NWA 2012 Strategic Planning Survey Results NWA Annual Meeting Salem, OR April 2012.
May 3, 2012
STATE OF CALIFORNIAEdmund G. Brown Jr., Governor
GOVERNOR’S OFFICE OF PLANNING AND RESEARCH
1400 Tenth StreetSacramento, CA 95814
P.O. Box 3044Sacramento, CA 95812
(916) 322-2318
www.opr.ca.gov
Annual Planning Survey Results
2012

ii Annual Planning Survey Results 2012
Page intentionally left blank
Annual Planning Survey Results 2012 i
AnnuAl PlAnning Survey reSultS
2012 edition
This publication may reference complex and specific laws and regulations. Any such reference is provided merely for the convenience of the reader. Always refer to the actual text of applicable laws and regulations, and consult with an attorney when applying them.
As with all Governor’s Office of Planning and Research publications, you may print all or part of this book. You need not secure permission; just copy it accurately and give credit to the Governor’s Office of Planning and Research.
For further information on this or other OPR documents, please visit www.opr.ca.gov or contact the State Clearinghouse at (916) 445-0613.
State of CaliforniaEdmund G. Brown Jr., Governor
Governor’s Office of Planning and Research1400 10th StreetSacramento, CA 95814
Ken Alex, Director, OPRScott Morgan, Director, State Clearinghouse
Publication Developed by:Cuauhtemoc Gonzalez, Associate Planner
Contributors:Alessandra BrownJennifer GonzalezAllison Joe

ii Annual Planning Survey Results 2012
Page intentionally left blank
Annual Planning Survey Results 2012 iii
Message From the Director
May 2012
The Governor’s Office of Planning and Research (OPR) is pleased to announce the release of the 2012 Annual Planning Survey Results. In previous years, the survey results were included in the Book of Lists. The contact information for Cities and Counties and other Planning Agencies that was also included in the Book of Lists is now located in the Directory of California Planning Agencies.
We want to make special note of the exceptional response rate – a full 87% of local governments – to this survey, making it a particularly useful tool.
This edition features:• An analysis of the results of the 2011 Annual Planning Survey;• The results of OPR’s 2011 Annual Planning Survey. The survey provides the latest information on local planning activities and special issues of statewide concern;• A cumulative index of questions asked in previous Annual Planning Surveys; and, • Status of local General Plans
Past editions of the Book of Lists are available to the public from the OPR website at www.opr.ca.gov under the “Publications and Forms” tab.
We appreciate the efforts of all the cities and counties that have taken the time and effort to complete the Annual Planning Survey. We also appreciate everyone who helps keep the information in this publication current and accurate. OPR encourages planners and others who use the Annual Planning Survey Results to share their comments and suggestions about how this publication can better serve users’ needs.
Sincerely,
Ken AlexDirector
iv Annual Planning Survey Results 2012
Page intentionally left blank
Annual Planning Survey Results 2012 v
Table of Contents
Table of ConTenTS
AnAlysis Of the 2011 AnnuAl PlAnninG suRvey Results 1
intROductiOn 5
GeneRAl Results 5
AnAlysis Of the 2011 AnnuAl PlAnninG suRvey Results 7
A: heAlth And GeneRAl PlAns 71. If your jurisdiction has policies and/or programs that explicitly reference health protection or promotion in your General Plan, where are those policies/programs contained?
2. If your jurisdiction has policies and/or programs to ensure that grocery stores or fruit and vegetable vendors are accessible across the jurisdiction, where are those policies and/or programs contained?
3. If your jurisdiction has policies and/or programs that facilitate opportunities for local food production (e.g. community gardens, protection of agricultural land, etc.), where are the policies and/or programs located?
4. Has your jurisdiction adopted park and open space standards that include requirements in the following areas?
6. If your jurisdiction has policies and/or programs that promote access to parks and open space, where are the policies and/or programs contained?
7. If your jurisdiction has policies and/or programs that promote joint use of or community access to schools or other public sites for play, exercise, and/or physical activity, where are the policies and/or programs contained?
B. tRAnsPORtAtiOn, MOBility, And PARkinG 115. Has your jurisdiction “modified the circulation element to plan for a balanced, multimodal transportation network that meets the needs of all users of the streets, roads, and highways…”?
8. Has your jurisdiction adopted pedestrian and/or bicycle infrastructure standards that include requirements in the following areas?
9. What are the parking requirements (spaces per unit) for the following?
10. What parking innovations or strategies does your jurisdiction utilize?
c. hOusinG, density, And infill 1611. Has your agency identified specific areas within its jurisdiction for infill development?
11a. Documents Where Areas for Infill Development have been Identified
12. Have the effects of infill development, such as traffic, noise, public services, etc., been analyzed in a programmatic environmental analysis, such as general plan environmental impact report?
13. If your agency has policies to promote or facilitate infill development, what types of policies and/or programs has your agency adopted to facilitate infill development?
14. If your jurisdiction has policies and/or programs to facilitate mixed use development and/or the clustering of residential, employment, and commercial areas, where are the policies and/or programs contained?
15. If your jurisdiction has policies and/or programs to facilitate residential and commercial density, where are the policies and/or programs contained?
16. If your jurisdiction has adopted policies and/or programs that promote access to regular transit service connecting residential, employment, and commercial areas across your jurisdiction, where are the policies and/or programs integrated?
17. Do you have staff dedicated to sustainability?
18. Have programs such as density bonuses or financial incentives been adopted to encourage lot consolidation of smaller infill parcels?

vi Annual Planning Survey Results 2012
Table of Contents
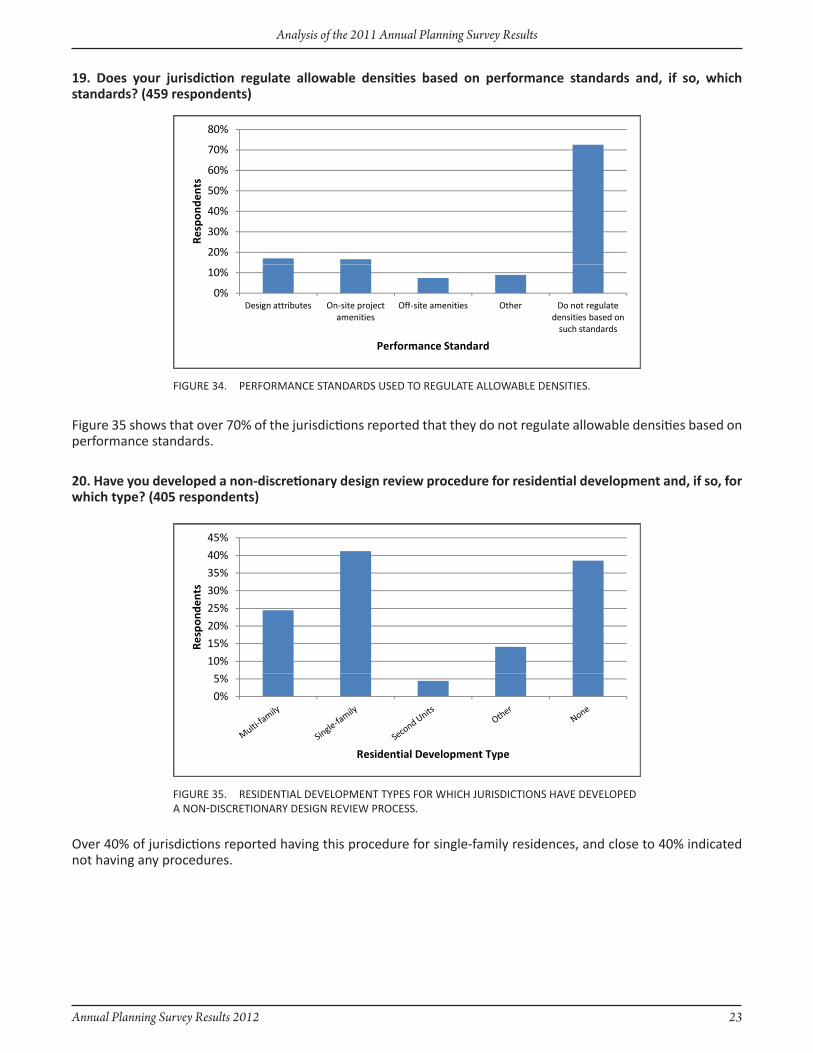
19. Does your jurisdiction regulate allowable densities based on performance standards and, if so, which standards?
20. Have you developed a non-discretionary design review procedure for residential development and, if so, for which type?
21. Please explain the primary barriers your jurisdiction has experienced to implementing infill projects.
d. eMeRGency shelteRs (sB 2) And sPeciAl needs 2522. If your jurisdiction has adopted a zone(s) to permit emergency shelters with a conditional use permit or other discretionary action, what type of land use category permits emergency shelters without discretionary action?
23. Does your jurisdiction require Planning Commission or City Council approval for granting reasonable accommodation in zoning and land use?
24. Does your jurisdiction require processing fees for granting reasonable accommodation in zoning and land use?
e. cOnseRvAtiOn Of AGRicultuRAl lAnd 2625. Does your jurisdiction have or do any of the following?
f. sOlAR eneRGy develOPMent 2726. If your jurisdiction has developed an administrative approval process of solar energy systems, is it limited to the following?
27. Has your jurisdiction developed policies, programs, or ordinances to facilitate the development of renewable energy facilities?
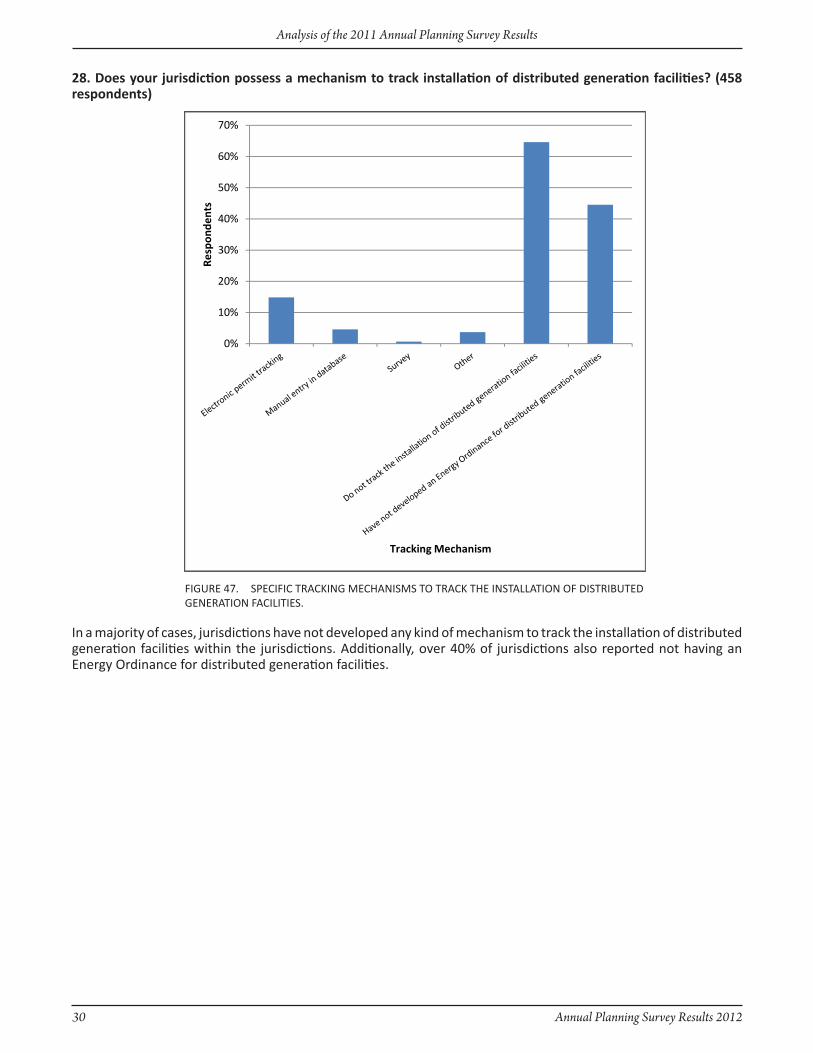
28. Does your jurisdiction possess a mechanism to track installation of distributed generation facilities?
29. If your jurisdiction tracks installation of distributed generation, how much distributed generation was installed between January 1, 2010 and December 31, 2010?
G. GReenhOuse GAses (GhG)/cliMAte ActiOn PlAn 3130. Has your jurisdiction adopted, or is in the process of drafting, policies and/or programs to address climate change and/or to reduce GHG emissions for community and municipal activities?
30a. If adopted or in progress, what forms do these policies and/or programs take?
31. What are your Greenhouse Gas reduction targets and years?
32. Does your jurisdiction have a mechanism for tracking progress on meeting your Greenhouse Gas reduction target for community wide and municipal emissions?
h. MiscellAneOus 3533. If your jurisdiction has adopted standards about the CalGreen Building Code, what tier had it adopted?
34. Does your jurisdiction require a voter initiative for any of the following?
35. If your jurisdiction is working with school districts to ensure that school siting, capital improvement decision (including closures), and operational policies align with general plans, RTPs, and sustainable communities plans, how does it do so?
36. If your jurisdiction tracks the amount of tree canopy coverage, what percent of your jurisdiction had tree canopy coverage?
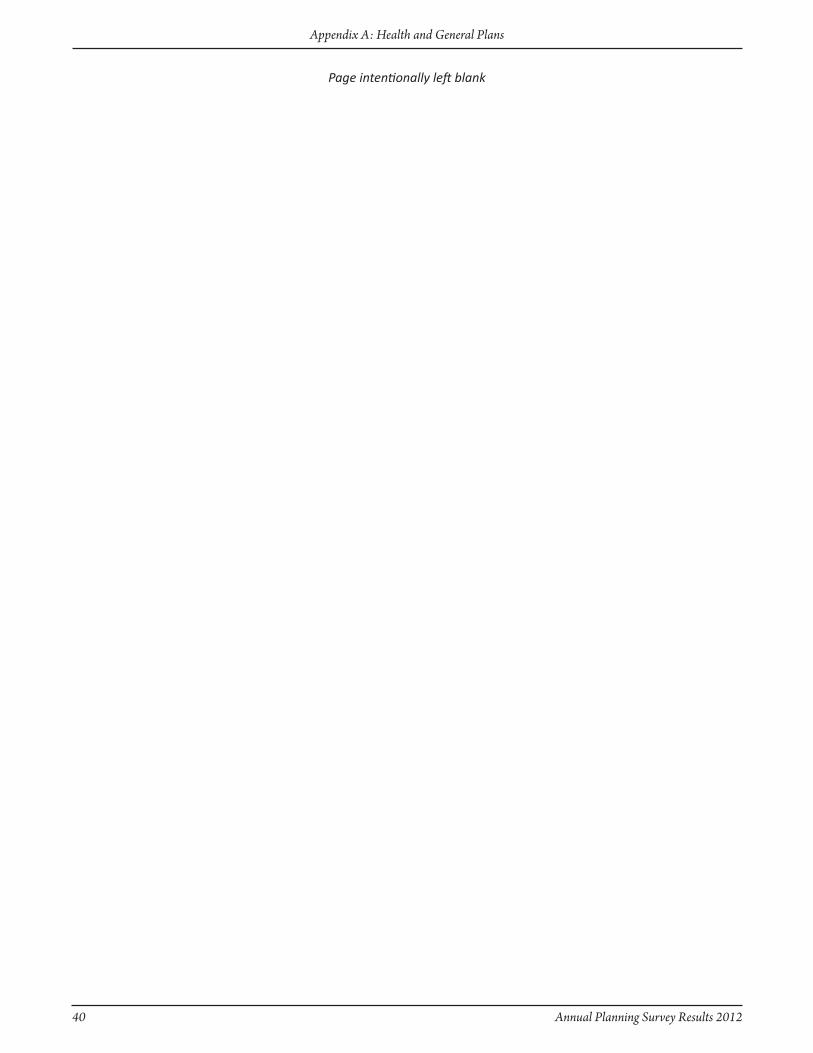
37. Does your jurisdiction have a cool roof/paving ordinance?
38. Please explain the primary barriers your jurisdiction has experienced to implementing Greenhouse Gas, Energy, and/or Sustainability policies.
APPendix A: heAlth And GeneRAl PlAns 39
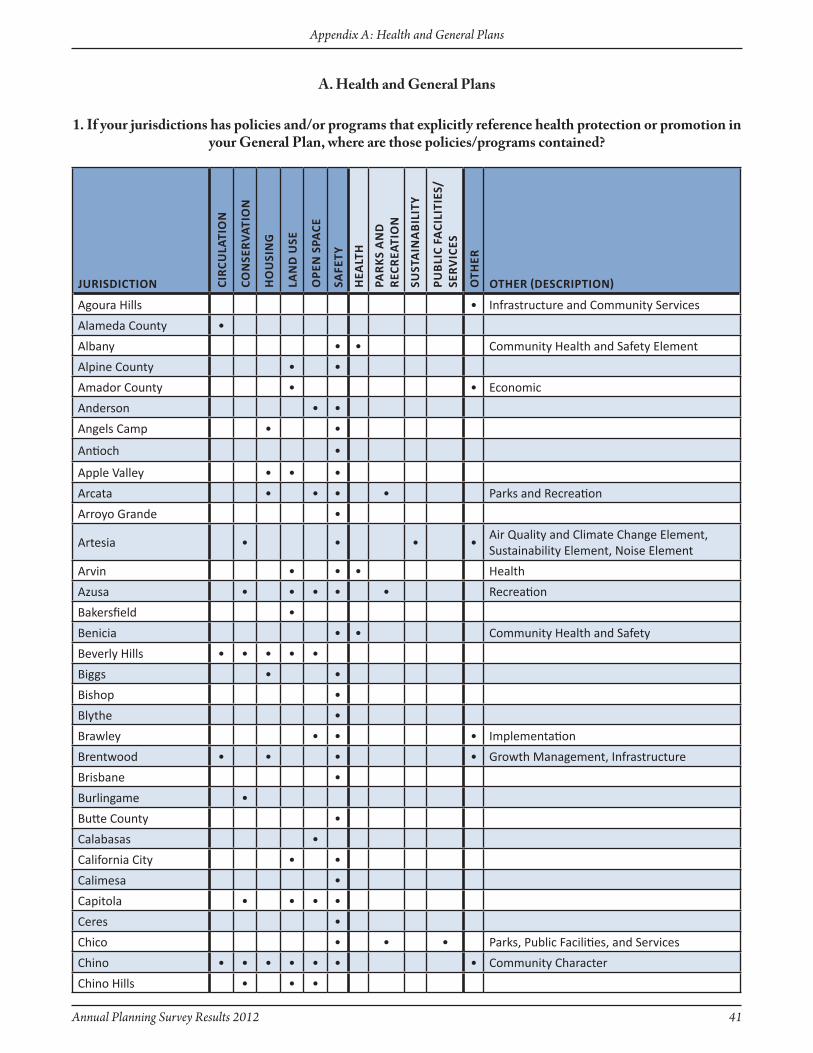
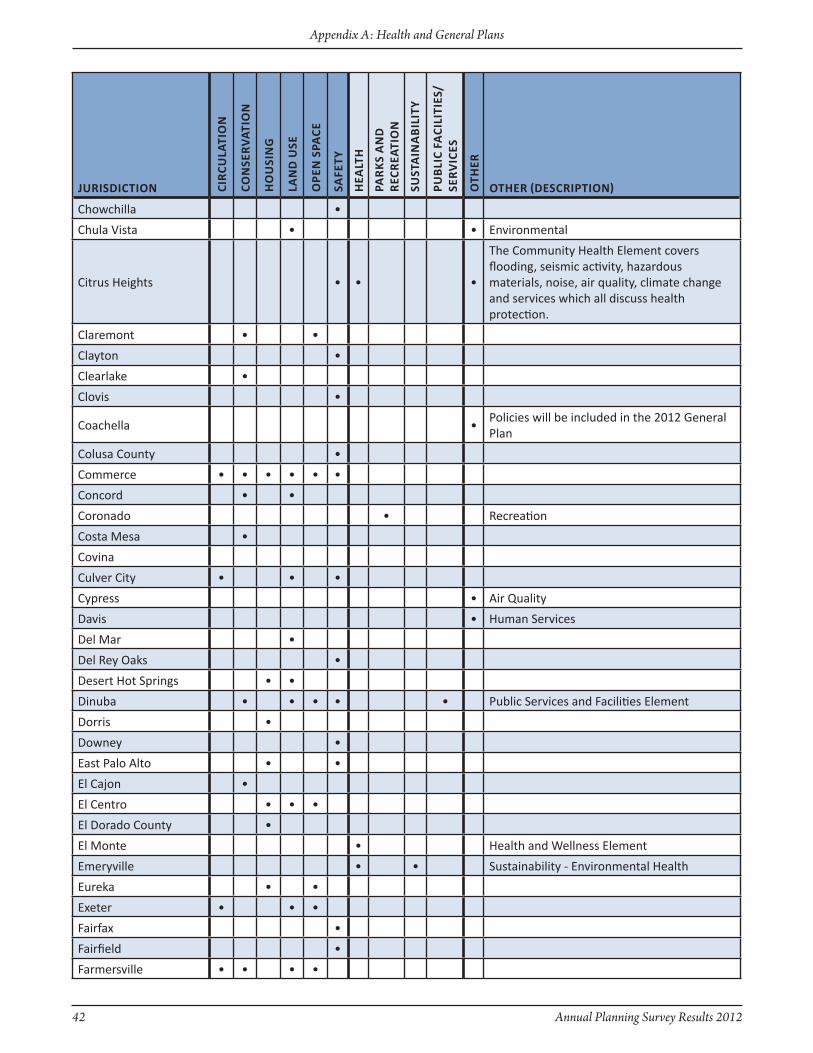
1. If your jurisdictions has policies and/or programs that explicitly reference health protection or promotion in your General Plan, where are those policies/programs contained?
2. If your jurisdiction has policies and/or programs to ensure that grocery stores or fruit and vegetable vendors are accessible across your jurisdiction, where are those policies and/or programs contained?
Annual Planning Survey Results 2012 vii
Table of Contents
3. If your jurisdiction has policies and/or programs that facilitate opportunities for local food production (e.g. community gardens, protection of agricultural land, etc.), where are the policies and/or programs contained?
4. Has your jurisdiction adopted park and open space standards that include requirements in the following areas?
6. If your jurisdiction has policies and/or programs that promote access to parks and open space, where are the policies and/or programs contained?
7. If your jurisdiction has policies and/or programs that promote joint use of or community access to schools or others public sites for play, exercise, and/or physical activity, where are the policies and/or programs contained?
APPendix B: tRAnsPORtAtiOn, MOBility, And PARkinG 91
5. Has your jurisdiction “modified the circulation element to plan for a balanced, multimodal transportation network that meets the needs of all users of streets, roads, and highways...”?
8. Has your jurisdiction adopted pedestrian and/or bicycle infrastructure standards that include requirements in the following areas?
9. What are the parking requirements (spaces per unit) for the following?
9a . Detailed Descriptions of Parking Requirements (spaces per unit) for the Following Housing Types
APPendix c: hOusinG, density, And infill 161
11. and 11a. Has your jurisdiction identified specific areas within its jurisdiction for infill development? If your agency has identified specific areas within its jurisdiction for infill development, where are those areas identified?
12. Have the effects of infill development, such as traffic, noise, public services, etc., been analyzed in a programmatic environmental analysis, such as a general plan environmental impact report?
13. If your agency has policies to promote or facilitate infill development, what types of policies and/or programs has your agency adopted to facilitate infill development?
14. If your jurisdiction has policies and/or programs to facilitate mixed use development and/or the clustering of residential, employment, and commercial areas, where are the policies and/or programs contained?
15. If your jurisdiction has policies and/or programs to facilitate residential and commercial density, where are the policies and/or programs contained?
16. If your jurisdiction has adopted policies and/or programs that promote access to regular transit service connecting residential, employment, and commercial areas across your jurisdiction, where are the policies and/or programs integrated?
17. Do you have staff dedicated to sustainability?
18. Have programs such as density bonuses or financial incentives been adopted to encourage lot consolidation of smaller infill parcels?
19. Does your jurisdiction regulate allowable densities based on performance standards and, if so, which standards?
20. Have you developed a non-discretionary design review procedure for residential development and, if so, for which type?
21. Please explain the primary barriers your jurisdiction has experienced to implementing infill projects.
21a. Narrative answers to the barriers jurisdictions have experienced to implementing infill projects.
APPendix d: eMeRGency shelteRs (sB 2) And sPeciAl needs 247
22. If your jurisdiction has adopted a zone(s) to permit emergency shelter without a conditional use permit or other discretionary action, what type of land use category permits emergency shelters without discretionary action?
23. Does your jurisdiction require Planning Commission or City Council approval for granting reasonable accommodation in zoning and land use?
viii Annual Planning Survey Results 2012
Table of Contents
24. Does your jurisdiction require processing fees for granting reasonable accommodation in zoning and land use?
APPendix e: cOnseRvAtiOn Of AGRicultuRAl lAnd 261
25. Does your jurisdiction have or do any of the following?
APPendix f: sOlAR eneRGy develOPMent 265
26. If your jurisdiction has developed an administrative approval process of solar energy systems, is it limited to the following?
27. Has your jurisdiction developed policies, programs, or ordinances to facilitate the development of renewable energy facilities?
28. Does your jurisdiction possess a mechanism to track installation of distributed generation facilities?
29. If your jurisdiction tracks installation of distributed generation, how much distributed generation was installed between January 1, 2010 and December 31, 2010?
APPendix G: GReenhOuse GAses (GhG)/cliMAte ActiOn PlAn 283
30. and 30a.Has your jurisdiction adopted, or is in the process of drafting, policies and/or programs to address climate change and/or to reduce GHG emissions for community and municipal activities? If adopted or in progress, what form do these policies and/or programs take?
31. What are your Greenhouse Gas reduction targets and years?
32. Does your jurisdiction have a mechanism for tracking progress on meeting your Greenhouse Gas reduction target for community wide and municipal emissions?
APPendix h: MiscellAneOus 303
33. If your jurisdiction has adopted standards above the CalGreen Building Code, what tier has it adopted?
36. If your jurisdiction tracks the amount of tree canopy coverage, what percent of your jurisdictions has tree canopy coverage?
37. Does your jurisdiction have a cool roofing/paving ordinance?
38. Please explain the primary barriers your jurisdiction has experienced to
Greenhouse Gas, Energy, and/or Sustainability Policies.
38a. Narrative answers to the barriers jurisdictions have experienced to implementing
Greenhouse Gas, Energy, and/or Sustainability policies.
APPendix i: AnnuAl PlAnninG suRvey Results/BOOk Of listS tOPic index 333
APPendix J: 2011 AnnuAl PlAnninG suRvey 339
APPendix k: stAtus Of lOcAl GeneRAl PlAns 347
General Plan Status By City
Index of Optional Elements and Year Adopted
General Plan Update

Annual Planning Survey Results 2012 ix
Table of Contents
tABle Of fiGuRes
Figure 1. Number of jurisdictions responding to the Annual Planning Survey since 2005. 5
Figure 2. Number of jurisdictions responding to each question of the 2011 Annual Planning Survey. 6
Figure 3. Location of General Plan policies and programs that explicitly reference health protection and promotion in the General Plan. 7
Figure 4. Location of General Plan policies and programs that ensure that grocery stores or fruit and vegetable vendors are accessible jurisdiction-wide. 7
Figure 5. Jurisdiction populations by jurisdiction median income quartile; showing the specific locations of General Plan policies and programs that ensure grocery stores or fruit and vegetable vendors are accessible jurisdiction-wide. 8
Figure 6. Location of General Plan policies and programs that facilitate opportunities for local food products. 8
Figure 7. Jurisdiction populations by jurisdiction median income quartile showing the specific location of General Plan policies and programs that facilitate opportunities for local food production. 9
Figure 8. Specific requirements for adopted park and open space standards. 9
Figure 9. Location of policies and programs in the General Plan that promote access to parks and open space. 10
Figure 10. Location of policies and programs that promote joint use, or community access to, schools or other public sites for play, exercise, and/or physical activity. 10
Figure 11. Jurisdictions that modified the Circulation Element to plan for a balanced, multimodal transportation network that meets the needs of all users of streets, roads, and highways. 11
Figure 12. Jurisdiction populations by jurisdiction median income quartile with modified Circulation Elements to plan for a balanced, multimodal transportation network. 11
Figure 13. Specific requirements for pedestrian and bicycle infrastructure standards. 12
Figure 14. Jurisdictions reporting the number of parking spaces per unit required for mixed use. 13
Figure 15. Jurisdictions reporting the number of parking spaces per unit required for multifamily apartments. 13
Figure 16. Jurisdictions reporting the number of parking spaces per unit required for single family attached (condominiums). 14
Figure 17. Jurisdictions reporting the number of parking spaces per unit required for duplexes. 14
Figure 18. Jurisdictions reporting the number of parking spaces per unit required for emergency shelters. 15
Figure 19. Jurisdictions reporting the parking innovations or strategies. 15
Figure 20. Jurisdictions that identified specific areas for infill development. 16
Figure 21. Jurisdictions identifying specific areas For infill development by jurisdiction population quartile. 16
Figure 22. Jurisdictions identifying specific areas for infill development by median income quartile. 17
Figure 23. Specific planning documents jurisdictions have to identify infill areas. 17
Figure 24. Jurisdictions that analyzed the effects of infill development in a programmatic environmental analysis. 18
Figure 25. Jurisdictions with policies to promote or facilitate infill development. 18
Figure 26. Jurisdictions reporting the location of policies and programs that promote or facilitate infill development. 19
Figure 27. Location of policies and programs to facilitate mixed use development and/or the clustering of residential, employment, and commercial areas. 19
Figure 28. Jurisdictions with policies and programs to facilitate mixed use development and/or the clustering of residential, employment, and commercial areas. 20
Figure 29. Location of policies and programs to facilitate residential and commercial density. 20
Figure 30. Location of policies and programs that promote access to regular transit service connecting residential, employment, and commercial areas across the jurisdiction. 21
Figure 31. Jurisdictions with staff dedicated to sustainability. 21
Figure 32. Jurisdictions with staff dedicated to sustainability by population quartile. 22
Figure 33. Incentive programs to encourage lot consolidation of smaller infill parcels. 22

x Annual Planning Survey Results 2012
Table of Contents
Figure 34. Performance standards used to regulate allowable densities. 23
Figure 35. Residential development types for which jurisdictions have developed a non-discretionary design review process. 23
Figure 36. Primary barriers experienced by jurisdictions in implementing infill projects. 24
Figure 37. Land uses where jurisdictions have adopted zones to permit emergency shelters pursuant to SB 2. 25
Figure 38. Jurisdictions requiring Planning Commission, City Council, or Board of Supervisor approval for granting reasonable accommodation in zoning and land use. 25
Figure 39. Jurisdictions requiring processing fees for granting reasonable accommodation in zoning and land use. 26
Figure 40. Specific agricultural programs. 26
Figure 41. Agricultural conservation programs by non-urbanized and urbanized area as defined by Public Resources code 21071. 27
Figure 42. Types of solar energy systems for which jurisdictions have developed an administrative approval process. 27
Figure 43. Jurisdictions by median income quartile that have developed an administrative approval process for certain types of solar energy systems. 28
Figure 44. Jurisdictions that have developed policies, programs, or ordinances to facilitate the development of renewable energy facilities. 28
Figure 45. Jurisdictions that have developed policies, programs, or ordinances to facilitate the development of renewable energy facilities by urbanized and non-urbanized area defined by California Public Resources Code section 21071. 29
Figure 46. Jurisdiction types that have developed policies, programs, or ordinances to facilitate the development of renewable energy facilities. 29
Figure 47. Specific tracking mechanisms to track the installation of distributed generation facilities. 30
Figure 48. Jurisdictions that tracked the installation of distributed generation facilities between January 1, 2010 and December 31, 2010. 31
Figure 49. Status of policies and/or programs to address climate change and/or to reduce GHG emissions for community and municipal activities. 31
Figure 50. Jurisdictions that have adopted or are in the process of drafting policies and/or programs to address climate change and/or to reduce GHG emissions for community and municipal activities and the form those policies and programs take. 32
Figure 51. Jurisdiction action made each year toward policies and/or programs addressing climate change and/or to reduce GHG emissions for community and municipal activities. 32
Figure 52. Jurisdictions adopted policies and/or programs to address climate change and/or to reduce GHG emissions for community and municipal activities. 33
Figure 53. Jurisdictions whose adopted policies and/or programs to address climate change and/or to reduce GHG emissions for community and municipal activities also include plans for greenhouse gas reduction or mitigation or vulnerability/resiliency to climate change. 33
Figure 54. Jurisdictions that have adopted GHG reductions target and years. 34
Figure 55. Jurisdictions that have mechanisms to track progress in meeting the GHG reduction target for community wide and municipal emissions. 34
Figure 56. Jurisdictions that adopted standards above the CalGreen Building Code. 35
Figure 57. Specific activities for which voter initiative is required. 35
Figure 58. Actions jurisdictions take in working with school districts to ensure that school siting, capital improvement decisions, and operational policies align with General Plans, Regional Transportation Plans (RTPs), and sustainable communities plans. 36
Figure 59. Jurisdictions that track the amount of tree canopy coverage. 36
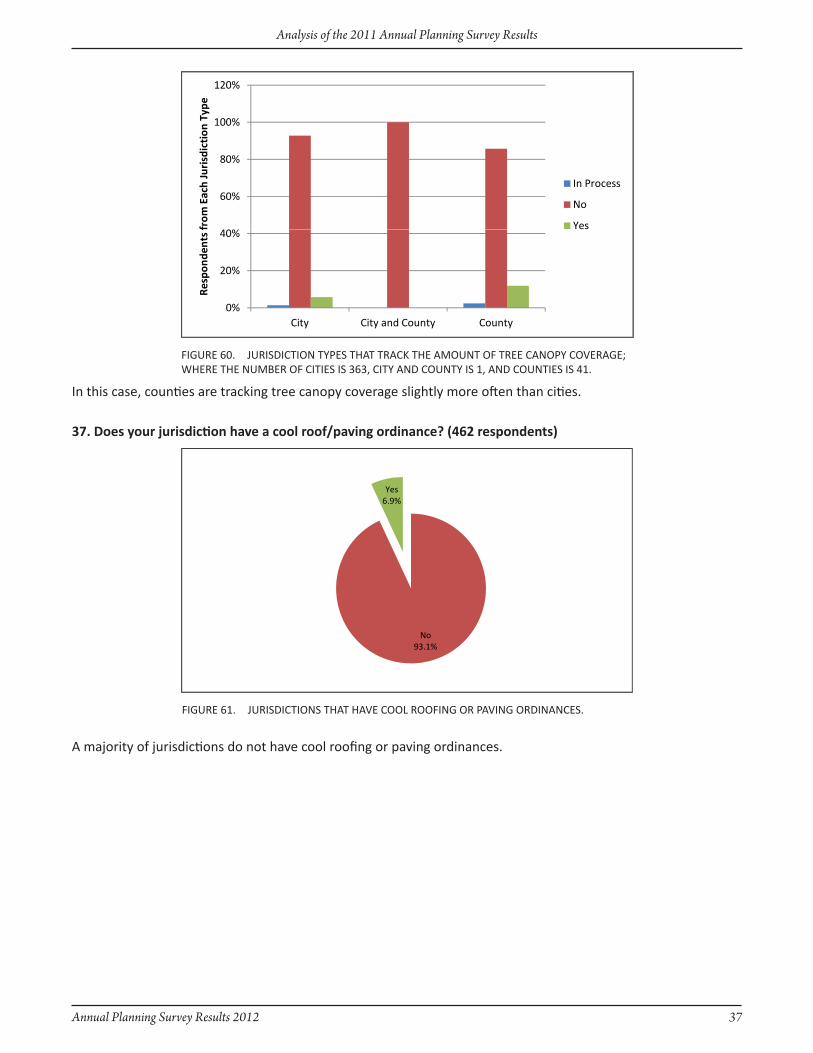
Figure 60. Jurisdiction types that track the amount of tree canopy coverage. 37
Figure 61. Jurisdictions that have cool roofing or paving ordinances. 37
Figure 62. Jurisdiction types that have cool roofing or paving ordinances 38
Figure 63. Primary barriers jurisdictions have experienced in implementing Greenhouse Gas, Energy, and/or Sustainability policies. 38
Annual Planning Survey Results 2012 1
Analysis of the 2011 Annual Planning Survey Results
Analysis of the 2011 Annual
Planning Survey Results
2 Annual Planning Survey Results 2012
Analysis of the 2011 Annual Planning Survey Results
Page intentionally left blank

Annual Planning Survey Results 2012 3
Analysis of the 2011 Annual Planning Survey Results
Jurisdictions that Responded to the 2011 Annual Planning Survey
In 2011, a total of 471 of the 540 cities and counties (87%) in California completed the Annual Planning Survey. This includes 49 of the 58 counties (84%) and 423 of the 482 cities (88%). The results were provided by each individual jurisdiction and represent the jurisdiction’s current, adopted policies and/or programs. Please contact the individual jurisdictions for more detailed information.
CiTieS
AdelantoAgoura HillsAlbanyAlhambraAmerican CanyonAnaheimAndersonAngels CampAntiochApple ValleyArcadiaArcataArroyo GrandeArtesiaArvinAtascaderoAthertonAuburnAvalonAvenalAzusaBakersfieldBaldwin ParkBanningBarstowBeaumontBellBell GardensBellflowerBelmontBeniciaBeverly HillsBig Bear LakeBiggsBishopBlue LakeBlytheBrawleyBreaBrentwoodBrisbaneBuelltonBuena ParkBurbankBurlingameCalabasasCalifornia CityCalimesaCamarilloCampbellCanyon LakeCapitola
CarlsbadCarpinteriaCarsonCeresChicoChinoChino HillsChowchillaChula VistaCitrus HeightsClaremontClaytonClearlakeClovisCoachellaCoalingaColfaxColmaColtonCommerceConcordCorningCoronaCoronadoCorte MaderaCosta MesaCovinaCulver CityCupertinoCypressDaly CityDana PointDanvilleDavisDel MarDel Rey OaksDelanoDesert Hot SpringsDiamond BarDinubaDixonDorrisDos PalosDowneyDuarteDublinEast Palo AltoEl CajonEl CentroEl CerritoEl MonteElk GroveEmeryvilleEncinitas
EscalonEscondidoEurekaExeterFairfaxFairfieldFarmersvilleFerndaleFillmoreFirebaughFolsomFontanaFort BraggFort JonesFortunaFoster CityFountain ValleyFowlerFremontFresnoFullertonGarden GroveGardenaGilroyGlendaleGlendoraGoletaGonzalesGrand TerraceGrass ValleyGreenfieldGridleyGrover BeachGuadalupeGustineHanfordHawaiian GardensHawthorneHaywardHealdsburgHemetHerculesHermosa BeachHesperiaHighlandHillsboroughHollisterHoltvilleHughsonHuntington BeachHuntington ParkHuronImperial BeachIndian Wells
IndioIndustryInglewoodIoneIrvineIrwindaleJacksonKermanLa Cañada FlintridgeLa HabraLa Habra HeightsLa MesaLa MiradaLa PalmaLa PuenteLa QuintaLa VerneLafayetteLaguna BeachLaguna HillsLaguna NiguelLaguna WoodsLake ElsinoreLakeportLakewoodLancasterLarkspurLawndaleLemon GroveLemooreLincolnLive OakLivermoreLivingstonLodiLomitaLompocLong BeachLoomisLos AlamitosLos AltosLos Altos HillsLos AngelesLos BanosLos GatosLynwoodMaderaMalibuManhattan BeachMantecaMarinaMartinezMarysvilleMaywood
MendotaMenifeeMenlo ParkMercedMill ValleyMillbraeMilpitasMission ViejoModestoMonroviaMontagueMontclairMonte SerenoMontebelloMontereyMonterey ParkMoorparkMoragaMoreno ValleyMorgan HillMorro BayMount ShastaMountain ViewMurrietaNapaNational CityNeedlesNevada CityNewarkNewmanNewport BeachNorcoNorwalkNovatoOakdaleOaklandOakleyOceansideOjaiOntarioOrangeOrange CoveOrindaOrlandOrovilleOxnardPacific GrovePacificaPalm DesertPalm SpringsPalmdalePalo AltoPalos Verdes EstatesParadise
4 Annual Planning Survey Results 2012
Analysis of the 2011 Annual Planning Survey Results
* The City and County of San Francisco is one jurisdiction. Only one survey was completed for the City and County.
ParamountParlierPasadenaPaso RoblesPattersonPerrisPetalumaPico RiveraPiedmontPinolePismo BeachPittsburgPlacervillePleasant HillPleasantonPlymouthPoint ArenaPomonaPort HuenemePortervillePortolaPortola ValleyPowayRancho CordovaRancho CucamongaRancho MirageRancho Palos VerdesRancho Santa MargaritaRed BluffReddingRedlandsRedondo BeachRedwood CityReedleyRialtoRichmondRidgecrestRio VistaRiverbankRiversideRocklinRohnert Park
Rolling HillsRolling Hills EstatesRosemeadRosevilleRossSalinasSan AnselmoSan BernardinoSan BrunoSan CarlosSan ClementeSan DiegoSan DimasSan FernandoSan Francisco*San GabrielSan JacintoSan JoaquinSan JoseSan Juan BautistaSan Juan CapistranoSan LeandroSan Luis ObispoSan MarcosSan MarinoSan MateoSan PabloSan RafaelSan RamonSand CitySangerSanta AnaSanta BarbaraSanta ClaritaSanta CruzSanta Fe SpringsSanta MariaSanta MonicaSanta PaulaSanta RosaSantee
SaratogaSausalitoSeal BeachSeasideSebastopolSignal HillSimi ValleySolana BeachSoledadSolvangSonomaSonoraSouth El MonteSouth GateSouth Lake TahoeSouth PasadenaSouth San FranciscoSt. HelenaStantonStocktonSuisun CitySunnyvaleSutter CreekTaftTehachapiTehamaTemeculaTemple CityThousand OaksTiburonTorranceTracyTrinidadTruckeeTulareTurlockUkiahUnion CityUplandVacavilleVallejo
VernonVictorvilleVilla ParkVisaliaVistaWalnutWalnut CreekWascoWaterfordWatsonvilleWeedWest CovinaWest HollywoodWest SacramentoWestlake VillageWestminsterWestmorlandWhittierWilliamsWillitsWillowsWindsorWintersWoodlakeWoodlandWoodsideYorba LindaYountvilleYrekaYucaipaYucca Valley
CounTieS
Alameda CountyAlpine CountyAmador CountyButte CountyCalaveras CountyColusa CountyContra Costa CountyDel Norte County
El Dorado CountyGlenn CountyHumboldt CountyInyo CountyKern CountyKings CountyLake CountyLassen CountyLos Angeles CountyMarin CountyMariposa CountyMendocino CountyModoc CountyMonterey CountyNapa CountyNevada CountyOrange CountyPlacer CountyPlumas CountyRiverside CountySacramento CountySan Benito CountySan Bernardino CountySan Diego CountySan Francisco County*San Joaquin CountySan Luis Obispo CountySanta Clara CountySanta Cruz CountySierra CountySiskiyou CountySolano CountyStanislaus CountySutter CountyTehama CountyTrinity CountyTulare CountyTuolumne CountyVentura CountyYolo CountyYuba County
Annual Planning Survey Results 2012 5
Analysis of the 2011 Annual Planning Survey Results
intROductiOnThe Governor’s Office of Planning and Research (OPR) has conducted the Annual Planning Survey for over 20 years. In the past, OPR presented the results as part of the California Planners’ Book of Lists. Beginning this year OPR is publishing the results of the Annual Planning Survey in stand-alone form.
The value of the Annual Planning Survey is due, in part, to the exceptional response rate from local governments. This year’s survey was completed by over 87% of the local governments in the State, the highest response rate ever received for any Annual Planning Survey. OPR thanks all the participants.
The Annual Planning Survey compiles current information on local government planning departments, General Plan adoptions and updates, and planning trends in the State. OPR developed the survey questions in coordination with other State Agencies and Departments. The survey covered many topics including: Health and General Plans; Transportation, Mobility, and Parking; Housing, Density, and Infill; Emergency Shelters and Special Needs; Conservation of Agricultural Land; Solar Energy Development; Greenhouse Gases/Climate Action Plans; and others.
The Annual Planning Survey data analysis follows the layout of the survey; general topic areas are identified with the largest size heading, demarked with a letter; and the questions specific to that topic area are identified with a smaller heading, demarked with the question number. Each topic heading is hyperlinked to its respective Appendix and each question heading is hyperlinked to its respective answer table in the Appendix.
The responses for each question are in the Appendices of this publication. The data from the 2011 Annual Planning Survey can be downloaded, in an Excel document, from our website at www.opr.ca.gov.
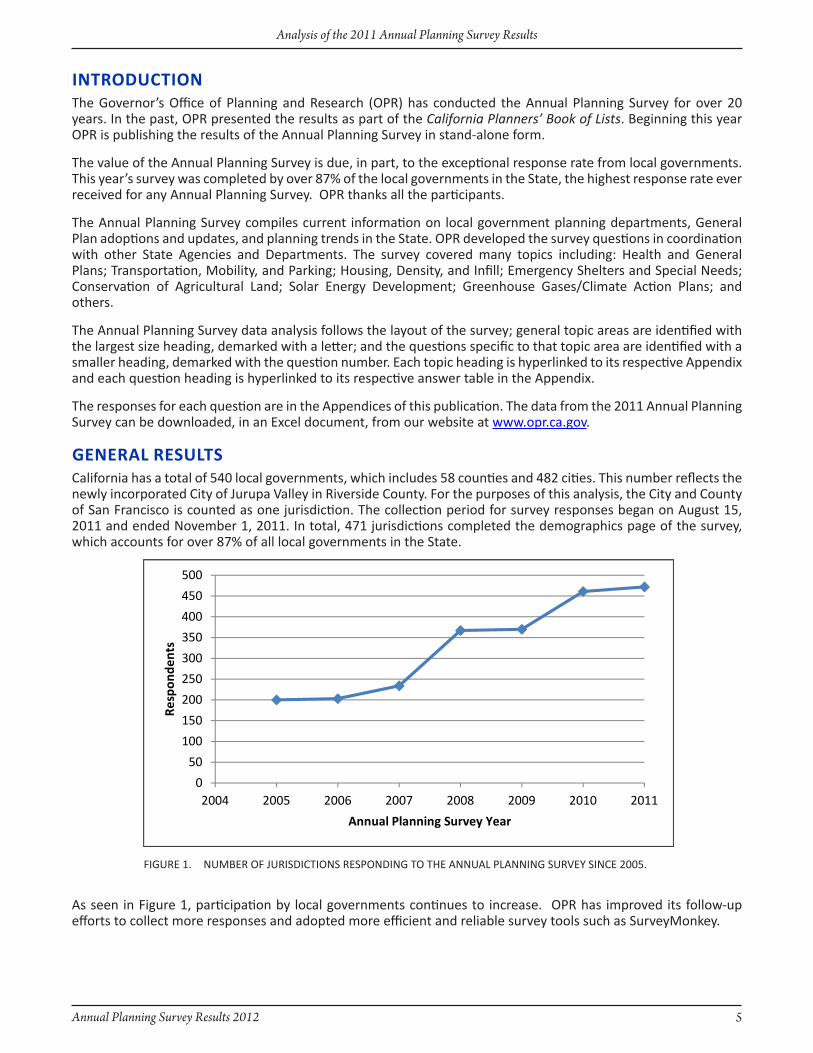
GeneRAl ResultsCalifornia has a total of 540 local governments, which includes 58 counties and 482 cities. This number reflects the newly incorporated City of Jurupa Valley in Riverside County. For the purposes of this analysis, the City and County of San Francisco is counted as one jurisdiction. The collection period for survey responses began on August 15, 2011 and ended November 1, 2011. In total, 471 jurisdictions completed the demographics page of the survey, which accounts for over 87% of all local governments in the State.
As seen in Figure 1, participation by local governments continues to increase. OPR has improved its follow-up efforts to collect more responses and adopted more efficient and reliable survey tools such as SurveyMonkey.
NUMBER OF JURISDICTIONS RESPONDING TO THE ANNUAL PLANNING SURVEY SINCE 2005.FIGURE 1.
6 Annual Planning Survey Results 2012
Analysis of the 2011 Annual Planning Survey Results
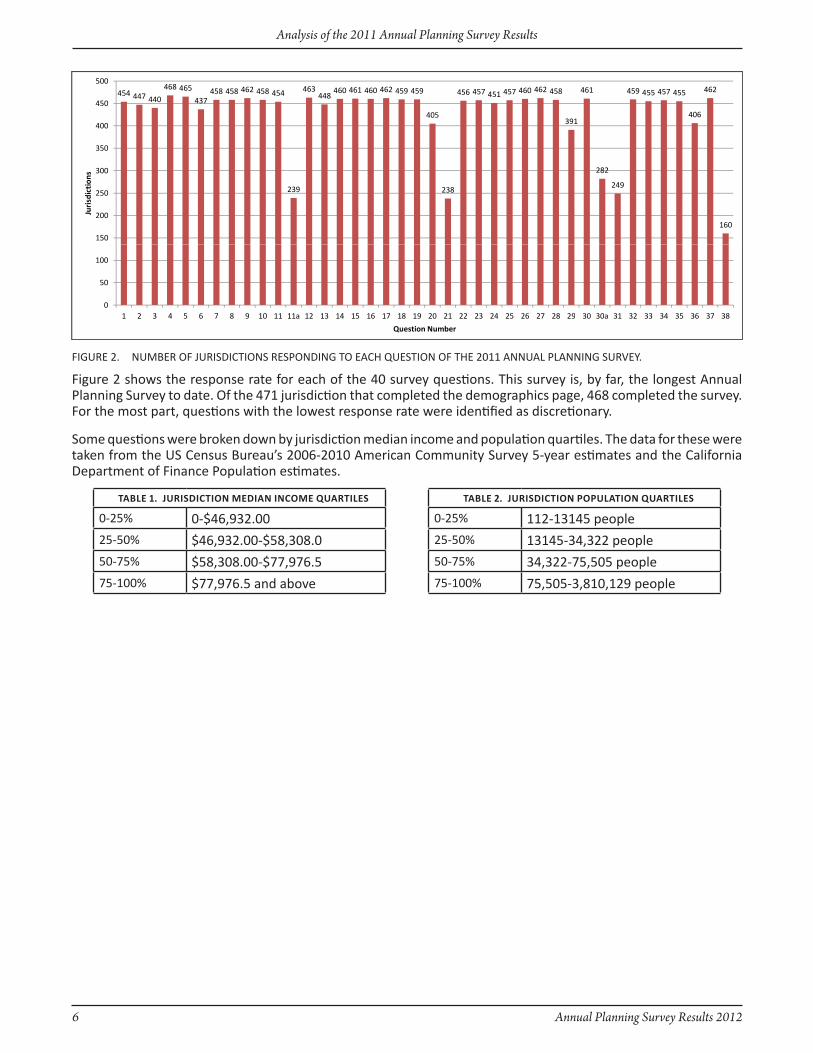
Figure 2 shows the response rate for each of the 40 survey questions. This survey is, by far, the longest Annual Planning Survey to date. Of the 471 jurisdiction that completed the demographics page, 468 completed the survey. For the most part, questions with the lowest response rate were identified as discretionary.
Some questions were broken down by jurisdiction median income and population quartiles. The data for these were taken from the US Census Bureau’s 2006-2010 American Community Survey 5-year estimates and the California Department of Finance Population estimates.
NUMBER OF JURISDICTIONS RESPONDING TO EACH QUESTION OF THE 2011 ANNUAL PLANNING SURVEY.FIGURE 2.
JuRisdictiOn MediAn incOMe QuARtiles Table 1.
0-25% 0-$46,932.0025-50% $46,932.00-$58,308.050-75% $58,308.00-$77,976.575-100% $77,976.5 and above
JuRisdictiOn POPulAtiOn QuARtiles Table 2.
0-25% 112-13145 people25-50% 13145-34,322 people50-75% 34,322-75,505 people75-100% 75,505-3,810,129 people
Annual Planning Survey Results 2012 7
Analysis of the 2011 Annual Planning Survey Results
AnAlysis Of the 2011 AnnuAl PlAnninG suRvey Results
A: heAlth And GeneRAl PlAns
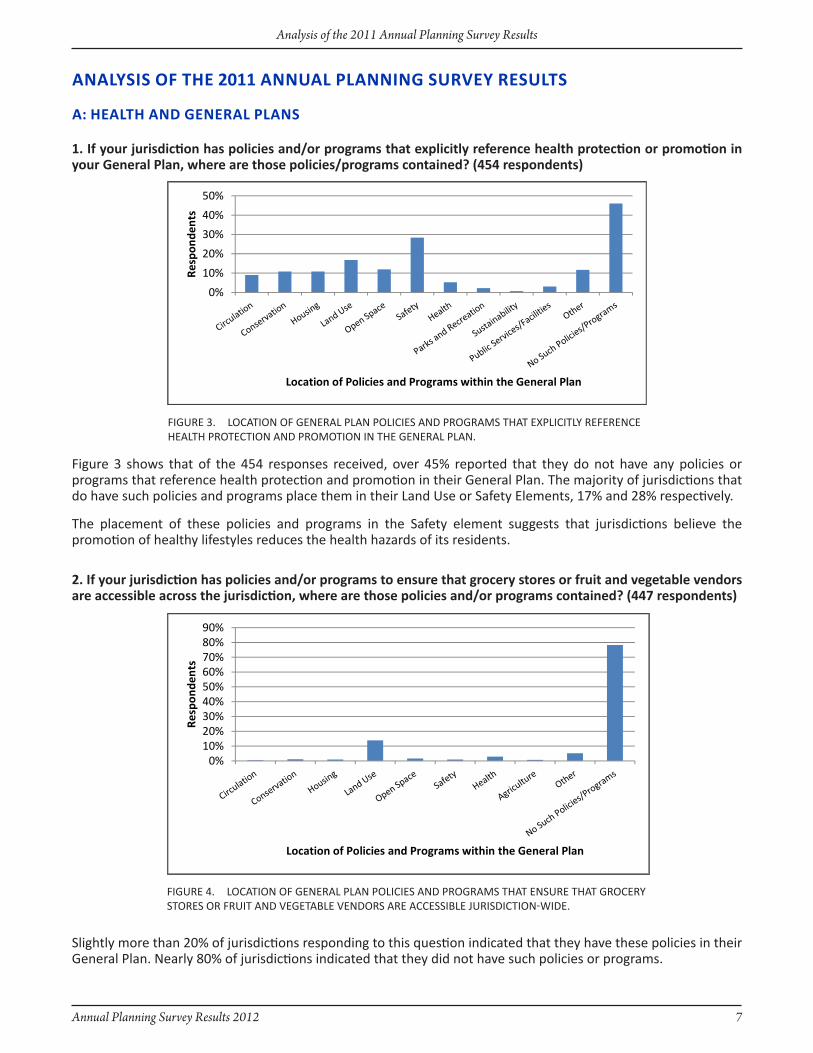
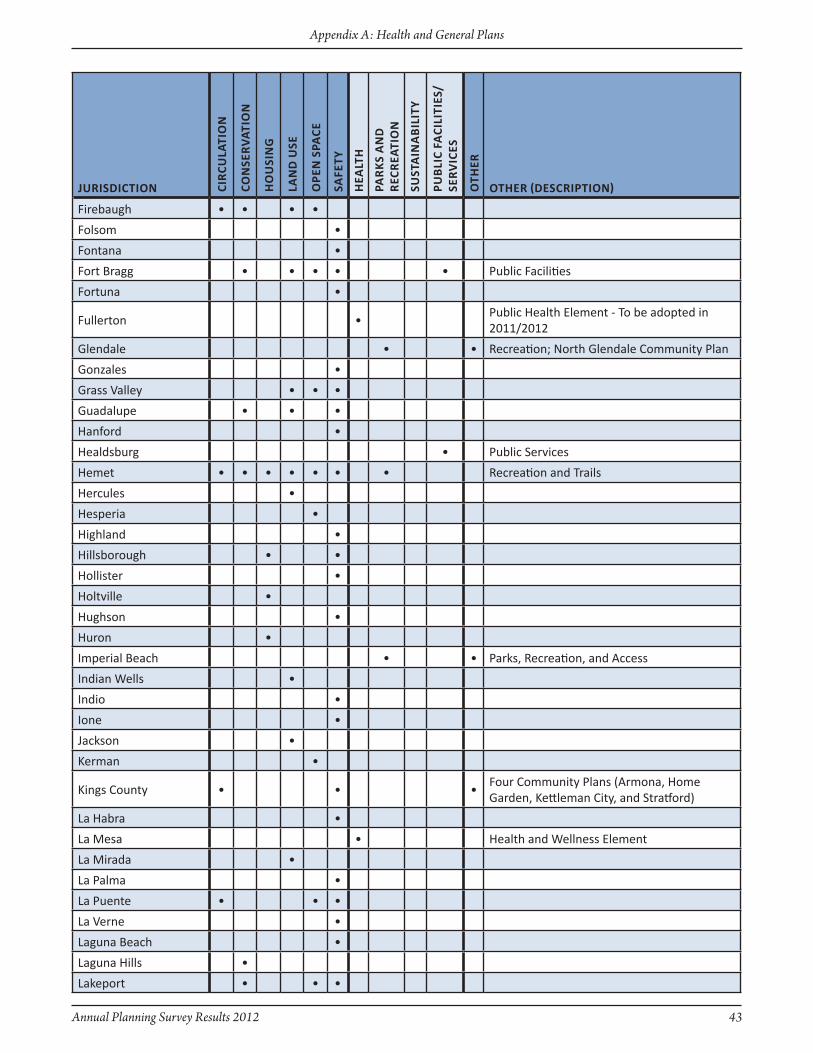
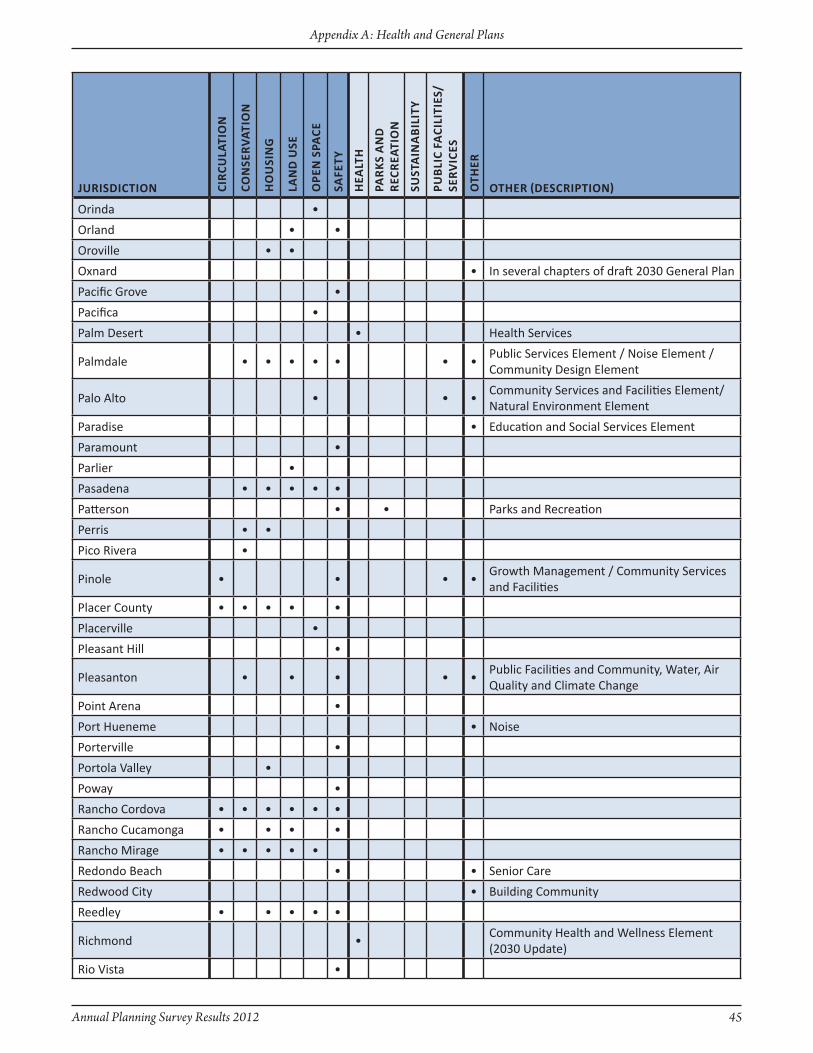
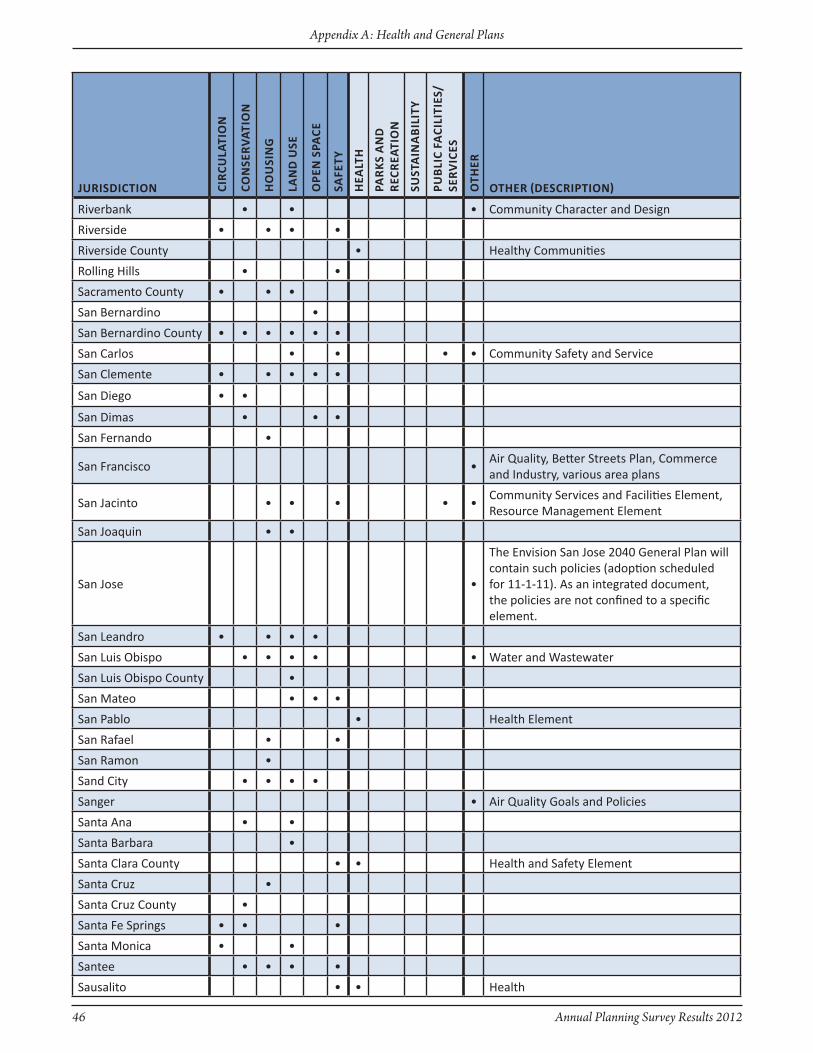
1. if your jurisdiction has policies and/or programs that explicitly reference health protection or promotion in your General Plan, where are those policies/programs contained? (454 respondents)
Figure 3 shows that of the 454 responses received, over 45% reported that they do not have any policies or programs that reference health protection and promotion in their General Plan. The majority of jurisdictions that do have such policies and programs place them in their Land Use or Safety Elements, 17% and 28% respectively.
The placement of these policies and programs in the Safety element suggests that jurisdictions believe the promotion of healthy lifestyles reduces the health hazards of its residents.
2. if your jurisdiction has policies and/or programs to ensure that grocery stores or fruit and vegetable vendors are accessible across the jurisdiction, where are those policies and/or programs contained? (447 respondents)
Slightly more than 20% of jurisdictions responding to this question indicated that they have these policies in their General Plan. Nearly 80% of jurisdictions indicated that they did not have such policies or programs.
LOCATION OF GENERAL PLAN POLICIES AND PROGRAMS THAT ExPLICITLY REFERENCE FIGURE 3. HEALTH PROTECTION AND PROMOTION IN THE GENERAL PLAN.
LOCATION OF GENERAL PLAN POLICIES AND PROGRAMS THAT ENSURE THAT GROCERY FIGURE 4. STORES OR FRUIT AND VEGETABLE VENDORS ARE ACCESSIBLE JURISDICTION-WIDE.
8 Annual Planning Survey Results 2012
Analysis of the 2011 Annual Planning Survey Results
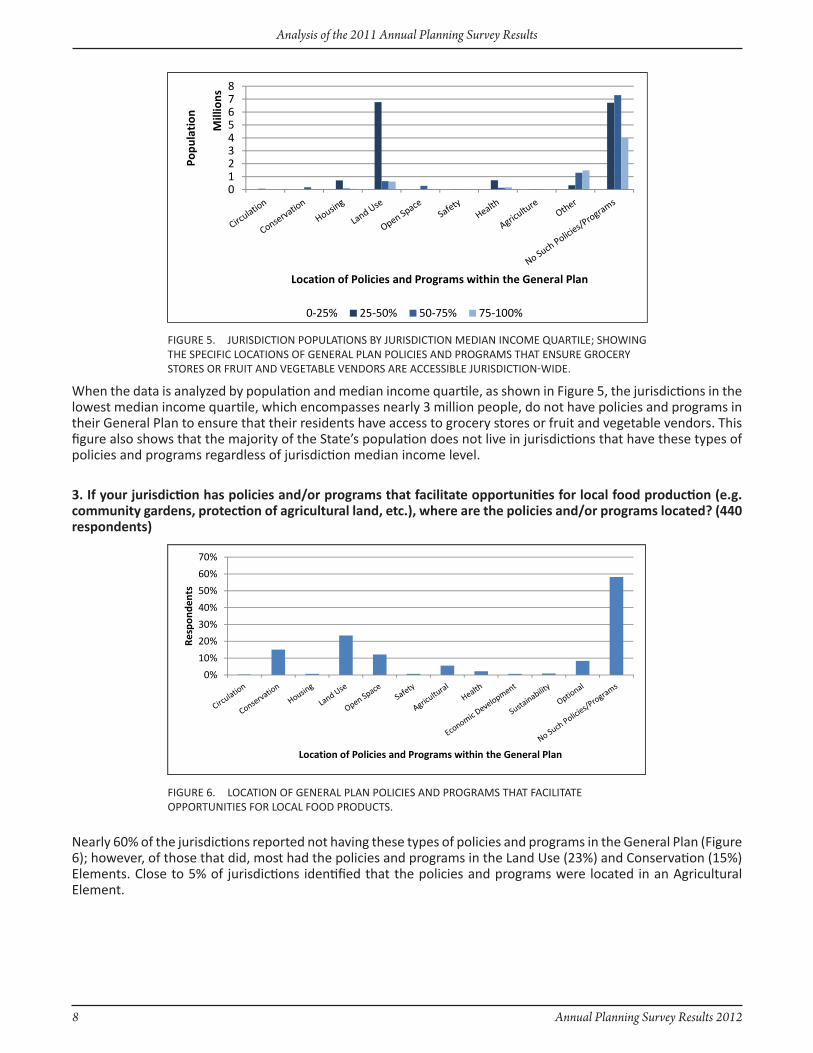
When the data is analyzed by population and median income quartile, as shown in Figure 5, the jurisdictions in the lowest median income quartile, which encompasses nearly 3 million people, do not have policies and programs in their General Plan to ensure that their residents have access to grocery stores or fruit and vegetable vendors. This figure also shows that the majority of the State’s population does not live in jurisdictions that have these types of policies and programs regardless of jurisdiction median income level.
3. if your jurisdiction has policies and/or programs that facilitate opportunities for local food production (e.g. community gardens, protection of agricultural land, etc.), where are the policies and/or programs located? (440 respondents)
Nearly 60% of the jurisdictions reported not having these types of policies and programs in the General Plan (Figure 6); however, of those that did, most had the policies and programs in the Land Use (23%) and Conservation (15%) Elements. Close to 5% of jurisdictions identified that the policies and programs were located in an Agricultural Element.
JURISDICTION POPULATIONS BY JURISDICTION MEDIAN INCOME QUARTILE; SHOWING FIGURE 5. THE SPECIFIC LOCATIONS OF GENERAL PLAN POLICIES AND PROGRAMS THAT ENSURE GROCERY STORES OR FRUIT AND VEGETABLE VENDORS ARE ACCESSIBLE JURISDICTION-WIDE.
LOCATION OF GENERAL PLAN POLICIES AND PROGRAMS THAT FACILITATE FIGURE 6. OPPORTUNITIES FOR LOCAL FOOD PRODUCTS.
Annual Planning Survey Results 2012 9
Analysis of the 2011 Annual Planning Survey Results
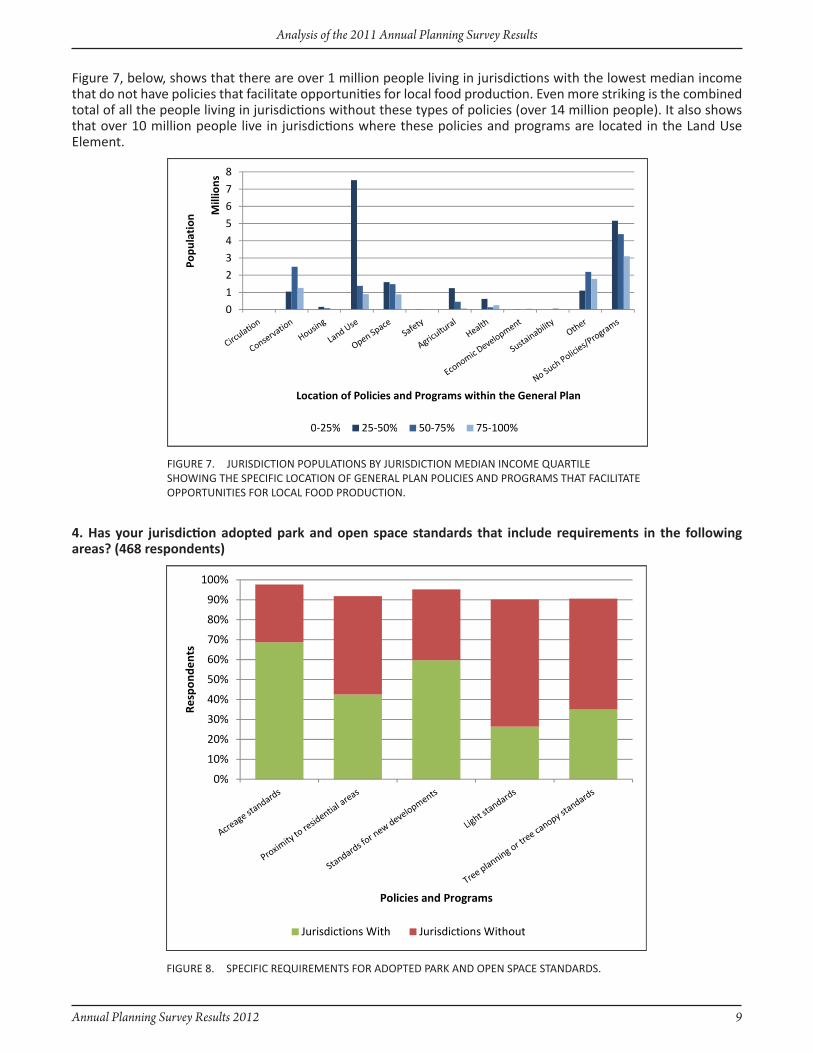
Figure 7, below, shows that there are over 1 million people living in jurisdictions with the lowest median income that do not have policies that facilitate opportunities for local food production. Even more striking is the combined total of all the people living in jurisdictions without these types of policies (over 14 million people). It also shows that over 10 million people live in jurisdictions where these policies and programs are located in the Land Use Element.
4. has your jurisdiction adopted park and open space standards that include requirements in the following areas? (468 respondents)
JURISDICTION POPULATIONS BY JURISDICTION MEDIAN INCOME QUARTILE FIGURE 7. SHOWING THE SPECIFIC LOCATION OF GENERAL PLAN POLICIES AND PROGRAMS THAT FACILITATE OPPORTUNITIES FOR LOCAL FOOD PRODUCTION.
SPECIFIC REQUIREMENTS FOR ADOPTED PARK AND OPEN SPACE STANDARDS.FIGURE 8.
10 Annual Planning Survey Results 2012
Analysis of the 2011 Annual Planning Survey Results
This question received the highest response rate of all questions. Acreage standards and standards for new developments were the most popular responses to address park and open space standards.
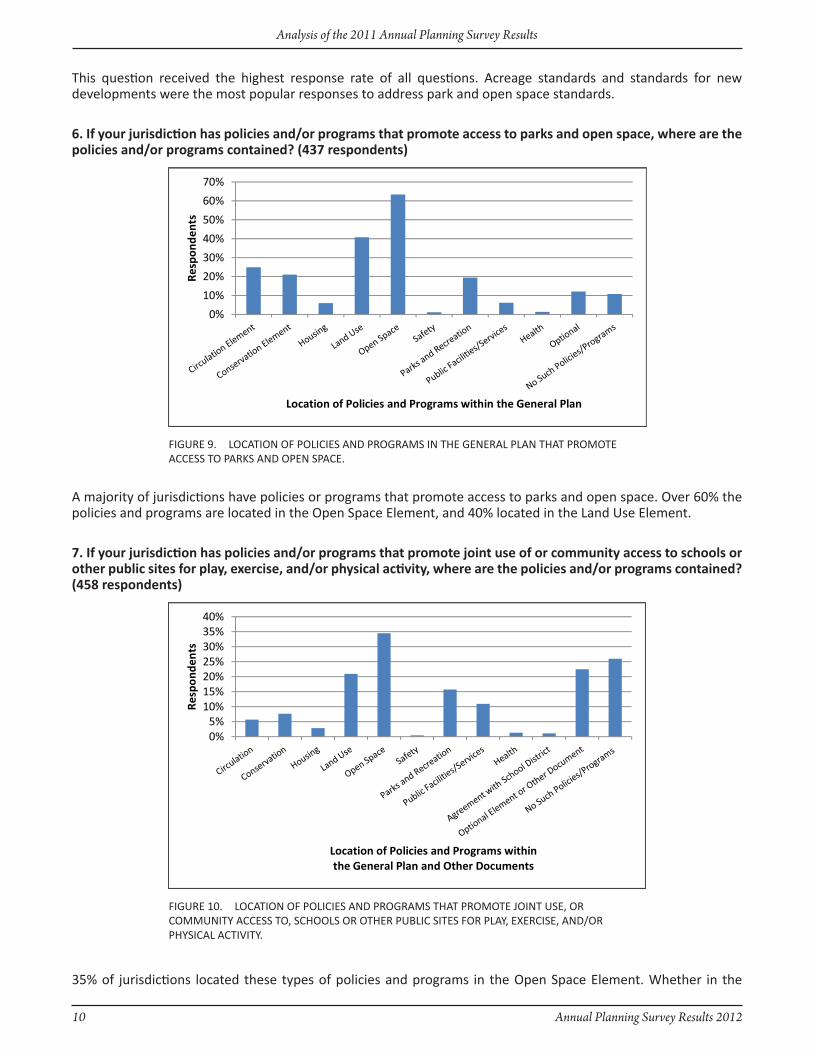
6. if your jurisdiction has policies and/or programs that promote access to parks and open space, where are the policies and/or programs contained? (437 respondents)
A majority of jurisdictions have policies or programs that promote access to parks and open space. Over 60% the policies and programs are located in the Open Space Element, and 40% located in the Land Use Element.
7. if your jurisdiction has policies and/or programs that promote joint use of or community access to schools or other public sites for play, exercise, and/or physical activity, where are the policies and/or programs contained? (458 respondents)
35% of jurisdictions located these types of policies and programs in the Open Space Element. Whether in the
LOCATION OF POLICIES AND PROGRAMS IN THE GENERAL PLAN THAT PROMOTE FIGURE 9. ACCESS TO PARKS AND OPEN SPACE.
LOCATION OF POLICIES AND PROGRAMS THAT PROMOTE JOINT USE, OR FIGURE 10. COMMUNITY ACCESS TO, SCHOOLS OR OTHER PUBLIC SITES FOR PLAY, ExERCISE, AND/OR PHYSICAL ACTIVITY.

Annual Planning Survey Results 2012 11
Analysis of the 2011 Annual Planning Survey Results
General Plan, other document, or through agreements with other entities (i.e., school districts), nearly 75% of the jurisdictions reported that they have these types of policies and programs.
B. tRAnsPORtAtiOn, MOBility, And PARkinG
5. has your jurisdiction “modified the circulation element to plan for a balanced, multimodal transportation network that meets the needs of all users of the streets, roads, and highways…”? (465 respondents)
465 jurisdictions responded to this question. The responses were nearly split down the middle with nearly 50% reporting that they had not yet modified the Circulation Element to reflect these policies and 48.6% reporting that they had modified the Circulation Element to address these policies.
By population and median income level, Figure 12 shows that the jurisdictions in the lowest median income quartile, which encompasses close to 4 million people, and about half (2 million) live in jurisdictions that have not yet modified their Circulation elements, but there are far more people in the 25-50% quartile that live in jurisdictions that have not modified the Circulation Element.
JURISDICTIONS THAT MODIFIED THE CIRCULATION ELEMENT TO PLAN FOR A FIGURE 11. BALANCED, MULTIMODAL TRANSPORTATION NETWORK THAT MEETS THE NEEDS OF ALL USERS OF STREETS, ROADS, AND HIGHWAYS.
JURISDICTION POPULATIONS BY JURISDICTION MEDIAN INCOME QUARTILE WITH FIGURE 12. MODIFIED CIRCULATION ELEMENTS TO PLAN FOR A BALANCED, MULTIMODAL TRANSPORTATION NETWORK.
12 Annual Planning Survey Results 2012
Analysis of the 2011 Annual Planning Survey Results
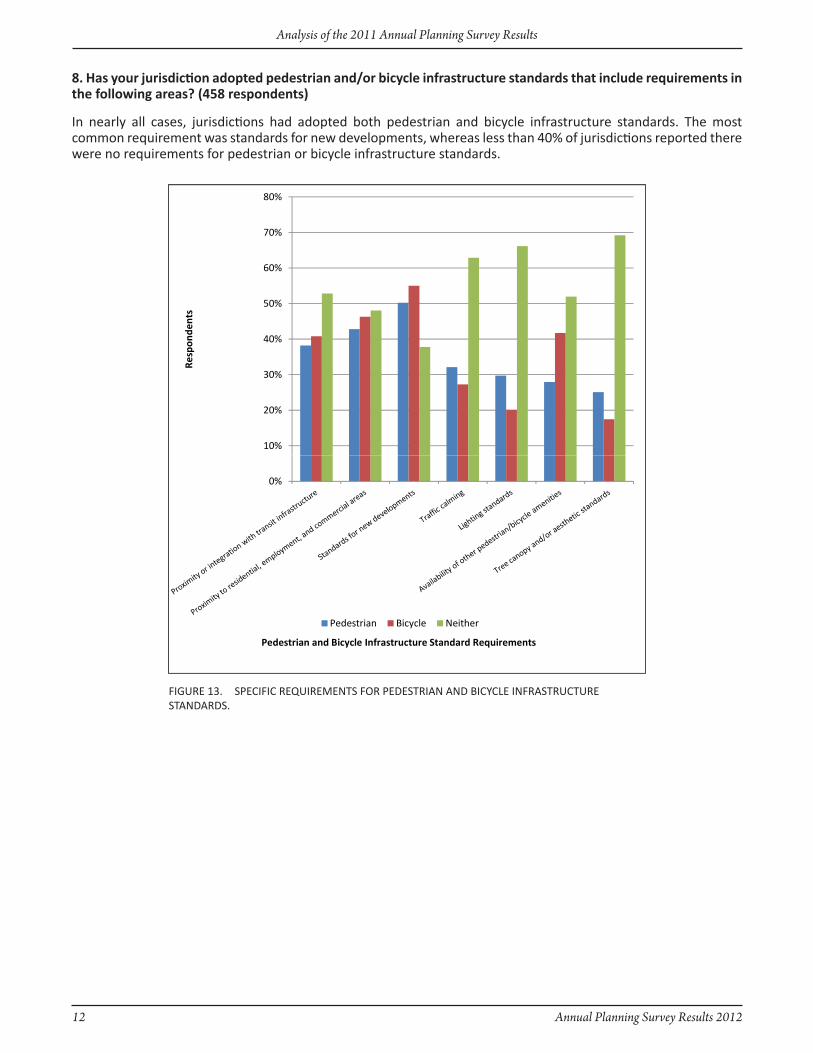
8. has your jurisdiction adopted pedestrian and/or bicycle infrastructure standards that include requirements in the following areas? (458 respondents)
In nearly all cases, jurisdictions had adopted both pedestrian and bicycle infrastructure standards. The most common requirement was standards for new developments, whereas less than 40% of jurisdictions reported there were no requirements for pedestrian or bicycle infrastructure standards.
SPECIFIC REQUIREMENTS FOR PEDESTRIAN AND BICYCLE INFRASTRUCTURE FIGURE 13. STANDARDS.
Annual Planning Survey Results 2012 13
Analysis of the 2011 Annual Planning Survey Results
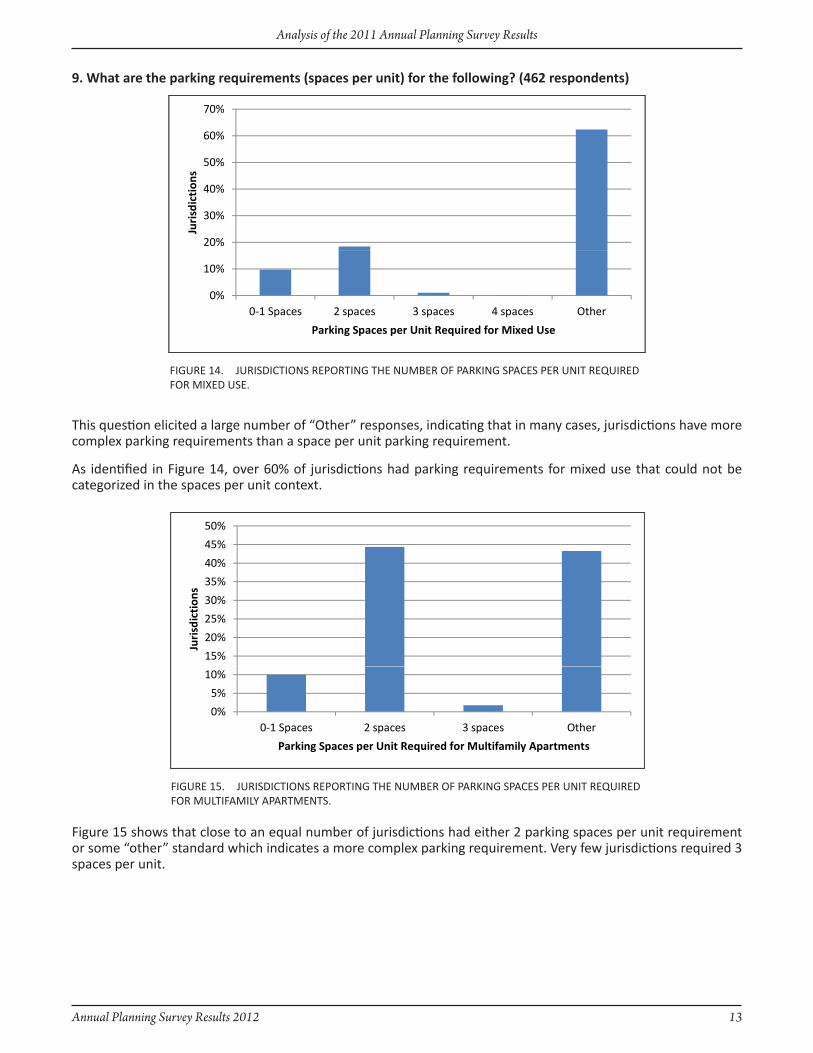
9. What are the parking requirements (spaces per unit) for the following? (462 respondents)
This question elicited a large number of “Other” responses, indicating that in many cases, jurisdictions have more complex parking requirements than a space per unit parking requirement.
As identified in Figure 14, over 60% of jurisdictions had parking requirements for mixed use that could not be categorized in the spaces per unit context.
Figure 15 shows that close to an equal number of jurisdictions had either 2 parking spaces per unit requirement or some “other” standard which indicates a more complex parking requirement. Very few jurisdictions required 3 spaces per unit.
JURISDICTIONS REPORTING THE NUMBER OF PARKING SPACES PER UNIT REQUIRED FIGURE 14. FOR MIxED USE.
JURISDICTIONS REPORTING THE NUMBER OF PARKING SPACES PER UNIT REQUIRED FIGURE 15. FOR MULTIFAMILY APARTMENTS.
14 Annual Planning Survey Results 2012
Analysis of the 2011 Annual Planning Survey Results
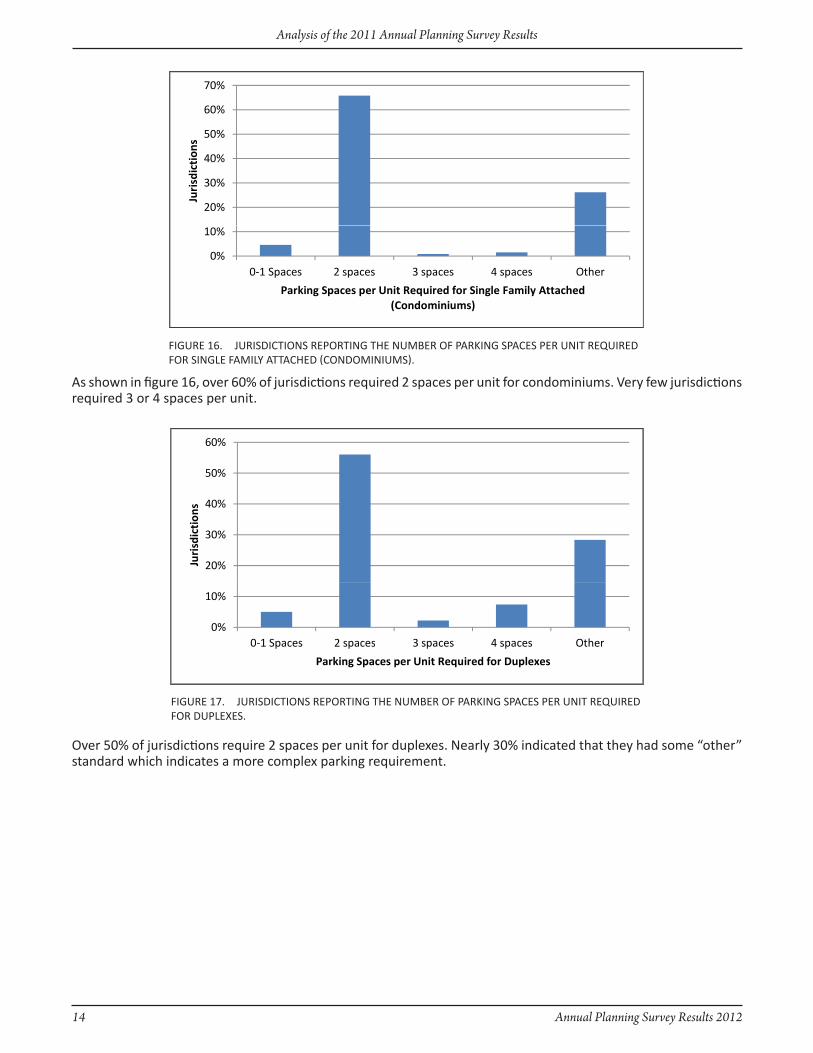
As shown in figure 16, over 60% of jurisdictions required 2 spaces per unit for condominiums. Very few jurisdictions required 3 or 4 spaces per unit.
Over 50% of jurisdictions require 2 spaces per unit for duplexes. Nearly 30% indicated that they had some “other” standard which indicates a more complex parking requirement.
JURISDICTIONS REPORTING THE NUMBER OF PARKING SPACES PER UNIT REQUIRED FIGURE 16. FOR SINGLE FAMILY ATTACHED (CONDOMINIUMS).
JURISDICTIONS REPORTING THE NUMBER OF PARKING SPACES PER UNIT REQUIRED FIGURE 17. FOR DUPLExES.

Annual Planning Survey Results 2012 15
Analysis of the 2011 Annual Planning Survey Results
Close to 60% of jurisdictions indicated that they had some “other” standard which indicates a more complex parking requirement for emergency shelters than a straight number of parking spaces per unit.
10. What parking innovations or strategies does your jurisdiction utilize? (458 respondents)
85% of jurisdictions had some form of parking strategy. Nearly 65% of jurisdictions indicated that they use shared parking strategies, and over 60% reported using some form of parking reductions for affordable or senior housing.
JURISDICTIONS REPORTING THE NUMBER OF PARKING SPACES PER UNIT REQUIRED FIGURE 18. FOR EMERGENCY SHELTERS.
JURISDICTIONS REPORTING THE PARKING INNOVATIONS OR STRATEGIES.FIGURE 19.

16 Annual Planning Survey Results 2012
Analysis of the 2011 Annual Planning Survey Results
c. hOusinG, density, And infill
11. has your agency identified specific areas within its jurisdiction for infill development? (465 respondents)
Nearly 70% reporting they had identified specific areas for infill development.
Figure 21 shows a slight increase in the identification of specific areas for infill development as the jurisdiction size increases. By jurisdiction size, smaller jurisdictions identify specific areas for infill development almost the to the same degree as larger jurisdictions.
JURISDICTIONS THAT IDENTIFIED SPECIFIC AREAS FOR INFILL DEVELOPMENT.FIGURE 20.
JURISDICTIONS IDENTIFYING SPECIFIC AREAS FOR INFILL DEVELOPMENT BY FIGURE 21. JURISDICTION POPULATION QUARTILE.

Annual Planning Survey Results 2012 17
Analysis of the 2011 Annual Planning Survey Results
Similarly, by income quartiles, Figure 22 shows that lower median income jurisdictions are just as likely to identify infill areas as higher income jurisdictions.
11a. documents Where Areas for infill development have been identified (239 respondents)
Figure 23 shows the planning documents used to identify specific areas within a jurisdiction for infill development. Infill development is often identified in the Housing and Land Use elements of the General Plan.
JURISDICTIONS IDENTIFYING SPECIFIC AREAS FOR INFILL DEVELOPMENT BY FIGURE 22. MEDIAN INCOME QUARTILE.
SPECIFIC PLANNING DOCUMENTS JURISDICTIONS HAVE TO IDENTIFY INFILL AREAS.FIGURE 23.

18 Annual Planning Survey Results 2012
Analysis of the 2011 Annual Planning Survey Results
12. have the effects of infill development, such as traffic, noise, public services, etc., been analyzed in a programmatic environmental analysis, such as general plan environmental impact report? (463 respondents)
68% of jurisdictions identified specific areas for infill development (see Figure 20), and over 50% of all jurisdictions have conducted a programmatic environmental analysis of the effects of infill development. This is typically conducted through a General Plan Environmental Impact Report (EIR) or some other type of programmatic EIR.
13. if your agency has policies to promote or facilitate infill development, what types of policies and/or programs has your agency adopted to facilitate infill development? (448 respondents)
64% of jurisdictions have policies and programs that promote or facilitate infill development. In comparing responses of jurisdictions with infill policies, there were 32 more jurisdictions that identified areas for infill development than those that have policies to promote or facilitate infill development.
JURISDICTIONS THAT ANALYzED THE EFFECTS OF INFILL DEVELOPMENT IN A FIGURE 24. PROGRAMMATIC ENVIRONMENTAL ANALYSIS.
JURISDICTIONS WITH POLICIES TO PROMOTE OR FACILITATE INFILL DEVELOPMENT.FIGURE 25.
Annual Planning Survey Results 2012 19
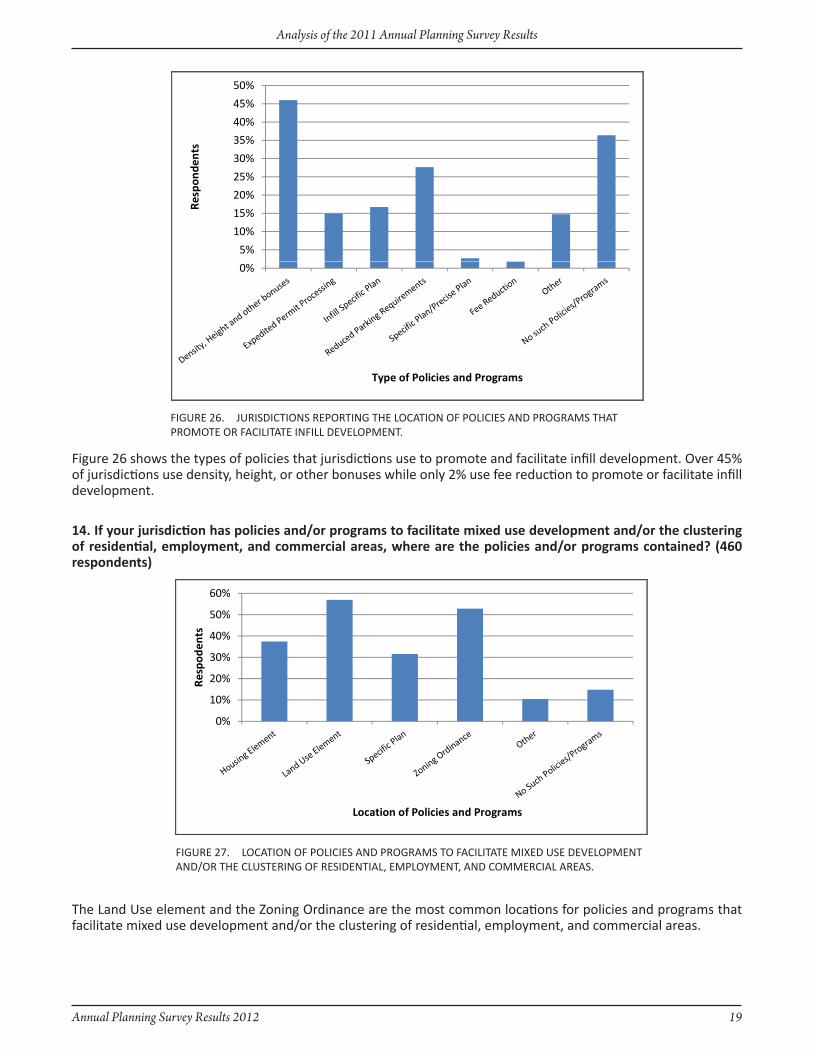
Analysis of the 2011 Annual Planning Survey Results
Figure 26 shows the types of policies that jurisdictions use to promote and facilitate infill development. Over 45% of jurisdictions use density, height, or other bonuses while only 2% use fee reduction to promote or facilitate infill development.
14. if your jurisdiction has policies and/or programs to facilitate mixed use development and/or the clustering of residential, employment, and commercial areas, where are the policies and/or programs contained? (460 respondents)
The Land Use element and the zoning Ordinance are the most common locations for policies and programs that facilitate mixed use development and/or the clustering of residential, employment, and commercial areas.
JURISDICTIONS REPORTING THE LOCATION OF POLICIES AND PROGRAMS THAT FIGURE 26. PROMOTE OR FACILITATE INFILL DEVELOPMENT.
LOCATION OF POLICIES AND PROGRAMS TO FACILITATE MIxED USE DEVELOPMENT FIGURE 27. AND/OR THE CLUSTERING OF RESIDENTIAL, EMPLOYMENT, AND COMMERCIAL AREAS.
20 Annual Planning Survey Results 2012
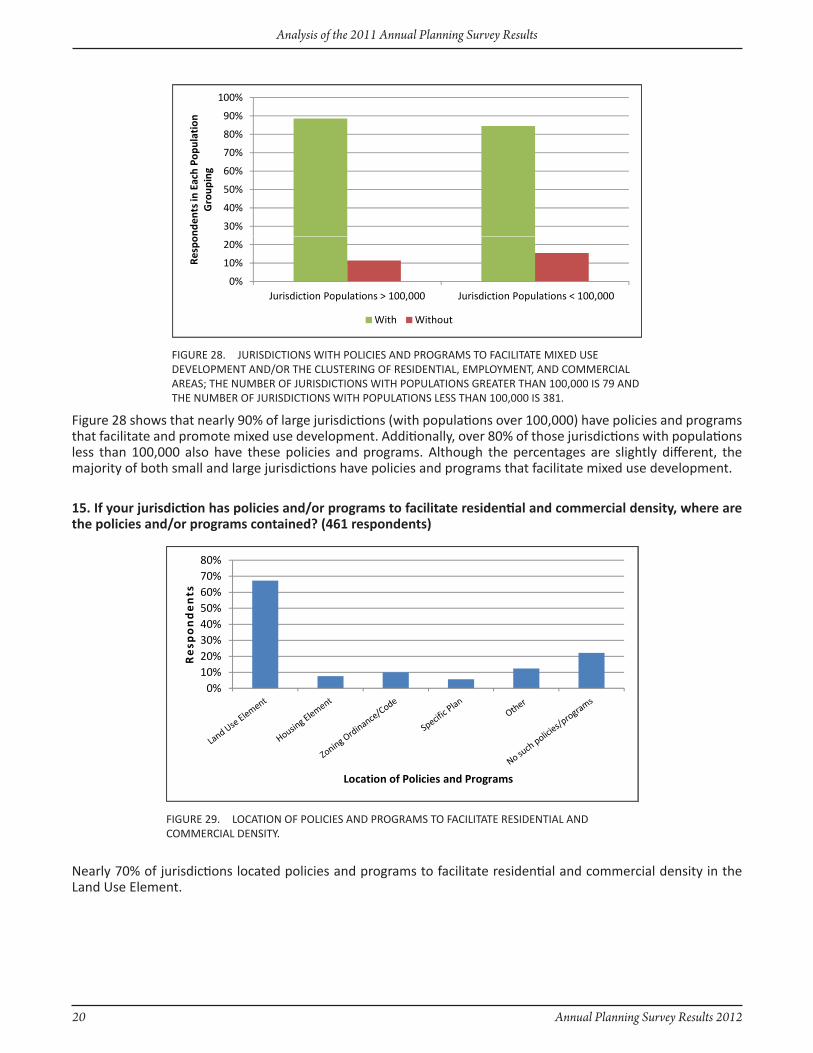
Analysis of the 2011 Annual Planning Survey Results
Figure 28 shows that nearly 90% of large jurisdictions (with populations over 100,000) have policies and programs that facilitate and promote mixed use development. Additionally, over 80% of those jurisdictions with populations less than 100,000 also have these policies and programs. Although the percentages are slightly different, the majority of both small and large jurisdictions have policies and programs that facilitate mixed use development.
15. if your jurisdiction has policies and/or programs to facilitate residential and commercial density, where are the policies and/or programs contained? (461 respondents)
Nearly 70% of jurisdictions located policies and programs to facilitate residential and commercial density in the Land Use Element.
JURISDICTIONS WITH POLICIES AND PROGRAMS TO FACILITATE MIxED USE FIGURE 28. DEVELOPMENT AND/OR THE CLUSTERING OF RESIDENTIAL, EMPLOYMENT, AND COMMERCIAL AREAS; THE NUMBER OF JURISDICTIONS WITH POPULATIONS GREATER THAN 100,000 IS 79 AND THE NUMBER OF JURISDICTIONS WITH POPULATIONS LESS THAN 100,000 IS 381.
LOCATION OF POLICIES AND PROGRAMS TO FACILITATE RESIDENTIAL AND FIGURE 29. COMMERCIAL DENSITY.
Annual Planning Survey Results 2012 21
Analysis of the 2011 Annual Planning Survey Results
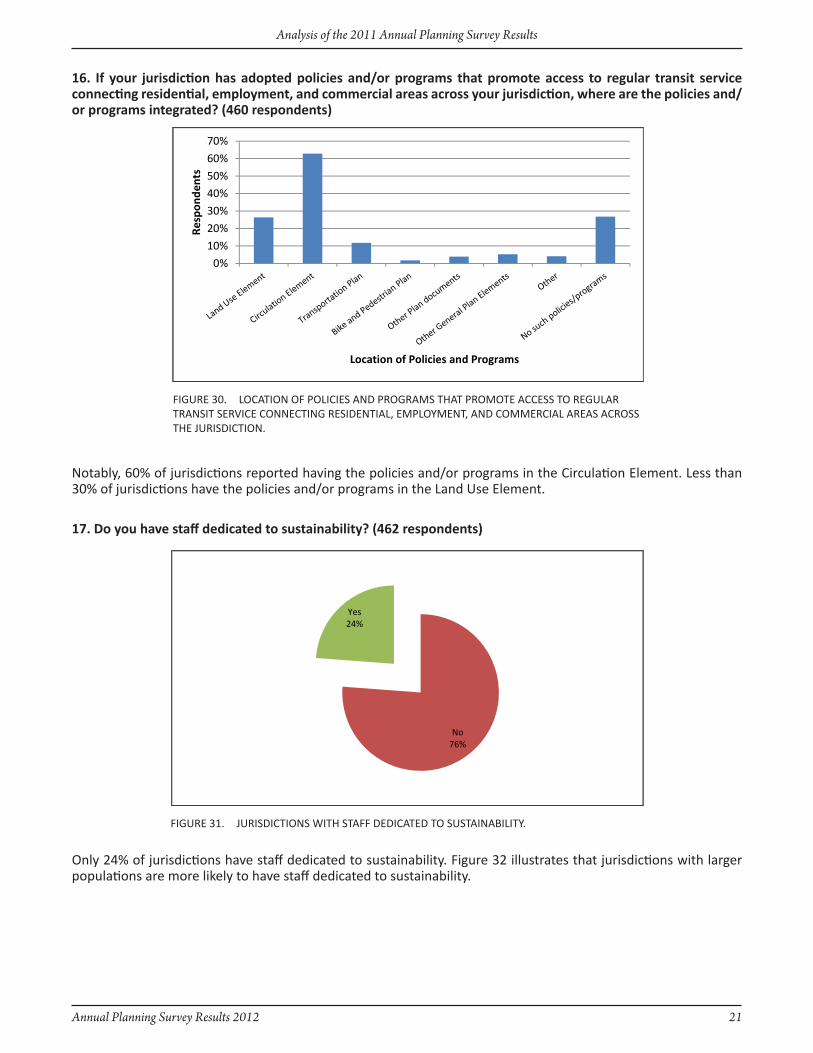
16. if your jurisdiction has adopted policies and/or programs that promote access to regular transit service connecting residential, employment, and commercial areas across your jurisdiction, where are the policies and/or programs integrated? (460 respondents)
Notably, 60% of jurisdictions reported having the policies and/or programs in the Circulation Element. Less than 30% of jurisdictions have the policies and/or programs in the Land Use Element.
17. do you have staff dedicated to sustainability? (462 respondents)
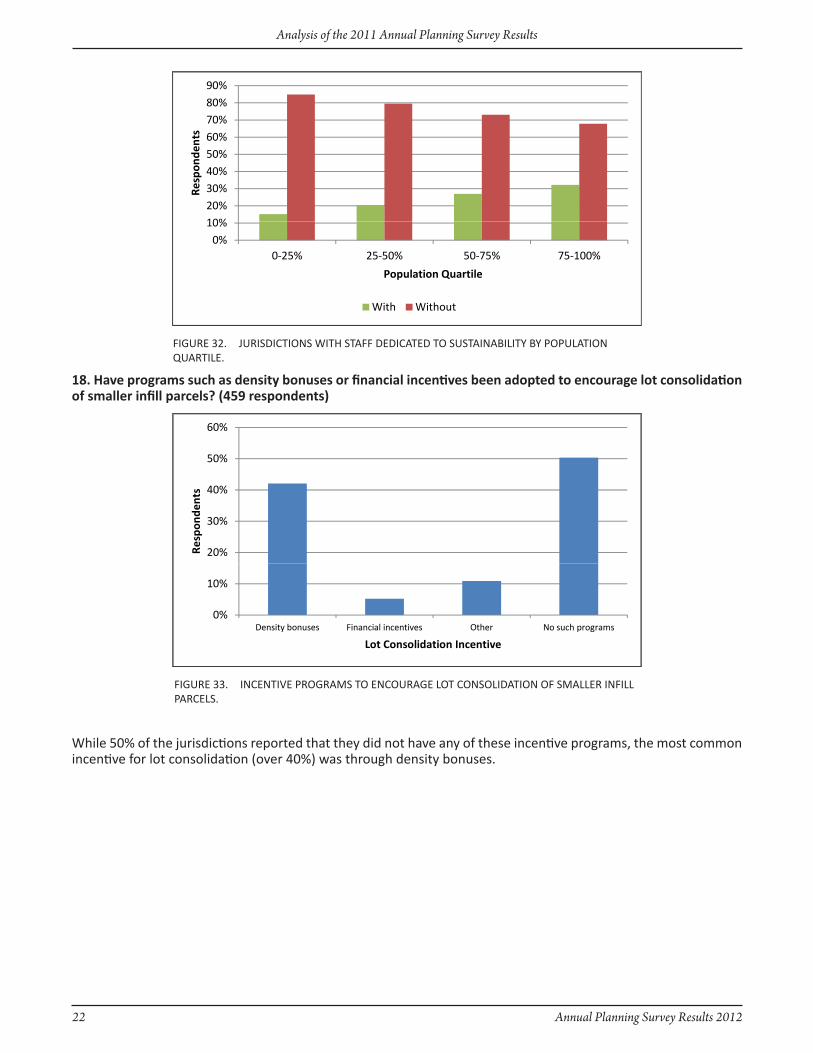
Only 24% of jurisdictions have staff dedicated to sustainability. Figure 32 illustrates that jurisdictions with larger populations are more likely to have staff dedicated to sustainability.
LOCATION OF POLICIES AND PROGRAMS THAT PROMOTE ACCESS TO REGULAR FIGURE 30. TRANSIT SERVICE CONNECTING RESIDENTIAL, EMPLOYMENT, AND COMMERCIAL AREAS ACROSS THE JURISDICTION.
JURISDICTIONS WITH STAFF DEDICATED TO SUSTAINABILITY.FIGURE 31.
22 Annual Planning Survey Results 2012
Analysis of the 2011 Annual Planning Survey Results
18. have programs such as density bonuses or financial incentives been adopted to encourage lot consolidation of smaller infill parcels? (459 respondents)
While 50% of the jurisdictions reported that they did not have any of these incentive programs, the most common incentive for lot consolidation (over 40%) was through density bonuses.
JURISDICTIONS WITH STAFF DEDICATED TO SUSTAINABILITY BY POPULATION FIGURE 32. QUARTILE.
INCENTIVE PROGRAMS TO ENCOURAGE LOT CONSOLIDATION OF SMALLER INFILL FIGURE 33. PARCELS.
Annual Planning Survey Results 2012 23
Analysis of the 2011 Annual Planning Survey Results
19. does your jurisdiction regulate allowable densities based on performance standards and, if so, which standards? (459 respondents)
Figure 35 shows that over 70% of the jurisdictions reported that they do not regulate allowable densities based on performance standards.
20. have you developed a non-discretionary design review procedure for residential development and, if so, for which type? (405 respondents)
Over 40% of jurisdictions reported having this procedure for single-family residences, and close to 40% indicated not having any procedures.
PERFORMANCE STANDARDS USED TO REGULATE ALLOWABLE DENSITIES.FIGURE 34.
RESIDENTIAL DEVELOPMENT TYPES FOR WHICH JURISDICTIONS HAVE DEVELOPED FIGURE 35. A NON-DISCRETIONARY DESIGN REVIEW PROCESS.

24 Annual Planning Survey Results 2012
Analysis of the 2011 Annual Planning Survey Results
21. Please explain the primary barriers your jurisdiction has experienced to implementing infill projects. (238 respondents)
25% of jurisdictions reported that infrastructure constraints were a primary barrier to implementing infill projects. Just under 25% reported that they had problems with assembling parcels of the right size and configuration for infill development.
Using data from Question 18 of the 2011 Annual Planning Survey which determined what types of incentive programs jurisdictions had to encourage lot consolidation of smaller infill parcels and then comparing it to data from this question, it is evident that even with programs to encourage lot consolidation that some jurisdictions are still having lot issues. Lot issues is a broad category that includes barriers dealing with lot consolidation, as well as irregularly shaped lots. Of those 57 jurisdictions who identified lot issues as a primary barrier, 21 have programs to provide density bonuses or other financial incentives to encourage lot consolidation of smaller infill parcels.
PRIMARY BARRIERS ExPERIENCED BY JURISDICTIONS IN IMPLEMENTING INFILL FIGURE 36. PROJECTS.
tABle 3.
JuRisdictiOns With PROGRAMs
And incentives tO AddRess infill
JuRisdictiOns WithOut PROGRAMs
And incentive tO AddRess infill
ToTal
Lot Issues 21 36 57
Annual Planning Survey Results 2012 25
Analysis of the 2011 Annual Planning Survey Results
d. eMeRGency shelteRs (sB 2) And sPeciAl needs
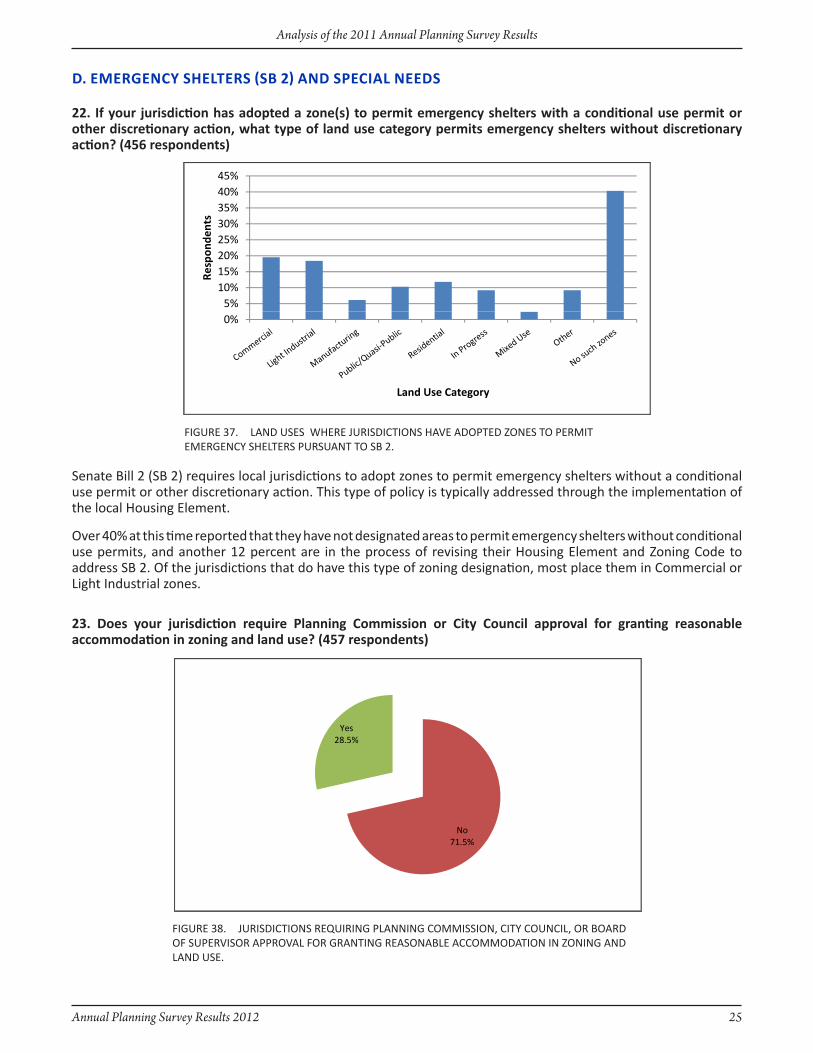
22. if your jurisdiction has adopted a zone(s) to permit emergency shelters with a conditional use permit or other discretionary action, what type of land use category permits emergency shelters without discretionary action? (456 respondents)
Senate Bill 2 (SB 2) requires local jurisdictions to adopt zones to permit emergency shelters without a conditional use permit or other discretionary action. This type of policy is typically addressed through the implementation of the local Housing Element.
Over 40% at this time reported that they have not designated areas to permit emergency shelters without conditional use permits, and another 12 percent are in the process of revising their Housing Element and zoning Code to address SB 2. Of the jurisdictions that do have this type of zoning designation, most place them in Commercial or Light Industrial zones.
23. does your jurisdiction require Planning commission or city council approval for granting reasonable accommodation in zoning and land use? (457 respondents)
LAND USES WHERE JURISDICTIONS HAVE ADOPTED zONES TO PERMIT FIGURE 37. EMERGENCY SHELTERS PURSUANT TO SB 2.
JURISDICTIONS REQUIRING PLANNING COMMISSION, CITY COUNCIL, OR BOARD FIGURE 38. OF SUPERVISOR APPROVAL FOR GRANTING REASONABLE ACCOMMODATION IN zONING AND LAND USE.
26 Annual Planning Survey Results 2012
Analysis of the 2011 Annual Planning Survey Results
Over 70% of the jurisdictions do not require Planning Commission, City Council, or Board of Supervisor approval to grant reasonable accommodation in zoning and land use.
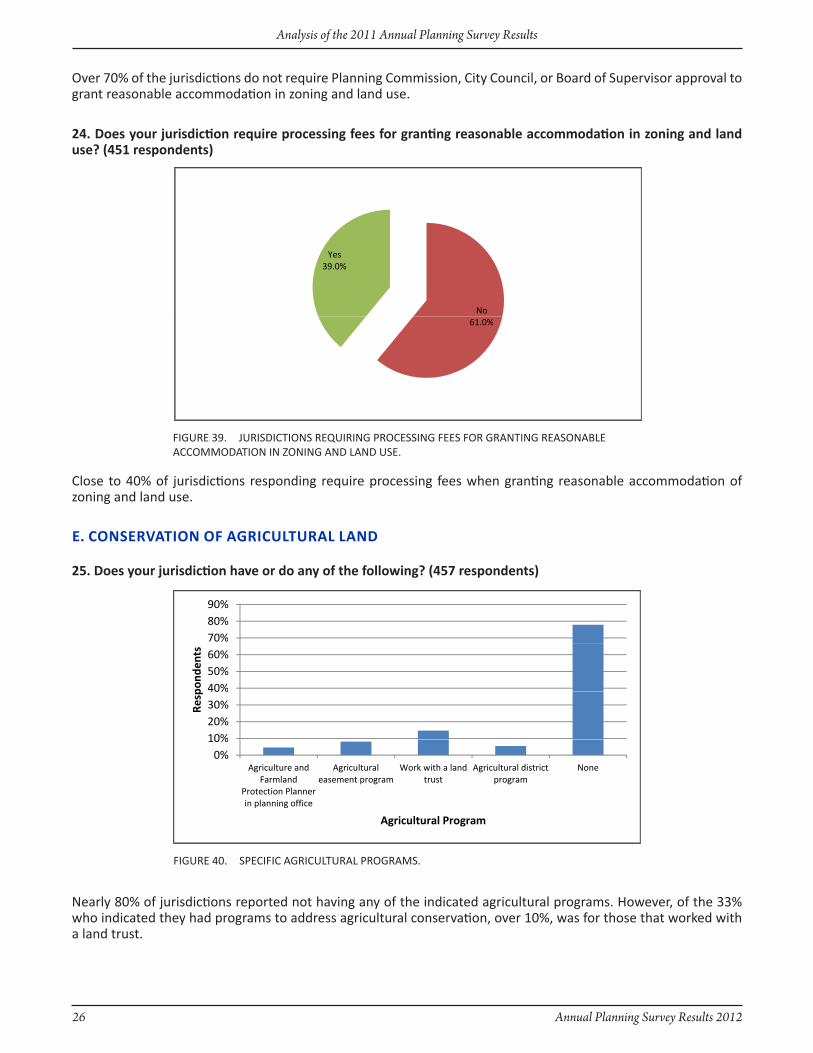
24. does your jurisdiction require processing fees for granting reasonable accommodation in zoning and land use? (451 respondents)
Close to 40% of jurisdictions responding require processing fees when granting reasonable accommodation of zoning and land use.
e. cOnseRvAtiOn Of AGRicultuRAl lAnd
25. does your jurisdiction have or do any of the following? (457 respondents)
Nearly 80% of jurisdictions reported not having any of the indicated agricultural programs. However, of the 33% who indicated they had programs to address agricultural conservation, over 10%, was for those that worked with a land trust.
SPECIFIC AGRICULTURAL PROGRAMS.FIGURE 40.
JURISDICTIONS REQUIRING PROCESSING FEES FOR GRANTING REASONABLE FIGURE 39. ACCOMMODATION IN zONING AND LAND USE.
Annual Planning Survey Results 2012 27
Analysis of the 2011 Annual Planning Survey Results
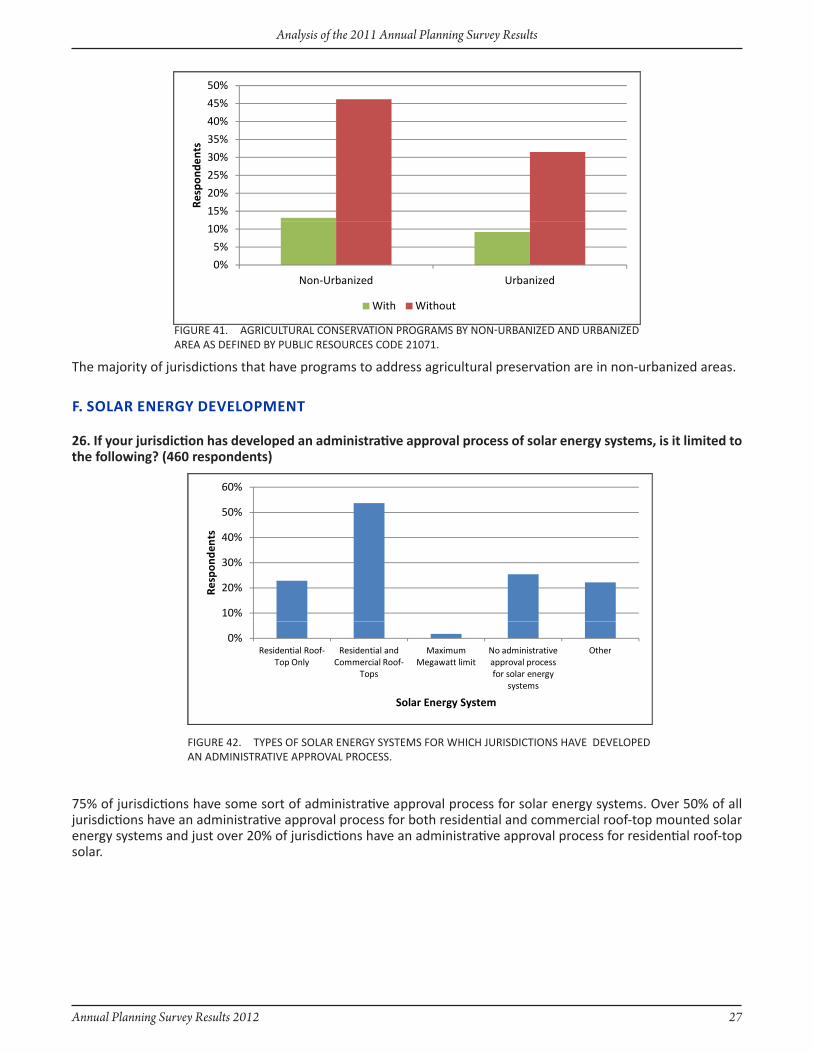
The majority of jurisdictions that have programs to address agricultural preservation are in non-urbanized areas.
f. sOlAR eneRGy develOPMent
26. if your jurisdiction has developed an administrative approval process of solar energy systems, is it limited to the following? (460 respondents)
75% of jurisdictions have some sort of administrative approval process for solar energy systems. Over 50% of all jurisdictions have an administrative approval process for both residential and commercial roof-top mounted solar energy systems and just over 20% of jurisdictions have an administrative approval process for residential roof-top solar.
AGRICULTURAL CONSERVATION PROGRAMS BY NON-URBANIzED AND URBANIzED FIGURE 41. AREA AS DEFINED BY PUBLIC RESOURCES CODE 21071.
TYPES OF SOLAR ENERGY SYSTEMS FOR WHICH JURISDICTIONS HAVE DEVELOPED FIGURE 42. AN ADMINISTRATIVE APPROVAL PROCESS.

28 Annual Planning Survey Results 2012
Analysis of the 2011 Annual Planning Survey Results
Figure 43 indicates that higher median income jurisdictions are more likely to have an administrative approval process for specific solar energy systems than lower median income jurisdictions.
27. has your jurisdiction developed policies, programs, or ordinances to facilitate the development of renewable energy facilities? (462 respondents)
The majority of jurisdictions still do not have policies, programs, or ordinances that facilitate the development of renewable energy facilities.
JURISDICTIONS THAT HAVE DEVELOPED POLICIES, PROGRAMS, OR ORDINANCES FIGURE 44. TO FACILITATE THE DEVELOPMENT OF RENEWABLE ENERGY FACILITIES.
JURISDICTIONS BY MEDIAN INCOME QUARTILE THAT HAVE DEVELOPED AN FIGURE 43. ADMINISTRATIVE APPROVAL PROCESS FOR CERTAIN TYPES OF SOLAR ENERGY SYSTEMS.

Annual Planning Survey Results 2012 29
Analysis of the 2011 Annual Planning Survey Results
Jurisdictions in urbanized areas are just as likely to have policies, programs, or ordinances to facilitate the development of renewable energy facilities as jurisdictions in non-urbanized areas.
Interestingly, when considering the type of jurisdictions (city versus county), counties are more likely than cities to develop these kinds of policies, programs, and ordinances.
JURISDICTIONS THAT HAVE DEVELOPED POLICIES, PROGRAMS, OR ORDINANCES FIGURE 45. TO FACILITATE THE DEVELOPMENT OF RENEWABLE ENERGY FACILITIES BY URBANIzED AND NON-URBANIzED AREA DEFINED BY CALIFORNIA PUBLIC RESOURCES CODE SECTION 21071.
JURISDICTION TYPES THAT HAVE DEVELOPED POLICIES, PROGRAMS, OR FIGURE 46. ORDINANCES TO FACILITATE THE DEVELOPMENT OF RENEWABLE ENERGY FACILITIES.
30 Annual Planning Survey Results 2012
Analysis of the 2011 Annual Planning Survey Results
28. does your jurisdiction possess a mechanism to track installation of distributed generation facilities? (458 respondents)
In a majority of cases, jurisdictions have not developed any kind of mechanism to track the installation of distributed generation facilities within the jurisdictions. Additionally, over 40% of jurisdictions also reported not having an Energy Ordinance for distributed generation facilities.
SPECIFIC TRACKING MECHANISMS TO TRACK THE INSTALLATION OF DISTRIBUTED FIGURE 47. GENERATION FACILITIES.

Annual Planning Survey Results 2012 31
Analysis of the 2011 Annual Planning Survey Results
29. if your jurisdiction tracks installation of distributed generation, how much distributed generation was installed between January 1, 2010 and december 31, 2010? (391 respondents)
Very few jurisdictions (39) reported tracking the installation of distributed generation facilities in 2010. See the Appendix for how much distributed generation was installed for the 2010 calendar year by jurisdictions that tracked its installation.
G. GReenhOuse GAses (GhG)/cliMAte ActiOn PlAn
30. has your jurisdiction adopted, or is in the process of drafting, policies and/or programs to address climate change and/or to reduce GhG emissions for community and municipal activities? (451 respondents)
Approximately 80% of jurisdictions have adopted, drafted, or plan to adopt these types of programs and policies. Nearly the same amount of jurisdictions have adopted these policies or programs. Close to 20% of responding jurisdictions have not adopted and are not in the process of developing the policies or programs.
JURISDICTIONS THAT TRACKED THE INSTALLATION OF DISTRIBUTED GENERATION FIGURE 48. FACILITIES BETWEEN JANUARY 1, 2010 AND DECEMBER 31, 2010.
STATUS OF POLICIES AND/OR PROGRAMS TO ADDRESS CLIMATE CHANGE AND/FIGURE 49. OR TO REDUCE GHG EMISSIONS FOR COMMUNITY AND MUNICIPAL ACTIVITIES.
32 Annual Planning Survey Results 2012
Analysis of the 2011 Annual Planning Survey Results
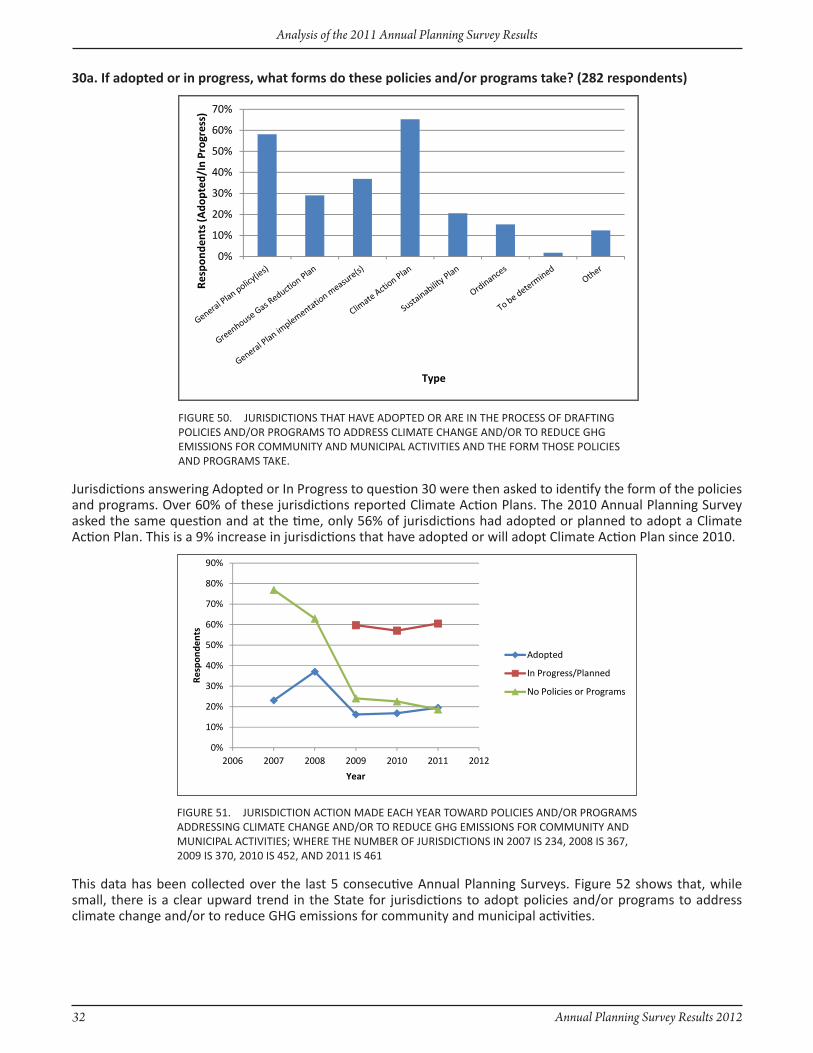
30a. if adopted or in progress, what forms do these policies and/or programs take? (282 respondents)
Jurisdictions answering Adopted or In Progress to question 30 were then asked to identify the form of the policies and programs. Over 60% of these jurisdictions reported Climate Action Plans. The 2010 Annual Planning Survey asked the same question and at the time, only 56% of jurisdictions had adopted or planned to adopt a Climate Action Plan. This is a 9% increase in jurisdictions that have adopted or will adopt Climate Action Plan since 2010.
This data has been collected over the last 5 consecutive Annual Planning Surveys. Figure 52 shows that, while small, there is a clear upward trend in the State for jurisdictions to adopt policies and/or programs to address climate change and/or to reduce GHG emissions for community and municipal activities.
JURISDICTIONS THAT HAVE ADOPTED OR ARE IN THE PROCESS OF DRAFTING FIGURE 50. POLICIES AND/OR PROGRAMS TO ADDRESS CLIMATE CHANGE AND/OR TO REDUCE GHG EMISSIONS FOR COMMUNITY AND MUNICIPAL ACTIVITIES AND THE FORM THOSE POLICIES AND PROGRAMS TAKE.
JURISDICTION ACTION MADE EACH YEAR TOWARD POLICIES AND/OR PROGRAMS FIGURE 51. ADDRESSING CLIMATE CHANGE AND/OR TO REDUCE GHG EMISSIONS FOR COMMUNITY AND MUNICIPAL ACTIVITIES; WHERE THE NUMBER OF JURISDICTIONS IN 2007 IS 234, 2008 IS 367, 2009 IS 370, 2010 IS 452, AND 2011 IS 461
Annual Planning Survey Results 2012 33
Analysis of the 2011 Annual Planning Survey Results
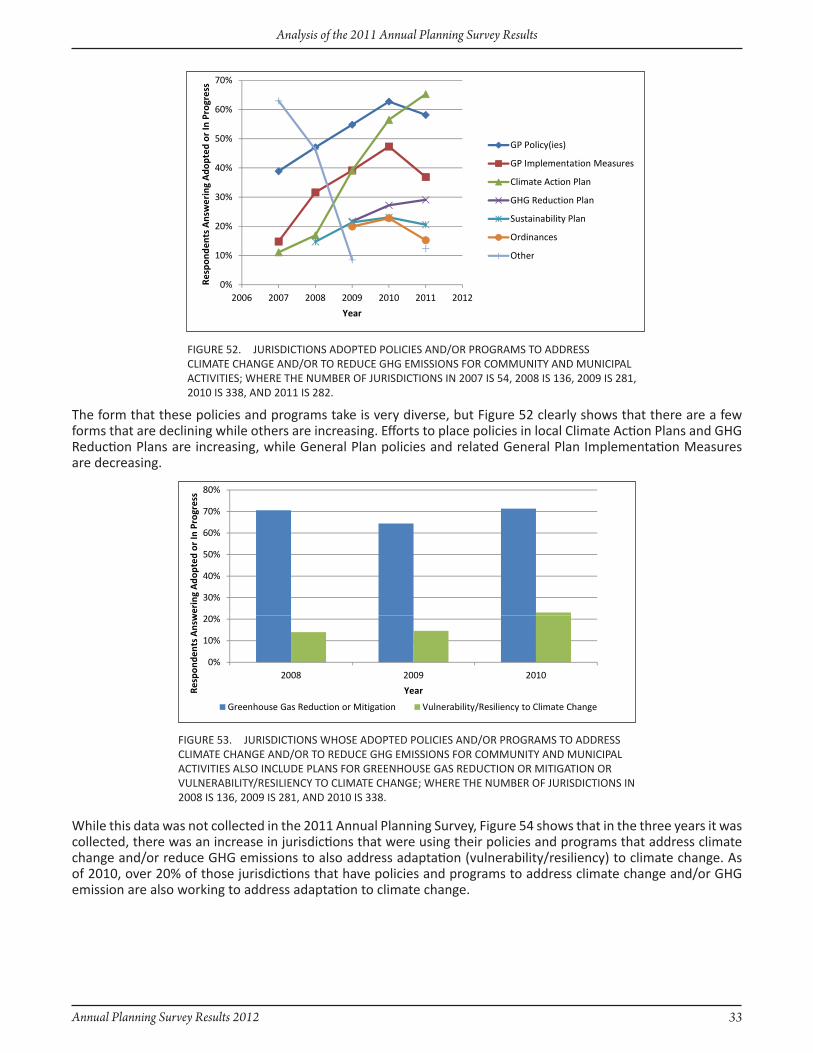
The form that these policies and programs take is very diverse, but Figure 52 clearly shows that there are a few forms that are declining while others are increasing. Efforts to place policies in local Climate Action Plans and GHG Reduction Plans are increasing, while General Plan policies and related General Plan Implementation Measures are decreasing.
While this data was not collected in the 2011 Annual Planning Survey, Figure 54 shows that in the three years it was collected, there was an increase in jurisdictions that were using their policies and programs that address climate change and/or reduce GHG emissions to also address adaptation (vulnerability/resiliency) to climate change. As of 2010, over 20% of those jurisdictions that have policies and programs to address climate change and/or GHG emission are also working to address adaptation to climate change.
JURISDICTIONS ADOPTED POLICIES AND/OR PROGRAMS TO ADDRESS FIGURE 52. CLIMATE CHANGE AND/OR TO REDUCE GHG EMISSIONS FOR COMMUNITY AND MUNICIPAL ACTIVITIES; WHERE THE NUMBER OF JURISDICTIONS IN 2007 IS 54, 2008 IS 136, 2009 IS 281, 2010 IS 338, AND 2011 IS 282.
JURISDICTIONS WHOSE ADOPTED POLICIES AND/OR PROGRAMS TO ADDRESS FIGURE 53. CLIMATE CHANGE AND/OR TO REDUCE GHG EMISSIONS FOR COMMUNITY AND MUNICIPAL ACTIVITIES ALSO INCLUDE PLANS FOR GREENHOUSE GAS REDUCTION OR MITIGATION OR VULNERABILITY/RESILIENCY TO CLIMATE CHANGE; WHERE THE NUMBER OF JURISDICTIONS IN 2008 IS 136, 2009 IS 281, AND 2010 IS 338.

34 Annual Planning Survey Results 2012
Analysis of the 2011 Annual Planning Survey Results
31. What are your Greenhouse Gas reduction targets and years? (249 respondents)
Over 50% of jurisdictions have adopted GHG reduction targets and years. See the Appendix for the targets and years.
32. does your jurisdiction have a mechanism for tracking progress on meeting your Greenhouse Gas reduction target for community wide and municipal emissions? (459 respondents)
Almost 80% of all respondents do not have mechanisms for tracking progress, although of the jurisdictions that have targets, nearly 55% also have mechanisms to track their project.
JURISDICTIONS THAT HAVE ADOPTED GHG REDUCTIONS TARGET AND YEARS.FIGURE 54.
JURISDICTIONS THAT HAVE MECHANISMS TO TRACK PROGRESS IN MEETING FIGURE 55. THE GHG REDUCTION TARGET FOR COMMUNITY WIDE AND MUNICIPAL EMISSIONS.
Annual Planning Survey Results 2012 35
Analysis of the 2011 Annual Planning Survey Results
h. MiscellAneOus
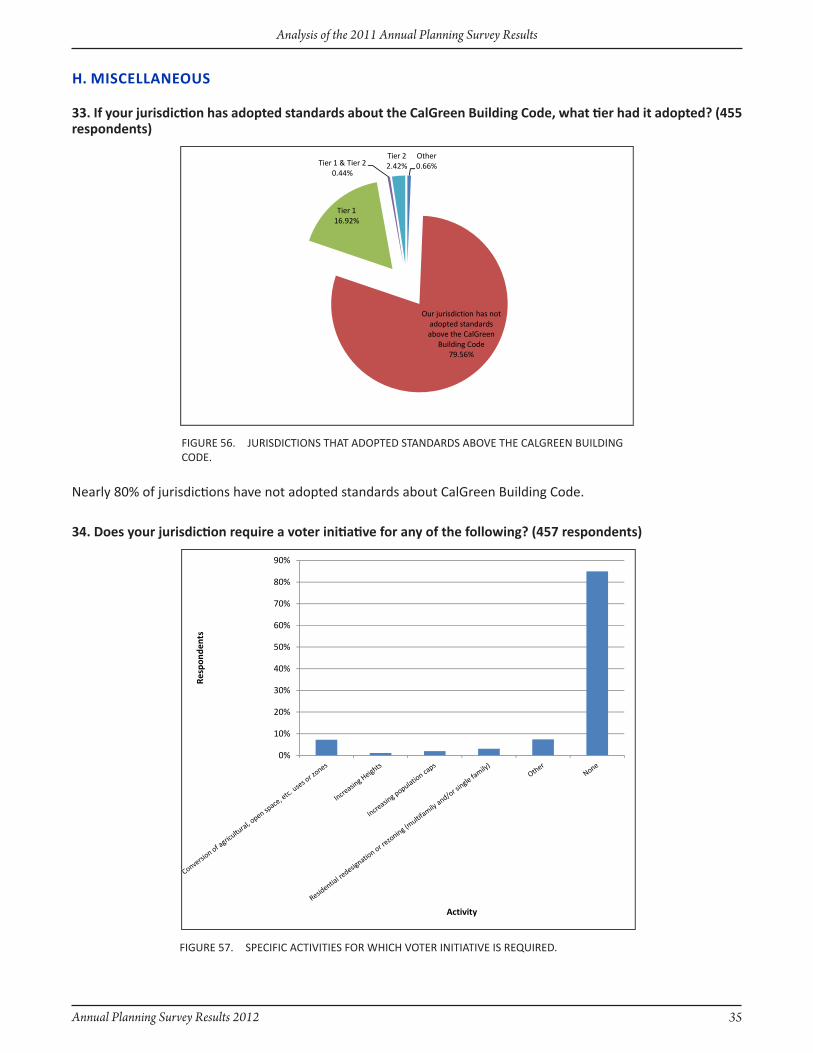
33. if your jurisdiction has adopted standards about the calGreen Building code, what tier had it adopted? (455 respondents)
Nearly 80% of jurisdictions have not adopted standards about CalGreen Building Code.
34. does your jurisdiction require a voter initiative for any of the following? (457 respondents)
JURISDICTIONS THAT ADOPTED STANDARDS ABOVE THE CALGREEN BUILDING FIGURE 56. CODE.
SPECIFIC ACTIVITIES FOR WHICH VOTER INITIATIVE IS REQUIRED.FIGURE 57.

36 Annual Planning Survey Results 2012
Analysis of the 2011 Annual Planning Survey Results
Voter initiative is overwhelmingly not used for any of these kinds of activities. Fewer than 10% of jurisdictions responded affirmatively to any of the choices.
35. if your jurisdiction is working with school districts to ensure that school siting, capital improvement decision (including closures), and operational policies align with general plans, RtPs, and sustainable communities plans, how does it do so? (455 respondents)
45% of jurisdictions reported that they have joint meetings of staff; however, another 40% do not collaborate with school districts.
36. if your jurisdiction tracks the amount of tree canopy coverage, what percent of your jurisdiction had tree canopy coverage? (405 respondents)
A majority of jurisdictions in the State do not track the amount of tree canopy coverage in their jurisdictions.
ACTIONS JURISDICTIONS TAKE IN WORKING WITH SCHOOL DISTRICTS TO FIGURE 58. ENSURE THAT SCHOOL SITING, CAPITAL IMPROVEMENT DECISIONS, AND OPERATIONAL POLICIES ALIGN WITH GENERAL PLANS, REGIONAL TRANSPORTATION PLANS (RTPS), AND SUSTAINABLE COMMUNITIES PLANS.
JURISDICTIONS THAT TRACK THE AMOUNT OF TREE CANOPY COVERAGE.FIGURE 59.
Annual Planning Survey Results 2012 37
Analysis of the 2011 Annual Planning Survey Results
In this case, counties are tracking tree canopy coverage slightly more often than cities.
37. does your jurisdiction have a cool roof/paving ordinance? (462 respondents)
A majority of jurisdictions do not have cool roofing or paving ordinances.
JURISDICTION TYPES THAT TRACK THE AMOUNT OF TREE CANOPY COVERAGE; FIGURE 60. WHERE THE NUMBER OF CITIES IS 363, CITY AND COUNTY IS 1, AND COUNTIES IS 41.
JURISDICTIONS THAT HAVE COOL ROOFING OR PAVING ORDINANCES.FIGURE 61.

38 Annual Planning Survey Results 2012
Analysis of the 2011 Annual Planning Survey Results
Figure 62 shows an even percentage of cities and county with and without cool roofing or paving ordinances.
38. Please explain the primary barriers your jurisdiction has experienced to implementing Greenhouse Gas, energy, and/or sustainability policies. (160 respondents)
Nearly 70% of jurisdictions indicated that their primary barrier to implementing Greenhouse Gas (GHG), Energy, and/or Sustainability policies was due to funding, financial, or budgetary constraints. 40% also indicated that lack of staff was a primary barrier.
JURISDICTION TYPES THAT HAVE COOL ROOFING OR PAVING ORDINANCES; FIGURE 62. THE NUMBER OF CITIES IS 415, CITY AND COUNTY IS 1, AND COUNTIES IS 46.
PRIMARY BARRIERS JURISDICTIONS HAVE ExPERIENCED IN IMPLEMENTING FIGURE 63. GREENHOUSE GAS, ENERGY, AND/OR SUSTAINABILITY POLICIES.

Annual Planning Survey Results 2012 39
Appendix A: Health and General Plans
For all Appendices, the column headings in the dark blue colors were choices provided in the questions of the Annual Planning Survey. Column headings highlighted in light blue were responses provided by survey respondents.
Appendix A: Health and
General Plans
40 Annual Planning Survey Results 2012
Appendix A: Health and General Plans
Page intentionally left blank
Annual Planning Survey Results 2012 41
Appendix A: Health and General Plans
JuRisdictiOn ciR
culA
tiO
n
cOn
seR
vAt
iOn
Ho
uSi
ng
lAn
d u
se
OPe
n s
PAce
Safe
Ty
Hea
lTH
PAR
ks
An
d
Rec
ReA
tiO
n
SuST
ain
ab
iliT
y
PuB
lic
fAci
liti
es/
seR
vic
es
Oth
eR
OtheR (descRiPtiOn)
Agoura Hills • Infrastructure and Community Services
Alameda County •
Albany • • Community Health and Safety Element
Alpine County • •
Amador County • • Economic
Anderson • •
Angels Camp • •
Antioch •
Apple Valley • • •
Arcata • • • • Parks and Recreation
Arroyo Grande •
Artesia • • • •Air Quality and Climate Change Element, Sustainability Element, Noise Element
Arvin • • • Health
Azusa • • • • • Recreation
Bakersfield •
Benicia • • Community Health and Safety
Beverly Hills • • • • •
Biggs • •
Bishop •
Blythe •
Brawley • • • Implementation
Brentwood • • • • Growth Management, Infrastructure
Brisbane •
Burlingame •
Butte County •
Calabasas •
California City • •
Calimesa •
Capitola • • • •
Ceres •
Chico • • • Parks, Public Facilities, and Services
Chino • • • • • • • Community Character
Chino Hills • • •
A. Health and General Plans
1. If your jurisdictions has policies and/or programs that explicitly reference health protection or promotion in your General Plan, where are those policies/programs contained?
42 Annual Planning Survey Results 2012
Appendix A: Health and General Plans
JuRisdictiOn ciR
culA
tiO
n
cOn
seR
vAt
iOn
Ho
uSi
ng
lAn
d u
se
OPe
n s
PAce
Safe
Ty
Hea
lTH
PAR
ks
An
d
Rec
ReA
tiO
n
SuST
ain
ab
iliT
y
PuB
lic
fAci
liti
es/
seR
vic
es
Oth
eR
OtheR (descRiPtiOn)
Chowchilla •
Chula Vista • • Environmental
Citrus Heights • • •
The Community Health Element covers flooding, seismic activity, hazardous materials, noise, air quality, climate change and services which all discuss health protection.
Claremont • •
Clayton •
Clearlake •
Clovis •
Coachella •Policies will be included in the 2012 General Plan
Colusa County •
Commerce • • • • • •
Concord • •
Coronado • Recreation
Costa Mesa •
Covina
Culver City • • •
Cypress • Air Quality
Davis • Human Services
Del Mar •
Del Rey Oaks •
Desert Hot Springs • •
Dinuba • • • • • Public Services and Facilities Element
Dorris •
Downey •
East Palo Alto • •
El Cajon •
El Centro • • •
El Dorado County •
El Monte • Health and Wellness Element
Emeryville • • Sustainability - Environmental Health
Eureka • •
Exeter • • •
Fairfax •
Fairfield •
Farmersville • • • •
Annual Planning Survey Results 2012 43
Appendix A: Health and General Plans
JuRisdictiOn ciR
culA
tiO
n
cOn
seR
vAt
iOn
Ho
uSi
ng
lAn
d u
se
OPe
n s
PAce
Safe
Ty
Hea
lTH
PAR
ks
An
d
Rec
ReA
tiO
n
SuST
ain
ab
iliT
y
PuB
lic
fAci
liti
es/
seR
vic
es
Oth
eR
OtheR (descRiPtiOn)
Firebaugh • • • •
Folsom •
Fontana •
Fort Bragg • • • • • Public Facilities
Fortuna •
Fullerton •Public Health Element - To be adopted in 2011/2012
Glendale • • Recreation; North Glendale Community Plan
Gonzales •
Grass Valley • • •
Guadalupe • • •
Hanford •
Healdsburg • Public Services
Hemet • • • • • • • Recreation and Trails
Hercules •
Hesperia •
Highland •
Hillsborough • •
Hollister •
Holtville •
Hughson •
Huron •
Imperial Beach • • Parks, Recreation, and Access
Indian Wells •
Indio •
Ione •
Jackson •
Kerman •
Kings County • • •Four Community Plans (Armona, Home Garden, Kettleman City, and Stratford)
La Habra •
La Mesa • Health and Wellness Element
La Mirada •
La Palma •
La Puente • • •
La Verne •
Laguna Beach •
Laguna Hills •
Lakeport • • •

44 Annual Planning Survey Results 2012
Appendix A: Health and General Plans
JuRisdictiOn ciR
culA
tiO
n
cOn
seR
vAt
iOn
Ho
uSi
ng
lAn
d u
se
OPe
n s
PAce
Safe
Ty
Hea
lTH
PAR
ks
An
d
Rec
ReA
tiO
n
SuST
ain
ab
iliT
y
PuB
lic
fAci
liti
es/
seR
vic
es
Oth
eR
OtheR (descRiPtiOn)
Lancaster •
Lassen County • • •
Lemon Grove • • Bicycle
Lincoln •
Livermore • Public Services
Livingston • •
Lodi • • • Design
Lompoc • •
Long Beach • Air Quality
Loomis •
Los Altos Hills • • Trails/Pathways Element
Los Angeles • • • • • Framework; Air Quality
Los Angeles County • • •
Madera •
Malibu •
Manhattan Beach • • •
Manteca •
Marin County • Public Health
Marina • Community Design and Development
Maywood •
Mendocino County • Development Element
Merced • • Sustainable Development
Monterey • • • • Social, Public Facilities
Monterey County • Public Services
Monterey Park • •
Moreno Valley •
Murrieta • Healthy Community Element
National City • • Health and Environmental Justice
Newman • • • • Public Facilities and Services Element
Newport Beach • • •Harbor and Bay; Recreation; Natural Resources
Norco •
Oakland • Pedestrian Master Plan
Oakley • • Health and Safety Element
Ojai • Recreation Element
Ontario • • • Social Resources
Orange • •
Orange Cove • • • •
Annual Planning Survey Results 2012 45
Appendix A: Health and General Plans
JuRisdictiOn ciR
culA
tiO
n
cOn
seR
vAt
iOn
Ho
uSi
ng
lAn
d u
se
OPe
n s
PAce
Safe
Ty
Hea
lTH
PAR
ks
An
d
Rec
ReA
tiO
n
SuST
ain
ab
iliT
y
PuB
lic
fAci
liti
es/
seR
vic
es
Oth
eR
OtheR (descRiPtiOn)
Orinda •
Orland • •
Oroville • •
Oxnard • In several chapters of draft 2030 General Plan
Pacific Grove •
Pacifica •
Palm Desert • Health Services
Palmdale • • • • • • •Public Services Element / Noise Element / Community Design Element
Palo Alto • • •Community Services and Facilities Element/Natural Environment Element
Paradise • Education and Social Services Element
Paramount •
Parlier •
Pasadena • • • • •
Patterson • • Parks and Recreation
Perris • •
Pico Rivera •
Pinole • • • •Growth Management / Community Services and Facilities
Placer County • • • • •
Placerville •
Pleasant Hill •
Pleasanton • • • • •Public Facilities and Community, Water, Air Quality and Climate Change
Point Arena •
Port Hueneme • Noise
Porterville •
Portola Valley •
Poway •
Rancho Cordova • • • • • •
Rancho Cucamonga • • • •
Rancho Mirage • • • • •
Redondo Beach • • Senior Care
Redwood City • Building Community
Reedley • • • • •
Richmond •Community Health and Wellness Element (2030 Update)
Rio Vista •
46 Annual Planning Survey Results 2012
Appendix A: Health and General Plans
JuRisdictiOn ciR
culA
tiO
n
cOn
seR
vAt
iOn
Ho
uSi
ng
lAn
d u
se
OPe
n s
PAce
Safe
Ty
Hea
lTH
PAR
ks
An
d
Rec
ReA
tiO
n
SuST
ain
ab
iliT
y
PuB
lic
fAci
liti
es/
seR
vic
es
Oth
eR
OtheR (descRiPtiOn)
Riverbank • • • Community Character and Design
Riverside • • • •
Riverside County • Healthy Communities
Rolling Hills • •
Sacramento County • • •
San Bernardino •
San Bernardino County • • • • • •
San Carlos • • • • Community Safety and Service
San Clemente • • • • •
San Diego • •
San Dimas • • •
San Fernando •
San Francisco •Air Quality, Better Streets Plan, Commerce and Industry, various area plans
San Jacinto • • • • •Community Services and Facilities Element, Resource Management Element
San Joaquin • •
San Jose •
The Envision San Jose 2040 General Plan will contain such policies (adoption scheduled for 11-1-11). As an integrated document, the policies are not confined to a specific element.
San Leandro • • • •
San Luis Obispo • • • • • Water and Wastewater
San Luis Obispo County •
San Mateo • • •
San Pablo • Health Element
San Rafael • •
San Ramon •
Sand City • • • •
Sanger • Air Quality Goals and Policies
Santa Ana • •
Santa Barbara •
Santa Clara County • • Health and Safety Element
Santa Cruz •
Santa Cruz County •
Santa Fe Springs • • •
Santa Monica • •
Santee • • • •
Sausalito • • Health

Annual Planning Survey Results 2012 47
Appendix A: Health and General Plans
JuRisdictiOn ciR
culA
tiO
n
cOn
seR
vAt
iOn
Ho
uSi
ng
lAn
d u
se
OPe
n s
PAce
Safe
Ty
Hea
lTH
PAR
ks
An
d
Rec
ReA
tiO
n
SuST
ain
ab
iliT
y
PuB
lic
fAci
liti
es/
seR
vic
es
Oth
eR
OtheR (descRiPtiOn)
Sierra County •
Simi Valley • Community Services
Siskiyou County •
Solano County •
South Gate • • • • • Healthy Community
South Lake Tahoe •
St. Helena •
Stanton • •
Stockton • • Health and Safety
Suisun City •
Sunnyvale • Policies are in process for 2012
Sutter Creek •
Taft • • Public Facilities and Service Element
Thousand Oaks •
Trinity County • • •
Truckee • Economic Development
Tulare County •
Tuolumne County • • •
Turlock • • Design
Union City • Youth, Family, Seniors and Health
Vallejo • •
Ventura County • • • • • • • Air Quality
Villa Park • •
Visalia • • • Parks and Recreation
Vista • Health Element
Walnut Creek •
Wasco •
Waterford • •
West Hollywood • •
West Sacramento • • • Child Care and Health Safety
Westminster •
Whittier • • Noise Element, Hazardous Mitigation Plan
Williams •
Winters •
Woodlake • • •
Woodland •
Yolo County • •
Yuba County • • Public Health and Safety
Yucca Valley • • Emergency Preparedness and Health Services
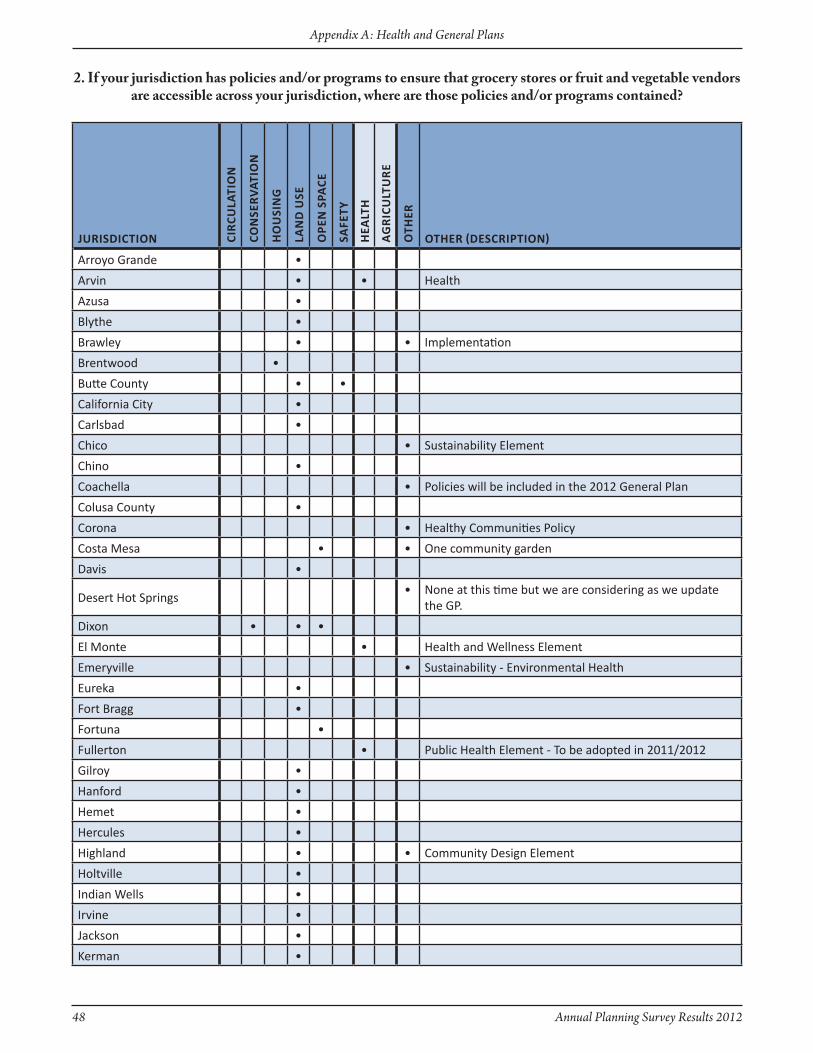
48 Annual Planning Survey Results 2012
Appendix A: Health and General Plans
JuRisdictiOn ciR
culA
tiO
n
cOn
seR
vAt
iOn
Ho
uSi
ng
lAn
d u
se
OPe
n s
PAce
Safe
Ty
Hea
lTH
AG
Ric
ult
uR
e
Oth
eR
OtheR (descRiPtiOn)
Arroyo Grande •
Arvin • • Health
Azusa •
Blythe •
Brawley • • Implementation
Brentwood •
Butte County • •
California City •
Carlsbad •
Chico • Sustainability Element
Chino •
Coachella • Policies will be included in the 2012 General Plan
Colusa County •
Corona • Healthy Communities Policy
Costa Mesa • • One community garden
Davis •
Desert Hot Springs• None at this time but we are considering as we update
the GP.
Dixon • • •
El Monte • Health and Wellness Element
Emeryville • Sustainability - Environmental Health
Eureka •
Fort Bragg •
Fortuna •
Fullerton • Public Health Element - To be adopted in 2011/2012
Gilroy •
Hanford •
Hemet •
Hercules •
Highland • • Community Design Element
Holtville •
Indian Wells •
Irvine •
Jackson •
Kerman •
2. If your jurisdiction has policies and/or programs to ensure that grocery stores or fruit and vegetable vendors are accessible across your jurisdiction, where are those policies and/or programs contained?

Annual Planning Survey Results 2012 49
Appendix A: Health and General Plans
JuRisdictiOn ciR
culA
tiO
n
cOn
seR
vAt
iOn
Ho
uSi
ng
lAn
d u
se
OPe
n s
PAce
Safe
Ty
Hea
lTH
AG
Ric
ult
uR
e
Oth
eR
OtheR (descRiPtiOn)
Kings County •• Four Community Plans (Armona, Home Garden,
Kettleman City, and Stratford)
La Mesa • Health and Wellness Element
Laguna Hills • •
Laguna Niguel •
Lassen County • Agricultural
Lodi • •
Lompoc •
Loomis •
Los Angeles •
Los Angeles County •
Marin County • Public Health
Mendocino County • Development Element
Murrieta • Healthy Community Element
Napa •
National City • • Health and Environmental Justice
Newport Beach •
Oakdale •
Ontario • • LU 1-6
Oroville •
Oxnard • Chapter 2 of draft 2030 General Plan
Pacific Grove •
Palmdale • •
Palo Alto • • Business and Economics
Parlier •
Perris •
Pinole •
Rancho Cordova •
Rancho Cucamonga • Community Services
Redwood City • Building Community
Reedley • •
Richmond • • Community Health and Wellness Element (2030 Update)
Ridgecrest •
Riverside County • Healthy Communities
Sacramento County • •
San Bernardino • Public gardens ordinance
San Carlos •
San Francisco • Commerce and Industry, various area plans
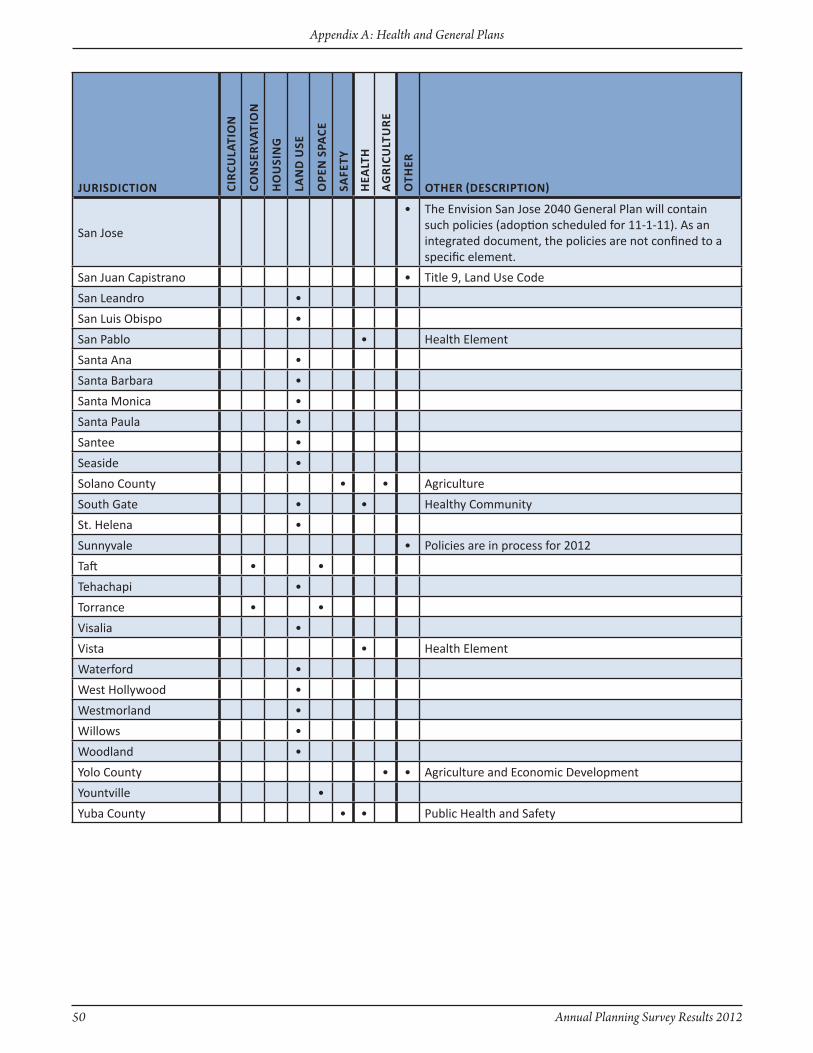
50 Annual Planning Survey Results 2012
Appendix A: Health and General Plans
JuRisdictiOn ciR
culA
tiO
n
cOn
seR
vAt
iOn
Ho
uSi
ng
lAn
d u
se
OPe
n s
PAce
Safe
Ty
Hea
lTH
AG
Ric
ult
uR
e
Oth
eR
OtheR (descRiPtiOn)
San Jose
• The Envision San Jose 2040 General Plan will contain such policies (adoption scheduled for 11-1-11). As an integrated document, the policies are not confined to a specific element.
San Juan Capistrano • Title 9, Land Use Code
San Leandro •
San Luis Obispo •
San Pablo • Health Element
Santa Ana •
Santa Barbara •
Santa Monica •
Santa Paula •
Santee •
Seaside •
Solano County • • Agriculture
South Gate • • Healthy Community
St. Helena •
Sunnyvale • Policies are in process for 2012
Taft • •
Tehachapi •
Torrance • •
Visalia •
Vista • Health Element
Waterford •
West Hollywood •
Westmorland •
Willows •
Woodland •
Yolo County • • Agriculture and Economic Development
Yountville •
Yuba County • • Public Health and Safety
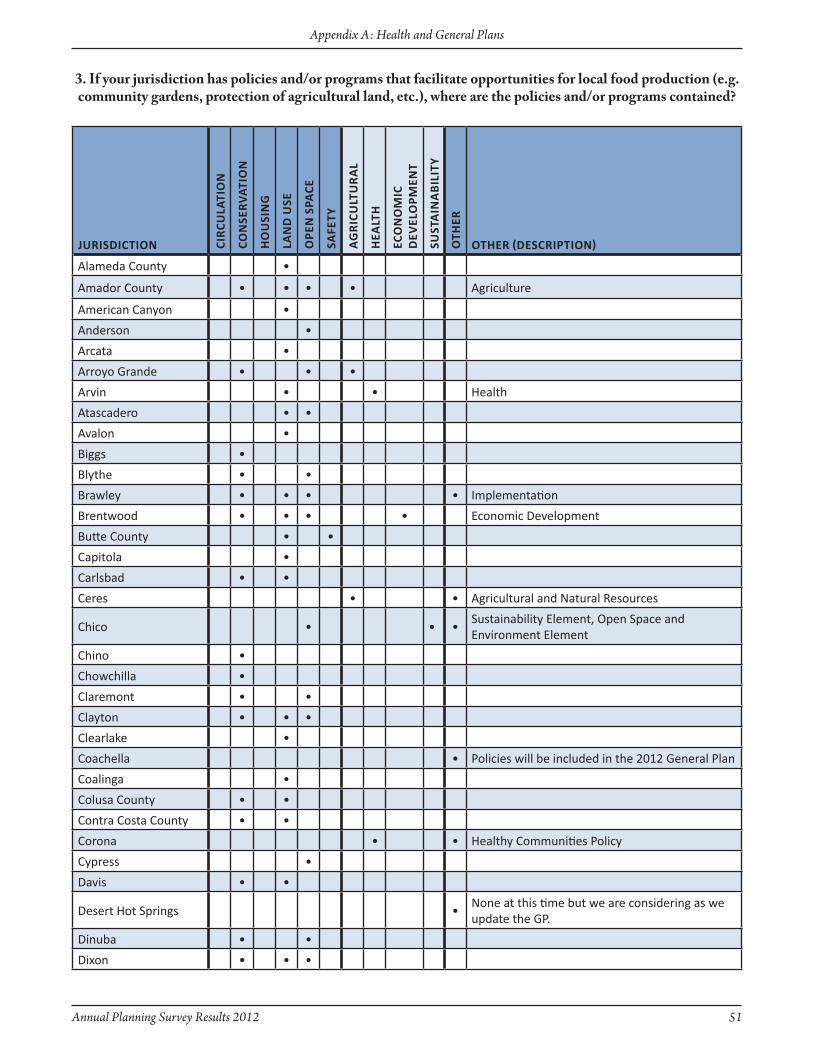
Annual Planning Survey Results 2012 51
Appendix A: Health and General Plans
JuRisdictiOn ciR
culA
tiO
n
cOn
seR
vAt
iOn
Ho
uSi
ng
lAn
d u
se
OPe
n s
PAce
Safe
Ty
AG
Ric
ult
uR
Al
Hea
lTH
ecO
nO
Mic
d
evel
OPM
ent
SuST
ain
ab
iliT
y
Oth
eR
OtheR (descRiPtiOn)
Alameda County •
Amador County • • • • Agriculture
American Canyon •
Anderson •
Arcata •
Arroyo Grande • • •
Arvin • • Health
Atascadero • •
Avalon •
Biggs •
Blythe • •
Brawley • • • • Implementation
Brentwood • • • • Economic Development
Butte County • •
Capitola •
Carlsbad • •
Ceres • • Agricultural and Natural Resources
Chico • • •Sustainability Element, Open Space and Environment Element
Chino •
Chowchilla •
Claremont • •
Clayton • • •
Clearlake •
Coachella • Policies will be included in the 2012 General Plan
Coalinga •
Colusa County • •
Contra Costa County • •
Corona • • Healthy Communities Policy
Cypress •
Davis • •
Desert Hot Springs •None at this time but we are considering as we update the GP.
Dinuba • •
Dixon • • •
3. If your jurisdiction has policies and/or programs that facilitate opportunities for local food production (e.g. community gardens, protection of agricultural land, etc.), where are the policies and/or programs contained?

52 Annual Planning Survey Results 2012
Appendix A: Health and General Plans
JuRisdictiOn ciR
culA
tiO
n
cOn
seR
vAt
iOn
Ho
uSi
ng
lAn
d u
se
OPe
n s
PAce
Safe
Ty
AG
Ric
ult
uR
Al
Hea
lTH
ecO
nO
Mic
d
evel
OPM
ent
SuST
ain
ab
iliT
y
Oth
eR
OtheR (descRiPtiOn)
Dublin • •
East Palo Alto • •
El Centro •
El Dorado County • • Agriculture and Forestry Element
El Monte • Health and Wellness Element
Elk Grove • •
Emeryville • Parks
Eureka •
Exeter •
Fairfield • Agricultural Preservation
Ferndale •
Firebaugh • •
Fort Bragg •
Fortuna •
Fresno •
Fullerton •Public Health Element - To be adopted in 2011/2012
Gilroy •
Glenn County • Agriculture
Goleta • •
Gonzales •
Guadalupe •
Hanford •
Healdsburg • Natural Resources
Hemet • •
Hercules •
Highland • • Community Design Element
Hollister • •
Holtville • •
Hughson • •
Huntington Beach •
Indian Wells •
Inyo County •
Irvine •
Jackson •
Kerman •
Kings County • • • •Four Community Plans (Armona, Home Garden, Kettleman City, and Stratford)
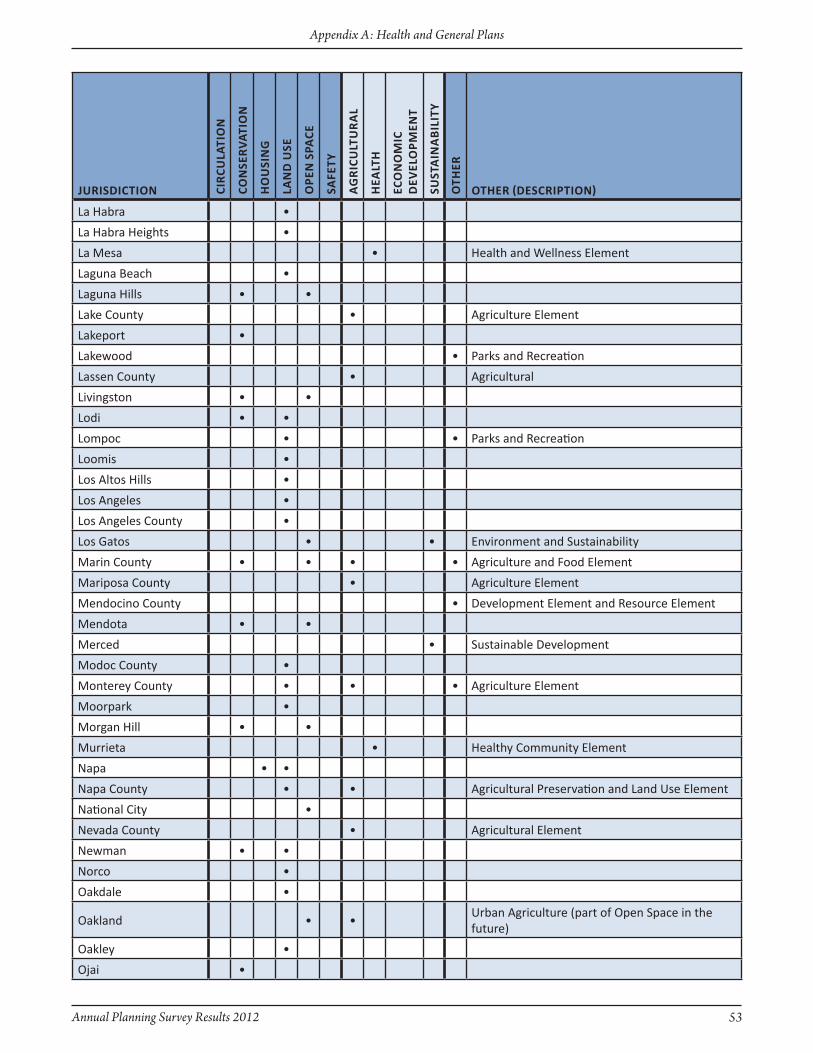
Annual Planning Survey Results 2012 53
Appendix A: Health and General Plans
JuRisdictiOn ciR
culA
tiO
n
cOn
seR
vAt
iOn
Ho
uSi
ng
lAn
d u
se
OPe
n s
PAce
Safe
Ty
AG
Ric
ult
uR
Al
Hea
lTH
ecO
nO
Mic
d
evel
OPM
ent
SuST
ain
ab
iliT
y
Oth
eR
OtheR (descRiPtiOn)
La Habra •
La Habra Heights •
La Mesa • Health and Wellness Element
Laguna Beach •
Laguna Hills • •
Lake County • Agriculture Element
Lakeport •
Lakewood • Parks and Recreation
Lassen County • Agricultural
Livingston • •
Lodi • •
Lompoc • • Parks and Recreation
Loomis •
Los Altos Hills •
Los Angeles •
Los Angeles County •
Los Gatos • • Environment and Sustainability
Marin County • • • • Agriculture and Food Element
Mariposa County • Agriculture Element
Mendocino County • Development Element and Resource Element
Mendota • •
Merced • Sustainable Development
Modoc County •
Monterey County • • • Agriculture Element
Moorpark •
Morgan Hill • •
Murrieta • Healthy Community Element
Napa • •
Napa County • • Agricultural Preservation and Land Use Element
National City •
Nevada County • Agricultural Element
Newman • •
Norco •
Oakdale •
Oakland • •Urban Agriculture (part of Open Space in the future)
Oakley •
Ojai •

54 Annual Planning Survey Results 2012
Appendix A: Health and General Plans
JuRisdictiOn ciR
culA
tiO
n
cOn
seR
vAt
iOn
Ho
uSi
ng
lAn
d u
se
OPe
n s
PAce
Safe
Ty
AG
Ric
ult
uR
Al
Hea
lTH
ecO
nO
Mic
d
evel
OPM
ent
SuST
ain
ab
iliT
y
Oth
eR
OtheR (descRiPtiOn)
Ontario • Environmental Resources
Orinda •
Orland • •
Oroville •
Oxnard • Chap 2 of draft 2030 General Plan
Palmdale • • •Public Services Element/Community Design Element
Palo Alto • •
Paradise • • •
Paramount • Public Facilities
Parlier •
Perris •
Pinole •
Pleasanton • • • Subregional
Plymouth •
Point Arena • •
Porterville •
Portola • •
Rancho Cordova • •
Rancho Cucamonga • Community Services
Redwood City • Building Community
Reedley • • • •
Richmond •Community Health and Wellness Element (2030 Update)
Riverbank • • • Community Character and Design
Riverside • • •
Riverside County • Healthy Communities
Rohnert Park •
Sacramento County • • • Agricultural
Salinas • • •
San Benito County • • •
San Bernardino • Public gardens ordinance
San Bernardino County • •
San Carlos • • Environment Management
San Diego • • Recreation
San Diego County • •
San Francisco •
San Jacinto • • • • Resource Management Element

Annual Planning Survey Results 2012 55
Appendix A: Health and General Plans
JuRisdictiOn ciR
culA
tiO
n
cOn
seR
vAt
iOn
Ho
uSi
ng
lAn
d u
se
OPe
n s
PAce
Safe
Ty
AG
Ric
ult
uR
Al
Hea
lTH
ecO
nO
Mic
d
evel
OPM
ent
SuST
ain
ab
iliT
y
Oth
eR
OtheR (descRiPtiOn)
San Joaquin County • •
San Jose •
The Envision San Jose 2040 General Plan will contain such policies (adoption scheduled for 11-1-11). As an integrated document, the policies are not confined to a specific element.
San Juan Capistrano • •
San Luis Obispo • • •
San Luis Obispo County • • • • Agriculture Element
San Pablo • Health Element
San Rafael • Sustainability Element (2011)
Santa Ana •
Santa Barbara •
Santa Clara County • •
Santa Clarita • •
Santa Cruz •
Santa Cruz County • •
Santa Fe Springs •
Santa Monica •
Santa Rosa • Public Services and Facilities Element
Seal Beach •
Sebastopol • City operates a community garden.
Sierra County • Agriculture Element
Siskiyou County • •
Solano County • • Agriculture
Sonoma •
South Gate • • • Healthy Community
St. Helena • •
Sunnyvale • Policies are in process for 2012
Taft • • • • •Energy Element and Economic Development Element
Tehachapi • •
Tehama •
Tehama County • • Agricultural
Thousand Oaks •Not an element; Urban Restriction Boundary Ordinance
Torrance • •
Trinidad •
Tulare County • • • Agriculture
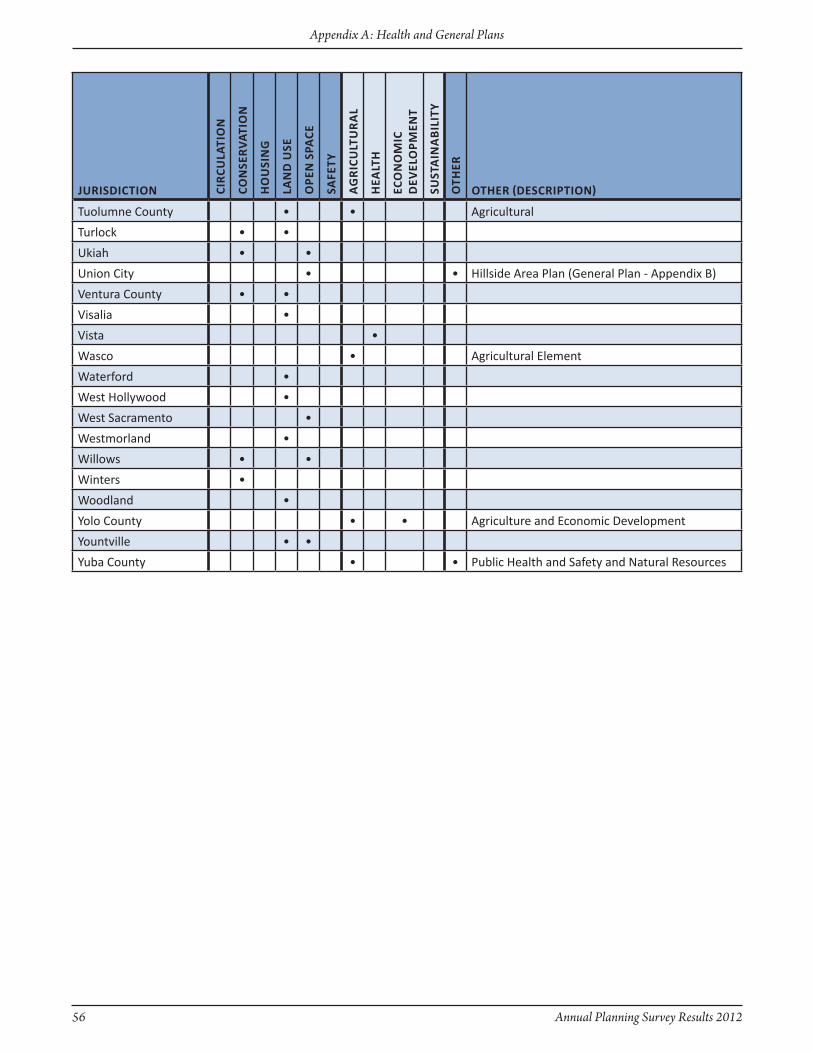
56 Annual Planning Survey Results 2012
Appendix A: Health and General Plans
JuRisdictiOn ciR
culA
tiO
n
cOn
seR
vAt
iOn
Ho
uSi
ng
lAn
d u
se
OPe
n s
PAce
Safe
Ty
AG
Ric
ult
uR
Al
Hea
lTH
ecO
nO
Mic
d
evel
OPM
ent
SuST
ain
ab
iliT
y
Oth
eR
OtheR (descRiPtiOn)
Tuolumne County • • Agricultural
Turlock • •
Ukiah • •
Union City • • Hillside Area Plan (General Plan - Appendix B)
Ventura County • •
Visalia •
Vista •
Wasco • Agricultural Element
Waterford •
West Hollywood •
West Sacramento •
Westmorland •
Willows • •
Winters •
Woodland •
Yolo County • • Agriculture and Economic Development
Yountville • •
Yuba County • • Public Health and Safety and Natural Resources
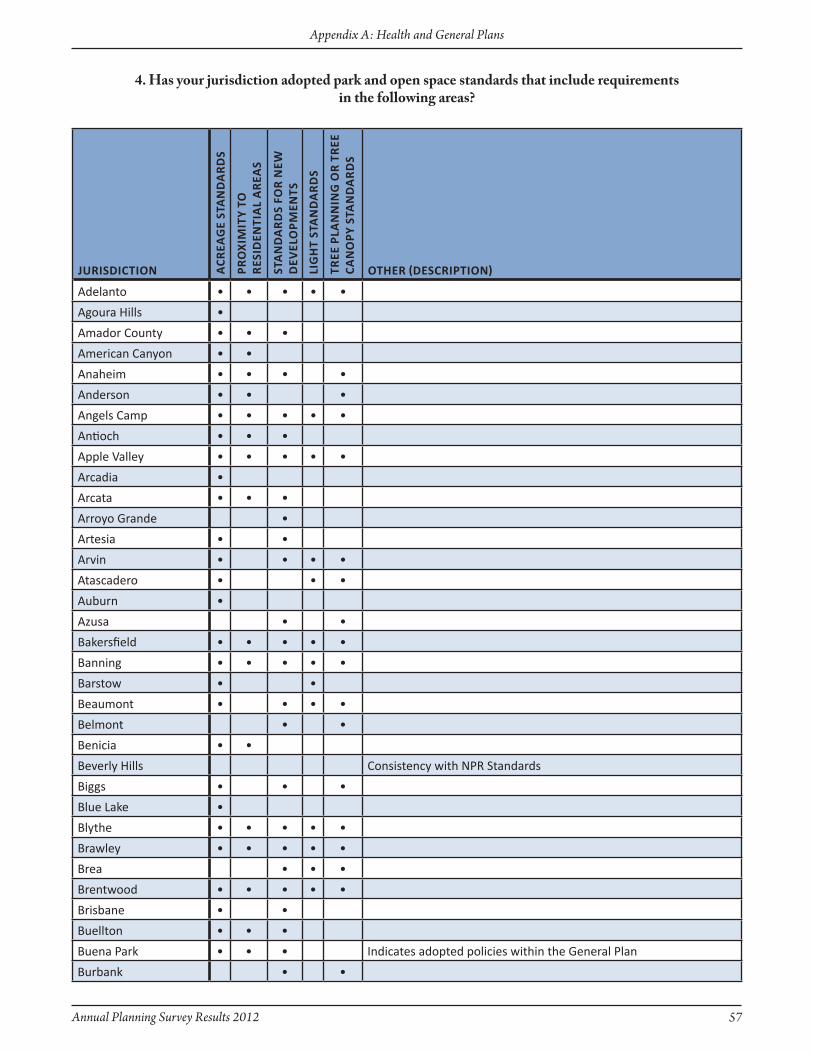
Annual Planning Survey Results 2012 57
Appendix A: Health and General Plans
JuRisdictiOn AcR
eAG
e st
An
dA
Rd
s
PRO
xiM
ity
tO
Res
iden
tiA
l A
ReA
s
stA
nd
AR
ds
fOR
neW
d
evel
OPM
ents
liG
ht
stA
nd
AR
ds
tRee
PlA
nn
inG
OR
tR
ee
cAn
OPy
stA
nd
AR
ds
OtheR (descRiPtiOn)
Adelanto • • • • •
Agoura Hills •
Amador County • • •
American Canyon • •
Anaheim • • • •
Anderson • • •
Angels Camp • • • • •
Antioch • • •
Apple Valley • • • • •
Arcadia •
Arcata • • •
Arroyo Grande •
Artesia • •
Arvin • • • •
Atascadero • • •
Auburn •
Azusa • •
Bakersfield • • • • •
Banning • • • • •
Barstow • •
Beaumont • • • •
Belmont • •
Benicia • •
Beverly Hills Consistency with NPR Standards
Biggs • • •
Blue Lake •
Blythe • • • • •
Brawley • • • • •
Brea • • •
Brentwood • • • • •
Brisbane • •
Buellton • • •
Buena Park • • • Indicates adopted policies within the General Plan
Burbank • •
4. Has your jurisdiction adopted park and open space standards that include requirementsin the following areas?

58 Annual Planning Survey Results 2012
Appendix A: Health and General Plans
JuRisdictiOn AcR
eAG
e st
An
dA
Rd
s
PRO
xiM
ity
tO
Res
iden
tiA
l A
ReA
s
stA
nd
AR
ds
fOR
neW
d
evel
OPM
ents
liG
ht
stA
nd
AR
ds
tRee
PlA
nn
inG
OR
tR
ee
cAn
OPy
stA
nd
AR
ds
OtheR (descRiPtiOn)
Burlingame •
Butte CountyThese standards will be in our new zoning Ordinance, which we are currently working on. Estimated to be completed in 2012
Calabasas • •
Calimesa • • • •
Camarillo • • •
Campbell • • • •
Carlsbad • • •
Carpinteria • • • Various standards for habitat preservation, trails, beach access, etc.
Carson • •
Ceres • •
Chico • •
Chino • • •
Chino Hills • • • • •
Chowchilla • • •
Chula Vista • • • •
Citrus Heights •
Claremont • • • •
Clayton • • •
Clearlake • • • • •
Clovis • •
Coachella •The City has a draft Parks and Recreation Guidelines document and policies will be included in the 2012 General Plan
Coalinga • •
Colton •
CommerceGP polices encourage more parks but no standards or guidelines are contained in the GP.
Concord •
Contra Costa County •
Corona • • • •
Coronado • • • • •
Corte Madera • •
Costa Mesa • • •
Covina • • • • •
Culver City • • • • •
Cupertino • • •
Cypress • • • •

Annual Planning Survey Results 2012 59
Appendix A: Health and General Plans
JuRisdictiOn AcR
eAG
e st
An
dA
Rd
s
PRO
xiM
ity
tO
Res
iden
tiA
l A
ReA
s
stA
nd
AR
ds
fOR
neW
d
evel
OPM
ents
liG
ht
stA
nd
AR
ds
tRee
PlA
nn
inG
OR
tR
ee
cAn
OPy
stA
nd
AR
ds
OtheR (descRiPtiOn)
Dana Point • • • •
Danville •
Davis • • • • • Neighborhood greenbelts, ag buffer, ag mitigation
Del Mar •
Del Rey Oaks •
Delano • •
Diamond Bar • • • • •
Dinuba • • • • •
Dixon • • •
Dorris •
Dos Palos • • • •
Dublin • • • Parks and Recreation Master Plan
East Palo Alto •
El Cajon •
El Centro • • • • •
El Cerrito • • • •
El Dorado County • • •
El Monte • • •
Elk Grove • •
Emeryville • • •
Encinitas • • • •
Escondido •
Eureka • • •
Exeter • • •
Fairfield • • • • •
Farmersville •
Ferndale • •
Firebaugh • • • •
Folsom • • • • •
Fontana • • •
Fort Bragg •
Fortuna • •
Foster City • • •
Fountain Valley • •
Fowler • • •
Fremont • • • •
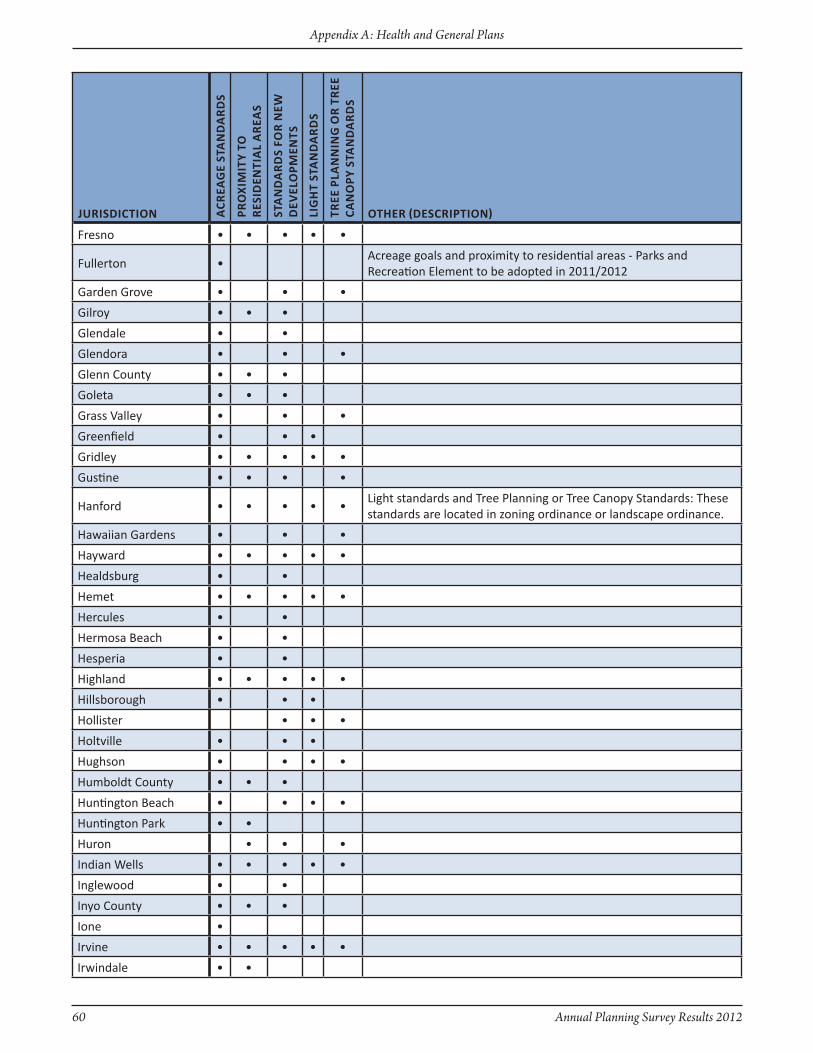
60 Annual Planning Survey Results 2012
Appendix A: Health and General Plans
JuRisdictiOn AcR
eAG
e st
An
dA
Rd
s
PRO
xiM
ity
tO
Res
iden
tiA
l A
ReA
s
stA
nd
AR
ds
fOR
neW
d
evel
OPM
ents
liG
ht
stA
nd
AR
ds
tRee
PlA
nn
inG
OR
tR
ee
cAn
OPy
stA
nd
AR
ds
OtheR (descRiPtiOn)
Fresno • • • • •
Fullerton •Acreage goals and proximity to residential areas - Parks and Recreation Element to be adopted in 2011/2012
Garden Grove • • •
Gilroy • • •
Glendale • •
Glendora • • •
Glenn County • • •
Goleta • • •
Grass Valley • • •
Greenfield • • •
Gridley • • • • •
Gustine • • • •
Hanford • • • • •Light standards and Tree Planning or Tree Canopy Standards: These standards are located in zoning ordinance or landscape ordinance.
Hawaiian Gardens • • •
Hayward • • • • •
Healdsburg • •
Hemet • • • • •
Hercules • •
Hermosa Beach • •
Hesperia • •
Highland • • • • •
Hillsborough • • •
Hollister • • •
Holtville • • •
Hughson • • • •
Humboldt County • • •
Huntington Beach • • • •
Huntington Park • •
Huron • • •
Indian Wells • • • • •
Inglewood • •
Inyo County • • •
Ione •
Irvine • • • • •
Irwindale • •

Annual Planning Survey Results 2012 61
Appendix A: Health and General Plans
JuRisdictiOn AcR
eAG
e st
An
dA
Rd
s
PRO
xiM
ity
tO
Res
iden
tiA
l A
ReA
s
stA
nd
AR
ds
fOR
neW
d
evel
OPM
ents
liG
ht
stA
nd
AR
ds
tRee
PlA
nn
inG
OR
tR
ee
cAn
OPy
stA
nd
AR
ds
OtheR (descRiPtiOn)
Jackson • • • • •
Kerman •
Kern County • • •
Kings County •
La Mirada • • •
La Palma •
La Puente • •
La Quinta • •
La Verne • • • • •
Lafayette • • •
Laguna Beach • •
Laguna Hills • •
Laguna Niguel • • •
Lake County •
Lake Elsinore • •
Lakeport • •
Lakewood • • • • •
Larkspur • •
Lassen County • • • •
Lemon Grove • •
Lemoore • •
Lincoln • • • •
Live Oak •
Livermore • • •
Livingston • • •
Lodi • • • • •
Lompoc • •
Long Beach • • • • •
Loomis • • •
Los Alamitos • • • • •
Los Altos Hills • • •
Los Angeles • • Service radii
Los Angeles County •
Los Banos • • • • •
Los Gatos •
Lynwood • •

62 Annual Planning Survey Results 2012
Appendix A: Health and General Plans
JuRisdictiOn AcR
eAG
e st
An
dA
Rd
s
PRO
xiM
ity
tO
Res
iden
tiA
l A
ReA
s
stA
nd
AR
ds
fOR
neW
d
evel
OPM
ents
liG
ht
stA
nd
AR
ds
tRee
PlA
nn
inG
OR
tR
ee
cAn
OPy
stA
nd
AR
ds
OtheR (descRiPtiOn)
Madera • • •
Manhattan Beach • • • • •
Manteca • • •
Marin County •
Marina • • • Standards are in Specific Plans and zoning, not GP
Mariposa County •
Marysville • •
Mendocino County • • •
Mendota • • •
Menifee • • •
Menlo Park •
Merced • • •
Millbrae • • •
Milpitas • • •
Mission Viejo •
Modesto • • •
Modoc County • • •
Monrovia • •
Montclair • •
Montebello • • • •
Monterey •
Monterey County • •
Monterey Park • •
Moorpark • • •
Moraga • • •
Moreno Valley • • • • •
Morgan Hill • • •
Mount Shasta •
Mountain View • •
Murrieta • • • • •
Napa • • •
National City • • • • •
Nevada County • • •
Newark • •
Newman • • • •
Newport Beach •
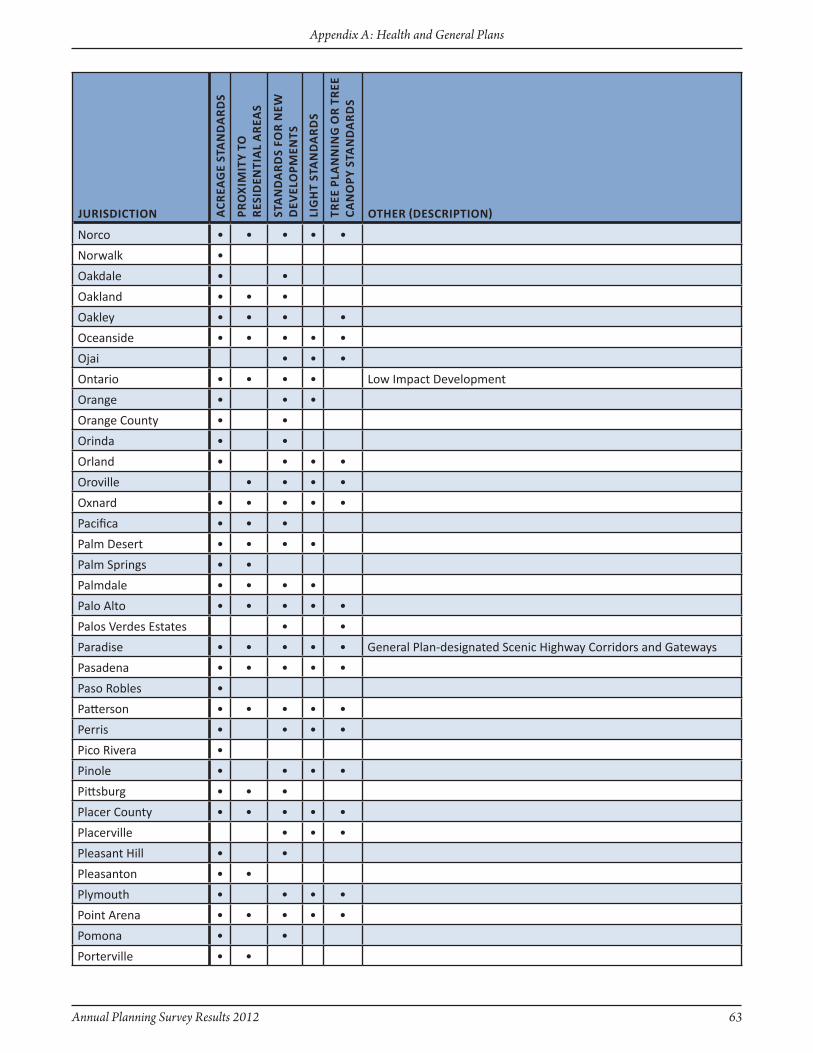
Annual Planning Survey Results 2012 63
Appendix A: Health and General Plans
JuRisdictiOn AcR
eAG
e st
An
dA
Rd
s
PRO
xiM
ity
tO
Res
iden
tiA
l A
ReA
s
stA
nd
AR
ds
fOR
neW
d
evel
OPM
ents
liG
ht
stA
nd
AR
ds
tRee
PlA
nn
inG
OR
tR
ee
cAn
OPy
stA
nd
AR
ds
OtheR (descRiPtiOn)
Norco • • • • •
Norwalk •
Oakdale • •
Oakland • • •
Oakley • • • •
Oceanside • • • • •
Ojai • • •
Ontario • • • • Low Impact Development
Orange • • •
Orange County • •
Orinda • •
Orland • • • •
Oroville • • • •
Oxnard • • • • •
Pacifica • • •
Palm Desert • • • •
Palm Springs • •
Palmdale • • • •
Palo Alto • • • • •
Palos Verdes Estates • •
Paradise • • • • • General Plan-designated Scenic Highway Corridors and Gateways
Pasadena • • • • •
Paso Robles •
Patterson • • • • •
Perris • • • •
Pico Rivera •
Pinole • • • •
Pittsburg • • •
Placer County • • • • •
Placerville • • •
Pleasant Hill • •
Pleasanton • •
Plymouth • • • •
Point Arena • • • • •
Pomona • •
Porterville • •
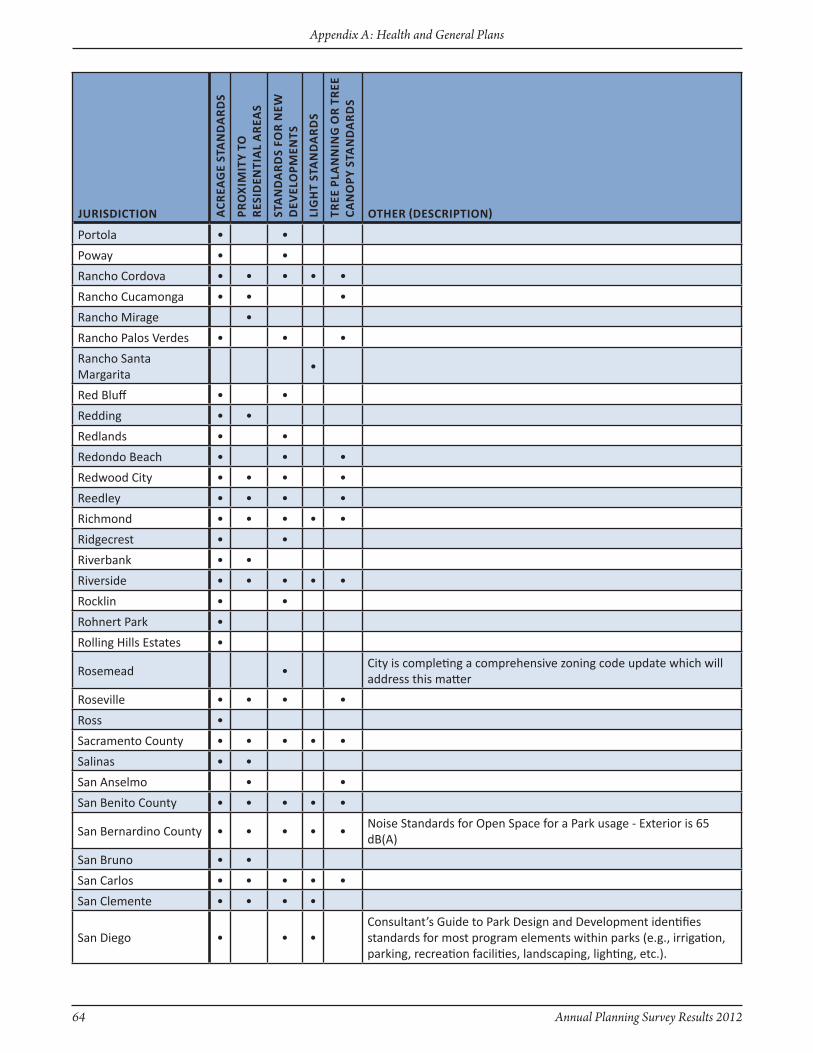
64 Annual Planning Survey Results 2012
Appendix A: Health and General Plans
JuRisdictiOn AcR
eAG
e st
An
dA
Rd
s
PRO
xiM
ity
tO
Res
iden
tiA
l A
ReA
s
stA
nd
AR
ds
fOR
neW
d
evel
OPM
ents
liG
ht
stA
nd
AR
ds
tRee
PlA
nn
inG
OR
tR
ee
cAn
OPy
stA
nd
AR
ds
OtheR (descRiPtiOn)
Portola • •
Poway • •
Rancho Cordova • • • • •
Rancho Cucamonga • • •
Rancho Mirage •
Rancho Palos Verdes • • •
Rancho Santa Margarita
•
Red Bluff • •
Redding • •
Redlands • •
Redondo Beach • • •
Redwood City • • • •
Reedley • • • •
Richmond • • • • •
Ridgecrest • •
Riverbank • •
Riverside • • • • •
Rocklin • •
Rohnert Park •
Rolling Hills Estates •
Rosemead •City is completing a comprehensive zoning code update which will address this matter
Roseville • • • •
Ross •
Sacramento County • • • • •
Salinas • •
San Anselmo • •
San Benito County • • • • •
San Bernardino County • • • • •Noise Standards for Open Space for a Park usage - Exterior is 65 dB(A)
San Bruno • •
San Carlos • • • • •
San Clemente • • • •
San Diego • • •Consultant’s Guide to Park Design and Development identifies standards for most program elements within parks (e.g., irrigation, parking, recreation facilities, landscaping, lighting, etc.).
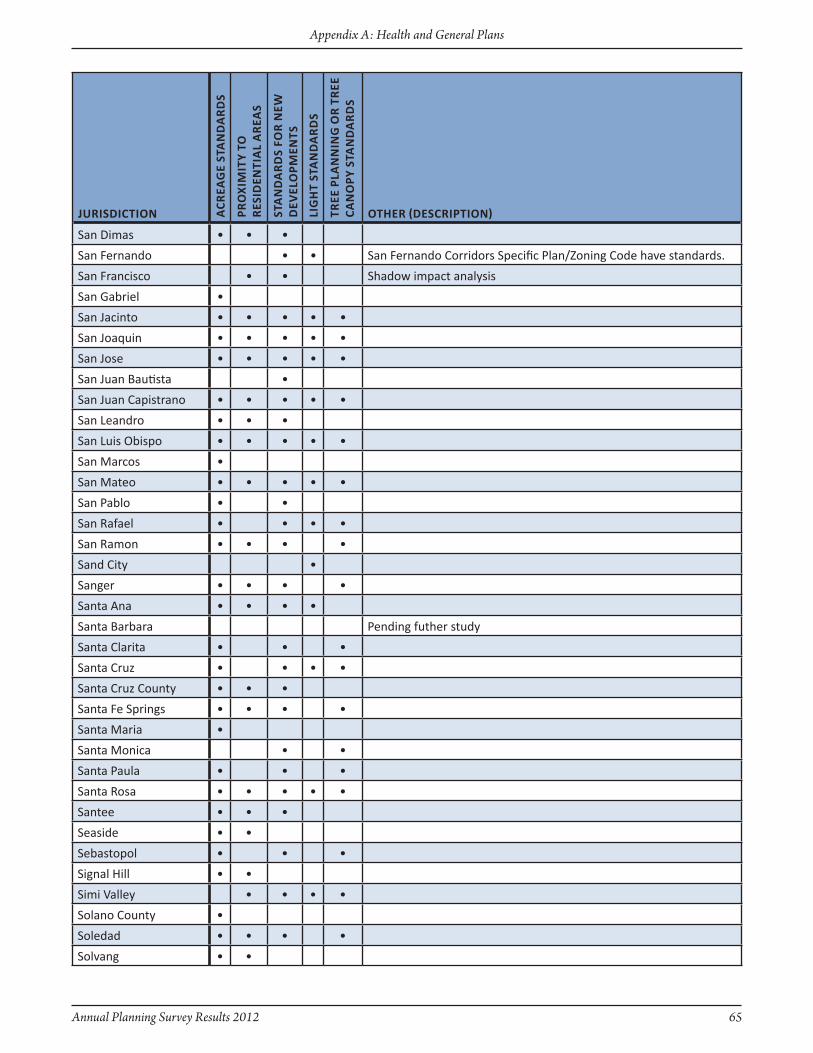
Annual Planning Survey Results 2012 65
Appendix A: Health and General Plans
JuRisdictiOn AcR
eAG
e st
An
dA
Rd
s
PRO
xiM
ity
tO
Res
iden
tiA
l A
ReA
s
stA
nd
AR
ds
fOR
neW
d
evel
OPM
ents
liG
ht
stA
nd
AR
ds
tRee
PlA
nn
inG
OR
tR
ee
cAn
OPy
stA
nd
AR
ds
OtheR (descRiPtiOn)
San Dimas • • •
San Fernando • • San Fernando Corridors Specific Plan/zoning Code have standards.
San Francisco • • Shadow impact analysis
San Gabriel •
San Jacinto • • • • •
San Joaquin • • • • •
San Jose • • • • •
San Juan Bautista •
San Juan Capistrano • • • • •
San Leandro • • •
San Luis Obispo • • • • •
San Marcos •
San Mateo • • • • •
San Pablo • •
San Rafael • • • •
San Ramon • • • •
Sand City •
Sanger • • • •
Santa Ana • • • •
Santa Barbara Pending futher study
Santa Clarita • • •
Santa Cruz • • • •
Santa Cruz County • • •
Santa Fe Springs • • • •
Santa Maria •
Santa Monica • •
Santa Paula • • •
Santa Rosa • • • • •
Santee • • •
Seaside • •
Sebastopol • • •
Signal Hill • •
Simi Valley • • • •
Solano County •
Soledad • • • •
Solvang • •

66 Annual Planning Survey Results 2012
Appendix A: Health and General Plans
JuRisdictiOn AcR
eAG
e st
An
dA
Rd
s
PRO
xiM
ity
tO
Res
iden
tiA
l A
ReA
s
stA
nd
AR
ds
fOR
neW
d
evel
OPM
ents
liG
ht
stA
nd
AR
ds
tRee
PlA
nn
inG
OR
tR
ee
cAn
OPy
stA
nd
AR
ds
OtheR (descRiPtiOn)
Sonoma • • • •
Sonora • •
South El Monte •
South San Francisco • • • •
St. Helena • • • • •
Stanislaus County • •
Stanton • •
Stockton • •
Suisun City • • •
Sunnyvale • • •
Sutter Creek • • • •
Taft • • • • •
Tehachapi • • •
Tehama County •
Temecula • • •
Temple City •
Thousand Oaks • • • • •
Tiburon • •
Torrance • • •
Tracy • • • • •Light Standards and Tree Planning or Tree Canopy Standards are in the Parks Master Plan
Trinidad •
Truckee • •
Tulare • • •
Tulare County • •
Tuolumne County • •
Turlock • • • •
Ukiah • • •
Union City • • • •
Upland • •
Vacaville • • •
Vallejo • • • • •
Ventura County • • •
Victorville • •
Villa Park • •
Visalia • • • •

Annual Planning Survey Results 2012 67
Appendix A: Health and General Plans
JuRisdictiOn AcR
eAG
e st
An
dA
Rd
s
PRO
xiM
ity
tO
Res
iden
tiA
l A
ReA
s
stA
nd
AR
ds
fOR
neW
d
evel
OPM
ents
liG
ht
stA
nd
AR
ds
tRee
PlA
nn
inG
OR
tR
ee
cAn
OPy
stA
nd
AR
ds
OtheR (descRiPtiOn)
Vista • • •
Walnut • •
Walnut Creek • •
Wasco •
Waterford • • •
Watsonville • • • •
Weed •
West Covina •
West Sacramento • • •
Westlake Village •
Westminster • •
Westmorland • • • •
Whittier • • •
Williams • •
Willits • • •
Windsor • •
Woodlake • •
Woodland • • • • •
Yolo County • • •
Yorba Linda • • •
Yountville • •
Yreka • • •
Yuba County • • •
Yucaipa • •
Yucca Valley • •

68 Annual Planning Survey Results 2012
Appendix A: Health and General Plans
JuRisdictiOn ciR
culA
tiO
n
cOn
seR
vAt
iOn
Ho
uSi
ng
lAn
d u
se
OPe
n s
PAce
Safe
Ty
PAR
ks
An
d
Rec
ReA
tiO
n
PuB
lic
fAci
liti
es/
seR
vic
es
Hea
lTH
Oth
eR
OtheR (descRiPtiOn)
Adelanto • •
Agoura Hills • •Infrastructure and Community Services; Natural Resources
Alameda County •
Albany •
Alhambra •
Amador County • •
American Canyon • • Parks and Recreation Element
Anaheim • Green
Anderson • • Recreation
Angels Camp • •
Antioch • • Public Services
Apple Valley • • • Parks and Recreation Element
Arcata • • Park and Rec
Arroyo Grande • Parks and Recreation Element
Artesia •
Arvin • • • Health
Atascadero • • • •
Auburn • •
Avalon •
Azusa • • • • Recreation Element
Bakersfield • • •
Baldwin Park •
Banning • •
Barstow •
Beaumont •
Bell • • • Recreation Element
Bell Gardens •
Bellflower • • •
Belmont •
Benicia •
Beverly Hills •
Big Bear Lake • • Parks and Recreation Element
Biggs • •
Bishop •
6. If your jurisdiction has policies and/or programs that promote access to parks and open space, where are the policies and/or programs contained?
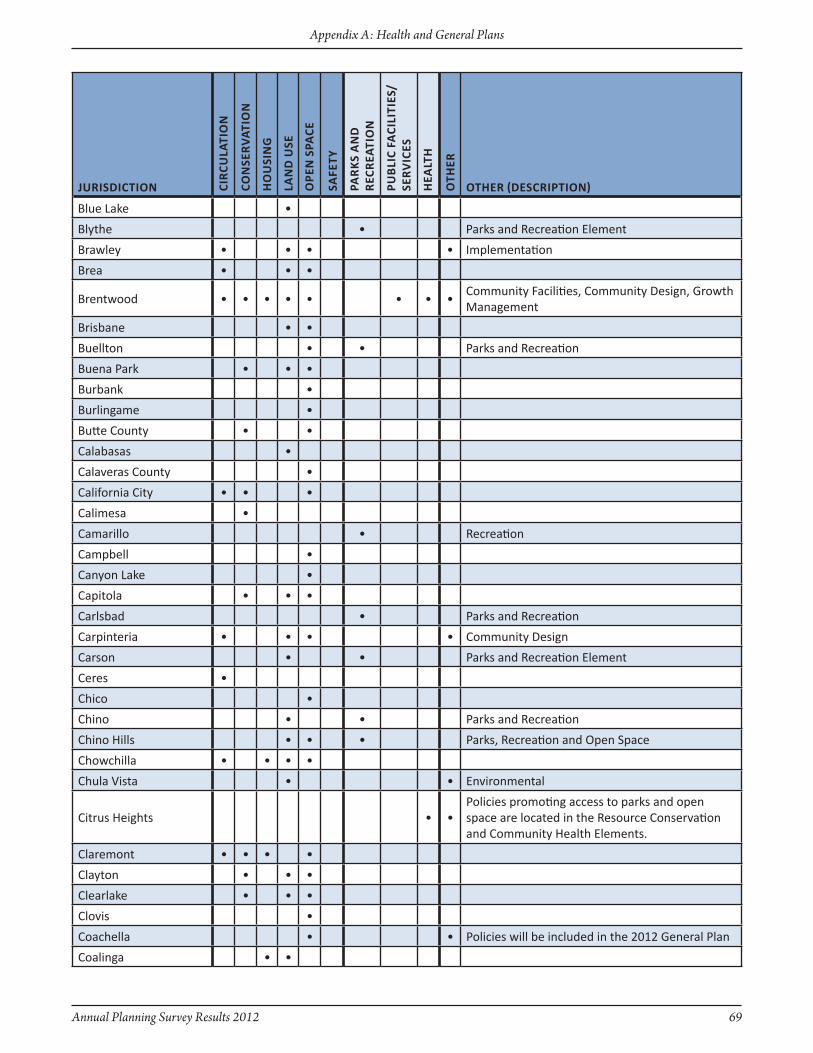
Annual Planning Survey Results 2012 69
Appendix A: Health and General Plans
JuRisdictiOn ciR
culA
tiO
n
cOn
seR
vAt
iOn
Ho
uSi
ng
lAn
d u
se
OPe
n s
PAce
Safe
Ty
PAR
ks
An
d
Rec
ReA
tiO
n
PuB
lic
fAci
liti
es/
seR
vic
es
Hea
lTH
Oth
eR
OtheR (descRiPtiOn)
Blue Lake •
Blythe • Parks and Recreation Element
Brawley • • • • Implementation
Brea • • •
Brentwood • • • • • • • •Community Facilities, Community Design, Growth Management
Brisbane • •
Buellton • • Parks and Recreation
Buena Park • • •
Burbank •
Burlingame •
Butte County • •
Calabasas •
Calaveras County •
California City • • •
Calimesa •
Camarillo • Recreation
Campbell •
Canyon Lake •
Capitola • • •
Carlsbad • Parks and Recreation
Carpinteria • • • • Community Design
Carson • • Parks and Recreation Element
Ceres •
Chico •
Chino • • Parks and Recreation
Chino Hills • • • Parks, Recreation and Open Space
Chowchilla • • • •
Chula Vista • • Environmental
Citrus Heights • •Policies promoting access to parks and open space are located in the Resource Conservation and Community Health Elements.
Claremont • • • •
Clayton • • •
Clearlake • • •
Clovis •
Coachella • • Policies will be included in the 2012 General Plan
Coalinga • •
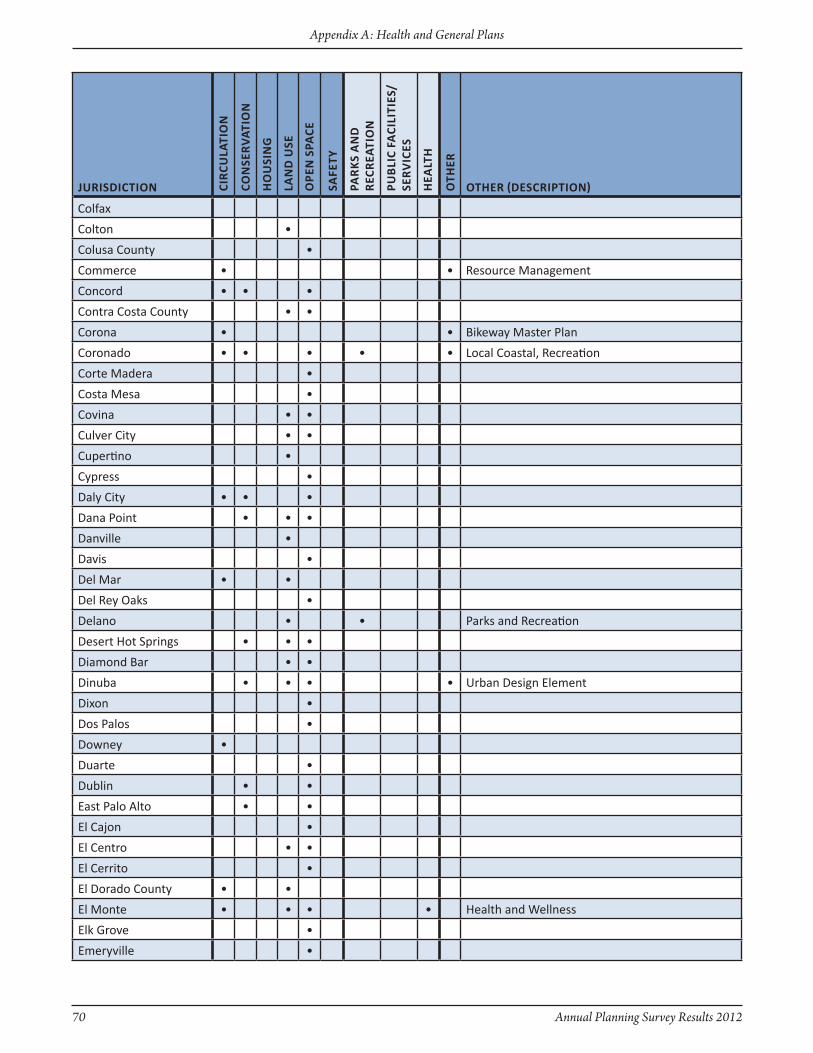
70 Annual Planning Survey Results 2012
Appendix A: Health and General Plans
JuRisdictiOn ciR
culA
tiO
n
cOn
seR
vAt
iOn
Ho
uSi
ng
lAn
d u
se
OPe
n s
PAce
Safe
Ty
PAR
ks
An
d
Rec
ReA
tiO
n
PuB
lic
fAci
liti
es/
seR
vic
es
Hea
lTH
Oth
eR
OtheR (descRiPtiOn)
Colfax
Colton •
Colusa County •
Commerce • • Resource Management
Concord • • •
Contra Costa County • •
Corona • • Bikeway Master Plan
Coronado • • • • • Local Coastal, Recreation
Corte Madera •
Costa Mesa •
Covina • •
Culver City • •
Cupertino •
Cypress •
Daly City • • •
Dana Point • • •
Danville •
Davis •
Del Mar • •
Del Rey Oaks •
Delano • • Parks and Recreation
Desert Hot Springs • • •
Diamond Bar • •
Dinuba • • • • Urban Design Element
Dixon •
Dos Palos •
Downey •
Duarte •
Dublin • •
East Palo Alto • •
El Cajon •
El Centro • •
El Cerrito •
El Dorado County • •
El Monte • • • • Health and Wellness
Elk Grove •
Emeryville •
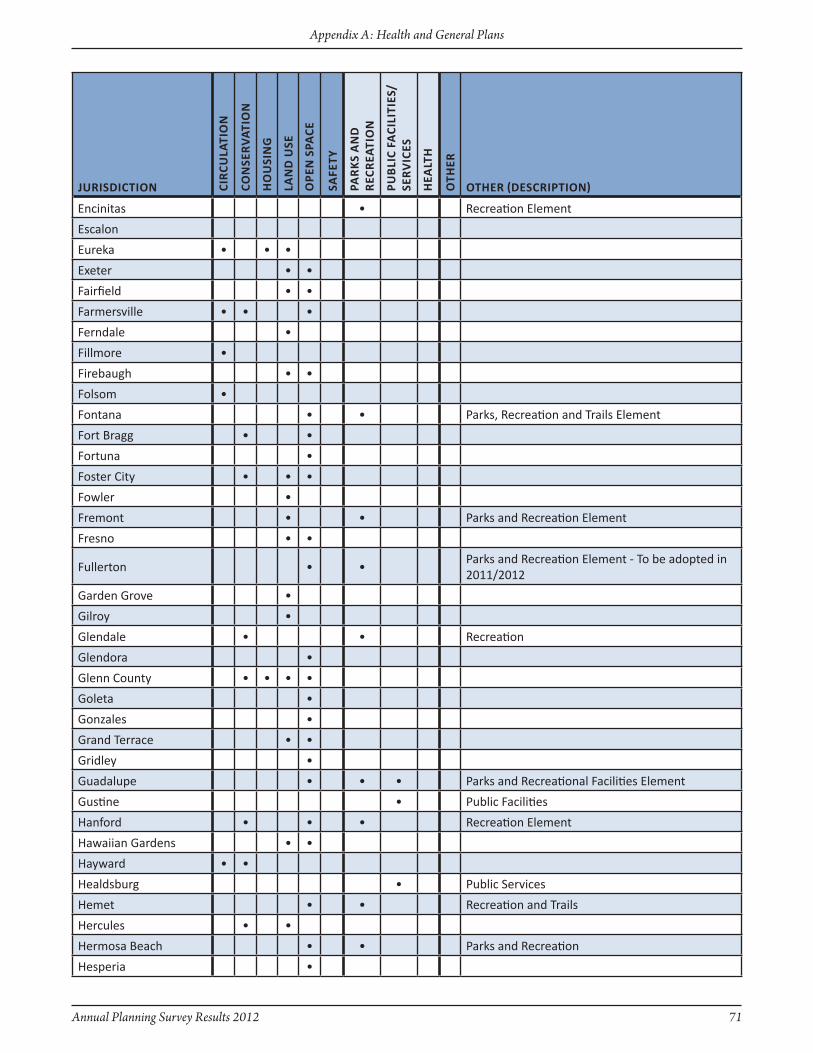
Annual Planning Survey Results 2012 71
Appendix A: Health and General Plans
JuRisdictiOn ciR
culA
tiO
n
cOn
seR
vAt
iOn
Ho
uSi
ng
lAn
d u
se
OPe
n s
PAce
Safe
Ty
PAR
ks
An
d
Rec
ReA
tiO
n
PuB
lic
fAci
liti
es/
seR
vic
es
Hea
lTH
Oth
eR
OtheR (descRiPtiOn)
Encinitas • Recreation Element
Escalon
Eureka • • •
Exeter • •
Fairfield • •
Farmersville • • •
Ferndale •
Fillmore •
Firebaugh • •
Folsom •
Fontana • • Parks, Recreation and Trails Element
Fort Bragg • •
Fortuna •
Foster City • • •
Fowler •
Fremont • • Parks and Recreation Element
Fresno • •
Fullerton • •Parks and Recreation Element - To be adopted in 2011/2012
Garden Grove •
Gilroy •
Glendale • • Recreation
Glendora •
Glenn County • • • •
Goleta •
Gonzales •
Grand Terrace • •
Gridley •
Guadalupe • • • Parks and Recreational Facilities Element
Gustine • Public Facilities
Hanford • • • Recreation Element
Hawaiian Gardens • •
Hayward • •
Healdsburg • Public Services
Hemet • • Recreation and Trails
Hercules • •
Hermosa Beach • • Parks and Recreation
Hesperia •
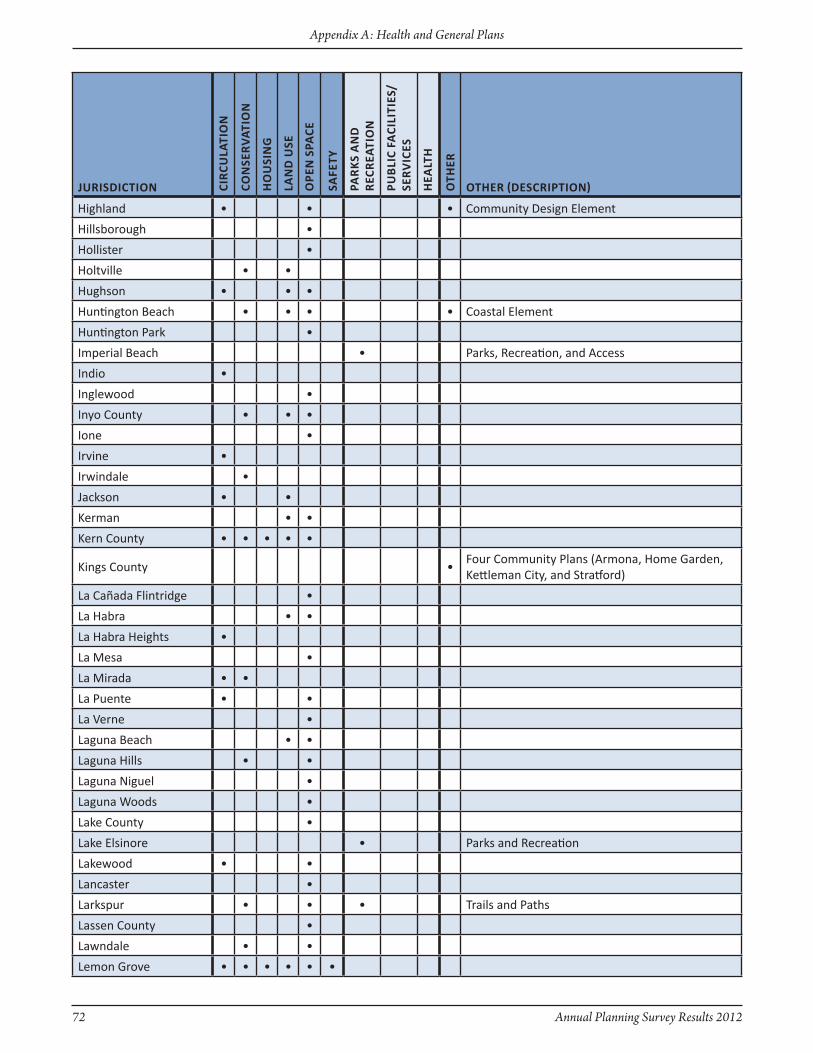
72 Annual Planning Survey Results 2012
Appendix A: Health and General Plans
JuRisdictiOn ciR
culA
tiO
n
cOn
seR
vAt
iOn
Ho
uSi
ng
lAn
d u
se
OPe
n s
PAce
Safe
Ty
PAR
ks
An
d
Rec
ReA
tiO
n
PuB
lic
fAci
liti
es/
seR
vic
es
Hea
lTH
Oth
eR
OtheR (descRiPtiOn)
Highland • • • Community Design Element
Hillsborough •
Hollister •
Holtville • •
Hughson • • •
Huntington Beach • • • • Coastal Element
Huntington Park •
Imperial Beach • Parks, Recreation, and Access
Indio •
Inglewood •
Inyo County • • •
Ione •
Irvine •
Irwindale •
Jackson • •
Kerman • •
Kern County • • • • •
Kings County •Four Community Plans (Armona, Home Garden, Kettleman City, and Stratford)
La Cañada Flintridge •
La Habra • •
La Habra Heights •
La Mesa •
La Mirada • •
La Puente • •
La Verne •
Laguna Beach • •
Laguna Hills • •
Laguna Niguel •
Laguna Woods •
Lake County •
Lake Elsinore • Parks and Recreation
Lakewood • •
Lancaster •
Larkspur • • • Trails and Paths
Lassen County •
Lawndale • •
Lemon Grove • • • • • •
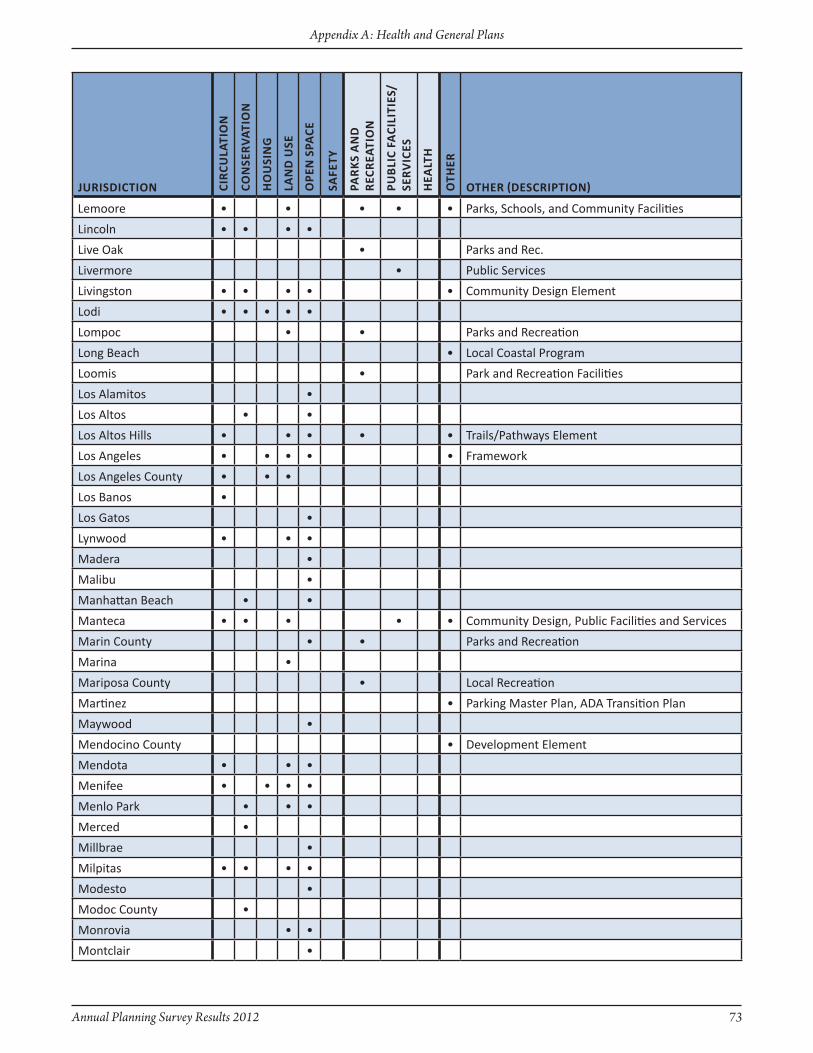
Annual Planning Survey Results 2012 73
Appendix A: Health and General Plans
JuRisdictiOn ciR
culA
tiO
n
cOn
seR
vAt
iOn
Ho
uSi
ng
lAn
d u
se
OPe
n s
PAce
Safe
Ty
PAR
ks
An
d
Rec
ReA
tiO
n
PuB
lic
fAci
liti
es/
seR
vic
es
Hea
lTH
Oth
eR
OtheR (descRiPtiOn)
Lemoore • • • • • Parks, Schools, and Community Facilities
Lincoln • • • •
Live Oak • Parks and Rec.
Livermore • Public Services
Livingston • • • • • Community Design Element
Lodi • • • • •
Lompoc • • Parks and Recreation
Long Beach • Local Coastal Program
Loomis • Park and Recreation Facilities
Los Alamitos •
Los Altos • •
Los Altos Hills • • • • • Trails/Pathways Element
Los Angeles • • • • • Framework
Los Angeles County • • •
Los Banos •
Los Gatos •
Lynwood • • •
Madera •
Malibu •
Manhattan Beach • •
Manteca • • • • • Community Design, Public Facilities and Services
Marin County • • Parks and Recreation
Marina •
Mariposa County • Local Recreation
Martinez • Parking Master Plan, ADA Transition Plan
Maywood •
Mendocino County • Development Element
Mendota • • •
Menifee • • • •
Menlo Park • • •
Merced •
Millbrae •
Milpitas • • • •
Modesto •
Modoc County •
Monrovia • •
Montclair •
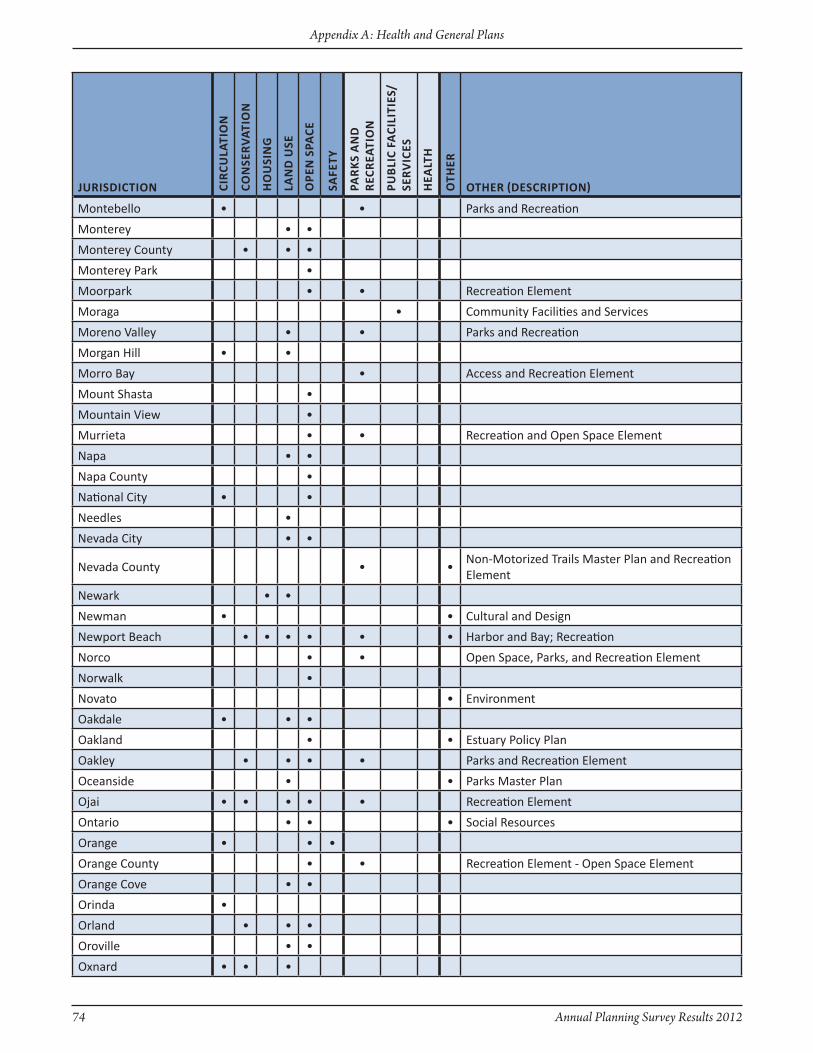
74 Annual Planning Survey Results 2012
Appendix A: Health and General Plans
JuRisdictiOn ciR
culA
tiO
n
cOn
seR
vAt
iOn
Ho
uSi
ng
lAn
d u
se
OPe
n s
PAce
Safe
Ty
PAR
ks
An
d
Rec
ReA
tiO
n
PuB
lic
fAci
liti
es/
seR
vic
es
Hea
lTH
Oth
eR
OtheR (descRiPtiOn)
Montebello • • Parks and Recreation
Monterey • •
Monterey County • • •
Monterey Park •
Moorpark • • Recreation Element
Moraga • Community Facilities and Services
Moreno Valley • • Parks and Recreation
Morgan Hill • •
Morro Bay • Access and Recreation Element
Mount Shasta •
Mountain View •
Murrieta • • Recreation and Open Space Element
Napa • •
Napa County •
National City • •
Needles •
Nevada City • •
Nevada County • •Non-Motorized Trails Master Plan and Recreation Element
Newark • •
Newman • • Cultural and Design
Newport Beach • • • • • • Harbor and Bay; Recreation
Norco • • Open Space, Parks, and Recreation Element
Norwalk •
Novato • Environment
Oakdale • • •
Oakland • • Estuary Policy Plan
Oakley • • • • Parks and Recreation Element
Oceanside • • Parks Master Plan
Ojai • • • • • Recreation Element
Ontario • • • Social Resources
Orange • • •
Orange County • • Recreation Element - Open Space Element
Orange Cove • •
Orinda •
Orland • • •
Oroville • •
Oxnard • • •

Annual Planning Survey Results 2012 75
Appendix A: Health and General Plans
JuRisdictiOn ciR
culA
tiO
n
cOn
seR
vAt
iOn
Ho
uSi
ng
lAn
d u
se
OPe
n s
PAce
Safe
Ty
PAR
ks
An
d
Rec
ReA
tiO
n
PuB
lic
fAci
liti
es/
seR
vic
es
Hea
lTH
Oth
eR
OtheR (descRiPtiOn)
Pacific Grove • Parks and Recreation
Pacifica • •
Palm Desert • Parks and Recreation Element
Palm Springs • • •
Palmdale • • • • • • • •Public Services Element/Noise Element/Community Design Element
Palo Alto • • • • • Community Services and Facilities Element
Palos Verdes Estates •
Paradise • •
Paramount •
Parlier •
Pasadena • • • • Green Space, Recreation and Parks Element
Paso Robles • Parks and Recreation Element
Patterson • • • Parks, Recreation and Cultural Resources
Perris •
Pico Rivera •
Piedmont • • • •
Pinole • • • Community Services and Facilities
Pismo Beach • •
Pittsburg •
Placer County • • • •
Placerville •
Pleasant Hill •
Pleasanton • • • •Public Facilities and Community Programs, Community Character Element, Subregional
Plymouth • • •
Point Arena •
Pomona • •
Port Hueneme •
Porterville • • • • • Parks, Schools and Community Facilities
Portola Valley • • •
Rancho Cordova • •
Rancho Cucamonga • Community Services
Rancho Mirage • • •
Rancho Palos Verdes • • •
Rancho Santa Margarita •
Red Bluff • • •
Redding • • • • Recreation Element
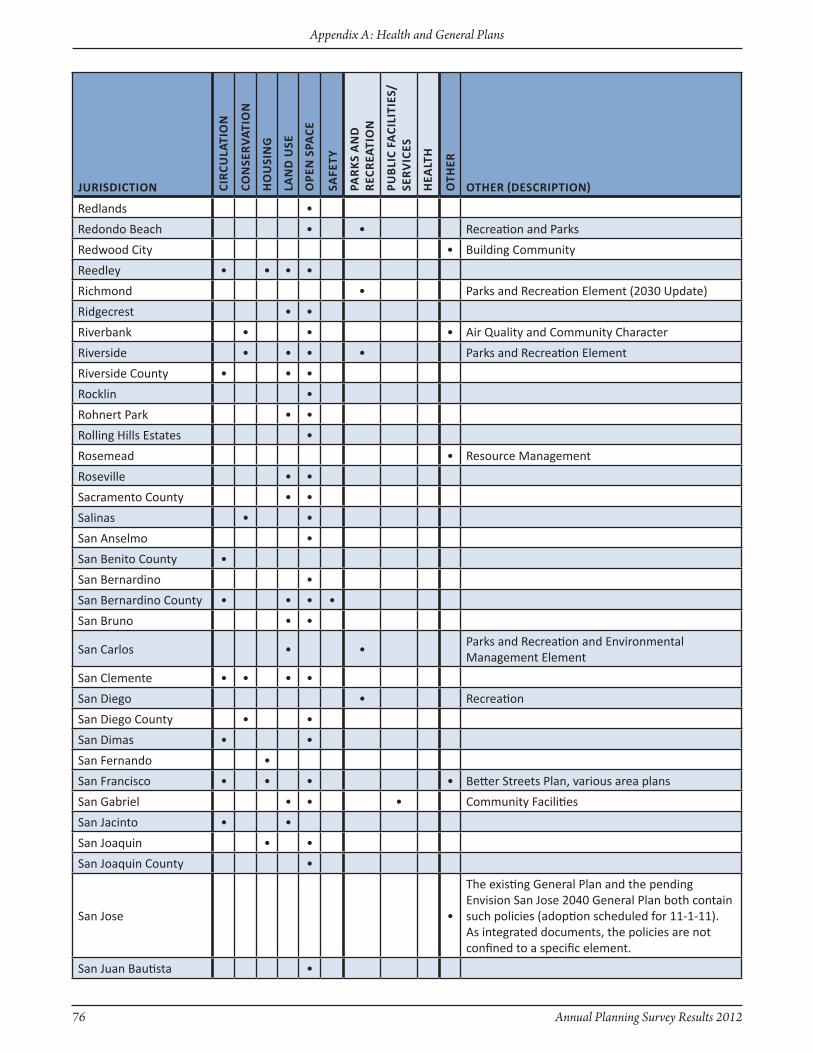
76 Annual Planning Survey Results 2012
Appendix A: Health and General Plans
JuRisdictiOn ciR
culA
tiO
n
cOn
seR
vAt
iOn
Ho
uSi
ng
lAn
d u
se
OPe
n s
PAce
Safe
Ty
PAR
ks
An
d
Rec
ReA
tiO
n
PuB
lic
fAci
liti
es/
seR
vic
es
Hea
lTH
Oth
eR
OtheR (descRiPtiOn)
Redlands •
Redondo Beach • • Recreation and Parks
Redwood City • Building Community
Reedley • • • •
Richmond • Parks and Recreation Element (2030 Update)
Ridgecrest • •
Riverbank • • • Air Quality and Community Character
Riverside • • • • Parks and Recreation Element
Riverside County • • •
Rocklin •
Rohnert Park • •
Rolling Hills Estates •
Rosemead • Resource Management
Roseville • •
Sacramento County • •
Salinas • •
San Anselmo •
San Benito County •
San Bernardino •
San Bernardino County • • • •
San Bruno • •
San Carlos • •Parks and Recreation and Environmental Management Element
San Clemente • • • •
San Diego • Recreation
San Diego County • •
San Dimas • •
San Fernando •
San Francisco • • • • Better Streets Plan, various area plans
San Gabriel • • • Community Facilities
San Jacinto • •
San Joaquin • •
San Joaquin County •
San Jose •
The existing General Plan and the pending Envision San Jose 2040 General Plan both contain such policies (adoption scheduled for 11-1-11). As integrated documents, the policies are not confined to a specific element.
San Juan Bautista •
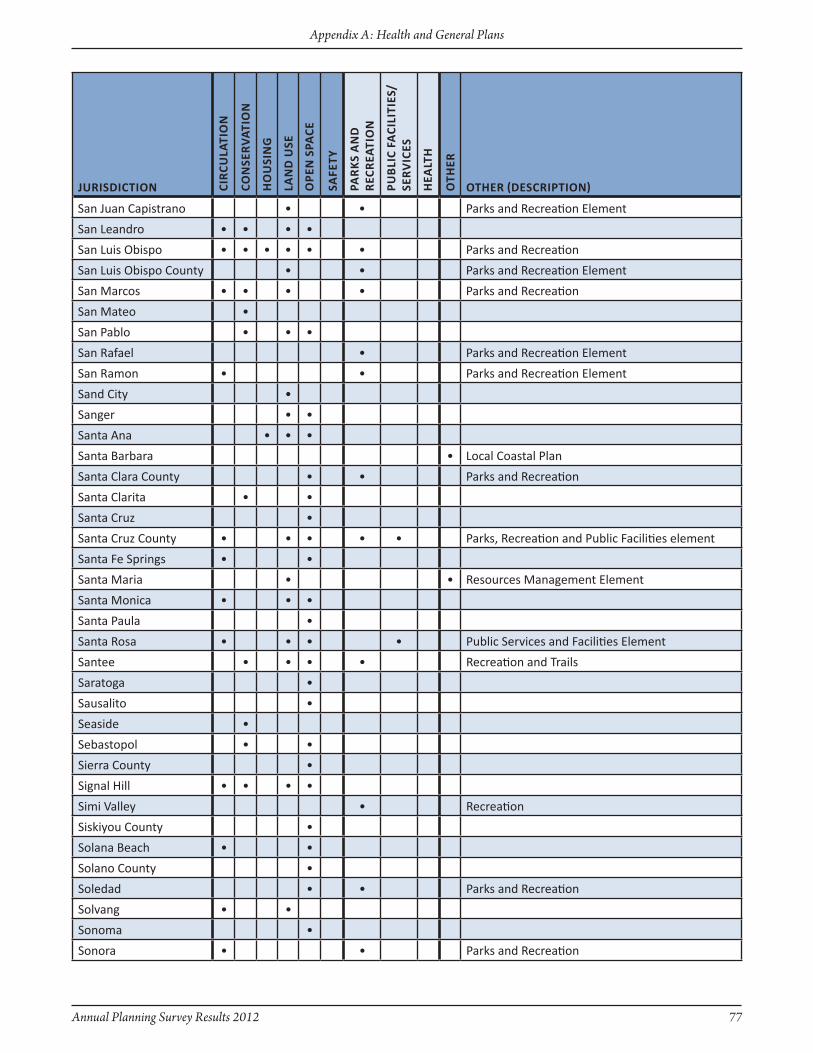
Annual Planning Survey Results 2012 77
Appendix A: Health and General Plans
JuRisdictiOn ciR
culA
tiO
n
cOn
seR
vAt
iOn
Ho
uSi
ng
lAn
d u
se
OPe
n s
PAce
Safe
Ty
PAR
ks
An
d
Rec
ReA
tiO
n
PuB
lic
fAci
liti
es/
seR
vic
es
Hea
lTH
Oth
eR
OtheR (descRiPtiOn)
San Juan Capistrano • • Parks and Recreation Element
San Leandro • • • •
San Luis Obispo • • • • • • Parks and Recreation
San Luis Obispo County • • Parks and Recreation Element
San Marcos • • • • Parks and Recreation
San Mateo •
San Pablo • • •
San Rafael • Parks and Recreation Element
San Ramon • • Parks and Recreation Element
Sand City •
Sanger • •
Santa Ana • • •
Santa Barbara • Local Coastal Plan
Santa Clara County • • Parks and Recreation
Santa Clarita • •
Santa Cruz •
Santa Cruz County • • • • • Parks, Recreation and Public Facilities element
Santa Fe Springs • •
Santa Maria • • Resources Management Element
Santa Monica • • •
Santa Paula •
Santa Rosa • • • • Public Services and Facilities Element
Santee • • • • Recreation and Trails
Saratoga •
Sausalito •
Seaside •
Sebastopol • •
Sierra County •
Signal Hill • • • •
Simi Valley • Recreation
Siskiyou County •
Solana Beach • •
Solano County •
Soledad • • Parks and Recreation
Solvang • •
Sonoma •
Sonora • • Parks and Recreation
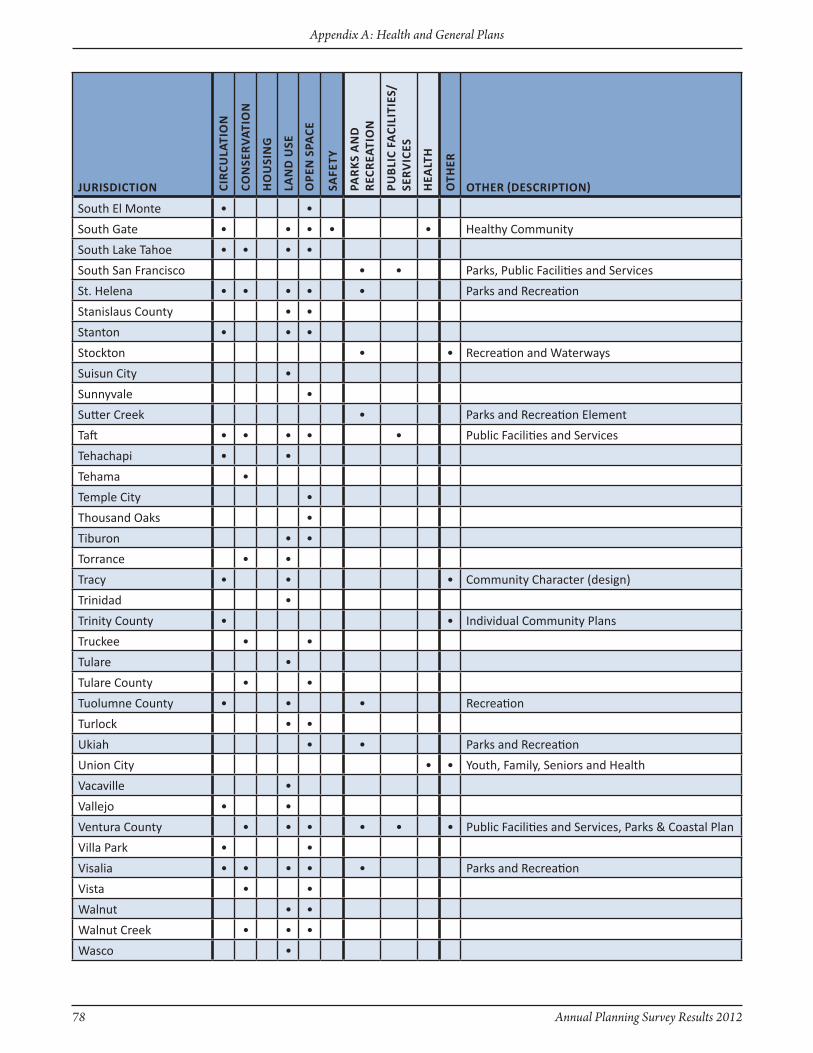
78 Annual Planning Survey Results 2012
Appendix A: Health and General Plans
JuRisdictiOn ciR
culA
tiO
n
cOn
seR
vAt
iOn
Ho
uSi
ng
lAn
d u
se
OPe
n s
PAce
Safe
Ty
PAR
ks
An
d
Rec
ReA
tiO
n
PuB
lic
fAci
liti
es/
seR
vic
es
Hea
lTH
Oth
eR
OtheR (descRiPtiOn)
South El Monte • •
South Gate • • • • • Healthy Community
South Lake Tahoe • • • •
South San Francisco • • Parks, Public Facilities and Services
St. Helena • • • • • Parks and Recreation
Stanislaus County • •
Stanton • • •
Stockton • • Recreation and Waterways
Suisun City •
Sunnyvale •
Sutter Creek • Parks and Recreation Element
Taft • • • • • Public Facilities and Services
Tehachapi • •
Tehama •
Temple City •
Thousand Oaks •
Tiburon • •
Torrance • •
Tracy • • • Community Character (design)
Trinidad •
Trinity County • • Individual Community Plans
Truckee • •
Tulare •
Tulare County • •
Tuolumne County • • • Recreation
Turlock • •
Ukiah • • Parks and Recreation
Union City • • Youth, Family, Seniors and Health
Vacaville •
Vallejo • •
Ventura County • • • • • • Public Facilities and Services, Parks & Coastal Plan
Villa Park • •
Visalia • • • • • Parks and Recreation
Vista • •
Walnut • •
Walnut Creek • • •
Wasco •
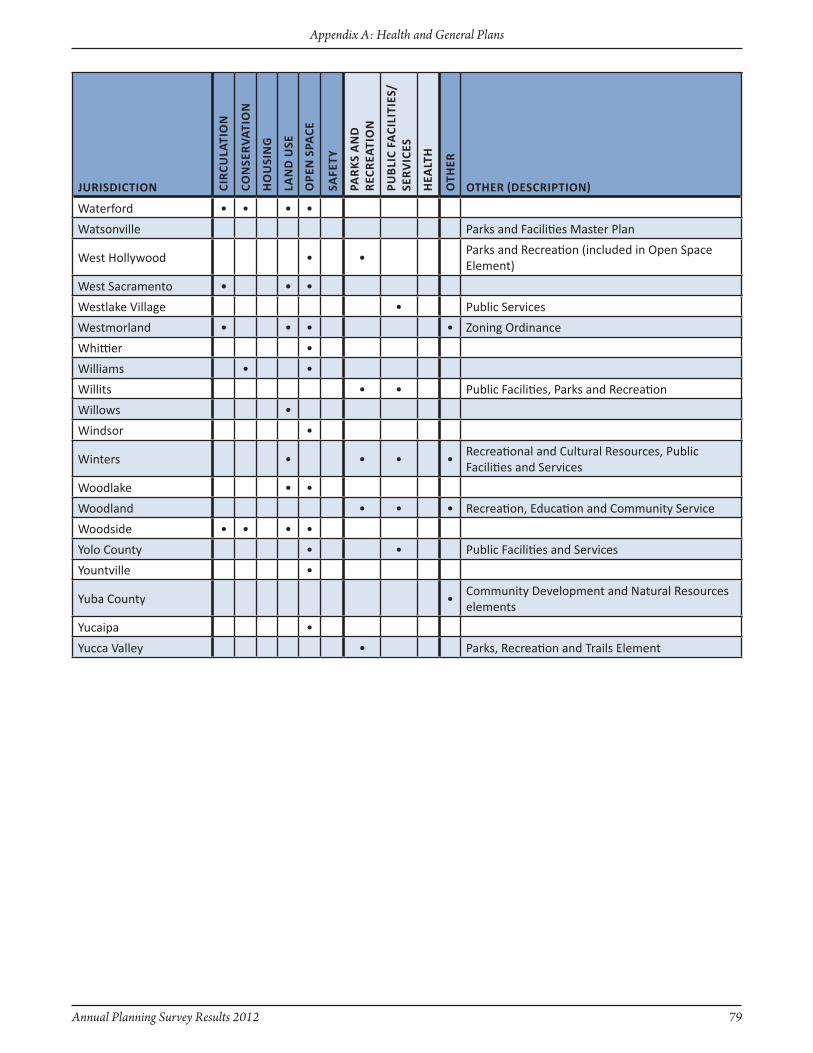
Annual Planning Survey Results 2012 79
Appendix A: Health and General Plans
JuRisdictiOn ciR
culA
tiO
n
cOn
seR
vAt
iOn
Ho
uSi
ng
lAn
d u
se
OPe
n s
PAce
Safe
Ty
PAR
ks
An
d
Rec
ReA
tiO
n
PuB
lic
fAci
liti
es/
seR
vic
es
Hea
lTH
Oth
eR
OtheR (descRiPtiOn)
Waterford • • • •
Watsonville Parks and Facilities Master Plan
West Hollywood • •Parks and Recreation (included in Open Space Element)
West Sacramento • • •
Westlake Village • Public Services
Westmorland • • • • zoning Ordinance
Whittier •
Williams • •
Willits • • Public Facilities, Parks and Recreation
Willows •
Windsor •
Winters • • • •Recreational and Cultural Resources, Public Facilities and Services
Woodlake • •
Woodland • • • Recreation, Education and Community Service
Woodside • • • •
Yolo County • • Public Facilities and Services
Yountville •
Yuba County •Community Development and Natural Resources elements
Yucaipa •
Yucca Valley • Parks, Recreation and Trails Element
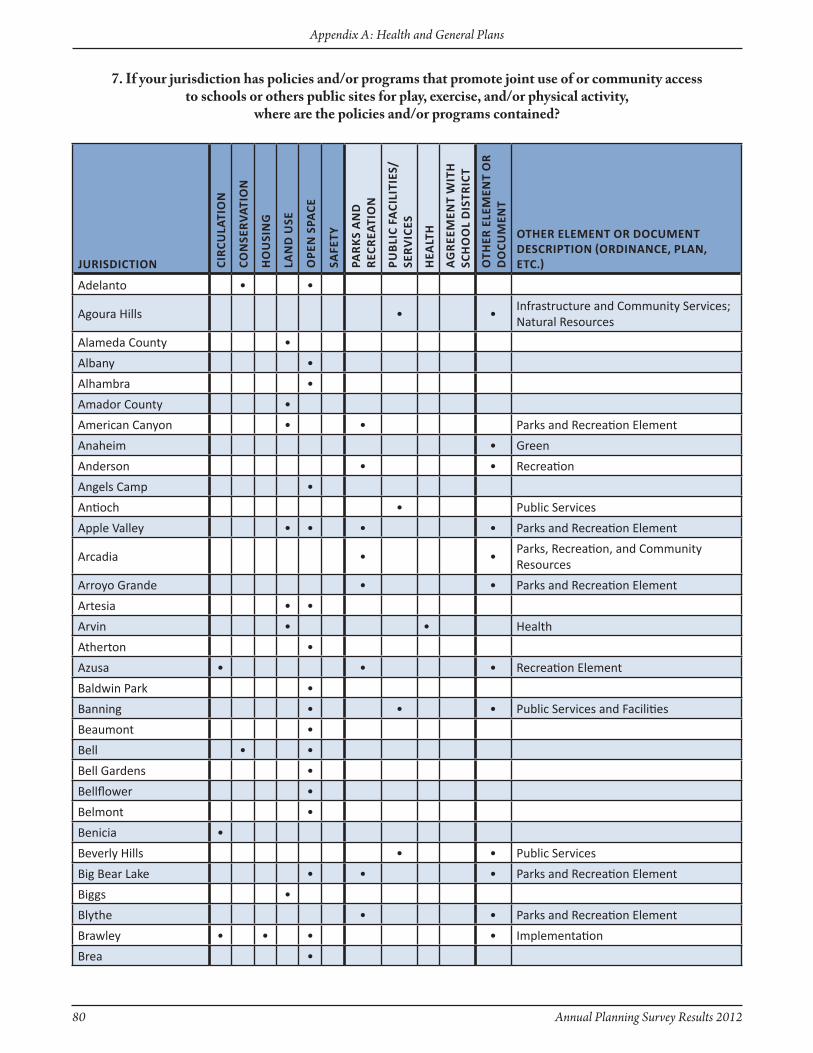
80 Annual Planning Survey Results 2012
Appendix A: Health and General Plans
JuRisdictiOn ciR
culA
tiO
n
cOn
seR
vAt
iOn
Ho
uSi
ng
lAn
d u
se
OPe
n s
PAce
Safe
Ty
PAR
ks
An
d
Rec
ReA
tiO
n
PuB
lic
fAci
liti
es/
seR
vic
es
Hea
lTH
AG
Ree
Men
t W
ith
sc
hO
Ol
dis
tRic
t
Oth
eR e
leM
ent
OR
d
Ocu
Men
t
OtheR eleMent OR dOcuMent descRiPtiOn (ORdinAnce, PlAn, etc.)
Adelanto • •
Agoura Hills • •Infrastructure and Community Services; Natural Resources
Alameda County •
Albany •
Alhambra •
Amador County •
American Canyon • • Parks and Recreation Element
Anaheim • Green
Anderson • • Recreation
Angels Camp •
Antioch • Public Services
Apple Valley • • • • Parks and Recreation Element
Arcadia • •Parks, Recreation, and Community Resources
Arroyo Grande • • Parks and Recreation Element
Artesia • •
Arvin • • Health
Atherton •
Azusa • • • Recreation Element
Baldwin Park •
Banning • • • Public Services and Facilities
Beaumont •
Bell • •
Bell Gardens •
Bellflower •
Belmont •
Benicia •
Beverly Hills • • Public Services
Big Bear Lake • • • Parks and Recreation Element
Biggs •
Blythe • • Parks and Recreation Element
Brawley • • • • Implementation
Brea •
7. If your jurisdiction has policies and/or programs that promote joint use of or community accessto schools or others public sites for play, exercise, and/or physical activity,
where are the policies and/or programs contained?
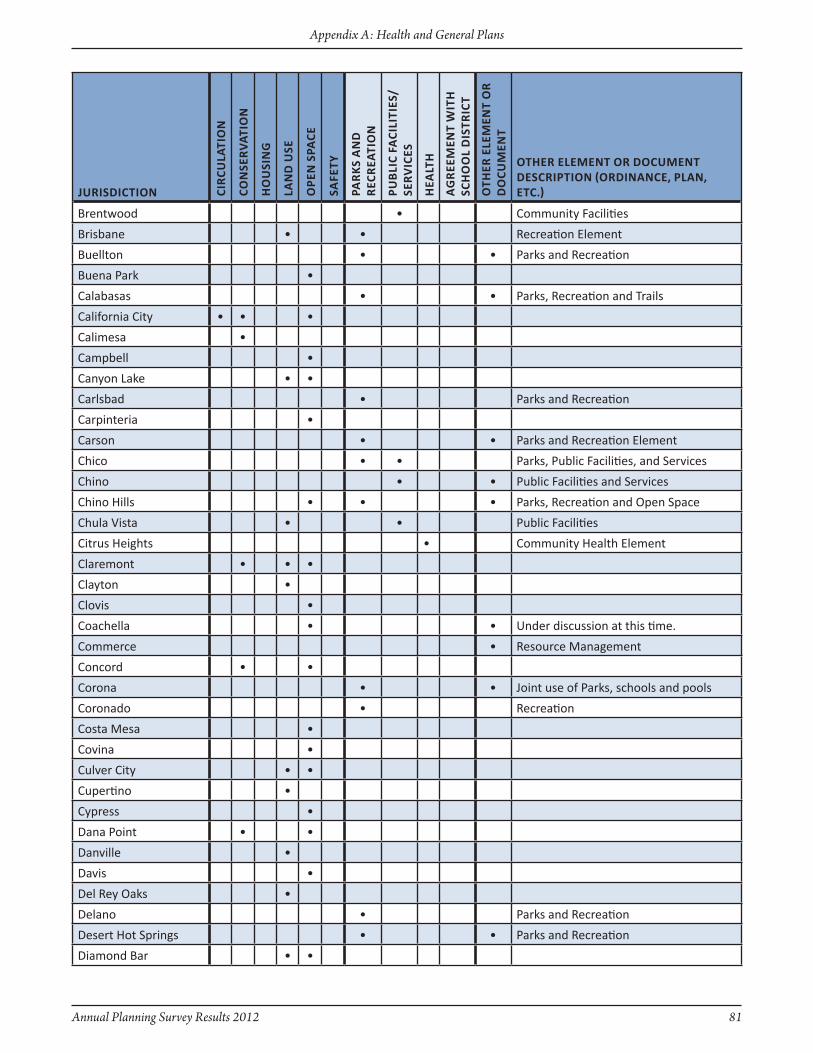
Annual Planning Survey Results 2012 81
Appendix A: Health and General Plans
JuRisdictiOn ciR
culA
tiO
n
cOn
seR
vAt
iOn
Ho
uSi
ng
lAn
d u
se
OPe
n s
PAce
Safe
Ty
PAR
ks
An
d
Rec
ReA
tiO
n
PuB
lic
fAci
liti
es/
seR
vic
es
Hea
lTH
AG
Ree
Men
t W
ith
sc
hO
Ol
dis
tRic
t
Oth
eR e
leM
ent
OR
d
Ocu
Men
t
OtheR eleMent OR dOcuMent descRiPtiOn (ORdinAnce, PlAn, etc.)
Brentwood • Community Facilities
Brisbane • • Recreation Element
Buellton • • Parks and Recreation
Buena Park •
Calabasas • • Parks, Recreation and Trails
California City • • •
Calimesa •
Campbell •
Canyon Lake • •
Carlsbad • Parks and Recreation
Carpinteria •
Carson • • Parks and Recreation Element
Chico • • Parks, Public Facilities, and Services
Chino • • Public Facilities and Services
Chino Hills • • • Parks, Recreation and Open Space
Chula Vista • • Public Facilities
Citrus Heights • Community Health Element
Claremont • • •
Clayton •
Clovis •
Coachella • • Under discussion at this time.
Commerce • Resource Management
Concord • •
Corona • • Joint use of Parks, schools and pools
Coronado • Recreation
Costa Mesa •
Covina •
Culver City • •
Cupertino •
Cypress •
Dana Point • •
Danville •
Davis •
Del Rey Oaks •
Delano • Parks and Recreation
Desert Hot Springs • • Parks and Recreation
Diamond Bar • •

82 Annual Planning Survey Results 2012
Appendix A: Health and General Plans
JuRisdictiOn ciR
culA
tiO
n
cOn
seR
vAt
iOn
Ho
uSi
ng
lAn
d u
se
OPe
n s
PAce
Safe
Ty
PAR
ks
An
d
Rec
ReA
tiO
n
PuB
lic
fAci
liti
es/
seR
vic
es
Hea
lTH
AG
Ree
Men
t W
ith
sc
hO
Ol
dis
tRic
t
Oth
eR e
leM
ent
OR
d
Ocu
Men
t
OtheR eleMent OR dOcuMent descRiPtiOn (ORdinAnce, PlAn, etc.)
Dinuba • • • • Urban Design Element
Dixon •
Dorris •
Duarte •
Dublin •
East Palo Alto • •
El Cajon •
El Centro • •
El Cerrito •
El Dorado County • Parks and Recreation Element
El Monte • • • • Health and Wellness
Elk Grove • Public Facilities and Finance
Emeryville • • Parks and Facilities- Schools
Encinitas • Recreation Element
Escondido •
Exeter •
Fairfield •
Farmersville • •
Fillmore •
Firebaugh • •
Fontana • • •Public Facilities, Services and Infrastructure Element, and Parks, Recreation and Trails Element
Fort Bragg • Public Facilities Element
Fortuna •
Foster City • •
Fowler •
Fremont • Parks and Recreation
Fresno •
Fullerton • • •Parks and Recreation Element - To be adopted in 2011/2012
Garden Grove •
Gilroy •
Glendale • • Recreation
Glendora • Yes. Not sure if its in General Plan.
Glenn County •
Goleta • • Public Facilities Element
Gonzales • Community Facilities and Services
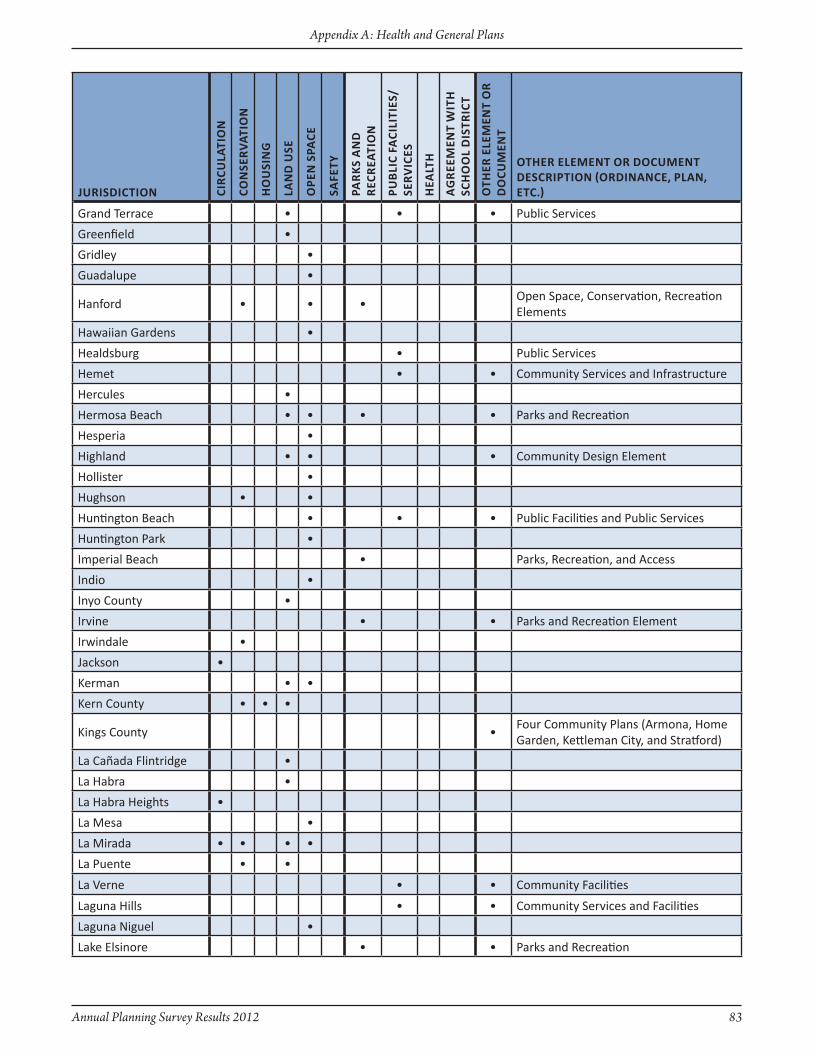
Annual Planning Survey Results 2012 83
Appendix A: Health and General Plans
JuRisdictiOn ciR
culA
tiO
n
cOn
seR
vAt
iOn
Ho
uSi
ng
lAn
d u
se
OPe
n s
PAce
Safe
Ty
PAR
ks
An
d
Rec
ReA
tiO
n
PuB
lic
fAci
liti
es/
seR
vic
es
Hea
lTH
AG
Ree
Men
t W
ith
sc
hO
Ol
dis
tRic
t
Oth
eR e
leM
ent
OR
d
Ocu
Men
t
OtheR eleMent OR dOcuMent descRiPtiOn (ORdinAnce, PlAn, etc.)
Grand Terrace • • • Public Services
Greenfield •
Gridley •
Guadalupe •
Hanford • • •Open Space, Conservation, Recreation Elements
Hawaiian Gardens •
Healdsburg • Public Services
Hemet • • Community Services and Infrastructure
Hercules •
Hermosa Beach • • • • Parks and Recreation
Hesperia •
Highland • • • Community Design Element
Hollister •
Hughson • •
Huntington Beach • • • Public Facilities and Public Services
Huntington Park •
Imperial Beach • Parks, Recreation, and Access
Indio •
Inyo County •
Irvine • • Parks and Recreation Element
Irwindale •
Jackson •
Kerman • •
Kern County • • •
Kings County •Four Community Plans (Armona, Home Garden, Kettleman City, and Stratford)
La Cañada Flintridge •
La Habra •
La Habra Heights •
La Mesa •
La Mirada • • • •
La Puente • •
La Verne • • Community Facilities
Laguna Hills • • Community Services and Facilities
Laguna Niguel •
Lake Elsinore • • Parks and Recreation
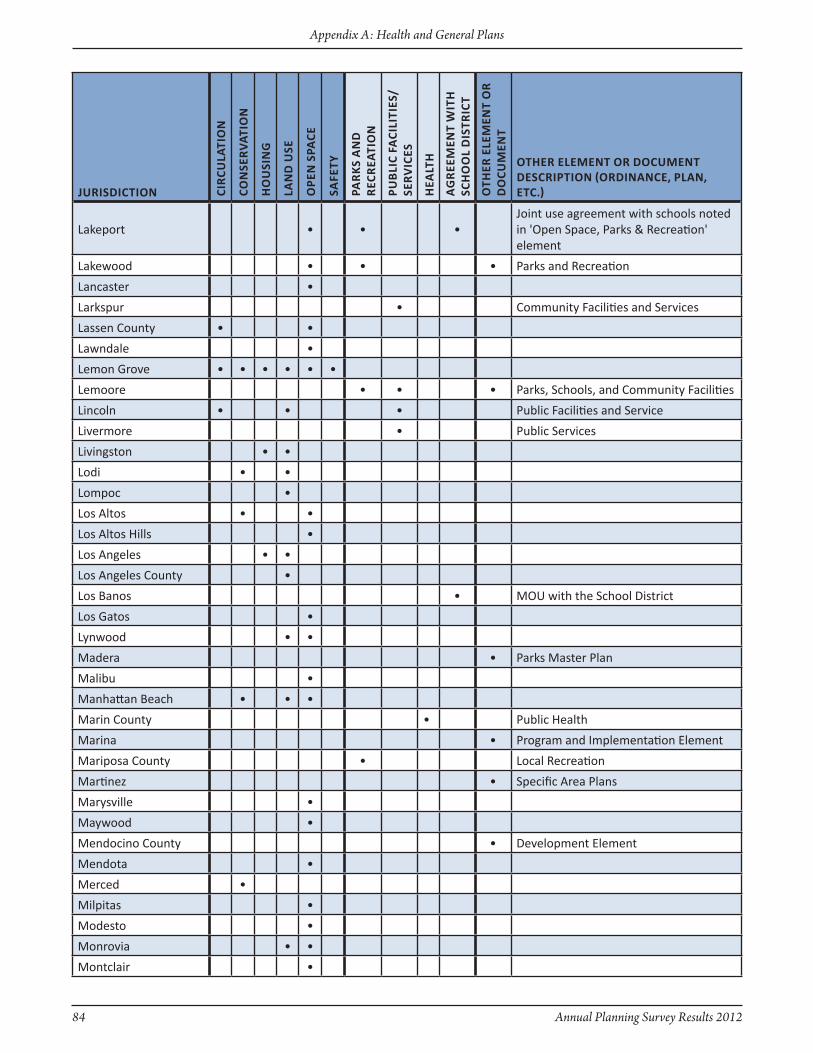
84 Annual Planning Survey Results 2012
Appendix A: Health and General Plans
JuRisdictiOn ciR
culA
tiO
n
cOn
seR
vAt
iOn
Ho
uSi
ng
lAn
d u
se
OPe
n s
PAce
Safe
Ty
PAR
ks
An
d
Rec
ReA
tiO
n
PuB
lic
fAci
liti
es/
seR
vic
es
Hea
lTH
AG
Ree
Men
t W
ith
sc
hO
Ol
dis
tRic
t
Oth
eR e
leM
ent
OR
d
Ocu
Men
t
OtheR eleMent OR dOcuMent descRiPtiOn (ORdinAnce, PlAn, etc.)
Lakeport • • •Joint use agreement with schools noted in 'Open Space, Parks & Recreation' element
Lakewood • • • Parks and Recreation
Lancaster •
Larkspur • Community Facilities and Services
Lassen County • •
Lawndale •
Lemon Grove • • • • • •
Lemoore • • • Parks, Schools, and Community Facilities
Lincoln • • • Public Facilities and Service
Livermore • Public Services
Livingston • •
Lodi • •
Lompoc •
Los Altos • •
Los Altos Hills •
Los Angeles • •
Los Angeles County •
Los Banos • MOU with the School District
Los Gatos •
Lynwood • •
Madera • Parks Master Plan
Malibu •
Manhattan Beach • • •
Marin County • Public Health
Marina • Program and Implementation Element
Mariposa County • Local Recreation
Martinez • Specific Area Plans
Marysville •
Maywood •
Mendocino County • Development Element
Mendota •
Merced •
Milpitas •
Modesto •
Monrovia • •
Montclair •

Annual Planning Survey Results 2012 85
Appendix A: Health and General Plans
JuRisdictiOn ciR
culA
tiO
n
cOn
seR
vAt
iOn
Ho
uSi
ng
lAn
d u
se
OPe
n s
PAce
Safe
Ty
PAR
ks
An
d
Rec
ReA
tiO
n
PuB
lic
fAci
liti
es/
seR
vic
es
Hea
lTH
AG
Ree
Men
t W
ith
sc
hO
Ol
dis
tRic
t
Oth
eR e
leM
ent
OR
d
Ocu
Men
t
OtheR eleMent OR dOcuMent descRiPtiOn (ORdinAnce, PlAn, etc.)
Montebello • • • Parks and Recreation
Monterey • Public Facilities
Monterey County • Public Services
Moorpark • • Recreation Element
Moreno Valley • • Parks and Recreation
Morgan Hill •
Mountain View •
Murrieta • • Recreation and Open Space Element
Napa •
National City • •
Needles •
Newman • • • Public Facilities and Services, Cultural
Newport Beach • • Recreation
Norco • • • •Open Space, Parks, and Recreation Element
Norwalk •
Novato •Through a joint use agreement with our school district
Oakdale • •
Oakland •
Oakley • Parks and Recreation Element
Oceanside • Parks Master Plan
Ojai • • Recreation Element
Ontario • • Parks and Recreation
Orange •
Orange Cove •
Orinda •
Orland •
Oroville •
Oxnard • • • •
Pacific Grove • Parks and Recreation
Pacifica •
Palm Desert • Parks and Recreation Element
Palm Springs • • •Recreation, Open Space and Conservation
Palmdale • • • • • • • •Public Services Element/Noise Element/Community Design Element

86 Annual Planning Survey Results 2012
Appendix A: Health and General Plans
JuRisdictiOn ciR
culA
tiO
n
cOn
seR
vAt
iOn
Ho
uSi
ng
lAn
d u
se
OPe
n s
PAce
Safe
Ty
PAR
ks
An
d
Rec
ReA
tiO
n
PuB
lic
fAci
liti
es/
seR
vic
es
Hea
lTH
AG
Ree
Men
t W
ith
sc
hO
Ol
dis
tRic
t
Oth
eR e
leM
ent
OR
d
Ocu
Men
t
OtheR eleMent OR dOcuMent descRiPtiOn (ORdinAnce, PlAn, etc.)
Palo Alto • • •Community Services and Facilities Element
Paramount •
Parlier •
Pasadena • • •Green Space, Recreation & Parks Element
Paso Robles • • Parks and Recreation Element
Patterson • • Parks, Recreation and Cultural Resources
Perris •
Pico Rivera •
Piedmont • •
Pinole • Community Services and Facilities
Pittsburg •
Placer County • • •
Placerville •
Pleasanton • • • •Public Facilities and Community Programs
Plymouth •
Port Hueneme •
Porterville • • • • Parks, Schools & Community Facilities
Portola • •
Portola Valley • •
Poway • •Policies with Poway Unified Schools (MOU document)
Rancho Cordova • • •
Rancho Cucamonga • • Community Services
Rancho Palos Verdes • •
Red Bluff • • •
Redding • • Recreation Element
Redlands •
Redondo Beach • • Recreation and Parks
Redwood City • • Building Community
Reedley •
Richmond •Education and Human Services Element (2030 Update)
Ridgecrest •
Riverside • •Education Element, Parks and Recreation Element
Rocklin •
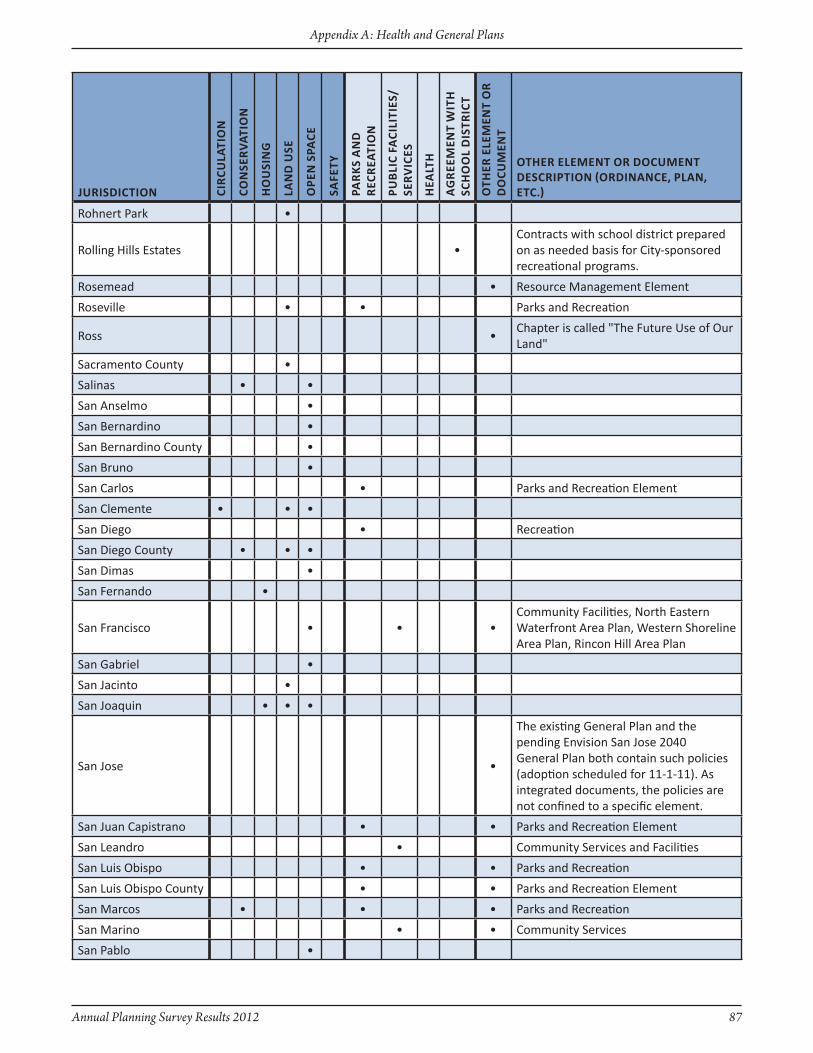
Annual Planning Survey Results 2012 87
Appendix A: Health and General Plans
JuRisdictiOn ciR
culA
tiO
n
cOn
seR
vAt
iOn
Ho
uSi
ng
lAn
d u
se
OPe
n s
PAce
Safe
Ty
PAR
ks
An
d
Rec
ReA
tiO
n
PuB
lic
fAci
liti
es/
seR
vic
es
Hea
lTH
AG
Ree
Men
t W
ith
sc
hO
Ol
dis
tRic
t
Oth
eR e
leM
ent
OR
d
Ocu
Men
t
OtheR eleMent OR dOcuMent descRiPtiOn (ORdinAnce, PlAn, etc.)
Rohnert Park •
Rolling Hills Estates •Contracts with school district prepared on as needed basis for City-sponsored recreational programs.
Rosemead • Resource Management Element
Roseville • • Parks and Recreation
Ross •Chapter is called "The Future Use of Our Land"
Sacramento County •
Salinas • •
San Anselmo •
San Bernardino •
San Bernardino County •
San Bruno •
San Carlos • Parks and Recreation Element
San Clemente • • •
San Diego • Recreation
San Diego County • • •
San Dimas •
San Fernando •
San Francisco • • •Community Facilities, North Eastern Waterfront Area Plan, Western Shoreline Area Plan, Rincon Hill Area Plan
San Gabriel •
San Jacinto •
San Joaquin • • •
San Jose •
The existing General Plan and the pending Envision San Jose 2040 General Plan both contain such policies (adoption scheduled for 11-1-11). As integrated documents, the policies are not confined to a specific element.
San Juan Capistrano • • Parks and Recreation Element
San Leandro • Community Services and Facilities
San Luis Obispo • • Parks and Recreation
San Luis Obispo County • • Parks and Recreation Element
San Marcos • • • Parks and Recreation
San Marino • • Community Services
San Pablo •

88 Annual Planning Survey Results 2012
Appendix A: Health and General Plans
JuRisdictiOn ciR
culA
tiO
n
cOn
seR
vAt
iOn
Ho
uSi
ng
lAn
d u
se
OPe
n s
PAce
Safe
Ty
PAR
ks
An
d
Rec
ReA
tiO
n
PuB
lic
fAci
liti
es/
seR
vic
es
Hea
lTH
AG
Ree
Men
t W
ith
sc
hO
Ol
dis
tRic
t
Oth
eR e
leM
ent
OR
d
Ocu
Men
t
OtheR eleMent OR dOcuMent descRiPtiOn (ORdinAnce, PlAn, etc.)
San Ramon • •Public Facilities Element & Parks and Recreation Element
Sanger • •
Santa Ana • • Education Element
Santa Barbara • •Parks and Recreation/Schools Joint Use Agreement
Santa Clarita • •
Santa Cruz •
Santa Cruz County • •Parks, Recreation and Public Facilities element
Santa Fe Springs • •
Santa Maria • • Resources Management Element
Santa Monica •
Santa Paula •
Santa Rosa • Public Services and Facilities Element
Santee • Recreation
Saratoga •
Sausalito • Environmental Quality
Sebastopol • •
Sierra County • •
Signal Hill •
Simi Valley • Recreation
Solana Beach •
Solano County • • Public Health and Safety
Soledad • Parks and Recreation
Sonora • Parks and Recreation
South El Monte •
South Gate • • • • • • • Healthy Community
South Lake Tahoe •
South San Francisco • • Parks, Public Facilities and Services
St. Helena • • Public Facilities and Services Element
Stockton • • Recreation and Waterways
Suisun City • •
Sunnyvale •
Sutter Creek • • Public Services and Facilities
Taft • Public Facilities and Services
Tehachapi • •
Temple City •
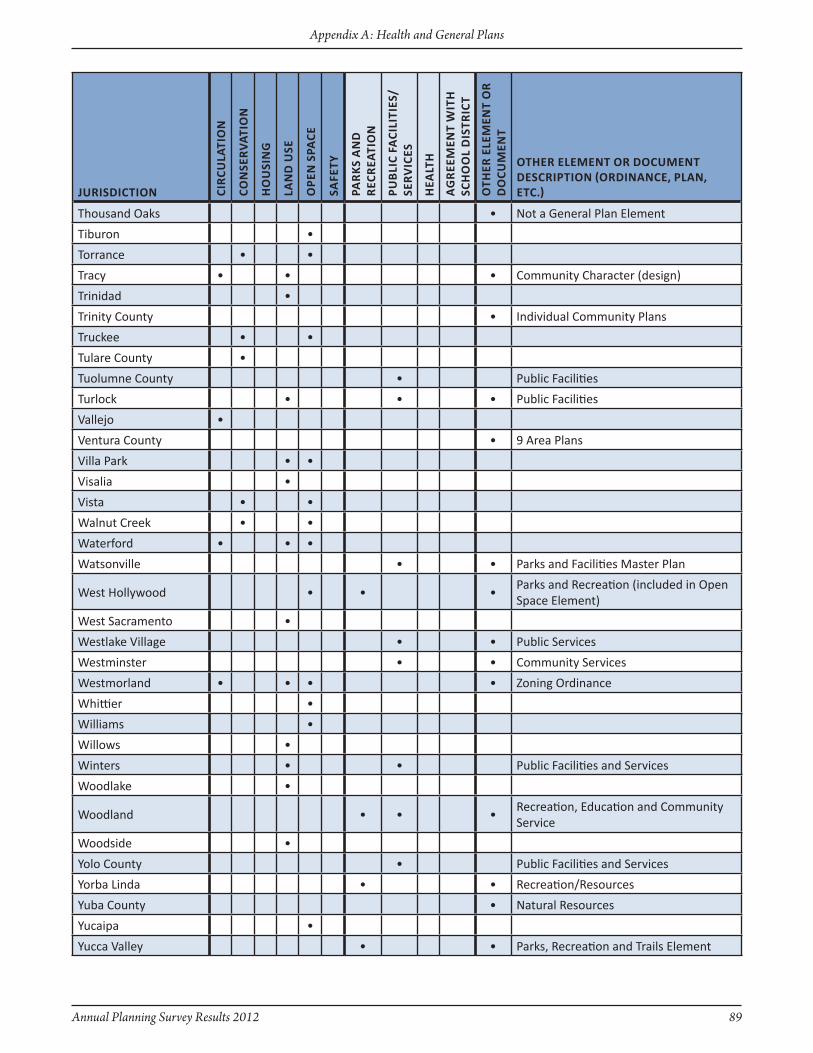
Annual Planning Survey Results 2012 89
Appendix A: Health and General Plans
JuRisdictiOn ciR
culA
tiO
n
cOn
seR
vAt
iOn
Ho
uSi
ng
lAn
d u
se
OPe
n s
PAce
Safe
Ty
PAR
ks
An
d
Rec
ReA
tiO
n
PuB
lic
fAci
liti
es/
seR
vic
es
Hea
lTH
AG
Ree
Men
t W
ith
sc
hO
Ol
dis
tRic
t
Oth
eR e
leM
ent
OR
d
Ocu
Men
t
OtheR eleMent OR dOcuMent descRiPtiOn (ORdinAnce, PlAn, etc.)
Thousand Oaks • Not a General Plan Element
Tiburon •
Torrance • •
Tracy • • • Community Character (design)
Trinidad •
Trinity County • Individual Community Plans
Truckee • •
Tulare County •
Tuolumne County • Public Facilities
Turlock • • • Public Facilities
Vallejo •
Ventura County • 9 Area Plans
Villa Park • •
Visalia •
Vista • •
Walnut Creek • •
Waterford • • •
Watsonville • • Parks and Facilities Master Plan
West Hollywood • • •Parks and Recreation (included in Open Space Element)
West Sacramento •
Westlake Village • • Public Services
Westminster • • Community Services
Westmorland • • • • zoning Ordinance
Whittier •
Williams •
Willows •
Winters • • Public Facilities and Services
Woodlake •
Woodland • • •Recreation, Education and Community Service
Woodside •
Yolo County • Public Facilities and Services
Yorba Linda • • Recreation/Resources
Yuba County • Natural Resources
Yucaipa •
Yucca Valley • • Parks, Recreation and Trails Element
90 Annual Planning Survey Results 2012
Appendix A: Health and General Plans

Annual Planning Survey Results 2012 91
Appendix B: Transportation, Mobility, and Parking
For all Appendices, the column headings in the dark blue colors were choices provided in the questions of the Annual Planning Survey. Column headings highlighted in light blue were responses provided by survey respondents.
Appendix B: Transportation, Mobility, and
Parking

92 Annual Planning Survey Results 2012
Appendix B: Transportation, Mobility, and Parking
Page intentionally left blank

Annual Planning Survey Results 2012 93
Appendix B: Transportation, Mobility, and Parking
* The City of Chino Hills: Modifications to the Circulation Element are “In Process.”
Agoura HillsAlameda CountyAlbanyAlpine CountyAmador CountyAndersonAngels CampApple ValleyArcadiaArtesiaArvinAvalonAzusaBakersfieldBanningBellBeverly HillsBishopBlytheBrawleyBrentwoodBuena ParkButte CountyCalabasasCalaveras CountyCalifornia CityChicoChinoChino Hills*ChowchillaChula VistaCitrus HeightsClaremontClovisCoalingaCommerceConcordContra Costa CountyCoronaCoronadoCorte MaderaCulver CityCupertinoDaly CityDavisDel Rey Oaks
DelanoDesert Hot SpringsDinubaDorrisDos PalosDowneyDublinEast Palo AltoEl CerritoEl MonteEmeryvilleEurekaFairfaxFairfieldFarmersvilleFillmoreFirebaughFontanaFort BraggFortunaFremontFullertonGlendaleGlendoraGoletaGonzalesGrand TerraceGridleyGustineHanfordHawaiian GardensHawthorneHemetHesperiaHoltvilleHughsonHuntington BeachIndioInyo CountyIoneIrvineIrwindaleJacksonKings CountyLa Cañada FlintridgeLa Mesa
La MiradaLa PuenteLa QuintaLa VerneLaguna HillsLakeportLarkspurLincolnLive OakLivingstonLodiLompocLoomisLos AlamitosLos Angeles CountyLos BanosLos GatosLynwoodMaderaMantecaMarin CountyMariposa CountyMendocino CountyMendotaMenifeeMercedMillbraeMilpitasMontereyMonterey ParkMoreno ValleyMorgan HillMurrietaNapaNational CityNevada CountyNorcoNorwalkNovatoOakdaleOaklandOceansideOrangeOrange CoveOrlandOroville
OxnardPalm SpringsPalo AltoParamountParlierPaso RoblesPattersonPerrisPiedmontPinolePittsburgPlacer CountyPlacervillePleasantonPlymouthPoint ArenaPortervilleRancho CordovaRancho CucamongaRancho MirageRed BluffRedondo BeachRedwood CityReedleyRialtoRichmondRidgecrestRiverbankRiversideRosemeadRosevilleSan BernardinoSan Bernardino CountySan CarlosSan ClementeSan DiegoSan Diego CountySan FranciscoSan Joaquin CountySan JoseSan Juan CapistranoSan LeandroSan MateoSan PabloSan RafaelSan Ramon
5. Has your jurisdiction “modified the circulation element to plan for a balanced, multimodal transportation network that meets the needs of all users of streets, roads, and highways...”?
(Government Code 65303 (b)(2)(A).
B. Transportation, Mobility, and Parking
Sand CitySanta BarbaraSanta ClaritaSanta CruzSanta MonicaSanteeSignal HillSimi ValleySolana BeachSolano CountySolvangSonoraSouth GateSouth Lake TahoeSt. HelenaStanislaus CountyStantonStocktonSuisun CitySunnyvaleSutter CountyTaftTehachapiTehamaTorranceTracyTruckeeTulareTurlockUkiahUnion CityUplandVacavilleVilla ParkVisaliaVistaWaterfordWest HollywoodWestminsterWhittierWilliamsWoodlakeWoodsideYolo CountyYountvilleYuba County
The following is a list of juridictions that have modified the cirulation element to plan for a balanced, multimodal transportation network that meets the needs of all users of streets, roads. and highways.
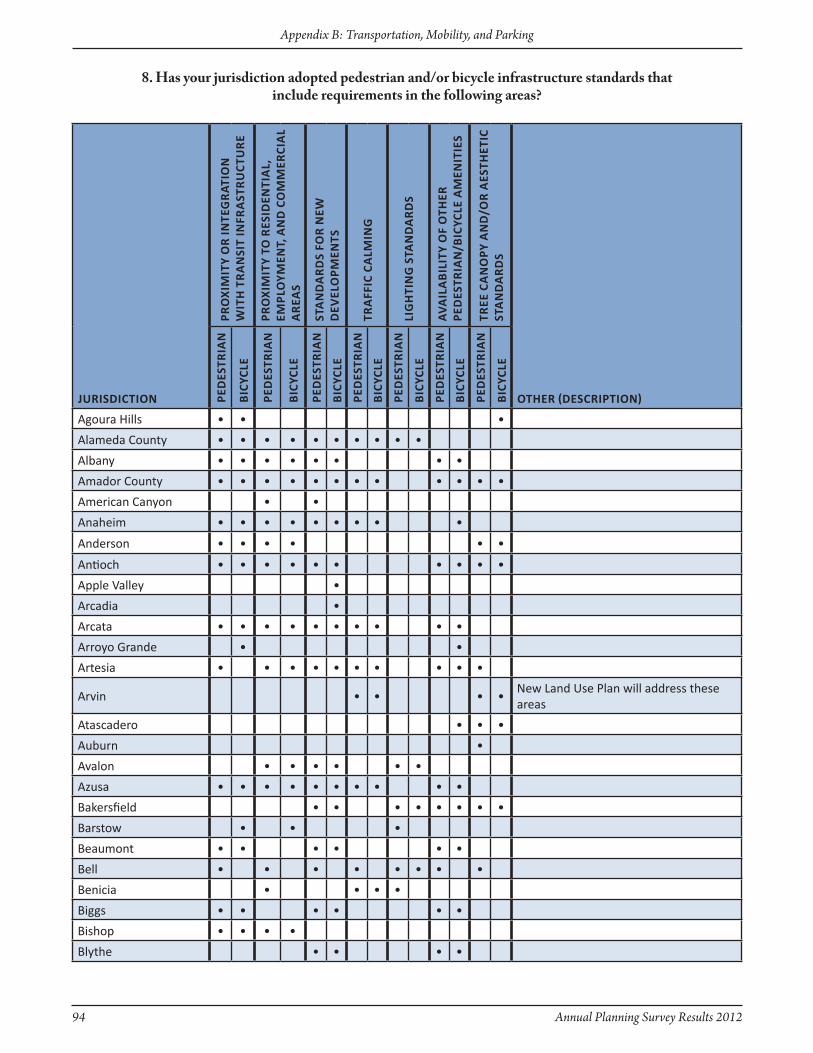
94 Annual Planning Survey Results 2012
Appendix B: Transportation, Mobility, and Parking
JuRisdictiOn
PRO
xiM
ity
OR
inte
GR
AtiO
n
Wit
h t
RA
nsi
t in
fRA
stR
uct
uR
e
PRO
xiM
ity
tO R
esid
enti
Al,
eM
PlO
yMen
t, A
nd
cO
MM
eRci
Al
AR
eAs
stA
nd
AR
ds
fOR
neW
d
evel
OPM
ents
tRA
ffic
cA
lMin
G
liG
hti
nG
stA
nd
AR
ds
Av
Ail
AB
ilit
y O
f O
theR
Pe
des
tRiA
n/B
icyc
le A
Men
itie
s
tRee
cA
nO
Py A
nd
/OR
Aes
thet
ic
stA
nd
AR
ds
OtheR (descRiPtiOn)Ped
estR
iAn
biC
yCle
Ped
estR
iAn
biC
yCle
Ped
estR
iAn
biC
yCle
Ped
estR
iAn
biC
yCle
Ped
estR
iAn
biC
yCle
Ped
estR
iAn
biC
yCle
Ped
estR
iAn
biC
yCle
Agoura Hills • • •
Alameda County • • • • • • • • • •
Albany • • • • • • • •
Amador County • • • • • • • • • • • •
American Canyon • •
Anaheim • • • • • • • • •
Anderson • • • • • •
Antioch • • • • • • • • • •
Apple Valley •
Arcadia •
Arcata • • • • • • • • • •
Arroyo Grande • •
Artesia • • • • • • • • • •
Arvin • • • •New Land Use Plan will address these areas
Atascadero • • •
Auburn •
Avalon • • • • • •
Azusa • • • • • • • • • •
Bakersfield • • • • • • • •
Barstow • • •
Beaumont • • • • • •
Bell • • • • • • • •
Benicia • • • •
Biggs • • • • • •
Bishop • • • •
Blythe • • • •
8. Has your jurisdiction adopted pedestrian and/or bicycle infrastructure standards that include requirements in the following areas?

Annual Planning Survey Results 2012 95
Appendix B: Transportation, Mobility, and Parking
JuRisdictiOn
PRO
xiM
ity
OR
inte
GR
AtiO
n
Wit
h t
RA
nsi
t in
fRA
stR
uct
uR
e
PRO
xiM
ity
tO R
esid
enti
Al,
eM
PlO
yMen
t, A
nd
cO
MM
eRci
Al
AR
eAs
stA
nd
AR
ds
fOR
neW
d
evel
OPM
ents
tRA
ffic
cA
lMin
G
liG
hti
nG
stA
nd
AR
ds
Av
Ail
AB
ilit
y O
f O
theR
Pe
des
tRiA
n/B
icyc
le A
Men
itie
s
tRee
cA
nO
Py A
nd
/OR
Aes
thet
ic
stA
nd
AR
ds
OtheR (descRiPtiOn)Ped
estR
iAn
biC
yCle
Ped
estR
iAn
biC
yCle
Ped
estR
iAn
biC
yCle
Ped
estR
iAn
biC
yCle
Ped
estR
iAn
biC
yCle
Ped
estR
iAn
biC
yCle
Ped
estR
iAn
biC
yCle
Brawley • • • • • • • • • • • •
Brea • • • • • •
Brentwood • • • • • • • • • • •
Brisbane • • • • • • • • • • • •
Buellton • • • • •
Buena Park • • • • • •
Burbank • • • • •
Burlingame • • • • • • • •
Butte County • • • • • • • • •
CalabasasPedestrian and bicycle standards and guidelines are in the Development Code
California City • • • • • • • • • • • •
Calimesa •
Campbell • • • • • • • • •
Canyon Lake •
Capitola • •
Carlsbad • • • • • •
Carson • • • • • •
Chico • • • • • •
Chino • •
Chino Hills • • • • • • • •
Chowchilla • • • • • • • • • •
Chula Vista • • • • • • • • • • • •
Citrus Heights • • • • • • • • • • • •
Claremont • • • • • • •Established Bicycle Priority zone that covers large area of City
Clayton • • • •
Clearlake • • • • • • • • •
Clovis • • • • • • •
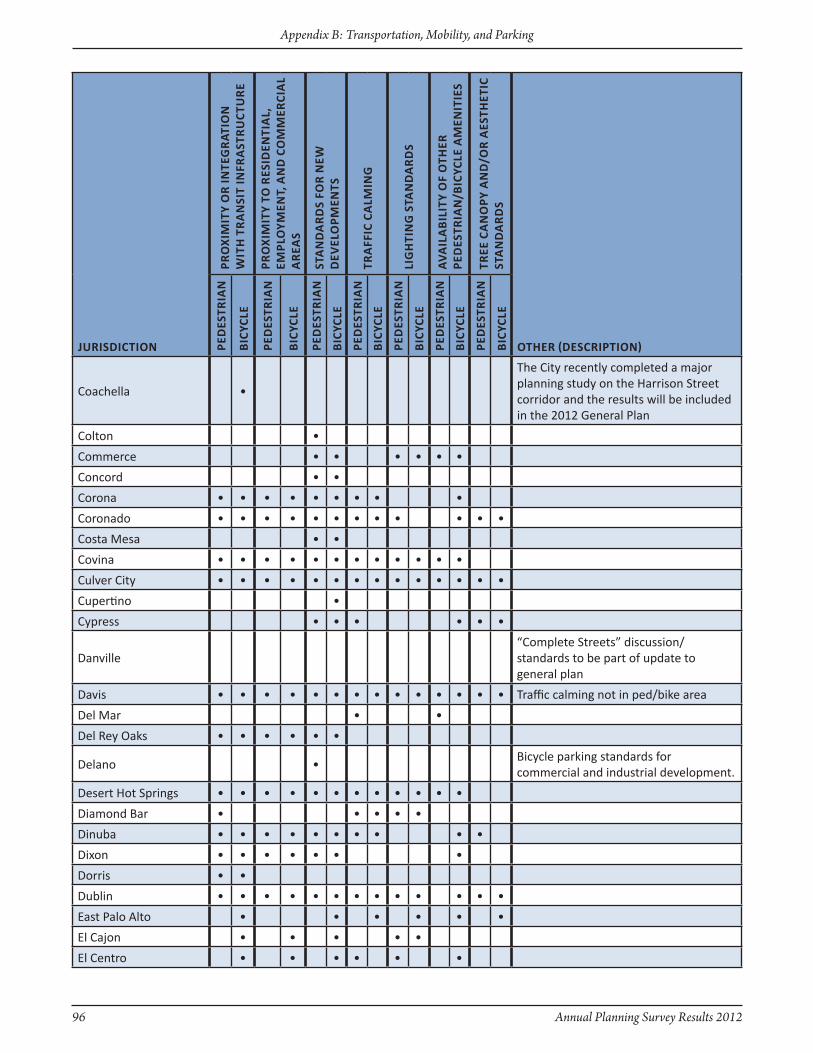
96 Annual Planning Survey Results 2012
Appendix B: Transportation, Mobility, and Parking
JuRisdictiOn
PRO
xiM
ity
OR
inte
GR
AtiO
n
Wit
h t
RA
nsi
t in
fRA
stR
uct
uR
e
PRO
xiM
ity
tO R
esid
enti
Al,
eM
PlO
yMen
t, A
nd
cO
MM
eRci
Al
AR
eAs
stA
nd
AR
ds
fOR
neW
d
evel
OPM
ents
tRA
ffic
cA
lMin
G
liG
hti
nG
stA
nd
AR
ds
Av
Ail
AB
ilit
y O
f O
theR
Pe
des
tRiA
n/B
icyc
le A
Men
itie
s
tRee
cA
nO
Py A
nd
/OR
Aes
thet
ic
stA
nd
AR
ds
OtheR (descRiPtiOn)Ped
estR
iAn
biC
yCle
Ped
estR
iAn
biC
yCle
Ped
estR
iAn
biC
yCle
Ped
estR
iAn
biC
yCle
Ped
estR
iAn
biC
yCle
Ped
estR
iAn
biC
yCle
Ped
estR
iAn
biC
yCle
Coachella •
The City recently completed a major planning study on the Harrison Street corridor and the results will be included in the 2012 General Plan
Colton •
Commerce • • • • • •
Concord • •
Corona • • • • • • • • •
Coronado • • • • • • • • • • • •
Costa Mesa • •
Covina • • • • • • • • • • • •
Culver City • • • • • • • • • • • • • •
Cupertino •
Cypress • • • • • •
Danville“Complete Streets” discussion/standards to be part of update to general plan
Davis • • • • • • • • • • • • • • Traffic calming not in ped/bike area
Del Mar • •
Del Rey Oaks • • • • • •
Delano •Bicycle parking standards for commercial and industrial development.
Desert Hot Springs • • • • • • • • • • • •
Diamond Bar • • • • •
Dinuba • • • • • • • • • •
Dixon • • • • • • •
Dorris • •
Dublin • • • • • • • • • • • • •
East Palo Alto • • • • • •
El Cajon • • • • •
El Centro • • • • • •

Annual Planning Survey Results 2012 97
Appendix B: Transportation, Mobility, and Parking
JuRisdictiOn
PRO
xiM
ity
OR
inte
GR
AtiO
n
Wit
h t
RA
nsi
t in
fRA
stR
uct
uR
e
PRO
xiM
ity
tO R
esid
enti
Al,
eM
PlO
yMen
t, A
nd
cO
MM
eRci
Al
AR
eAs
stA
nd
AR
ds
fOR
neW
d
evel
OPM
ents
tRA
ffic
cA
lMin
G
liG
hti
nG
stA
nd
AR
ds
Av
Ail
AB
ilit
y O
f O
theR
Pe
des
tRiA
n/B
icyc
le A
Men
itie
s
tRee
cA
nO
Py A
nd
/OR
Aes
thet
ic
stA
nd
AR
ds
OtheR (descRiPtiOn)Ped
estR
iAn
biC
yCle
Ped
estR
iAn
biC
yCle
Ped
estR
iAn
biC
yCle
Ped
estR
iAn
biC
yCle
Ped
estR
iAn
biC
yCle
Ped
estR
iAn
biC
yCle
Ped
estR
iAn
biC
yCle
El Cerrito • • • • • • • • • • • • • •
El Dorado County • • • •
El Monte • • • • • • • • • • •
Elk Grove •
Emeryville • • • • • • • •
Encinitas • • • • • •
Escondido • • • • • • • • • •
Eureka • • • • • • • • • •
Exeter • • • •
Fairfax • • • • • • • • • •
Fairfield • • • • • • • •
Farmersville • • • • • • • •
Ferndale • •
Fillmore • • • • • •
Firebaugh • • • • • • • •
Folsom • • • • • • • • • • • • • •
Fontana • • • • • • • • • • • •
Fort Bragg • • • • • •
Fortuna • • • •
Fountain Valley • •
Fremont • • • • • • • • • • • • • •Fremont has adopted both a Bicycle and a Pedestrian Master Plan as part of the General Plan
Fresno • • • • • • • •
Fullerton • • • • • • • • • • • • • •These standards are contained within our October 2010 adopted Fullerton Transportation Center Specific Plan
Garden Grove • • • • • • • • • • • • • •
Gilroy • • • • • • •
Glendale • •
Goleta • • • • • • • • •

98 Annual Planning Survey Results 2012
Appendix B: Transportation, Mobility, and Parking
JuRisdictiOn
PRO
xiM
ity
OR
inte
GR
AtiO
n
Wit
h t
RA
nsi
t in
fRA
stR
uct
uR
e
PRO
xiM
ity
tO R
esid
enti
Al,
eM
PlO
yMen
t, A
nd
cO
MM
eRci
Al
AR
eAs
stA
nd
AR
ds
fOR
neW
d
evel
OPM
ents
tRA
ffic
cA
lMin
G
liG
hti
nG
stA
nd
AR
ds
Av
Ail
AB
ilit
y O
f O
theR
Pe
des
tRiA
n/B
icyc
le A
Men
itie
s
tRee
cA
nO
Py A
nd
/OR
Aes
thet
ic
stA
nd
AR
ds
OtheR (descRiPtiOn)Ped
estR
iAn
biC
yCle
Ped
estR
iAn
biC
yCle
Ped
estR
iAn
biC
yCle
Ped
estR
iAn
biC
yCle
Ped
estR
iAn
biC
yCle
Ped
estR
iAn
biC
yCle
Ped
estR
iAn
biC
yCle
Gonzales • • • •
Grand Terrace •
Greenfield • •
Gridley • • • • • •
Grover Beach • • •
Guadalupe • • • • • • • •
Gustine • • • • • •
HanfordCity adopts the Regional Transportation and Bicycle Plan from Kings County Association of Governments
Hawaiian Gardens • • •
Hayward • • • •
Standards for bicycle infrastructure and amenities for new development are currently in a form-based code that affects only a portion of the City.
Healdsburg • •
Hemet • • • • • •
Hermosa Beach •
Hesperia • • • • • • •
Highland • • • • • • • • • •
Hillsborough • • •
Hollister • • • • • • • • • • • • • •
Holtville • • •
Hughson • • • • • • • •
Huntington Beach • • • • • • • •
Imperial Beach •
Industry • •
Inglewood •
Inyo County • •
Ione • • • • • • •
Irvine • • • • • • • • • •

Annual Planning Survey Results 2012 99
Appendix B: Transportation, Mobility, and Parking
JuRisdictiOn
PRO
xiM
ity
OR
inte
GR
AtiO
n
Wit
h t
RA
nsi
t in
fRA
stR
uct
uR
e
PRO
xiM
ity
tO R
esid
enti
Al,
eM
PlO
yMen
t, A
nd
cO
MM
eRci
Al
AR
eAs
stA
nd
AR
ds
fOR
neW
d
evel
OPM
ents
tRA
ffic
cA
lMin
G
liG
hti
nG
stA
nd
AR
ds
Av
Ail
AB
ilit
y O
f O
theR
Pe
des
tRiA
n/B
icyc
le A
Men
itie
s
tRee
cA
nO
Py A
nd
/OR
Aes
thet
ic
stA
nd
AR
ds
OtheR (descRiPtiOn)Ped
estR
iAn
biC
yCle
Ped
estR
iAn
biC
yCle
Ped
estR
iAn
biC
yCle
Ped
estR
iAn
biC
yCle
Ped
estR
iAn
biC
yCle
Ped
estR
iAn
biC
yCle
Ped
estR
iAn
biC
yCle
Jackson • • • • • • • •
Kerman • • • • •
Kern County • • • • • • • •
La Mesa • • • • • • • • • • • • • •
La Mirada • • • • • • • •
La Puente • •
La Quinta • • •
La Verne • • • • • • • • • • • • • •
Laguna Hills • • • • • • • • •
Laguna Niguel • • • • •
Lake County • • • •
Lake Elsinore • • • • • •
Lakeport • • •
Lakewood • • • • • •
Larkspur • • • • • • • • • • • •Adopted Guidelines for each, not standards
Lassen County • • • • •
Lemon Grove • • • • • • • • •
Lemoore • • • • •
Lincoln • • • • • • • •
Live Oak • • • • • • • • • •
Livermore • • • • • • • • • • •
Livingston • • • • • • • •
Lodi • • • • • • • • • • • • • •
Lomita • • •
Lompoc •
Long Beach •
Loomis • • • • • • • • • • • •
Los Alamitos •
Los Altos •
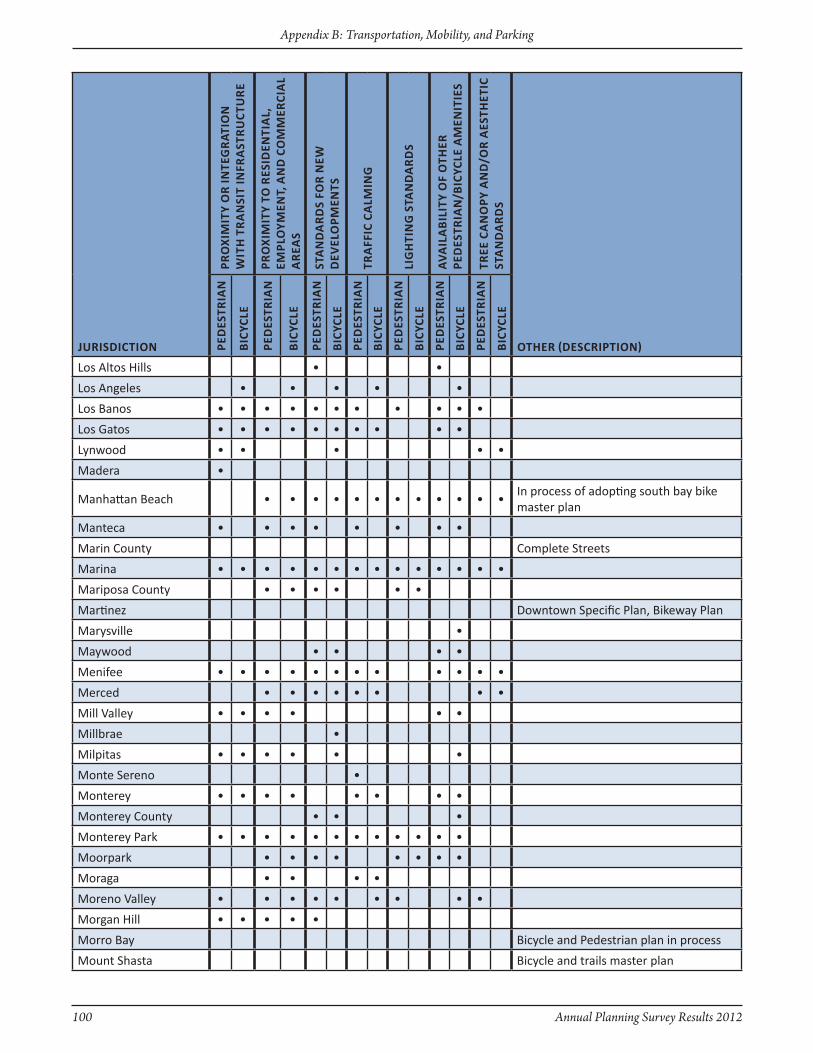
100 Annual Planning Survey Results 2012
Appendix B: Transportation, Mobility, and Parking
JuRisdictiOn
PRO
xiM
ity
OR
inte
GR
AtiO
n
Wit
h t
RA
nsi
t in
fRA
stR
uct
uR
e
PRO
xiM
ity
tO R
esid
enti
Al,
eM
PlO
yMen
t, A
nd
cO
MM
eRci
Al
AR
eAs
stA
nd
AR
ds
fOR
neW
d
evel
OPM
ents
tRA
ffic
cA
lMin
G
liG
hti
nG
stA
nd
AR
ds
Av
Ail
AB
ilit
y O
f O
theR
Pe
des
tRiA
n/B
icyc
le A
Men
itie
s
tRee
cA
nO
Py A
nd
/OR
Aes
thet
ic
stA
nd
AR
ds
OtheR (descRiPtiOn)Ped
estR
iAn
biC
yCle
Ped
estR
iAn
biC
yCle
Ped
estR
iAn
biC
yCle
Ped
estR
iAn
biC
yCle
Ped
estR
iAn
biC
yCle
Ped
estR
iAn
biC
yCle
Ped
estR
iAn
biC
yCle
Los Altos Hills • •
Los Angeles • • • • •
Los Banos • • • • • • • • • • •
Los Gatos • • • • • • • • • •
Lynwood • • • • •
Madera •
Manhattan Beach • • • • • • • • • • • •In process of adopting south bay bike master plan
Manteca • • • • • • • •
Marin County Complete Streets
Marina • • • • • • • • • • • • • •
Mariposa County • • • • • •
Martinez Downtown Specific Plan, Bikeway Plan
Marysville •
Maywood • • • •
Menifee • • • • • • • • • • • •
Merced • • • • • • • •
Mill Valley • • • • • •
Millbrae •
Milpitas • • • • • •
Monte Sereno •
Monterey • • • • • • • •
Monterey County • • •
Monterey Park • • • • • • • • • • • •
Moorpark • • • • • • • •
Moraga • • • •
Moreno Valley • • • • • • • • •
Morgan Hill • • • • •
Morro Bay Bicycle and Pedestrian plan in process
Mount Shasta Bicycle and trails master plan
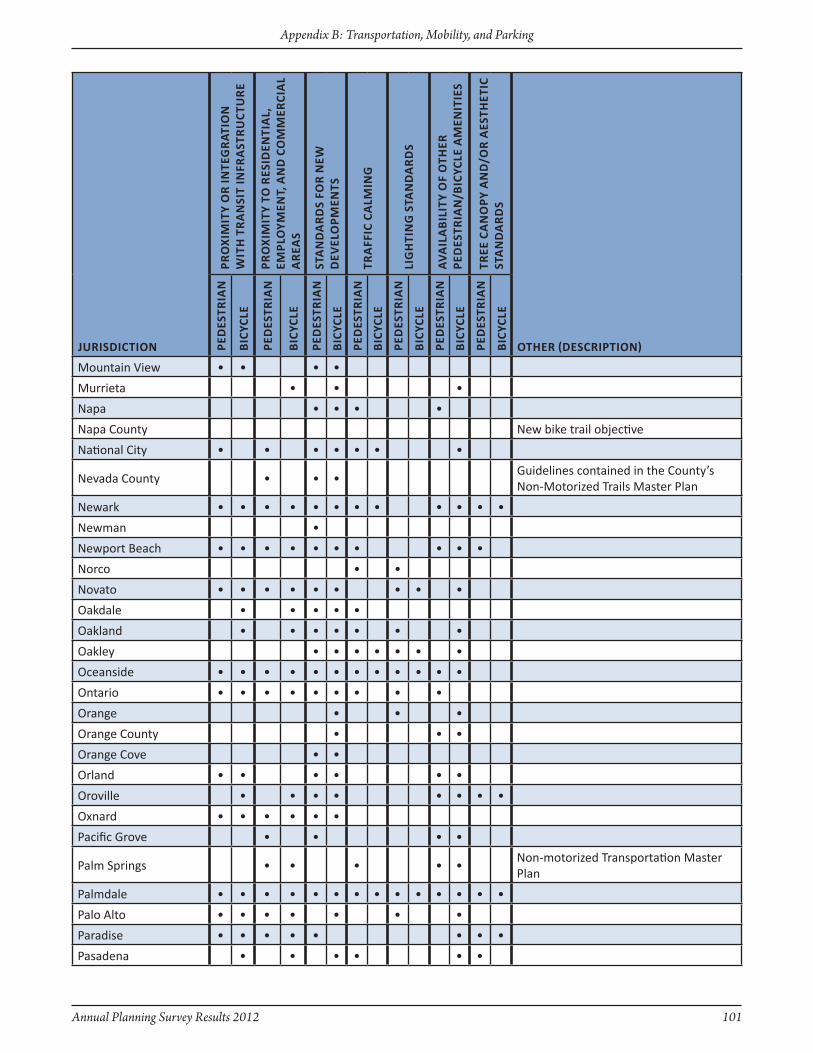
Annual Planning Survey Results 2012 101
Appendix B: Transportation, Mobility, and Parking
JuRisdictiOn
PRO
xiM
ity
OR
inte
GR
AtiO
n
Wit
h t
RA
nsi
t in
fRA
stR
uct
uR
e
PRO
xiM
ity
tO R
esid
enti
Al,
eM
PlO
yMen
t, A
nd
cO
MM
eRci
Al
AR
eAs
stA
nd
AR
ds
fOR
neW
d
evel
OPM
ents
tRA
ffic
cA
lMin
G
liG
hti
nG
stA
nd
AR
ds
Av
Ail
AB
ilit
y O
f O
theR
Pe
des
tRiA
n/B
icyc
le A
Men
itie
s
tRee
cA
nO
Py A
nd
/OR
Aes
thet
ic
stA
nd
AR
ds
OtheR (descRiPtiOn)Ped
estR
iAn
biC
yCle
Ped
estR
iAn
biC
yCle
Ped
estR
iAn
biC
yCle
Ped
estR
iAn
biC
yCle
Ped
estR
iAn
biC
yCle
Ped
estR
iAn
biC
yCle
Ped
estR
iAn
biC
yCle
Mountain View • • • •
Murrieta • • •
Napa • • • •
Napa County New bike trail objective
National City • • • • • • •
Nevada County • • •Guidelines contained in the County’s Non-Motorized Trails Master Plan
Newark • • • • • • • • • • • •
Newman •
Newport Beach • • • • • • • • • •
Norco • •
Novato • • • • • • • • •
Oakdale • • • • •
Oakland • • • • • • •
Oakley • • • • • • •
Oceanside • • • • • • • • • • • •
Ontario • • • • • • • • •
Orange • • •
Orange County • • •
Orange Cove • •
Orland • • • • • •
Oroville • • • • • • • •
Oxnard • • • • • •
Pacific Grove • • • •
Palm Springs • • • • •Non-motorized Transportation Master Plan
Palmdale • • • • • • • • • • • • • •
Palo Alto • • • • • • •
Paradise • • • • • • • •
Pasadena • • • • • •
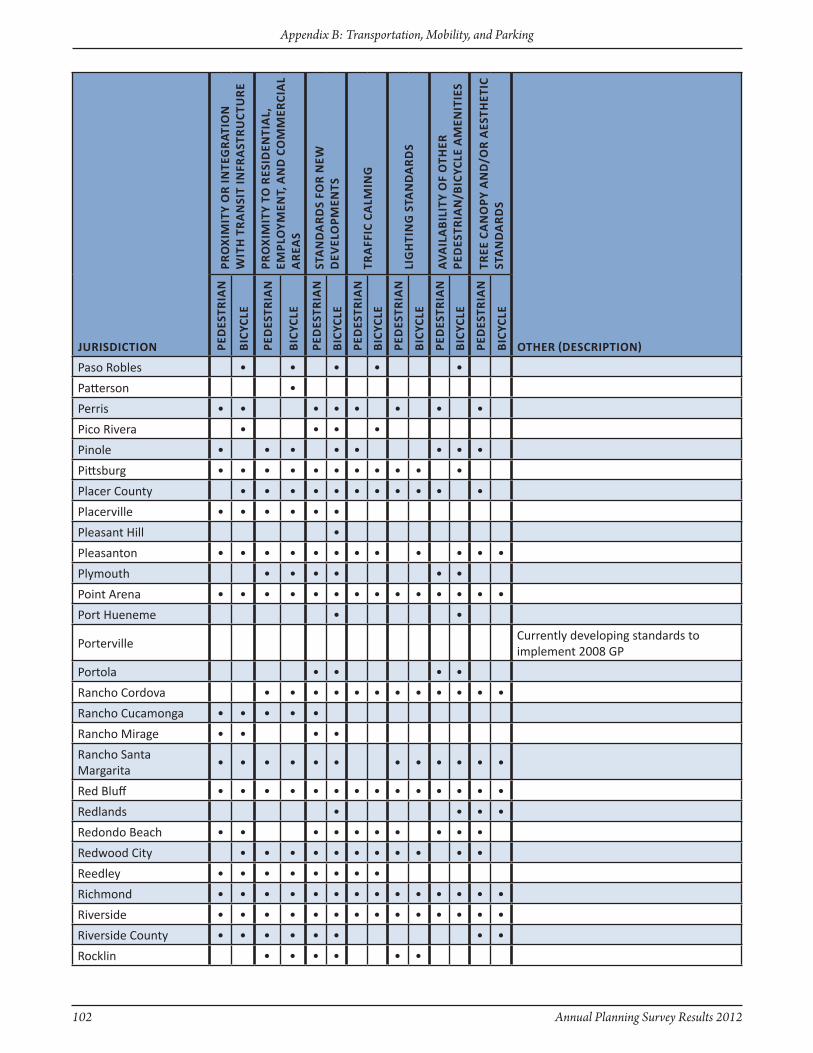
102 Annual Planning Survey Results 2012
Appendix B: Transportation, Mobility, and Parking
JuRisdictiOn
PRO
xiM
ity
OR
inte
GR
AtiO
n
Wit
h t
RA
nsi
t in
fRA
stR
uct
uR
e
PRO
xiM
ity
tO R
esid
enti
Al,
eM
PlO
yMen
t, A
nd
cO
MM
eRci
Al
AR
eAs
stA
nd
AR
ds
fOR
neW
d
evel
OPM
ents
tRA
ffic
cA
lMin
G
liG
hti
nG
stA
nd
AR
ds
Av
Ail
AB
ilit
y O
f O
theR
Pe
des
tRiA
n/B
icyc
le A
Men
itie
s
tRee
cA
nO
Py A
nd
/OR
Aes
thet
ic
stA
nd
AR
ds
OtheR (descRiPtiOn)Ped
estR
iAn
biC
yCle
Ped
estR
iAn
biC
yCle
Ped
estR
iAn
biC
yCle
Ped
estR
iAn
biC
yCle
Ped
estR
iAn
biC
yCle
Ped
estR
iAn
biC
yCle
Ped
estR
iAn
biC
yCle
Paso Robles • • • • •
Patterson •
Perris • • • • • • • •
Pico Rivera • • • •
Pinole • • • • • • • •
Pittsburg • • • • • • • • • • •
Placer County • • • • • • • • • • •
Placerville • • • • • •
Pleasant Hill •
Pleasanton • • • • • • • • • • • •
Plymouth • • • • • •
Point Arena • • • • • • • • • • • • • •
Port Hueneme • •
PortervilleCurrently developing standards to implement 2008 GP
Portola • • • •
Rancho Cordova • • • • • • • • • • • •
Rancho Cucamonga • • • • •
Rancho Mirage • • • •
Rancho Santa Margarita
• • • • • • • • • • • •
Red Bluff • • • • • • • • • • • • • •
Redlands • • • •
Redondo Beach • • • • • • • • • •
Redwood City • • • • • • • • • • •
Reedley • • • • • • • •
Richmond • • • • • • • • • • • • • •
Riverside • • • • • • • • • • • • • •
Riverside County • • • • • • • •
Rocklin • • • • • •

Annual Planning Survey Results 2012 103
Appendix B: Transportation, Mobility, and Parking
JuRisdictiOn
PRO
xiM
ity
OR
inte
GR
AtiO
n
Wit
h t
RA
nsi
t in
fRA
stR
uct
uR
e
PRO
xiM
ity
tO R
esid
enti
Al,
eM
PlO
yMen
t, A
nd
cO
MM
eRci
Al
AR
eAs
stA
nd
AR
ds
fOR
neW
d
evel
OPM
ents
tRA
ffic
cA
lMin
G
liG
hti
nG
stA
nd
AR
ds
Av
Ail
AB
ilit
y O
f O
theR
Pe
des
tRiA
n/B
icyc
le A
Men
itie
s
tRee
cA
nO
Py A
nd
/OR
Aes
thet
ic
stA
nd
AR
ds
OtheR (descRiPtiOn)Ped
estR
iAn
biC
yCle
Ped
estR
iAn
biC
yCle
Ped
estR
iAn
biC
yCle
Ped
estR
iAn
biC
yCle
Ped
estR
iAn
biC
yCle
Ped
estR
iAn
biC
yCle
Ped
estR
iAn
biC
yCle
Rohnert Park • •
Rolling Hills Estates • •
City has a comprehensive bike/pedestrian path program that links all areas of the City through trails adjacent to public streets.
Rosemead • • • • • • •
Roseville • • • • • • • • • •
Sacramento County • • • • • • • • • • • •
Salinas • • • • •
San Anselmo • • • • • • • • • • • •
San Benito County • • • • • • • •
San Bernardino Underway
San Bernardino County • • • • • • • • •
San Diego • • • • • • • • • • •
San Dimas • • • • • • • •
San Fernando • •
San Francisco • • • • • • • • • • • Guidelines for lighting and tree canopy
San Gabriel • • • •
San Jacinto • • • • • •
San Joaquin • • • • • • • • • • •
San Jose • • • • • • • • • • • • • •
San Juan Capistrano • • • • • • • • • •
San Leandro • • • • •
San Luis Obispo • • • • • • • • • • • • • •
San Luis Obispo County • • • • •
San Mateo • • • • • • • • • • • • • •
San Pablo • • • • • • • • • • • • • •
San Rafael • • • • • • • •
San Ramon • • • • • • • • • • • •
Sanger • • • • • • • • •
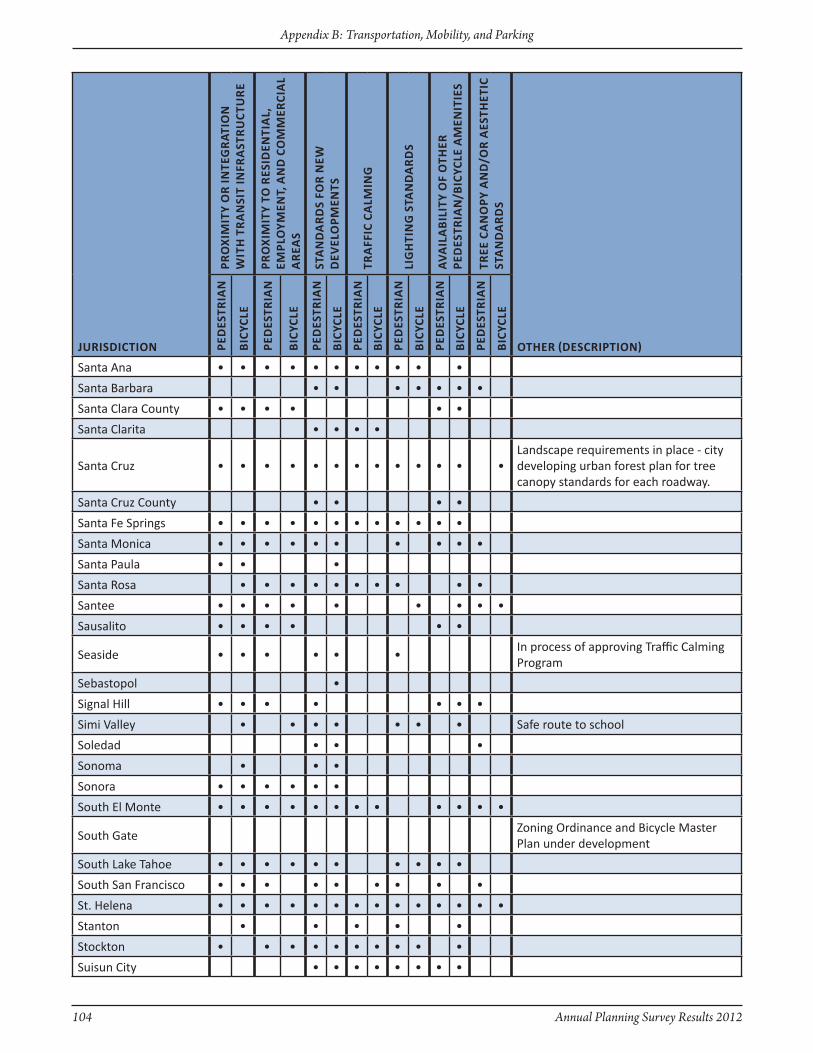
104 Annual Planning Survey Results 2012
Appendix B: Transportation, Mobility, and Parking
JuRisdictiOn
PRO
xiM
ity
OR
inte
GR
AtiO
n
Wit
h t
RA
nsi
t in
fRA
stR
uct
uR
e
PRO
xiM
ity
tO R
esid
enti
Al,
eM
PlO
yMen
t, A
nd
cO
MM
eRci
Al
AR
eAs
stA
nd
AR
ds
fOR
neW
d
evel
OPM
ents
tRA
ffic
cA
lMin
G
liG
hti
nG
stA
nd
AR
ds
Av
Ail
AB
ilit
y O
f O
theR
Pe
des
tRiA
n/B
icyc
le A
Men
itie
s
tRee
cA
nO
Py A
nd
/OR
Aes
thet
ic
stA
nd
AR
ds
OtheR (descRiPtiOn)Ped
estR
iAn
biC
yCle
Ped
estR
iAn
biC
yCle
Ped
estR
iAn
biC
yCle
Ped
estR
iAn
biC
yCle
Ped
estR
iAn
biC
yCle
Ped
estR
iAn
biC
yCle
Ped
estR
iAn
biC
yCle
Santa Ana • • • • • • • • • • •
Santa Barbara • • • • • • •
Santa Clara County • • • • • •
Santa Clarita • • • •
Santa Cruz • • • • • • • • • • • • •Landscape requirements in place - city developing urban forest plan for tree canopy standards for each roadway.
Santa Cruz County • • • •
Santa Fe Springs • • • • • • • • • • • •
Santa Monica • • • • • • • • • •
Santa Paula • • •
Santa Rosa • • • • • • • • • •
Santee • • • • • • • • •
Sausalito • • • • • •
Seaside • • • • • •In process of approving Traffic Calming Program
Sebastopol •
Signal Hill • • • • • • •
Simi Valley • • • • • • • Safe route to school
Soledad • • •
Sonoma • • •
Sonora • • • • • •
South El Monte • • • • • • • • • • • •
South Gatezoning Ordinance and Bicycle Master Plan under development
South Lake Tahoe • • • • • • • • • •
South San Francisco • • • • • • • • •
St. Helena • • • • • • • • • • • • • •
Stanton • • • • •
Stockton • • • • • • • • • •
Suisun City • • • • • • • •
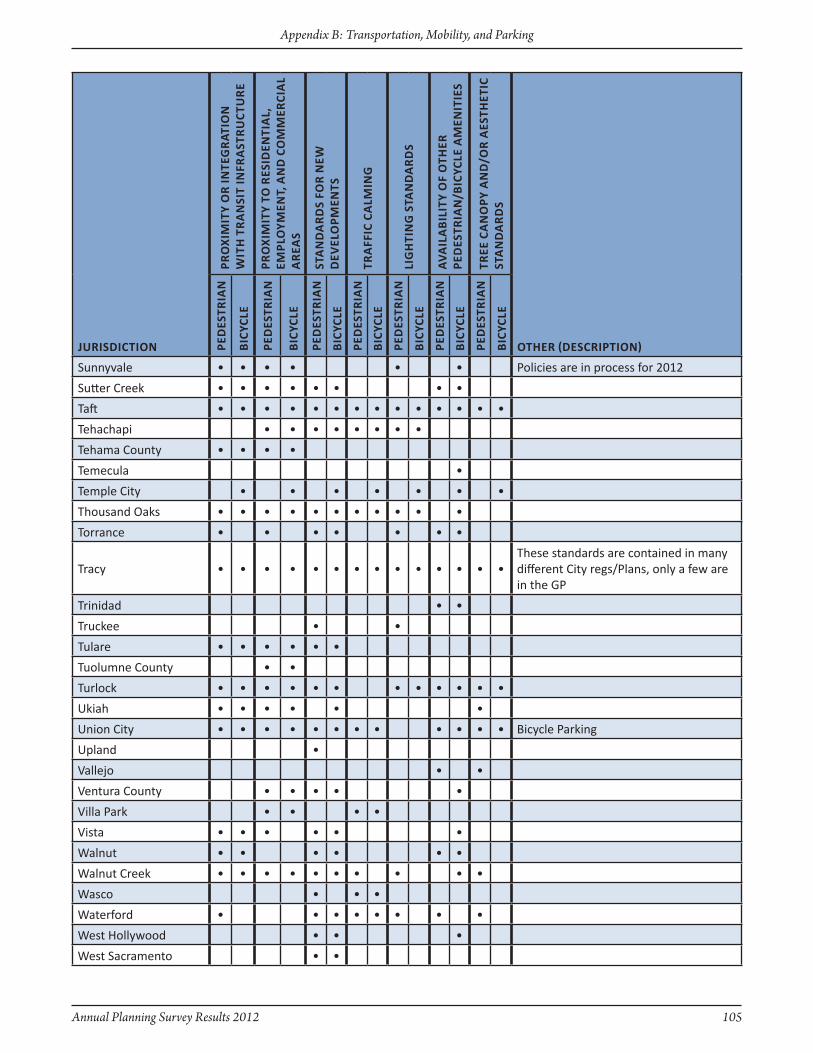
Annual Planning Survey Results 2012 105
Appendix B: Transportation, Mobility, and Parking
JuRisdictiOn
PRO
xiM
ity
OR
inte
GR
AtiO
n
Wit
h t
RA
nsi
t in
fRA
stR
uct
uR
e
PRO
xiM
ity
tO R
esid
enti
Al,
eM
PlO
yMen
t, A
nd
cO
MM
eRci
Al
AR
eAs
stA
nd
AR
ds
fOR
neW
d
evel
OPM
ents
tRA
ffic
cA
lMin
G
liG
hti
nG
stA
nd
AR
ds
Av
Ail
AB
ilit
y O
f O
theR
Pe
des
tRiA
n/B
icyc
le A
Men
itie
s
tRee
cA
nO
Py A
nd
/OR
Aes
thet
ic
stA
nd
AR
ds
OtheR (descRiPtiOn)Ped
estR
iAn
biC
yCle
Ped
estR
iAn
biC
yCle
Ped
estR
iAn
biC
yCle
Ped
estR
iAn
biC
yCle
Ped
estR
iAn
biC
yCle
Ped
estR
iAn
biC
yCle
Ped
estR
iAn
biC
yCle
Sunnyvale • • • • • • Policies are in process for 2012
Sutter Creek • • • • • • • •
Taft • • • • • • • • • • • • • •
Tehachapi • • • • • • • •
Tehama County • • • •
Temecula •
Temple City • • • • • • •
Thousand Oaks • • • • • • • • • • •
Torrance • • • • • • •
Tracy • • • • • • • • • • • • • •These standards are contained in many different City regs/Plans, only a few are in the GP
Trinidad • •
Truckee • •
Tulare • • • • • •
Tuolumne County • •
Turlock • • • • • • • • • • • •
Ukiah • • • • • •
Union City • • • • • • • • • • • • Bicycle Parking
Upland •
Vallejo • •
Ventura County • • • • •
Villa Park • • • •
Vista • • • • • •
Walnut • • • • • •
Walnut Creek • • • • • • • • • •
Wasco • • •
Waterford • • • • • • • •
West Hollywood • • •
West Sacramento • •
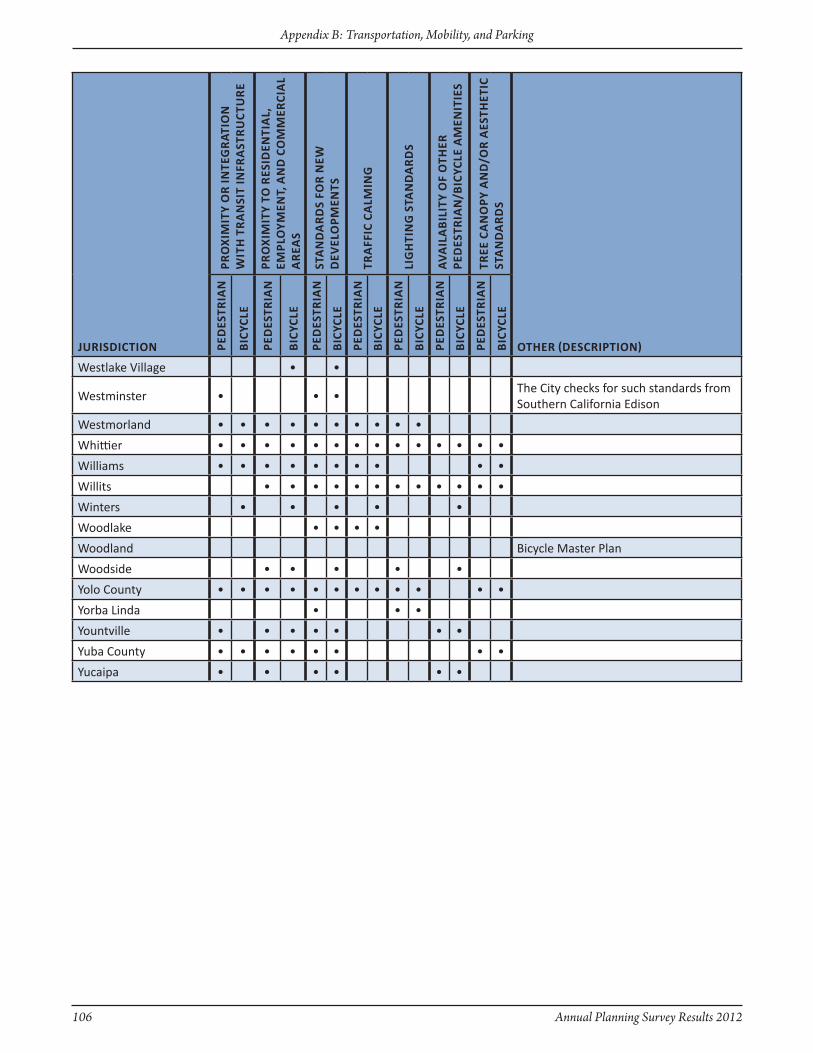
106 Annual Planning Survey Results 2012
Appendix B: Transportation, Mobility, and Parking
JuRisdictiOn
PRO
xiM
ity
OR
inte
GR
AtiO
n
Wit
h t
RA
nsi
t in
fRA
stR
uct
uR
e
PRO
xiM
ity
tO R
esid
enti
Al,
eM
PlO
yMen
t, A
nd
cO
MM
eRci
Al
AR
eAs
stA
nd
AR
ds
fOR
neW
d
evel
OPM
ents
tRA
ffic
cA
lMin
G
liG
hti
nG
stA
nd
AR
ds
Av
Ail
AB
ilit
y O
f O
theR
Pe
des
tRiA
n/B
icyc
le A
Men
itie
s
tRee
cA
nO
Py A
nd
/OR
Aes
thet
ic
stA
nd
AR
ds
OtheR (descRiPtiOn)Ped
estR
iAn
biC
yCle
Ped
estR
iAn
biC
yCle
Ped
estR
iAn
biC
yCle
Ped
estR
iAn
biC
yCle
Ped
estR
iAn
biC
yCle
Ped
estR
iAn
biC
yCle
Ped
estR
iAn
biC
yCle
Westlake Village • •
Westminster • • •The City checks for such standards from Southern California Edison
Westmorland • • • • • • • • • •
Whittier • • • • • • • • • • • • • •
Williams • • • • • • • • • •
Willits • • • • • • • • • • • •
Winters • • • • •
Woodlake • • • •
Woodland Bicycle Master Plan
Woodside • • • • •
Yolo County • • • • • • • • • • • •
Yorba Linda • • •
Yountville • • • • • • •
Yuba County • • • • • • • •
Yucaipa • • • • • •
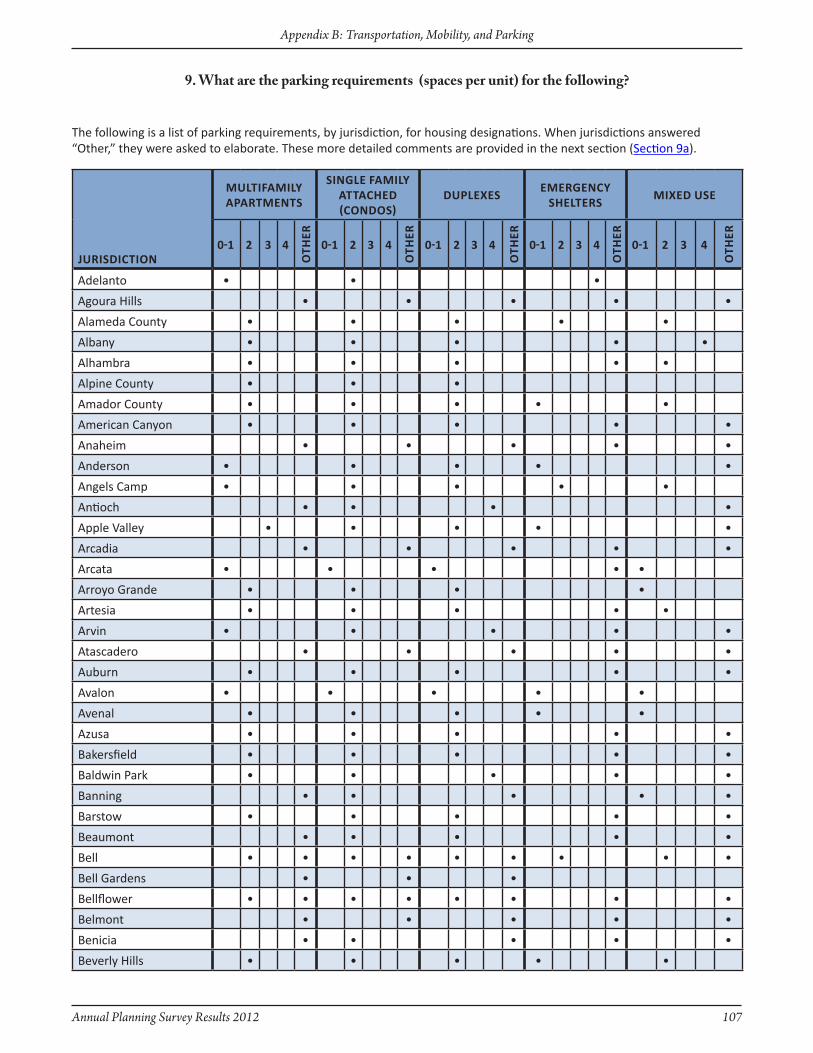
Annual Planning Survey Results 2012 107
Appendix B: Transportation, Mobility, and Parking
JuRisdictiOn
MultifAMily APARtMents
sinGle fAMily AttAched (cOndOs)
duPlexeseMeRGency
shelteRsMixed use
0-1 2 3 4
Oth
eR
0-1 2 3 4
Oth
eR
0-1 2 3 4
Oth
eR
0-1 2 3 4
Oth
eR
0-1 2 3 4
Oth
eR
Adelanto • • •
Agoura Hills • • • • •
Alameda County • • • • •
Albany • • • • •
Alhambra • • • • •
Alpine County • • •
Amador County • • • • •
American Canyon • • • • •
Anaheim • • • • •
Anderson • • • • •
Angels Camp • • • • •
Antioch • • • •
Apple Valley • • • • •
Arcadia • • • • •
Arcata • • • • •
Arroyo Grande • • • •
Artesia • • • • •
Arvin • • • • •
Atascadero • • • • •
Auburn • • • • •
Avalon • • • • •
Avenal • • • • •
Azusa • • • • •
Bakersfield • • • • •
Baldwin Park • • • • •
Banning • • • • •
Barstow • • • • •
Beaumont • • • • •
Bell • • • • • • • • •
Bell Gardens • • •
Bellflower • • • • • • • •
Belmont • • • • •
Benicia • • • • •
Beverly Hills • • • • •
The following is a list of parking requirements, by jurisdiction, for housing designations. When jurisdictions answered “Other,” they were asked to elaborate. These more detailed comments are provided in the next section (Section 9a).
9. What are the parking requirements (spaces per unit) for the following?
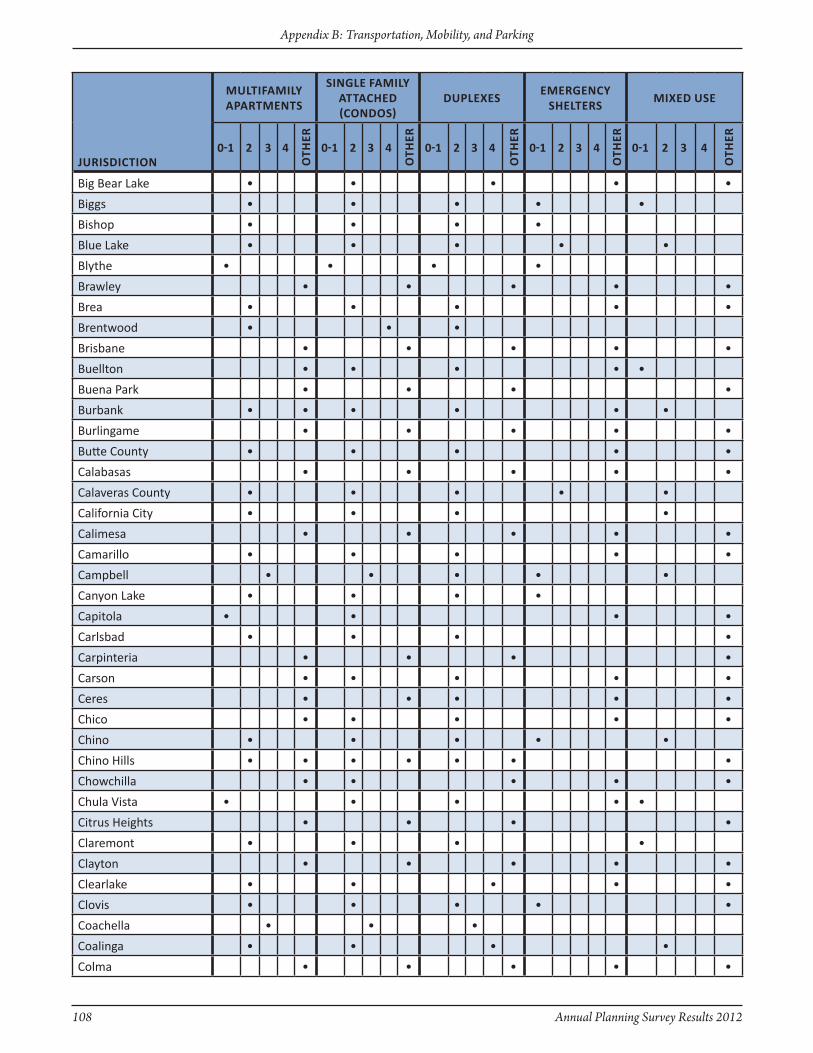
108 Annual Planning Survey Results 2012
Appendix B: Transportation, Mobility, and Parking
JuRisdictiOn
MultifAMily APARtMents
sinGle fAMily AttAched (cOndOs)
duPlexeseMeRGency
shelteRsMixed use
0-1 2 3 4
Oth
eR
0-1 2 3 4
Oth
eR
0-1 2 3 4
Oth
eR
0-1 2 3 4
Oth
eR
0-1 2 3 4
Oth
eR
Big Bear Lake • • • • •
Biggs • • • • •
Bishop • • • •
Blue Lake • • • • •
Blythe • • • •
Brawley • • • • •
Brea • • • • •
Brentwood • • •
Brisbane • • • • •
Buellton • • • • •
Buena Park • • • •
Burbank • • • • • •
Burlingame • • • • •
Butte County • • • • •
Calabasas • • • • •
Calaveras County • • • • •
California City • • • •
Calimesa • • • • •
Camarillo • • • • •
Campbell • • • • •
Canyon Lake • • • •
Capitola • • • •
Carlsbad • • • •
Carpinteria • • • •
Carson • • • • •
Ceres • • • • •
Chico • • • • •
Chino • • • • •
Chino Hills • • • • • • •
Chowchilla • • • • •
Chula Vista • • • • •
Citrus Heights • • • •
Claremont • • • •
Clayton • • • • •
Clearlake • • • • •
Clovis • • • • •
Coachella • • •
Coalinga • • • •
Colma • • • • •
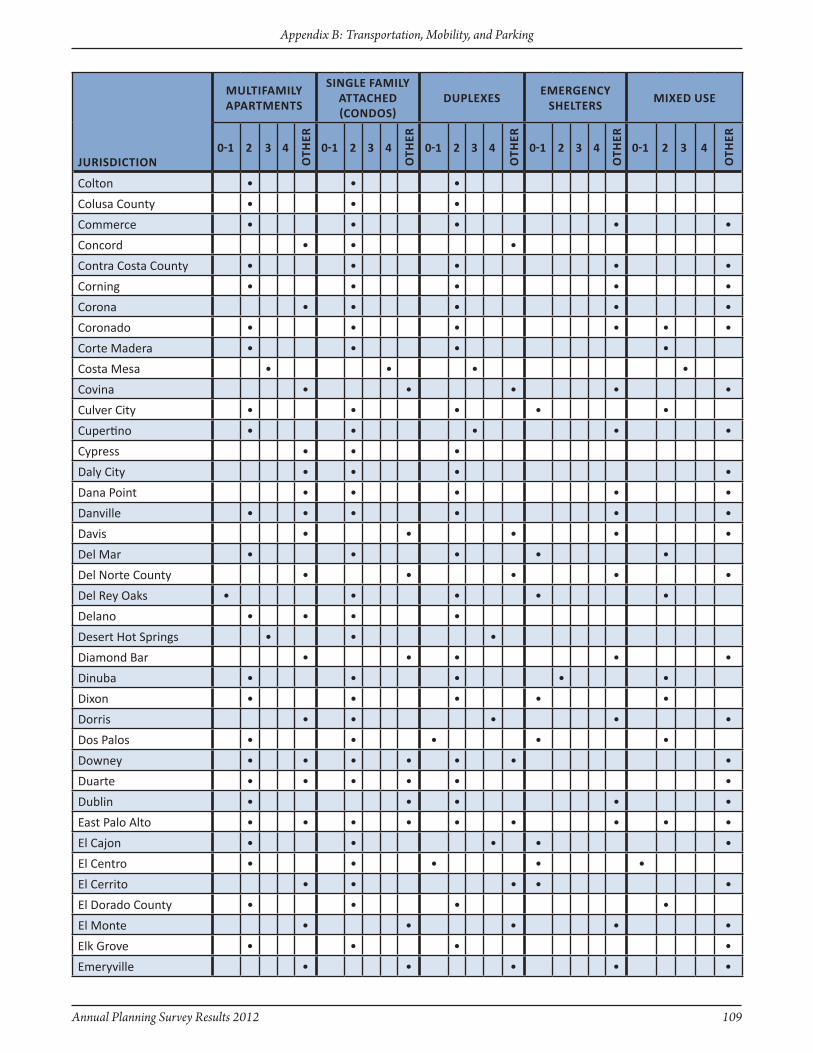
Annual Planning Survey Results 2012 109
Appendix B: Transportation, Mobility, and Parking
JuRisdictiOn
MultifAMily APARtMents
sinGle fAMily AttAched (cOndOs)
duPlexeseMeRGency
shelteRsMixed use
0-1 2 3 4
Oth
eR
0-1 2 3 4
Oth
eR
0-1 2 3 4
Oth
eR
0-1 2 3 4
Oth
eR
0-1 2 3 4
Oth
eR
Colton • • •
Colusa County • • •
Commerce • • • • •
Concord • • •
Contra Costa County • • • • •
Corning • • • • •
Corona • • • • •
Coronado • • • • • •
Corte Madera • • • •
Costa Mesa • • • •
Covina • • • • •
Culver City • • • • •
Cupertino • • • • •
Cypress • • •
Daly City • • • •
Dana Point • • • • •
Danville • • • • • •
Davis • • • • •
Del Mar • • • • •
Del Norte County • • • • •
Del Rey Oaks • • • • •
Delano • • • •
Desert Hot Springs • • •
Diamond Bar • • • • •
Dinuba • • • • •
Dixon • • • • •
Dorris • • • • •
Dos Palos • • • • •
Downey • • • • • • •
Duarte • • • • • •
Dublin • • • • •
East Palo Alto • • • • • • • • •
El Cajon • • • • •
El Centro • • • • •
El Cerrito • • • • •
El Dorado County • • • •
El Monte • • • • •
Elk Grove • • • •
Emeryville • • • • •

110 Annual Planning Survey Results 2012
Appendix B: Transportation, Mobility, and Parking
JuRisdictiOn
MultifAMily APARtMents
sinGle fAMily AttAched (cOndOs)
duPlexeseMeRGency
shelteRsMixed use
0-1 2 3 4
Oth
eR
0-1 2 3 4
Oth
eR
0-1 2 3 4
Oth
eR
0-1 2 3 4
Oth
eR
0-1 2 3 4
Oth
eR
Encinitas • • • • •
Escondido • • • • •
Eureka • • • •
Exeter • • • • •
Fairfax • • • • •
Fairfield • • • • •
Ferndale • • • • •
Fillmore • • • • •
Firebaugh • • •
Folsom • • • • •
Fontana • • • • •
Fort Bragg • • • •
Fort Jones • •
Fortuna • • • • •
Foster City • • • •
Fountain Valley • • • • •
Fowler • • • •
Fremont • • • • •
Fresno • • • • •
Fullerton • • • • •
Garden Grove • • • •
Gardena • • • •
Gilroy • • • • •
Glendale • • • • •
Glendora • • • • •
Glenn County • • • •
Goleta • • • • •
Gonzales • • •
Grand Terrace • • • •
Grass Valley • • • •
Greenfield • • • • •
Gridley • • • • •
Grover Beach • • • •
Guadalupe • • • •
Gustine • • • • •
Hanford • •
Hawaiian Gardens • • • •
Hawthorne • • • • •
Hayward • • • • •
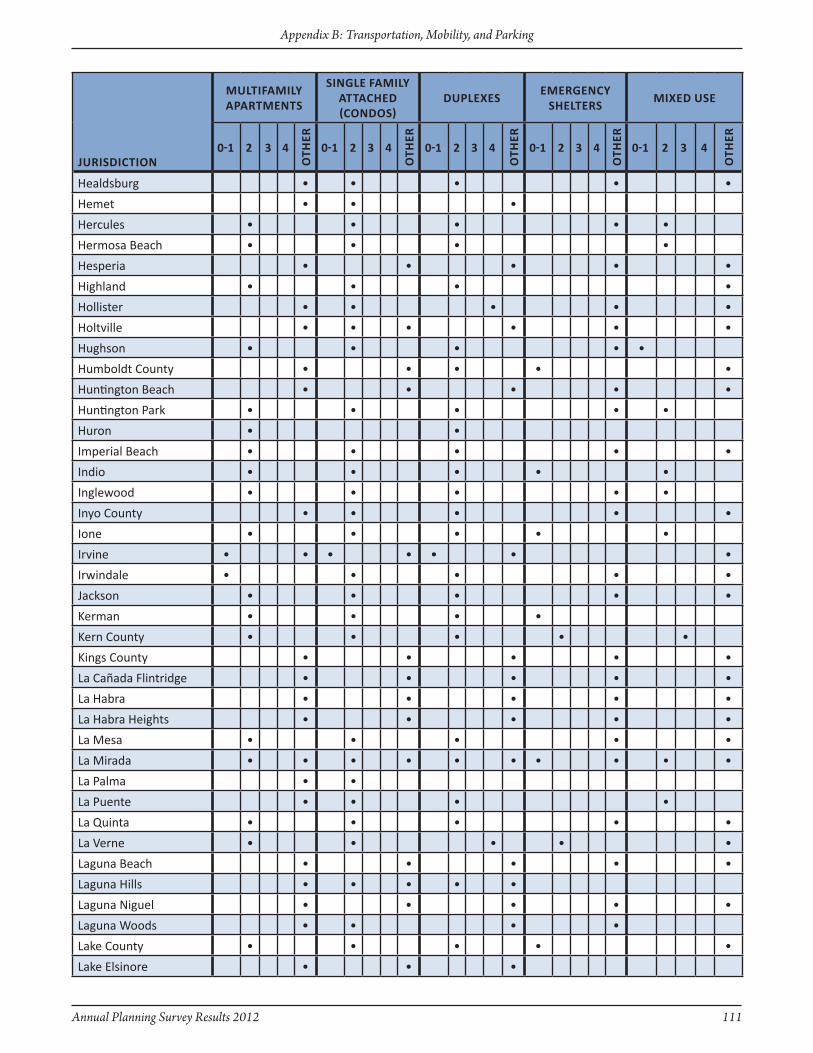
Annual Planning Survey Results 2012 111
Appendix B: Transportation, Mobility, and Parking
JuRisdictiOn
MultifAMily APARtMents
sinGle fAMily AttAched (cOndOs)
duPlexeseMeRGency
shelteRsMixed use
0-1 2 3 4
Oth
eR
0-1 2 3 4
Oth
eR
0-1 2 3 4
Oth
eR
0-1 2 3 4
Oth
eR
0-1 2 3 4
Oth
eR
Healdsburg • • • • •
Hemet • • •
Hercules • • • • •
Hermosa Beach • • • •
Hesperia • • • • •
Highland • • • •
Hollister • • • • •
Holtville • • • • • •
Hughson • • • • •
Humboldt County • • • • •
Huntington Beach • • • • •
Huntington Park • • • • •
Huron • •
Imperial Beach • • • • •
Indio • • • • •
Inglewood • • • • •
Inyo County • • • • •
Ione • • • • •
Irvine • • • • • • •
Irwindale • • • • •
Jackson • • • • •
Kerman • • • •
Kern County • • • • •
Kings County • • • • •
La Cañada Flintridge • • • • •
La Habra • • • • •
La Habra Heights • • • • •
La Mesa • • • • •
La Mirada • • • • • • • • • •
La Palma • •
La Puente • • • •
La Quinta • • • • •
La Verne • • • • •
Laguna Beach • • • • •
Laguna Hills • • • • •
Laguna Niguel • • • • •
Laguna Woods • • • •
Lake County • • • • •
Lake Elsinore • • •

112 Annual Planning Survey Results 2012
Appendix B: Transportation, Mobility, and Parking
JuRisdictiOn
MultifAMily APARtMents
sinGle fAMily AttAched (cOndOs)
duPlexeseMeRGency
shelteRsMixed use
0-1 2 3 4
Oth
eR
0-1 2 3 4
Oth
eR
0-1 2 3 4
Oth
eR
0-1 2 3 4
Oth
eR
0-1 2 3 4
Oth
eR
Lakeport • • • • •
Lakewood • • • •
Lancaster • • • • •
Larkspur • • • • •
Lassen County • • • • •
Lawndale • • • •
Lemon Grove • • • •
Lemoore • • • •
Lincoln • • • • •
Live Oak • • •
Livermore • • • • •
Livingston • • • • •
Lodi • • • • •
Lomita • • • • •
Lompoc • • • •
Long Beach • • • •
Loomis • • • • •
Los Alamitos • • •
Los Altos • • • •
Los Angeles • • • • •
Los Angeles County • • • • •
Los Banos • • • • •
Los Gatos • • • • •
Lynwood • •
Madera • • • • •
Malibu • • •
Manhattan Beach • • • • • • •
Manteca • • • • •
Marin County • • • • •
Marina • • • •
Mariposa County • • • • •
Martinez • • • •
Marysville • • • • •
Maywood • • • • •
Mendocino County • • •
Mendota • • • • •
Menifee • • • •
Menlo Park • • • •
Merced • • • • •
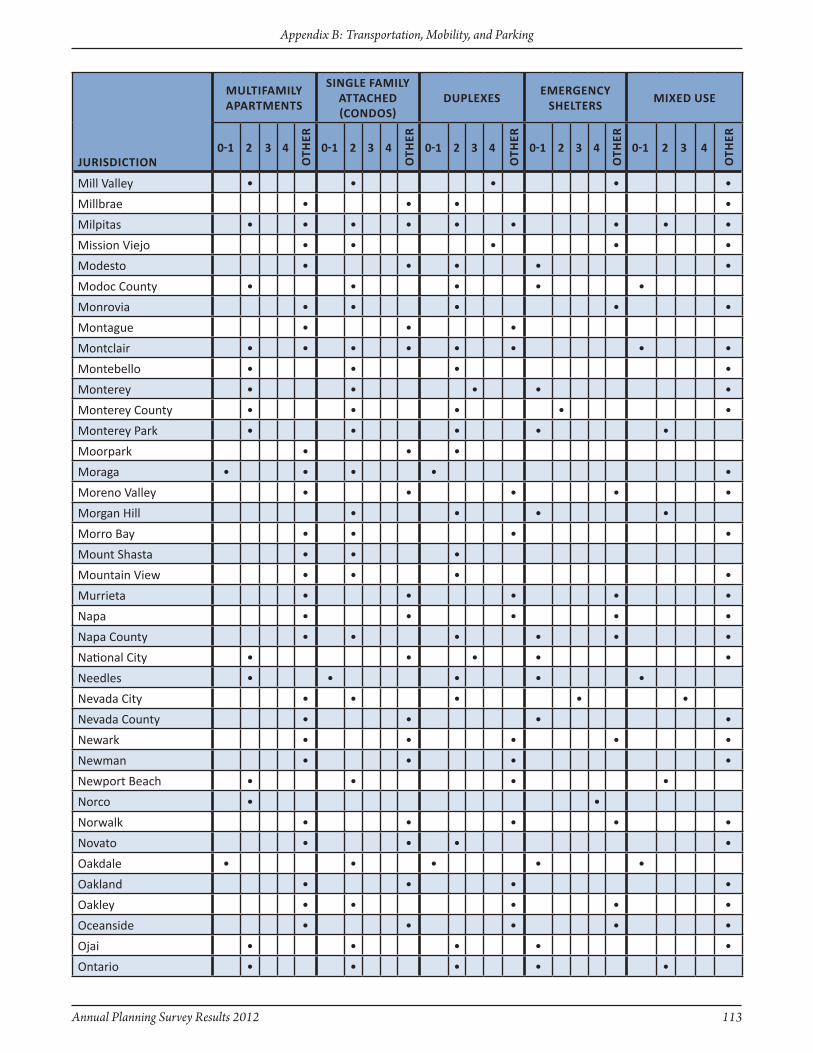
Annual Planning Survey Results 2012 113
Appendix B: Transportation, Mobility, and Parking
JuRisdictiOn
MultifAMily APARtMents
sinGle fAMily AttAched (cOndOs)
duPlexeseMeRGency
shelteRsMixed use
0-1 2 3 4
Oth
eR
0-1 2 3 4
Oth
eR
0-1 2 3 4
Oth
eR
0-1 2 3 4
Oth
eR
0-1 2 3 4
Oth
eR
Mill Valley • • • • •
Millbrae • • • •
Milpitas • • • • • • • • •
Mission Viejo • • • • •
Modesto • • • • •
Modoc County • • • • •
Monrovia • • • • •
Montague • • •
Montclair • • • • • • • •
Montebello • • • •
Monterey • • • • •
Monterey County • • • • •
Monterey Park • • • • •
Moorpark • • •
Moraga • • • • •
Moreno Valley • • • • •
Morgan Hill • • • •
Morro Bay • • • •
Mount Shasta • • •
Mountain View • • • •
Murrieta • • • • •
Napa • • • • •
Napa County • • • • • •
National City • • • • •
Needles • • • • •
Nevada City • • • • •
Nevada County • • • •
Newark • • • • •
Newman • • • •
Newport Beach • • • •
Norco • •
Norwalk • • • • •
Novato • • • •
Oakdale • • • • •
Oakland • • • •
Oakley • • • • •
Oceanside • • • • •
Ojai • • • • •
Ontario • • • • •
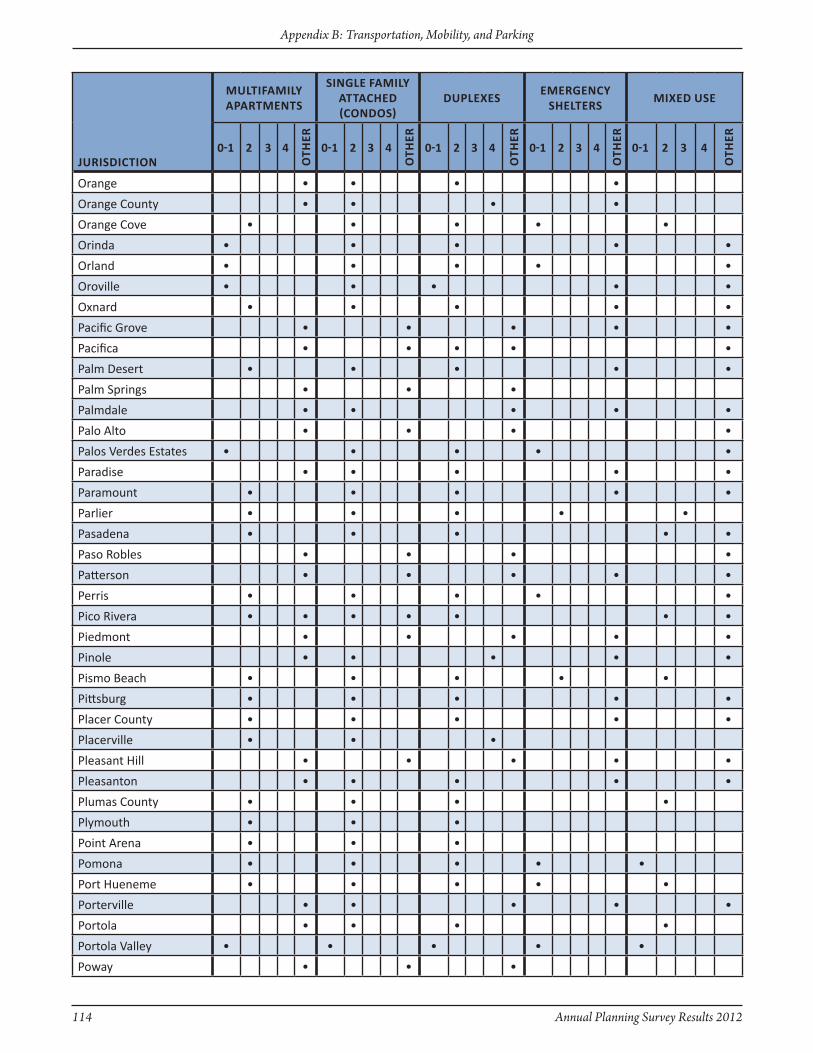
114 Annual Planning Survey Results 2012
Appendix B: Transportation, Mobility, and Parking
JuRisdictiOn
MultifAMily APARtMents
sinGle fAMily AttAched (cOndOs)
duPlexeseMeRGency
shelteRsMixed use
0-1 2 3 4
Oth
eR
0-1 2 3 4
Oth
eR
0-1 2 3 4
Oth
eR
0-1 2 3 4
Oth
eR
0-1 2 3 4
Oth
eR
Orange • • • •
Orange County • • • •
Orange Cove • • • • •
Orinda • • • • •
Orland • • • • •
Oroville • • • • •
Oxnard • • • • •
Pacific Grove • • • • •
Pacifica • • • • •
Palm Desert • • • • •
Palm Springs • • •
Palmdale • • • • •
Palo Alto • • • •
Palos Verdes Estates • • • • •
Paradise • • • • •
Paramount • • • • •
Parlier • • • • •
Pasadena • • • • •
Paso Robles • • • •
Patterson • • • • •
Perris • • • • •
Pico Rivera • • • • • • •
Piedmont • • • • •
Pinole • • • • •
Pismo Beach • • • • •
Pittsburg • • • • •
Placer County • • • • •
Placerville • • •
Pleasant Hill • • • • •
Pleasanton • • • • •
Plumas County • • • •
Plymouth • • •
Point Arena • • •
Pomona • • • • •
Port Hueneme • • • • •
Porterville • • • • •
Portola • • • •
Portola Valley • • • • •
Poway • • •

Annual Planning Survey Results 2012 115
Appendix B: Transportation, Mobility, and Parking
JuRisdictiOn
MultifAMily APARtMents
sinGle fAMily AttAched (cOndOs)
duPlexeseMeRGency
shelteRsMixed use
0-1 2 3 4
Oth
eR
0-1 2 3 4
Oth
eR
0-1 2 3 4
Oth
eR
0-1 2 3 4
Oth
eR
0-1 2 3 4
Oth
eR
Rancho Cordova • • • •
Rancho Cucamonga • • • • •
Rancho Mirage • • • • •
Rancho Palos Verdes • • • • •
Rancho Santa Margarita • • • • • •
Red Bluff • • • • •
Redding • • • • •
Redlands • • • •
Redondo Beach • • • •
Redwood City • • • • •
Reedley • • •
Rialto • • • • •
Richmond • • •
Ridgecrest • • • •
Riverbank • • • • •
Riverside • • • • •
Riverside County • • • •
Rocklin • • • • •
Rohnert Park • • • •
Rolling Hills • • • • •
Rolling Hills Estates • • • • •
Rosemead • • • •
Roseville • • • • •
Ross • • • •
Sacramento County • • • • • •
Salinas • • • • • • • •
San Anselmo • • • •
San Benito County • • • •
San Bernardino • • • •
San Bernardino County • • • • •
San Bruno • • •
San Clemente • • • • •
San Diego • • • • •
San Diego County • • • •
San Dimas • • • • •
San Fernando • • • •
San Francisco • • • • •
San Gabriel • • • • •
San Jacinto • • • • •
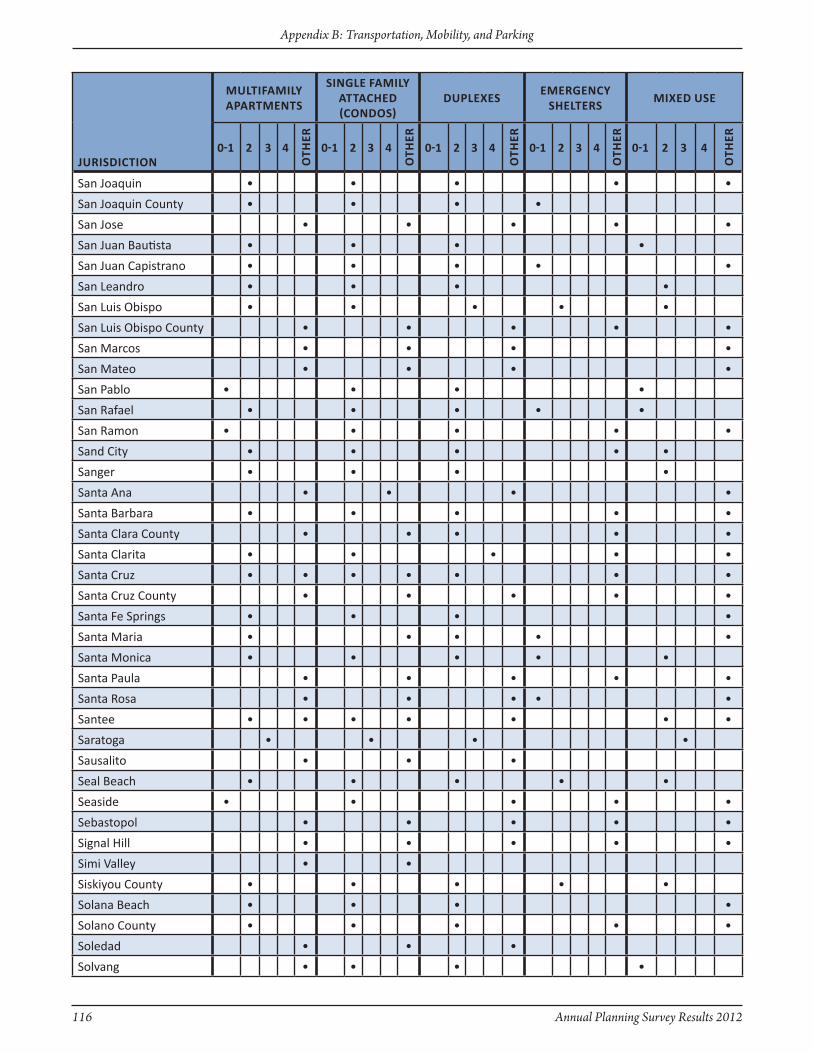
116 Annual Planning Survey Results 2012
Appendix B: Transportation, Mobility, and Parking
JuRisdictiOn
MultifAMily APARtMents
sinGle fAMily AttAched (cOndOs)
duPlexeseMeRGency
shelteRsMixed use
0-1 2 3 4
Oth
eR
0-1 2 3 4
Oth
eR
0-1 2 3 4
Oth
eR
0-1 2 3 4
Oth
eR
0-1 2 3 4
Oth
eR
San Joaquin • • • • •
San Joaquin County • • • •
San Jose • • • • •
San Juan Bautista • • • •
San Juan Capistrano • • • • •
San Leandro • • • •
San Luis Obispo • • • • •
San Luis Obispo County • • • • •
San Marcos • • • •
San Mateo • • • •
San Pablo • • • •
San Rafael • • • • •
San Ramon • • • • •
Sand City • • • • •
Sanger • • • •
Santa Ana • • • •
Santa Barbara • • • • •
Santa Clara County • • • • •
Santa Clarita • • • • •
Santa Cruz • • • • • • •
Santa Cruz County • • • • •
Santa Fe Springs • • • •
Santa Maria • • • • •
Santa Monica • • • • •
Santa Paula • • • • •
Santa Rosa • • • • •
Santee • • • • • • •
Saratoga • • • •
Sausalito • • •
Seal Beach • • • • •
Seaside • • • • •
Sebastopol • • • • •
Signal Hill • • • • •
Simi Valley • •
Siskiyou County • • • • •
Solana Beach • • • •
Solano County • • • • •
Soledad • • •
Solvang • • • •
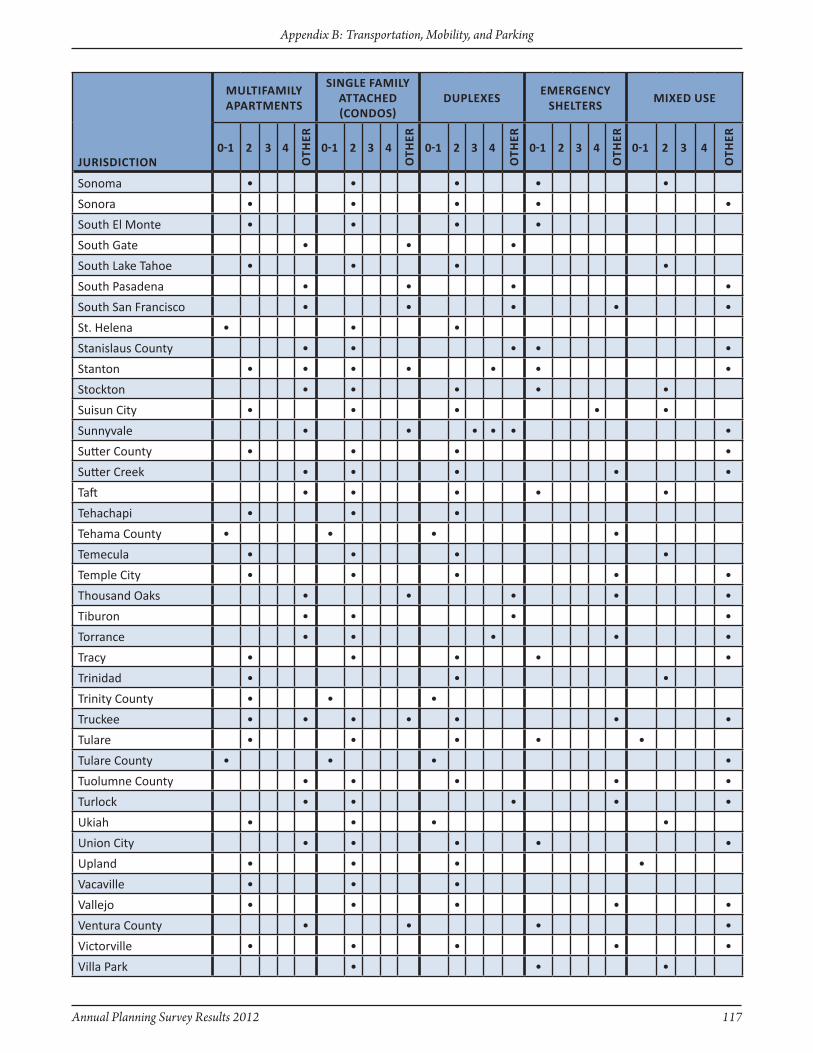
Annual Planning Survey Results 2012 117
Appendix B: Transportation, Mobility, and Parking
JuRisdictiOn
MultifAMily APARtMents
sinGle fAMily AttAched (cOndOs)
duPlexeseMeRGency
shelteRsMixed use
0-1 2 3 4
Oth
eR
0-1 2 3 4
Oth
eR
0-1 2 3 4
Oth
eR
0-1 2 3 4
Oth
eR
0-1 2 3 4
Oth
eR
Sonoma • • • • •
Sonora • • • • •
South El Monte • • • •
South Gate • • •
South Lake Tahoe • • • •
South Pasadena • • • •
South San Francisco • • • • •
St. Helena • • •
Stanislaus County • • • • •
Stanton • • • • • • •
Stockton • • • • •
Suisun City • • • • •
Sunnyvale • • • • • •
Sutter County • • • •
Sutter Creek • • • • •
Taft • • • • •
Tehachapi • • •
Tehama County • • • •
Temecula • • • •
Temple City • • • • •
Thousand Oaks • • • • •
Tiburon • • • •
Torrance • • • • •
Tracy • • • • •
Trinidad • • •
Trinity County • • •
Truckee • • • • • • •
Tulare • • • • •
Tulare County • • • •
Tuolumne County • • • • •
Turlock • • • • •
Ukiah • • • •
Union City • • • • •
Upland • • • •
Vacaville • • •
Vallejo • • • • •
Ventura County • • • •
Victorville • • • • •
Villa Park • • •
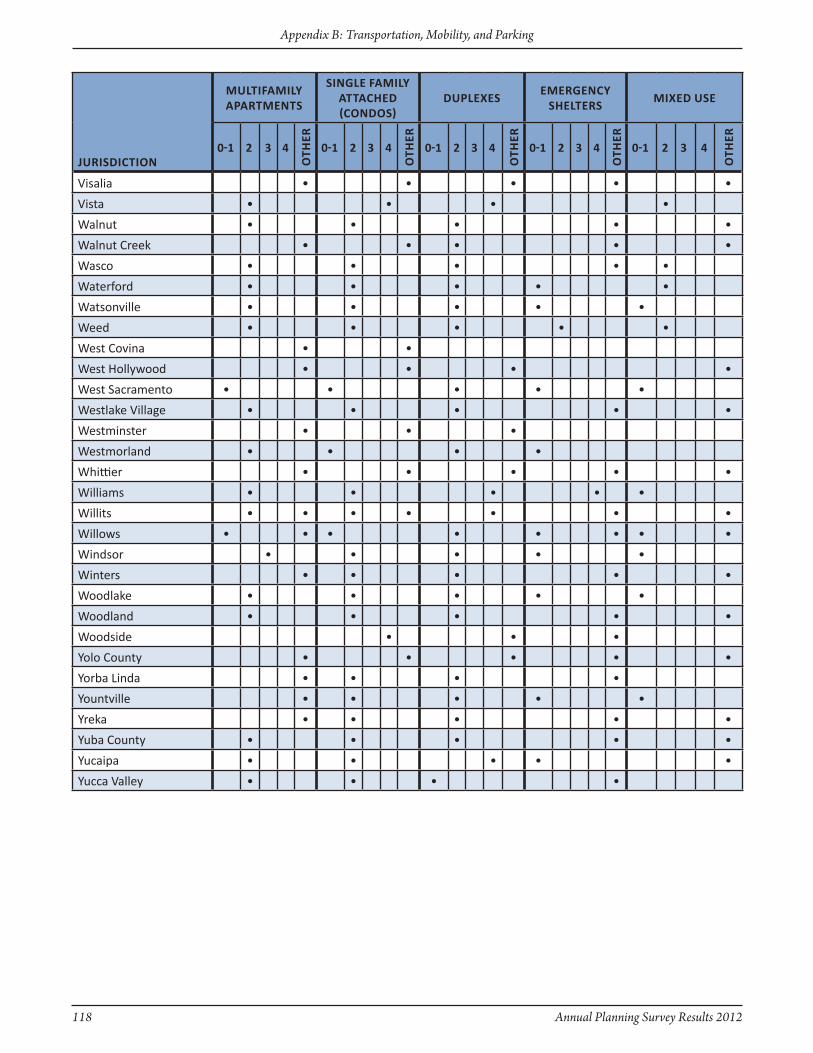
118 Annual Planning Survey Results 2012
Appendix B: Transportation, Mobility, and Parking
JuRisdictiOn
MultifAMily APARtMents
sinGle fAMily AttAched (cOndOs)
duPlexeseMeRGency
shelteRsMixed use
0-1 2 3 4
Oth
eR
0-1 2 3 4
Oth
eR
0-1 2 3 4
Oth
eR
0-1 2 3 4
Oth
eR
0-1 2 3 4
Oth
eR
Visalia • • • • •
Vista • • • •
Walnut • • • • •
Walnut Creek • • • • •
Wasco • • • • •
Waterford • • • • •
Watsonville • • • • •
Weed • • • • •
West Covina • •
West Hollywood • • • •
West Sacramento • • • • •
Westlake Village • • • • •
Westminster • • •
Westmorland • • • •
Whittier • • • • •
Williams • • • • •
Willits • • • • • • •
Willows • • • • • • • •
Windsor • • • • •
Winters • • • • •
Woodlake • • • • •
Woodland • • • • •
Woodside • • •
Yolo County • • • • •
Yorba Linda • • • •
Yountville • • • • •
Yreka • • • • •
Yuba County • • • • •
Yucaipa • • • • •
Yucca Valley • • • •
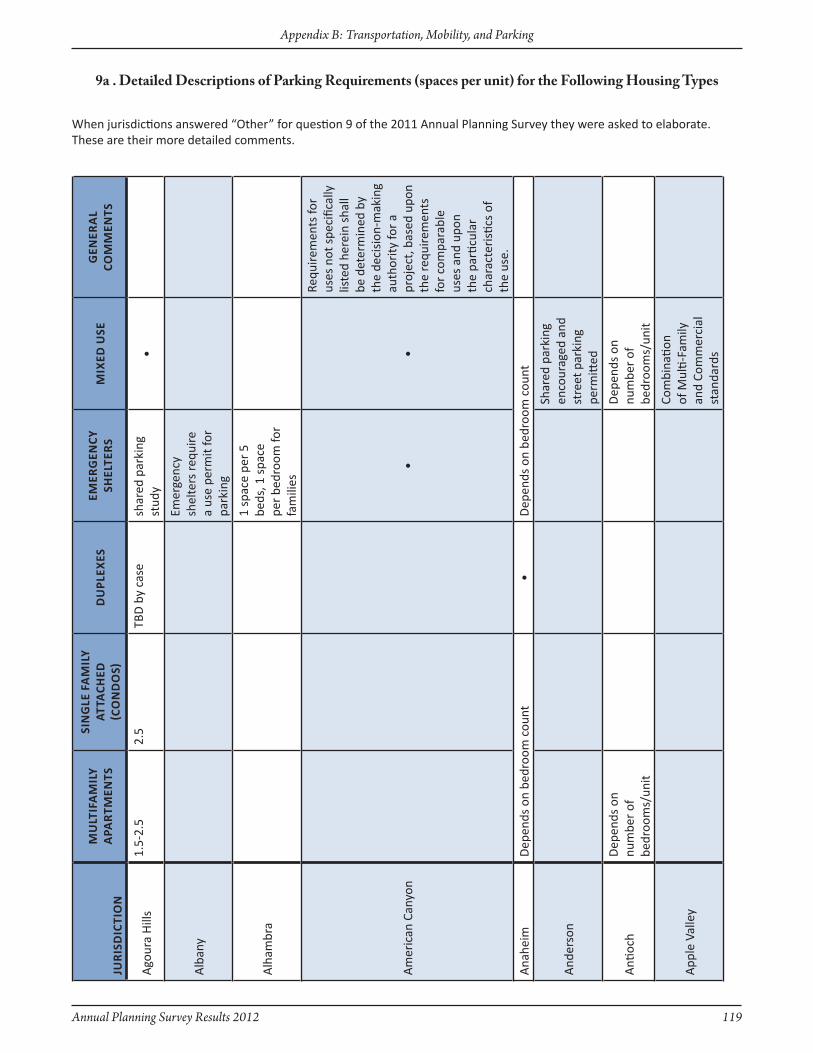
Annual Planning Survey Results 2012 119
Appendix B: Transportation, Mobility, and Parking
9a . Detailed Descriptions of Parking Requirements (spaces per unit) for the Following Housing Types
When jurisdictions answered “Other” for question 9 of the 2011 Annual Planning Survey they were asked to elaborate. These are their more detailed comments.
JuR
isd
icti
On
Mu
ltif
AM
ily
APA
RtM
ents
sin
Gle
fA
Mil
y At
tAch
ed
(cO
nd
Os)
du
Plex
eseM
eRG
ency
sh
elte
Rs
Mix
ed u
seG
eneR
Al
cOM
Men
ts
Ago
ura
Hill
s1.
5-2.
52.
5TB
D b
y ca
sesh
ared
par
king
st
udy
•
Alb
any
Emer
genc
y sh
elte
rs re
quire
a
use
perm
it fo
r pa
rkin
g
Alh
ambr
a
1 sp
ace
per
5 be
ds, 1
spa
ce
per
bedr
oom
for
fam
ilies
Am
eric
an C
anyo
n•
•
Requ
irem
ents
for
uses
not
spe
cific
ally
lis
ted
here
in s
hall
be d
eter
min
ed b
y th
e de
cisi
on-m
akin
g au
thor
ity fo
r a
proj
ect,
bas
ed u
pon
the
requ
irem
ents
fo
r co
mpa
rabl
e us
es a
nd u
pon
the
parti
cula
r ch
arac
teri
stics
of
the
use.
Ana
heim
Dep
ends
on
bedr
oom
cou
nt•
Dep
ends
on
bedr
oom
cou
nt
And
erso
n
Shar
ed p
arki
ng
enco
urag
ed a
nd
stre
et p
arki
ng
perm
itted
Anti
och
Dep
ends
on
num
ber
of
bedr
oom
s/un
it
Dep
ends
on
num
ber
of
bedr
oom
s/un
it
App
le V
alle
y
Com
bina
tion
of M
ulti-
Fam
ily
and
Com
mer
cial
st
anda
rds

120 Annual Planning Survey Results 2012
Appendix B: Transportation, Mobility, and Parking
JuR
isd
icti
On
Mu
ltif
AM
ily
APA
RtM
ents
sin
Gle
fA
Mil
y At
tAch
ed
(cO
nd
OM
iniu
Ms)
du
Plex
eseM
eRG
ency
sh
elte
Rs
Mix
ed u
seG
eneR
Al
cOM
Men
ts
Arc
adia
2 sp
aces
+ 1
/2 g
uest
spa
ce2/
1,00
0 gr
oss
sq. ft
1.5
+ 1/
2 gu
est
Arc
ata
Thes
e ar
e in
clud
ed
in o
ur Im
plem
entin
g O
rdin
ance
Art
esia
Dep
endi
ng o
n zo
ning
an
d us
e ca
tego
ry
Arv
inW
ill b
e ad
dres
sed
in th
e ne
w L
and
Use
Pla
n
Atas
cade
roPa
rkin
g sp
aces
on
bedr
oom
s, n
ot u
nits
and
use
s
Aub
urn
Det
erm
ined
by
Plan
ning
Com
mis
sion
Com
bina
tion
of th
e in
divi
dual
use
s
Azu
sa2
spac
es +
1 s
pace
per
5
beds
Shar
ed P
arki
ng
Prov
isio
ns
Bake
rsfie
ldPa
rkin
g fo
r offi
ce o
nly
50%
of r
equi
rem
ent
base
d on
use
Bald
win
Par
k
Our
Cod
e do
esn'
t cur
rent
ly h
ave
a m
ixed
us
e zo
ne o
r al
low
em
erge
ncy
shel
ters
yet
. W
e're
cur
rent
ly u
nder
goin
g th
e Co
de u
pdat
e pr
oces
s.
Bann
ing
1,2,
3,4
base
d on
nu
mbe
r of
bed
room
s1,
2,3,
4 ba
sed
on
num
ber
of b
edro
oms
1.5
Bars
tow
Wor
king
on
2 pe
r un
it +
as
requ
ired
for
com
mer
cial
use
Beau
mon
t
Mut
lifam
ily e
ffcie
ncy
and
1-be
droo
m a
re
1.25
spa
ces
per
unit;
m
ultif
amily
2 o
r m
ore
room
s ar
e 2.
5 sp
aces
pe
r un
it
Curr
ently
bei
ng
dete
rmin
ed
•
Bell
Plus
1 g
uest
spa
ce/3
uni
ts1/
200
for
com
mer
cial
re
tail
use
+ 1
gues
t sp
ace/
3 un
its
Bell
Gar
dens
2 sp
aces
per
DU
Bellfl
ower
Plus
add
ition
al s
pace
s•
Vari
es

Annual Planning Survey Results 2012 121
Appendix B: Transportation, Mobility, and Parking
JuR
isd
icti
On
Mu
ltif
AM
ily
APA
RtM
ents
sin
Gle
fA
Mil
y At
tAch
ed
(cO
nd
OM
iniu
Ms)
du
Plex
eseM
eRG
ency
sh
elte
Rs
Mix
ed u
seG
eneR
Al
cOM
Men
ts
Belm
ont
1 ga
rage
, one
cov
ered
2 ga
rage
, 2 d
rive
way
TBD
Via
plan
ned
deve
lopm
ent
Beni
cia
3 be
droo
ms:
21.
5
•
http:
//w
ww
.co
depu
blis
hing
.com
/ca
/ben
icia
/
Stud
ios:
1.2
: Gro
up
Resi
denti
al 1
per
2
beds
and
1 p
er 1
00
sq. ft
.
Big
Bear
Lak
e1:
250
sq. ft
. gfa
By p
arki
ng s
tudy
Braw
ley
••
••
•
1.5
Spac
es fo
r St
udio
, 1.
75 S
pace
s fo
r 1
Bedr
oom
, and
2
Spac
es fo
r 2
Bedr
oom
or
mor
e, o
ther
use
s va
ry
Brea
1 sp
ace
per
4 be
dsSh
ared
par
king
st
udie
s
Bris
bane
1-2
spac
es ti
ed to
be
droo
m c
ount
2-4
spac
es ti
ed to
be
droo
m c
ount
1-2
spac
es ti
ed to
be
droo
m c
ount
Ord
inan
ce in
pro
cess
1-2
spac
es ti
ed to
be
droo
m c
ount
Buel
lton
1 be
droo
m =
1 s
pace
, 2
bedr
oom
= 2
spa
ces,
3
or m
ore
bedr
oom
s =
2.5
spac
es
1 fo
r ev
ery
4 be
ds
and
1 fo
r ev
ery
2 em
ploy
ees
Buen
a Pa
rk2-
3 de
pend
ing
on
bedr
oom
s3-
3.5
2-3
spac
esVa
ries
Burb
ank
Slid
ing
scal
e, p
lus
addi
tiona
l .25
gue
sts/
unit
1 pa
rkin
g sp
ace
per
5 be
ds if
acc
eptin
g w
alk-
in's
, 1 s
pace
pe
r 10
bed
s if
not
acce
pting
wal
k-in
's
Burl
inga
me
Vary
bas
ed o
n nu
mbe
r of
bed
room
s 1-
2 sp
aces
1 pe
r 3
beds
Redu
ced
res.
reqm
t do
wnt
own,
pkg
for
reta
il offi
ce p
er c
ode
Butt
e Co
unty
••
We
are
upda
ting
the
z.O
. new
sta
ndar
ds
expe
cted
201
2

122 Annual Planning Survey Results 2012
Appendix B: Transportation, Mobility, and Parking
JuR
isd
icti
On
Mu
ltif
AM
ily
APA
RtM
ents
sin
Gle
fA
Mil
y At
tAch
ed
(cO
nd
OM
iniu
Ms)
du
Plex
eseM
eRG
ency
sh
elte
Rs
Mix
ed u
seG
eneR
Al
cOM
Men
ts
Cala
basa
s
Stud
io u
nit:
1 c
over
ed
spac
e/un
it; O
ne
Bedr
oom
: 1.5
spa
ces/
unit,
1 o
f whi
ch s
hall
be c
over
ed; T
wo
or
mor
e be
droo
ms:
2
spac
es fo
r ea
ch
bedr
oom
ove
r tw
o, 1
of
eve
ry 2
spa
ces
shal
l be
cov
ered
; gue
st
park
ing:
1 s
pace
/3
units
As
requ
ired
for
mul
ti-fa
mily
hou
sing
. Ea
ch d
rive
way
with
m
inim
um d
imen
sion
s of
20'
x 2
0' o
utsi
de
of a
pub
lic R
OW
or
priv
ate
stre
et m
ay b
e co
unte
d as
a g
uest
pa
rkin
g sp
ace
Stud
io u
nit:
1 c
over
ed
spac
e/un
it; O
ne
Bedr
oom
: 1.5
spa
ces/
unit,
1 o
f whi
ch s
hall
be c
over
ed; T
wo
or
mor
e be
droo
ms:
2
spac
es fo
r ea
ch
bedr
oom
ove
r tw
o, 1
of
eve
ry 2
spa
ces
shal
l be
cov
ered
; gue
st
park
ing:
1 s
pace
/3
units
1 sp
ace
for
each
250
sq
. ft. o
f gro
ss fl
oor
area
Subj
ect t
o th
e in
divi
dual
use
.
Calim
esa
Base
d on
num
ber
of b
edro
oms,
als
o in
clud
es g
uest
spa
ces
Cam
arill
oBa
sed
on s
ize
of
shel
ter
Base
d on
type
of
mix
ed u
se
Capi
tola
Park
ing
stud
y
Carl
sbad
•
Carp
inte
ria
One
spa
ce fo
r 1
bedr
oom
, Tw
o sp
aces
for
2+ b
edro
oms
Sam
e ab
ove
othe
r ho
usin
g ty
pes
and
1 pe
r 25
0 sq
uare
feet
co
mm
erci
al
Cars
onVa
ries
Vari
esVa
ries
Cere
sM
ulti-
Fam
ily u
nits
is
1.5
spac
es p
er u
nit
••
Vari
es
Chic
o1
per
bedr
oom
, up
to 2
•Fo
llow
s us
e re
quire
men
ts
Chin
o H
ills
+1 g
uest
spa
ce/2
uni
tsBa
sed
on s
quar
e fo
otag
e+1
gue
st s
pace
/2 u
nits
Base
d on
pro
posa
ls
Chow
chill
a
Num
ber
of b
edro
oms
Num
ber
of b
edro
oms
•
Char
acte
risti
cs o
f th
e pr
ojec
t and
in
acco
rdan
ce w
ith o
ur
zoni
ng o
rdin
ance
Chul
a Vi
sta
Shel
ters
by
squa
re
foot
age
Resi
denti
al s
tnds
. in
crea
se if
mor
e be
droo
ms/
unit.
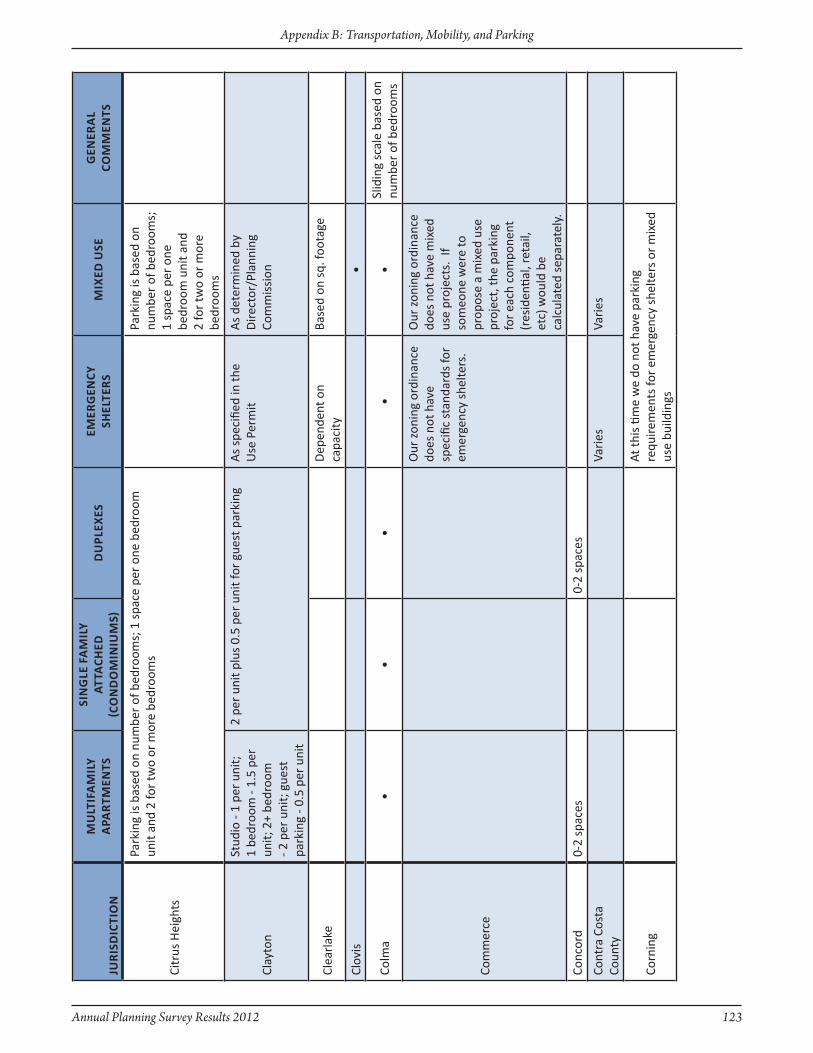
Annual Planning Survey Results 2012 123
Appendix B: Transportation, Mobility, and Parking
JuR
isd
icti
On
Mu
ltif
AM
ily
APA
RtM
ents
sin
Gle
fA
Mil
y At
tAch
ed
(cO
nd
OM
iniu
Ms)
du
Plex
eseM
eRG
ency
sh
elte
Rs
Mix
ed u
seG
eneR
Al
cOM
Men
ts
Citr
us H
eigh
ts
Park
ing
is b
ased
on
num
ber
of b
edro
oms;
1 s
pace
per
one
bed
room
un
it an
d 2
for
two
or m
ore
bedr
oom
sPa
rkin
g is
bas
ed o
n nu
mbe
r of
bed
room
s;
1 sp
ace
per
one
bedr
oom
uni
t and
2
for
two
or m
ore
bedr
oom
s
Clay
ton
Stud
io -
1 pe
r un
it;
1 be
droo
m -
1.5
per
unit;
2+
bedr
oom
- 2
per
uni
t; g
uest
pa
rkin
g - 0
.5 p
er u
nit
2 pe
r un
it pl
us 0
.5 p
er u
nit f
or g
uest
par
king
As
spec
ified
in th
e U
se P
erm
itA
s de
term
ined
by
Dire
ctor
/Pla
nnin
g Co
mm
issi
on
Clea
rlak
eD
epen
dent
on
capa
city
Base
d on
sq.
foot
age
Clov
is•
Colm
a•
••
••
Slid
ing
scal
e ba
sed
on
num
ber
of b
edro
oms
Com
mer
ce
Our
zon
ing
ordi
nanc
e do
es n
ot h
ave
spec
ific
stan
dard
s fo
r em
erge
ncy
shel
ters
.
Our
zon
ing
ordi
nanc
e do
es n
ot h
ave
mix
ed
use
proj
ects
. If
som
eone
wer
e to
pr
opos
e a
mix
ed u
se
proj
ect,
the
park
ing
for
each
com
pone
nt
(res
iden
tial,
reta
il,
etc)
wou
ld b
e ca
lcul
ated
sep
arat
ely.
Conc
ord
0-2
spac
es0-
2 sp
aces
Cont
ra C
osta
Co
unty
Vari
esVa
ries
Corn
ing
At th
is ti
me
we
do n
ot h
ave
park
ing
requ
irem
ents
for
emer
genc
y sh
elte
rs o
r m
ixed
us
e bu
ildin
gs
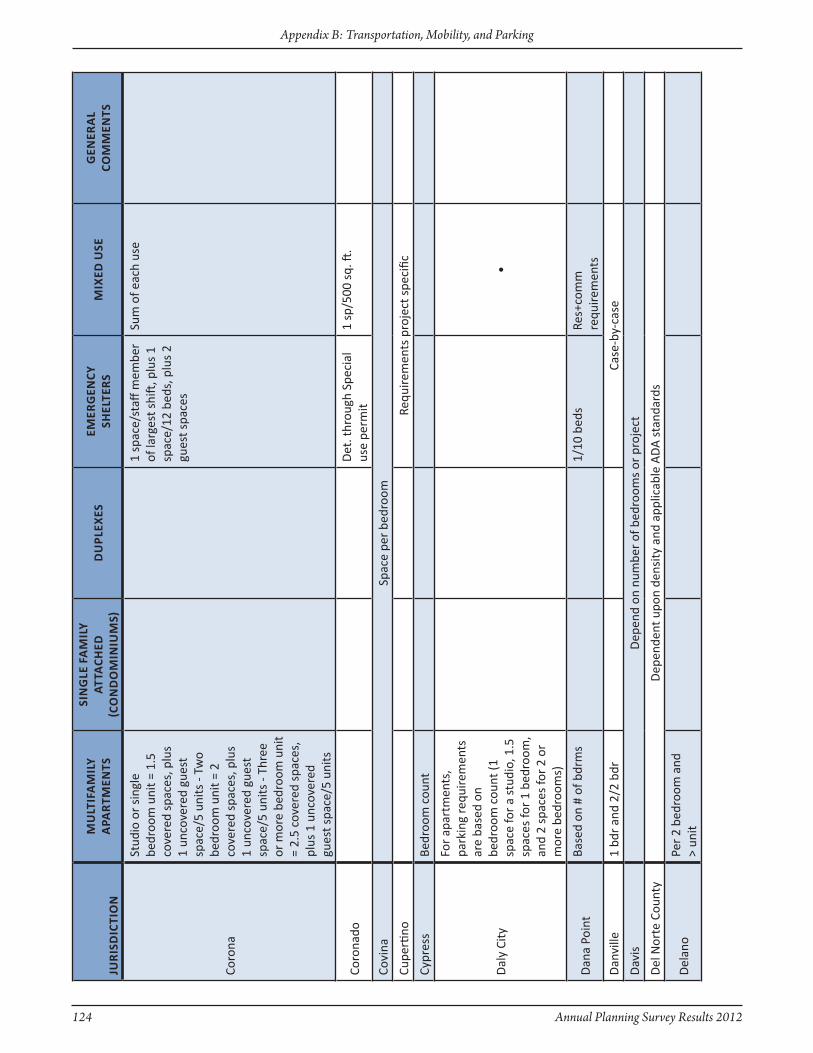
124 Annual Planning Survey Results 2012
Appendix B: Transportation, Mobility, and Parking
JuR
isd
icti
On
Mu
ltif
AM
ily
APA
RtM
ents
sin
Gle
fA
Mil
y At
tAch
ed
(cO
nd
OM
iniu
Ms)
du
Plex
eseM
eRG
ency
sh
elte
Rs
Mix
ed u
seG
eneR
Al
cOM
Men
ts
Coro
na
Stud
io o
r si
ngle
be
droo
m u
nit =
1.5
co
vere
d sp
aces
, plu
s 1
unco
vere
d gu
est
spac
e/5
units
- Tw
o be
droo
m u
nit =
2
cove
red
spac
es, p
lus
1 un
cove
red
gues
t sp
ace/
5 un
its -
Thre
e or
mor
e be
droo
m u
nit
= 2.
5 co
vere
d sp
aces
, pl
us 1
unc
over
ed
gues
t spa
ce/5
uni
ts
1 sp
ace/
staff
mem
ber
of la
rges
t shi
ft, p
lus
1 sp
ace/
12 b
eds,
plu
s 2
gues
t spa
ces
Sum
of e
ach
use
Coro
nado
Det
. thr
ough
Spe
cial
us
e pe
rmit
1 sp
/500
sq.
ft.
Covi
naSp
ace
per
bedr
oom
Cupe
rtino
Requ
irem
ents
pro
ject
spe
cific
Cypr
ess
Bedr
oom
cou
nt
Dal
y Ci
ty
For
apar
tmen
ts,
park
ing
requ
irem
ents
ar
e ba
sed
on
bedr
oom
cou
nt (1
sp
ace
for
a st
udio
, 1.5
sp
aces
for
1 be
droo
m,
and
2 sp
aces
for
2 or
m
ore
bedr
oom
s)
•
Dan
a Po
int
Base
d on
# o
f bdr
ms
1/10
bed
sRe
s+co
mm
re
quire
men
ts
Dan
ville
1 bd
r an
d 2/
2 bd
rCa
se-b
y-ca
se
Dav
isD
epen
d on
num
ber
of b
edro
oms
or p
roje
ct
Del
Nor
te C
ount
yD
epen
dent
upo
n de
nsity
and
app
licab
le A
DA
sta
ndar
ds
Del
ano
Per
2 be
droo
m a
nd
> un
it
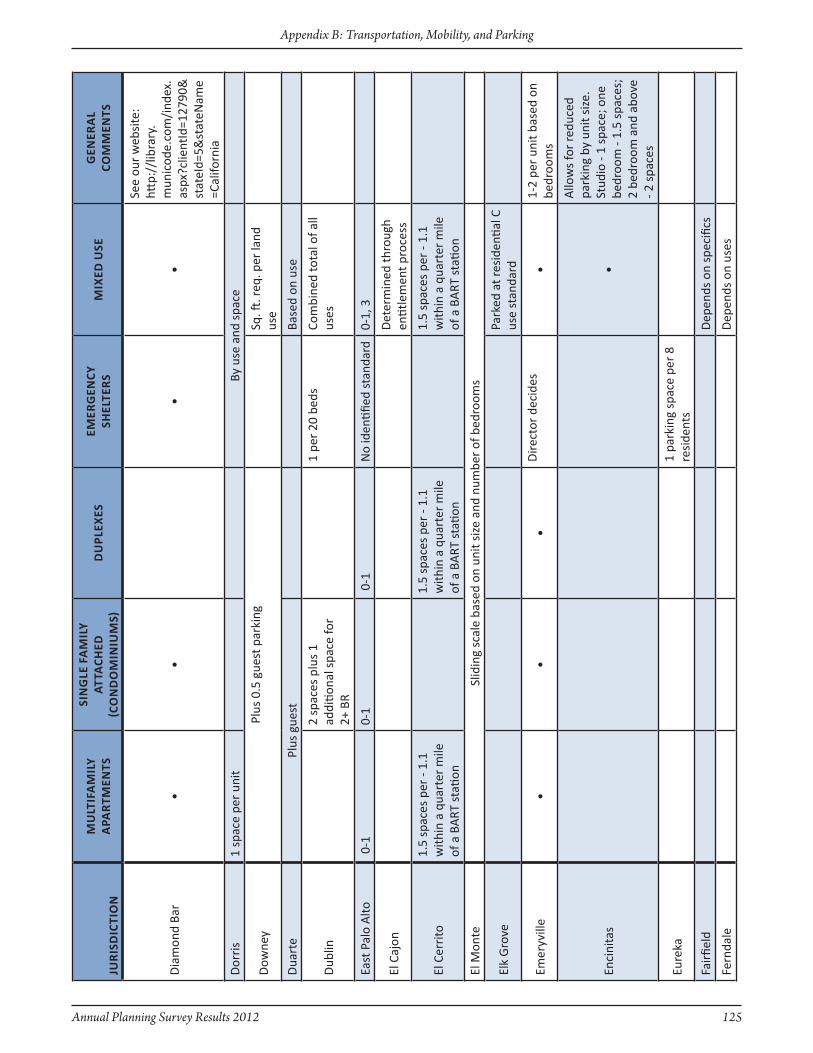
Annual Planning Survey Results 2012 125
Appendix B: Transportation, Mobility, and Parking
JuR
isd
icti
On
Mu
ltif
AM
ily
APA
RtM
ents
sin
Gle
fA
Mil
y At
tAch
ed
(cO
nd
OM
iniu
Ms)
du
Plex
eseM
eRG
ency
sh
elte
Rs
Mix
ed u
seG
eneR
Al
cOM
Men
ts
Dia
mon
d Ba
r•
••
•
See
our
web
site
: htt
p://
libra
ry.
mun
icod
e.co
m/i
ndex
.as
px?c
lient
Id=1
2790
&st
ateI
d=5&
stat
eNam
e=C
alifo
rnia
Dor
ris
1 sp
ace
per
unit
By u
se a
nd s
pace
Dow
ney
Plus
0.5
gue
st p
arki
ngSq
. ft. r
eq. p
er la
nd
use
Dua
rte
Plus
gue
stBa
sed
on u
se
Dub
lin2
spac
es p
lus
1 ad
ditio
nal s
pace
for
2+ B
R
1 pe
r 20
bed
sCo
mbi
ned
tota
l of a
ll us
es
East
Pal
o A
lto 0
-10-
1 0
-1N
o id
entifi
ed s
tand
ard
0-1,
3
El C
ajon
Det
erm
ined
thro
ugh
entit
lem
ent p
roce
ss
El C
erri
to1.
5 sp
aces
per
- 1.
1 w
ithin
a q
uart
er m
ile
of a
BA
RT s
tatio
n
1.5
spac
es p
er -
1.1
with
in a
qua
rter
mile
of
a B
ART
sta
tion
1.5
spac
es p
er -
1.1
with
in a
qua
rter
mile
of
a B
ART
sta
tion
El M
onte
Slid
ing
scal
e ba
sed
on u
nit s
ize
and
num
ber
of b
edro
oms
Elk
Gro
vePa
rked
at r
esid
entia
l C
use
stan
dard
Emer
yvill
e•
••
Dire
ctor
dec
ides
•1-
2 pe
r un
it ba
sed
on
bedr
oom
s
Enci
nita
s•
Allo
ws
for
redu
ced
park
ing
by u
nit s
ize.
St
udio
- 1
spac
e; o
ne
bedr
oom
- 1.
5 sp
aces
; 2
bedr
oom
and
abo
ve
- 2 s
pace
s
Eure
ka1
park
ing
spac
e pe
r 8
resi
dent
s
Fair
field
Dep
ends
on
spec
ifics
Fern
dale
Dep
ends
on
uses
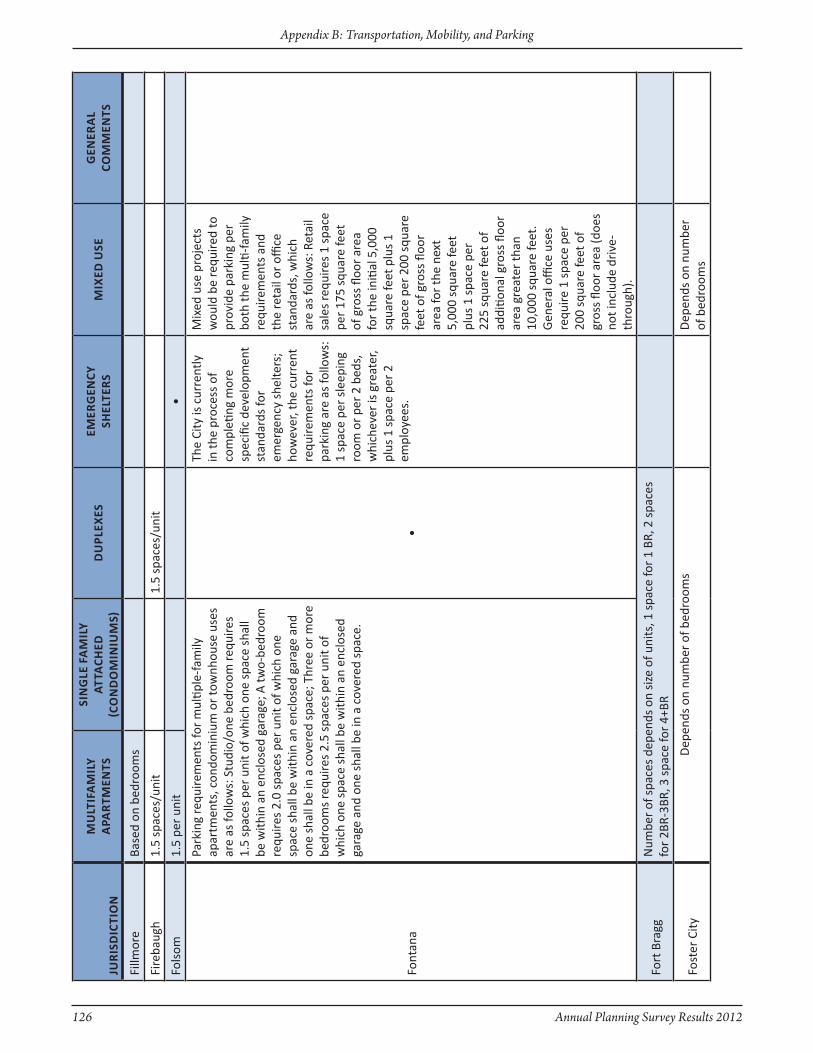
126 Annual Planning Survey Results 2012
Appendix B: Transportation, Mobility, and Parking
JuR
isd
icti
On
Mu
ltif
AM
ily
APA
RtM
ents
sin
Gle
fA
Mil
y At
tAch
ed
(cO
nd
OM
iniu
Ms)
du
Plex
eseM
eRG
ency
sh
elte
Rs
Mix
ed u
seG
eneR
Al
cOM
Men
ts
Fillm
ore
Base
d on
bed
room
s
Fire
baug
h1.
5 sp
aces
/uni
t1.
5 sp
aces
/uni
t
Fols
om1.
5 pe
r un
it•
Font
ana
Park
ing
requ
irem
ents
for
mul
tiple
-fam
ily
apar
tmen
ts, c
ondo
min
ium
or
tow
nhou
se u
ses
are
as fo
llow
s: S
tudi
o/on
e be
droo
m re
quire
s 1.
5 sp
aces
per
uni
t of w
hich
one
spa
ce s
hall
be w
ithin
an
encl
osed
gar
age;
A tw
o-be
droo
m
requ
ires
2.0
spac
es p
er u
nit o
f whi
ch o
ne
spac
e sh
all b
e w
ithin
an
encl
osed
gar
age
and
one
shal
l be
in a
cov
ered
spa
ce; T
hree
or
mor
e be
droo
ms
requ
ires
2.5
spac
es p
er u
nit o
f w
hich
one
spa
ce s
hall
be w
ithin
an
encl
osed
ga
rage
and
one
sha
ll be
in a
cov
ered
spa
ce.
•
The
City
is c
urre
ntly
in
the
proc
ess
of
com
pleti
ng m
ore
spec
ific
deve
lopm
ent
stan
dard
s fo
r em
erge
ncy
shel
ters
; ho
wev
er, t
he c
urre
nt
requ
irem
ents
for
park
ing
are
as fo
llow
s:
1 sp
ace
per
slee
ping
ro
om o
r pe
r 2
beds
, w
hich
ever
is g
reat
er,
plus
1 s
pace
per
2
empl
oyee
s.
Mix
ed u
se p
roje
cts
wou
ld b
e re
quire
d to
pr
ovid
e pa
rkin
g pe
r bo
th th
e m
ulti-
fam
ily
requ
irem
ents
and
th
e re
tail
or o
ffice
st
anda
rds,
whi
ch
are
as fo
llow
s: R
etai
l sa
les
requ
ires
1 sp
ace
per
175
squa
re fe
et
of g
ross
floo
r ar
ea
for
the
initi
al 5
,000
sq
uare
feet
plu
s 1
spac
e pe
r 20
0 sq
uare
fe
et o
f gro
ss fl
oor
area
for
the
next
5,
000
squa
re fe
et
plus
1 s
pace
per
22
5 sq
uare
feet
of
addi
tiona
l gro
ss fl
oor
area
gre
ater
than
10
,000
squ
are
feet
. G
ener
al o
ffice
use
s re
quire
1 s
pace
per
20
0 sq
uare
feet
of
gros
s flo
or a
rea
(doe
s no
t inc
lude
dri
ve-
thro
ugh)
.
Fort
Bra
ggN
umbe
r of
spa
ces
depe
nds
on s
ize
of u
nits
, 1 s
pace
for
1 BR
, 2 s
pace
s fo
r 2B
R-3B
R, 3
spa
ce fo
r 4+
BR
Fost
er C
ityD
epen
ds o
n nu
mbe
r of
bed
room
sD
epen
ds o
n nu
mbe
r of
bed
room
s
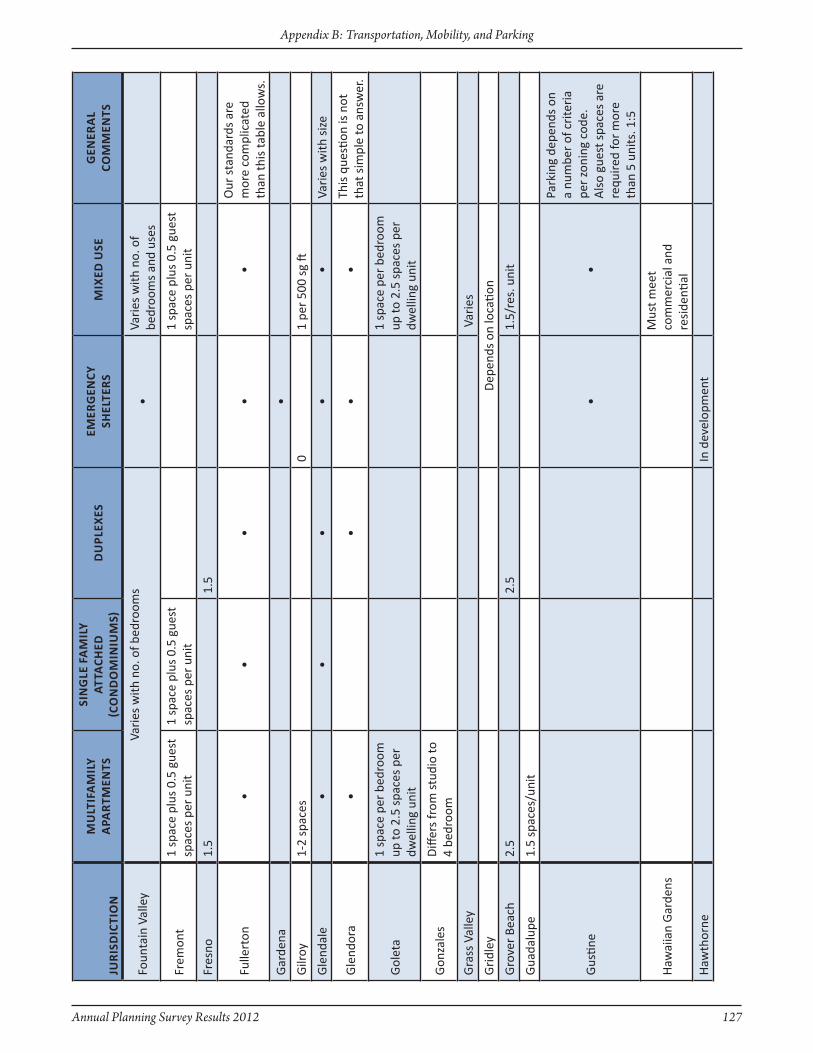
Annual Planning Survey Results 2012 127
Appendix B: Transportation, Mobility, and Parking
JuR
isd
icti
On
Mu
ltif
AM
ily
APA
RtM
ents
sin
Gle
fA
Mil
y At
tAch
ed
(cO
nd
OM
iniu
Ms)
du
Plex
eseM
eRG
ency
sh
elte
Rs
Mix
ed u
seG
eneR
Al
cOM
Men
ts
Foun
tain
Val
ley
Vari
es w
ith n
o. o
f bed
room
s•
Vari
es w
ith n
o. o
f be
droo
ms
and
uses
Frem
ont
1 sp
ace
plus
0.5
gue
st
spac
es p
er u
nit
1 sp
ace
plus
0.5
gue
st
spac
es p
er u
nit
1 sp
ace
plus
0.5
gue
st
spac
es p
er u
nit
Fres
no1.
51.
5
Fulle
rton
••
••
•O
ur s
tand
ards
are
m
ore
com
plic
ated
th
an th
is ta
ble
allo
ws.
Gar
dena
•
Gilr
oy1-
2 sp
aces
01
per
500
sg ft
Gle
ndal
e•
••
••
Vari
es w
ith s
ize
Gle
ndor
a•
••
•Th
is q
uesti
on is
not
th
at s
impl
e to
ans
wer
.
Gol
eta
1 sp
ace
per
bedr
oom
up
to 2
.5 s
pace
s pe
r dw
ellin
g un
it
1 sp
ace
per
bedr
oom
up
to 2
.5 s
pace
s pe
r dw
ellin
g un
it
Gon
zale
sD
iffer
s fr
om s
tudi
o to
4
bedr
oom
Gra
ss V
alle
y V
arie
s
Gri
dley
Dep
ends
on
loca
tion
Gro
ver
Beac
h2.
52.
51.
5/re
s. u
nit
Gua
dalu
pe1.
5 sp
aces
/uni
t
Gus
tine
••
Park
ing
depe
nds
on
a nu
mbe
r of
cri
teri
a pe
r zo
ning
cod
e.
Als
o gu
est s
pace
s ar
e re
quire
d fo
r m
ore
than
5 u
nits
. 1:5
Haw
aiia
n G
arde
nsM
ust m
eet
com
mer
cial
and
re
side
ntial
Haw
thor
neIn
dev
elop
men
t
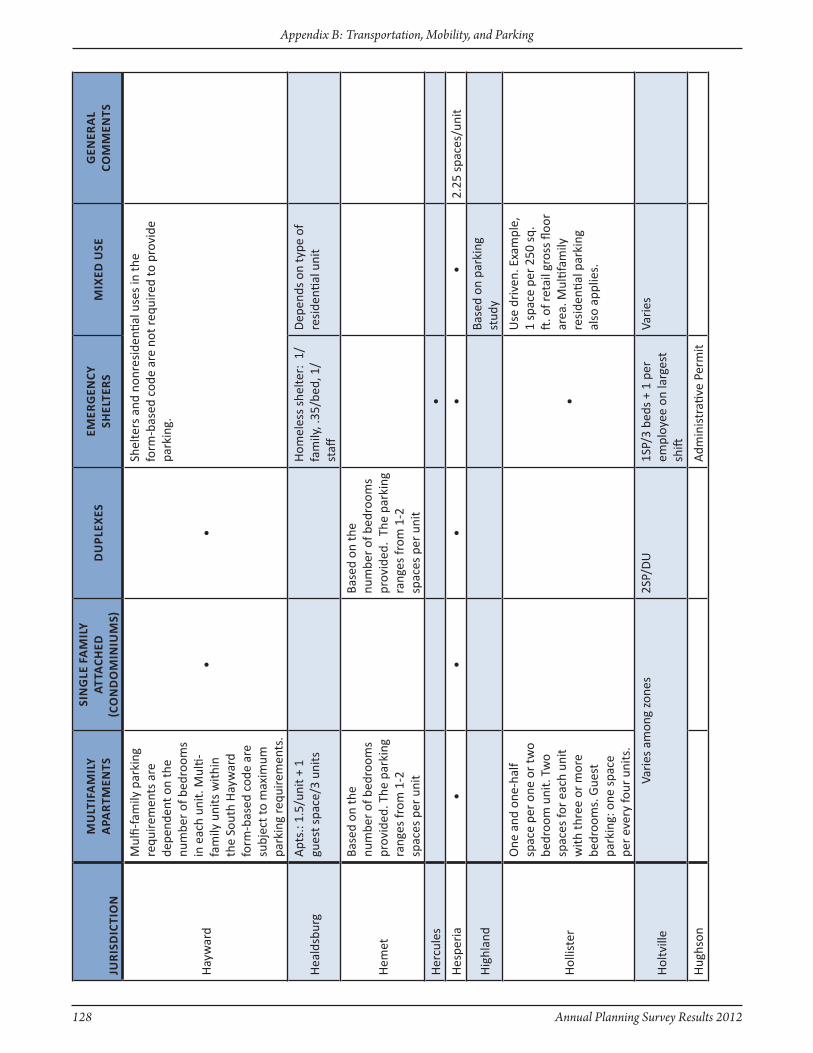
128 Annual Planning Survey Results 2012
Appendix B: Transportation, Mobility, and Parking
JuR
isd
icti
On
Mu
ltif
AM
ily
APA
RtM
ents
sin
Gle
fA
Mil
y At
tAch
ed
(cO
nd
OM
iniu
Ms)
du
Plex
eseM
eRG
ency
sh
elte
Rs
Mix
ed u
seG
eneR
Al
cOM
Men
ts
Hay
war
d
Mul
fi-fa
mily
par
king
re
quire
men
ts a
re
depe
nden
t on
the
num
ber
of b
edro
oms
in e
ach
unit.
Mul
ti-fa
mily
uni
ts w
ithin
th
e So
uth
Hay
war
d fo
rm-b
ased
cod
e ar
e su
bjec
t to
max
imum
pa
rkin
g re
quire
men
ts.
••
Shel
ters
and
non
resi
denti
al u
ses
in th
e fo
rm-b
ased
cod
e ar
e no
t req
uire
d to
pro
vide
pa
rkin
g.
Hea
ldsb
urg
Apt
s.: 1
.5/u
nit +
1
gues
t spa
ce/3
uni
tsH
omel
ess
shel
ter:
1/
fam
ily, .
35/b
ed, 1
/st
aff
Dep
ends
on
type
of
resi
denti
al u
nit
Hem
et
Base
d on
the
num
ber
of b
edro
oms
prov
ided
. The
par
king
ra
nges
from
1-2
sp
aces
per
uni
t
Base
d on
the
num
ber
of b
edro
oms
prov
ided
. Th
e pa
rkin
g ra
nges
from
1-2
sp
aces
per
uni
t
Her
cule
s•
Hes
peri
a•
••
••
2.25
spa
ces/
unit
Hig
hlan
dBa
sed
on p
arki
ng
stud
y
Hol
liste
r
One
and
one
-hal
f sp
ace
per
one
or tw
o be
droo
m u
nit.
Tw
o sp
aces
for
each
uni
t w
ith th
ree
or m
ore
bedr
oom
s. G
uest
pa
rkin
g: o
ne s
pace
pe
r ev
ery
four
uni
ts.
•
Use
dri
ven.
Exa
mpl
e,
1 sp
ace
per
250
sq.
ft. o
f ret
ail g
ross
floo
r ar
ea. M
ultif
amily
re
side
ntial
par
king
al
so a
pplie
s.
Hol
tvill
eVa
ries
am
ong
zone
s2S
P/D
U1S
P/3
beds
+ 1
per
em
ploy
ee o
n la
rges
t sh
ift
Vari
es
Hug
hson
Adm
inis
trati
ve P
erm
it
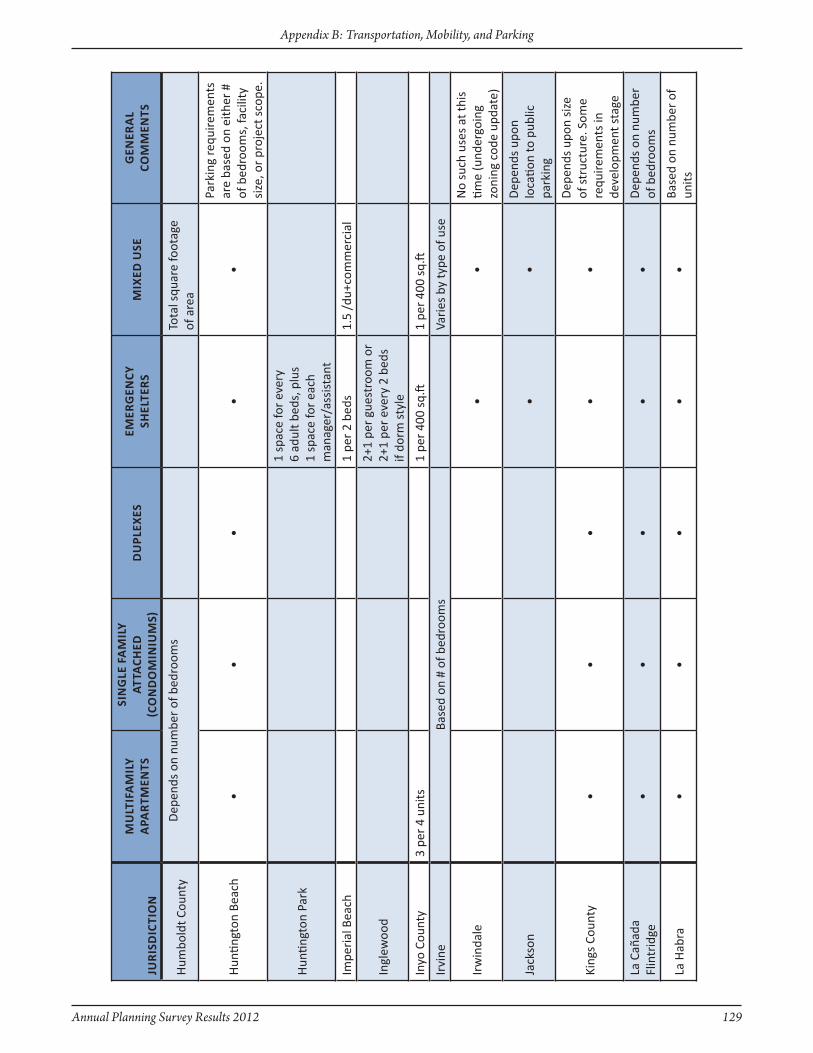
Annual Planning Survey Results 2012 129
Appendix B: Transportation, Mobility, and Parking
JuR
isd
icti
On
Mu
ltif
AM
ily
APA
RtM
ents
sin
Gle
fA
Mil
y At
tAch
ed
(cO
nd
OM
iniu
Ms)
du
Plex
eseM
eRG
ency
sh
elte
Rs
Mix
ed u
seG
eneR
Al
cOM
Men
ts
Hum
bold
t Cou
nty
Dep
ends
on
num
ber
of b
edro
oms
Tota
l squ
are
foot
age
of a
rea
Hun
tingt
on B
each
••
••
•
Park
ing
requ
irem
ents
ar
e ba
sed
on e
ither
#
of b
edro
oms,
faci
lity
size
, or
proj
ect s
cope
.
Hun
tingt
on P
ark
1 sp
ace
for
ever
y 6
adul
t bed
s, p
lus
1 sp
ace
for
each
m
anag
er/a
ssis
tant
Impe
rial
Bea
ch1
per
2 be
ds1.
5 /d
u+co
mm
erci
al
Ingl
ewoo
d2+
1 pe
r gu
estr
oom
or
2+1
per
ever
y 2
beds
if
dorm
sty
le
Inyo
Cou
nty
3 pe
r 4
units
1 pe
r 40
0 sq
.ft1
per
400
sq.ft
Irvi
neBa
sed
on #
of b
edro
oms
Vari
es b
y ty
pe o
f use
Irw
inda
le•
•N
o su
ch u
ses
at th
is
time
(und
ergo
ing
zoni
ng c
ode
upda
te)
Jack
son
••
Dep
ends
upo
n lo
catio
n to
pub
lic
park
ing
King
s Co
unty
••
••
•
Dep
ends
upo
n si
ze
of s
truc
ture
. Som
e re
quire
men
ts in
de
velo
pmen
t sta
ge
La C
añad
a Fl
intr
idge
••
••
•D
epen
ds o
n nu
mbe
r of
bed
room
s
La H
abra
••
••
•Ba
sed
on n
umbe
r of
un
its
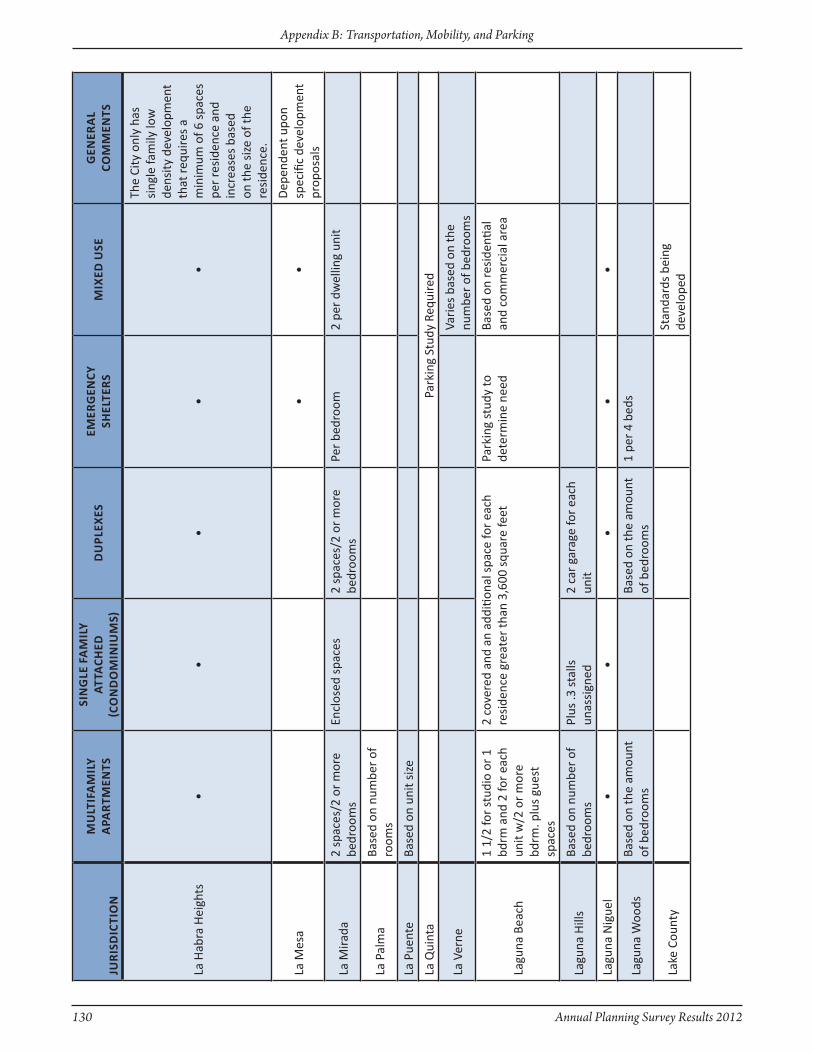
130 Annual Planning Survey Results 2012
Appendix B: Transportation, Mobility, and Parking
JuR
isd
icti
On
Mu
ltif
AM
ily
APA
RtM
ents
sin
Gle
fA
Mil
y At
tAch
ed
(cO
nd
OM
iniu
Ms)
du
Plex
eseM
eRG
ency
sh
elte
Rs
Mix
ed u
seG
eneR
Al
cOM
Men
ts
La H
abra
Hei
ghts
••
••
•
The
City
onl
y ha
s si
ngle
fam
ily lo
w
dens
ity d
evel
opm
ent
that
requ
ires
a m
inim
um o
f 6 s
pace
s pe
r re
side
nce
and
incr
ease
s ba
sed
on th
e si
ze o
f the
re
side
nce.
La M
esa
••
Dep
ende
nt u
pon
spec
ific
deve
lopm
ent
prop
osal
s
La M
irada
2 sp
aces
/2 o
r m
ore
bedr
oom
sEn
clos
ed s
pace
s2
spac
es/2
or
mor
e be
droo
ms
Per
bedr
oom
2 pe
r dw
ellin
g un
it
La P
alm
aBa
sed
on n
umbe
r of
ro
oms
La P
uent
eBa
sed
on u
nit s
ize
La Q
uint
aPa
rkin
g St
udy
Requ
ired
La V
erne
Vari
es b
ased
on
the
num
ber
of b
edro
oms
Lagu
na B
each
1 1/
2 fo
r st
udio
or
1 bd
rm a
nd 2
for
each
un
it w
/2 o
r m
ore
bdrm
. plu
s gu
est
spac
es
2 co
vere
d an
d an
add
ition
al s
pace
for
each
re
side
nce
grea
ter
than
3,6
00 s
quar
e fe
etPa
rkin
g st
udy
to
dete
rmin
e ne
edBa
sed
on re
side
ntial
an
d co
mm
erci
al a
rea
Lagu
na H
ills
Base
d on
num
ber
of
bedr
oom
sPl
us .3
sta
lls
unas
sign
ed2
car
gara
ge fo
r ea
ch
unit
Lagu
na N
igue
l•
••
••
Lagu
na W
oods
Base
d on
the
amou
nt
of b
edro
oms
Base
d on
the
amou
nt
of b
edro
oms
1 pe
r 4
beds
Lake
Cou
nty
Stan
dard
s be
ing
deve
lope
d

Annual Planning Survey Results 2012 131
Appendix B: Transportation, Mobility, and Parking
JuR
isd
icti
On
Mu
ltif
AM
ily
APA
RtM
ents
sin
Gle
fA
Mil
y At
tAch
ed
(cO
nd
OM
iniu
Ms)
du
Plex
eseM
eRG
ency
sh
elte
Rs
Mix
ed u
seG
eneR
Al
cOM
Men
ts
Lake
Els
inor
e•
••
Park
ing
is b
ased
upo
n nu
mbe
r of
bed
room
s as
follo
ws:
Stu
dios
an
d 1
Bedr
oom
re
quire
1 c
over
ed
and
2/3
open
par
king
sp
ace
per
unit,
for
dwel
ling
units
with
2
and
mor
e be
droo
ms
requ
ired
park
ing
is
1 co
vere
d an
d 1
1/3
open
par
king
spa
ce
per
unit.
Lake
port
Park
ing
requ
irem
ents
ar
e se
t for
th in
O
rdin
ance
No.
880
(2
010)
: One
spa
ce
for
ever
y 6
adul
t be
ds o
r ½
spa
ce p
er
bedr
oom
des
igna
ted
for
fam
ily u
nits
with
ch
ildre
n. O
ne s
pace
sh
all b
e pr
ovid
ed fo
r ea
ch m
anag
er/s
taff
m
embe
r. Bi
ke ra
ck
park
ing
shal
l als
o be
pro
vide
d by
the
faci
lity.
Lake
woo
d•
•
1 sp
ace
per
10 b
eds
•
Park
ing
for
any
mul
ti-fa
mily
dev
elop
men
t is
base
d on
the
num
ber
of b
edro
oms
per
unit
Lanc
aste
r
Num
ber
of p
arki
ng
spac
es fo
r ap
artm
ent
unit
is d
epen
dent
on
the
num
ber
of
bedr
oom
s in
the
unit.
••
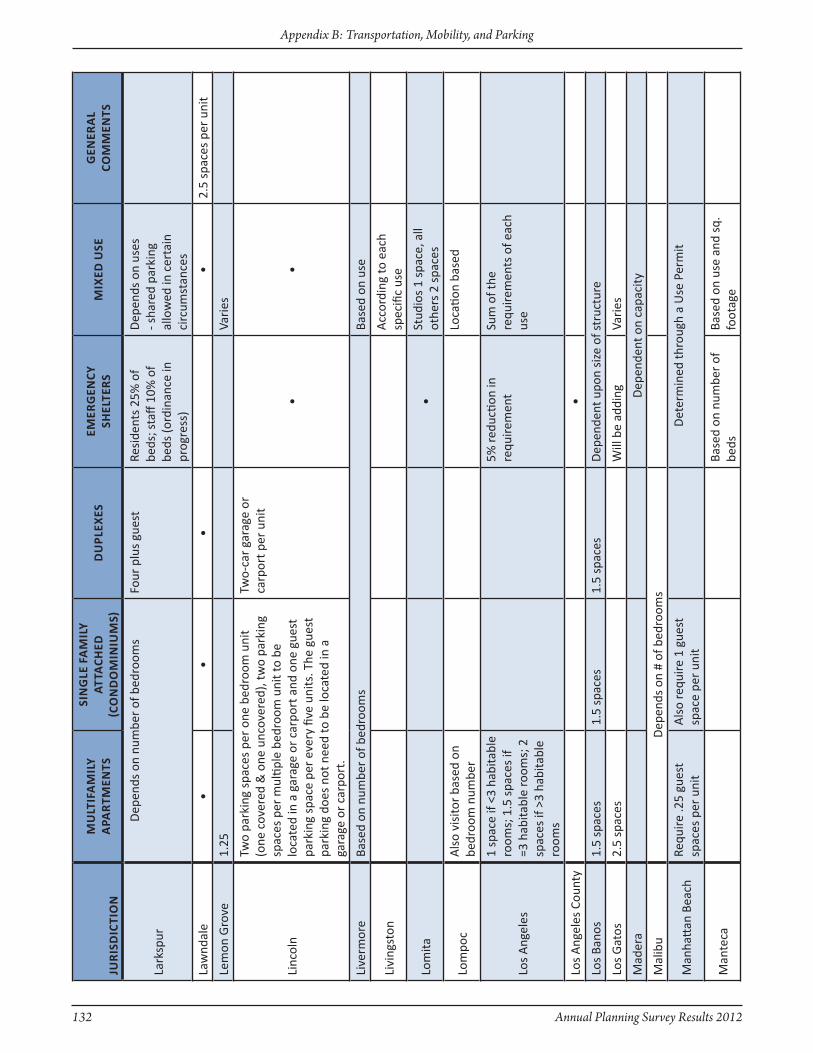
132 Annual Planning Survey Results 2012
Appendix B: Transportation, Mobility, and Parking
JuR
isd
icti
On
Mu
ltif
AM
ily
APA
RtM
ents
sin
Gle
fA
Mil
y At
tAch
ed
(cO
nd
OM
iniu
Ms)
du
Plex
eseM
eRG
ency
sh
elte
Rs
Mix
ed u
seG
eneR
Al
cOM
Men
ts
Lark
spur
Dep
ends
on
num
ber
of b
edro
oms
Four
plu
s gu
est
Resi
dent
s 25
% o
f be
ds; s
taff
10%
of
beds
(ord
inan
ce in
pr
ogre
ss)
Dep
ends
on
uses
- s
hare
d pa
rkin
g al
low
ed in
cer
tain
ci
rcum
stan
ces
Law
ndal
e•
••
•2.
5 sp
aces
per
uni
t
Lem
on G
rove
1.25
Vari
es
Linc
oln
Two
park
ing
spac
es p
er o
ne b
edro
om u
nit
(one
cov
ered
& o
ne u
ncov
ered
), tw
o pa
rkin
g sp
aces
per
mul
tiple
bed
room
uni
t to
be
loca
ted
in a
gar
age
or c
arpo
rt a
nd o
ne g
uest
pa
rkin
g sp
ace
per
ever
y fiv
e un
its. T
he g
uest
pa
rkin
g do
es n
ot n
eed
to b
e lo
cate
d in
a
gara
ge o
r ca
rpor
t.
Two-
car
gara
ge o
r ca
rpor
t per
uni
t
••
Live
rmor
eBa
sed
on n
umbe
r of
bed
room
sBa
sed
on u
se
Livi
ngst
onA
ccor
ding
to e
ach
spec
ific
use
Lom
ita•
Stud
ios
1 sp
ace,
all
othe
rs 2
spa
ces
Lom
poc
Als
o vi
sito
r ba
sed
on
bedr
oom
num
ber
Loca
tion
base
d
Los
Ang
eles
1 sp
ace
if <3
hab
itabl
e ro
oms;
1.5
spa
ces
if =3
hab
itabl
e ro
oms;
2
spac
es if
>3
habi
tabl
e ro
oms
5% re
ducti
on in
re
quire
men
tSu
m o
f the
re
quire
men
ts o
f eac
h us
e
Los
Ang
eles
Cou
nty
•
Los
Bano
s1.
5 sp
aces
1.5
spac
es1.
5 sp
aces
Dep
ende
nt u
pon
size
of s
truc
ture
Los
Gat
os2.
5 sp
aces
Will
be
addi
ngVa
ries
Mad
era
Dep
ende
nt o
n ca
paci
ty
Mal
ibu
Dep
ends
on
# of
bed
room
s
Man
hatt
an B
each
Requ
ire .2
5 gu
est
spac
es p
er u
nit
Als
o re
quire
1 g
uest
sp
ace
per
unit
Det
erm
ined
thro
ugh
a U
se P
erm
it
Man
teca
Base
d on
num
ber
of
beds
Base
d on
use
and
sq.
fo
otag
e

Annual Planning Survey Results 2012 133
Appendix B: Transportation, Mobility, and Parking
JuR
isd
icti
On
Mu
ltif
AM
ily
APA
RtM
ents
sin
Gle
fA
Mil
y At
tAch
ed
(cO
nd
OM
iniu
Ms)
du
Plex
eseM
eRG
ency
sh
elte
Rs
Mix
ed u
seG
eneR
Al
cOM
Men
ts
Mar
in C
ount
yD
eter
min
ed b
y sp
aces
per
uni
tG
ross
floo
r ar
eaG
ross
floo
r ar
ea a
nd
spac
es p
er u
nit
Mar
ina
zoni
ng O
rdin
ance
- de
pend
s on
bed
room
sBa
sed
on u
nder
lyin
g la
nd u
seIn
acc
orda
nce
with
st
ruct
ure
type
fo
r re
side
ntial
sq
uare
foot
age
for
com
mer
cial
Mar
ipos
a Co
unty
1.5
to 2
.0 s
pace
s1.
5 to
2.0
spa
ces
1.5
to 2
.0 s
pace
sSh
ared
/pub
lic s
pace
sU
p to
50%
redu
ction
Mar
tinez
Rang
e 1-
2.2
5Ra
nge
1- 2
.25
Rang
e 1-
2.2
5Va
ries
Men
doci
no C
ount
y0-
1, 2
& 3
Men
dota
Case
-by-
case
Men
ifee
Park
ing
requ
irem
ents
ar
e no
t spe
cific
ally
lis
ted,
but
wou
ld b
e de
term
ined
bas
ed
on th
e sp
ecifi
c m
ix o
f us
es.
Men
lo P
ark
Dep
ends
on
spec
ific
uses
Mer
ced
Vari
esVa
ries
Mill
Val
ley
••
To b
e de
term
ined
by
the
Plan
ning
Co
mm
issi
on
Mill
brae
1-2
per
unit
1-2
per
unit
By C
UP
Milp
itas
Plus
gue
stPl
us g
uest
Plus
gue
st•
Plus
gue
st
Mis
sion
Vie
jo
Base
d on
num
ber
of
bedr
oom
s. 1
.5 s
pace
s fo
r 1
bedr
oom
uni
t, 2
sp
aces
for
2 be
droo
m
units
, and
2.5
sp
aces
for
3 or
mor
e be
droo
m u
nit
One
spa
ce fo
r ea
ch
250
sq. ft
. of g
ross
flo
or a
rea
Dep
end
upon
pro
ject
pa
rkin
g ge
nera
tion
stud
y
Mod
esto
••
•St
anda
rds
vary
bas
ed
on s
ize
of p
roje
ct
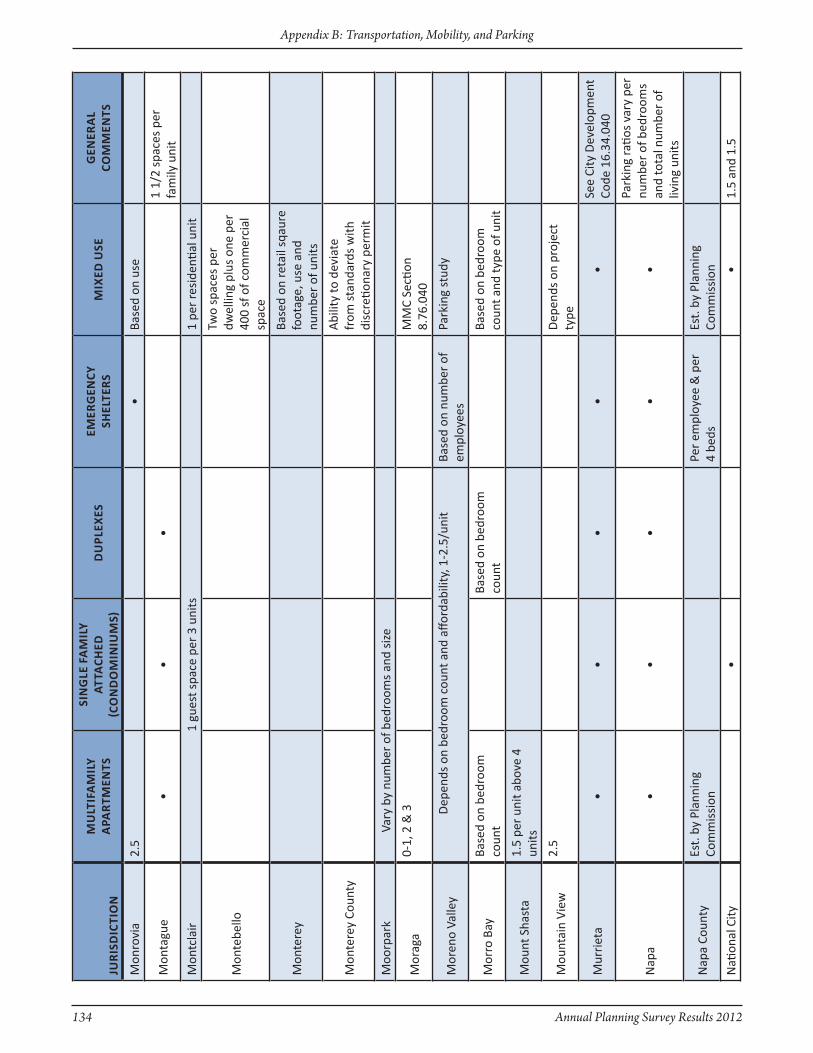
134 Annual Planning Survey Results 2012
Appendix B: Transportation, Mobility, and Parking
JuR
isd
icti
On
Mu
ltif
AM
ily
APA
RtM
ents
sin
Gle
fA
Mil
y At
tAch
ed
(cO
nd
OM
iniu
Ms)
du
Plex
eseM
eRG
ency
sh
elte
Rs
Mix
ed u
seG
eneR
Al
cOM
Men
ts
Mon
rovi
a2.
5•
Base
d on
use
Mon
tagu
e•
••
1 1/
2 sp
aces
per
fa
mily
uni
t
Mon
tcla
ir1
gues
t spa
ce p
er 3
uni
ts1
per
resi
denti
al u
nit
Mon
tebe
llo
Two
spac
es p
er
dwel
ling
plus
one
per
40
0 sf
of c
omm
erci
al
spac
e
Mon
tere
yBa
sed
on re
tail
sqau
re
foot
age,
use
and
nu
mbe
r of
uni
ts
Mon
tere
y Co
unty
Abi
lity
to d
evia
te
from
sta
ndar
ds w
ith
disc
retio
nary
per
mit
Moo
rpar
kVa
ry b
y nu
mbe
r of
bed
room
s an
d si
ze
Mor
aga
0-1,
2 &
3M
MC
Secti
on
8.76
.040
Mor
eno
Valle
y D
epen
ds o
n be
droo
m c
ount
and
affo
rdab
ility
, 1-2
.5/u
nit
Base
d on
num
ber
of
empl
oyee
sPa
rkin
g st
udy
Mor
ro B
ayBa
sed
on b
edro
om
coun
tBa
sed
on b
edro
om
coun
tBa
sed
on b
edro
om
coun
t and
type
of u
nit
Mou
nt S
hast
a1.
5 pe
r un
it ab
ove
4 un
its
Mou
ntai
n Vi
ew2.
5D
epen
ds o
n pr
ojec
t ty
pe
Mur
riet
a•
••
••
See
City
Dev
elop
men
t Co
de 1
6.34
.040
Nap
a•
••
••
Park
ing
ratio
s va
ry p
er
num
ber
of b
edro
oms
and
tota
l num
ber
of
livin
g un
its
Nap
a Co
unty
Est.
by
Plan
ning
Co
mm
issi
onPe
r em
ploy
ee &
per
4
beds
Est.
by
Plan
ning
Co
mm
issi
on
Nati
onal
City
••
1.5
and
1.5

Annual Planning Survey Results 2012 135
Appendix B: Transportation, Mobility, and Parking
JuR
isd
icti
On
Mu
ltif
AM
ily
APA
RtM
ents
sin
Gle
fA
Mil
y At
tAch
ed
(cO
nd
OM
iniu
Ms)
du
Plex
eseM
eRG
ency
sh
elte
Rs
Mix
ed u
seG
eneR
Al
cOM
Men
ts
Nev
ada
City
Vari
es w
ith
appl
icati
on
Nev
ada
Coun
ty
Base
d on
# o
f bed
room
s, u
p to
2 s
pace
s fo
r 3
bedr
oom
uni
tsD
epen
ds o
n pr
opos
ed
use,
bas
ed o
n flo
or
area
for
com
mec
ial
and
type
of r
esid
entia
l
New
ark
2.25
per
uni
t 2.
25 p
er u
nit
2.25
per
uni
t Ba
sed
on C
omm
erci
al
Park
ing
Stan
dard
s2.
25 p
er u
nit
New
man
1 co
vere
d, 1
un
cove
red
2 co
vere
d1
cove
red,
1
unco
vere
dD
epen
ds o
n m
ix
New
port
Bea
chSe
t by
use
perm
it
Nor
wal
kBa
sed
upon
num
ber
of b
edro
oms
and
tota
l nu
mbe
r of
uni
ts•
••
•
Nov
ato
Rang
es fr
om 1
-2 u
nits
and
gue
st p
arki
ng is
re
quire
dD
epen
ds o
n us
e
Oak
land
1.5
spac
es1.
5 sp
aces
1.5
spac
esSu
m o
f req
s fo
r ea
ch
use
Oak
ley
1-2+
dep
endi
ng o
n be
droo
ms
•Pe
r CU
P or
spe
cific
s of
pro
ject
Oce
ansi
de•
••
••
Vari
able
, bas
ed o
n ap
plic
able
ord
inan
ce,
with
opp
ortu
nitie
s fo
r re
duce
d re
quire
men
ts
thro
ugh
CUP
proc
ess
Oja
iVa
ries
by
proj
ect
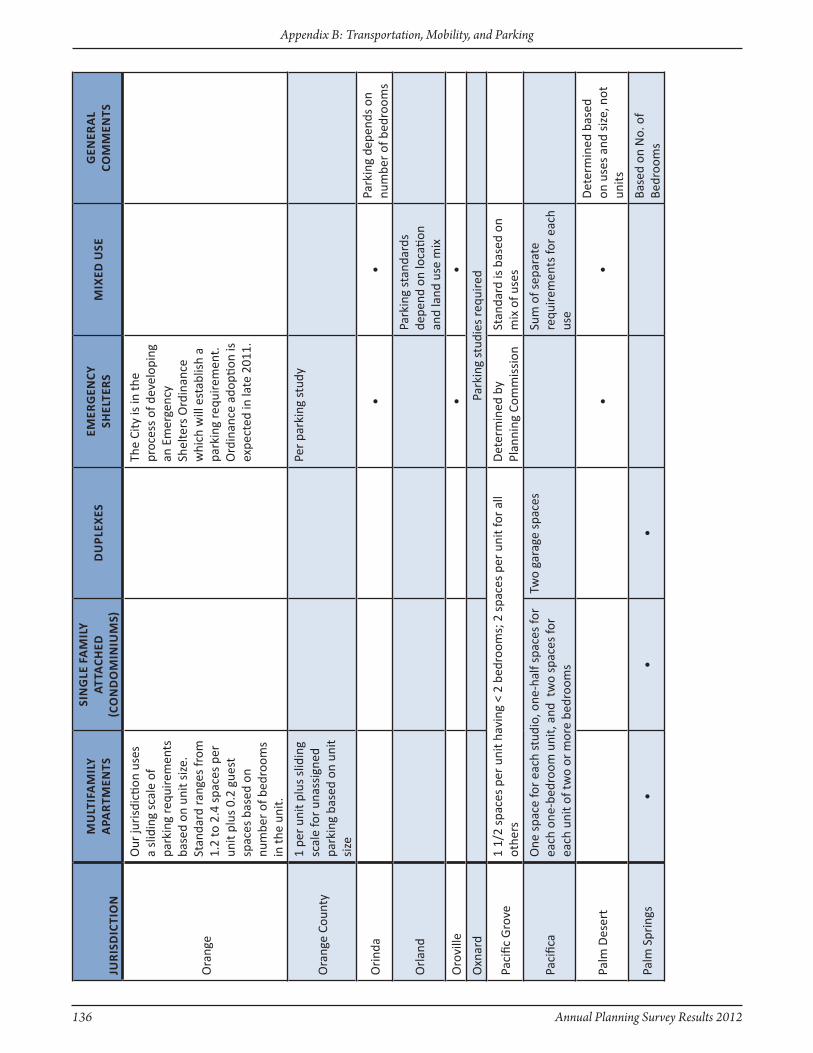
136 Annual Planning Survey Results 2012
Appendix B: Transportation, Mobility, and Parking
JuR
isd
icti
On
Mu
ltif
AM
ily
APA
RtM
ents
sin
Gle
fA
Mil
y At
tAch
ed
(cO
nd
OM
iniu
Ms)
du
Plex
eseM
eRG
ency
sh
elte
Rs
Mix
ed u
seG
eneR
Al
cOM
Men
ts
Ora
nge
Our
juri
sdic
tion
uses
a
slid
ing
scal
e of
pa
rkin
g re
quire
men
ts
base
d on
uni
t siz
e.
Stan
dard
rang
es fr
om
1.2
to 2
.4 s
pace
s pe
r un
it pl
us 0
.2 g
uest
sp
aces
bas
ed o
n nu
mbe
r of
bed
room
s in
the
unit.
The
City
is in
the
proc
ess
of d
evel
opin
g an
Em
erge
ncy
Shel
ters
Ord
inan
ce
whi
ch w
ill e
stab
lish
a pa
rkin
g re
quire
men
t.
Ord
inan
ce a
dopti
on is
ex
pect
ed in
late
201
1.
Ora
nge
Coun
ty
1 pe
r un
it pl
us s
lidin
g sc
ale
for
unas
sign
ed
park
ing
base
d on
uni
t si
ze
Per
park
ing
stud
y
Ori
nda
••
Park
ing
depe
nds
on
num
ber
of b
edro
oms
Orl
and
Park
ing
stan
dard
s de
pend
on
loca
tion
and
land
use
mix
Oro
ville
••
Oxn
ard
Park
ing
stud
ies
requ
ired
Paci
fic G
rove
1 1/
2 sp
aces
per
uni
t hav
ing
< 2
bedr
oom
s; 2
spa
ces
per
unit
for
all
othe
rsD
eter
min
ed b
y Pl
anni
ng C
omm
issi
onSt
anda
rd is
bas
ed o
n m
ix o
f use
s
Paci
fica
One
spa
ce fo
r ea
ch s
tudi
o, o
ne-h
alf s
pace
s fo
r ea
ch o
ne-b
edro
om u
nit,
and
tw
o sp
aces
for
each
uni
t of t
wo
or m
ore
bedr
oom
s
Two
gara
ge s
pace
sSu
m o
f sep
arat
e re
quire
men
ts fo
r ea
ch
use
Palm
Des
ert
••
Det
erm
ined
bas
ed
on u
ses
and
size
, not
un
its
Palm
Spr
ings
••
•Ba
sed
on N
o. o
f Be
droo
ms
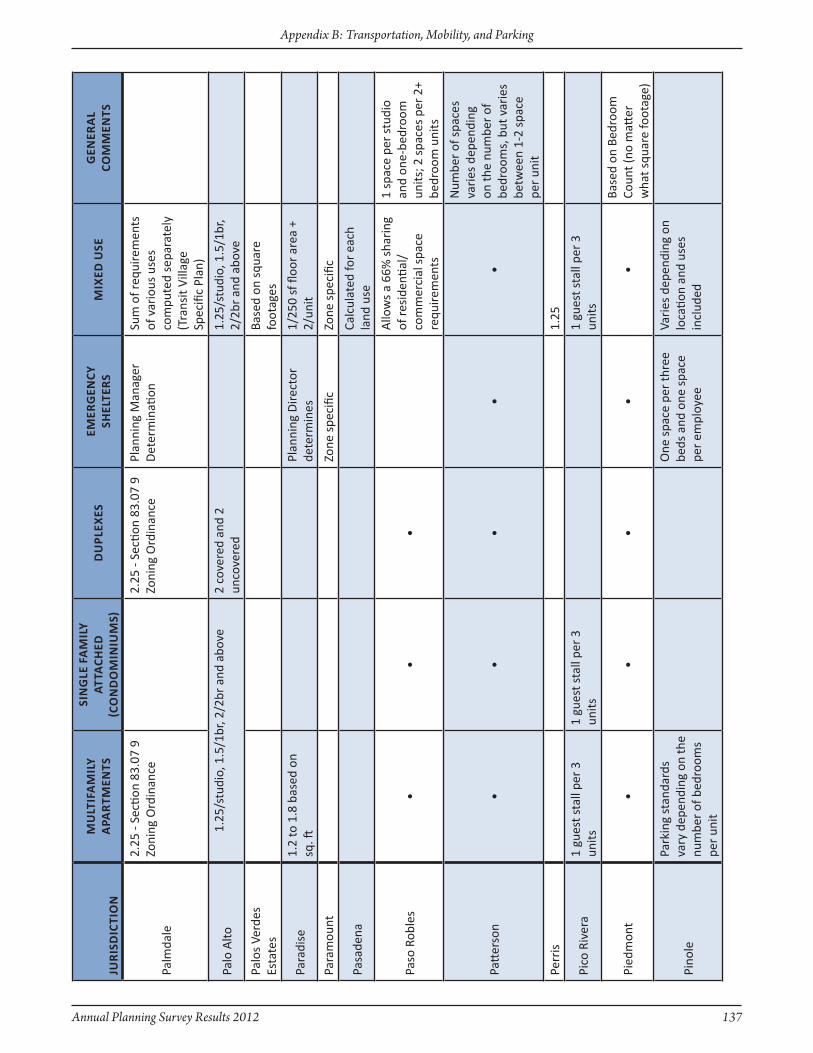
Annual Planning Survey Results 2012 137
Appendix B: Transportation, Mobility, and Parking
JuR
isd
icti
On
Mu
ltif
AM
ily
APA
RtM
ents
sin
Gle
fA
Mil
y At
tAch
ed
(cO
nd
OM
iniu
Ms)
du
Plex
eseM
eRG
ency
sh
elte
Rs
Mix
ed u
seG
eneR
Al
cOM
Men
ts
Palm
dale
2.25
- Se
ction
83.
07 9
zo
ning
Ord
inan
ce2.
25 -
Secti
on 8
3.07
9
zoni
ng O
rdin
ance
Plan
ning
Man
ager
D
eter
min
ation
Sum
of r
equi
rem
ents
of
var
ious
use
s co
mpu
ted
sepa
rate
ly
(Tra
nsit
Villa
ge
Spec
ific
Plan
)
Palo
Alto
1.25
/stu
dio,
1.5
/1br
, 2/2
br a
nd a
bove
2 co
vere
d an
d 2
unco
vere
d1.
25/s
tudi
o, 1
.5/1
br,
2/2b
r an
d ab
ove
Palo
s Ve
rdes
Es
tate
sBa
sed
on s
quar
e fo
otag
es
Para
dise
1.2
to 1
.8 b
ased
on
sq. ft
Plan
ning
Dire
ctor
de
term
ines
1/25
0 sf
floo
r ar
ea +
2/
unit
Para
mou
ntzo
ne s
peci
ficzo
ne s
peci
fic
Pasa
dena
Calc
ulat
ed fo
r ea
ch
land
use
Paso
Rob
les
••
•
Allo
ws
a 66
% s
hari
ng
of re
side
ntial
/co
mm
erci
al s
pace
re
quire
men
ts
1 sp
ace
per
stud
io
and
one-
bedr
oom
un
its; 2
spa
ces
per
2+
bedr
oom
uni
ts
Patt
erso
n•
••
••
Num
ber
of s
pace
s va
ries
dep
endi
ng
on th
e nu
mbe
r of
be
droo
ms,
but
var
ies
betw
een
1-2
spac
e pe
r un
it
Perr
is1.
25
Pico
Riv
era
1 gu
est s
tall
per
3 un
its1
gues
t sta
ll pe
r 3
units
1 gu
est s
tall
per
3 un
its
Pied
mon
t•
••
••
Base
d on
Bed
room
Co
unt (
no m
atter
w
hat s
quar
e fo
otag
e)
Pino
le
Park
ing
stan
dard
s va
ry d
epen
ding
on
the
num
ber
of b
edro
oms
per
unit
One
spa
ce p
er th
ree
beds
and
one
spa
ce
per
empl
oyee
Vari
es d
epen
ding
on
loca
tion
and
uses
in
clud
ed
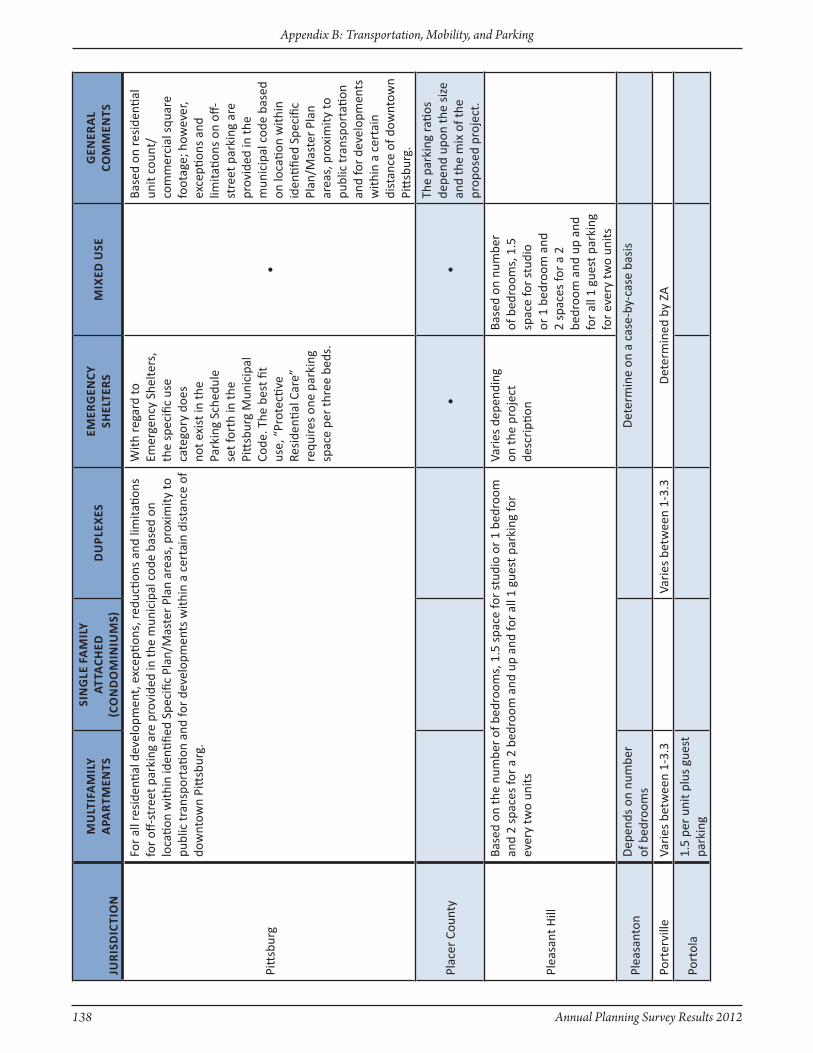
138 Annual Planning Survey Results 2012
Appendix B: Transportation, Mobility, and Parking
JuR
isd
icti
On
Mu
ltif
AM
ily
APA
RtM
ents
sin
Gle
fA
Mil
y At
tAch
ed
(cO
nd
OM
iniu
Ms)
du
Plex
eseM
eRG
ency
sh
elte
Rs
Mix
ed u
seG
eneR
Al
cOM
Men
ts
Pitt
sbur
g
For
all r
esid
entia
l dev
elop
men
t, e
xcep
tions
, red
uctio
ns a
nd li
mita
tions
fo
r off
-str
eet p
arki
ng a
re p
rovi
ded
in th
e m
unic
ipal
cod
e ba
sed
on
loca
tion
with
in id
entifi
ed S
peci
fic P
lan/
Mas
ter
Plan
are
as, p
roxi
mity
to
publ
ic tr
ansp
orta
tion
and
for
deve
lopm
ents
with
in a
cer
tain
dis
tanc
e of
do
wnt
own
Pitt
sbur
g.
With
rega
rd to
Em
erge
ncy
Shel
ters
, th
e sp
ecifi
c us
e ca
tego
ry d
oes
not e
xist
in th
e Pa
rkin
g Sc
hedu
le
set f
orth
in th
e Pi
ttsb
urg
Mun
icip
al
Code
. The
bes
t fit
use,
“Pr
otec
tive
Resi
denti
al C
are”
re
quire
s on
e pa
rkin
g sp
ace
per
thre
e be
ds.
•
Base
d on
resi
denti
al
unit
coun
t/co
mm
erci
al s
quar
e fo
otag
e; h
owev
er,
exce
ption
s an
d lim
itatio
ns o
n off
-st
reet
par
king
are
pr
ovid
ed in
the
mun
icip
al c
ode
base
d on
loca
tion
with
in
iden
tified
Spe
cific
Pl
an/M
aste
r Pl
an
area
s, p
roxi
mity
to
publ
ic tr
ansp
orta
tion
and
for
deve
lopm
ents
w
ithin
a c
erta
in
dist
ance
of d
ownt
own
Pitt
sbur
g.
Plac
er C
ount
y•
•
The
park
ing
ratio
s de
pend
upo
n th
e si
ze
and
the
mix
of t
he
prop
osed
pro
ject
.
Plea
sant
Hill
Base
d on
the
num
ber
of b
edro
oms,
1.5
spa
ce fo
r st
udio
or
1 be
droo
m
and
2 sp
aces
for
a 2
bedr
oom
and
up
and
for
all 1
gue
st p
arki
ng fo
r ev
ery
two
units
Vari
es d
epen
ding
on
the
proj
ect
desc
ripti
on
Base
d on
num
ber
of b
edro
oms,
1.5
sp
ace
for
stud
io
or 1
bed
room
and
2
spac
es fo
r a
2 be
droo
m a
nd u
p an
d fo
r al
l 1 g
uest
par
king
fo
r ev
ery
two
units
Plea
sant
onD
epen
ds o
n nu
mbe
r of
bed
room
sD
eter
min
e on
a c
ase-
by-c
ase
basi
s
Port
ervi
lleVa
ries
bet
wee
n 1-
3.3
Vari
es b
etw
een
1-3.
3D
eter
min
ed b
y zA
Port
ola
1.5
per
unit
plus
gue
st
park
ing
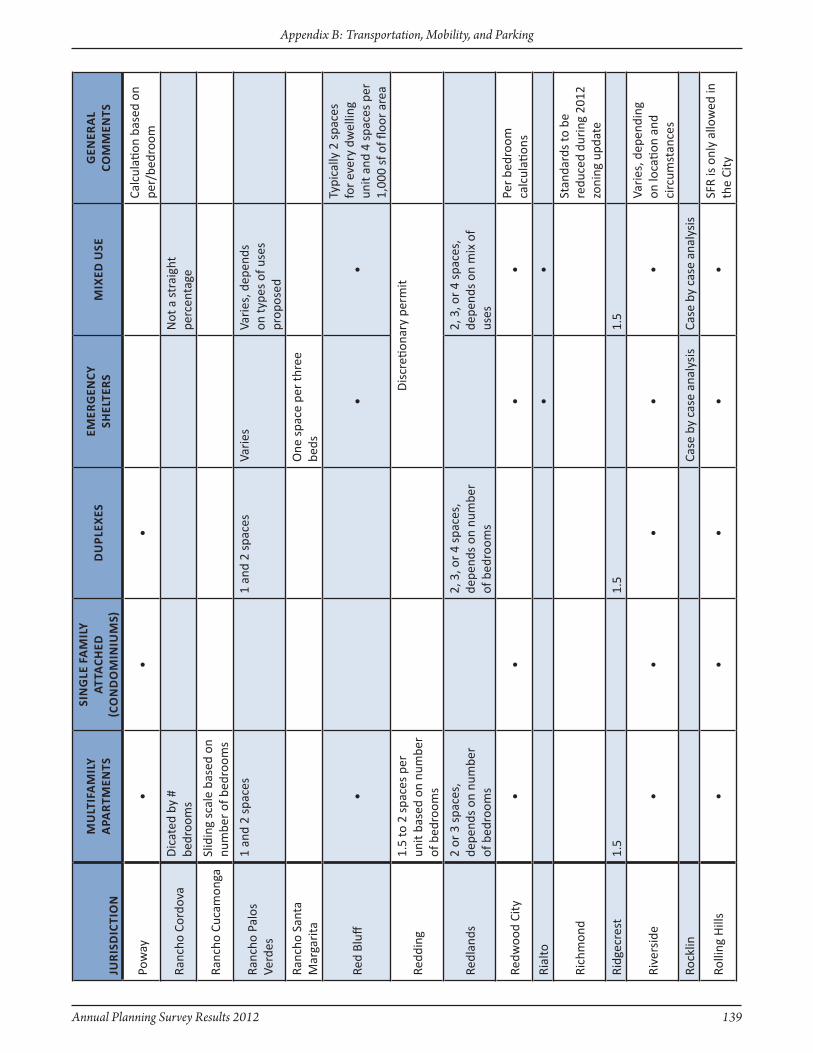
Annual Planning Survey Results 2012 139
Appendix B: Transportation, Mobility, and Parking
JuR
isd
icti
On
Mu
ltif
AM
ily
APA
RtM
ents
sin
Gle
fA
Mil
y At
tAch
ed
(cO
nd
OM
iniu
Ms)
du
Plex
eseM
eRG
ency
sh
elte
Rs
Mix
ed u
seG
eneR
Al
cOM
Men
ts
Pow
ay•
••
Calc
ulati
on b
ased
on
per/
bedr
oom
Ranc
ho C
ordo
vaD
icat
ed b
y #
bedr
oom
sN
ot a
str
aigh
t pe
rcen
tage
Ranc
ho C
ucam
onga
Slid
ing
scal
e ba
sed
on
num
ber
of b
edro
oms
Ranc
ho P
alos
Ve
rdes
1 an
d 2
spac
es1
and
2 sp
aces
Vari
esVa
ries
, dep
ends
on
type
s of
use
s pr
opos
ed
Ranc
ho S
anta
M
arga
rita
One
spa
ce p
er th
ree
beds
Red
Bluff
••
•
Typi
cally
2 s
pace
s fo
r ev
ery
dwel
ling
unit
and
4 sp
aces
per
1,
000
sf o
f floo
r ar
ea
Redd
ing
1.5
to 2
spa
ces
per
unit
base
d on
num
ber
of b
edro
oms
Dis
creti
onar
y pe
rmit
Redl
ands
2 or
3 s
pace
s,
depe
nds
on n
umbe
r of
bed
room
s
2, 3
, or
4 sp
aces
, de
pend
s on
num
ber
of b
edro
oms
2, 3
, or
4 sp
aces
, de
pend
s on
mix
of
uses
Redw
ood
City
••
••
Per
bedr
oom
ca
lcul
ation
s
Rial
to•
•
Rich
mon
dSt
anda
rds
to b
e re
duce
d du
ring
201
2 zo
ning
upd
ate
Ridg
ecre
st1.
51.
51.
5
Rive
rsid
e•
••
••
Vari
es, d
epen
ding
on
loca
tion
and
circ
umst
ance
s
Rock
linCa
se b
y ca
se a
naly
sis
Case
by
case
ana
lysi
s
Rolli
ng H
ills
••
••
•SF
R is
onl
y al
low
ed in
th
e Ci
ty
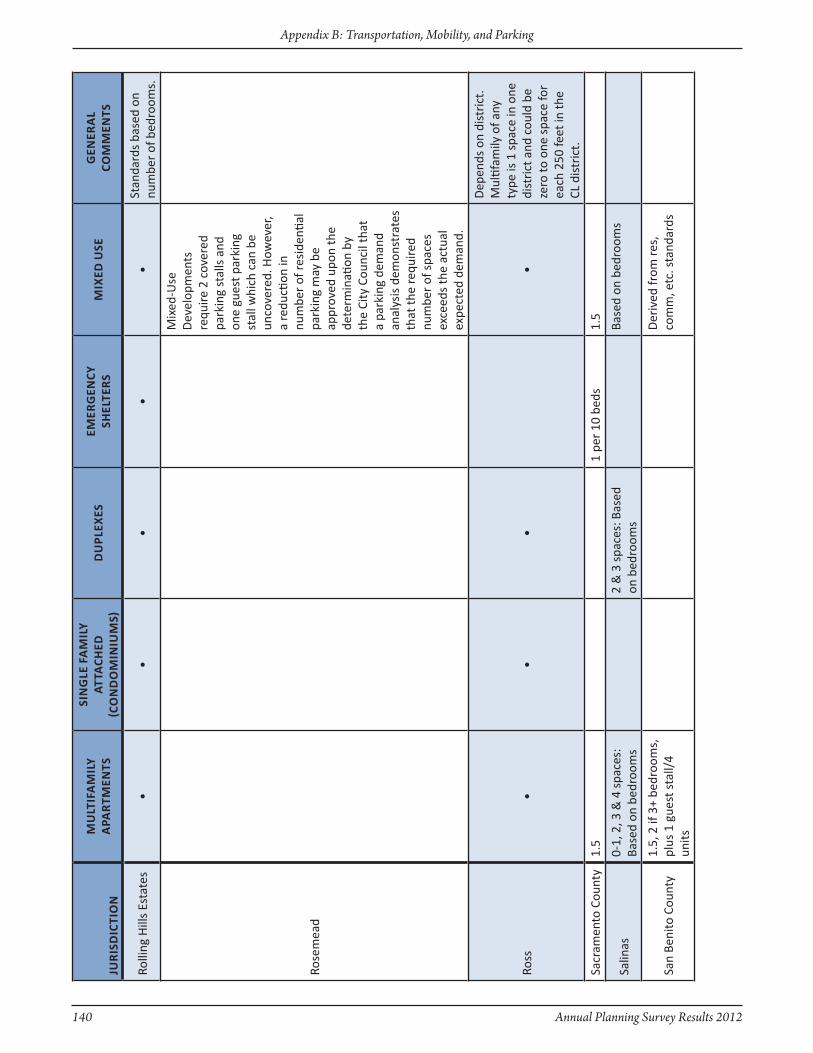
140 Annual Planning Survey Results 2012
Appendix B: Transportation, Mobility, and Parking
JuR
isd
icti
On
Mu
ltif
AM
ily
APA
RtM
ents
sin
Gle
fA
Mil
y At
tAch
ed
(cO
nd
OM
iniu
Ms)
du
Plex
eseM
eRG
ency
sh
elte
Rs
Mix
ed u
seG
eneR
Al
cOM
Men
ts
Rolli
ng H
ills
Esta
tes
••
••
•St
anda
rds
base
d on
nu
mbe
r of
bed
room
s.
Rose
mea
d
Mix
ed-U
se
Dev
elop
men
ts
requ
ire 2
cov
ered
pa
rkin
g st
alls
and
on
e gu
est p
arki
ng
stal
l whi
ch c
an b
e un
cove
red.
How
ever
, a
redu
ction
in
num
ber
of re
side
ntial
pa
rkin
g m
ay b
e ap
prov
ed u
pon
the
dete
rmin
ation
by
the
City
Cou
ncil
that
a
park
ing
dem
and
anal
ysis
dem
onst
rate
s th
at th
e re
quire
d nu
mbe
r of
spa
ces
exce
eds
the
actu
al
expe
cted
dem
and.
Ross
••
••
Dep
ends
on
dist
rict
. M
ultif
amily
of a
ny
type
is 1
spa
ce in
one
di
stri
ct a
nd c
ould
be
zero
to o
ne s
pace
for
each
250
feet
in th
e CL
dis
tric
t.
Sacr
amen
to C
ount
y1.
51
per
10 b
eds
1.5
Salin
as0-
1, 2
, 3 &
4 s
pace
s:
Base
d on
bed
room
s2
& 3
spa
ces:
Bas
ed
on b
edro
oms
Base
d on
bed
room
s
San
Beni
to C
ount
y1.
5, 2
if 3
+ be
droo
ms,
pl
us 1
gue
st s
tall/
4 un
its
Der
ived
from
res,
co
mm
, etc
. sta
ndar
ds

Annual Planning Survey Results 2012 141
Appendix B: Transportation, Mobility, and Parking
JuR
isd
icti
On
Mu
ltif
AM
ily
APA
RtM
ents
sin
Gle
fA
Mil
y At
tAch
ed
(cO
nd
OM
iniu
Ms)
du
Plex
eseM
eRG
ency
sh
elte
Rs
Mix
ed u
seG
eneR
Al
cOM
Men
ts
San
Bern
ardi
no
Coun
ty
2.5
for
proj
ects
of 4
or
mor
e un
its, o
ne
shal
l be
cove
red
for
each
dw
ellin
g un
it on
the
proj
ect s
ite
to a
ccom
mod
ate
resi
dent
and
vis
itor
park
ing.
2.0
for
proj
ects
of 2
or
3 un
its, o
ne s
hall
be
cove
red
for
each
dw
ellin
g un
it.
Resi
denti
al p
arki
ng
spac
es s
hall
be
loca
ted
to th
e re
ar
of th
e fr
ont s
etba
ck
line,
exc
ept t
hat i
n th
e M
ount
ain
Regi
on,
the
park
ing
spac
es
may
be
loca
ted
with
in
the
setb
ack
area
s.
Tand
em p
arki
ng is
no
t allo
wed
exc
ept i
n th
e M
ount
ain
Regi
on.
Are
as o
utsi
de th
e dr
ivew
ay in
fron
t of
the
prim
ary
stru
ctur
e,
whe
ther
out
side
the
fron
t yar
d se
tbac
k or
not
, sha
ll no
t be
used
for
park
ing.
In
the
Valle
y an
d D
eser
t Re
gion
s, th
e co
vere
d pa
rkin
g re
quire
men
t on
ly a
pplie
s to
the
RS a
nd R
M L
and
Use
zo
ning
Dis
tric
ts.
One
sha
ll be
cov
ered
. Re
side
ntial
par
king
sp
aces
sha
ll be
lo
cate
d to
the
rear
of
the
fron
t set
back
lin
e, e
xcep
t tha
t in
the
Mou
ntai
n Re
gion
, th
e pa
rkin
g sp
aces
m
ay b
e lo
cate
d w
ithin
th
e se
tbac
k ar
eas.
Ta
ndem
par
king
is
not a
llow
ed e
xcep
t in
the
Mou
ntai
n Re
gion
. A
reas
out
side
the
driv
eway
in fr
ont o
f th
e pr
imar
y st
ruct
ure,
w
heth
er o
utsi
de th
e fr
ont y
ard
setb
ack
or n
ot, s
hall
not b
e us
ed fo
r pa
rkin
g. In
th
e Va
lley
and
Des
ert
Regi
ons,
the
cove
red
park
ing
requ
irem
ent
only
app
lies
to th
e RS
and
RM
Lan
d U
se
zoni
ng D
istr
icts
.
1 fo
r ea
ch 3
resi
dent
s.Re
side
ntial
use
plu
s th
e no
n-re
side
ntial
us
es s
hall
prov
ide
a m
inim
um fo
r fo
ur s
pace
s w
ith a
n ad
ditio
nal p
arki
ng
spac
e fo
r ea
ch fa
cilit
y ve
hicl
e, e
xcep
t whe
re
othe
rwis
e no
ted.
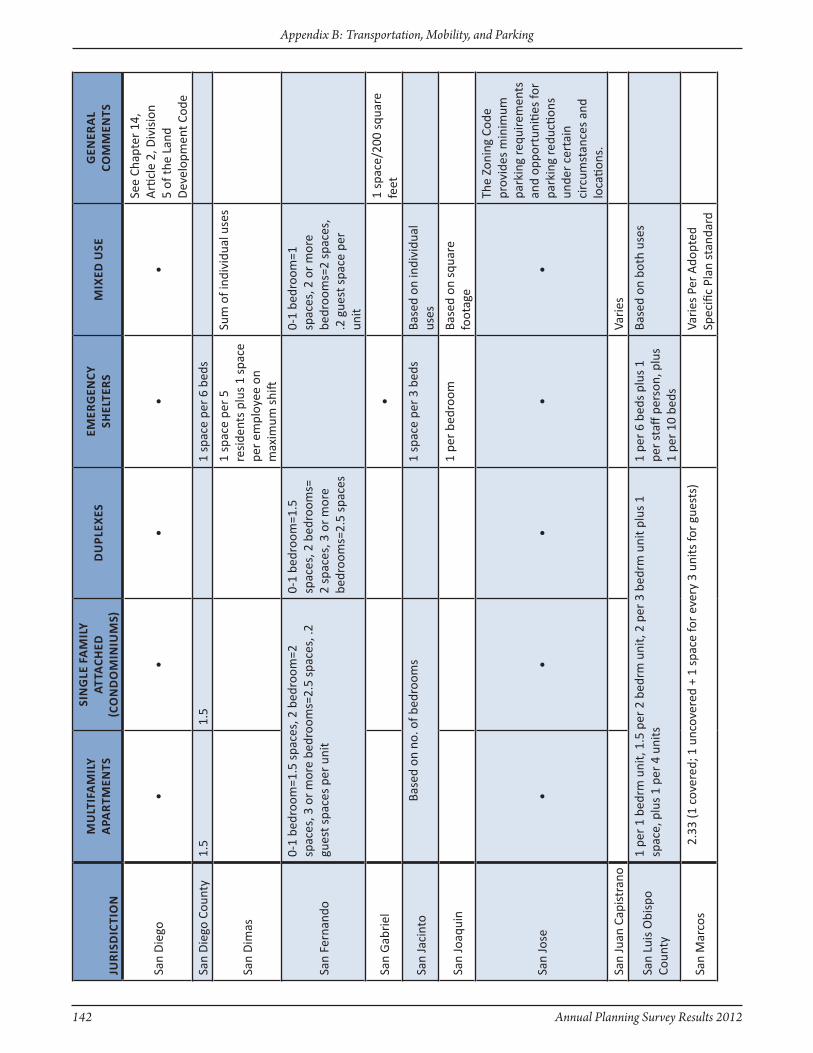
142 Annual Planning Survey Results 2012
Appendix B: Transportation, Mobility, and Parking
JuR
isd
icti
On
Mu
ltif
AM
ily
APA
RtM
ents
sin
Gle
fA
Mil
y At
tAch
ed
(cO
nd
OM
iniu
Ms)
du
Plex
eseM
eRG
ency
sh
elte
Rs
Mix
ed u
seG
eneR
Al
cOM
Men
ts
San
Die
go•
••
••
See
Chap
ter
14,
Arti
cle
2, D
ivis
ion
5 of
the
Land
D
evel
opm
ent C
ode
San
Die
go C
ount
y1.
51.
51
spac
e pe
r 6
beds
San
Dim
as
1 sp
ace
per
5 re
side
nts
plus
1 s
pace
pe
r em
ploy
ee o
n m
axim
um s
hift
Sum
of i
ndiv
idua
l use
s
San
Fern
ando
0-1
bedr
oom
=1.5
spa
ces,
2 b
edro
om=2
sp
aces
, 3 o
r m
ore
bedr
oom
s=2.
5 sp
aces
, .2
gues
t spa
ces
per
unit
0-1
bedr
oom
=1.5
sp
aces
, 2 b
edro
oms=
2
spac
es, 3
or
mor
e be
droo
ms=
2.5
spac
es
0-1
bedr
oom
=1
spac
es, 2
or
mor
e be
droo
ms=
2 sp
aces
, .2
gue
st s
pace
per
un
it
San
Gab
riel
•1
spac
e/20
0 sq
uare
fe
et
San
Jaci
nto
Base
d on
no.
of b
edro
oms
1 sp
ace
per
3 be
dsBa
sed
on in
divi
dual
us
es
San
Joaq
uin
1 pe
r be
droo
mBa
sed
on s
quar
e fo
otag
e
San
Jose
••
••
•
The
zoni
ng C
ode
prov
ides
min
imum
pa
rkin
g re
quire
men
ts
and
oppo
rtun
ities
for
park
ing
redu
ction
s un
der
cert
ain
circ
umst
ance
s an
d lo
catio
ns.
San
Juan
Cap
istr
ano
Vari
es
San
Luis
Obi
spo
Coun
ty
1 pe
r 1
bedr
m u
nit,
1.5
per
2 b
edrm
uni
t, 2
per
3 b
edrm
uni
t plu
s 1
spac
e, p
lus
1 pe
r 4
units
1 pe
r 6
beds
plu
s 1
per
staff
per
son,
plu
s 1
per
10 b
eds
Base
d on
bot
h us
es
San
Mar
cos
2.33
(1 c
over
ed; 1
unc
over
ed +
1 s
pace
for
ever
y 3
units
for
gues
ts)
Vari
es P
er A
dopt
ed
Spec
ific
Plan
sta
ndar
d
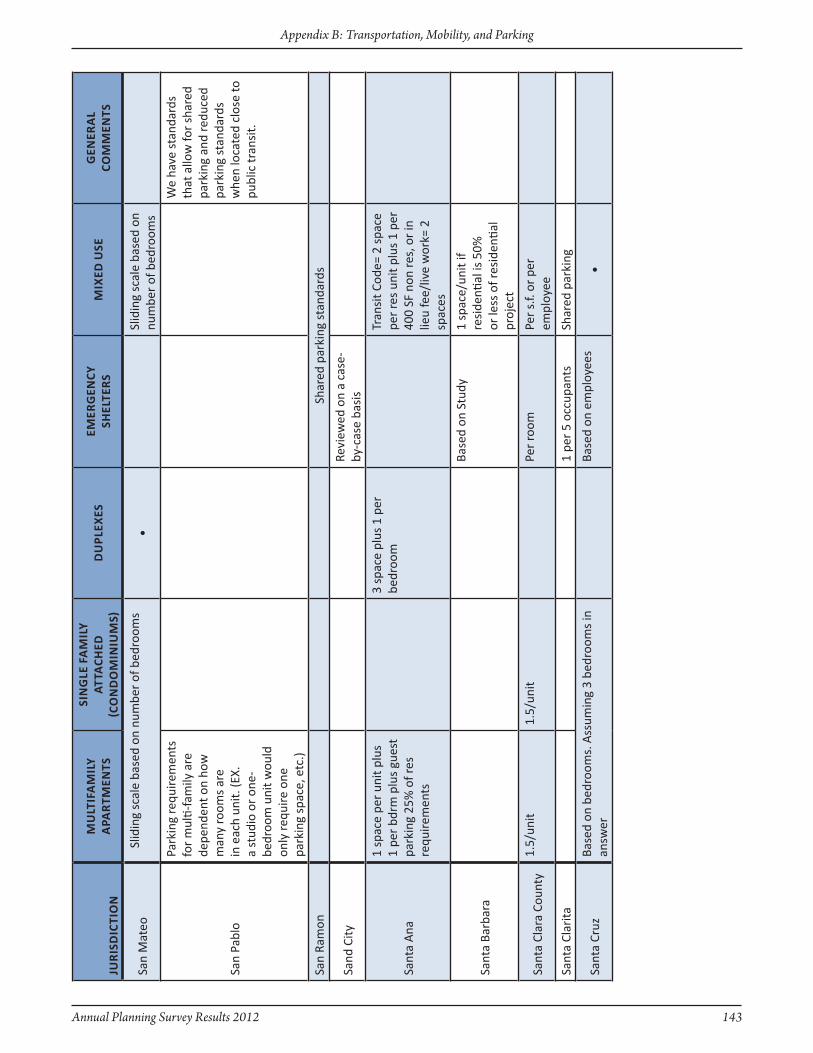
Annual Planning Survey Results 2012 143
Appendix B: Transportation, Mobility, and Parking
JuR
isd
icti
On
Mu
ltif
AM
ily
APA
RtM
ents
sin
Gle
fA
Mil
y At
tAch
ed
(cO
nd
OM
iniu
Ms)
du
Plex
eseM
eRG
ency
sh
elte
Rs
Mix
ed u
seG
eneR
Al
cOM
Men
ts
San
Mat
eoSl
idin
g sc
ale
base
d on
num
ber
of b
edro
oms
•Sl
idin
g sc
ale
base
d on
nu
mbe
r of
bed
room
s
San
Pabl
o
Park
ing
requ
irem
ents
fo
r m
ulti-
fam
ily a
re
depe
nden
t on
how
m
any
room
s ar
e in
eac
h un
it. (E
x.
a st
udio
or
one-
bedr
oom
uni
t wou
ld
only
requ
ire o
ne
park
ing
spac
e, e
tc.)
We
have
sta
ndar
ds
that
allo
w fo
r sh
ared
pa
rkin
g an
d re
duce
d pa
rkin
g st
anda
rds
whe
n lo
cate
d cl
ose
to
publ
ic tr
ansi
t.
San
Ram
onSh
ared
par
king
sta
ndar
ds
Sand
City
Revi
ewed
on
a ca
se-
by-c
ase
basi
s
Sant
a A
na
1 sp
ace
per
unit
plus
1
per
bdrm
plu
s gu
est
park
ing
25%
of r
es
requ
irem
ents
3 sp
ace
plus
1 p
er
bedr
oom
Tran
sit C
ode=
2 s
pace
pe
r re
s un
it pl
us 1
per
40
0 SF
non
res,
or
in
lieu
fee/
live
wor
k= 2
sp
aces
Sant
a Ba
rbar
a
Base
d on
Stu
dy1
spac
e/un
it if
resi
denti
al is
50%
or
less
of r
esid
entia
l pr
ojec
t
Sant
a Cl
ara
Coun
ty1.
5/un
it1.
5/un
itPe
r ro
omPe
r s.
f. or
per
em
ploy
ee
Sant
a Cl
arita
1 pe
r 5
occu
pant
sSh
ared
par
king
Sant
a Cr
uzBa
sed
on b
edro
oms.
Ass
umin
g 3
bedr
oom
s in
an
swer
Base
d on
em
ploy
ees
•

144 Annual Planning Survey Results 2012
Appendix B: Transportation, Mobility, and Parking
JuR
isd
icti
On
Mu
ltif
AM
ily
APA
RtM
ents
sin
Gle
fA
Mil
y At
tAch
ed
(cO
nd
OM
iniu
Ms)
du
Plex
eseM
eRG
ency
sh
elte
Rs
Mix
ed u
seG
eneR
Al
cOM
Men
ts
Sant
a Cr
uz C
ount
y•
••
••
Requ
irem
ents
are
ba
sed
on n
umbe
r of
be
droo
ms
or a
mou
nt
of c
omm
erci
al s
pace
, an
d th
e nu
mbe
r of
be
ds a
nd e
mpl
oyee
s fo
r em
erge
ncy
shel
ters
Sant
a Fe
Spr
ings
Com
bina
tion
of th
e pa
rkin
g re
quire
men
ts
for
the
uses
Sant
a M
aria
2.5
Vari
es b
y lo
catio
n 1-
2
Sant
a Pa
ula
Base
d on
num
ber
of
bedr
oom
s2
car
gara
ge 4
or
less
be
droo
ms
& 3
car
ga
rage
5+
bedr
oom
s
2 ca
r ga
rage
Per
CUP
Requ
ires
spec
ial
stud
y/pa
rkin
g an
alys
is
Sant
a Ro
sa1.
5 fo
r 1
bedr
oom
and
5 fo
r 2
bedr
oom
uni
ts1.
5 fo
r 1
bedr
oom
and
5
for
2 be
droo
ms
Sant
ee1.
5 sp
aces
for
1 be
d/st
u1.
5 sp
aces
for
1 be
d/st
u
Saus
alito
2 sp
aces
with
2+
bedr
oom
s. 1
.5 s
pace
s fo
r 1
bedr
oom
••
Seas
ide
1 sp
ace
per
unit
plus
on
e sp
ace
for
each
2
units
for
gues
t par
king
Base
d on
use
per
mit
findi
ngs
One
spa
ce fo
r on
e-be
droo
m u
nit a
nd
two
spac
es fo
r tw
o-be
droo
m u
nits
Com
mis
sion
has
di
scre
tion
to re
duce
pa
rkin
g fo
r m
ixed
-us
e pr
ojec
t bas
ed o
n re
view
of i
ndiv
idua
l ne
eds
Seba
stop
ol•
••
••
Stan
dard
s va
ry b
y nu
mbe
r of
bed
room
s,
mix
of u
ses;
spe
cial
st
anda
rd fo
r ho
mel
ess
shel
ters
.

Annual Planning Survey Results 2012 145
Appendix B: Transportation, Mobility, and Parking
JuR
isd
icti
On
Mu
ltif
AM
ily
APA
RtM
ents
sin
Gle
fA
Mil
y At
tAch
ed
(cO
nd
OM
iniu
Ms)
du
Plex
eseM
eRG
ency
sh
elte
Rs
Mix
ed u
seG
eneR
Al
cOM
Men
ts
Sign
al H
ill•
••
••
Slid
ing
scal
e ba
sed
on th
e nu
mbe
r of
be
droo
ms
Sim
i Val
ley
2.5
spac
es/
unit
2.5
spac
es/u
nit
Sola
na B
each
•
Sola
no C
ount
y•
•Pl
anni
ng C
omm
issi
on
to d
eter
min
e on
pr
ojec
t spe
cific
bas
is
Sole
dad
••
•
2 co
vere
d pa
rkin
g sp
aces
requ
ired
for
units
with
two
bedr
oom
s or
few
er;
2 1/
2 sp
aces
for
units
with
3 o
r m
ore
bedr
oom
s.
Solv
ang
Rang
es fr
om 1
to
2.5
spac
es b
ased
on
num
ber
of b
edro
oms
Sono
raD
epen
ds o
n U
se
Sout
h G
ate
Base
d on
bed
room
s
Sout
h Pa
sade
na1
bedr
oom
= 1
spa
ce; 2
bed
room
= 2
spa
ces;
1 g
uest
for
ever
y 2
1 be
droo
m =
1 s
pace
; 2
bedr
oom
= 2
spa
ces;
1
gues
t for
eve
ry 2
Sout
h Sa
n Fr
anci
sco
••
••
•
Num
ber
of s
pace
s ba
sed
on n
umbe
r of
bed
room
s an
d/or
flo
or a
rea
Stan
isla
us C
ount
y
1 1/
2 sp
aces
per
uni
t1
1/2
spac
es p
er u
nit
Det
erm
ined
by
com
bini
ng in
divi
dual
re
quire
men
ts fo
r ea
ch
use
Stan
ton
Plus
one
gue
st s
pace
fo
r ev
ery
3 un
itsPl
us o
ne g
uest
spa
ce
for
ever
y 2
units
2 sp
aces
for
resi
denti
al p
lus
1/30
0sf.
for
com
mer
cial
ele
men
t
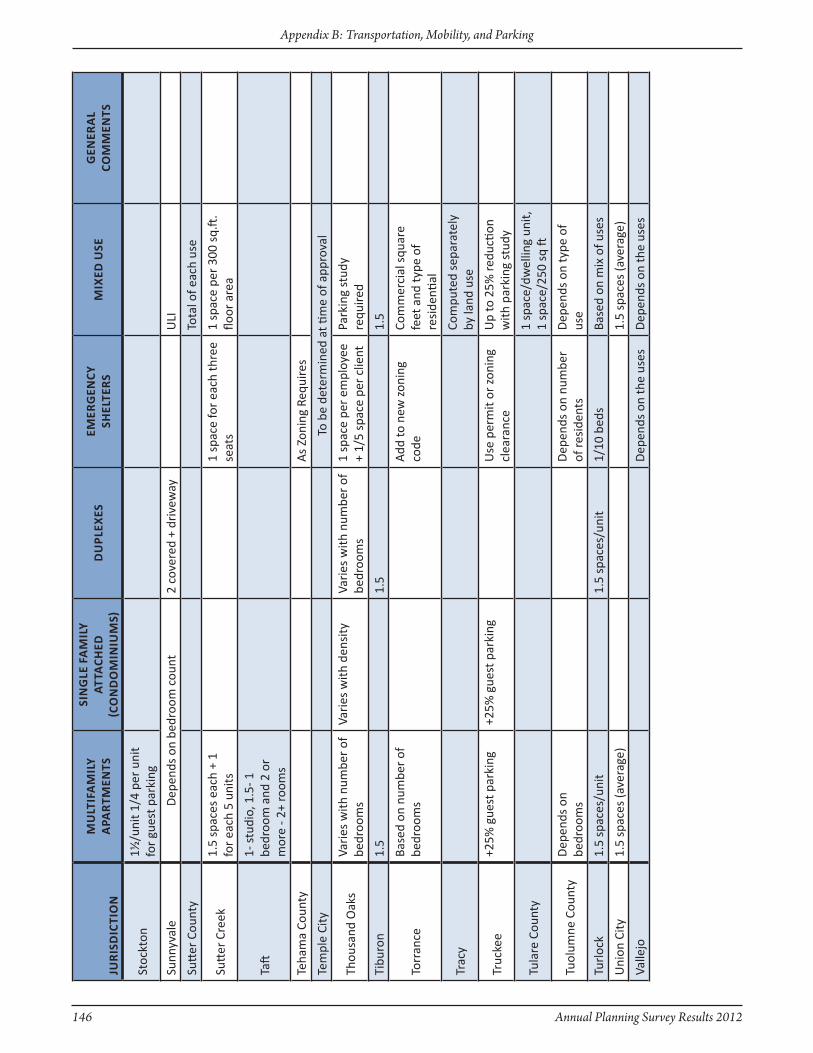
146 Annual Planning Survey Results 2012
Appendix B: Transportation, Mobility, and Parking
JuR
isd
icti
On
Mu
ltif
AM
ily
APA
RtM
ents
sin
Gle
fA
Mil
y At
tAch
ed
(cO
nd
OM
iniu
Ms)
du
Plex
eseM
eRG
ency
sh
elte
Rs
Mix
ed u
seG
eneR
Al
cOM
Men
ts
Stoc
kton
1½/u
nit 1
/4 p
er u
nit
for
gues
t par
king
Sunn
yval
eD
epen
ds o
n be
droo
m c
ount
2 co
vere
d +
driv
eway
ULI
Sutt
er C
ount
yTo
tal o
f eac
h us
e
Sutt
er C
reek
1.5
spac
es e
ach
+ 1
for
each
5 u
nits
1 sp
ace
for
each
thre
e se
ats
1 sp
ace
per
300
sq.ft
. flo
or a
rea
Taft
1- s
tudi
o, 1
.5- 1
be
droo
m a
nd 2
or
mor
e - 2
+ ro
oms
Teha
ma
Coun
tyA
s zo
ning
Req
uire
s
Tem
ple
City
To b
e de
term
ined
at ti
me
of a
ppro
val
Thou
sand
Oak
sVa
ries
with
num
ber
of
bedr
oom
sVa
ries
with
den
sity
Vari
es w
ith n
umbe
r of
be
droo
ms
1 sp
ace
per
empl
oyee
+
1/5
spac
e pe
r cl
ient
Park
ing
stud
y re
quire
d
Tibu
ron
1.5
1.5
1.5
Torr
ance
Base
d on
num
ber
of
bedr
oom
sA
dd to
new
zon
ing
code
Com
mer
cial
squ
are
feet
and
type
of
resi
denti
al
Trac
yCo
mpu
ted
sepa
rate
ly
by la
nd u
se
Truc
kee
+25%
gue
st p
arki
ng+2
5% g
uest
par
king
Use
per
mit
or z
onin
g cl
eara
nce
Up
to 2
5% re
ducti
on
with
par
king
stu
dy
Tula
re C
ount
y1
spac
e/dw
ellin
g un
it,
1 sp
ace/
250
sq ft
Tuol
umne
Cou
nty
Dep
ends
on
bedr
oom
sD
epen
ds o
n nu
mbe
r of
resi
dent
sD
epen
ds o
n ty
pe o
f us
e
Turl
ock
1.5
spac
es/u
nit
1.5
spac
es/u
nit
1/10
bed
sBa
sed
on m
ix o
f use
s
Uni
on C
ity1.
5 sp
aces
(ave
rage
)1.
5 sp
aces
(ave
rage
)
Valle
joD
epen
ds o
n th
e us
esD
epen
ds o
n th
e us
es

Annual Planning Survey Results 2012 147
Appendix B: Transportation, Mobility, and Parking
JuR
isd
icti
On
Mu
ltif
AM
ily
APA
RtM
ents
sin
Gle
fA
Mil
y At
tAch
ed
(cO
nd
OM
iniu
Ms)
du
Plex
eseM
eRG
ency
sh
elte
Rs
Mix
ed u
seG
eneR
Al
cOM
Men
ts
Vent
ura
Coun
ty•
••
Park
ing
requ
irem
ents
va
ry b
y ty
pe o
f pa
rkin
g, #
bed
room
s an
d m
ixed
use
in
clud
es s
um o
r to
tal f
or e
ach
use
with
pro
visi
ons
for
redu
cing
with
sha
red
park
ing
Vict
orvi
lleD
eter
min
ed b
y Co
mm
issi
on
Visa
lia1.
5 sp
aces
/uni
t•
1.5
spac
es/u
nit
1 sp
ace/
3 be
ds1.
5 sp
aces
/uni
t
Wal
nut
Det
erm
ined
by
Plan
ning
Com
mis
sion
Wal
nut C
reek
Vari
es b
ased
on
num
ber
of b
edro
oms
.25
per
bed
+ 1
per
empl
oyee
Vari
es b
ased
on
num
ber
of b
edro
oms
Was
co•
Wes
t Cov
ina
2.1
per
unit
2.25
per
uni
t
Wes
t Hol
lyw
ood
Vari
es b
y nu
mbe
r of
bed
room
sVa
ries
by
num
ber
of b
edro
oms
for
resi
denti
al c
ompo
nent
of
mix
ed-u
se
Wes
tlake
Vill
age
••
Park
ing
as re
quire
d fo
r pr
imar
y or
mos
t in
tens
e us
e.
Wes
tmin
ster
1 or
few
er b
edro
oms
= 1
car
gara
ge p
lus
0.5
open
; 2 b
edro
om =
1 g
arag
e pl
us 1
ope
n; 3
or
mor
e be
droo
ms
= 2
gara
ge a
nd 0
.5 o
pen
•
Whi
ttier
Dep
ends
on
# of
be
droo
ms
2 en
clos
ed2
unen
clos
edD
epen
ds o
n #
of
bedr
oom
s1/
8 be
ds p
lus
1/si
te
man
ager
Sum
of e
ach
use
prop
osed
Will
itsFo
r 3+
bed
room
s, 1
1/2
for
up to
2 b
edro
oms
1 fo
r ev
ery
2 be
dsCo
mbi
natio
n of
re
side
ntial
and
co
mm
erci
al s
tand
ards
Will
ows
2 sp
aces
for
each
dw
ellin
g un
it w
ith 2
or
mor
e be
droo
ms
1 pa
rkin
g sp
ace
for
10
beds
and
1 s
pace
for
each
sta
ff p
erso
n
1 sp
ace
plus
2
man
ager
par
king
sp
aces
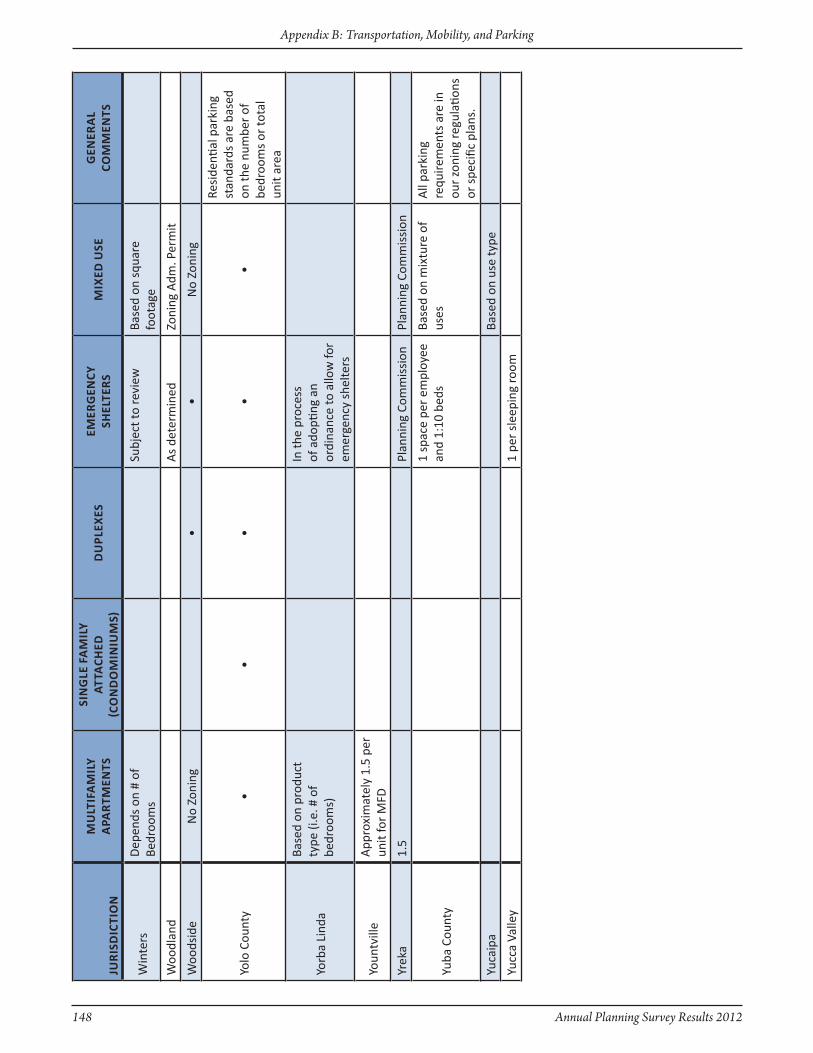
148 Annual Planning Survey Results 2012
Appendix B: Transportation, Mobility, and Parking
JuR
isd
icti
On
Mu
ltif
AM
ily
APA
RtM
ents
sin
Gle
fA
Mil
y At
tAch
ed
(cO
nd
OM
iniu
Ms)
du
Plex
eseM
eRG
ency
sh
elte
Rs
Mix
ed u
seG
eneR
Al
cOM
Men
ts
Win
ters
Dep
ends
on
# of
Be
droo
ms
Subj
ect t
o re
view
Base
d on
squ
are
foot
age
Woo
dlan
dA
s de
term
ined
zoni
ng A
dm. P
erm
it
Woo
dsid
eN
o zo
ning
••
No
zoni
ng
Yolo
Cou
nty
••
••
•
Resi
denti
al p
arki
ng
stan
dard
s ar
e ba
sed
on th
e nu
mbe
r of
be
droo
ms
or to
tal
unit
area
Yorb
a Li
nda
Base
d on
pro
duct
ty
pe (i
.e. #
of
bedr
oom
s)
In th
e pr
oces
s of
ado
pting
an
ordi
nanc
e to
allo
w fo
r em
erge
ncy
shel
ters
Youn
tvill
eA
ppro
xim
atel
y 1.
5 pe
r un
it fo
r M
FD
Yrek
a1.
5Pl
anni
ng C
omm
issi
onPl
anni
ng C
omm
issi
on
Yuba
Cou
nty
1 sp
ace
per
empl
oyee
an
d 1:
10 b
eds
Base
d on
mix
ture
of
uses
All
park
ing
requ
irem
ents
are
in
our
zoni
ng re
gula
tions
or
spe
cific
pla
ns.
Yuca
ipa
Base
d on
use
type
Yucc
a Va
lley
1 pe
r sl
eepi
ng ro
om
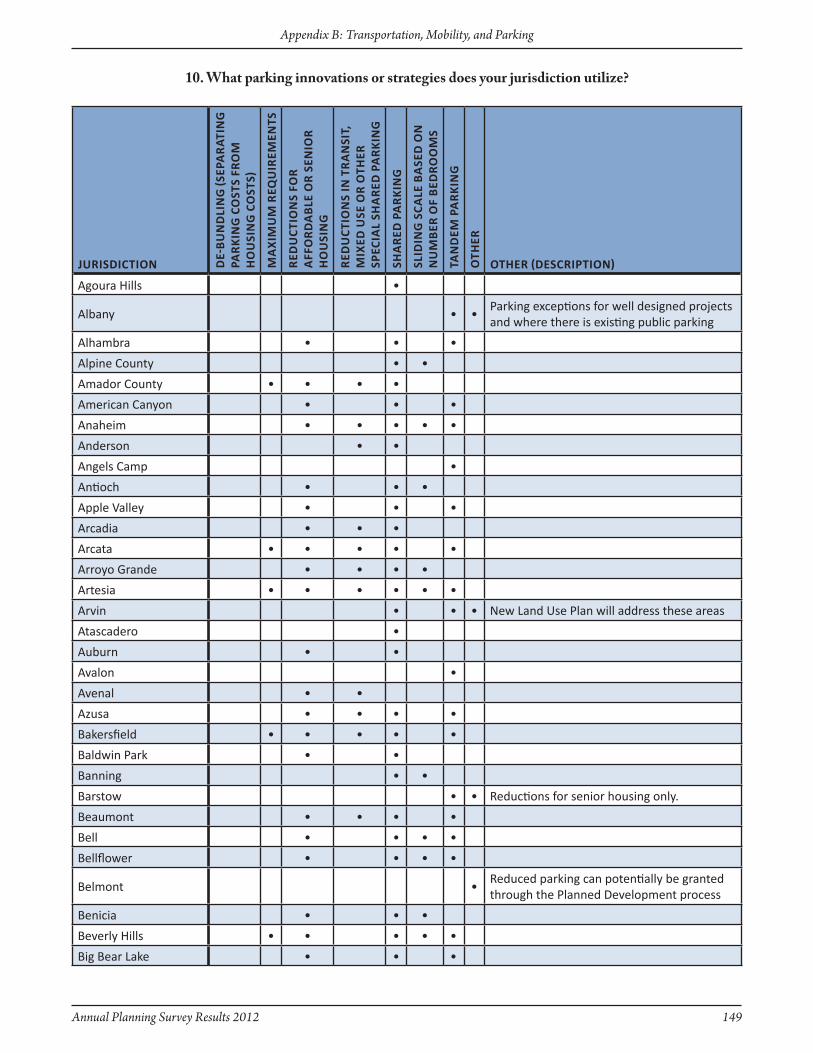
Annual Planning Survey Results 2012 149
Appendix B: Transportation, Mobility, and Parking
JuRisdictiOn de-
Bu
nd
lin
G (s
ePA
RAt
inG
PA
Rk
inG
cO
sts
fRO
M
hO
usi
nG
cO
sts)
MA
xiM
uM
ReQ
uiR
eMen
ts
Red
uct
iOn
s fO
R
Aff
OR
dA
Ble
OR
sen
iOR
H
ou
Sin
g
Red
uc
tiO
ns
in t
RA
nsi
t,
Mix
ed u
se O
R O
theR
sP
eciA
l sh
AR
ed P
AR
kin
G
shA
Red
PA
Rk
inG
slid
inG
scA
le B
Ase
d O
n
nu
MB
eR O
f B
edR
OO
Ms
tAn
deM
PA
Rk
inG
Oth
eR
OtheR (descRiPtiOn)
Agoura Hills •
Albany • •Parking exceptions for well designed projects and where there is existing public parking
Alhambra • • •
Alpine County • •
Amador County • • • •
American Canyon • • •
Anaheim • • • • •
Anderson • •
Angels Camp •
Antioch • • •
Apple Valley • • •
Arcadia • • •
Arcata • • • • •
Arroyo Grande • • • •
Artesia • • • • • •
Arvin • • • New Land Use Plan will address these areas
Atascadero •
Auburn • •
Avalon •
Avenal • •
Azusa • • • •
Bakersfield • • • • •
Baldwin Park • •
Banning • •
Barstow • • Reductions for senior housing only.
Beaumont • • • •
Bell • • • •
Bellflower • • • •
Belmont •Reduced parking can potentially be granted through the Planned Development process
Benicia • • •
Beverly Hills • • • • •
Big Bear Lake • • •
10. What parking innovations or strategies does your jurisdiction utilize?
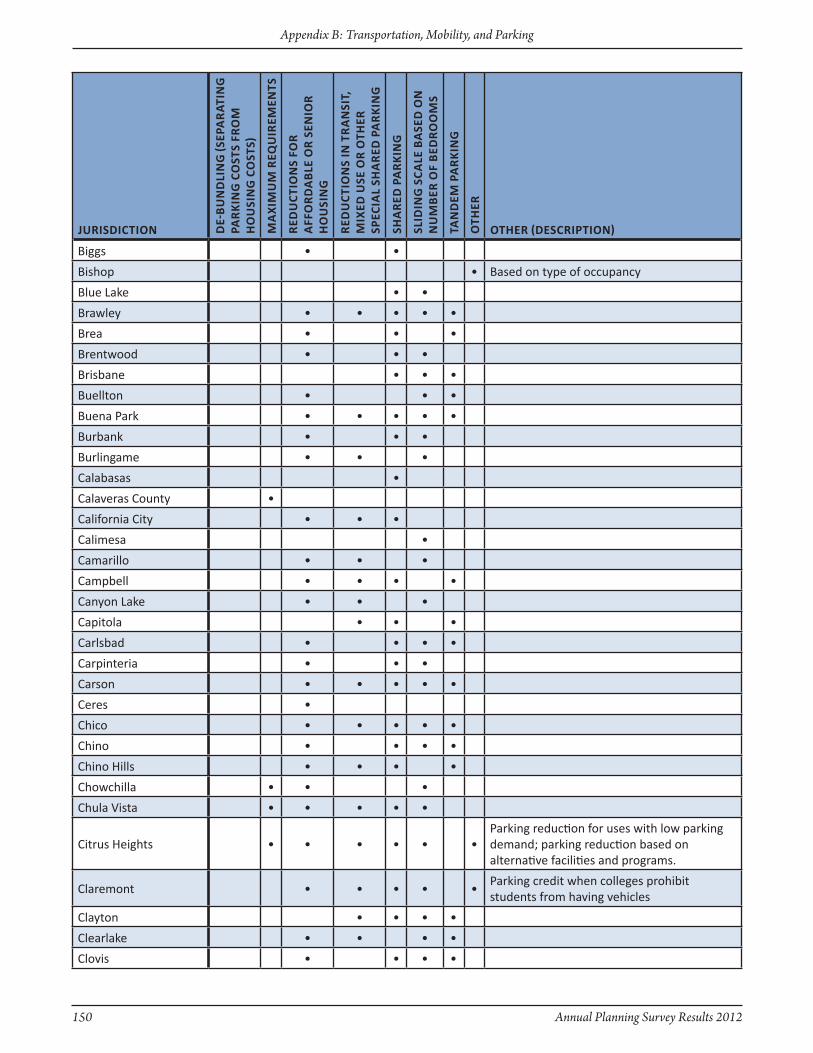
150 Annual Planning Survey Results 2012
Appendix B: Transportation, Mobility, and Parking
JuRisdictiOn de-
Bu
nd
lin
G (s
ePA
RAt
inG
PA
Rk
inG
cO
sts
fRO
M
hO
usi
nG
cO
sts)
MA
xiM
uM
ReQ
uiR
eMen
ts
Red
uct
iOn
s fO
R
Aff
OR
dA
Ble
OR
sen
iOR
H
ou
Sin
g
Red
uc
tiO
ns
in t
RA
nsi
t,
Mix
ed u
se O
R O
theR
sP
eciA
l sh
AR
ed P
AR
kin
G
shA
Red
PA
Rk
inG
slid
inG
scA
le B
Ase
d O
n
nu
MB
eR O
f B
edR
OO
Ms
tAn
deM
PA
Rk
inG
Oth
eR
OtheR (descRiPtiOn)
Biggs • •
Bishop • Based on type of occupancy
Blue Lake • •
Brawley • • • • •
Brea • • •
Brentwood • • •
Brisbane • • •
Buellton • • •
Buena Park • • • • •
Burbank • • •
Burlingame • • •
Calabasas •
Calaveras County •
California City • • •
Calimesa •
Camarillo • • •
Campbell • • • •
Canyon Lake • • •
Capitola • • •
Carlsbad • • • •
Carpinteria • • •
Carson • • • • •
Ceres •
Chico • • • • •
Chino • • • •
Chino Hills • • • •
Chowchilla • • •
Chula Vista • • • • •
Citrus Heights • • • • • •Parking reduction for uses with low parking demand; parking reduction based on alternative facilities and programs.
Claremont • • • • •Parking credit when colleges prohibit students from having vehicles
Clayton • • • •
Clearlake • • • •
Clovis • • • •

Annual Planning Survey Results 2012 151
Appendix B: Transportation, Mobility, and Parking
JuRisdictiOn de-
Bu
nd
lin
G (s
ePA
RAt
inG
PA
Rk
inG
cO
sts
fRO
M
hO
usi
nG
cO
sts)
MA
xiM
uM
ReQ
uiR
eMen
ts
Red
uct
iOn
s fO
R
Aff
OR
dA
Ble
OR
sen
iOR
H
ou
Sin
g
Red
uc
tiO
ns
in t
RA
nsi
t,
Mix
ed u
se O
R O
theR
sP
eciA
l sh
AR
ed P
AR
kin
G
shA
Red
PA
Rk
inG
slid
inG
scA
le B
Ase
d O
n
nu
MB
eR O
f B
edR
OO
Ms
tAn
deM
PA
Rk
inG
Oth
eR
OtheR (descRiPtiOn)
Coachella • •
Coalinga • •
Colma •
Colton • •
Commerce •
Concord • • • •
Contra Costa County • • TDM
Corona • • • Shared parking for off-peak uses
Coronado • • •
Costa Mesa • • •
Covina • •
Culver City • • •
Cupertino • • • •
Cypress • • •
Daly City • • •
Dana Point • • • • Parking Management Plans
Danville • • • • •
Davis • • • • • • • Depends on project
Del Mar • • •
Del Rey Oaks •
Delano • •
Desert Hot Springs • • •
Diamond Bar • • •
Dinuba •
Dixon • • • •
Duarte • • •
Dublin • • • • •Off-site parking; compact and motorcycle space substitution
East Palo Alto • •
El Cajon • •
El Centro • • • • •
El Cerrito • • • • •
El Dorado County • •
El Monte • • • •
Elk Grove •
Emeryville • • • •

152 Annual Planning Survey Results 2012
Appendix B: Transportation, Mobility, and Parking
JuRisdictiOn de-
Bu
nd
lin
G (s
ePA
RAt
inG
PA
Rk
inG
cO
sts
fRO
M
hO
usi
nG
cO
sts)
MA
xiM
uM
ReQ
uiR
eMen
ts
Red
uct
iOn
s fO
R
Aff
OR
dA
Ble
OR
sen
iOR
H
ou
Sin
g
Red
uc
tiO
ns
in t
RA
nsi
t,
Mix
ed u
se O
R O
theR
sP
eciA
l sh
AR
ed P
AR
kin
G
shA
Red
PA
Rk
inG
slid
inG
scA
le B
Ase
d O
n
nu
MB
eR O
f B
edR
OO
Ms
tAn
deM
PA
Rk
inG
Oth
eR
OtheR (descRiPtiOn)
Encinitas • • • •
Escondido • • • • •
Exeter • •
Fairfax • • •
Fairfield • • • • •
Fillmore • • • •
Firebaugh •
Folsom • • • •
Fontana • • • • •
Fort Bragg • • • • • •
Use of on street parking for a portion of requirement, if not a parking impacted neighborhood. Parking In Lieu fee if development in the Central Business District
Fortuna • • •
Foster City • • • •
Fountain Valley • •
Fowler •
Fremont • • •
Fresno • • • •
Fullerton • •
Garden Grove • • •
Gardena • •
Gilroy •
Glendale • • • • •
Glendora • • •
Glenn County • • •
Goleta • • •
Gonzales • •
Grand Terrace •
Grass Valley • • • •
Greenfield •
Gridley • • • •
Grover Beach • • •
Gustine •
There are various procedures for the reduction of parking requirements such as parking in lieu fee off hour uses and other design considerations.
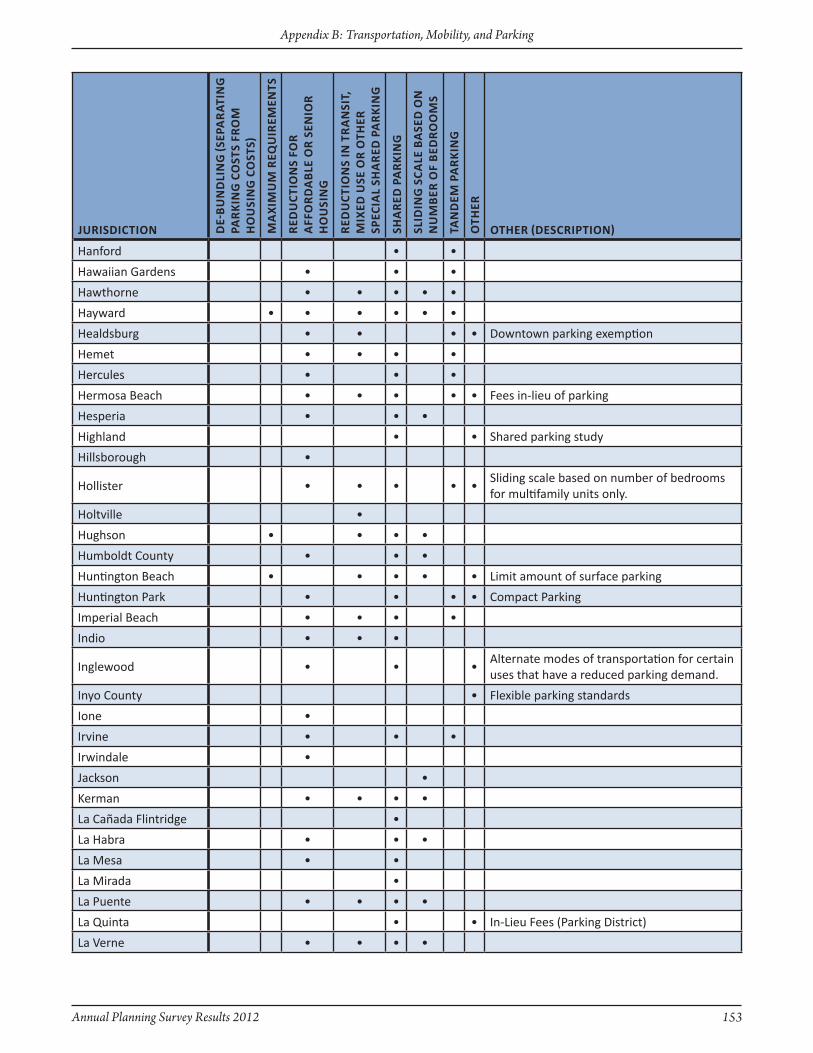
Annual Planning Survey Results 2012 153
Appendix B: Transportation, Mobility, and Parking
JuRisdictiOn de-
Bu
nd
lin
G (s
ePA
RAt
inG
PA
Rk
inG
cO
sts
fRO
M
hO
usi
nG
cO
sts)
MA
xiM
uM
ReQ
uiR
eMen
ts
Red
uct
iOn
s fO
R
Aff
OR
dA
Ble
OR
sen
iOR
H
ou
Sin
g
Red
uc
tiO
ns
in t
RA
nsi
t,
Mix
ed u
se O
R O
theR
sP
eciA
l sh
AR
ed P
AR
kin
G
shA
Red
PA
Rk
inG
slid
inG
scA
le B
Ase
d O
n
nu
MB
eR O
f B
edR
OO
Ms
tAn
deM
PA
Rk
inG
Oth
eR
OtheR (descRiPtiOn)
Hanford • •
Hawaiian Gardens • • •
Hawthorne • • • • •
Hayward • • • • • •
Healdsburg • • • • Downtown parking exemption
Hemet • • • •
Hercules • • •
Hermosa Beach • • • • • Fees in-lieu of parking
Hesperia • • •
Highland • • Shared parking study
Hillsborough •
Hollister • • • • •Sliding scale based on number of bedrooms for multifamily units only.
Holtville •
Hughson • • • •
Humboldt County • • •
Huntington Beach • • • • • Limit amount of surface parking
Huntington Park • • • • Compact Parking
Imperial Beach • • • •
Indio • • •
Inglewood • • •Alternate modes of transportation for certain uses that have a reduced parking demand.
Inyo County • Flexible parking standards
Ione •
Irvine • • •
Irwindale •
Jackson •
Kerman • • • •
La Cañada Flintridge •
La Habra • • •
La Mesa • •
La Mirada •
La Puente • • • •
La Quinta • • In-Lieu Fees (Parking District)
La Verne • • • •
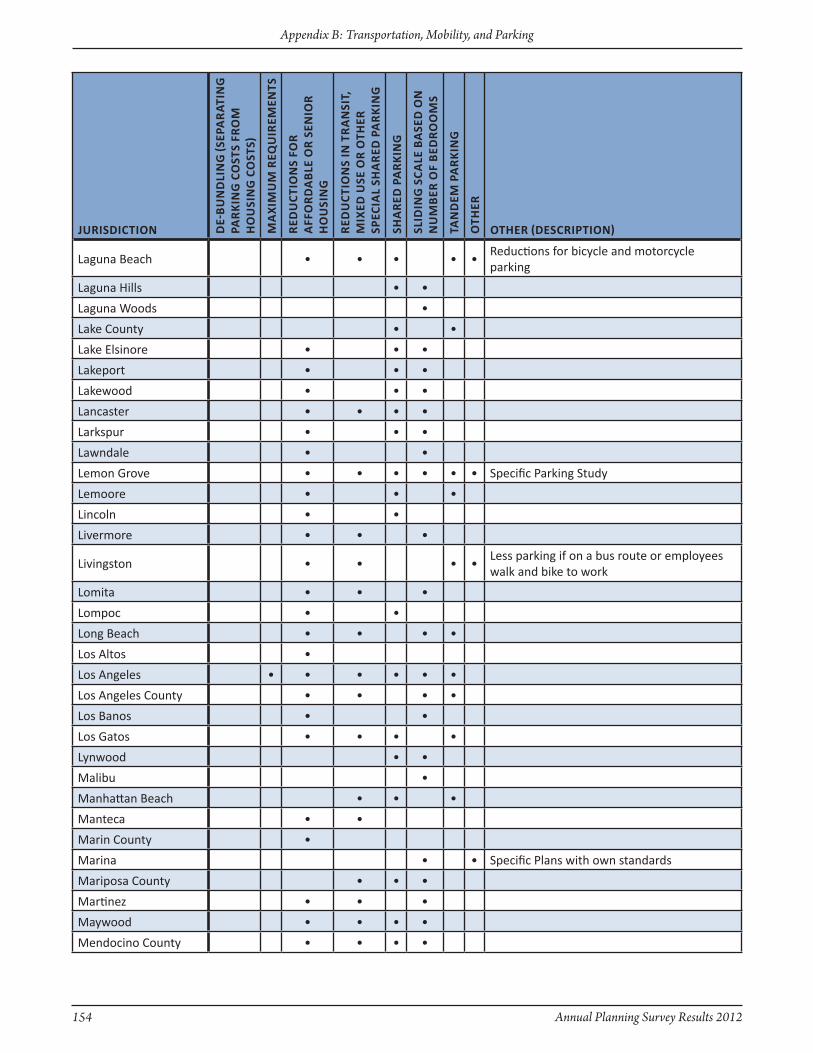
154 Annual Planning Survey Results 2012
Appendix B: Transportation, Mobility, and Parking
JuRisdictiOn de-
Bu
nd
lin
G (s
ePA
RAt
inG
PA
Rk
inG
cO
sts
fRO
M
hO
usi
nG
cO
sts)
MA
xiM
uM
ReQ
uiR
eMen
ts
Red
uct
iOn
s fO
R
Aff
OR
dA
Ble
OR
sen
iOR
H
ou
Sin
g
Red
uc
tiO
ns
in t
RA
nsi
t,
Mix
ed u
se O
R O
theR
sP
eciA
l sh
AR
ed P
AR
kin
G
shA
Red
PA
Rk
inG
slid
inG
scA
le B
Ase
d O
n
nu
MB
eR O
f B
edR
OO
Ms
tAn
deM
PA
Rk
inG
Oth
eR
OtheR (descRiPtiOn)
Laguna Beach • • • • •Reductions for bicycle and motorcycle parking
Laguna Hills • •
Laguna Woods •
Lake County • •
Lake Elsinore • • •
Lakeport • • •
Lakewood • • •
Lancaster • • • •
Larkspur • • •
Lawndale • •
Lemon Grove • • • • • • Specific Parking Study
Lemoore • • •
Lincoln • •
Livermore • • •
Livingston • • • •Less parking if on a bus route or employees walk and bike to work
Lomita • • •
Lompoc • •
Long Beach • • • •
Los Altos •
Los Angeles • • • • • •
Los Angeles County • • • •
Los Banos • •
Los Gatos • • • •
Lynwood • •
Malibu •
Manhattan Beach • • •
Manteca • •
Marin County •
Marina • • Specific Plans with own standards
Mariposa County • • •
Martinez • • •
Maywood • • • •
Mendocino County • • • •
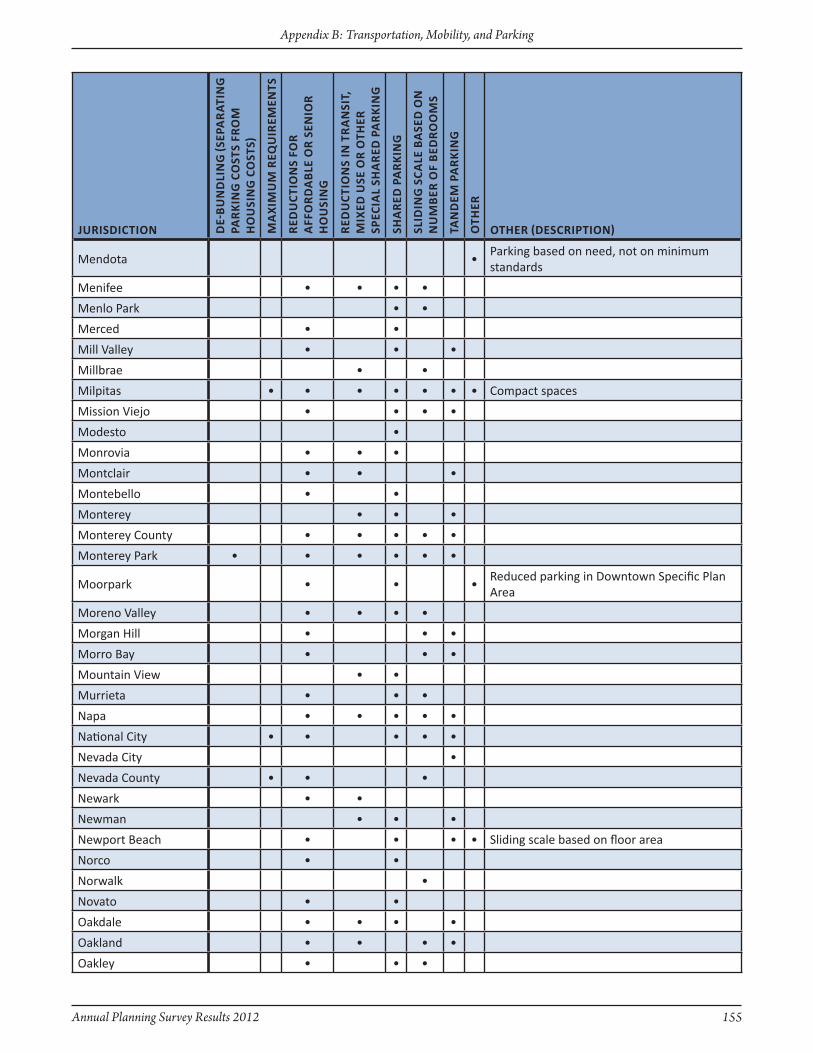
Annual Planning Survey Results 2012 155
Appendix B: Transportation, Mobility, and Parking
JuRisdictiOn de-
Bu
nd
lin
G (s
ePA
RAt
inG
PA
Rk
inG
cO
sts
fRO
M
hO
usi
nG
cO
sts)
MA
xiM
uM
ReQ
uiR
eMen
ts
Red
uct
iOn
s fO
R
Aff
OR
dA
Ble
OR
sen
iOR
H
ou
Sin
g
Red
uc
tiO
ns
in t
RA
nsi
t,
Mix
ed u
se O
R O
theR
sP
eciA
l sh
AR
ed P
AR
kin
G
shA
Red
PA
Rk
inG
slid
inG
scA
le B
Ase
d O
n
nu
MB
eR O
f B
edR
OO
Ms
tAn
deM
PA
Rk
inG
Oth
eR
OtheR (descRiPtiOn)
Mendota •Parking based on need, not on minimum standards
Menifee • • • •
Menlo Park • •
Merced • •
Mill Valley • • •
Millbrae • •
Milpitas • • • • • • • Compact spaces
Mission Viejo • • • •
Modesto •
Monrovia • • •
Montclair • • •
Montebello • •
Monterey • • •
Monterey County • • • • •
Monterey Park • • • • • •
Moorpark • • •Reduced parking in Downtown Specific Plan Area
Moreno Valley • • • •
Morgan Hill • • •
Morro Bay • • •
Mountain View • •
Murrieta • • •
Napa • • • • •
National City • • • • •
Nevada City •
Nevada County • • •
Newark • •
Newman • • •
Newport Beach • • • • Sliding scale based on floor area
Norco • •
Norwalk •
Novato • •
Oakdale • • • •
Oakland • • • •
Oakley • • •

156 Annual Planning Survey Results 2012
Appendix B: Transportation, Mobility, and Parking
JuRisdictiOn de-
Bu
nd
lin
G (s
ePA
RAt
inG
PA
Rk
inG
cO
sts
fRO
M
hO
usi
nG
cO
sts)
MA
xiM
uM
ReQ
uiR
eMen
ts
Red
uct
iOn
s fO
R
Aff
OR
dA
Ble
OR
sen
iOR
H
ou
Sin
g
Red
uc
tiO
ns
in t
RA
nsi
t,
Mix
ed u
se O
R O
theR
sP
eciA
l sh
AR
ed P
AR
kin
G
shA
Red
PA
Rk
inG
slid
inG
scA
le B
Ase
d O
n
nu
MB
eR O
f B
edR
OO
Ms
tAn
deM
PA
Rk
inG
Oth
eR
OtheR (descRiPtiOn)
Oceanside • • • • •De-bundling recommended (though not codified) in Coast Hwy Vision Plan
Ojai • • •
Ontario • • • •
Orange • • • • Parking district
Orange County • • •For multi-family guest parking, sliding scale based on unit square footage.
Orange Cove •
Orinda • • • •
Orland • •
Oroville • •
Oxnard • • • • •
Pacific Grove • • •
Pacifica • •
Palm Desert • •
Palm Springs • •
Palmdale • •
Reduced parking requirements within CD-Mx (Downtown Commercial, Mixed Use Transition) zone and Transit Village Specific Plan
Palo Alto • •
Paradise • • • Off-site, on street
Paramount •
Pasadena • • • • • • Parking credit program
Paso Robles • • • • •Reduced parking requirements in Uptown/Town Centre Specific Plan Area
Patterson • •
Perris • • • • •
Pico Rivera •
Piedmont • • •
Pinole • • • • •
Pittsburg • • • • • • •
Placer County • • • •
Placerville • • • •
Pleasant Hill • • • • •
Pleasanton • • • •
Pomona • •

Annual Planning Survey Results 2012 157
Appendix B: Transportation, Mobility, and Parking
JuRisdictiOn de-
Bu
nd
lin
G (s
ePA
RAt
inG
PA
Rk
inG
cO
sts
fRO
M
hO
usi
nG
cO
sts)
MA
xiM
uM
ReQ
uiR
eMen
ts
Red
uct
iOn
s fO
R
Aff
OR
dA
Ble
OR
sen
iOR
H
ou
Sin
g
Red
uc
tiO
ns
in t
RA
nsi
t,
Mix
ed u
se O
R O
theR
sP
eciA
l sh
AR
ed P
AR
kin
G
shA
Red
PA
Rk
inG
slid
inG
scA
le B
Ase
d O
n
nu
MB
eR O
f B
edR
OO
Ms
tAn
deM
PA
Rk
inG
Oth
eR
OtheR (descRiPtiOn)
Port Hueneme • •
Porterville • • • • •
Portola • • •Requirements can be waived or reduced in downtown and old town overlay areas.
Poway • •
Rancho Cordova • • • • •
Rancho Cucamonga • • •
Rancho Palos Verdes • • •
Rancho Santa Margarita
• •
Red Bluff • • • •
Redding • • • •
Redlands • • • • •
Redondo Beach • •
Redwood City • • • • • • • In-lieu parking fee in downtown
Reedley • • •Commercial parkings districts/public parking lots
Rialto • •
Richmond • •
Riverbank • Ratio is based on Site Plan Review
Riverside • • • • • •
Riverside County • • • • •
Rocklin • • •
Rohnert Park •
Rolling Hills Estates • •
Rosemead • • • • •
Roseville • • •
Ross • •
Sacramento County • • • •
Salinas • • • •
San Anselmo • • • •
San Benito County • •
San Bernardino • • •
San Bernardino County • • • • •
San Bruno •
San Carlos • • • • • •

158 Annual Planning Survey Results 2012
Appendix B: Transportation, Mobility, and Parking
JuRisdictiOn de-
Bu
nd
lin
G (s
ePA
RAt
inG
PA
Rk
inG
cO
sts
fRO
M
hO
usi
nG
cO
sts)
MA
xiM
uM
ReQ
uiR
eMen
ts
Red
uct
iOn
s fO
R
Aff
OR
dA
Ble
OR
sen
iOR
H
ou
Sin
g
Red
uc
tiO
ns
in t
RA
nsi
t,
Mix
ed u
se O
R O
theR
sP
eciA
l sh
AR
ed P
AR
kin
G
shA
Red
PA
Rk
inG
slid
inG
scA
le B
Ase
d O
n
nu
MB
eR O
f B
edR
OO
Ms
tAn
deM
PA
Rk
inG
Oth
eR
OtheR (descRiPtiOn)
San Clemente • • •
San Diego • • • • •
San Diego County •Parking assessment districts, special area regulations
San Dimas • • • •
San Fernando • • • • •
San Francisco • • • • • • Stacked parking; carshare pods
San Gabriel • •
San Jacinto • • • •
San Joaquin • • •
San Jose • • • • • •
San Juan Capistrano • • • •
San Leandro • • • • • • •
San Luis Obispo • • • • •
San Luis Obispo County • • • • • • Mixed use reductions, Off-site parking
San Marcos • • •
San Marino •
San Mateo • • • • • • •
San Pablo • • •
San Rafael • • • • •
San Ramon • • • • •
Sand City • •
Sanger • • •
Santa Ana • • • •
Santa Barbara • • • • • •
Santa Clara County •
Santa Clarita • • • • •
Santa Cruz • • • •We are currently revising parking standards to create mixed use standards and other parking reduction incentives.
Santa Cruz County • • • • •
Santa Maria •
Santa Monica • •In process of considering TOD parking standards as appropriate
Santa Paula • • •
Santa Rosa • • • • • •
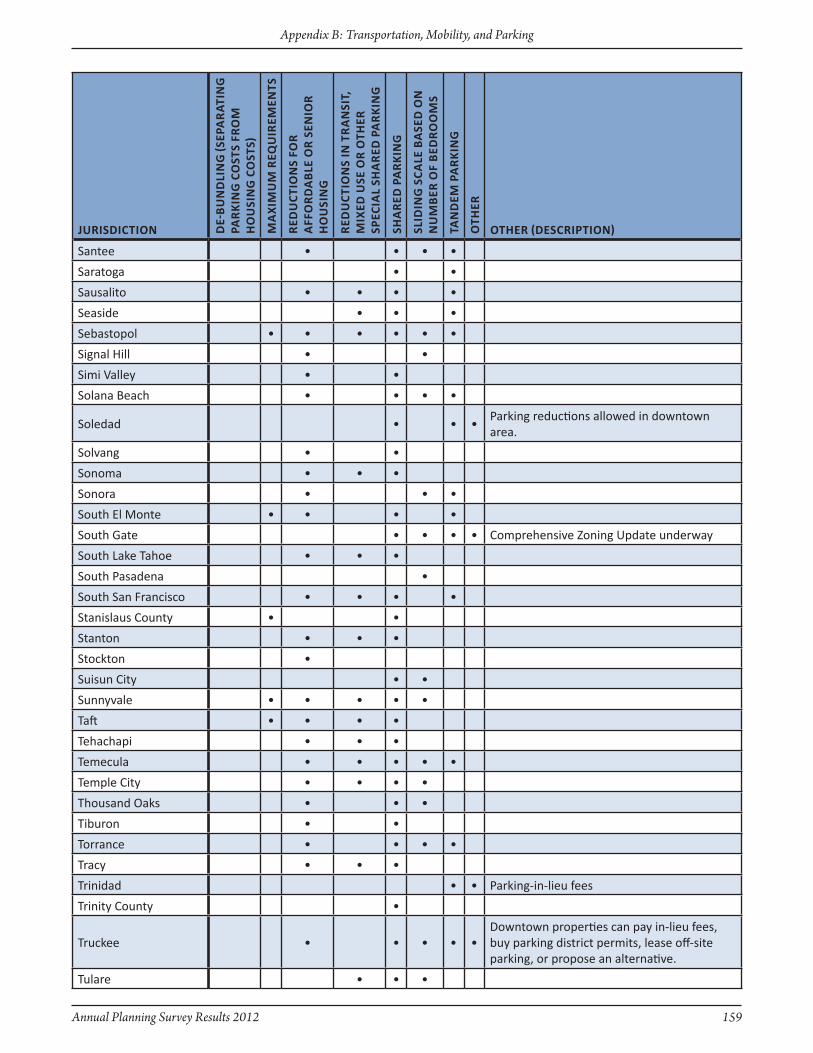
Annual Planning Survey Results 2012 159
Appendix B: Transportation, Mobility, and Parking
JuRisdictiOn de-
Bu
nd
lin
G (s
ePA
RAt
inG
PA
Rk
inG
cO
sts
fRO
M
hO
usi
nG
cO
sts)
MA
xiM
uM
ReQ
uiR
eMen
ts
Red
uct
iOn
s fO
R
Aff
OR
dA
Ble
OR
sen
iOR
H
ou
Sin
g
Red
uc
tiO
ns
in t
RA
nsi
t,
Mix
ed u
se O
R O
theR
sP
eciA
l sh
AR
ed P
AR
kin
G
shA
Red
PA
Rk
inG
slid
inG
scA
le B
Ase
d O
n
nu
MB
eR O
f B
edR
OO
Ms
tAn
deM
PA
Rk
inG
Oth
eR
OtheR (descRiPtiOn)
Santee • • • •
Saratoga • •
Sausalito • • • •
Seaside • • •
Sebastopol • • • • • •
Signal Hill • •
Simi Valley • •
Solana Beach • • • •
Soledad • • •Parking reductions allowed in downtown area.
Solvang • •
Sonoma • • •
Sonora • • •
South El Monte • • • •
South Gate • • • • Comprehensive zoning Update underway
South Lake Tahoe • • •
South Pasadena •
South San Francisco • • • •
Stanislaus County • •
Stanton • • •
Stockton •
Suisun City • •
Sunnyvale • • • • •
Taft • • • •
Tehachapi • • •
Temecula • • • • •
Temple City • • • •
Thousand Oaks • • •
Tiburon • •
Torrance • • • •
Tracy • • •
Trinidad • • Parking-in-lieu fees
Trinity County •
Truckee • • • • •Downtown properties can pay in-lieu fees, buy parking district permits, lease off-site parking, or propose an alternative.
Tulare • • •
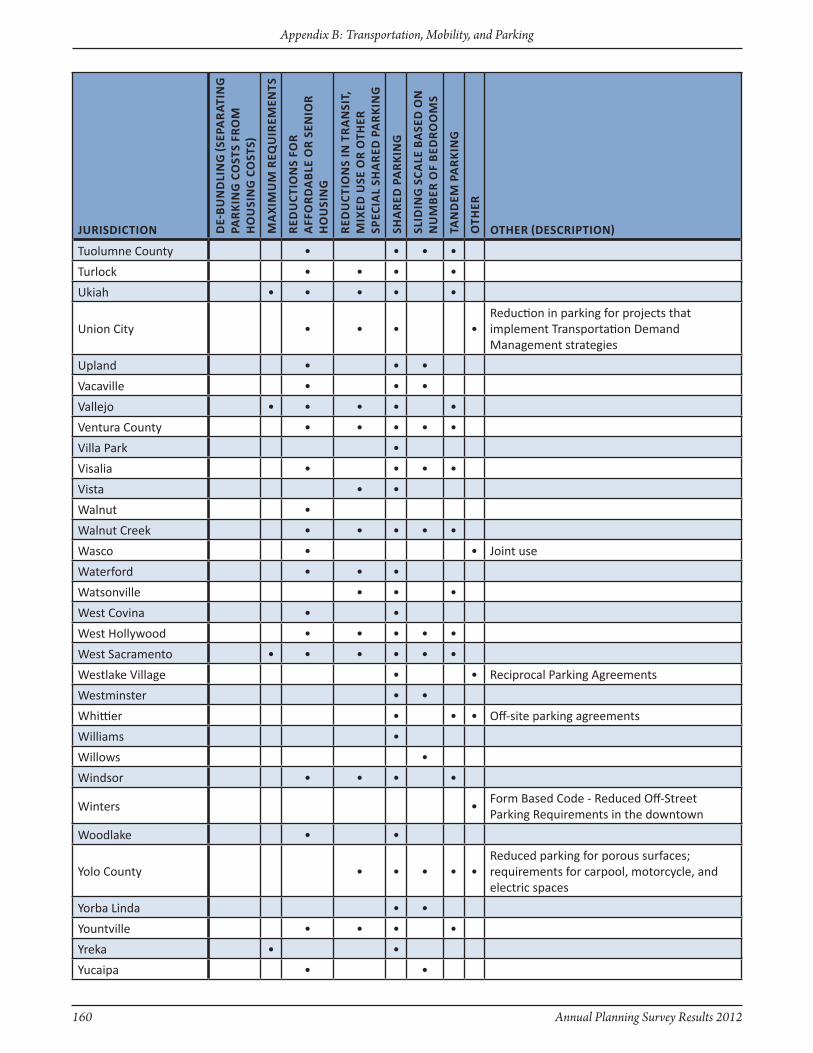
160 Annual Planning Survey Results 2012
Appendix B: Transportation, Mobility, and Parking
JuRisdictiOn de-
Bu
nd
lin
G (s
ePA
RAt
inG
PA
Rk
inG
cO
sts
fRO
M
hO
usi
nG
cO
sts)
MA
xiM
uM
ReQ
uiR
eMen
ts
Red
uct
iOn
s fO
R
Aff
OR
dA
Ble
OR
sen
iOR
H
ou
Sin
g
Red
uc
tiO
ns
in t
RA
nsi
t,
Mix
ed u
se O
R O
theR
sP
eciA
l sh
AR
ed P
AR
kin
G
shA
Red
PA
Rk
inG
slid
inG
scA
le B
Ase
d O
n
nu
MB
eR O
f B
edR
OO
Ms
tAn
deM
PA
Rk
inG
Oth
eR
OtheR (descRiPtiOn)
Tuolumne County • • • •
Turlock • • • •
Ukiah • • • • •
Union City • • • •Reduction in parking for projects that implement Transportation Demand Management strategies
Upland • • •
Vacaville • • •
Vallejo • • • • •
Ventura County • • • • •
Villa Park •
Visalia • • • •
Vista • •
Walnut •
Walnut Creek • • • • •
Wasco • • Joint use
Waterford • • •
Watsonville • • •
West Covina • •
West Hollywood • • • • •
West Sacramento • • • • • •
Westlake Village • • Reciprocal Parking Agreements
Westminster • •
Whittier • • • Off-site parking agreements
Williams •
Willows •
Windsor • • • •
Winters •Form Based Code - Reduced Off-Street Parking Requirements in the downtown
Woodlake • •
Yolo County • • • • •Reduced parking for porous surfaces; requirements for carpool, motorcycle, and electric spaces
Yorba Linda • •
Yountville • • • •
Yreka • •
Yucaipa • •
Annual Planning Survey Results 2012 161
Appendix C: Housing, Density, and Infill
For all Appendices, the column headings in the dark blue colors were choices provided in the questions of the Annual Planning Survey. Column headings highlighted in light blue were responses provided by survey respondents.
Appendix C:Housing,
Density, and Infill
162 Annual Planning Survey Results 2012
Appendix C: Housing, Density, and Infill
Page intentionally left blank
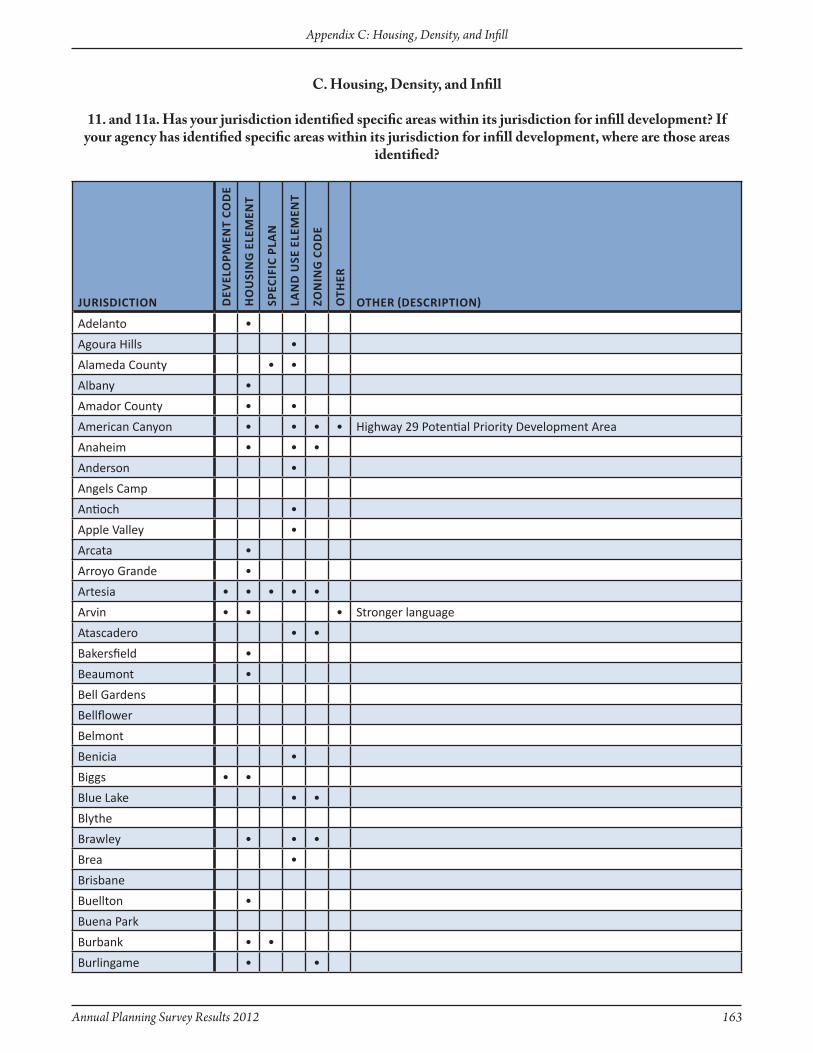
Annual Planning Survey Results 2012 163
Appendix C: Housing, Density, and Infill
JuRisdictiOn dev
elO
PMen
t cO
de
hO
usi
nG
ele
Men
t
sPec
ific
PlA
n
lAn
d u
se e
leM
ent
ZOn
inG
cO
de
Oth
eR
OtheR (descRiPtiOn)
Adelanto •
Agoura Hills •
Alameda County • •
Albany •
Amador County • •
American Canyon • • • • Highway 29 Potential Priority Development Area
Anaheim • • •
Anderson •
Angels Camp
Antioch •
Apple Valley •
Arcata •
Arroyo Grande •
Artesia • • • • •
Arvin • • • Stronger language
Atascadero • •
Bakersfield •
Beaumont •
Bell Gardens
Bellflower
Belmont
Benicia •
Biggs • •
Blue Lake • •
Blythe
Brawley • • •
Brea •
Brisbane
Buellton •
Buena Park
Burbank • •
Burlingame • •
11. and 11a. Has your jurisdiction identified specific areas within its jurisdiction for infill development? If your agency has identified specific areas within its jurisdiction for infill development, where are those areas
identified?
C. Housing, Density, and Infill

164 Annual Planning Survey Results 2012
Appendix C: Housing, Density, and Infill
JuRisdictiOn dev
elO
PMen
t cO
de
hO
usi
nG
ele
Men
t
sPec
ific
PlA
n
lAn
d u
se e
leM
ent
ZOn
inG
cO
de
Oth
eR
OtheR (descRiPtiOn)
Butte County •
Calabasas
California City
Calimesa •
Campbell • • •
Canyon Lake
Carlsbad • •
Carpinteria
Carson
Chico •
Chino • •
Chino HillsIn process of identifying specific areas within the jurisdiction for infill development
Chowchilla
Chula Vista • • Regional Forecast documents
Citrus Heights • • •
Claremont • • •
Clayton • •
Clearlake
Coachella
Coalinga
Colton •
Commerce •
Concord
Contra Costa County
Corning •
Corona • • Downtown and urban core areas
Coronado
Covina
Culver City • • • •
Cupertino •
Cypress
Daly City • • •
Dana Point •
Danville
Davis • • • Special infill potential studies
Delano

Annual Planning Survey Results 2012 165
Appendix C: Housing, Density, and Infill
JuRisdictiOn dev
elO
PMen
t cO
de
hO
usi
nG
ele
Men
t
sPec
ific
PlA
n
lAn
d u
se e
leM
ent
ZOn
inG
cO
de
Oth
eR
OtheR (descRiPtiOn)
Desert Hot Springs • •
Dinuba
Dos Palos •
Duarte
Dublin •
East Palo Alto
El Cajon •
El Centro • •
El Cerrito • • •
El Dorado County •
El Monte •
Emeryville • •
Encinitas • •
Escondido
Eureka • •
Fairfax
Fairfield
Folsom •
Fontana • The City has an adopted infill ordinance.
Fort Bragg •
Fortuna •
Foster City
Fremont • • •Priority Development Areas identified as part of regional planning efforts, updated General Plan will include policies promoting development in these areas
Fresno
Fullerton •
Garden Grove •
Gilroy
Glendale • • • Downtown Specific Plan
Glendora • Entire city is infill development.
Goleta •
Gonzales
Grass Valley
Greenfield •
Gridley •
Guadalupe • •
Gustine
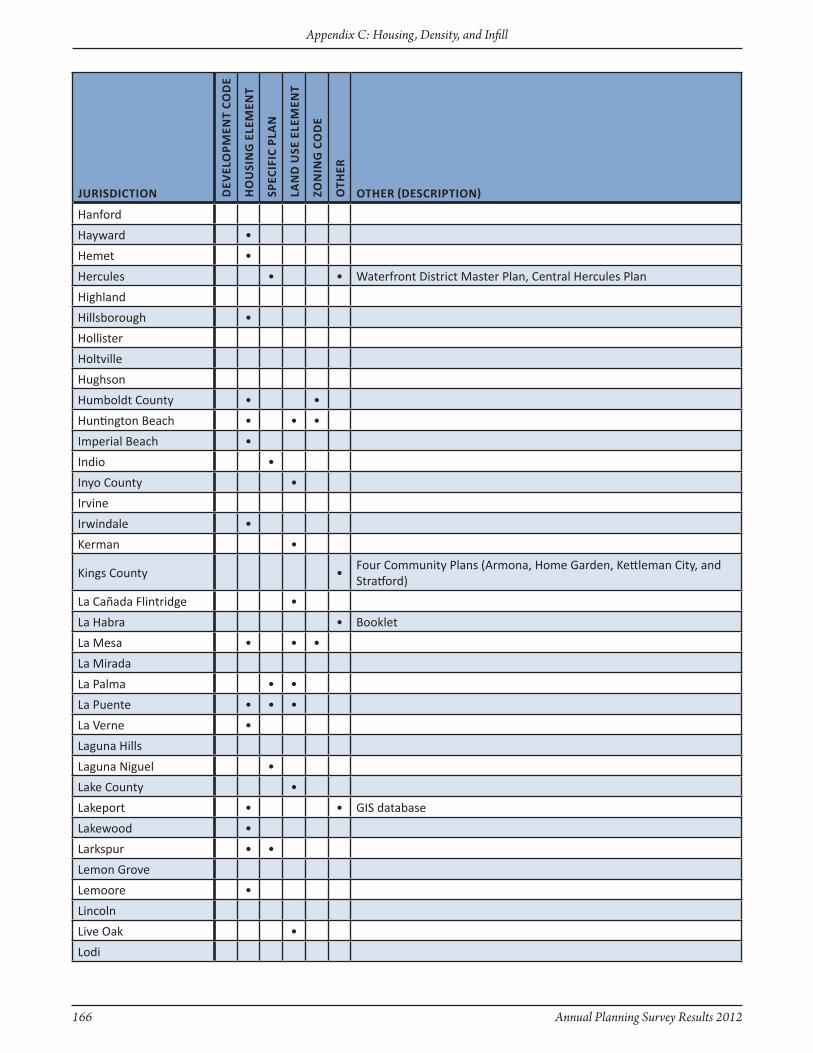
166 Annual Planning Survey Results 2012
Appendix C: Housing, Density, and Infill
JuRisdictiOn dev
elO
PMen
t cO
de
hO
usi
nG
ele
Men
t
sPec
ific
PlA
n
lAn
d u
se e
leM
ent
ZOn
inG
cO
de
Oth
eR
OtheR (descRiPtiOn)
Hanford
Hayward •
Hemet •
Hercules • • Waterfront District Master Plan, Central Hercules Plan
Highland
Hillsborough •
Hollister
Holtville
Hughson
Humboldt County • •
Huntington Beach • • •
Imperial Beach •
Indio •
Inyo County •
Irvine
Irwindale •
Kerman •
Kings County •Four Community Plans (Armona, Home Garden, Kettleman City, and Stratford)
La Cañada Flintridge •
La Habra • Booklet
La Mesa • • •
La Mirada
La Palma • •
La Puente • • •
La Verne •
Laguna Hills
Laguna Niguel •
Lake County •
Lakeport • • GIS database
Lakewood •
Larkspur • •
Lemon Grove
Lemoore •
Lincoln
Live Oak •
Lodi
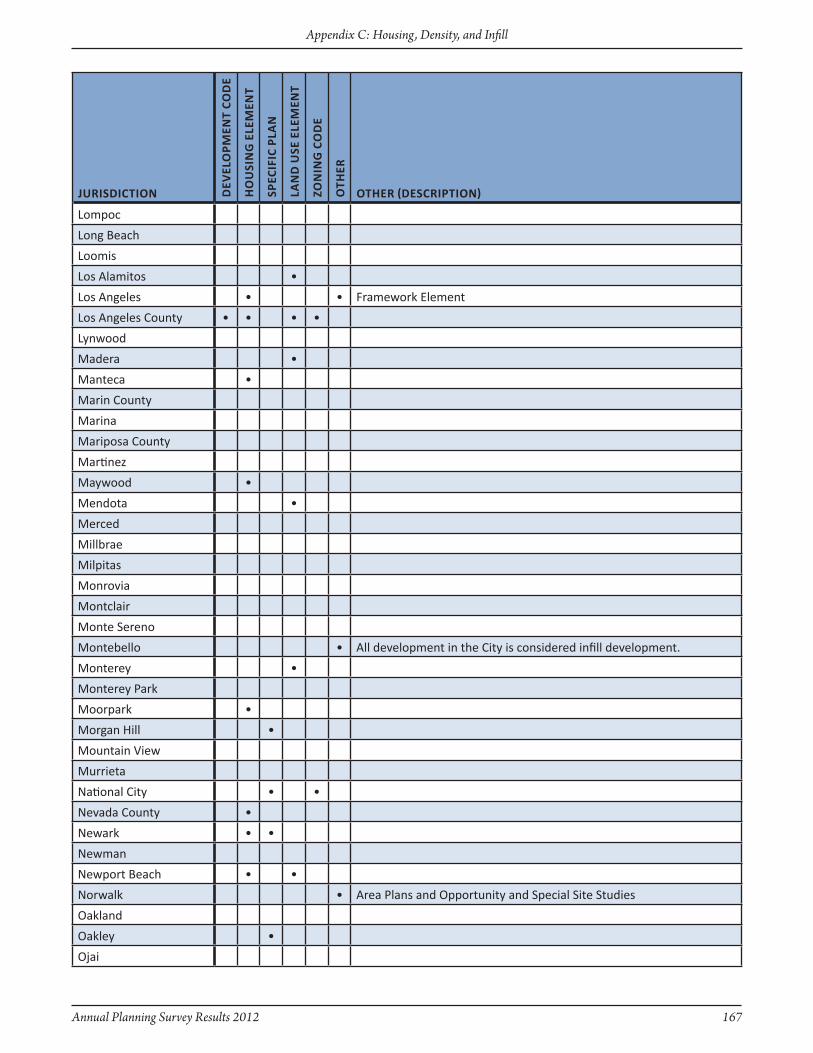
Annual Planning Survey Results 2012 167
Appendix C: Housing, Density, and Infill
JuRisdictiOn dev
elO
PMen
t cO
de
hO
usi
nG
ele
Men
t
sPec
ific
PlA
n
lAn
d u
se e
leM
ent
ZOn
inG
cO
de
Oth
eR
OtheR (descRiPtiOn)
Lompoc
Long Beach
Loomis
Los Alamitos •
Los Angeles • • Framework Element
Los Angeles County • • • •
Lynwood
Madera •
Manteca •
Marin County
Marina
Mariposa County
Martinez
Maywood •
Mendota •
Merced
Millbrae
Milpitas
Monrovia
Montclair
Monte Sereno
Montebello • All development in the City is considered infill development.
Monterey •
Monterey Park
Moorpark •
Morgan Hill •
Mountain View
Murrieta
National City • •
Nevada County •
Newark • •
Newman
Newport Beach • •
Norwalk • Area Plans and Opportunity and Special Site Studies
Oakland
Oakley •
Ojai
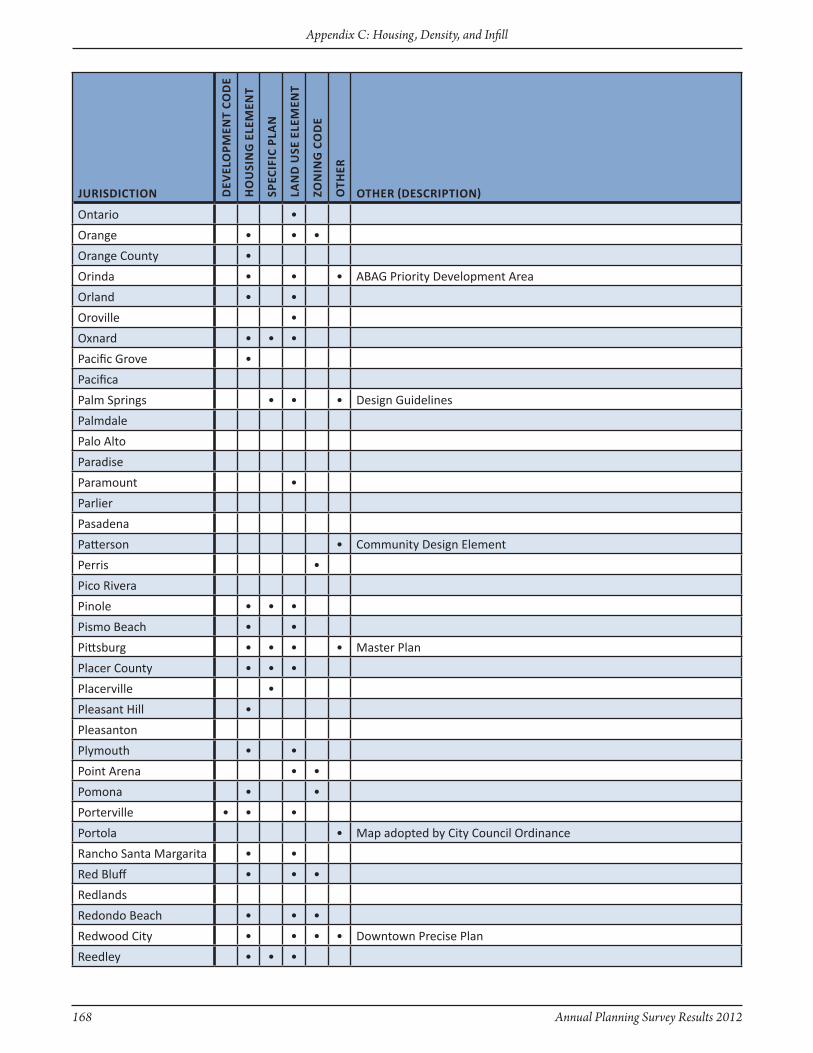
168 Annual Planning Survey Results 2012
Appendix C: Housing, Density, and Infill
JuRisdictiOn dev
elO
PMen
t cO
de
hO
usi
nG
ele
Men
t
sPec
ific
PlA
n
lAn
d u
se e
leM
ent
ZOn
inG
cO
de
Oth
eR
OtheR (descRiPtiOn)
Ontario •
Orange • • •
Orange County •
Orinda • • • ABAG Priority Development Area
Orland • •
Oroville •
Oxnard • • •
Pacific Grove •
Pacifica
Palm Springs • • • Design Guidelines
Palmdale
Palo Alto
Paradise
Paramount •
Parlier
Pasadena
Patterson • Community Design Element
Perris •
Pico Rivera
Pinole • • •
Pismo Beach • •
Pittsburg • • • • Master Plan
Placer County • • •
Placerville •
Pleasant Hill •
Pleasanton
Plymouth • •
Point Arena • •
Pomona • •
Porterville • • •
Portola • Map adopted by City Council Ordinance
Rancho Santa Margarita • •
Red Bluff • • •
Redlands
Redondo Beach • • •
Redwood City • • • • Downtown Precise Plan
Reedley • • •
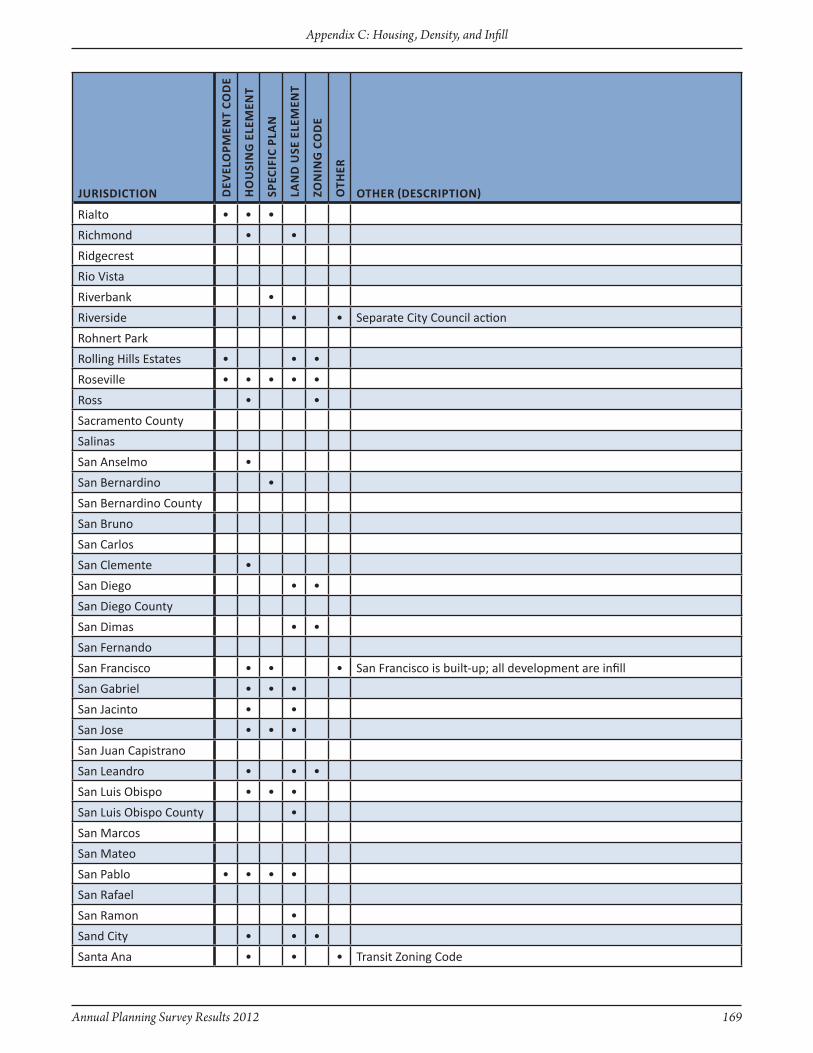
Annual Planning Survey Results 2012 169
Appendix C: Housing, Density, and Infill
JuRisdictiOn dev
elO
PMen
t cO
de
hO
usi
nG
ele
Men
t
sPec
ific
PlA
n
lAn
d u
se e
leM
ent
ZOn
inG
cO
de
Oth
eR
OtheR (descRiPtiOn)
Rialto • • •
Richmond • •
Ridgecrest
Rio Vista
Riverbank •
Riverside • • Separate City Council action
Rohnert Park
Rolling Hills Estates • • •
Roseville • • • • •
Ross • •
Sacramento County
Salinas
San Anselmo •
San Bernardino •
San Bernardino County
San Bruno
San Carlos
San Clemente •
San Diego • •
San Diego County
San Dimas • •
San Fernando
San Francisco • • • San Francisco is built-up; all development are infill
San Gabriel • • •
San Jacinto • •
San Jose • • •
San Juan Capistrano
San Leandro • • •
San Luis Obispo • • •
San Luis Obispo County •
San Marcos
San Mateo
San Pablo • • • •
San Rafael
San Ramon •
Sand City • • •
Santa Ana • • • Transit zoning Code
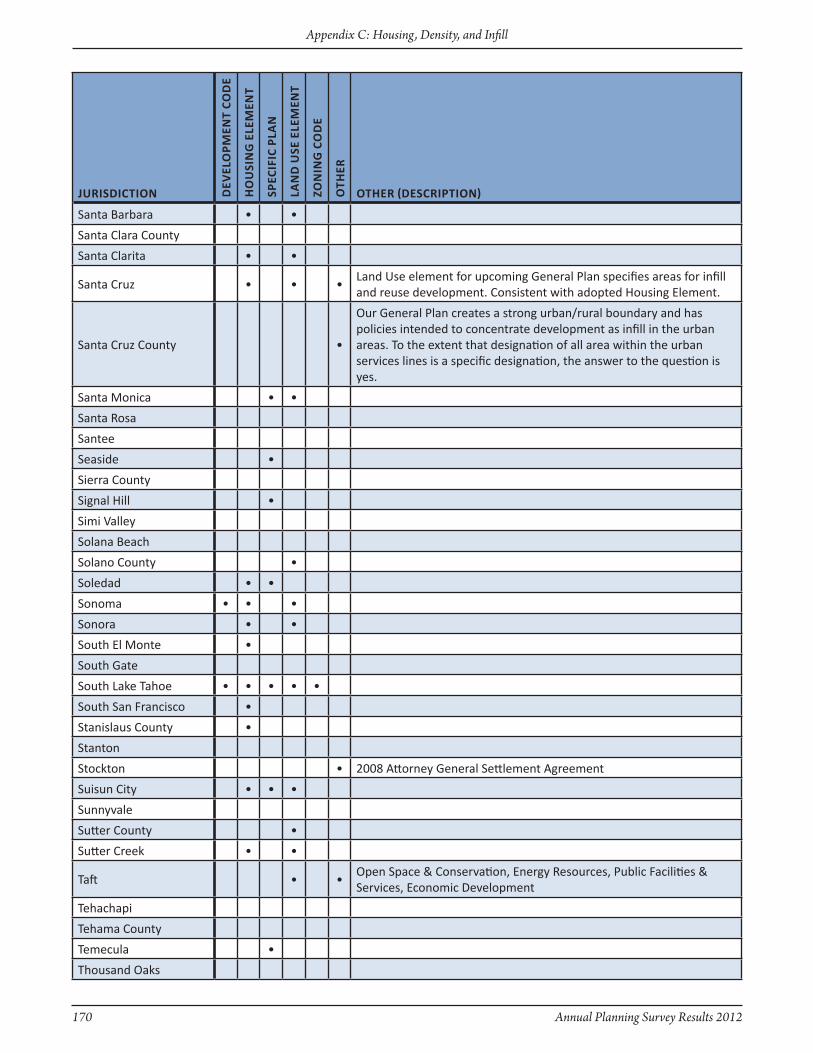
170 Annual Planning Survey Results 2012
Appendix C: Housing, Density, and Infill
JuRisdictiOn dev
elO
PMen
t cO
de
hO
usi
nG
ele
Men
t
sPec
ific
PlA
n
lAn
d u
se e
leM
ent
ZOn
inG
cO
de
Oth
eR
OtheR (descRiPtiOn)
Santa Barbara • •
Santa Clara County
Santa Clarita • •
Santa Cruz • • •Land Use element for upcoming General Plan specifies areas for infill and reuse development. Consistent with adopted Housing Element.
Santa Cruz County •
Our General Plan creates a strong urban/rural boundary and has policies intended to concentrate development as infill in the urban areas. To the extent that designation of all area within the urban services lines is a specific designation, the answer to the question is yes.
Santa Monica • •
Santa Rosa
Santee
Seaside •
Sierra County
Signal Hill •
Simi Valley
Solana Beach
Solano County •
Soledad • •
Sonoma • • •
Sonora • •
South El Monte •
South Gate
South Lake Tahoe • • • • •
South San Francisco •
Stanislaus County •
Stanton
Stockton • 2008 Attorney General Settlement Agreement
Suisun City • • •
Sunnyvale
Sutter County •
Sutter Creek • •
Taft • •Open Space & Conservation, Energy Resources, Public Facilities & Services, Economic Development
Tehachapi
Tehama County
Temecula •
Thousand Oaks
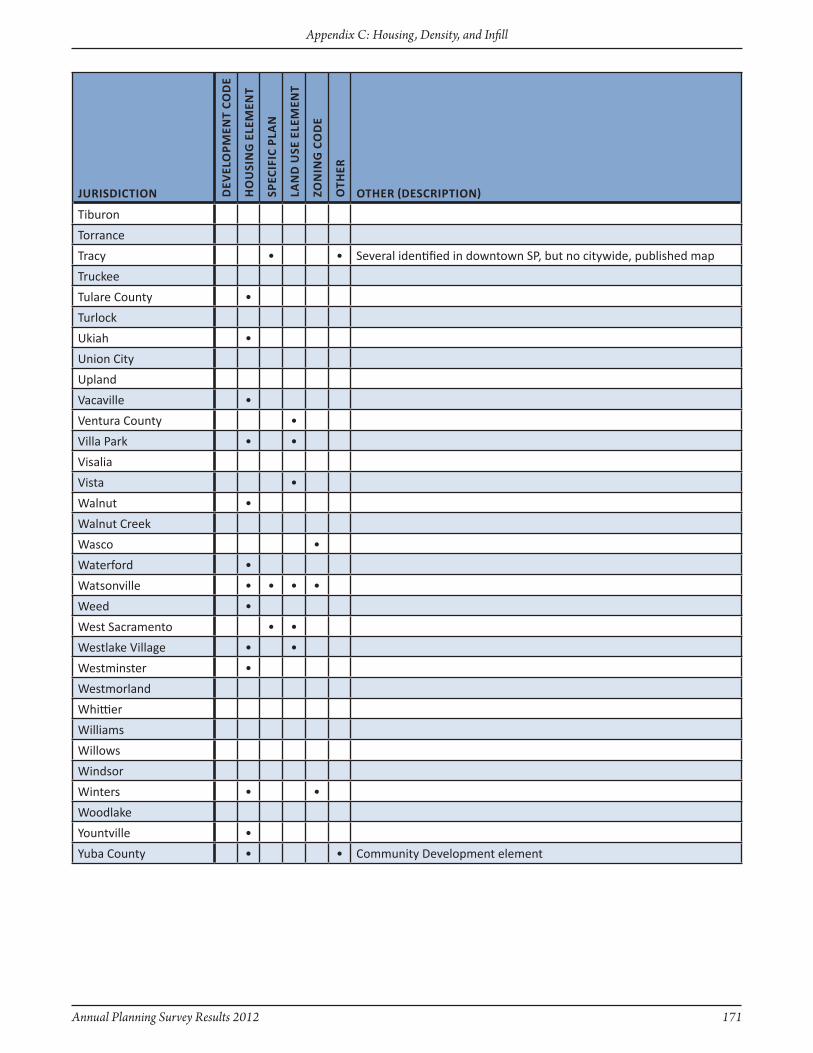
Annual Planning Survey Results 2012 171
Appendix C: Housing, Density, and Infill
JuRisdictiOn dev
elO
PMen
t cO
de
hO
usi
nG
ele
Men
t
sPec
ific
PlA
n
lAn
d u
se e
leM
ent
ZOn
inG
cO
de
Oth
eR
OtheR (descRiPtiOn)
Tiburon
Torrance
Tracy • • Several identified in downtown SP, but no citywide, published map
Truckee
Tulare County •
Turlock
Ukiah •
Union City
Upland
Vacaville •
Ventura County •
Villa Park • •
Visalia
Vista •
Walnut •
Walnut Creek
Wasco •
Waterford •
Watsonville • • • •
Weed •
West Sacramento • •
Westlake Village • •
Westminster •
Westmorland
Whittier
Williams
Willows
Windsor
Winters • •
Woodlake
Yountville •
Yuba County • • Community Development element
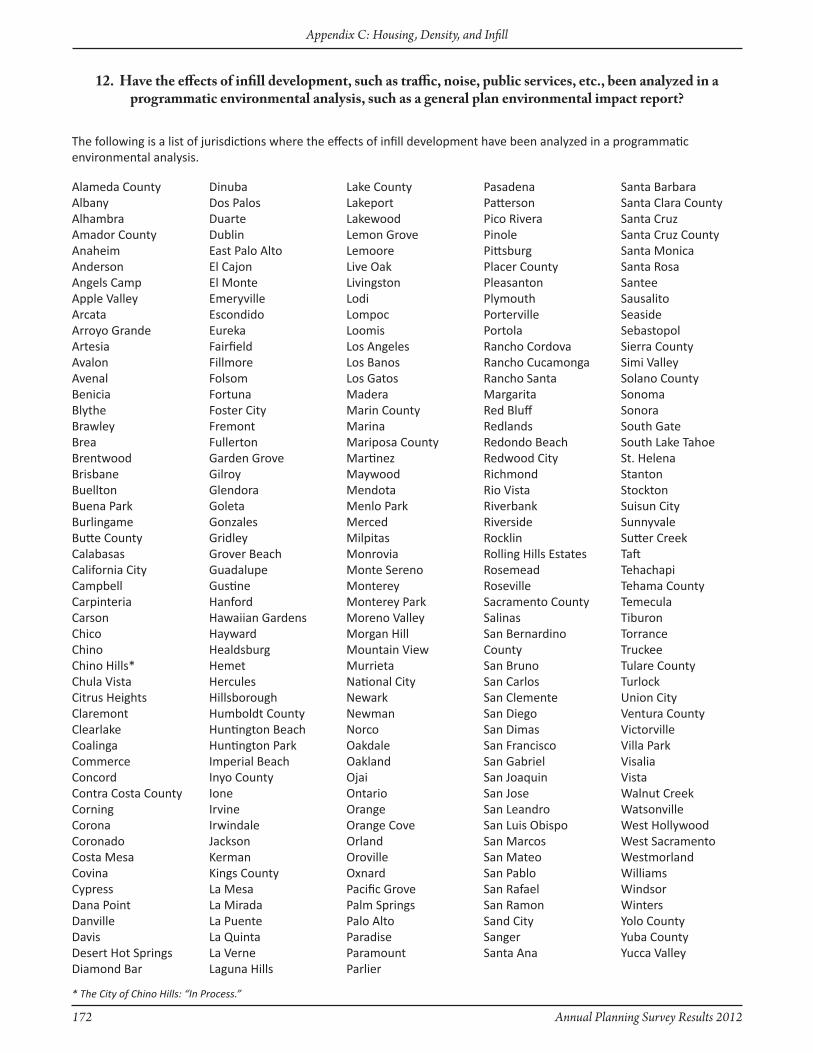
172 Annual Planning Survey Results 2012
Appendix C: Housing, Density, and Infill
Alameda CountyAlbanyAlhambraAmador CountyAnaheimAndersonAngels CampApple ValleyArcataArroyo GrandeArtesiaAvalonAvenalBeniciaBlytheBrawleyBreaBrentwoodBrisbaneBuelltonBuena ParkBurlingameButte CountyCalabasasCalifornia CityCampbellCarpinteriaCarsonChicoChinoChino Hills*Chula VistaCitrus HeightsClaremontClearlakeCoalingaCommerceConcordContra Costa CountyCorningCoronaCoronadoCosta MesaCovinaCypressDana PointDanvilleDavisDesert Hot SpringsDiamond Bar
DinubaDos PalosDuarteDublinEast Palo AltoEl CajonEl MonteEmeryvilleEscondidoEurekaFairfieldFillmoreFolsomFortunaFoster CityFremontFullertonGarden GroveGilroyGlendoraGoletaGonzalesGridleyGrover BeachGuadalupeGustineHanfordHawaiian GardensHaywardHealdsburgHemetHerculesHillsboroughHumboldt CountyHuntington BeachHuntington ParkImperial BeachInyo CountyIoneIrvineIrwindaleJacksonKermanKings CountyLa MesaLa MiradaLa PuenteLa QuintaLa VerneLaguna Hills
Lake CountyLakeportLakewoodLemon GroveLemooreLive OakLivingstonLodiLompocLoomisLos AngelesLos BanosLos GatosMaderaMarin CountyMarinaMariposa CountyMartinezMaywoodMendotaMenlo ParkMercedMilpitasMonroviaMonte SerenoMontereyMonterey ParkMoreno ValleyMorgan HillMountain ViewMurrietaNational CityNewarkNewmanNorcoOakdaleOaklandOjaiOntarioOrangeOrange CoveOrlandOrovilleOxnardPacific GrovePalm SpringsPalo AltoParadiseParamountParlier
PasadenaPattersonPico RiveraPinolePittsburgPlacer CountyPleasantonPlymouthPortervillePortolaRancho CordovaRancho CucamongaRancho Santa MargaritaRed BluffRedlandsRedondo BeachRedwood CityRichmondRio VistaRiverbankRiversideRocklinRolling Hills EstatesRosemeadRosevilleSacramento CountySalinasSan Bernardino CountySan BrunoSan CarlosSan ClementeSan DiegoSan DimasSan FranciscoSan GabrielSan JoaquinSan JoseSan LeandroSan Luis ObispoSan MarcosSan MateoSan PabloSan RafaelSan RamonSand CitySangerSanta Ana
* The City of Chino Hills: “In Process.”
Santa BarbaraSanta Clara CountySanta CruzSanta Cruz CountySanta MonicaSanta RosaSanteeSausalitoSeasideSebastopolSierra CountySimi ValleySolano CountySonomaSonoraSouth GateSouth Lake TahoeSt. HelenaStantonStocktonSuisun CitySunnyvaleSutter CreekTaftTehachapiTehama CountyTemeculaTiburonTorranceTruckeeTulare CountyTurlockUnion CityVentura CountyVictorvilleVilla ParkVisaliaVistaWalnut CreekWatsonvilleWest HollywoodWest SacramentoWestmorlandWilliamsWindsorWintersYolo CountyYuba CountyYucca Valley
12. Have the effects of infill development, such as traffic, noise, public services, etc., been analyzed in a programmatic environmental analysis, such as a general plan environmental impact report?
The following is a list of jurisdictions where the effects of infill development have been analyzed in a programmatic environmental analysis.
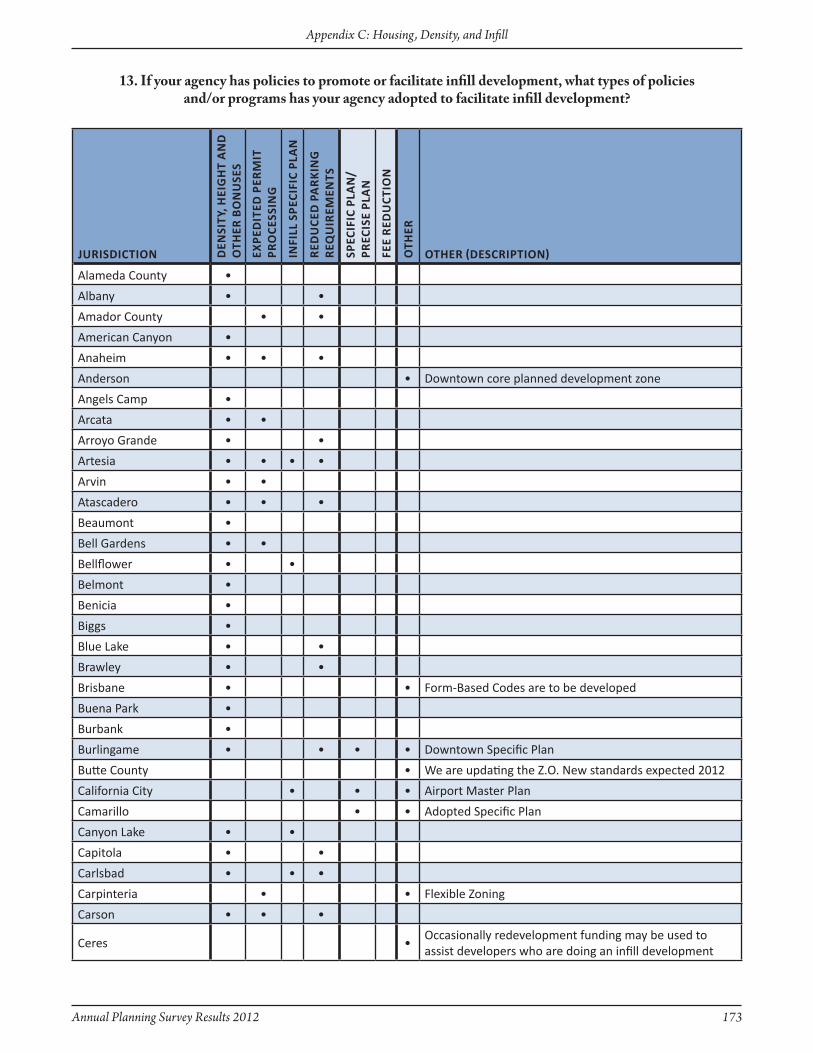
Annual Planning Survey Results 2012 173
Appendix C: Housing, Density, and Infill
JuRisdictiOn den
sity
, hei
Gh
t A
nd
O
theR
BO
nu
ses
exPe
dit
ed P
eRM
it
PRO
cess
inG
infi
ll s
Peci
fic
PlA
n
Red
uce
d P
AR
kin
G
ReQ
uiR
eMen
ts
sPec
ific
PlA
n/
PRec
ise
PlA
n
fee
Red
uct
iOn
Oth
eR
OtheR (descRiPtiOn)
Alameda County •
Albany • •
Amador County • •
American Canyon •
Anaheim • • •
Anderson • Downtown core planned development zone
Angels Camp •
Arcata • •
Arroyo Grande • •
Artesia • • • •
Arvin • •
Atascadero • • •
Beaumont •
Bell Gardens • •
Bellflower • •
Belmont •
Benicia •
Biggs •
Blue Lake • •
Brawley • •
Brisbane • • Form-Based Codes are to be developed
Buena Park •
Burbank •
Burlingame • • • • Downtown Specific Plan
Butte County • We are updating the z.O. New standards expected 2012
California City • • • Airport Master Plan
Camarillo • • Adopted Specific Plan
Canyon Lake • •
Capitola • •
Carlsbad • • •
Carpinteria • • Flexible zoning
Carson • • •
Ceres •Occasionally redevelopment funding may be used to assist developers who are doing an infill development
13. If your agency has policies to promote or facilitate infill development, what types of policiesand/or programs has your agency adopted to facilitate infill development?

174 Annual Planning Survey Results 2012
Appendix C: Housing, Density, and Infill
JuRisdictiOn den
sity
, hei
Gh
t A
nd
O
theR
BO
nu
ses
exPe
dit
ed P
eRM
it
PRO
cess
inG
infi
ll s
Peci
fic
PlA
n
Red
uce
d P
AR
kin
G
ReQ
uiR
eMen
ts
sPec
ific
PlA
n/
PRec
ise
PlA
n
fee
Red
uct
iOn
Oth
eR
OtheR (descRiPtiOn)
Chico • •
Chowchilla • • Reduced Development Impact Fees
Chula Vista • • Redevelopment Area fee deferrals.
Citrus Heights • • •
Clayton • •
Clearlake •
Coachella •Climate Action Plan under development as part of the 2012 GP update.
Coalinga • • • Others to come once zoning code is updated
Colton •
Colusa County • Discourage other development
Commerce •
Contra Costa County • •
Corona •UDR designation of the North Main Street Specific Plan specifically establishes in-fill policies
Coronado •
Costa Mesa • • •
Covina • • Covina Town Center Specific Plan
Culver City •
Cypress • •
Daly City •
Dana Point • • • • Density Bonuses
Danville • •
Davis • Land use policies
Desert Hot Springs • • •
Dinuba • •
Dos Palos •
Duarte • • • •
Dublin • • •
East Palo Alto • • • Housing Element encourages infill (4.2)
El Cajon • • •
El Centro • •
El Cerrito • • •
El Monte • • • • • These policies and programs are under development.
Emeryville •
Encinitas • • •
Escondido • • •

Annual Planning Survey Results 2012 175
Appendix C: Housing, Density, and Infill
JuRisdictiOn den
sity
, hei
Gh
t A
nd
O
theR
BO
nu
ses
exPe
dit
ed P
eRM
it
PRO
cess
inG
infi
ll s
Peci
fic
PlA
n
Red
uce
d P
AR
kin
G
ReQ
uiR
eMen
ts
sPec
ific
PlA
n/
PRec
ise
PlA
n
fee
Red
uct
iOn
Oth
eR
OtheR (descRiPtiOn)
Eureka •
Exeter •
Fairfax • • Rezoning
Fairfield • •
Fillmore • • •
Folsom • •
Fontana • • Reduced Development Impact Fees
Fortuna • •
Foster City • • Planned Developments
Fountain Valley • •
Fowler •
Fremont • •Updated General Plan will allow higher-density development in Priority Development Areas
Fresno • •
Fullerton • • • • •As part of our October 2010 adopted Fullerton Transportation Center Specific Plan
Garden Grove •
Gilroy • • •
Glendale • • •Hillside standards favor building on existing lots, rather than new subdivisions
Glendora • • • •
Glenn County •
Goleta • •
Gonzales • •
Grass Valley • •
Gridley •
Grover Beach • •
Guadalupe • •
Hanford • • Impact fees reduction
Hawaiian Gardens •
Hayward • •
Hemet • • •
Hercules • •
Hermosa Beach • The only development we have is infill development
Highland • •
Hillsborough •
Hollister •Per the City's growth management ordinance, infill vacant lots score higher points for proposed development.
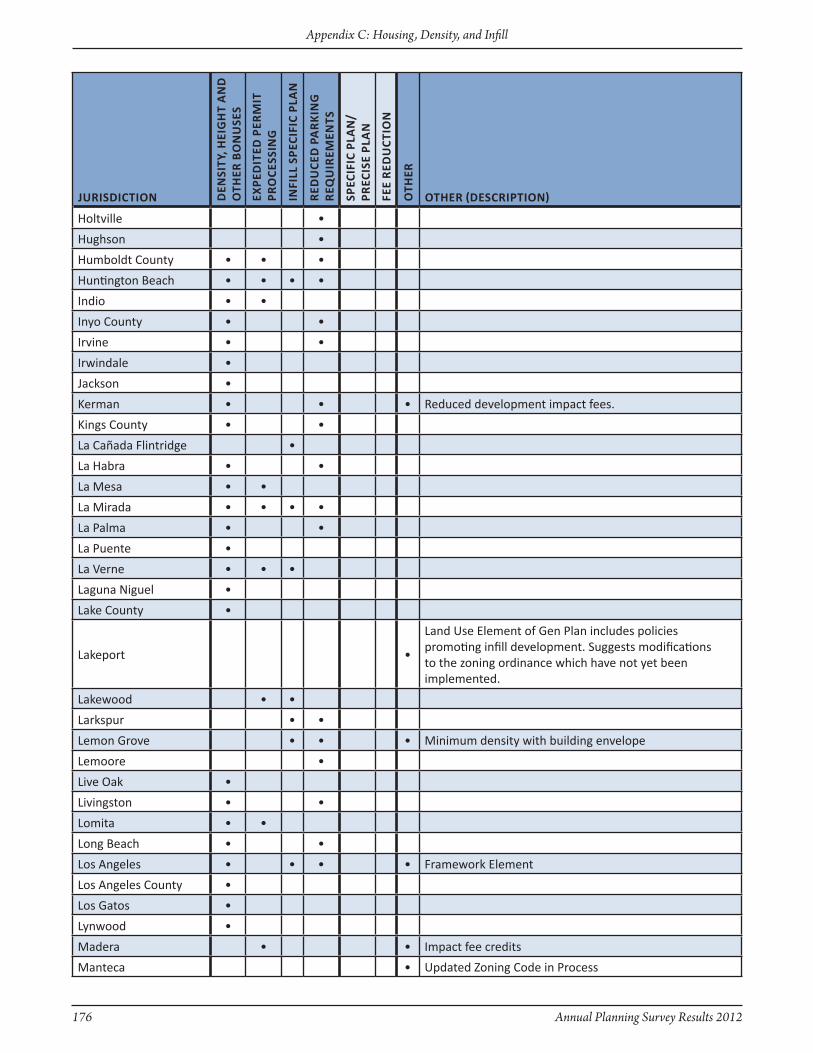
176 Annual Planning Survey Results 2012
Appendix C: Housing, Density, and Infill
JuRisdictiOn den
sity
, hei
Gh
t A
nd
O
theR
BO
nu
ses
exPe
dit
ed P
eRM
it
PRO
cess
inG
infi
ll s
Peci
fic
PlA
n
Red
uce
d P
AR
kin
G
ReQ
uiR
eMen
ts
sPec
ific
PlA
n/
PRec
ise
PlA
n
fee
Red
uct
iOn
Oth
eR
OtheR (descRiPtiOn)
Holtville •
Hughson •
Humboldt County • • •
Huntington Beach • • • •
Indio • •
Inyo County • •
Irvine • •
Irwindale •
Jackson •
Kerman • • • Reduced development impact fees.
Kings County • •
La Cañada Flintridge •
La Habra • •
La Mesa • •
La Mirada • • • •
La Palma • •
La Puente •
La Verne • • •
Laguna Niguel •
Lake County •
Lakeport •
Land Use Element of Gen Plan includes policies promoting infill development. Suggests modifications to the zoning ordinance which have not yet been implemented.
Lakewood • •
Larkspur • •
Lemon Grove • • • Minimum density with building envelope
Lemoore •
Live Oak •
Livingston • •
Lomita • •
Long Beach • •
Los Angeles • • • • Framework Element
Los Angeles County •
Los Gatos •
Lynwood •
Madera • • Impact fee credits
Manteca • Updated zoning Code in Process

Annual Planning Survey Results 2012 177
Appendix C: Housing, Density, and Infill
JuRisdictiOn den
sity
, hei
Gh
t A
nd
O
theR
BO
nu
ses
exPe
dit
ed P
eRM
it
PRO
cess
inG
infi
ll s
Peci
fic
PlA
n
Red
uce
d P
AR
kin
G
ReQ
uiR
eMen
ts
sPec
ific
PlA
n/
PRec
ise
PlA
n
fee
Red
uct
iOn
Oth
eR
OtheR (descRiPtiOn)
Marina • • Specific Plan and EIR in draft
Mariposa County • •
Martinez • • •
Marysville •
Maywood • • •
Mendocino County • Development Element
Mendota • •
Merced • •
Millbrae • • •
Milpitas • • Specific Plans
Modesto •
Monrovia • •
Montclair • •
Monterey • •
Monterey Park • • • •
Moorpark • Urban Growth Boundary
Moreno Valley • Use of CEQA Infill Exemption
Morgan Hill • • • Residential Development Control System
Morro Bay • Compact Infill Development policies
Mount Shasta • •Created floating zone that allows use of older smaller lots.
Mountain View • • • Precise Plans, sliding scale density, density bonuses
Murrieta •
Nevada City •
Nevada County • Housing Element Rezone Programs
Newark • • •
Newman • Promotion of Infill
Newport Beach •
Oakland • • • Priority Development Areas (PDA)
Ojai •
Ontario •
Orange • • CEQA tiering/environmental streamlining
Orange County • • • Density increase with parcel consolidation
Orange Cove •
Orinda • •
Orland •
Oroville • • •
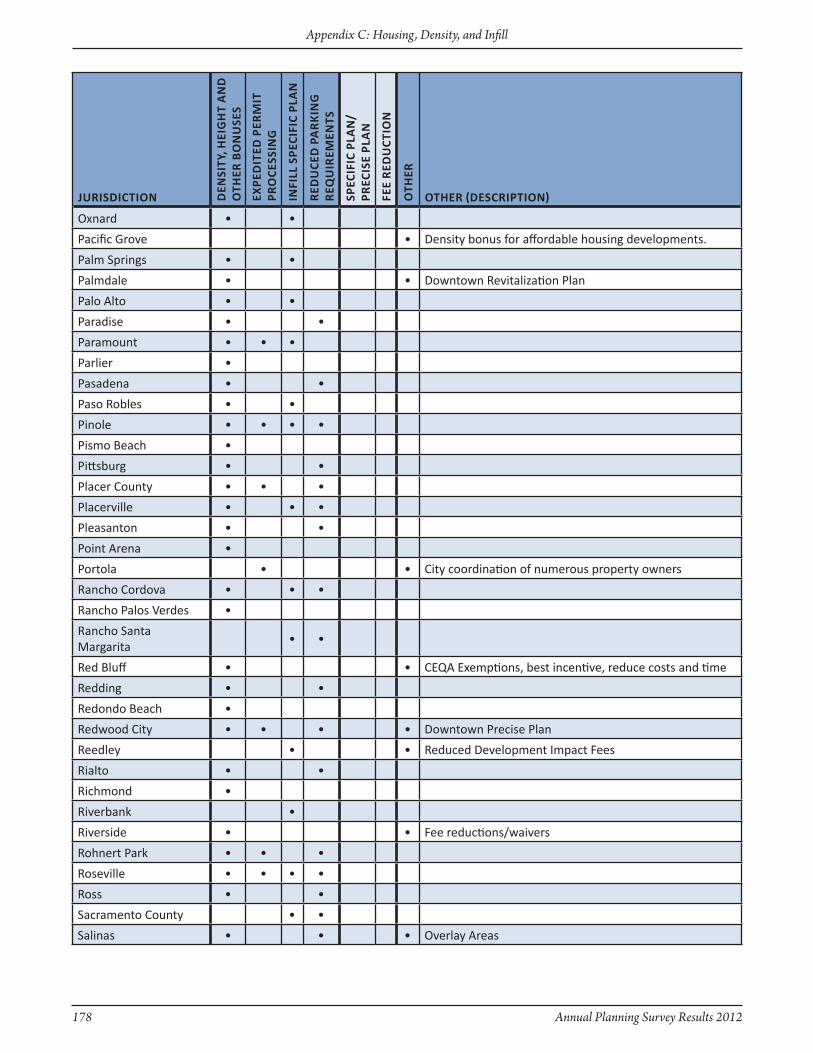
178 Annual Planning Survey Results 2012
Appendix C: Housing, Density, and Infill
JuRisdictiOn den
sity
, hei
Gh
t A
nd
O
theR
BO
nu
ses
exPe
dit
ed P
eRM
it
PRO
cess
inG
infi
ll s
Peci
fic
PlA
n
Red
uce
d P
AR
kin
G
ReQ
uiR
eMen
ts
sPec
ific
PlA
n/
PRec
ise
PlA
n
fee
Red
uct
iOn
Oth
eR
OtheR (descRiPtiOn)
Oxnard • •
Pacific Grove • Density bonus for affordable housing developments.
Palm Springs • •
Palmdale • • Downtown Revitalization Plan
Palo Alto • •
Paradise • •
Paramount • • •
Parlier •
Pasadena • •
Paso Robles • •
Pinole • • • •
Pismo Beach •
Pittsburg • •
Placer County • • •
Placerville • • •
Pleasanton • •
Point Arena •
Portola • • City coordination of numerous property owners
Rancho Cordova • • •
Rancho Palos Verdes •
Rancho Santa Margarita
• •
Red Bluff • • CEQA Exemptions, best incentive, reduce costs and time
Redding • •
Redondo Beach •
Redwood City • • • • Downtown Precise Plan
Reedley • • Reduced Development Impact Fees
Rialto • •
Richmond •
Riverbank •
Riverside • • Fee reductions/waivers
Rohnert Park • • •
Roseville • • • •
Ross • •
Sacramento County • •
Salinas • • • Overlay Areas
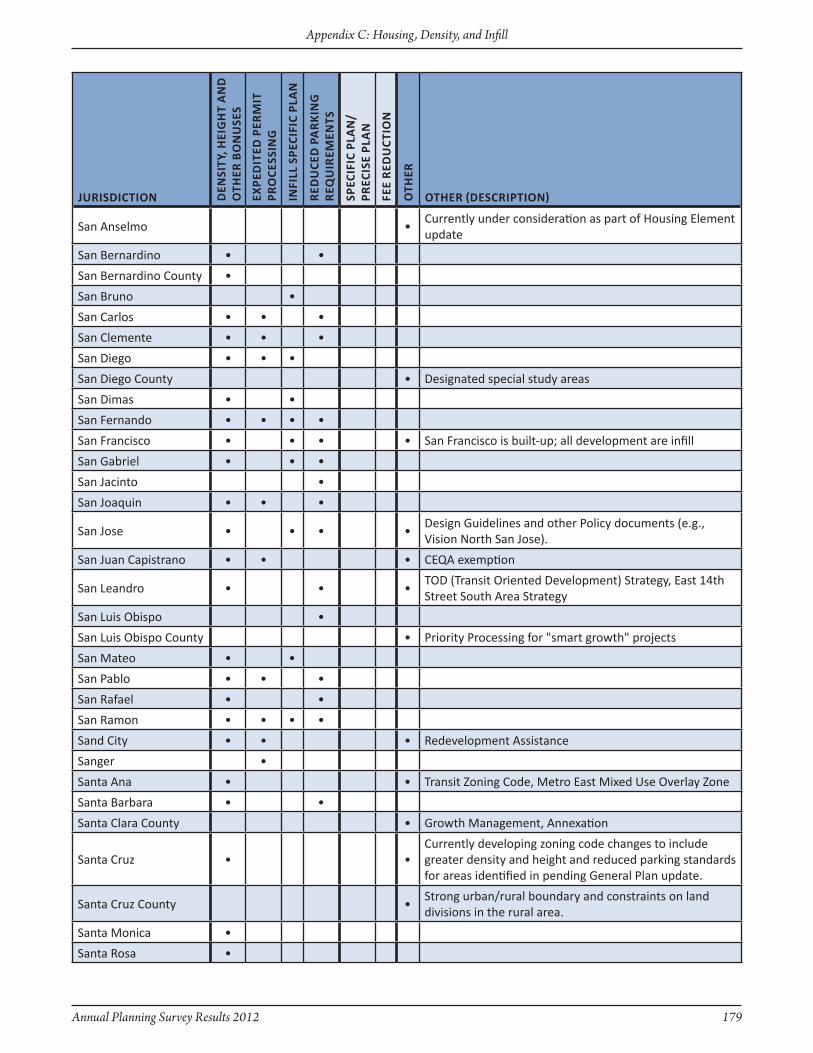
Annual Planning Survey Results 2012 179
Appendix C: Housing, Density, and Infill
JuRisdictiOn den
sity
, hei
Gh
t A
nd
O
theR
BO
nu
ses
exPe
dit
ed P
eRM
it
PRO
cess
inG
infi
ll s
Peci
fic
PlA
n
Red
uce
d P
AR
kin
G
ReQ
uiR
eMen
ts
sPec
ific
PlA
n/
PRec
ise
PlA
n
fee
Red
uct
iOn
Oth
eR
OtheR (descRiPtiOn)
San Anselmo •Currently under consideration as part of Housing Element update
San Bernardino • •
San Bernardino County •
San Bruno •
San Carlos • • •
San Clemente • • •
San Diego • • •
San Diego County • Designated special study areas
San Dimas • •
San Fernando • • • •
San Francisco • • • • San Francisco is built-up; all development are infill
San Gabriel • • •
San Jacinto •
San Joaquin • • •
San Jose • • • •Design Guidelines and other Policy documents (e.g., Vision North San Jose).
San Juan Capistrano • • • CEQA exemption
San Leandro • • •TOD (Transit Oriented Development) Strategy, East 14th Street South Area Strategy
San Luis Obispo •
San Luis Obispo County • Priority Processing for "smart growth" projects
San Mateo • •
San Pablo • • •
San Rafael • •
San Ramon • • • •
Sand City • • • Redevelopment Assistance
Sanger •
Santa Ana • • Transit zoning Code, Metro East Mixed Use Overlay zone
Santa Barbara • •
Santa Clara County • Growth Management, Annexation
Santa Cruz • •Currently developing zoning code changes to include greater density and height and reduced parking standards for areas identified in pending General Plan update.
Santa Cruz County •Strong urban/rural boundary and constraints on land divisions in the rural area.
Santa Monica •
Santa Rosa •

180 Annual Planning Survey Results 2012
Appendix C: Housing, Density, and Infill
JuRisdictiOn den
sity
, hei
Gh
t A
nd
O
theR
BO
nu
ses
exPe
dit
ed P
eRM
it
PRO
cess
inG
infi
ll s
Peci
fic
PlA
n
Red
uce
d P
AR
kin
G
ReQ
uiR
eMen
ts
sPec
ific
PlA
n/
PRec
ise
PlA
n
fee
Red
uct
iOn
Oth
eR
OtheR (descRiPtiOn)
Seaside •
Sebastopol •
Signal Hill • •
Simi Valley • •
Solana Beach •
Solano County • Identified areas of county w/programmatic EIR
Soledad • •
City is currently updating its Downtown Specific Plan to promote infill development through a variety of policies, including reducing the parking requirements for new commercial development.
Sonoma •
Sonora • • Building Coverage, Reduced Setbacks
South El Monte • •
South Gate • zoning update underway
South Lake Tahoe • •
St. Helena • • •
Stanislaus County •
Stockton • •
Suisun City • •
Sunnyvale • Almost all development is infill in Sunnyvale
Sutter Creek •
Taft • •
Tehachapi • • • Fee Reduction
Thousand Oaks • Model neighborhood standards
Tiburon • •
Torrance • Will include in new zoning code
Tracy • • Growth Management Ordinance, Downtown SP
Truckee •Increased FAR maximum/Redevelopment Agency assistance
Tulare •
Ukiah • • • Density bonus
Union City • •
Upland • • •
Vallejo •
Ventura County •Infill encouraged in urbanized areas via Urban designation of General Plan and the Guidelines for Orderly Development
Visalia • • Flexible design standards
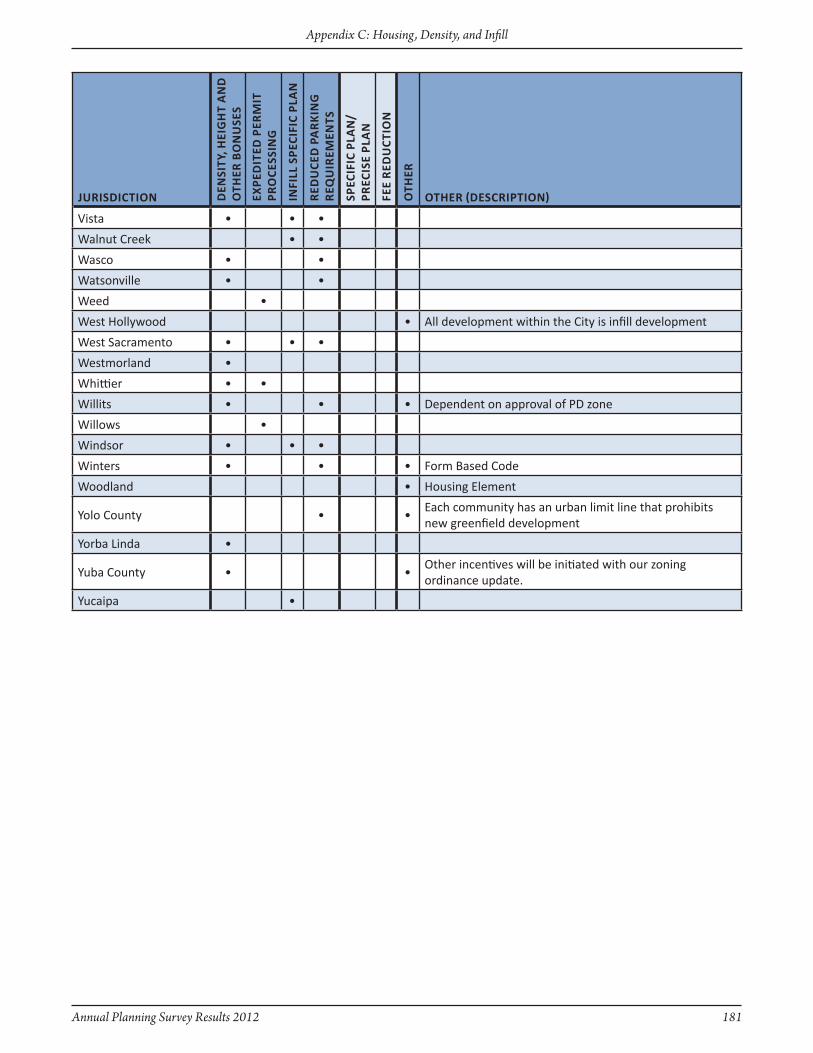
Annual Planning Survey Results 2012 181
Appendix C: Housing, Density, and Infill
JuRisdictiOn den
sity
, hei
Gh
t A
nd
O
theR
BO
nu
ses
exPe
dit
ed P
eRM
it
PRO
cess
inG
infi
ll s
Peci
fic
PlA
n
Red
uce
d P
AR
kin
G
ReQ
uiR
eMen
ts
sPec
ific
PlA
n/
PRec
ise
PlA
n
fee
Red
uct
iOn
Oth
eR
OtheR (descRiPtiOn)
Vista • • •
Walnut Creek • •
Wasco • •
Watsonville • •
Weed •
West Hollywood • All development within the City is infill development
West Sacramento • • •
Westmorland •
Whittier • •
Willits • • • Dependent on approval of PD zone
Willows •
Windsor • • •
Winters • • • Form Based Code
Woodland • Housing Element
Yolo County • •Each community has an urban limit line that prohibits new greenfield development
Yorba Linda •
Yuba County • •Other incentives will be initiated with our zoning ordinance update.
Yucaipa •

182 Annual Planning Survey Results 2012
Appendix C: Housing, Density, and Infill
JuRisdictiOn hO
usi
nG
ele
Men
t
lAn
d u
se e
leM
ent
sPec
ific
PlA
n
ZOn
inG
OR
din
An
ce
Oth
eR
OtheR (descRiPtiOn)
Adelanto •
Agoura Hills • • • •
Alameda County •
Albany •
Alhambra • • Downtown Master Plan
Alpine County • •
Amador County • •
American Canyon • • •
Anaheim • •
Anderson •
Angels Camp •
Antioch • •
Apple Valley • •
Arcadia • •
Arcata • • •
Arroyo Grande • • •
Artesia • • • •
Arvin • To be addressed
Atascadero • •
Avalon •
Avenal •
Azusa • • •
Bakersfield • • • • Redevelopment
Banning •
Barstow • •
Beaumont • • • •
Bellflower •
Belmont • • • Forthcoming Belmont Village zoning Ordinance
Beverly Hills •
Blue Lake • •
Blythe •
Brawley • • • •
Brea • • •
Brentwood • • • •
14. If your jurisdiction has policies and/or programs to facilitate mixed use development and/or the clustering of residential, employment, and commercial areas, where are the policies and/or programs contained?
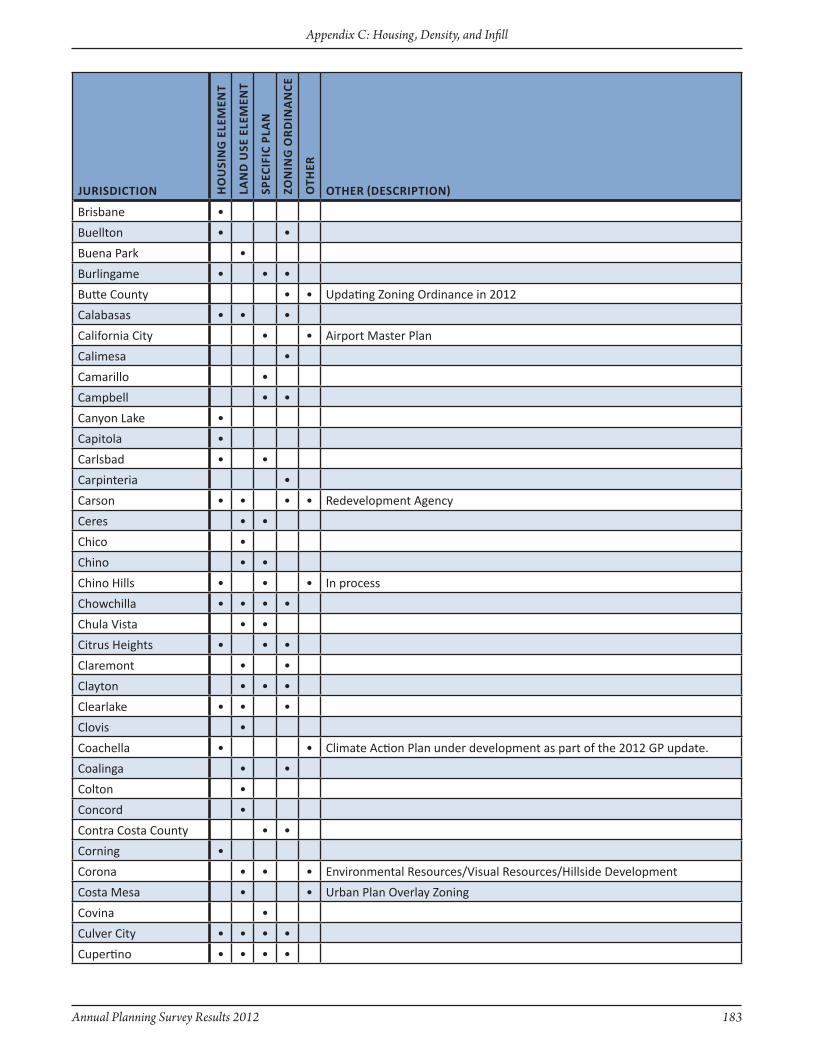
Annual Planning Survey Results 2012 183
Appendix C: Housing, Density, and Infill
JuRisdictiOn hO
usi
nG
ele
Men
t
lAn
d u
se e
leM
ent
sPec
ific
PlA
n
ZOn
inG
OR
din
An
ce
Oth
eR
OtheR (descRiPtiOn)
Brisbane •
Buellton • •
Buena Park •
Burlingame • • •
Butte County • • Updating zoning Ordinance in 2012
Calabasas • • •
California City • • Airport Master Plan
Calimesa •
Camarillo •
Campbell • •
Canyon Lake •
Capitola •
Carlsbad • •
Carpinteria •
Carson • • • • Redevelopment Agency
Ceres • •
Chico •
Chino • •
Chino Hills • • • In process
Chowchilla • • • •
Chula Vista • •
Citrus Heights • • •
Claremont • •
Clayton • • •
Clearlake • • •
Clovis •
Coachella • • Climate Action Plan under development as part of the 2012 GP update.
Coalinga • •
Colton •
Concord •
Contra Costa County • •
Corning •
Corona • • • Environmental Resources/Visual Resources/Hillside Development
Costa Mesa • • Urban Plan Overlay zoning
Covina •
Culver City • • • •
Cupertino • • • •
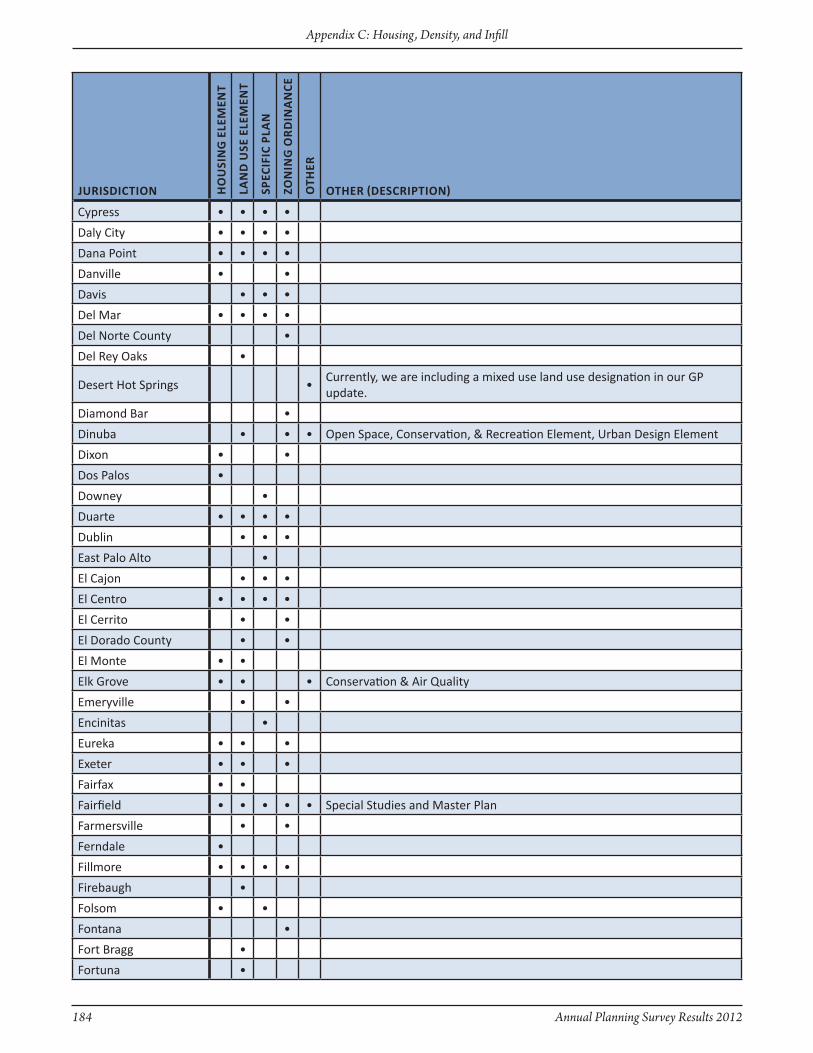
184 Annual Planning Survey Results 2012
Appendix C: Housing, Density, and Infill
JuRisdictiOn hO
usi
nG
ele
Men
t
lAn
d u
se e
leM
ent
sPec
ific
PlA
n
ZOn
inG
OR
din
An
ce
Oth
eR
OtheR (descRiPtiOn)
Cypress • • • •
Daly City • • • •
Dana Point • • • •
Danville • •
Davis • • •
Del Mar • • • •
Del Norte County •
Del Rey Oaks •
Desert Hot Springs •Currently, we are including a mixed use land use designation in our GP update.
Diamond Bar •
Dinuba • • • Open Space, Conservation, & Recreation Element, Urban Design Element
Dixon • •
Dos Palos •
Downey •
Duarte • • • •
Dublin • • •
East Palo Alto •
El Cajon • • •
El Centro • • • •
El Cerrito • •
El Dorado County • •
El Monte • •
Elk Grove • • • Conservation & Air Quality
Emeryville • •
Encinitas •
Eureka • • •
Exeter • • •
Fairfax • •
Fairfield • • • • • Special Studies and Master Plan
Farmersville • •
Ferndale •
Fillmore • • • •
Firebaugh •
Folsom • •
Fontana •
Fort Bragg •
Fortuna •

Annual Planning Survey Results 2012 185
Appendix C: Housing, Density, and Infill
JuRisdictiOn hO
usi
nG
ele
Men
t
lAn
d u
se e
leM
ent
sPec
ific
PlA
n
ZOn
inG
OR
din
An
ce
Oth
eR
OtheR (descRiPtiOn)
Foster City • • • Planned Development Use Permits
Fountain Valley •
Fowler •
Fremont • • •
Fresno • •
Fullerton • • •As part of our October 2010 adopted Fullerton Transportation Center Specific Plan
Garden Grove •
Gardena •
Gilroy • • • •
Glendale • • • •
Glendora • • • •
Glenn County • • •
Goleta • •
Gonzales •
Grand Terrace •
Grass Valley • • • •
Gridley •
Guadalupe • • •
Gustine •
Hanford • • •
Hawaiian Gardens •
Hawthorne • •
Hayward • • • Form-Based Code
Hemet •
Hercules •
Hermosa Beach • •
Hesperia • • •
Highland • •
Hollister •
Holtville • •
Hughson •
Humboldt County • •
Huntington Beach • • •
Huntington Park • • • •
Imperial Beach • • •
Indio •
Inyo County • •
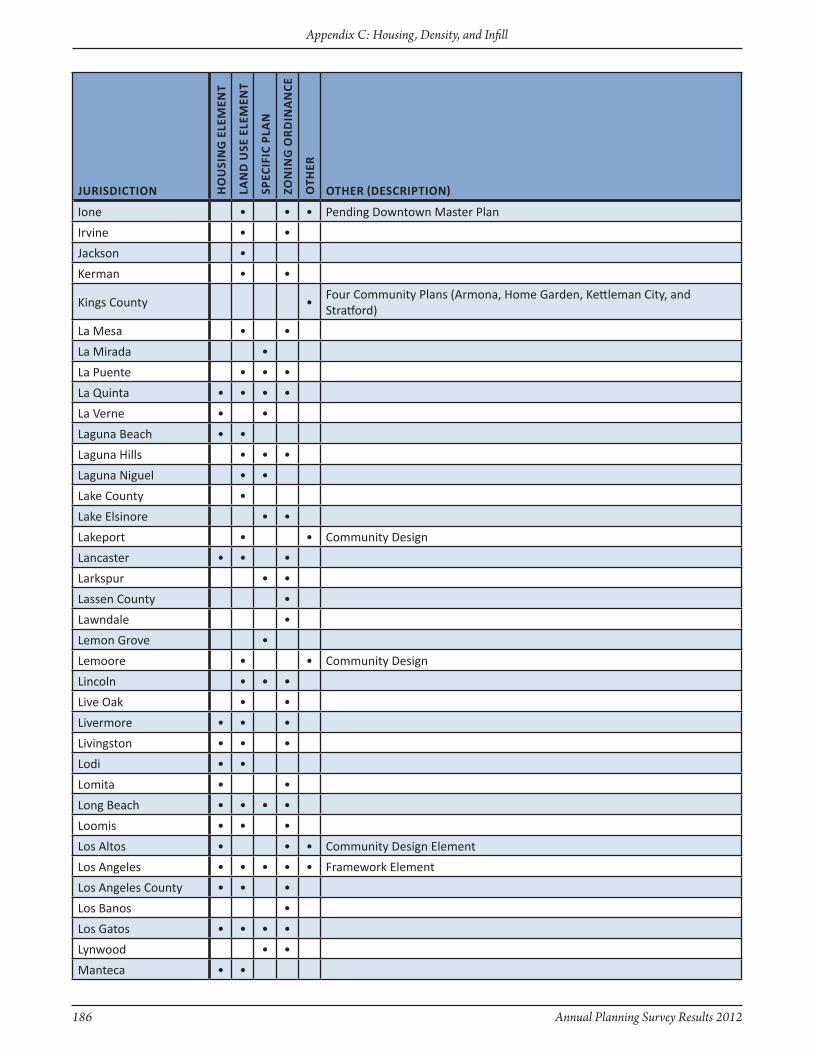
186 Annual Planning Survey Results 2012
Appendix C: Housing, Density, and Infill
JuRisdictiOn hO
usi
nG
ele
Men
t
lAn
d u
se e
leM
ent
sPec
ific
PlA
n
ZOn
inG
OR
din
An
ce
Oth
eR
OtheR (descRiPtiOn)
Ione • • • Pending Downtown Master Plan
Irvine • •
Jackson •
Kerman • •
Kings County •Four Community Plans (Armona, Home Garden, Kettleman City, and Stratford)
La Mesa • •
La Mirada •
La Puente • • •
La Quinta • • • •
La Verne • •
Laguna Beach • •
Laguna Hills • • •
Laguna Niguel • •
Lake County •
Lake Elsinore • •
Lakeport • • Community Design
Lancaster • • •
Larkspur • •
Lassen County •
Lawndale •
Lemon Grove •
Lemoore • • Community Design
Lincoln • • •
Live Oak • •
Livermore • • •
Livingston • • •
Lodi • •
Lomita • •
Long Beach • • • •
Loomis • • •
Los Altos • • • Community Design Element
Los Angeles • • • • • Framework Element
Los Angeles County • • •
Los Banos •
Los Gatos • • • •
Lynwood • •
Manteca • •
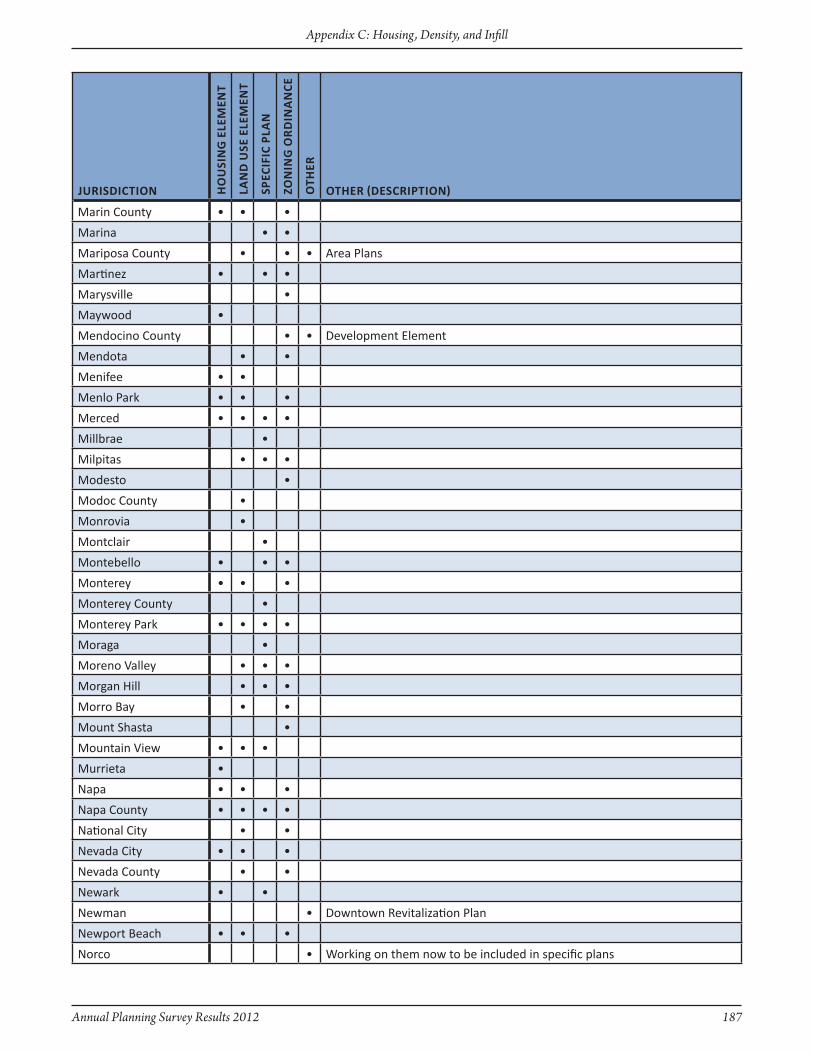
Annual Planning Survey Results 2012 187
Appendix C: Housing, Density, and Infill
JuRisdictiOn hO
usi
nG
ele
Men
t
lAn
d u
se e
leM
ent
sPec
ific
PlA
n
ZOn
inG
OR
din
An
ce
Oth
eR
OtheR (descRiPtiOn)
Marin County • • •
Marina • •
Mariposa County • • • Area Plans
Martinez • • •
Marysville •
Maywood •
Mendocino County • • Development Element
Mendota • •
Menifee • •
Menlo Park • • •
Merced • • • •
Millbrae •
Milpitas • • •
Modesto •
Modoc County •
Monrovia •
Montclair •
Montebello • • •
Monterey • • •
Monterey County •
Monterey Park • • • •
Moraga •
Moreno Valley • • •
Morgan Hill • • •
Morro Bay • •
Mount Shasta •
Mountain View • • •
Murrieta •
Napa • • •
Napa County • • • •
National City • •
Nevada City • • •
Nevada County • •
Newark • •
Newman • Downtown Revitalization Plan
Newport Beach • • •
Norco • Working on them now to be included in specific plans

188 Annual Planning Survey Results 2012
Appendix C: Housing, Density, and Infill
JuRisdictiOn hO
usi
nG
ele
Men
t
lAn
d u
se e
leM
ent
sPec
ific
PlA
n
ZOn
inG
OR
din
An
ce
Oth
eR
OtheR (descRiPtiOn)
Novato • • • • Climate Action Plan
Oakdale •
Oakland • •
Oakley • Commercial Expediting Program
Oceanside •
Ojai • •
Ontario • • • • PUD
Orange • • •
Orange Cove • •
Orinda • •
Orland •
Oroville • •
Oxnard • • • •
Pacific Grove • •
Pacifica • • •
Palm Springs • •
Palmdale • • • • Community Design Element
Palo Alto • • • •
Paradise • • •
Paramount • •
Parlier • •
Pasadena • • •
Paso Robles • • • •
Patterson •
Perris • • •
Pico Rivera •
Piedmont • • •
Pinole • • •
Pismo Beach • •
Pittsburg • • • • • Master Plan
Placer County • • •
Placerville •
Pleasant Hill • • •
Pleasanton • •
Plumas County •
Plymouth •
Point Arena •

Annual Planning Survey Results 2012 189
Appendix C: Housing, Density, and Infill
JuRisdictiOn hO
usi
nG
ele
Men
t
lAn
d u
se e
leM
ent
sPec
ific
PlA
n
ZOn
inG
OR
din
An
ce
Oth
eR
OtheR (descRiPtiOn)
Port Hueneme •
Porterville • • •
Portola • • •
Poway •
Rancho Cordova • • •
Rancho Cucamonga •
Rancho Santa Margarita
• •
Red Bluff • • •
Redding • •
Redlands • • • •
Redondo Beach • • •
Redwood City • • • Downtown Precise Plan
Reedley • •
Rialto •
Richmond • •
Ridgecrest •
Riverbank • • • Air Quality; and Community Character and Design
Riverside • • • •
Riverside County • • • •
Rocklin •
Rohnert Park • • •
Rolling Hills Estates • • •
Rosemead • •
Roseville • • • •
Ross • •
Sacramento County • • • Corridor Plans
Salinas • •
San Anselmo •
San Benito County • Transportation Element
San Bernardino •
San Bernardino County •
San Bruno • • •
San Carlos • • •
San Clemente • •
San Diego • • •
San Diego County • Mixed use designation
San Dimas • • • •

190 Annual Planning Survey Results 2012
Appendix C: Housing, Density, and Infill
JuRisdictiOn hO
usi
nG
ele
Men
t
lAn
d u
se e
leM
ent
sPec
ific
PlA
n
ZOn
inG
OR
din
An
ce
Oth
eR
OtheR (descRiPtiOn)
San Fernando • • • •
San Francisco • • • •
San Gabriel • • • •
San Jacinto • •
San Jose • • • • •San Jose has an integrated General Plan, and the policies are found throughout the document. In addition, the City has adopted Design Guidelines and other Policy documents (e.g., Vision North San Jose).
San Juan Bautista •
San Juan Capistrano • • •
San Leandro • • •
San Luis Obispo • • •
San Luis Obispo County •
San Marcos •
San Mateo • • •
San Pablo • • •
San Rafael • • •
San Ramon • • • •
Sand City • •
Sanger • •
Santa Ana • •
Santa Barbara • • •
Santa Clara County •
Santa Clarita • • •
Santa Cruz • • • Upcoming Land Use element increases mixed use programs and policies
Santa Cruz County • • Circulation element
Santa Maria •
Santa Monica • • •
Santa Paula • •
Santa Rosa • • • •
Santee •
Saratoga •
Seaside •
Sebastopol • • •
Sierra County •
Signal Hill • •
Simi Valley • • • •
Solana Beach • • • •
Solano County •

Annual Planning Survey Results 2012 191
Appendix C: Housing, Density, and Infill
JuRisdictiOn hO
usi
nG
ele
Men
t
lAn
d u
se e
leM
ent
sPec
ific
PlA
n
ZOn
inG
OR
din
An
ce
Oth
eR
OtheR (descRiPtiOn)
Soledad •Mixed Use development will be provided as part of the update of the City's Downtown Specific Plan.
Solvang •
Sonoma • • •
Sonora •
South El Monte • •
South Gate • • • •
South Lake Tahoe • • • •
South San Francisco • •
St. Helena • •
Stanton • •
Stockton • Districts and Villages
Suisun City • • •
Sunnyvale • • •
Sutter County •
Sutter Creek • •
Taft • •
Tehachapi • •
Tehama County • • •
Temecula • •
Thousand Oaks • Thousand Oaks Boulevard Specific Plan in progress
Tiburon • •
Torrance • •
Tracy •
Trinidad • •
Truckee • • Community Character Element; Conservation & Open Space Element
Tulare •
Tulare County •
Tuolumne County • •
Turlock • • • •
Ukiah • •
Union City • •
Upland •
Vacaville • •
Vallejo • • • •
Ventura County • • •
Victorville • •
Villa Park • • •
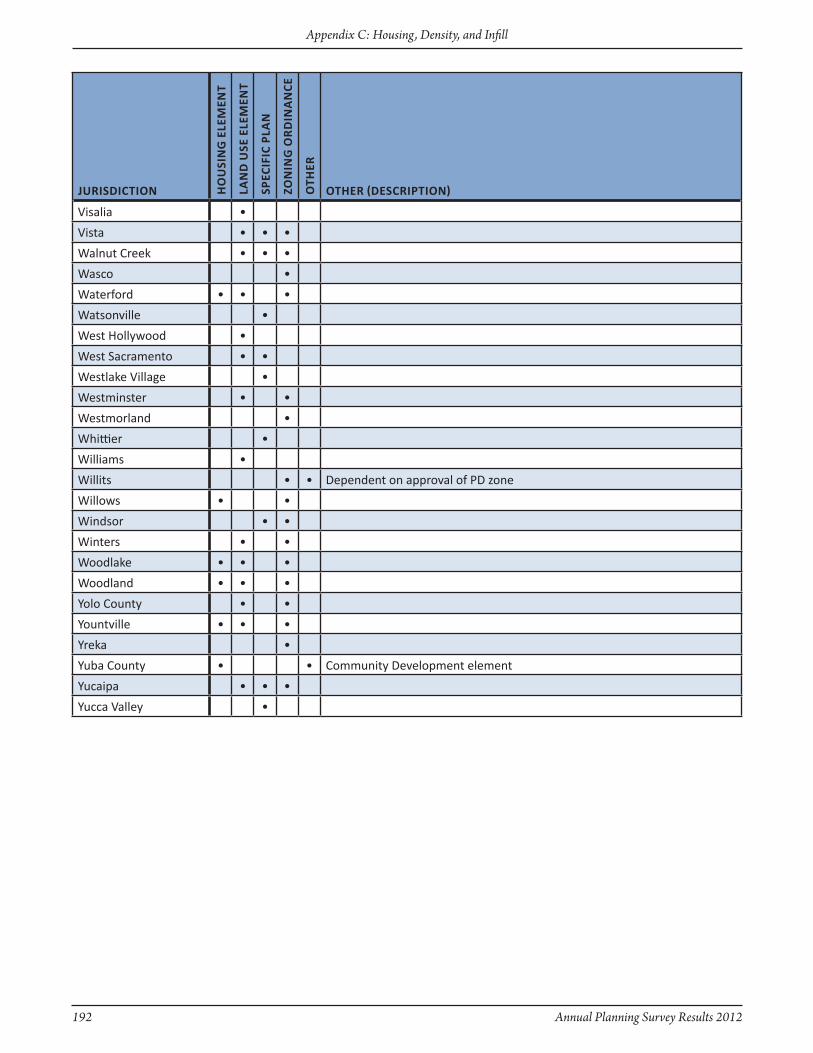
192 Annual Planning Survey Results 2012
Appendix C: Housing, Density, and Infill
JuRisdictiOn hO
usi
nG
ele
Men
t
lAn
d u
se e
leM
ent
sPec
ific
PlA
n
ZOn
inG
OR
din
An
ce
Oth
eR
OtheR (descRiPtiOn)
Visalia •
Vista • • •
Walnut Creek • • •
Wasco •
Waterford • • •
Watsonville •
West Hollywood •
West Sacramento • •
Westlake Village •
Westminster • •
Westmorland •
Whittier •
Williams •
Willits • • Dependent on approval of PD zone
Willows • •
Windsor • •
Winters • •
Woodlake • • •
Woodland • • •
Yolo County • •
Yountville • • •
Yreka •
Yuba County • • Community Development element
Yucaipa • • •
Yucca Valley •
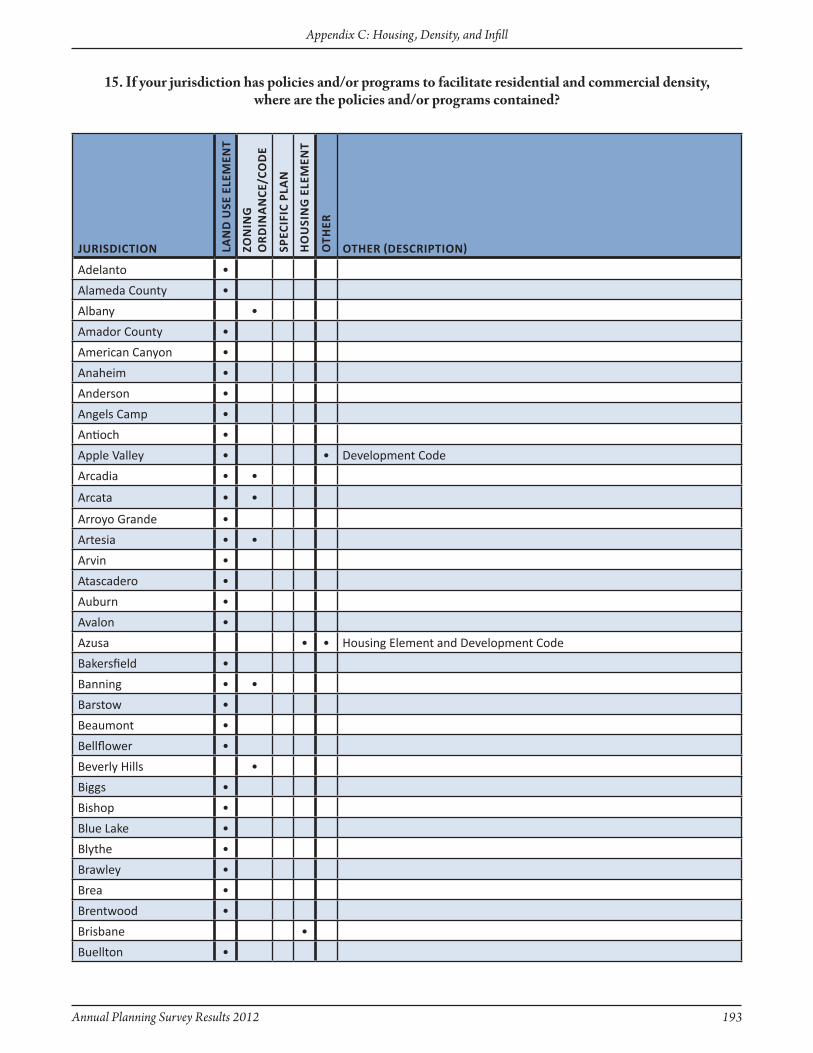
Annual Planning Survey Results 2012 193
Appendix C: Housing, Density, and Infill
JuRisdictiOn lAn
d u
se e
leM
ent
Zon
ing
O
Rd
inA
nce
/cO
de
sPec
ific
PlA
n
hO
usi
nG
ele
Men
t
Oth
eR
OtheR (descRiPtiOn)
Adelanto •
Alameda County •
Albany •
Amador County •
American Canyon •
Anaheim •
Anderson •
Angels Camp •
Antioch •
Apple Valley • • Development Code
Arcadia • •
Arcata • •
Arroyo Grande •
Artesia • •
Arvin •
Atascadero •
Auburn •
Avalon •
Azusa • • Housing Element and Development Code
Bakersfield •
Banning • •
Barstow •
Beaumont •
Bellflower •
Beverly Hills •
Biggs •
Bishop •
Blue Lake •
Blythe •
Brawley •
Brea •
Brentwood •
Brisbane •
Buellton •
15. If your jurisdiction has policies and/or programs to facilitate residential and commercial density,where are the policies and/or programs contained?
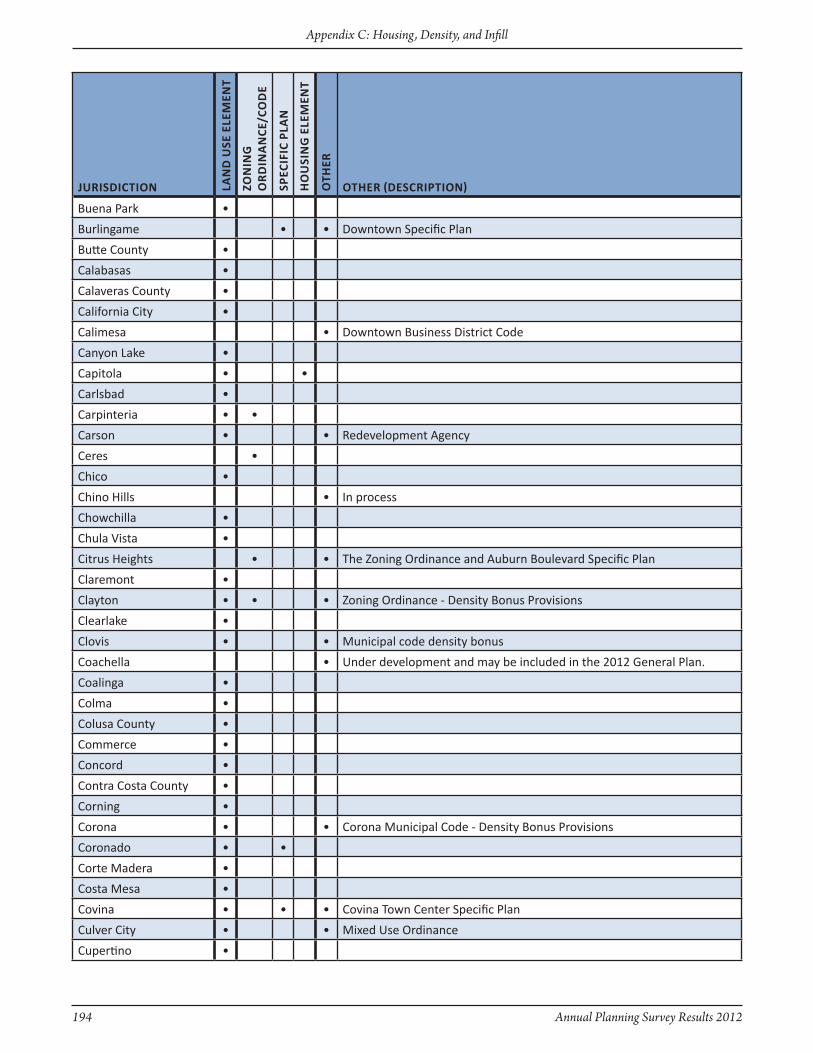
194 Annual Planning Survey Results 2012
Appendix C: Housing, Density, and Infill
JuRisdictiOn lAn
d u
se e
leM
ent
Zon
ing
O
Rd
inA
nce
/cO
de
sPec
ific
PlA
n
hO
usi
nG
ele
Men
t
Oth
eR
OtheR (descRiPtiOn)
Buena Park •
Burlingame • • Downtown Specific Plan
Butte County •
Calabasas •
Calaveras County •
California City •
Calimesa • Downtown Business District Code
Canyon Lake •
Capitola • •
Carlsbad •
Carpinteria • •
Carson • • Redevelopment Agency
Ceres •
Chico •
Chino Hills • In process
Chowchilla •
Chula Vista •
Citrus Heights • • The zoning Ordinance and Auburn Boulevard Specific Plan
Claremont •
Clayton • • • zoning Ordinance - Density Bonus Provisions
Clearlake •
Clovis • • Municipal code density bonus
Coachella • Under development and may be included in the 2012 General Plan.
Coalinga •
Colma •
Colusa County •
Commerce •
Concord •
Contra Costa County •
Corning •
Corona • • Corona Municipal Code - Density Bonus Provisions
Coronado • •
Corte Madera •
Costa Mesa •
Covina • • • Covina Town Center Specific Plan
Culver City • • Mixed Use Ordinance
Cupertino •

Annual Planning Survey Results 2012 195
Appendix C: Housing, Density, and Infill
JuRisdictiOn lAn
d u
se e
leM
ent
Zon
ing
O
Rd
inA
nce
/cO
de
sPec
ific
PlA
n
hO
usi
nG
ele
Men
t
Oth
eR
OtheR (descRiPtiOn)
Cypress •
Daly City •
Dana Point • • • • zoning Ordinance, Town Center Plan
Davis •
Del Mar •
Del Norte County •
Del Rey Oaks •
Desert Hot Springs •
Diamond Bar •
Dinuba • • •Open Space, Conservation, & Recreation Element, Circulation Element, Urban Boundary Element, Housing Element
Dixon •
Dos Palos •
Duarte •
Dublin • • •
East Palo Alto • •
El Cajon •
El Centro •
El Cerrito •
El Dorado County •
El Monte •
Elk Grove • Land Use Element - residential only
Emeryville •
Encinitas •
Eureka •
Exeter •
Fairfax • •
Fairfield • •
Farmersville •
Fillmore •
Folsom •
Fontana •
Fort Bragg • Coastal Land Use and Development Code
Fortuna •
Foster City • • Planned Development Use Permits
Fremont • •Updated General Plan includes strong policies promoting mixed use in Land Use, Community Character
Fresno •
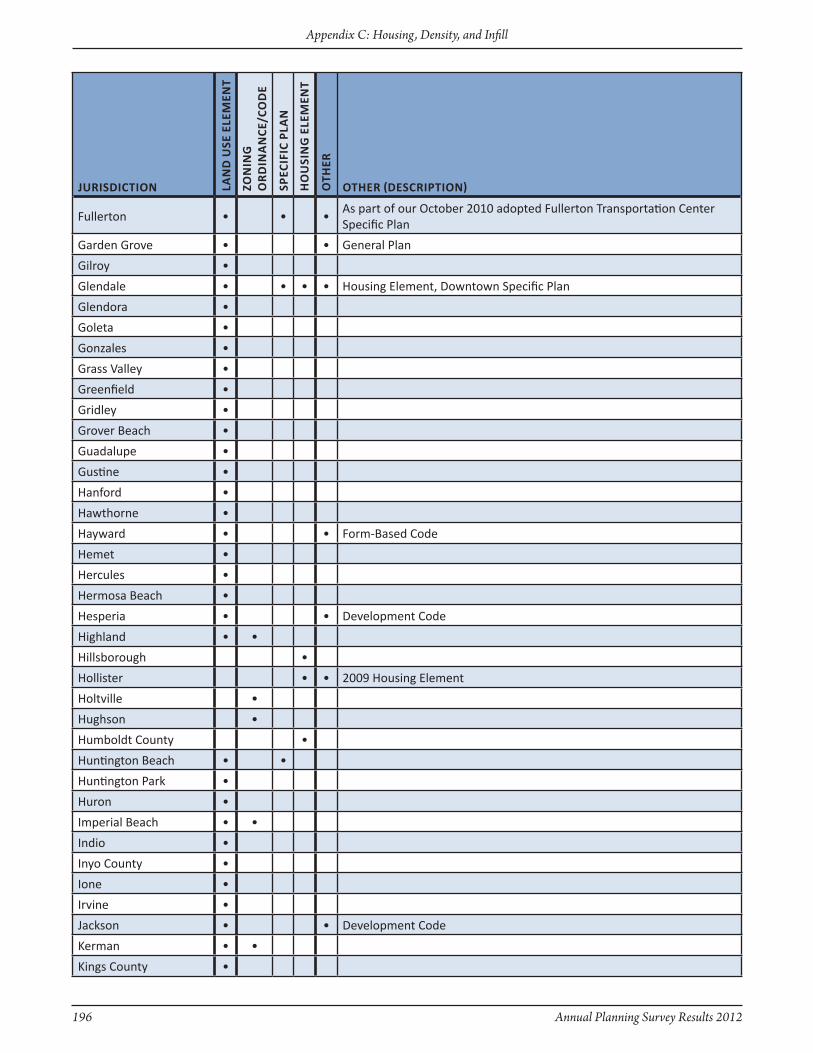
196 Annual Planning Survey Results 2012
Appendix C: Housing, Density, and Infill
JuRisdictiOn lAn
d u
se e
leM
ent
Zon
ing
O
Rd
inA
nce
/cO
de
sPec
ific
PlA
n
hO
usi
nG
ele
Men
t
Oth
eR
OtheR (descRiPtiOn)
Fullerton • • •As part of our October 2010 adopted Fullerton Transportation Center Specific Plan
Garden Grove • • General Plan
Gilroy •
Glendale • • • • Housing Element, Downtown Specific Plan
Glendora •
Goleta •
Gonzales •
Grass Valley •
Greenfield •
Gridley •
Grover Beach •
Guadalupe •
Gustine •
Hanford •
Hawthorne •
Hayward • • Form-Based Code
Hemet •
Hercules •
Hermosa Beach •
Hesperia • • Development Code
Highland • •
Hillsborough •
Hollister • • 2009 Housing Element
Holtville •
Hughson •
Humboldt County •
Huntington Beach • •
Huntington Park •
Huron •
Imperial Beach • •
Indio •
Inyo County •
Ione •
Irvine •
Jackson • • Development Code
Kerman • •
Kings County •
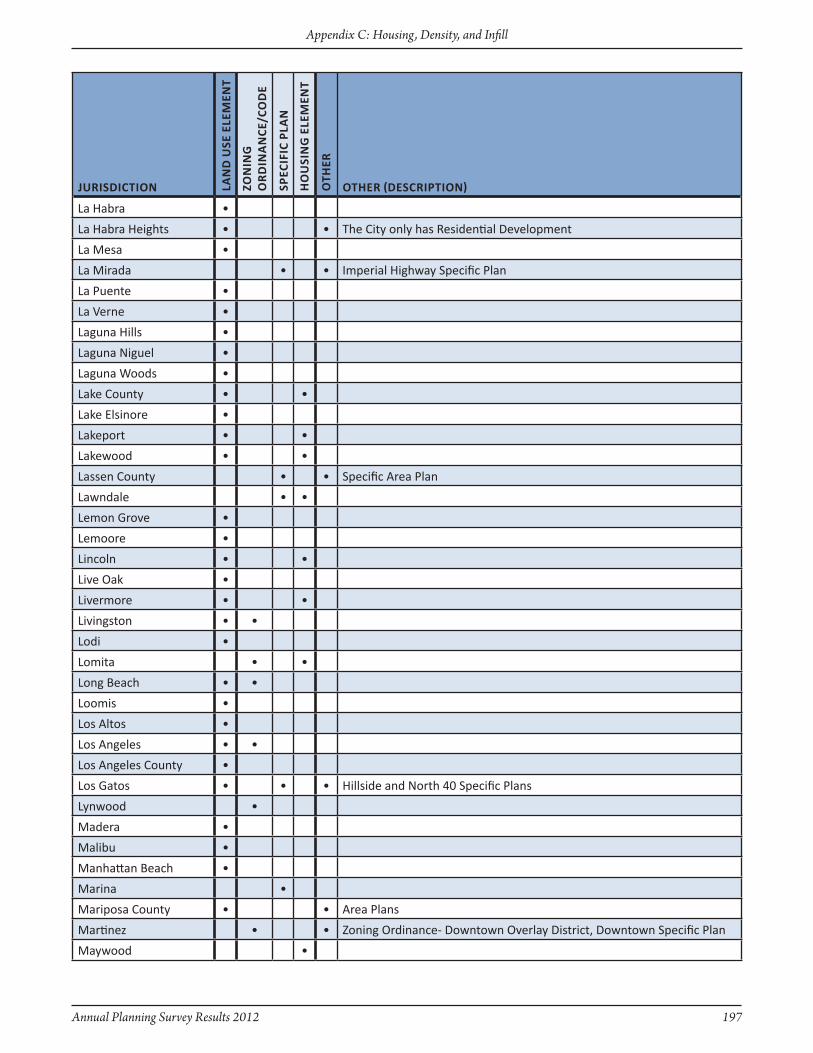
Annual Planning Survey Results 2012 197
Appendix C: Housing, Density, and Infill
JuRisdictiOn lAn
d u
se e
leM
ent
Zon
ing
O
Rd
inA
nce
/cO
de
sPec
ific
PlA
n
hO
usi
nG
ele
Men
t
Oth
eR
OtheR (descRiPtiOn)
La Habra •
La Habra Heights • • The City only has Residential Development
La Mesa •
La Mirada • • Imperial Highway Specific Plan
La Puente •
La Verne •
Laguna Hills •
Laguna Niguel •
Laguna Woods •
Lake County • •
Lake Elsinore •
Lakeport • •
Lakewood • •
Lassen County • • Specific Area Plan
Lawndale • •
Lemon Grove •
Lemoore •
Lincoln • •
Live Oak •
Livermore • •
Livingston • •
Lodi •
Lomita • •
Long Beach • •
Loomis •
Los Altos •
Los Angeles • •
Los Angeles County •
Los Gatos • • • Hillside and North 40 Specific Plans
Lynwood •
Madera •
Malibu •
Manhattan Beach •
Marina •
Mariposa County • • Area Plans
Martinez • • zoning Ordinance- Downtown Overlay District, Downtown Specific Plan
Maywood •
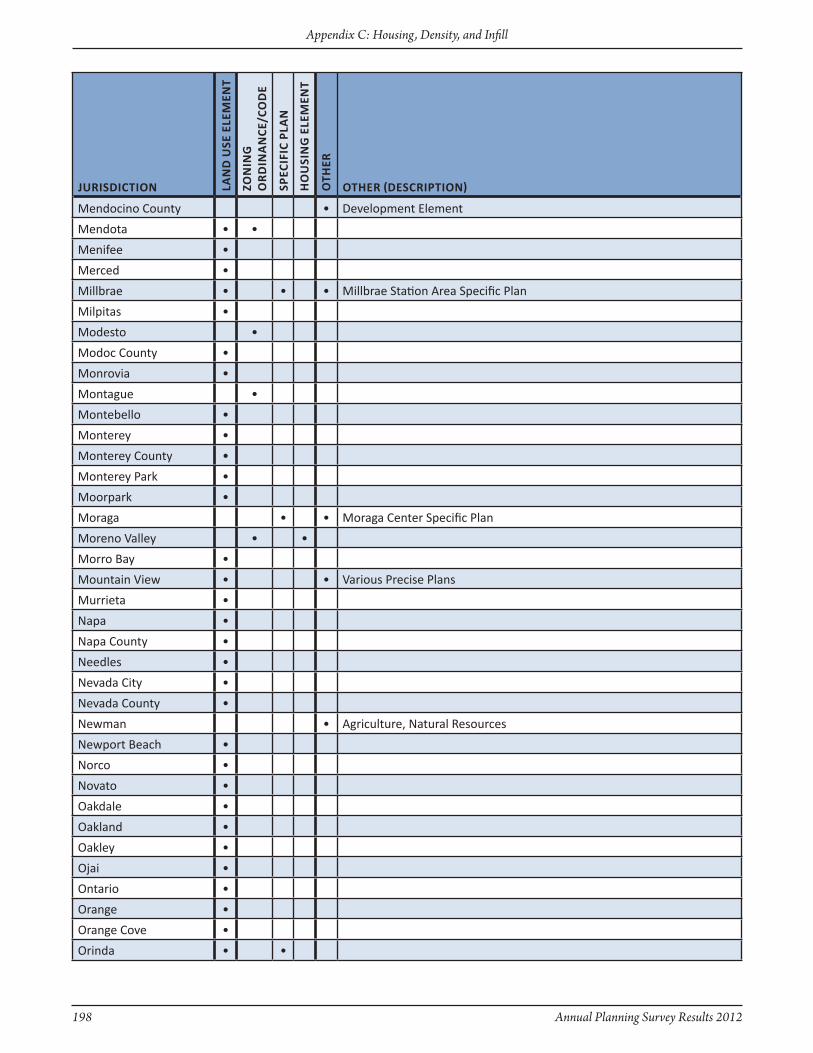
198 Annual Planning Survey Results 2012
Appendix C: Housing, Density, and Infill
JuRisdictiOn lAn
d u
se e
leM
ent
Zon
ing
O
Rd
inA
nce
/cO
de
sPec
ific
PlA
n
hO
usi
nG
ele
Men
t
Oth
eR
OtheR (descRiPtiOn)
Mendocino County • Development Element
Mendota • •
Menifee •
Merced •
Millbrae • • • Millbrae Station Area Specific Plan
Milpitas •
Modesto •
Modoc County •
Monrovia •
Montague •
Montebello •
Monterey •
Monterey County •
Monterey Park •
Moorpark •
Moraga • • Moraga Center Specific Plan
Moreno Valley • •
Morro Bay •
Mountain View • • Various Precise Plans
Murrieta •
Napa •
Napa County •
Needles •
Nevada City •
Nevada County •
Newman • Agriculture, Natural Resources
Newport Beach •
Norco •
Novato •
Oakdale •
Oakland •
Oakley •
Ojai •
Ontario •
Orange •
Orange Cove •
Orinda • •

Annual Planning Survey Results 2012 199
Appendix C: Housing, Density, and Infill
JuRisdictiOn lAn
d u
se e
leM
ent
Zon
ing
O
Rd
inA
nce
/cO
de
sPec
ific
PlA
n
hO
usi
nG
ele
Men
t
Oth
eR
OtheR (descRiPtiOn)
Orland •
Oroville •
Oxnard •
Pacific Grove •
Palm Springs •
Palmdale • • •Community Design Element / Downtown Revitalization Plan / zoning Ordinance
Palo Alto • •
Paradise • •
Paramount •
Parlier •
Pasadena •
Paso Robles • • • Uptown/Town Centre Specific Plan
Patterson •
Perris •
Pico Rivera •
Piedmont • • •
Pinole • • •
Pismo Beach •
Pittsburg • • • • zoning Ordinance; Urban Design Element; Specific Plan; Master Plan
Placer County •
Placerville •
Pleasant Hill • Economic Strategy Element
Pleasanton • • • Applicable Specific Plans
Point Arena •
Port Hueneme •
Porterville •
Rancho Cordova •
Rancho Cucamonga •
Rancho Palos Verdes •
Rancho Santa Margarita •
Red Bluff •
Redding •
Redlands •
Redondo Beach •
Redwood City •
Reedley •
Richmond •
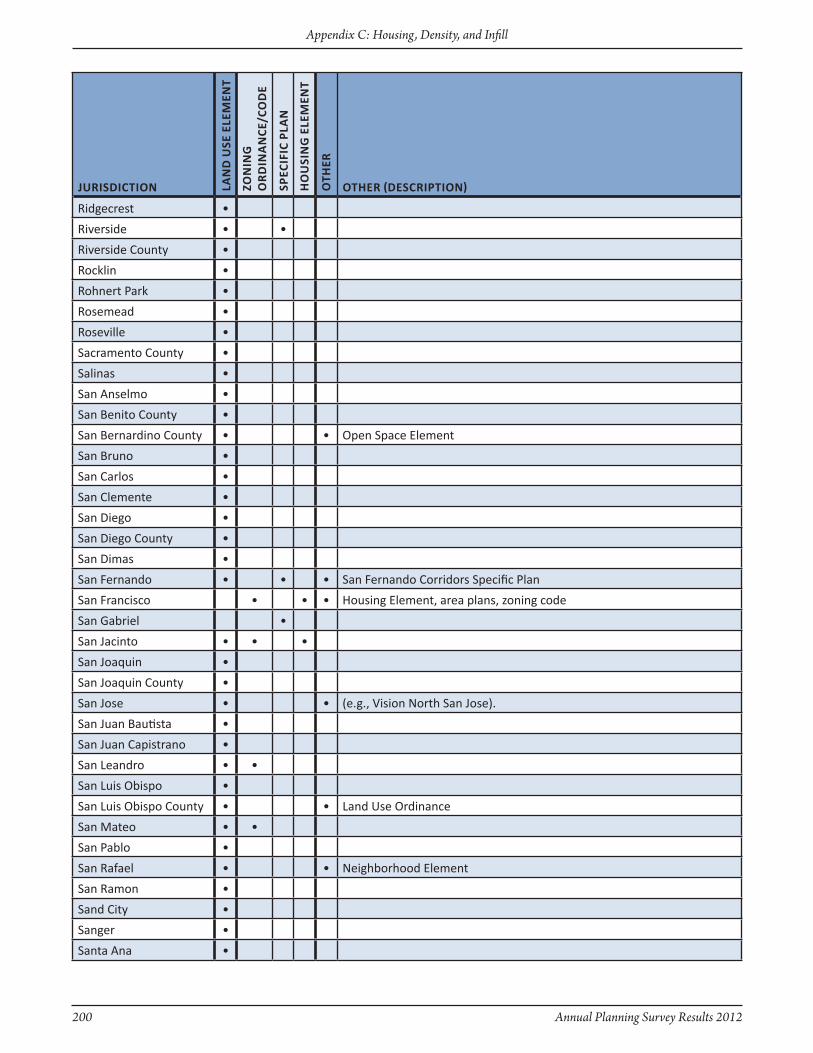
200 Annual Planning Survey Results 2012
Appendix C: Housing, Density, and Infill
JuRisdictiOn lAn
d u
se e
leM
ent
Zon
ing
O
Rd
inA
nce
/cO
de
sPec
ific
PlA
n
hO
usi
nG
ele
Men
t
Oth
eR
OtheR (descRiPtiOn)
Ridgecrest •
Riverside • •
Riverside County •
Rocklin •
Rohnert Park •
Rosemead •
Roseville •
Sacramento County •
Salinas •
San Anselmo •
San Benito County •
San Bernardino County • • Open Space Element
San Bruno •
San Carlos •
San Clemente •
San Diego •
San Diego County •
San Dimas •
San Fernando • • • San Fernando Corridors Specific Plan
San Francisco • • • Housing Element, area plans, zoning code
San Gabriel •
San Jacinto • • •
San Joaquin •
San Joaquin County •
San Jose • • (e.g., Vision North San Jose).
San Juan Bautista •
San Juan Capistrano •
San Leandro • •
San Luis Obispo •
San Luis Obispo County • • Land Use Ordinance
San Mateo • •
San Pablo •
San Rafael • • Neighborhood Element
San Ramon •
Sand City •
Sanger •
Santa Ana •
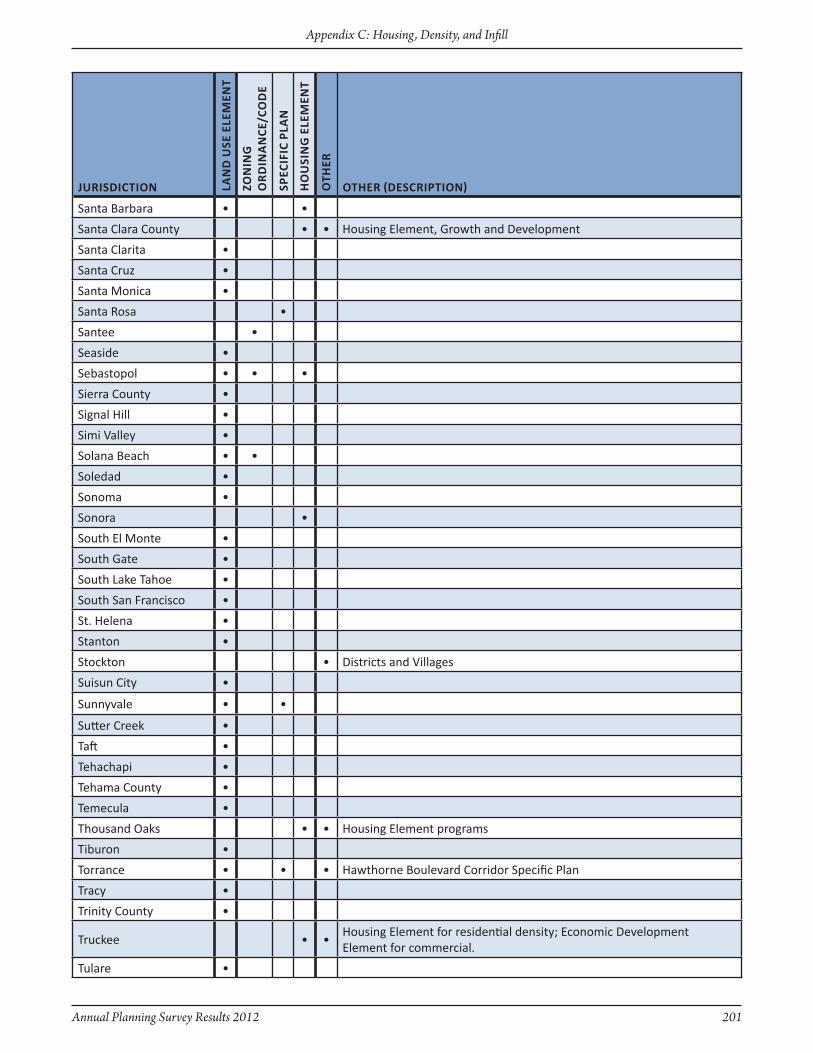
Annual Planning Survey Results 2012 201
Appendix C: Housing, Density, and Infill
JuRisdictiOn lAn
d u
se e
leM
ent
Zon
ing
O
Rd
inA
nce
/cO
de
sPec
ific
PlA
n
hO
usi
nG
ele
Men
t
Oth
eR
OtheR (descRiPtiOn)
Santa Barbara • •
Santa Clara County • • Housing Element, Growth and Development
Santa Clarita •
Santa Cruz •
Santa Monica •
Santa Rosa •
Santee •
Seaside •
Sebastopol • • •
Sierra County •
Signal Hill •
Simi Valley •
Solana Beach • •
Soledad •
Sonoma •
Sonora •
South El Monte •
South Gate •
South Lake Tahoe •
South San Francisco •
St. Helena •
Stanton •
Stockton • Districts and Villages
Suisun City •
Sunnyvale • •
Sutter Creek •
Taft •
Tehachapi •
Tehama County •
Temecula •
Thousand Oaks • • Housing Element programs
Tiburon •
Torrance • • • Hawthorne Boulevard Corridor Specific Plan
Tracy •
Trinity County •
Truckee • •Housing Element for residential density; Economic Development Element for commercial.
Tulare •

202 Annual Planning Survey Results 2012
Appendix C: Housing, Density, and Infill
JuRisdictiOn lAn
d u
se e
leM
ent
Zon
ing
O
Rd
inA
nce
/cO
de
sPec
ific
PlA
n
hO
usi
nG
ele
Men
t
Oth
eR
OtheR (descRiPtiOn)
Tulare County •
Tuolumne County •
Turlock •
Ukiah •
Union City •
Upland •
Vacaville •
Vallejo •
Ventura County • • •Housing Element Program includes re-zoning to high density completed in 2011
Victorville •
Villa Park •
Visalia •
Vista •
Walnut Creek • •
Wasco •
Waterford •
West Hollywood •
West Sacramento •
Westminster •
Westmorland • •
Whittier •
Williams •
Willits • • zoning ordinance, dependent on approval of PD zone
Willows •
Winters • • Form Based Code/zoning Code
Woodland •
Yolo County •
Yorba Linda •
Yountville • •
Yuba County • Community Development element
Yucca Valley •
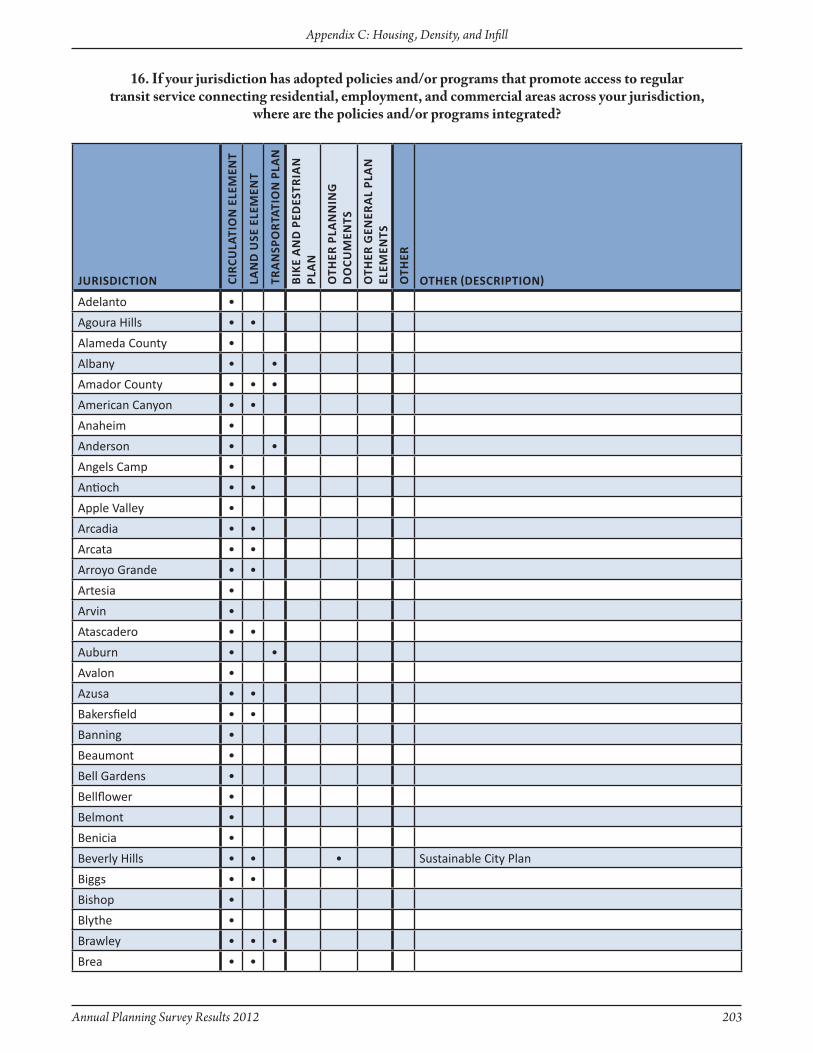
Annual Planning Survey Results 2012 203
Appendix C: Housing, Density, and Infill
JuRisdictiOn ciR
culA
tiO
n e
leM
ent
lAn
d u
se e
leM
ent
tRA
nsP
OR
tAti
On
PlA
n
Bik
e A
nd
Ped
estR
iAn
Pl
An
Oth
eR P
lAn
nin
G
dO
cuM
ents
Oth
eR G
eneR
Al
PlA
n
eleM
ents
Oth
eR
OtheR (descRiPtiOn)
Adelanto •
Agoura Hills • •
Alameda County •
Albany • •
Amador County • • •
American Canyon • •
Anaheim •
Anderson • •
Angels Camp •
Antioch • •
Apple Valley •
Arcadia • •
Arcata • •
Arroyo Grande • •
Artesia •
Arvin •
Atascadero • •
Auburn • •
Avalon •
Azusa • •
Bakersfield • •
Banning •
Beaumont •
Bell Gardens •
Bellflower •
Belmont •
Benicia •
Beverly Hills • • • Sustainable City Plan
Biggs • •
Bishop •
Blythe •
Brawley • • •
Brea • •
16. If your jurisdiction has adopted policies and/or programs that promote access to regulartransit service connecting residential, employment, and commercial areas across your jurisdiction,
where are the policies and/or programs integrated?

204 Annual Planning Survey Results 2012
Appendix C: Housing, Density, and Infill
JuRisdictiOn ciR
culA
tiO
n e
leM
ent
lAn
d u
se e
leM
ent
tRA
nsP
OR
tAti
On
PlA
n
Bik
e A
nd
Ped
estR
iAn
Pl
An
Oth
eR P
lAn
nin
G
dO
cuM
ents
Oth
eR G
eneR
Al
PlA
n
eleM
ents
Oth
eR
OtheR (descRiPtiOn)
Brentwood • • • Growth Management, Economic Development
Brisbane •
Buena Park • • Mobility Element, Conservation & Sustainability Element
Butte County • •
Calabasas •
California City • • • City's Bicycle Plan
Campbell • •
Canyon Lake •
Capitola • Housing Element
Carlsbad • •
Carpinteria • •
Carson • •
Ceres •
Chico • •
Chino •
Chino Hills • •
Chowchilla • •
Chula Vista •
Citrus Heights • • • •Community Development Element, zoning Code, Auburn Boulevard Specific and Bikeway Master Plan
Claremont •
Clayton • • Growth Managment Element
Clearlake • •
Clovis •
Coachella •Regional transportation and bus services are under the jurisdictions of CVAG and Sunline.
Coalinga •
Commerce •
Contra Costa County • • Specific Plan
Corona • •
Coronado • • •
Covina • City of Covina Bicycle Master Plan
Culver City • • •
Cupertino •
Cypress •
Daly City • Specific Plan
Danville •
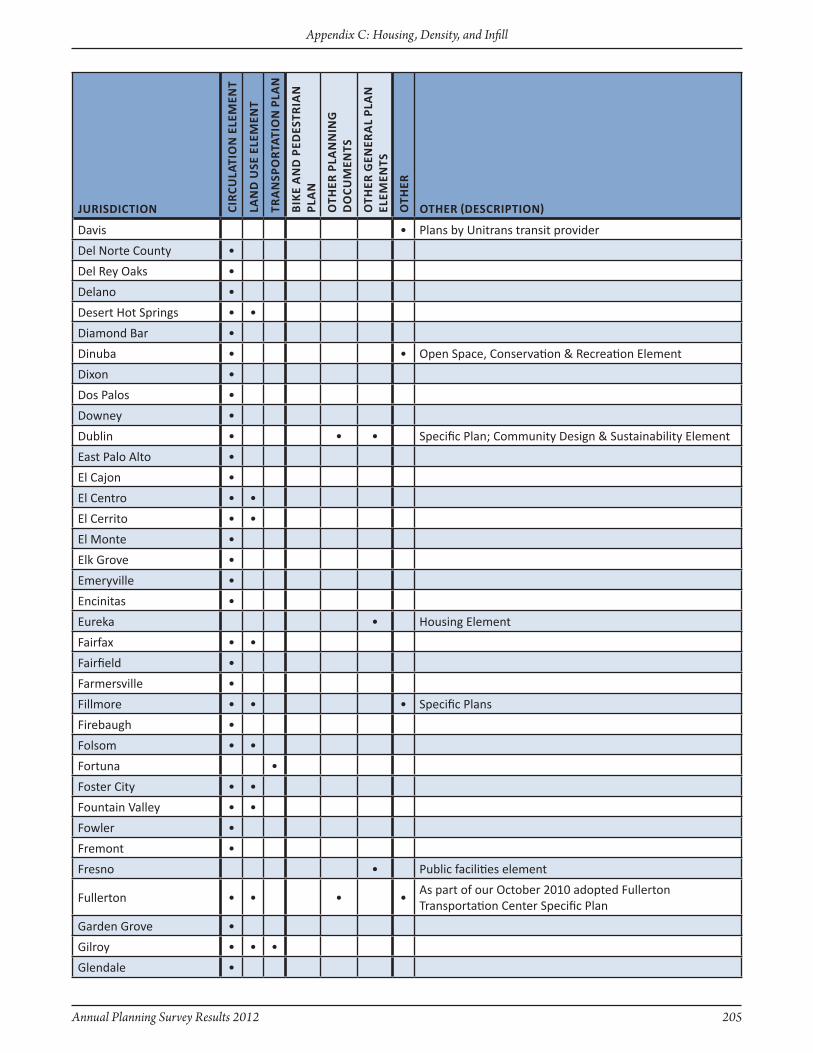
Annual Planning Survey Results 2012 205
Appendix C: Housing, Density, and Infill
JuRisdictiOn ciR
culA
tiO
n e
leM
ent
lAn
d u
se e
leM
ent
tRA
nsP
OR
tAti
On
PlA
n
Bik
e A
nd
Ped
estR
iAn
Pl
An
Oth
eR P
lAn
nin
G
dO
cuM
ents
Oth
eR G
eneR
Al
PlA
n
eleM
ents
Oth
eR
OtheR (descRiPtiOn)
Davis • Plans by Unitrans transit provider
Del Norte County •
Del Rey Oaks •
Delano •
Desert Hot Springs • •
Diamond Bar •
Dinuba • • Open Space, Conservation & Recreation Element
Dixon •
Dos Palos •
Downey •
Dublin • • • Specific Plan; Community Design & Sustainability Element
East Palo Alto •
El Cajon •
El Centro • •
El Cerrito • •
El Monte •
Elk Grove •
Emeryville •
Encinitas •
Eureka • Housing Element
Fairfax • •
Fairfield •
Farmersville •
Fillmore • • • Specific Plans
Firebaugh •
Folsom • •
Fortuna •
Foster City • •
Fountain Valley • •
Fowler •
Fremont •
Fresno • Public facilities element
Fullerton • • • •As part of our October 2010 adopted Fullerton Transportation Center Specific Plan
Garden Grove •
Gilroy • • •
Glendale •
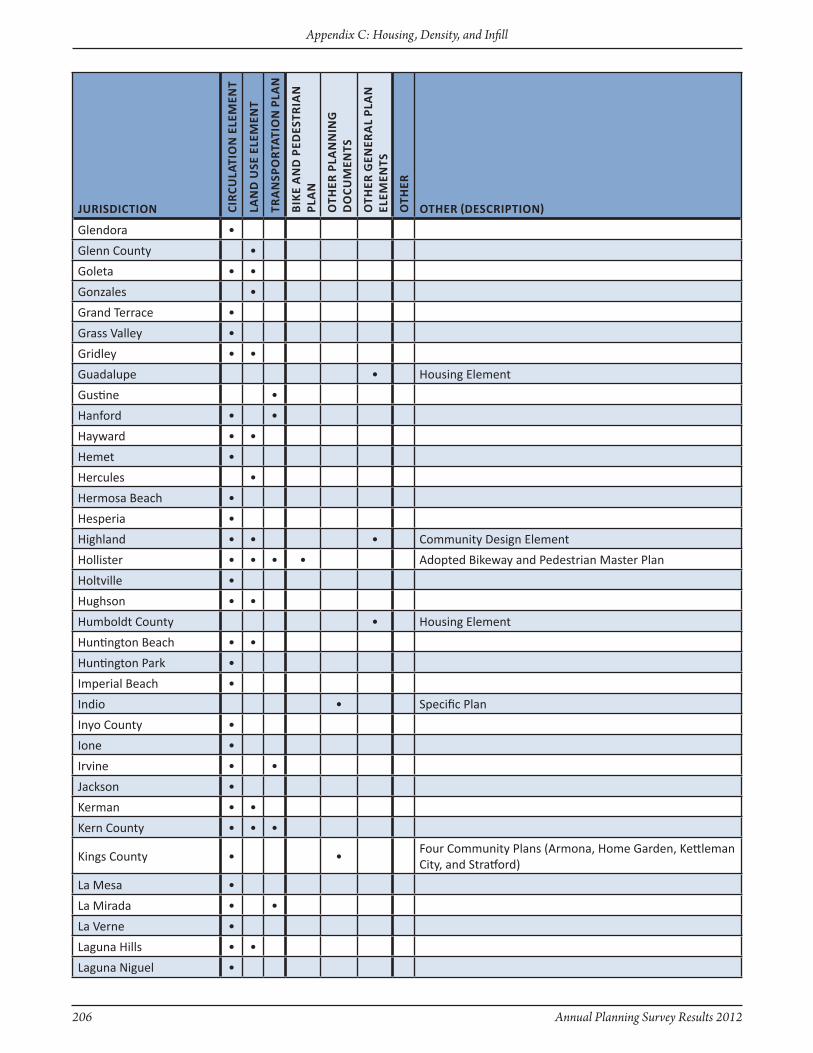
206 Annual Planning Survey Results 2012
Appendix C: Housing, Density, and Infill
JuRisdictiOn ciR
culA
tiO
n e
leM
ent
lAn
d u
se e
leM
ent
tRA
nsP
OR
tAti
On
PlA
n
Bik
e A
nd
Ped
estR
iAn
Pl
An
Oth
eR P
lAn
nin
G
dO
cuM
ents
Oth
eR G
eneR
Al
PlA
n
eleM
ents
Oth
eR
OtheR (descRiPtiOn)
Glendora •
Glenn County •
Goleta • •
Gonzales •
Grand Terrace •
Grass Valley •
Gridley • •
Guadalupe • Housing Element
Gustine •
Hanford • •
Hayward • •
Hemet •
Hercules •
Hermosa Beach •
Hesperia •
Highland • • • Community Design Element
Hollister • • • • Adopted Bikeway and Pedestrian Master Plan
Holtville •
Hughson • •
Humboldt County • Housing Element
Huntington Beach • •
Huntington Park •
Imperial Beach •
Indio • Specific Plan
Inyo County •
Ione •
Irvine • •
Jackson •
Kerman • •
Kern County • • •
Kings County • •Four Community Plans (Armona, Home Garden, Kettleman City, and Stratford)
La Mesa •
La Mirada • •
La Verne •
Laguna Hills • •
Laguna Niguel •
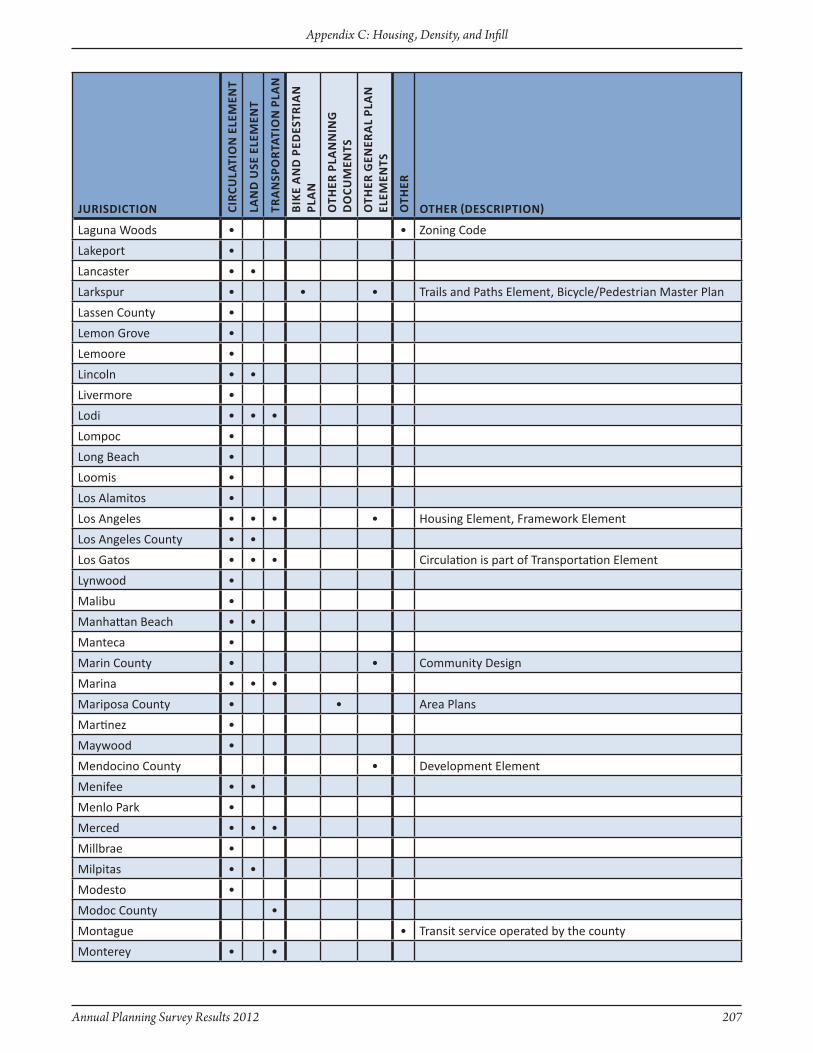
Annual Planning Survey Results 2012 207
Appendix C: Housing, Density, and Infill
JuRisdictiOn ciR
culA
tiO
n e
leM
ent
lAn
d u
se e
leM
ent
tRA
nsP
OR
tAti
On
PlA
n
Bik
e A
nd
Ped
estR
iAn
Pl
An
Oth
eR P
lAn
nin
G
dO
cuM
ents
Oth
eR G
eneR
Al
PlA
n
eleM
ents
Oth
eR
OtheR (descRiPtiOn)
Laguna Woods • • zoning Code
Lakeport •
Lancaster • •
Larkspur • • • Trails and Paths Element, Bicycle/Pedestrian Master Plan
Lassen County •
Lemon Grove •
Lemoore •
Lincoln • •
Livermore •
Lodi • • •
Lompoc •
Long Beach •
Loomis •
Los Alamitos •
Los Angeles • • • • Housing Element, Framework Element
Los Angeles County • •
Los Gatos • • • Circulation is part of Transportation Element
Lynwood •
Malibu •
Manhattan Beach • •
Manteca •
Marin County • • Community Design
Marina • • •
Mariposa County • • Area Plans
Martinez •
Maywood •
Mendocino County • Development Element
Menifee • •
Menlo Park •
Merced • • •
Millbrae •
Milpitas • •
Modesto •
Modoc County •
Montague • Transit service operated by the county
Monterey • •
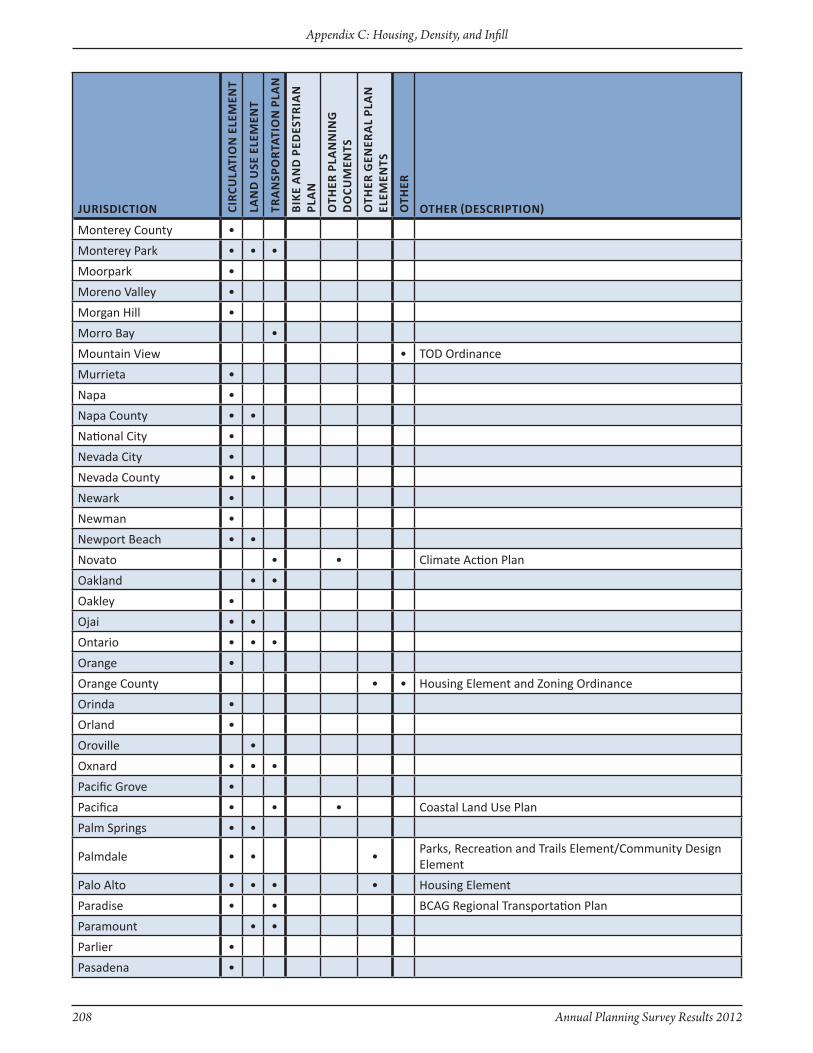
208 Annual Planning Survey Results 2012
Appendix C: Housing, Density, and Infill
JuRisdictiOn ciR
culA
tiO
n e
leM
ent
lAn
d u
se e
leM
ent
tRA
nsP
OR
tAti
On
PlA
n
Bik
e A
nd
Ped
estR
iAn
Pl
An
Oth
eR P
lAn
nin
G
dO
cuM
ents
Oth
eR G
eneR
Al
PlA
n
eleM
ents
Oth
eR
OtheR (descRiPtiOn)
Monterey County •
Monterey Park • • •
Moorpark •
Moreno Valley •
Morgan Hill •
Morro Bay •
Mountain View • TOD Ordinance
Murrieta •
Napa •
Napa County • •
National City •
Nevada City •
Nevada County • •
Newark •
Newman •
Newport Beach • •
Novato • • Climate Action Plan
Oakland • •
Oakley •
Ojai • •
Ontario • • •
Orange •
Orange County • • Housing Element and zoning Ordinance
Orinda •
Orland •
Oroville •
Oxnard • • •
Pacific Grove •
Pacifica • • • Coastal Land Use Plan
Palm Springs • •
Palmdale • • •Parks, Recreation and Trails Element/Community Design Element
Palo Alto • • • • Housing Element
Paradise • • BCAG Regional Transportation Plan
Paramount • •
Parlier •
Pasadena •
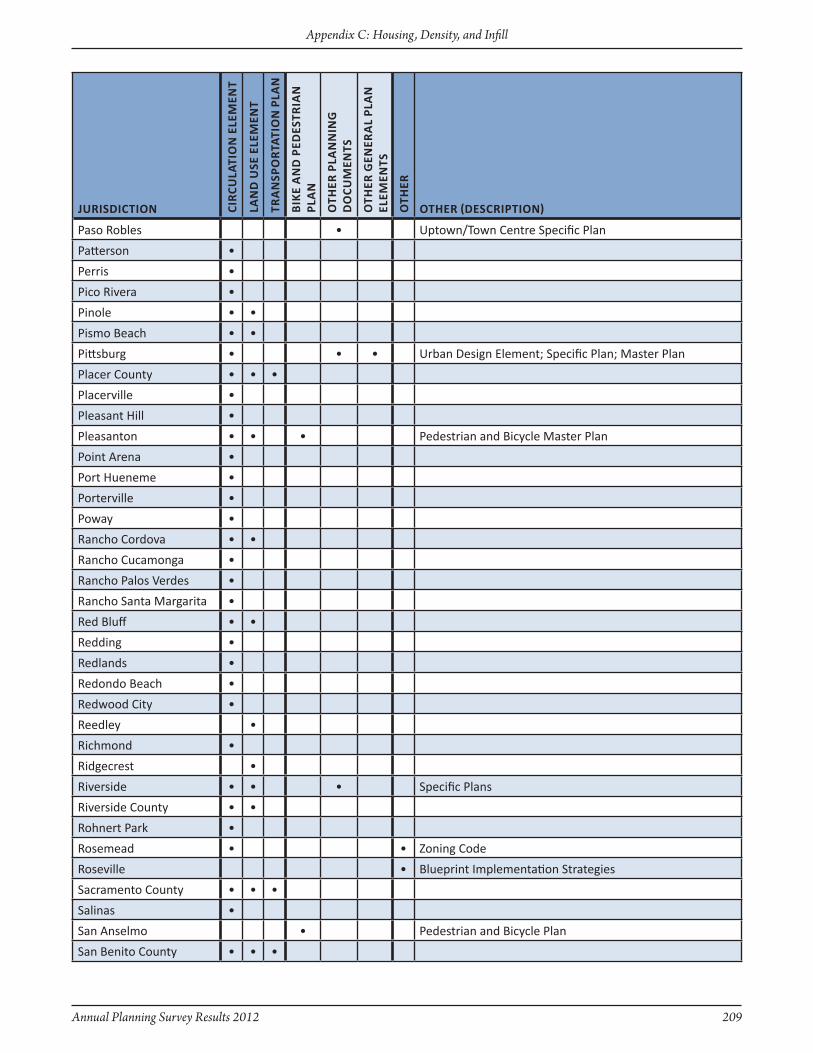
Annual Planning Survey Results 2012 209
Appendix C: Housing, Density, and Infill
JuRisdictiOn ciR
culA
tiO
n e
leM
ent
lAn
d u
se e
leM
ent
tRA
nsP
OR
tAti
On
PlA
n
Bik
e A
nd
Ped
estR
iAn
Pl
An
Oth
eR P
lAn
nin
G
dO
cuM
ents
Oth
eR G
eneR
Al
PlA
n
eleM
ents
Oth
eR
OtheR (descRiPtiOn)
Paso Robles • Uptown/Town Centre Specific Plan
Patterson •
Perris •
Pico Rivera •
Pinole • •
Pismo Beach • •
Pittsburg • • • Urban Design Element; Specific Plan; Master Plan
Placer County • • •
Placerville •
Pleasant Hill •
Pleasanton • • • Pedestrian and Bicycle Master Plan
Point Arena •
Port Hueneme •
Porterville •
Poway •
Rancho Cordova • •
Rancho Cucamonga •
Rancho Palos Verdes •
Rancho Santa Margarita •
Red Bluff • •
Redding •
Redlands •
Redondo Beach •
Redwood City •
Reedley •
Richmond •
Ridgecrest •
Riverside • • • Specific Plans
Riverside County • •
Rohnert Park •
Rosemead • • zoning Code
Roseville • Blueprint Implementation Strategies
Sacramento County • • •
Salinas •
San Anselmo • Pedestrian and Bicycle Plan
San Benito County • • •
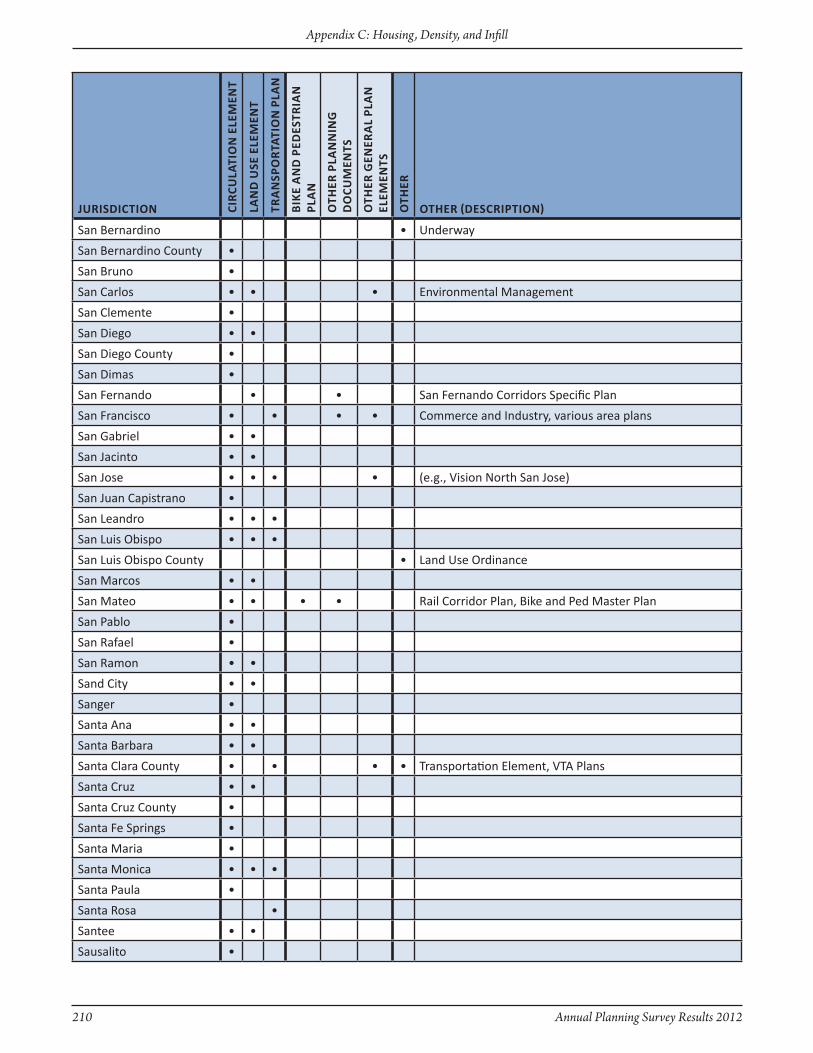
210 Annual Planning Survey Results 2012
Appendix C: Housing, Density, and Infill
JuRisdictiOn ciR
culA
tiO
n e
leM
ent
lAn
d u
se e
leM
ent
tRA
nsP
OR
tAti
On
PlA
n
Bik
e A
nd
Ped
estR
iAn
Pl
An
Oth
eR P
lAn
nin
G
dO
cuM
ents
Oth
eR G
eneR
Al
PlA
n
eleM
ents
Oth
eR
OtheR (descRiPtiOn)
San Bernardino • Underway
San Bernardino County •
San Bruno •
San Carlos • • • Environmental Management
San Clemente •
San Diego • •
San Diego County •
San Dimas •
San Fernando • • San Fernando Corridors Specific Plan
San Francisco • • • • Commerce and Industry, various area plans
San Gabriel • •
San Jacinto • •
San Jose • • • • (e.g., Vision North San Jose)
San Juan Capistrano •
San Leandro • • •
San Luis Obispo • • •
San Luis Obispo County • Land Use Ordinance
San Marcos • •
San Mateo • • • • Rail Corridor Plan, Bike and Ped Master Plan
San Pablo •
San Rafael •
San Ramon • •
Sand City • •
Sanger •
Santa Ana • •
Santa Barbara • •
Santa Clara County • • • • Transportation Element, VTA Plans
Santa Cruz • •
Santa Cruz County •
Santa Fe Springs •
Santa Maria •
Santa Monica • • •
Santa Paula •
Santa Rosa •
Santee • •
Sausalito •
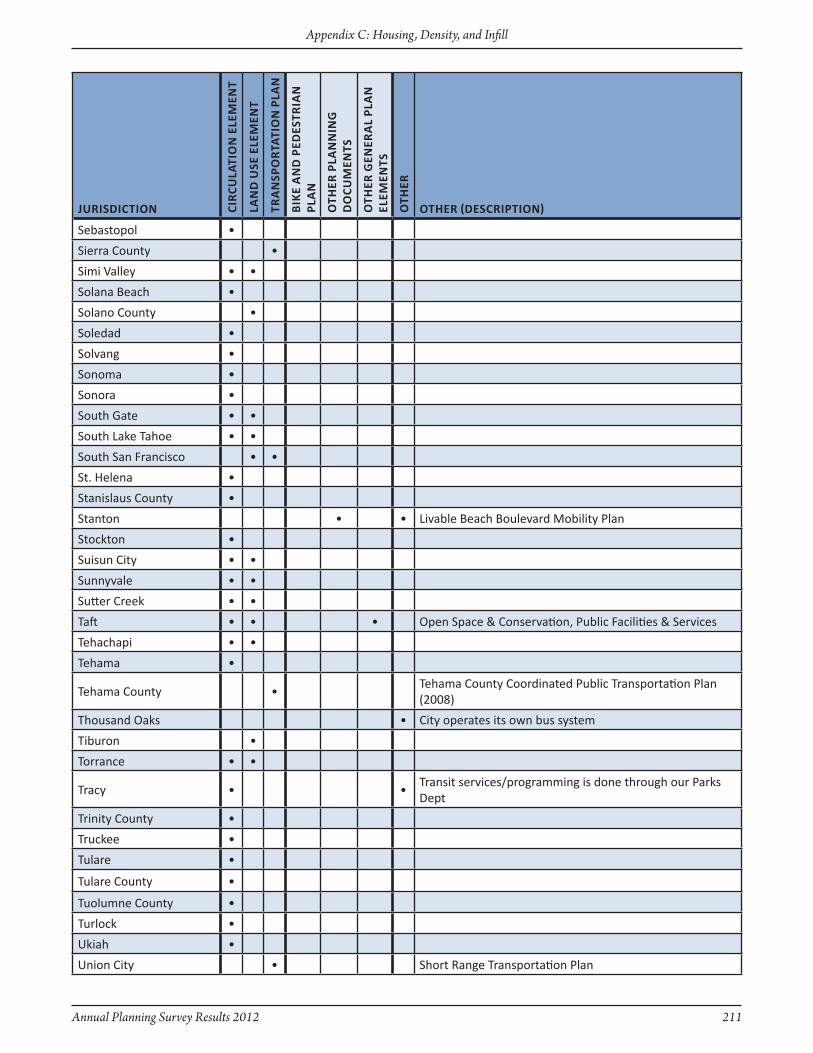
Annual Planning Survey Results 2012 211
Appendix C: Housing, Density, and Infill
JuRisdictiOn ciR
culA
tiO
n e
leM
ent
lAn
d u
se e
leM
ent
tRA
nsP
OR
tAti
On
PlA
n
Bik
e A
nd
Ped
estR
iAn
Pl
An
Oth
eR P
lAn
nin
G
dO
cuM
ents
Oth
eR G
eneR
Al
PlA
n
eleM
ents
Oth
eR
OtheR (descRiPtiOn)
Sebastopol •
Sierra County •
Simi Valley • •
Solana Beach •
Solano County •
Soledad •
Solvang •
Sonoma •
Sonora •
South Gate • •
South Lake Tahoe • •
South San Francisco • •
St. Helena •
Stanislaus County •
Stanton • • Livable Beach Boulevard Mobility Plan
Stockton •
Suisun City • •
Sunnyvale • •
Sutter Creek • •
Taft • • • Open Space & Conservation, Public Facilities & Services
Tehachapi • •
Tehama •
Tehama County •Tehama County Coordinated Public Transportation Plan (2008)
Thousand Oaks • City operates its own bus system
Tiburon •
Torrance • •
Tracy • •Transit services/programming is done through our Parks Dept
Trinity County •
Truckee •
Tulare •
Tulare County •
Tuolumne County •
Turlock •
Ukiah •
Union City • Short Range Transportation Plan
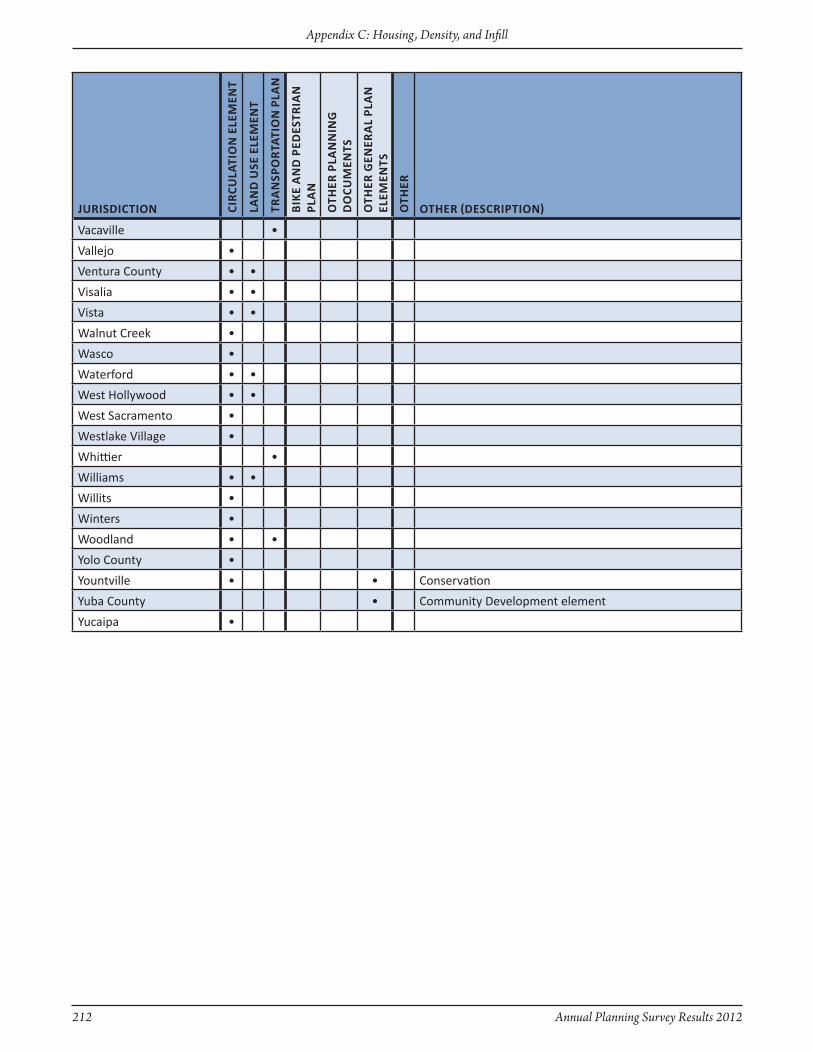
212 Annual Planning Survey Results 2012
Appendix C: Housing, Density, and Infill
JuRisdictiOn ciR
culA
tiO
n e
leM
ent
lAn
d u
se e
leM
ent
tRA
nsP
OR
tAti
On
PlA
n
Bik
e A
nd
Ped
estR
iAn
Pl
An
Oth
eR P
lAn
nin
G
dO
cuM
ents
Oth
eR G
eneR
Al
PlA
n
eleM
ents
Oth
eR
OtheR (descRiPtiOn)
Vacaville •
Vallejo •
Ventura County • •
Visalia • •
Vista • •
Walnut Creek •
Wasco •
Waterford • •
West Hollywood • •
West Sacramento •
Westlake Village •
Whittier •
Williams • •
Willits •
Winters •
Woodland • •
Yolo County •
Yountville • • Conservation
Yuba County • Community Development element
Yucaipa •

Annual Planning Survey Results 2012 213
Appendix C: Housing, Density, and Infill
AdelantoAlbanyAntiochArcadiaArroyo GrandeBeaumontBeniciaBlue LakeBrisbaneCapitolaChicoChula VistaCitrus HeightsClaremontContra Costa CountyCoronadoCulver CityCupertinoDana PointDavisDesert Hot SpringsDuarteDublinEl CentroEl CerritoEl MonteEmeryvilleFoster CityFremontFresnoGlendaleGoletaGonzalesGuadalupeHanfordHaywardHermosa Beach
HillsboroughHollisterHuntington BeachIrvineLa Cañada FlintridgeLompocLong BeachLos AlamitosManhattan BeachMarin CountyMarysvilleMaywoodMendocino CountyMenlo ParkMill ValleyMonterey ParkMoorparkNapaNapa CountyNovatoOakdaleOaklandOntarioOxnardPalm DesertPalm SpringsPalo AltoParadisePasadenaPerrisPlacer CountyPlacervillePortervillePortola ValleyRancho CordovaRancho MirageRed Bluff
RichmondRidgecrestRiversideRiverside CountyRosemeadSacramento CountySan AnselmoSan BernardinoSan ClementeSan DiegoSan Diego CountySan FranciscoSan JoaquinSan JoseSan LeandroSan RafaelSan RamonSanta BarbaraSanta Clara CountySanta ClaritaSanta CruzSanta MonicaSanta RosaSanteeSausalitoSimi ValleySolana BeachSouth Lake TahoeSouth San FranciscoSunnyvaleSutter CreekTiburonTorranceTracyUnion CityWindsor*
* The City of Windsor has a half-time employee dedicated to sustainability
17. Do you have staff dedicated to sustainability?
The following is a list of jurisdictions that have staff dedicated to sustainability.

214 Annual Planning Survey Results 2012
Appendix C: Housing, Density, and Infill
JuRisdictiOn den
sity
b
on
uSe
S
fin
an
Cia
l in
cen
tiv
es
Oth
eR
OtheR (descRiPtiOn)
Adelanto •
Agoura Hills •
Alameda County •
Albany •
Alhambra •
Anaheim • Minimum Acreage Standards to encourage consolidation
Anderson •
Angels Camp •
Arroyo Grande •
Artesia •
Atascadero •
Avalon •
Avenal •
Azusa •
Bakersfield • • Redevelopment
Baldwin Park •
Banning •
Barstow •
Beaumont •
Bell Gardens •
Bellflower • •
Benicia •
Beverly Hills • • Increased unit density
Brawley •
Brea • Reduced development standards
Brentwood •
Brisbane •
Buellton •
Buena Park •
Burbank •
Burlingame •
Calabasas •
Calaveras County •
Camarillo • •
Campbell •
Carlsbad • •
Carpinteria • • Expedited Processing
18. Have programs such as density bonuses or financial incentives been adopted to encouragelot consolidation of smaller infill parcels?
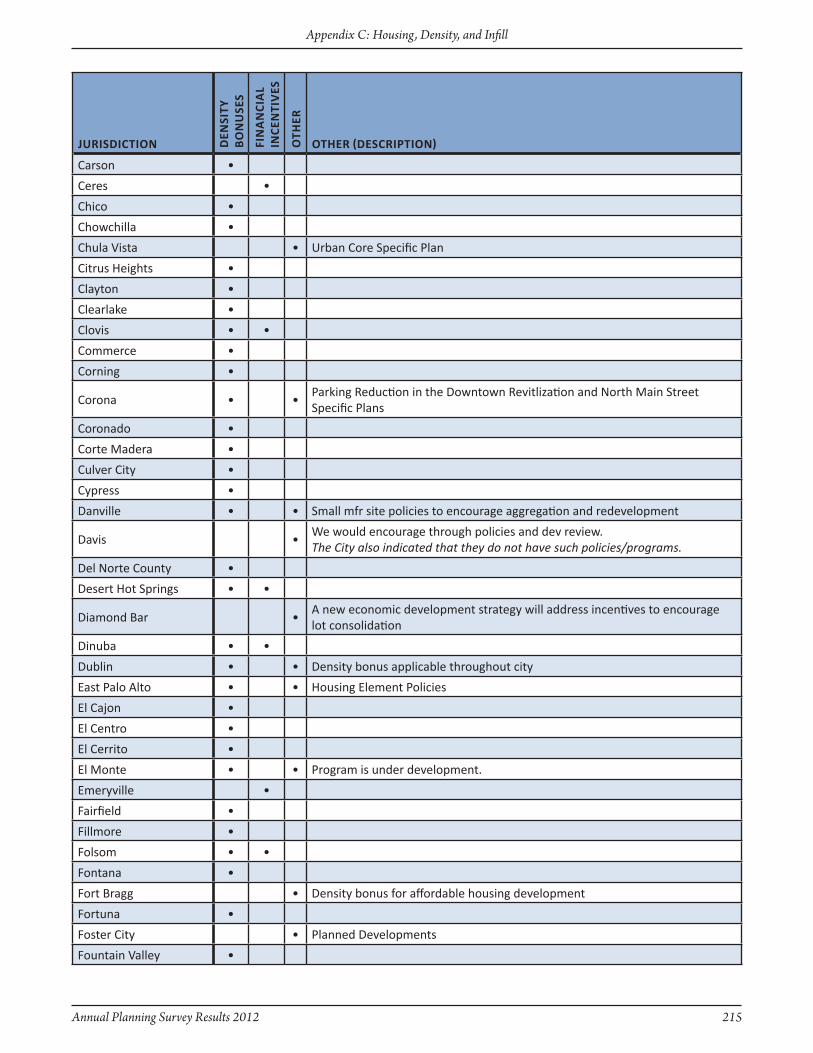
Annual Planning Survey Results 2012 215
Appendix C: Housing, Density, and Infill
JuRisdictiOn den
sity
b
on
uSe
S
fin
an
Cia
l in
cen
tiv
es
Oth
eR
OtheR (descRiPtiOn)
Carson •
Ceres •
Chico •
Chowchilla •
Chula Vista • Urban Core Specific Plan
Citrus Heights •
Clayton •
Clearlake •
Clovis • •
Commerce •
Corning •
Corona • •Parking Reduction in the Downtown Revitlization and North Main Street Specific Plans
Coronado •
Corte Madera •
Culver City •
Cypress •
Danville • • Small mfr site policies to encourage aggregation and redevelopment
Davis •We would encourage through policies and dev review.The City also indicated that they do not have such policies/programs.
Del Norte County •
Desert Hot Springs • •
Diamond Bar •A new economic development strategy will address incentives to encourage lot consolidation
Dinuba • •
Dublin • • Density bonus applicable throughout city
East Palo Alto • • Housing Element Policies
El Cajon •
El Centro •
El Cerrito •
El Monte • • Program is under development.
Emeryville •
Fairfield •
Fillmore •
Folsom • •
Fontana •
Fort Bragg • Density bonus for affordable housing development
Fortuna •
Foster City • Planned Developments
Fountain Valley •

216 Annual Planning Survey Results 2012
Appendix C: Housing, Density, and Infill
JuRisdictiOn den
sity
b
on
uSe
S
fin
an
Cia
l in
cen
tiv
es
Oth
eR
OtheR (descRiPtiOn)
Fremont •
Garden Grove •
Glendale •
Glendora •
Glenn County •
Goleta •
Gonzales •
Grand Terrace • • Development Incentives
Grover Beach • Not for lot consolidation, but for Affordable Housing
Guadalupe • • General support for this expressed in Land Use Element and Housing Element
Gustine •
Hanford •
Hawaiian Gardens •
Hemet •
Hesperia •
Highland •
Hillsborough •
Hollister • • Growth Management Program
Holtville •
Hughson •
Humboldt County •
Huntington Beach •
Inyo County •
Irwindale •
Kern County •
La Mesa •
La Mirada •
La Palma •
La Puente • •
Laguna Niguel •
Lake County •
Lakeport • • Set forth in General Plan (Land Use and Housing Elements)
Lakewood •
Lassen County •
Lawndale •
Lemon Grove • • Redevelopment areas
Lincoln •
Livermore •
Livingston •
Lomita •
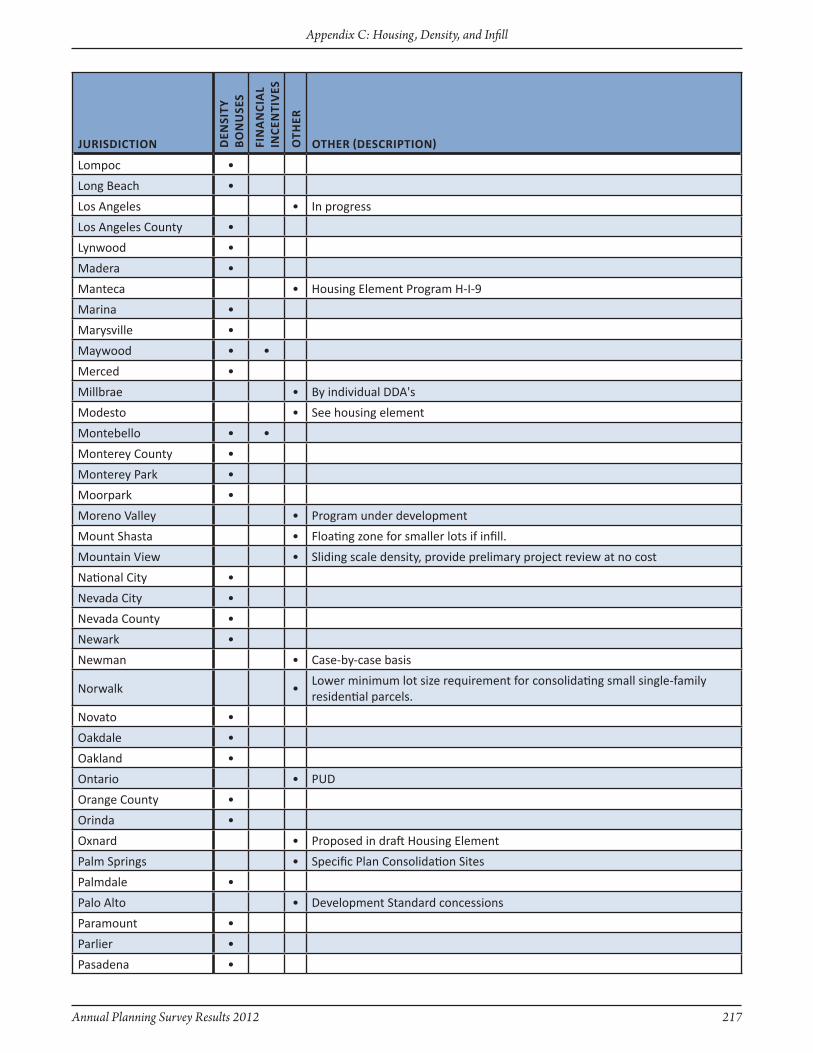
Annual Planning Survey Results 2012 217
Appendix C: Housing, Density, and Infill
JuRisdictiOn den
sity
b
on
uSe
S
fin
an
Cia
l in
cen
tiv
es
Oth
eR
OtheR (descRiPtiOn)
Lompoc •
Long Beach •
Los Angeles • In progress
Los Angeles County •
Lynwood •
Madera •
Manteca • Housing Element Program H-I-9
Marina •
Marysville •
Maywood • •
Merced •
Millbrae • By individual DDA's
Modesto • See housing element
Montebello • •
Monterey County •
Monterey Park •
Moorpark •
Moreno Valley • Program under development
Mount Shasta • Floating zone for smaller lots if infill.
Mountain View • Sliding scale density, provide prelimary project review at no cost
National City •
Nevada City •
Nevada County •
Newark •
Newman • Case-by-case basis
Norwalk •Lower minimum lot size requirement for consolidating small single-family residential parcels.
Novato •
Oakdale •
Oakland •
Ontario • PUD
Orange County •
Orinda •
Oxnard • Proposed in draft Housing Element
Palm Springs • Specific Plan Consolidation Sites
Palmdale •
Palo Alto • Development Standard concessions
Paramount •
Parlier •
Pasadena •
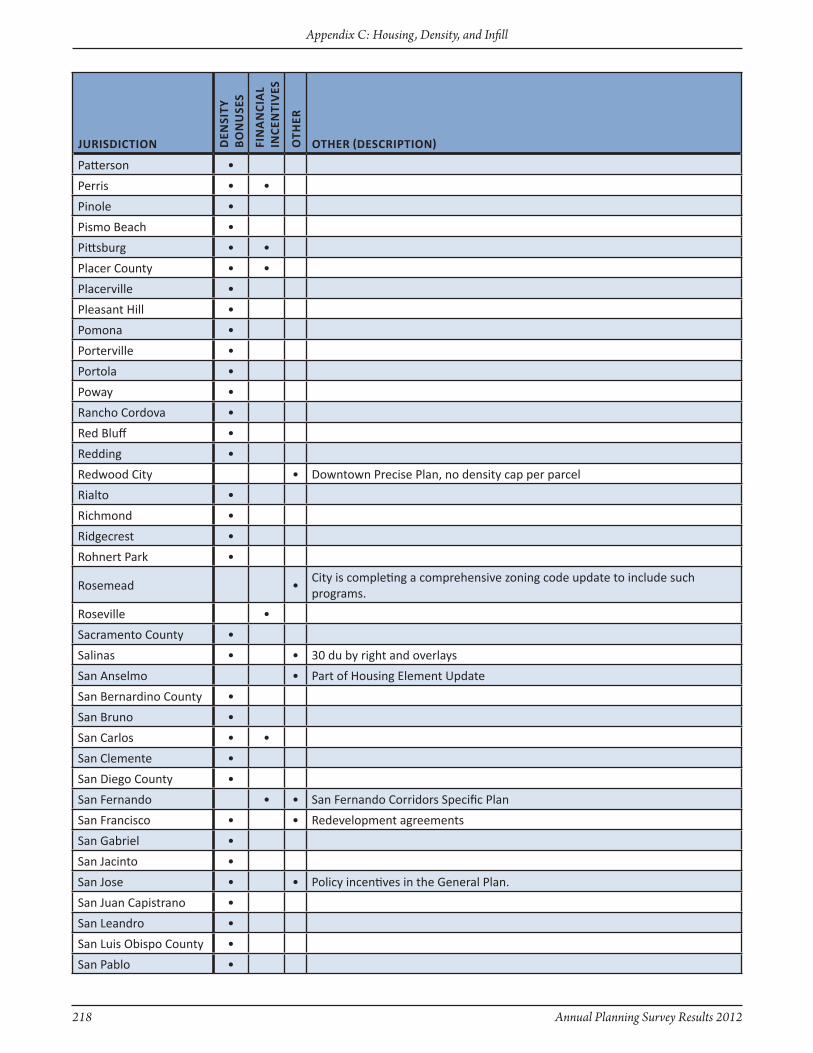
218 Annual Planning Survey Results 2012
Appendix C: Housing, Density, and Infill
JuRisdictiOn den
sity
b
on
uSe
S
fin
an
Cia
l in
cen
tiv
es
Oth
eR
OtheR (descRiPtiOn)
Patterson •
Perris • •
Pinole •
Pismo Beach •
Pittsburg • •
Placer County • •
Placerville •
Pleasant Hill •
Pomona •
Porterville •
Portola •
Poway •
Rancho Cordova •
Red Bluff •
Redding •
Redwood City • Downtown Precise Plan, no density cap per parcel
Rialto •
Richmond •
Ridgecrest •
Rohnert Park •
Rosemead •City is completing a comprehensive zoning code update to include such programs.
Roseville •
Sacramento County •
Salinas • • 30 du by right and overlays
San Anselmo • Part of Housing Element Update
San Bernardino County •
San Bruno •
San Carlos • •
San Clemente •
San Diego County •
San Fernando • • San Fernando Corridors Specific Plan
San Francisco • • Redevelopment agreements
San Gabriel •
San Jacinto •
San Jose • • Policy incentives in the General Plan.
San Juan Capistrano •
San Leandro •
San Luis Obispo County •
San Pablo •
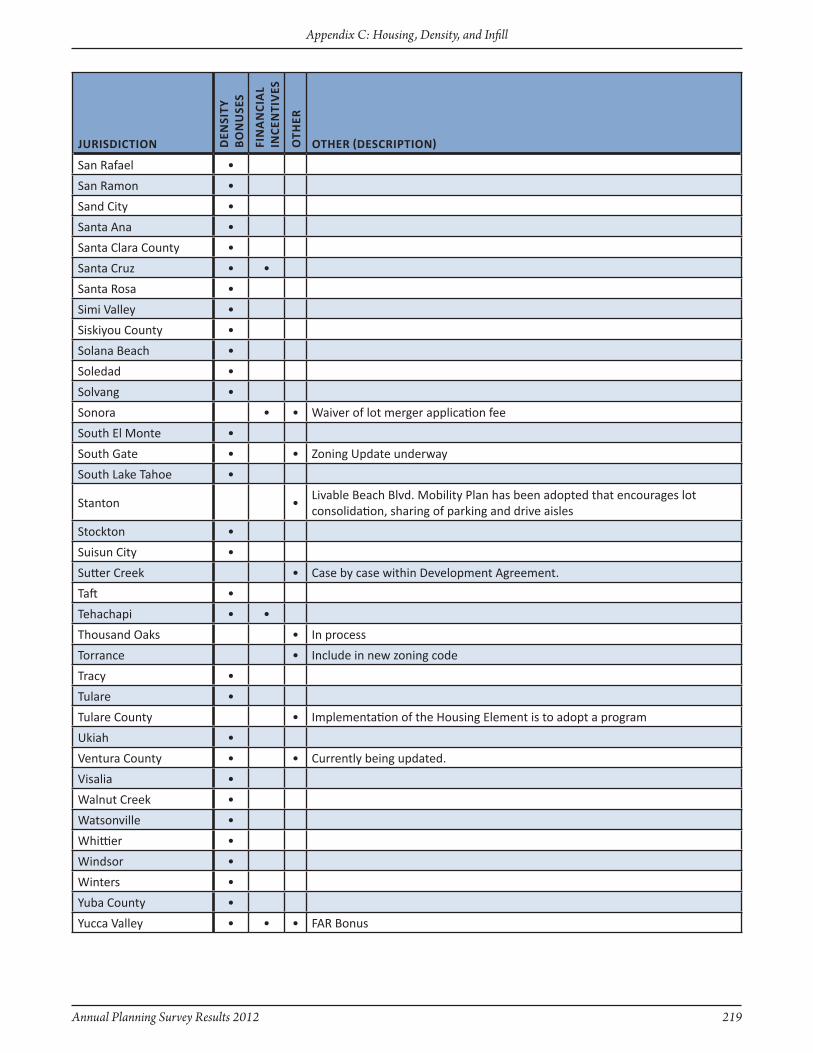
Annual Planning Survey Results 2012 219
Appendix C: Housing, Density, and Infill
JuRisdictiOn den
sity
b
on
uSe
S
fin
an
Cia
l in
cen
tiv
es
Oth
eR
OtheR (descRiPtiOn)
San Rafael •
San Ramon •
Sand City •
Santa Ana •
Santa Clara County •
Santa Cruz • •
Santa Rosa •
Simi Valley •
Siskiyou County •
Solana Beach •
Soledad •
Solvang •
Sonora • • Waiver of lot merger application fee
South El Monte •
South Gate • • zoning Update underway
South Lake Tahoe •
Stanton •Livable Beach Blvd. Mobility Plan has been adopted that encourages lot consolidation, sharing of parking and drive aisles
Stockton •
Suisun City •
Sutter Creek • Case by case within Development Agreement.
Taft •
Tehachapi • •
Thousand Oaks • In process
Torrance • Include in new zoning code
Tracy •
Tulare •
Tulare County • Implementation of the Housing Element is to adopt a program
Ukiah •
Ventura County • • Currently being updated.
Visalia •
Walnut Creek •
Watsonville •
Whittier •
Windsor •
Winters •
Yuba County •
Yucca Valley • • • FAR Bonus
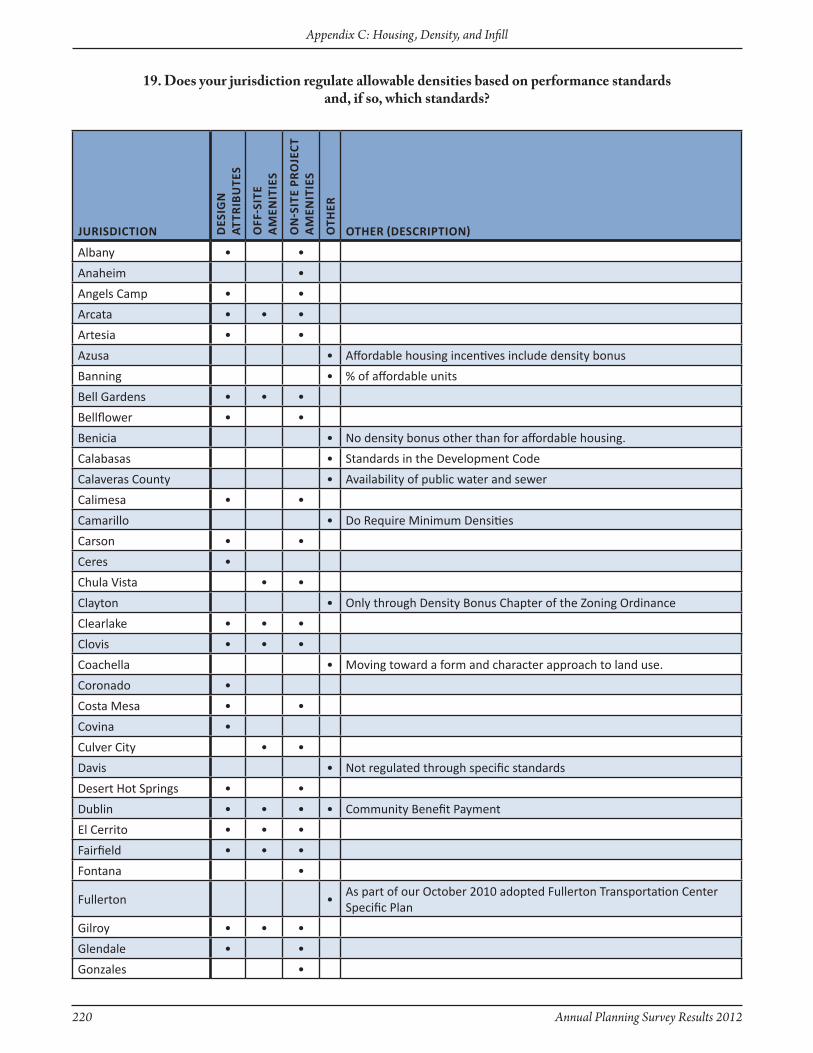
220 Annual Planning Survey Results 2012
Appendix C: Housing, Density, and Infill
JuRisdictiOn des
iGn
At
tRiB
ute
s
Off
-sit
e A
Men
itie
s
On
-sit
e PR
OJe
ct
AM
enit
ies
Oth
eR
OtheR (descRiPtiOn)
Albany • •
Anaheim •
Angels Camp • •
Arcata • • •
Artesia • •
Azusa • Affordable housing incentives include density bonus
Banning • % of affordable units
Bell Gardens • • •
Bellflower • •
Benicia • No density bonus other than for affordable housing.
Calabasas • Standards in the Development Code
Calaveras County • Availability of public water and sewer
Calimesa • •
Camarillo • Do Require Minimum Densities
Carson • •
Ceres •
Chula Vista • •
Clayton • Only through Density Bonus Chapter of the zoning Ordinance
Clearlake • • •
Clovis • • •
Coachella • Moving toward a form and character approach to land use.
Coronado •
Costa Mesa • •
Covina •
Culver City • •
Davis • Not regulated through specific standards
Desert Hot Springs • •
Dublin • • • • Community Benefit Payment
El Cerrito • • •
Fairfield • • •
Fontana •
Fullerton •As part of our October 2010 adopted Fullerton Transportation Center Specific Plan
Gilroy • • •
Glendale • •
Gonzales •
19. Does your jurisdiction regulate allowable densities based on performance standardsand, if so, which standards?

Annual Planning Survey Results 2012 221
Appendix C: Housing, Density, and Infill
JuRisdictiOn des
iGn
At
tRiB
ute
s
Off
-sit
e A
Men
itie
s
On
-sit
e PR
OJe
ct
AM
enit
ies
Oth
eR
OtheR (descRiPtiOn)
Gustine • • •
Hanford •
Hemet • •
Hercules •
Hesperia •
Highland •
Hollister •R1-L/Pz: Single Family Residential Performance Overlay zone, H/Pz: High Density Performance Overlay zone
Hughson • •
Humboldt County • • •
Irwindale • Housing affordability
Jackson •
Kerman • •
La Mesa • •
Laguna Niguel • • • Affordable housing
Larkspur • Height and parking
Lemon Grove • • Minimum densities
Lemoore • We have minimum density requirements
Livermore •
Livingston • No developer has used the density bonus program
Los Angeles • • In progress
Los Angeles County • • •
Los Gatos • •
Madera • We have minimum density requirements as well as maximums
Maywood • •
Monterey • •
Monterey Park • • •
Mount Shasta •
Mountain View • Form-based performance standards
Napa •
Napa County • Minimum lot size/acreages
National City • •
Nevada City • • •
Novato •
Oakdale •
Oakland • •
Oceanside • • •
Oroville •

222 Annual Planning Survey Results 2012
Appendix C: Housing, Density, and Infill
JuRisdictiOn des
iGn
At
tRiB
ute
s
Off
-sit
e A
Men
itie
s
On
-sit
e PR
OJe
ct
AM
enit
ies
Oth
eR
OtheR (descRiPtiOn)
Oxnard • • •
Palm Springs • • • • Hillside grading
Palo Alto • "Public Benefit"
Paradise • •
Paramount • •
Parlier •
Pasadena • •
Paso Robles • • Uptown/Town Centre Specific Plan
Perris • •
Pinole • • •
Pittsburg • •
Placer County • • •
Placerville •
Pleasanton • •
Porterville • •
Rancho Cordova • •
Red Bluff • •
Riverside • •
Rohnert Park •
Rosemead •
Sacramento County • •
San Bernardino •
San Bernardino County • • •
San Fernando • Specific Plan
San Francisco • Height and bulk
San Jacinto • • •
San Jose •Not directly, however, residential developments are required to provide onsite and offsite amenities that may affect the density of the project.
San Juan Capistrano • • •
San Luis Obispo • • Density bonus for affordable housing
San Luis Obispo County •Provision of Community Water and Sewer; Type of Road; Distance from CBD
San Pablo •
San Ramon • • •
Sanger • • •
Santa Ana •
Santa Barbara • • Lot area, parking, open space
Santa Monica • • •
Sausalito •
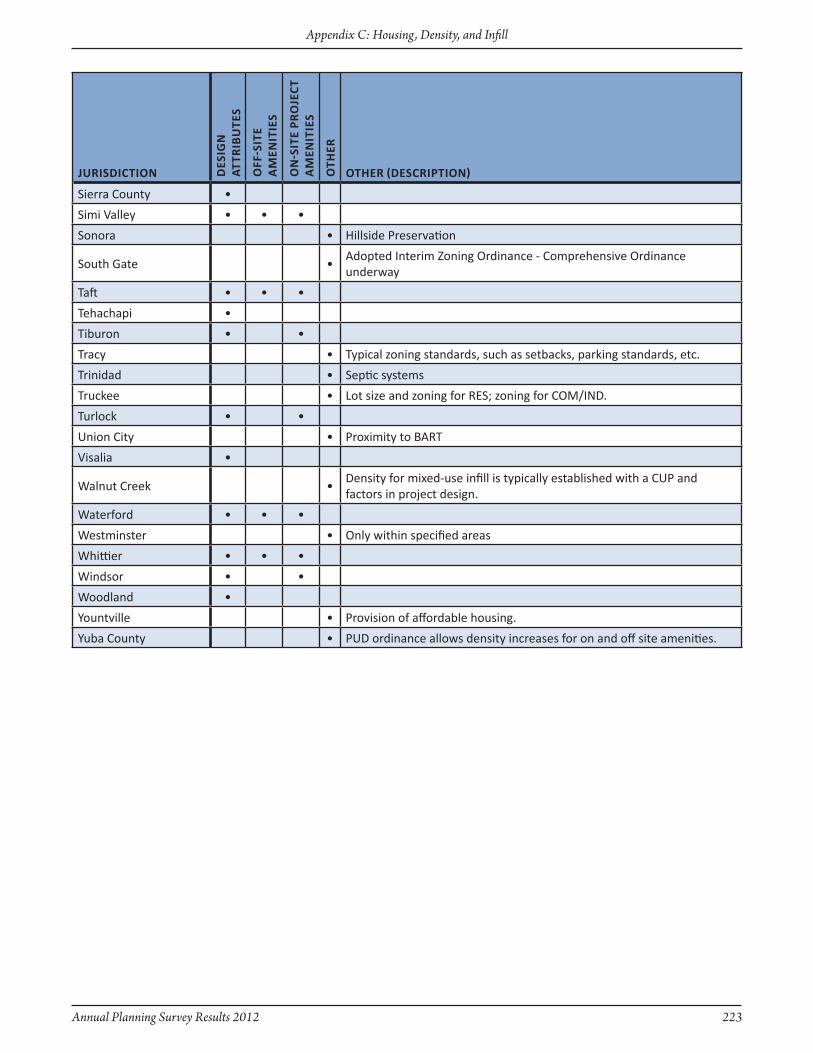
Annual Planning Survey Results 2012 223
Appendix C: Housing, Density, and Infill
JuRisdictiOn des
iGn
At
tRiB
ute
s
Off
-sit
e A
Men
itie
s
On
-sit
e PR
OJe
ct
AM
enit
ies
Oth
eR
OtheR (descRiPtiOn)
Sierra County •
Simi Valley • • •
Sonora • Hillside Preservation
South Gate •Adopted Interim zoning Ordinance - Comprehensive Ordinance underway
Taft • • •
Tehachapi •
Tiburon • •
Tracy • Typical zoning standards, such as setbacks, parking standards, etc.
Trinidad • Septic systems
Truckee • Lot size and zoning for RES; zoning for COM/IND.
Turlock • •
Union City • Proximity to BART
Visalia •
Walnut Creek •Density for mixed-use infill is typically established with a CUP and factors in project design.
Waterford • • •
Westminster • Only within specified areas
Whittier • • •
Windsor • •
Woodland •
Yountville • Provision of affordable housing.
Yuba County • PUD ordinance allows density increases for on and off site amenities.

224 Annual Planning Survey Results 2012
Appendix C: Housing, Density, and Infill
JuRisdictiOn Mu
lti-
fAM
ily
sin
Gle
-fA
Mil
y
secO
nd
un
its
Oth
eR
OtheR (desRiPtiOn)
Agoura Hills •
Albany •Admin design review is required for additions 240 sq. ft. or less. Commission Design Review is required for additions larger than 240 sq. ft., second story additions, and new residential construction.
Alpine County •
American Canyon •
Anderson •
Angels Camp • •
Arcadia • •
Arcata •
Arroyo Grande •
Artesia •
Arvin •
Atascadero • • Specific Plans/PUDs go to Design Review
Atherton •
Azusa • • • Duplex development
Bakersfield •
Baldwin Park • •
Barstow • • Multi-family dependent upon Redevelopment Area.
Beaumont •
Bell • •
Benicia • Only single family development that is "outside" the historic district.
Big Bear Lake •
Biggs • Individual SFR units only (not subdivision level)
Bishop •
Blue Lake •
Brawley •
Brea • •
Brentwood •
Brisbane •
Buellton • Have not developed procedure
Buena Park •
Burlingame • Design Review is discretionary in all zones.
Calabasas •
California City •
Calimesa •
20. Have you developed a non-discretionary design review procedure forresidential development and, if so, for which type?
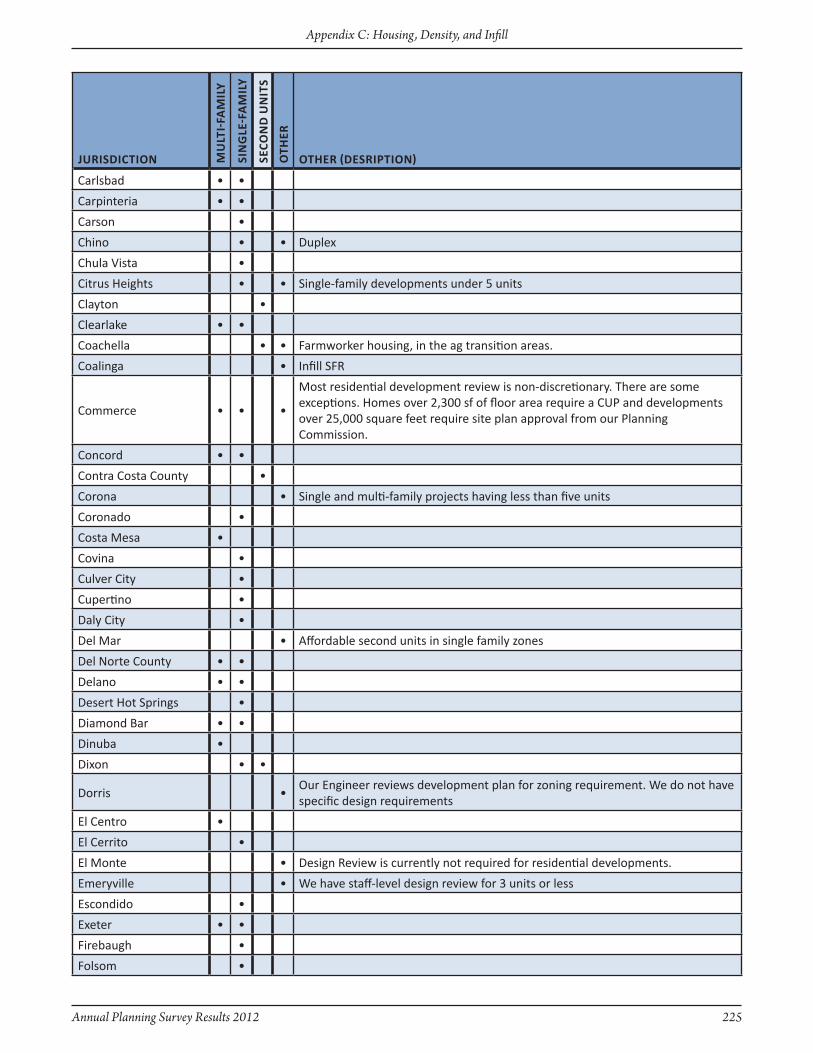
Annual Planning Survey Results 2012 225
Appendix C: Housing, Density, and Infill
JuRisdictiOn Mu
lti-
fAM
ily
sin
Gle
-fA
Mil
y
secO
nd
un
its
Oth
eR
OtheR (desRiPtiOn)
Carlsbad • •
Carpinteria • •
Carson •
Chino • • Duplex
Chula Vista •
Citrus Heights • • Single-family developments under 5 units
Clayton •
Clearlake • •
Coachella • • Farmworker housing, in the ag transition areas.
Coalinga • Infill SFR
Commerce • • •
Most residential development review is non-discretionary. There are some exceptions. Homes over 2,300 sf of floor area require a CUP and developments over 25,000 square feet require site plan approval from our Planning Commission.
Concord • •
Contra Costa County •
Corona • Single and multi-family projects having less than five units
Coronado •
Costa Mesa •
Covina •
Culver City •
Cupertino •
Daly City •
Del Mar • Affordable second units in single family zones
Del Norte County • •
Delano • •
Desert Hot Springs •
Diamond Bar • •
Dinuba •
Dixon • •
Dorris •Our Engineer reviews development plan for zoning requirement. We do not have specific design requirements
El Centro •
El Cerrito •
El Monte • Design Review is currently not required for residential developments.
Emeryville • We have staff-level design review for 3 units or less
Escondido •
Exeter • •
Firebaugh •
Folsom •
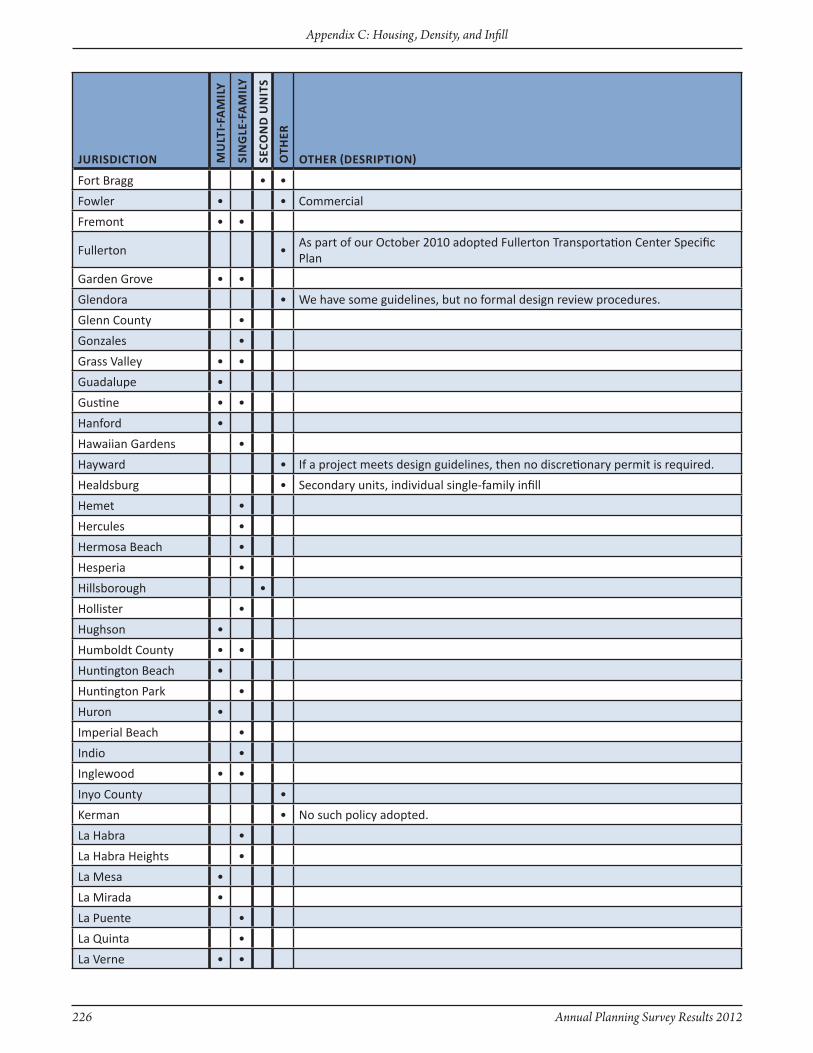
226 Annual Planning Survey Results 2012
Appendix C: Housing, Density, and Infill
JuRisdictiOn Mu
lti-
fAM
ily
sin
Gle
-fA
Mil
y
secO
nd
un
its
Oth
eR
OtheR (desRiPtiOn)
Fort Bragg • •
Fowler • • Commercial
Fremont • •
Fullerton •As part of our October 2010 adopted Fullerton Transportation Center Specific Plan
Garden Grove • •
Glendora • We have some guidelines, but no formal design review procedures.
Glenn County •
Gonzales •
Grass Valley • •
Guadalupe •
Gustine • •
Hanford •
Hawaiian Gardens •
Hayward • If a project meets design guidelines, then no discretionary permit is required.
Healdsburg • Secondary units, individual single-family infill
Hemet •
Hercules •
Hermosa Beach •
Hesperia •
Hillsborough •
Hollister •
Hughson •
Humboldt County • •
Huntington Beach •
Huntington Park •
Huron •
Imperial Beach •
Indio •
Inglewood • •
Inyo County •
Kerman • No such policy adopted.
La Habra •
La Habra Heights •
La Mesa •
La Mirada •
La Puente •
La Quinta •
La Verne • •
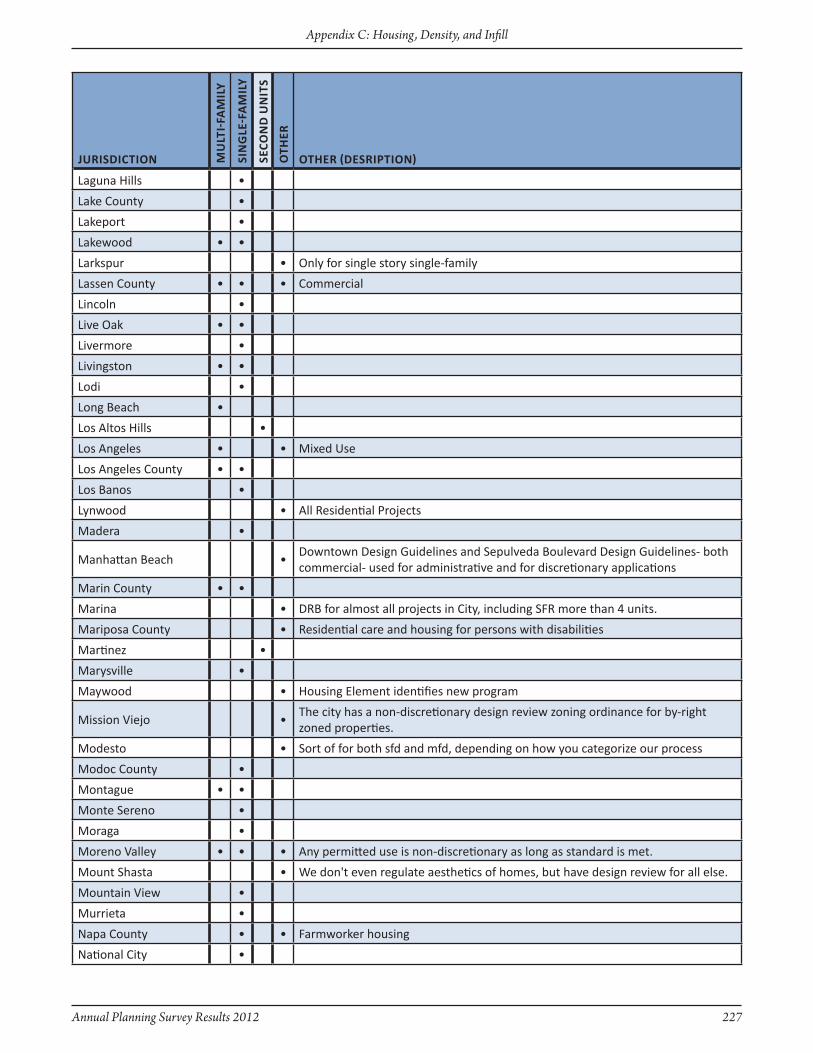
Annual Planning Survey Results 2012 227
Appendix C: Housing, Density, and Infill
JuRisdictiOn Mu
lti-
fAM
ily
sin
Gle
-fA
Mil
y
secO
nd
un
its
Oth
eR
OtheR (desRiPtiOn)
Laguna Hills •
Lake County •
Lakeport •
Lakewood • •
Larkspur • Only for single story single-family
Lassen County • • • Commercial
Lincoln •
Live Oak • •
Livermore •
Livingston • •
Lodi •
Long Beach •
Los Altos Hills •
Los Angeles • • Mixed Use
Los Angeles County • •
Los Banos •
Lynwood • All Residential Projects
Madera •
Manhattan Beach •Downtown Design Guidelines and Sepulveda Boulevard Design Guidelines- both commercial- used for administrative and for discretionary applications
Marin County • •
Marina • DRB for almost all projects in City, including SFR more than 4 units.
Mariposa County • Residential care and housing for persons with disabilities
Martinez •
Marysville •
Maywood • Housing Element identifies new program
Mission Viejo •The city has a non-discretionary design review zoning ordinance for by-right zoned properties.
Modesto • Sort of for both sfd and mfd, depending on how you categorize our process
Modoc County •
Montague • •
Monte Sereno •
Moraga •
Moreno Valley • • • Any permitted use is non-discretionary as long as standard is met.
Mount Shasta • We don't even regulate aesthetics of homes, but have design review for all else.
Mountain View •
Murrieta •
Napa County • • Farmworker housing
National City •
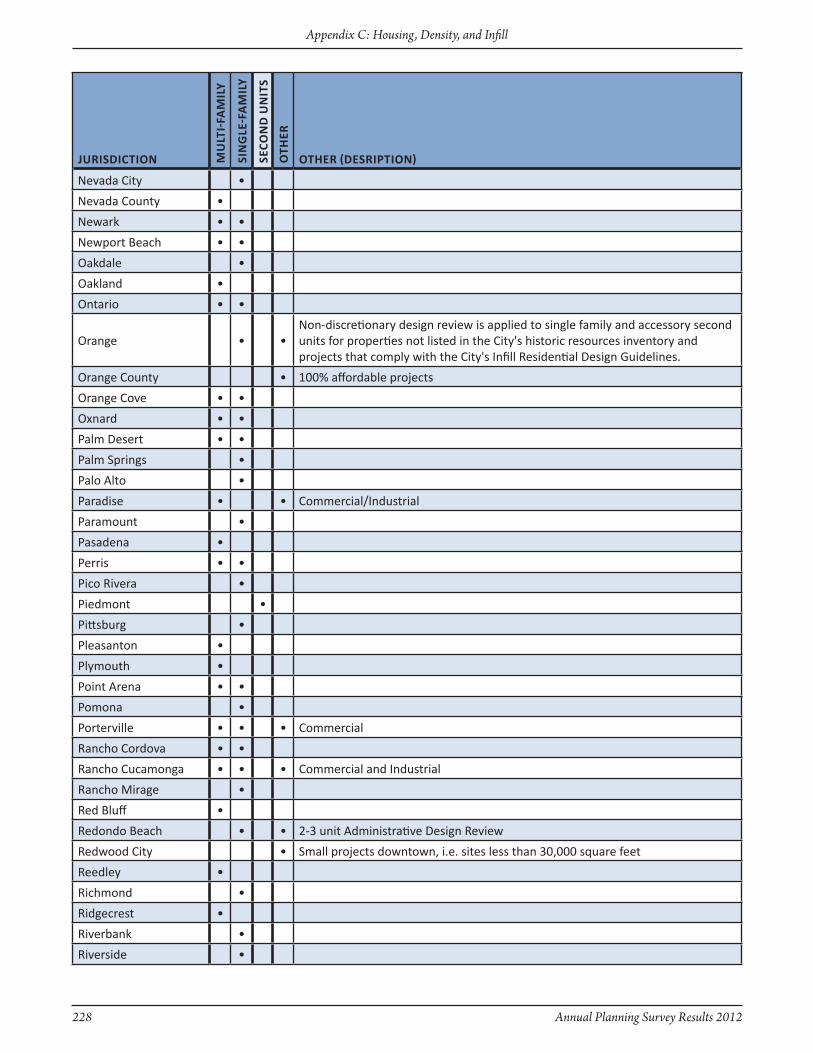
228 Annual Planning Survey Results 2012
Appendix C: Housing, Density, and Infill
JuRisdictiOn Mu
lti-
fAM
ily
sin
Gle
-fA
Mil
y
secO
nd
un
its
Oth
eR
OtheR (desRiPtiOn)
Nevada City •
Nevada County •
Newark • •
Newport Beach • •
Oakdale •
Oakland •
Ontario • •
Orange • •Non-discretionary design review is applied to single family and accessory second units for properties not listed in the City's historic resources inventory and projects that comply with the City's Infill Residential Design Guidelines.
Orange County • 100% affordable projects
Orange Cove • •
Oxnard • •
Palm Desert • •
Palm Springs •
Palo Alto •
Paradise • • Commercial/Industrial
Paramount •
Pasadena •
Perris • •
Pico Rivera •
Piedmont •
Pittsburg •
Pleasanton •
Plymouth •
Point Arena • •
Pomona •
Porterville • • • Commercial
Rancho Cordova • •
Rancho Cucamonga • • • Commercial and Industrial
Rancho Mirage •
Red Bluff •
Redondo Beach • • 2-3 unit Administrative Design Review
Redwood City • Small projects downtown, i.e. sites less than 30,000 square feet
Reedley •
Richmond •
Ridgecrest •
Riverbank •
Riverside •

Annual Planning Survey Results 2012 229
Appendix C: Housing, Density, and Infill
JuRisdictiOn Mu
lti-
fAM
ily
sin
Gle
-fA
Mil
y
secO
nd
un
its
Oth
eR
OtheR (desRiPtiOn)
Riverside County •
Rocklin •
Rolling Hills Estates •
Rosemead •
Ross •
Sacramento County •
Salinas • •
San Anselmo •
San Bernardino • •
San Bernardino County • •
San Bruno •
San Carlos •
San Clemente •
San Diego • •
San Fernando • •
San Jacinto • •
San Joaquin • •
San Jose •
San Juan Capistrano •
San Leandro • We have a less involved review procedure; it is still discretionary
San Luis Obispo •
San Marcos
San Pablo •
San Rafael •
Sanger • •
Santa Ana • •Non Discretionary Multi-family is review by adminstrative Site Plan Review process
Santa Barbara •
Santa Clara County • Statutory, Admin
Santa Clarita • •
Santa Cruz •
Santa Monica •
Santa Paula • •
Santa Rosa •
Santee •
Seaside •
Simi Valley • •
Soledad • •
Sonoma •

230 Annual Planning Survey Results 2012
Appendix C: Housing, Density, and Infill
JuRisdictiOn Mu
lti-
fAM
ily
sin
Gle
-fA
Mil
y
secO
nd
un
its
Oth
eR
OtheR (desRiPtiOn)
Sonora •
South El Monte •
South Gate • •
South Lake Tahoe •
Stockton • •
Suisun City •
Sunnyvale •
Sutter Creek •
Tehama County • •
Temecula •
Temple City • •
Torrance •
Tracy • •SFDUs don't require discretionary review in Tracy, but the question doesn't make sense. Design review is always a discretionary activity.
Trinidad • Accessory dwelling units
Truckee •
Tulare County • Multi-family above 4-units
Union City
Ventura County •
Visalia • • •
Vista •
Waterford •
Watsonville • •
West Sacramento • •
Westminster •When you have design review, you exercise discretion. You cannot have non-discretionary design review. That’s an oxymoron.
Whittier •
Willits • •
Willows •
Windsor •
Woodlake • •
Yolo County • •
Yorba Linda •
Yountville •
Yuba County • • • Specific Plan areas only
Yucaipa •
Yucca Valley • •
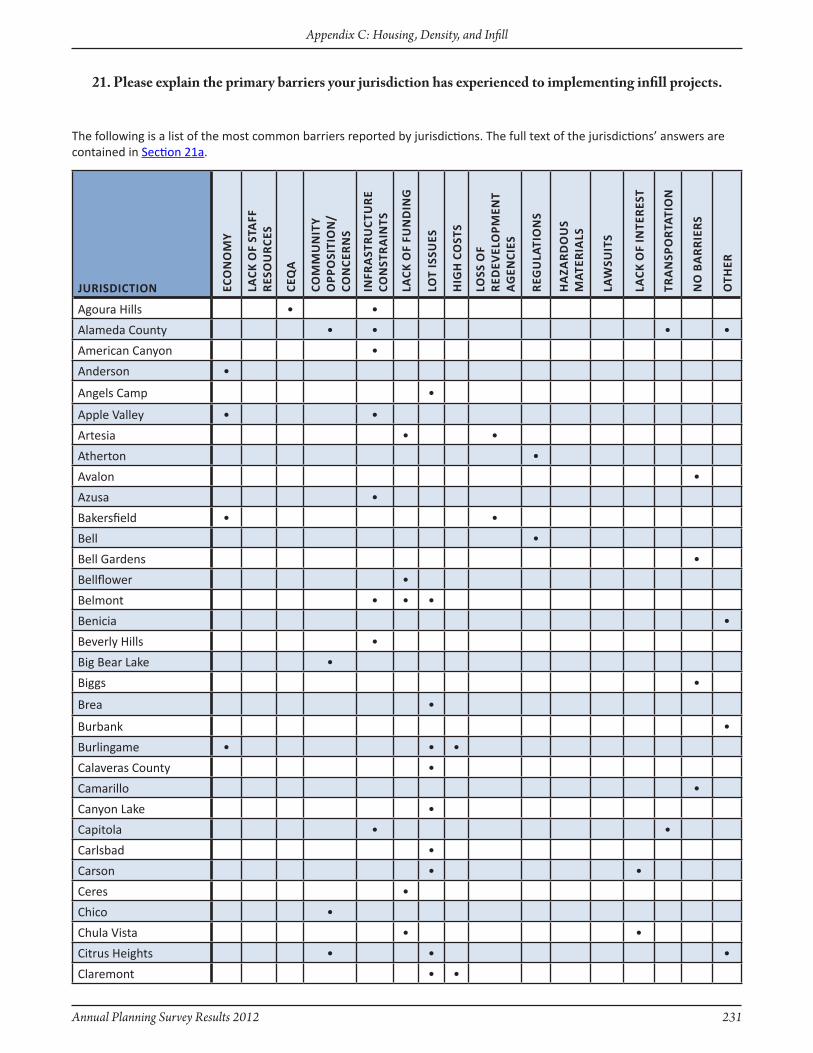
Annual Planning Survey Results 2012 231
Appendix C: Housing, Density, and Infill
JuRisdictiOn ecO
nO
My
lAck
Of
stA
ff
Res
Ou
Rce
s
ceQ
A
cOM
Mu
nit
y O
PPO
siti
On
/cO
nce
Rn
s
infR
Ast
Ru
ctu
Re
cOn
stR
Ain
ts
lAck
Of
fun
din
G
loT
iSSu
eS
Hig
H C
oST
S
loSS
of
Red
evel
OPM
ent
ag
enCi
eS
ReG
ulA
tiO
ns
hA
ZAR
dO
us
MAt
eRiA
ls
law
SuiT
S
lAck
Of
inte
Res
t
tRA
nsP
OR
tAti
On
nO
BA
RR
ieR
s
Oth
eR
Agoura Hills • •
Alameda County • • • •
American Canyon •
Anderson •
Angels Camp •
Apple Valley • •
Artesia • •
Atherton •
Avalon •
Azusa •
Bakersfield • •
Bell •
Bell Gardens •
Bellflower •
Belmont • • •
Benicia •
Beverly Hills •
Big Bear Lake •
Biggs •
Brea •
Burbank •
Burlingame • • •
Calaveras County •
Camarillo •
Canyon Lake •
Capitola • •
Carlsbad •
Carson • •
Ceres •
Chico •
Chula Vista • •
Citrus Heights • • •
Claremont • •
21. Please explain the primary barriers your jurisdiction has experienced to implementing infill projects.
The following is a list of the most common barriers reported by jurisdictions. The full text of the jurisdictions’ answers are contained in Section 21a.
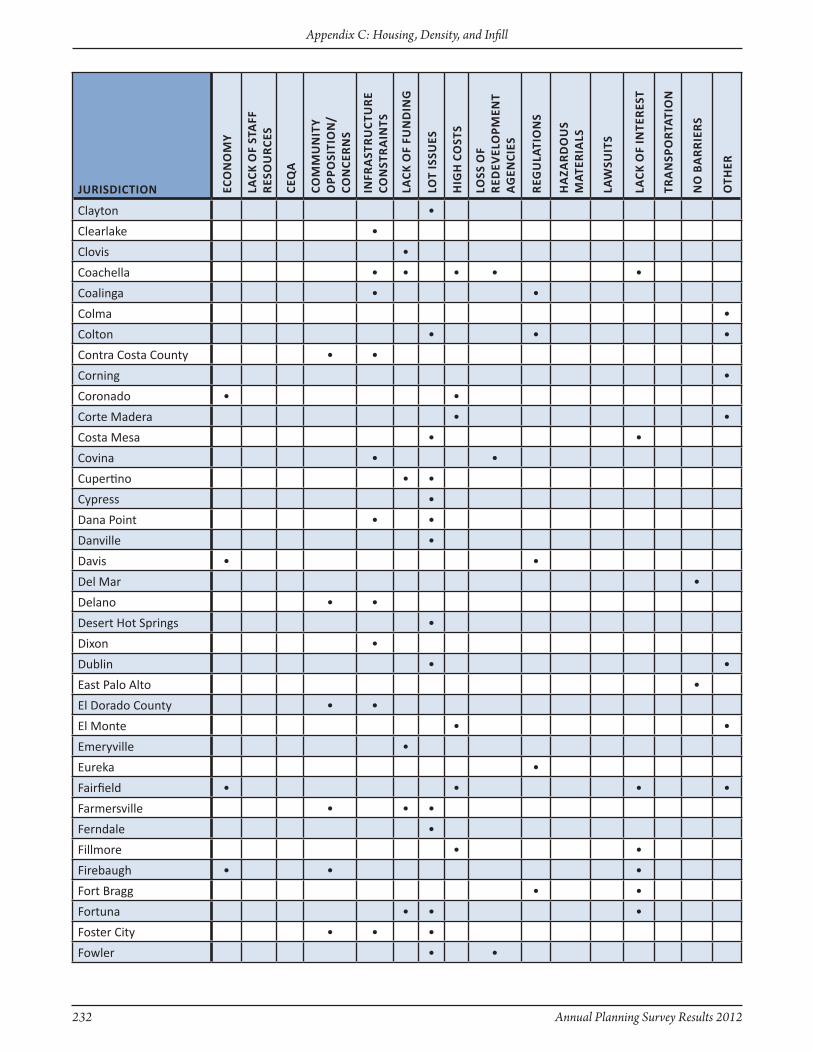
232 Annual Planning Survey Results 2012
Appendix C: Housing, Density, and Infill
JuRisdictiOn ecO
nO
My
lAck
Of
stA
ff
Res
Ou
Rce
s
ceQ
A
cOM
Mu
nit
y O
PPO
siti
On
/cO
nce
Rn
s
infR
Ast
Ru
ctu
Re
cOn
stR
Ain
ts
lAck
Of
fun
din
G
loT
iSSu
eS
Hig
H C
oST
S
loSS
of
Red
evel
OPM
ent
ag
enCi
eS
ReG
ulA
tiO
ns
hA
ZAR
dO
us
MAt
eRiA
ls
law
SuiT
S
lAck
Of
inte
Res
t
tRA
nsP
OR
tAti
On
nO
BA
RR
ieR
s
Oth
eR
Clayton •
Clearlake •
Clovis •
Coachella • • • • •
Coalinga • •
Colma •
Colton • • •
Contra Costa County • •
Corning •
Coronado • •
Corte Madera • •
Costa Mesa • •
Covina • •
Cupertino • •
Cypress •
Dana Point • •
Danville •
Davis • •
Del Mar •
Delano • •
Desert Hot Springs •
Dixon •
Dublin • •
East Palo Alto •
El Dorado County • •
El Monte • •
Emeryville •
Eureka •
Fairfield • • • •
Farmersville • • •
Ferndale •
Fillmore • •
Firebaugh • • •
Fort Bragg • •
Fortuna • • •
Foster City • • •
Fowler • •
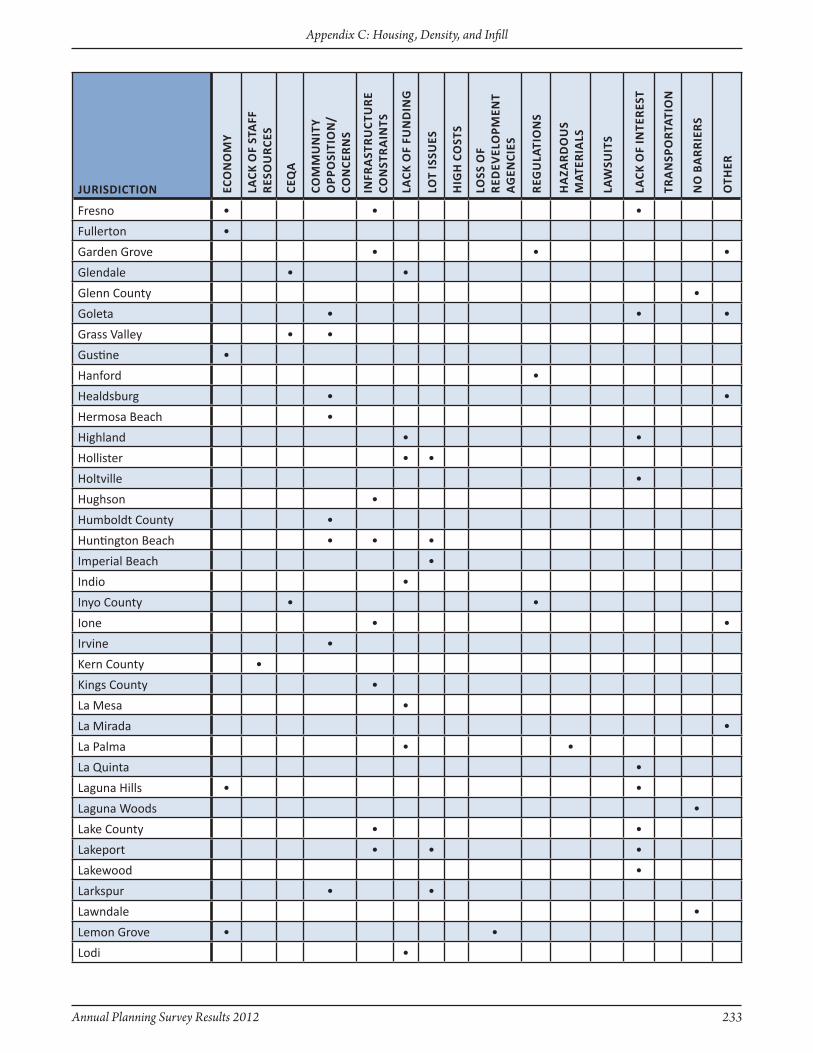
Annual Planning Survey Results 2012 233
Appendix C: Housing, Density, and Infill
JuRisdictiOn ecO
nO
My
lAck
Of
stA
ff
Res
Ou
Rce
s
ceQ
A
cOM
Mu
nit
y O
PPO
siti
On
/cO
nce
Rn
s
infR
Ast
Ru
ctu
Re
cOn
stR
Ain
ts
lAck
Of
fun
din
G
loT
iSSu
eS
Hig
H C
oST
S
loSS
of
Red
evel
OPM
ent
ag
enCi
eS
ReG
ulA
tiO
ns
hA
ZAR
dO
us
MAt
eRiA
ls
law
SuiT
S
lAck
Of
inte
Res
t
tRA
nsP
OR
tAti
On
nO
BA
RR
ieR
s
Oth
eR
Fresno • • •
Fullerton •
Garden Grove • • •
Glendale • •
Glenn County •
Goleta • • •
Grass Valley • •
Gustine •
Hanford •
Healdsburg • •
Hermosa Beach •
Highland • •
Hollister • •
Holtville •
Hughson •
Humboldt County •
Huntington Beach • • •
Imperial Beach •
Indio •
Inyo County • •
Ione • •
Irvine •
Kern County •
Kings County •
La Mesa •
La Mirada •
La Palma • •
La Quinta •
Laguna Hills • •
Laguna Woods •
Lake County • •
Lakeport • • •
Lakewood •
Larkspur • •
Lawndale •
Lemon Grove • •
Lodi •

234 Annual Planning Survey Results 2012
Appendix C: Housing, Density, and Infill
JuRisdictiOn ecO
nO
My
lAck
Of
stA
ff
Res
Ou
Rce
s
ceQ
A
cOM
Mu
nit
y O
PPO
siti
On
/cO
nce
Rn
s
infR
Ast
Ru
ctu
Re
cOn
stR
Ain
ts
lAck
Of
fun
din
G
loT
iSSu
eS
Hig
H C
oST
S
loSS
of
Red
evel
OPM
ent
ag
enCi
eS
ReG
ulA
tiO
ns
hA
ZAR
dO
us
MAt
eRiA
ls
law
SuiT
S
lAck
Of
inte
Res
t
tRA
nsP
OR
tAti
On
nO
BA
RR
ieR
s
Oth
eR
Los Angeles •
Los Angeles County •
Los Banos •
Los Gatos •
Madera • •
Manhattan Beach •
Marina •
Mariposa County •
Maywood •
Mendocino County •
Mendota • • • •
Menlo Park •
Merced • •
Mill Valley •
Millbrae • •
Milpitas • •
Modesto • • • •
Monrovia • •
Montclair •
Montebello •
Moreno Valley •
Mount Shasta •
Mountain View • •
Murrieta •
National City • •
Nevada City •
Nevada County •
Newark • • • • • •
Newport Beach • •
Norco •
Novato • • • •
Oakland • • • • •
Oceanside • • • •
Ojai • •
Ontario •
Orange •
Orange County • • •
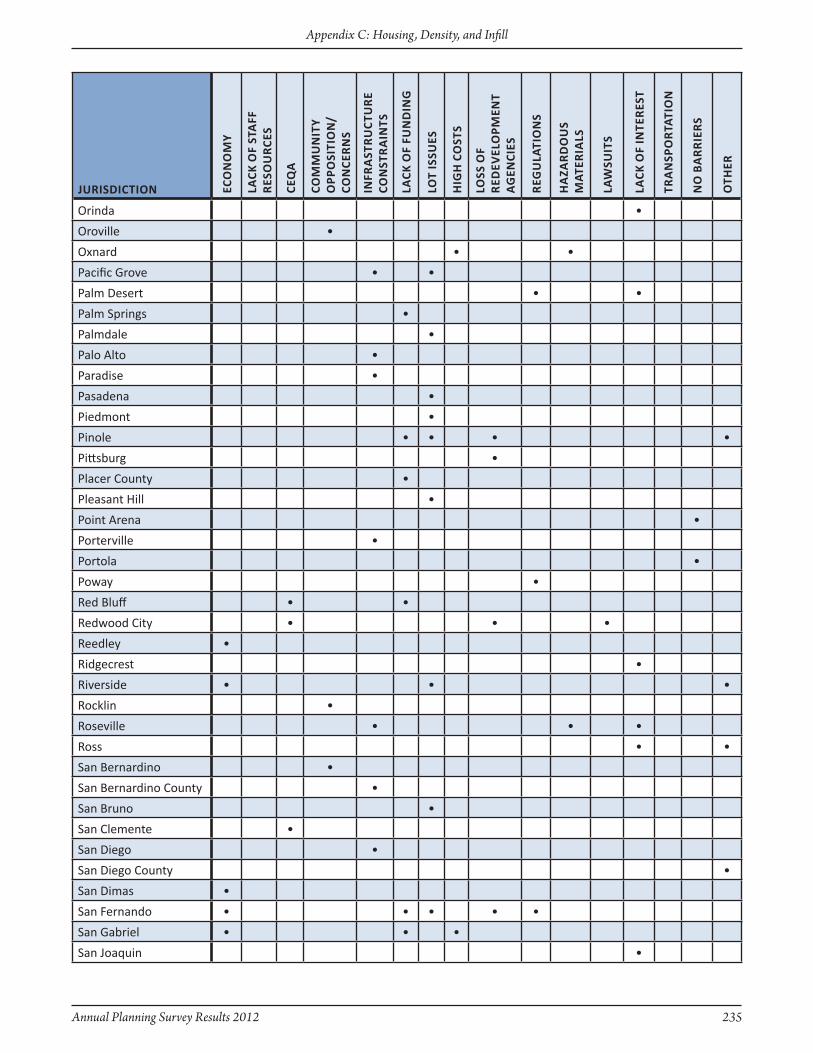
Annual Planning Survey Results 2012 235
Appendix C: Housing, Density, and Infill
JuRisdictiOn ecO
nO
My
lAck
Of
stA
ff
Res
Ou
Rce
s
ceQ
A
cOM
Mu
nit
y O
PPO
siti
On
/cO
nce
Rn
s
infR
Ast
Ru
ctu
Re
cOn
stR
Ain
ts
lAck
Of
fun
din
G
loT
iSSu
eS
Hig
H C
oST
S
loSS
of
Red
evel
OPM
ent
ag
enCi
eS
ReG
ulA
tiO
ns
hA
ZAR
dO
us
MAt
eRiA
ls
law
SuiT
S
lAck
Of
inte
Res
t
tRA
nsP
OR
tAti
On
nO
BA
RR
ieR
s
Oth
eR
Orinda •
Oroville •
Oxnard • •
Pacific Grove • •
Palm Desert • •
Palm Springs •
Palmdale •
Palo Alto •
Paradise •
Pasadena •
Piedmont •
Pinole • • • •
Pittsburg •
Placer County •
Pleasant Hill •
Point Arena •
Porterville •
Portola •
Poway •
Red Bluff • •
Redwood City • • •
Reedley •
Ridgecrest •
Riverside • • •
Rocklin •
Roseville • • •
Ross • •
San Bernardino •
San Bernardino County •
San Bruno •
San Clemente •
San Diego •
San Diego County •
San Dimas •
San Fernando • • • • •
San Gabriel • • •
San Joaquin •
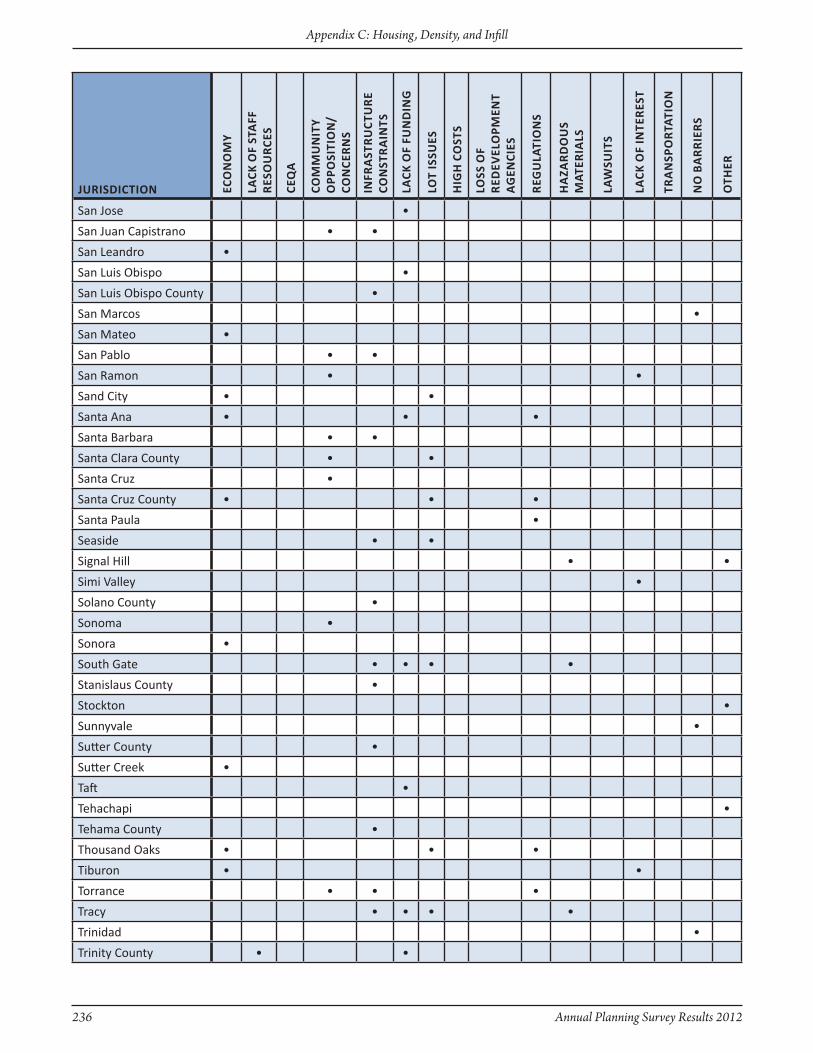
236 Annual Planning Survey Results 2012
Appendix C: Housing, Density, and Infill
JuRisdictiOn ecO
nO
My
lAck
Of
stA
ff
Res
Ou
Rce
s
ceQ
A
cOM
Mu
nit
y O
PPO
siti
On
/cO
nce
Rn
s
infR
Ast
Ru
ctu
Re
cOn
stR
Ain
ts
lAck
Of
fun
din
G
loT
iSSu
eS
Hig
H C
oST
S
loSS
of
Red
evel
OPM
ent
ag
enCi
eS
ReG
ulA
tiO
ns
hA
ZAR
dO
us
MAt
eRiA
ls
law
SuiT
S
lAck
Of
inte
Res
t
tRA
nsP
OR
tAti
On
nO
BA
RR
ieR
s
Oth
eR
San Jose •
San Juan Capistrano • •
San Leandro •
San Luis Obispo •
San Luis Obispo County •
San Marcos •
San Mateo •
San Pablo • •
San Ramon • •
Sand City • •
Santa Ana • • •
Santa Barbara • •
Santa Clara County • •
Santa Cruz •
Santa Cruz County • • •
Santa Paula •
Seaside • •
Signal Hill • •
Simi Valley •
Solano County •
Sonoma •
Sonora •
South Gate • • • •
Stanislaus County •
Stockton •
Sunnyvale •
Sutter County •
Sutter Creek •
Taft •
Tehachapi •
Tehama County •
Thousand Oaks • • •
Tiburon • •
Torrance • • •
Tracy • • • •
Trinidad •
Trinity County • •
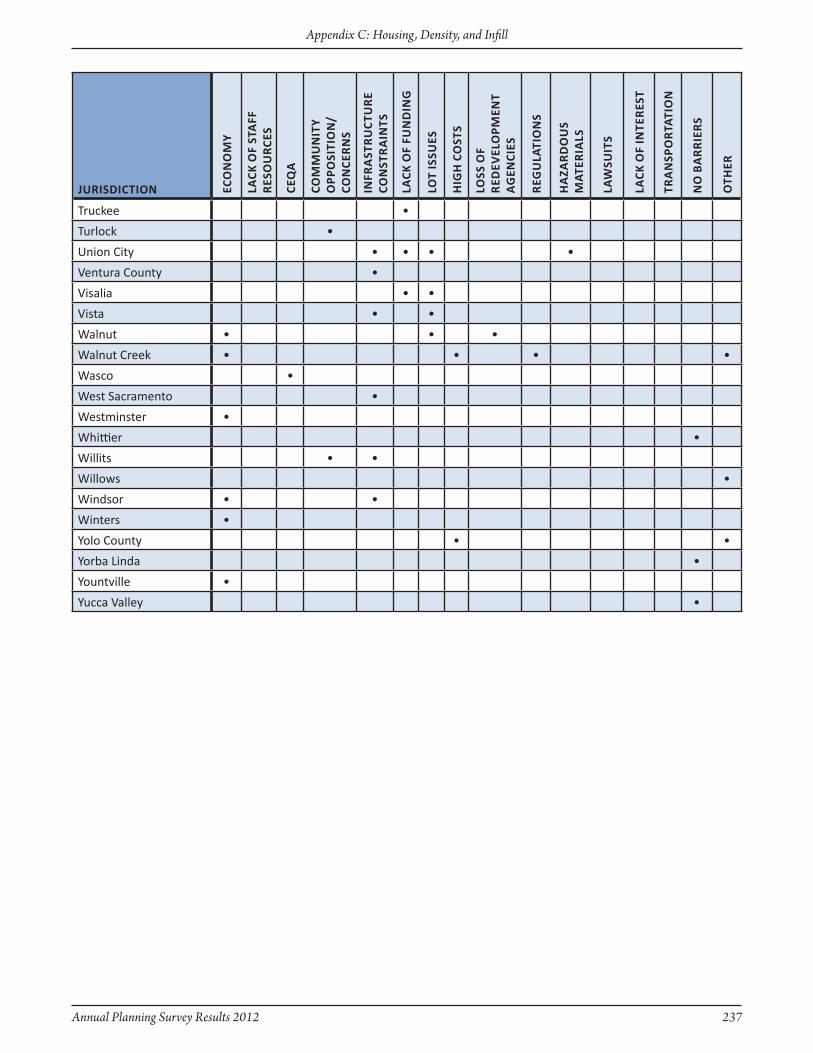
Annual Planning Survey Results 2012 237
Appendix C: Housing, Density, and Infill
JuRisdictiOn ecO
nO
My
lAck
Of
stA
ff
Res
Ou
Rce
s
ceQ
A
cOM
Mu
nit
y O
PPO
siti
On
/cO
nce
Rn
s
infR
Ast
Ru
ctu
Re
cOn
stR
Ain
ts
lAck
Of
fun
din
G
loT
iSSu
eS
Hig
H C
oST
S
loSS
of
Red
evel
OPM
ent
ag
enCi
eS
ReG
ulA
tiO
ns
hA
ZAR
dO
us
MAt
eRiA
ls
law
SuiT
S
lAck
Of
inte
Res
t
tRA
nsP
OR
tAti
On
nO
BA
RR
ieR
s
Oth
eR
Truckee •
Turlock •
Union City • • • •
Ventura County •
Visalia • •
Vista • •
Walnut • • •
Walnut Creek • • • •
Wasco •
West Sacramento •
Westminster •
Whittier •
Willits • •
Willows •
Windsor • •
Winters •
Yolo County • •
Yorba Linda •
Yountville •
Yucca Valley •

238 Annual Planning Survey Results 2012
Appendix C: Housing, Density, and Infill
JuRisdictiOn BARRieRs
Agoura HillsThe CEQA exemption doesn't often apply, as our city is primarily built out and traffic impacts result. Therefore, projects cannot be environmentally streamlined for processing. Infill lots often have steep slopes as well, which makes them less desirable and more costly to develop.
Alameda County Inadequate infrastructure, community opposition, and lack of transit
American CanyonThe lack of an adopted Specific Plan and the lack of sufficient utilities and roadway infrastucture to support.
Anderson The economy
Angels Camp Terrain - We are in the foothills and a lot of parcels are unbuildable
Apple Valley The economy and lack of infrastructure
Artesia Lack of funding and financial incentives, now no RDA
Atherton Multi-family and commercial developments are not allowed in the town
Azusa Our primary barrier is parking and restrictions on parking placement.
Bakersfield Poor market conditions; elimination of redevelopment
BellOur zoning Code will need to be revitalized and updated to address current community dynamics and issues. The current zoning code is inadequate to fulfill the desired effects of a higher density.
Bell Gardens Our city is completely built out.
Bellflower Financing
Belmont
In determining the realistic development capacity of infill project sites, factors such as small and irregularly subdivided sites, fragmented ownership, and limited alternatives for access must be considered. A limited availability of commercially-zoned property within the City places a high price tag on the value of keeping our local economic base; converting commercial property to housing land uses does not make sense financially for the City. Significant infill projects would require upgrades to existing aging infrastructure, primarily to the City’s storm water management system. This added financial burden, combined with the increasing challenge for developers in obtaining traditional project financing, has prevented projects from moving forward.
Benicia
The center of civic, cultural, tourist, and waterfront activites is in a designated historic district. Because of this, it is difficult to gather the density needed to encourage infill and charge economic development in Benicia's historic downtown. Most alterations of any kind will require Design Review fees, processing, and hearing. Outside the Historic District most projects require design review, except for Single Family residences.
Beverly HillsEssentially, all new development in Beverly Hills is infill. Traffic is the biggest issue facing new development in the city.
Big Bear Lake Neighborhood opposition
Brea Lot consolidation is difficult due to size and proximity
BurbankLack of support from public and/or politically. Lack of understanding about benefits and/or impacts of denser development.
Burlingame Current economic conditions, small parcel sizes and high land costs.
Calaveras County
Calaveras is a rural foothill county with only one incorporated city. Infill develpment would take place in close proximity to developed communities. Most communities are historic, and lands available for infill development are limited. Infill development lands are also severely constrained by existing foothill topography and hydrologic features such as creeks and wetlands. The easily developed lands have already been developed.
Canyon Lake Location/access to infill areas and development desirability
Capitola Transportation and transit funding.
21a. Narrative answers to the barriers jurisdictions have experienced to implementing infill projects.
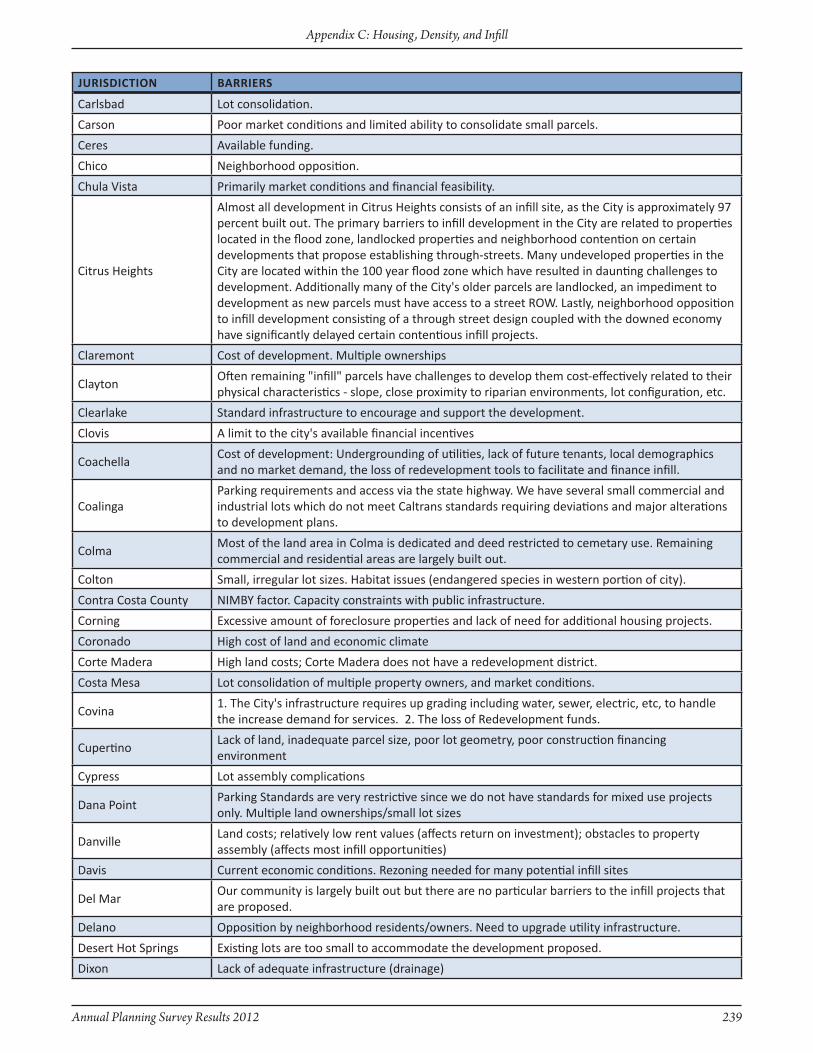
Annual Planning Survey Results 2012 239
Appendix C: Housing, Density, and Infill
JuRisdictiOn BARRieRs
Carlsbad Lot consolidation.
Carson Poor market conditions and limited ability to consolidate small parcels.
Ceres Available funding.
Chico Neighborhood opposition.
Chula Vista Primarily market conditions and financial feasibility.
Citrus Heights
Almost all development in Citrus Heights consists of an infill site, as the City is approximately 97 percent built out. The primary barriers to infill development in the City are related to properties located in the flood zone, landlocked properties and neighborhood contention on certain developments that propose establishing through-streets. Many undeveloped properties in the City are located within the 100 year flood zone which have resulted in daunting challenges to development. Additionally many of the City's older parcels are landlocked, an impediment to development as new parcels must have access to a street ROW. Lastly, neighborhood opposition to infill development consisting of a through street design coupled with the downed economy have significantly delayed certain contentious infill projects.
Claremont Cost of development. Multiple ownerships
ClaytonOften remaining "infill" parcels have challenges to develop them cost-effectively related to their physical characteristics - slope, close proximity to riparian environments, lot configuration, etc.
Clearlake Standard infrastructure to encourage and support the development.
Clovis A limit to the city's available financial incentives
CoachellaCost of development: Undergrounding of utilities, lack of future tenants, local demographics and no market demand, the loss of redevelopment tools to facilitate and finance infill.
CoalingaParking requirements and access via the state highway. We have several small commercial and industrial lots which do not meet Caltrans standards requiring deviations and major alterations to development plans.
ColmaMost of the land area in Colma is dedicated and deed restricted to cemetary use. Remaining commercial and residential areas are largely built out.
Colton Small, irregular lot sizes. Habitat issues (endangered species in western portion of city).
Contra Costa County NIMBY factor. Capacity constraints with public infrastructure.
Corning Excessive amount of foreclosure properties and lack of need for additional housing projects.
Coronado High cost of land and economic climate
Corte Madera High land costs; Corte Madera does not have a redevelopment district.
Costa Mesa Lot consolidation of multiple property owners, and market conditions.
Covina1. The City's infrastructure requires up grading including water, sewer, electric, etc, to handle the increase demand for services. 2. The loss of Redevelopment funds.
CupertinoLack of land, inadequate parcel size, poor lot geometry, poor construction financing environment
Cypress Lot assembly complications
Dana PointParking Standards are very restrictive since we do not have standards for mixed use projects only. Multiple land ownerships/small lot sizes
DanvilleLand costs; relatively low rent values (affects return on investment); obstacles to property assembly (affects most infill opportunities)
Davis Current economic conditions. Rezoning needed for many potential infill sites
Del MarOur community is largely built out but there are no particular barriers to the infill projects that are proposed.
Delano Opposition by neighborhood residents/owners. Need to upgrade utility infrastructure.
Desert Hot Springs Existing lots are too small to accommodate the development proposed.
Dixon Lack of adequate infrastructure (drainage)
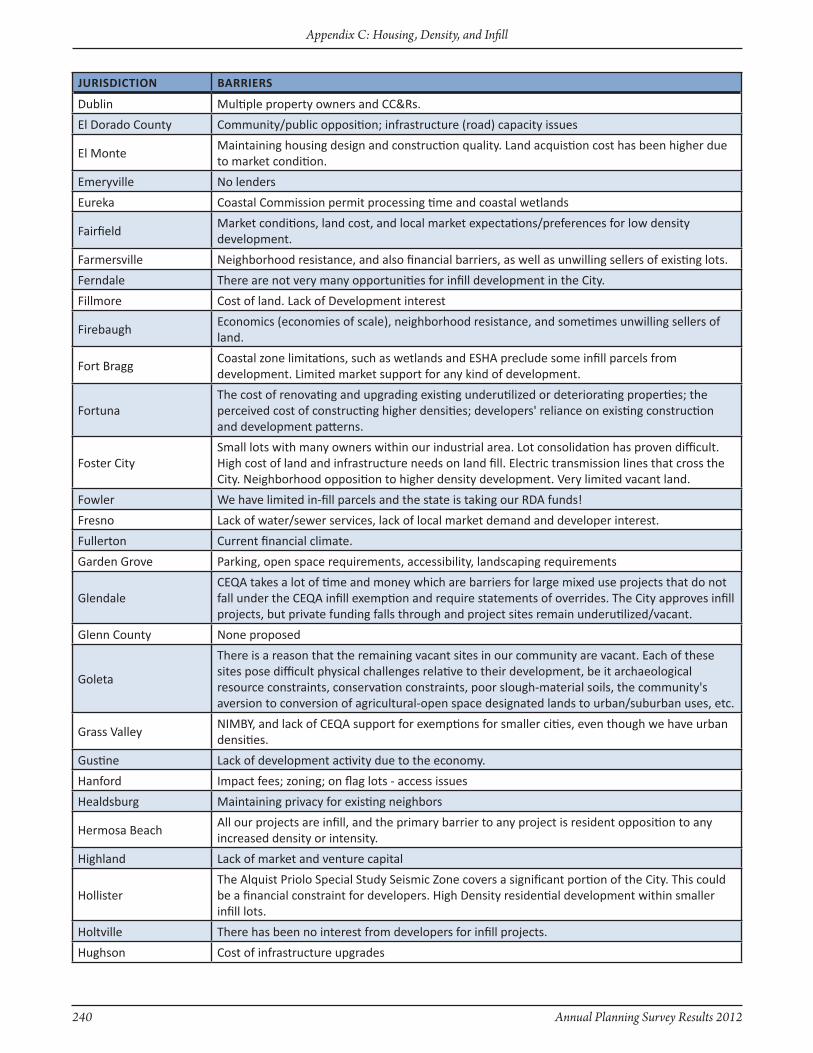
240 Annual Planning Survey Results 2012
Appendix C: Housing, Density, and Infill
JuRisdictiOn BARRieRs
Dublin Multiple property owners and CC&Rs.
El Dorado County Community/public opposition; infrastructure (road) capacity issues
El MonteMaintaining housing design and construction quality. Land acquistion cost has been higher due to market condition.
Emeryville No lenders
Eureka Coastal Commission permit processing time and coastal wetlands
FairfieldMarket conditions, land cost, and local market expectations/preferences for low density development.
Farmersville Neighborhood resistance, and also financial barriers, as well as unwilling sellers of existing lots.
Ferndale There are not very many opportunities for infill development in the City.
Fillmore Cost of land. Lack of Development interest
FirebaughEconomics (economies of scale), neighborhood resistance, and sometimes unwilling sellers of land.
Fort BraggCoastal zone limitations, such as wetlands and ESHA preclude some infill parcels from development. Limited market support for any kind of development.
FortunaThe cost of renovating and upgrading existing underutilized or deteriorating properties; the perceived cost of constructing higher densities; developers' reliance on existing construction and development patterns.
Foster CitySmall lots with many owners within our industrial area. Lot consolidation has proven difficult. High cost of land and infrastructure needs on land fill. Electric transmission lines that cross the City. Neighborhood opposition to higher density development. Very limited vacant land.
Fowler We have limited in-fill parcels and the state is taking our RDA funds!
Fresno Lack of water/sewer services, lack of local market demand and developer interest.
Fullerton Current financial climate.
Garden Grove Parking, open space requirements, accessibility, landscaping requirements
GlendaleCEQA takes a lot of time and money which are barriers for large mixed use projects that do not fall under the CEQA infill exemption and require statements of overrides. The City approves infill projects, but private funding falls through and project sites remain underutilized/vacant.
Glenn County None proposed
Goleta
There is a reason that the remaining vacant sites in our community are vacant. Each of these sites pose difficult physical challenges relative to their development, be it archaeological resource constraints, conservation constraints, poor slough-material soils, the community's aversion to conversion of agricultural-open space designated lands to urban/suburban uses, etc.
Grass ValleyNIMBY, and lack of CEQA support for exemptions for smaller cities, even though we have urban densities.
Gustine Lack of development activity due to the economy.
Hanford Impact fees; zoning; on flag lots - access issues
Healdsburg Maintaining privacy for existing neighbors
Hermosa BeachAll our projects are infill, and the primary barrier to any project is resident opposition to any increased density or intensity.
Highland Lack of market and venture capital
HollisterThe Alquist Priolo Special Study Seismic zone covers a significant portion of the City. This could be a financial constraint for developers. High Density residential development within smaller infill lots.
Holtville There has been no interest from developers for infill projects.
Hughson Cost of infrastructure upgrades
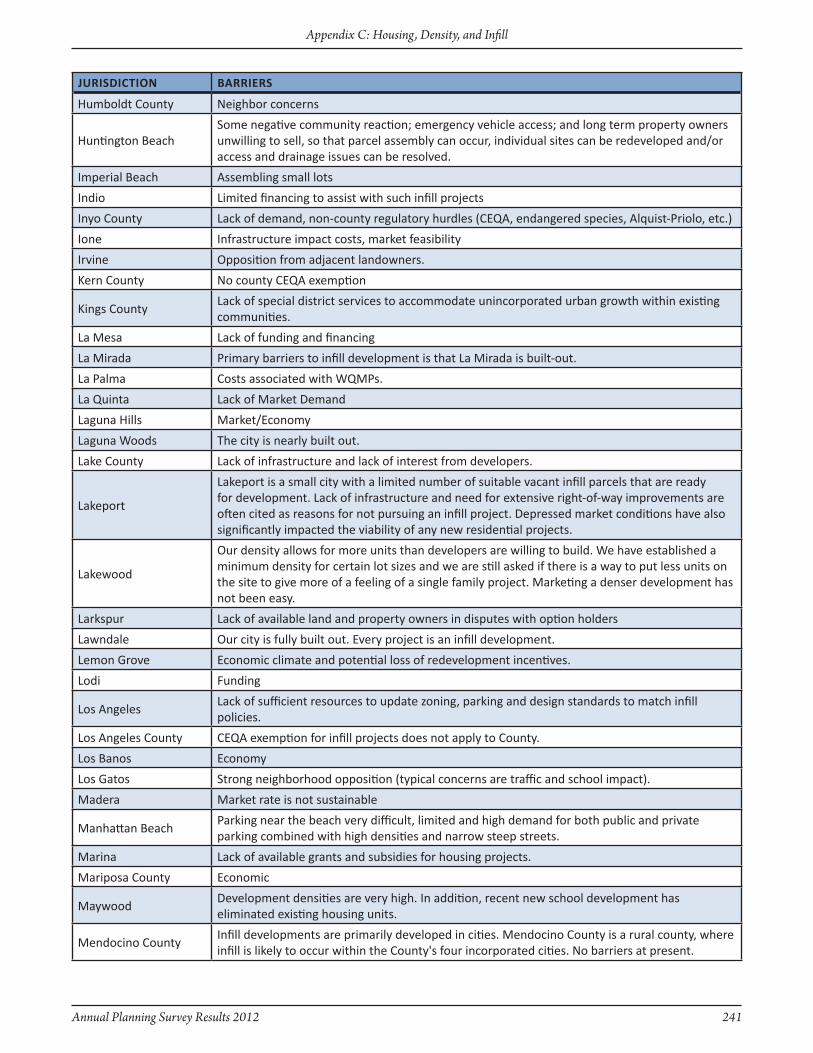
Annual Planning Survey Results 2012 241
Appendix C: Housing, Density, and Infill
JuRisdictiOn BARRieRs
Humboldt County Neighbor concerns
Huntington BeachSome negative community reaction; emergency vehicle access; and long term property owners unwilling to sell, so that parcel assembly can occur, individual sites can be redeveloped and/or access and drainage issues can be resolved.
Imperial Beach Assembling small lots
Indio Limited financing to assist with such infill projects
Inyo County Lack of demand, non-county regulatory hurdles (CEQA, endangered species, Alquist-Priolo, etc.)
Ione Infrastructure impact costs, market feasibility
Irvine Opposition from adjacent landowners.
Kern County No county CEQA exemption
Kings CountyLack of special district services to accommodate unincorporated urban growth within existing communities.
La Mesa Lack of funding and financing
La Mirada Primary barriers to infill development is that La Mirada is built-out.
La Palma Costs associated with WQMPs.
La Quinta Lack of Market Demand
Laguna Hills Market/Economy
Laguna Woods The city is nearly built out.
Lake County Lack of infrastructure and lack of interest from developers.
Lakeport
Lakeport is a small city with a limited number of suitable vacant infill parcels that are ready for development. Lack of infrastructure and need for extensive right-of-way improvements are often cited as reasons for not pursuing an infill project. Depressed market conditions have also significantly impacted the viability of any new residential projects.
Lakewood
Our density allows for more units than developers are willing to build. We have established a minimum density for certain lot sizes and we are still asked if there is a way to put less units on the site to give more of a feeling of a single family project. Marketing a denser development has not been easy.
Larkspur Lack of available land and property owners in disputes with option holders
Lawndale Our city is fully built out. Every project is an infill development.
Lemon Grove Economic climate and potential loss of redevelopment incentives.
Lodi Funding
Los AngelesLack of sufficient resources to update zoning, parking and design standards to match infill policies.
Los Angeles County CEQA exemption for infill projects does not apply to County.
Los Banos Economy
Los Gatos Strong neighborhood opposition (typical concerns are traffic and school impact).
Madera Market rate is not sustainable
Manhattan BeachParking near the beach very difficult, limited and high demand for both public and private parking combined with high densities and narrow steep streets.
Marina Lack of available grants and subsidies for housing projects.
Mariposa County Economic
MaywoodDevelopment densities are very high. In addition, recent new school development has eliminated existing housing units.
Mendocino CountyInfill developments are primarily developed in cities. Mendocino County is a rural county, where infill is likely to occur within the County's four incorporated cities. No barriers at present.

242 Annual Planning Survey Results 2012
Appendix C: Housing, Density, and Infill
JuRisdictiOn BARRieRs
Mendota
Mostly money, as in the City/RDA has none with which it might be able to actively and rigorously promote infill. Also of importance is that the majority of infill parcels are located along or in close proximity to State Route 180, which serves as the primary business corridor. These parcels were originally subdivided in the late 1800s, and consist of base 25' x 150' lots. Nonconforming uses are abundant, many of which are in substandard structures (again, the City has no means to correct or help correct this). Any infill project along this corridor must comply with Caltrans requirements, which adds a layer of difficulty and often a great deal of time to even simple development processes.
Menlo Park Community opposition
Merced Cost and NIMBY
Mill Valley Concerns about density, traffic, impact to community character
Millbrae Slow economy, lack of investment by developers.
MilpitasRecently adopted air quality thresholds have limited the applicability of the infill exemption under CEQA.
ModestoInadequate infrastructure and no money to repair and upgrade it. Development community and city have little experience working with infill development.
Monrovia The economy and an inability to secure financing for projects.
MontclairRegional Water Quality Control Board's unreasonable guidelines for addressing surface water runoff. Our small city has lost two projects that can be directly traced to ridiculous WQMP requirements.
Montebello Attracting developers to the City.
Moreno Valley Cost of Aging, Undersized Infrastructure Upgrade
Mount Shasta Infrastructure is sometimes substandard such as water and sewer. Sidewalks as well.
Mountain View Outdated zoning regulations; small, fragmented lots
MurrietaInfill is not a pressing issue for the City compared to other jurisdictions in the regions, the City still has property available for residential, commercial, and industrial development.
National CityHazardous materials in the soil/underground storage tank issues; ownership issues or lack of property control (uncooperative owner)
Nevada City Small size of City results in very few applications.
Nevada County Lack of infrastructure, primarily sanitary sewer, lack of other services.
NewarkInfrastructure costs and the lack of regional funding to support infill, State Attacks on Redevelopment have cast a dark cloud over proposed infill projects, Cumbersome Air District rules have confused developers and made them fear lawsuits.
Newport BeachThe Land Use Element and zoning Code do not provide suffient density/intensity and bulidng height to allow true mixed-use projects. Off-street parking requirements, especially in the Coastal zone, make it difficult to park [at] infill projects.
NorcoAll recent proposed projects have needed reduction of fees or other forms of financial assistance from the City which the City is not in a position to do.
NovatoCost of development. Unsophisticated property owners. Community concerns regarding compatibility.
Oakland1) NIMBY resistance to increased height/density 2) Lack of certainty regarding Redevelopment Agency and fiscal status of City General Fund 3) Difference in land valuation between commercial and residential uses 4) Consolidation of multiple smaller parcels
OceansideDifficulties in assembling small parcels; high land costs in the Coastal zone (where most infill opportunities currently exist); costs of upgrading existing infrastructure
Ojai The economy. Traffic impact thresholds.
Ontario Lot consideration/configuration
Orange Political dynamics.

Annual Planning Survey Results 2012 243
Appendix C: Housing, Density, and Infill
JuRisdictiOn BARRieRs
Orange County Lack of vacant underutilized parcels, traffic impacts and neighborhood opposition.
Orinda Long term property owners disinterested in redevelopment of their properties.
Oroville The community buy into something other than single family residential units!
Oxnard Relative cost compared to remaining greenfield development within City limits.
Pacific Grove Lack of water supply for new development; very limited supply of vacant and underutilized land.
Palm DesertCurrent code requirements make it difficult to fit the necessary standards on small infill sites without the creative ability to manipulate the code. Additionally, some members of the Palm Desert community prefer low-density development.
Palm Springs Lack of institutional infrastructure for financing mixed use projects.
Palmdale 1. Available vacant land throughout 104 square mile City 2. Low density suburban community
Palo Alto Existing aging infrastructure, school impacts, development standards.
Paradise
Lack of a community sewer system. All wastewater disposal is provided by on-site wastewater treatment and disposal systems. Lack of adequate storm water drainage facilities in areas. Topography, shallow soils, high groundwater make on-site wastewater disposal infeasible in areas.
Pasadena Lack of suitable infill sites.
PiedmontThe city has been completely built-out for many years, with no commercial or industrial sites that can be converted to infill mixed-use or housing projects.
PinoleSite assembly, low performing schools, lack of capital available for new construction, loss of redevelopment funds due to mandatory state payments.
PittsburgThe primary barriers facing infill development in Pittsburg are the overall economic downtown and the loss of millions of Redevelopment Agency funds due to State take-aways.
Placer County Property owners cannot obtain financing.
Pleasant Hill Proximity to existing development, compatibility concerns
Point ArenaLack of developer/investor interest. No new construction. City Population has remained stagnant for decades at a population of less than 500 persons. Parcels within the city limit approx. 30% remain undeveloped.
Porterville Deficient infrastructure in older parts of town.
PowayUpdated policy objectives that need attention. Ability to dedicate resources/commitment to updating general plan elements and initiatives.
Red Bluff
CEQA, is the barrier. The time resources and cost of the State and Federal Funding could be more efficiently utilized for low income family purposes by either creating more dwelling units or adding more amenities to the project i.e. day care facilities and staffing in the common buildings. Infill by its very nature and definition is and should be a ministerial act. The General Plan and zoning Environmental Documents have already studied the Impacts as long as the use is a permited use without a Use Permit.
Redwood City CEQA challenges to the programmatic EIR. State's elimination of Redevelopment Agency
Reedley Economics - Raw land values are still very low in the central valley
Ridgecrest Finding a developer willing to make the investment, take the risk.
Riverside Current economy; difficulty in land consolidation; difficulties in integrating historic resources
Rocklin Opposition by existing neighbors.
RosevilleLack of adequate infrastructure, lack of investment by private development, hazardous materials
Ross No interest in building.
San Bernardino Neighborhood activists

244 Annual Planning Survey Results 2012
Appendix C: Housing, Density, and Infill
JuRisdictiOn BARRieRs
San Bernardino County
Primarily, the focus of the County is to encourage development to be in spheres of influence, unincorporated communities and towns. The County does not provide any sewer service and negligible water services. The County is committed to having development concentrated in the SOI limits for residential use. Due to the lack of infrastructure, the challenge for conversion to residential use of under utilized land is ongoing. However, currently in the County, affordable housing developments are being explored and proposed. A large portion of the County’s undeveloped land is protected by its use as open space and agricultural preserves or farmland which preserves these parcels from conversion to urban uses.
San Bruno Small vacant lots - need more lot consolidation.
San Clemente CEQA needs to be reformed to facilitate infill. It is punitive as it currently exists.
San Diego A lack of public facilities
San Diego County Lack of area master plans
San Dimas Economy
San Fernando
Disjointed ownership of parcels along commercial corridors zoned for mixed use development, gap fund financing problems to develop mixed use projects, a sluggish economy, state take away of Agency redevelopment funds, and, the city's current parking regulations have all impacted the ability to facilitate and develop infill development projects.
San Gabriel The poor economy. Difficulty of developers obtaining financing. High land costs.
San Joaquin Lack of development applications.
San JoseIn some instances, publicly held development companies, insurance corporations, and/or financial institutions have not supported innovative, mixed use development with reduced/no parking.
San Juan Capistrano 1. Opposition by neighboring residents. 2. Public facility and/or street capacity constraints.
San Leandro The economy is the primary barrier.
San Luis Obispo Cost of development impact fees.
San Luis Obispo County Limited water supply
San Mateo Poor Economy
San Pablo Push back from the Community on reduced parking standards and increased traffic.
San Ramon Slow growth attitude of residents
Sand City Current real estate climate and small lots needing lot consolidation.
Santa AnaPoor economic and market conditions. Resource to conduct public outreach. Environmental analysis and land use plan development is barrier to changing land use designation to all residential/mixed use infill development.
Santa Barbara Traffic impacts, Community concern over size, height, and sale of projects.
Santa Clara CountyLimited available land supply. Some neighborhood opposition to infill subdivision, but not of such degree as to result in denial.
Santa CruzConflicts with neighbors over scale and density of infill development. Many potential infill sites are adjacent to less dense residential areas.
Santa Cruz County
1. Market/economy issues. 2. Parcels need to be assembled in many cases, particularly for commercial use. 3. Many parcels have physical contraints, such as protected natural resources and steep slopes. 4. Regulatory constraints, such as lack of a mixed use ordinance and flexible, form based code.
Santa PaulaApplicants request several exceptions to the City development standards, such as common open space and parking reductions.
SeasideAvailability of water; off-street parking facilities; City has been built out with many smaller non-conforming lots that makes consolidation difficult; relocation of existing businesses and residences.

Annual Planning Survey Results 2012 245
Appendix C: Housing, Density, and Infill
JuRisdictiOn BARRieRs
Signal HillBrownfield concerns; proximity to active and abandoned oil wells; proximity to earthquake faults
Simi Valley Developer demand and market constraints
Solano County Lack of infrastructure
Sonoma Neighbor objections.
Sonora The current economy is not a climate for new residential construction
South Gate
We are essentially built out. Population density of approximately 13,000 people per square mile. Lot consolidation in existing neighborhoods is difficult due to small lot residential development, narrow streets and constrained infrastructure. New General Plan provides for conversion of industrial and commercial properties along major corridors and intersection into sustainable development, TOD's, Districts and Villages with density ranging from 40 to over 100 du's per acre. City's financial resources are very limited. Many properties are contaminated.
Stanislaus County Infrastructure availablility
Stockton Greenfield development is perceived to be easier and more profitable.
Sunnyvale All development in Sunnyvale is infill.
Sutter County Adequate public water and sewage disposal
Sutter Creek In-fill projects have not been submitted in a number of years....economy issues.
Taft Money
Tehachapi Infill areas not necessary where developers want to develop.
Tehama County The ability to finance large sewage treatment facilities in a rural setting.
Thousand OaksSite constraints and economics are primary barriers, including steep terrain, flood hazards, protected trees, existing structures and infrastructure costs. The new State MS4 permit requirements are also expected to add a significant barrier to infill projects.
Tiburon Economic considerations- finding willing developers is difficult in this economic climate.
TorranceFor CEQA non-exempt projects: traffic and air quality mitigation are the primary barriers. For CEQA projects, potential barriers include public opposition for discretionary projects, access to required parking, and public infrastructure improvements required of a project.
TracyLot consolidation, soils and groundwater contamination, ownership (railroad and energy company property), basic sewer, storm drain, and water line upgrade costs are too expensive for smaller projects.
Trinidad Being a very small town in a rural area, most of these issues do not apply.
Trinity County Lack of funding and staff
Truckee
There has been a community shift in the definition of in-fill. The focus is now on constructing new projects Downtown and rehabilitating older existing shopping centers versus building new neighborhood center nodes in fringe subdivisions. Also, the development community has little access to funding at this time, so there was no new commercial construction starts in 2010.
Turlock Neighborhood opposition to increased traffic and noise.
Union City
Need for infrastructure upgrades and no funds to pay for them. Clean-up of existing sites that are contaminated. Unusual size and shape of infill lots. Existing traffic issues including LOS D or E on surrounding roads. Lack of Market. In TOD areas, rate of return not high enough to privately finance high density.
Ventura County Infrastructure deficiencies.
Visalia Property owner participation, and financing
Vista Willing property owners, lot consolidation, street improvement requirements
Walnut Economic conditions, fragmented ownership, redevelopment fund uncertainty
Walnut Creek1. Depressed economy; 2. High land costs; 3. High construction costs; 4. New BAAQMD air quality standards.

246 Annual Planning Survey Results 2012
Appendix C: Housing, Density, and Infill
JuRisdictiOn BARRieRs
Wasco CEQA
West Sacramento Inadequate utility infrastructure
Westminster The economy
WillitsDepends on type of project. Emergency shelters and affordable housing projects have met with neighbor opposition. Constraints with City water supply and processing and delivery system preclude large-scale development at this time.
Willows
The city did not have zoning to allow SRO's or transitional and supportive housing. The city did not have a formal process for streamlining the permit review process for persons with disabilities to make a reasonable accomodation request. These are now in place with the newly updated housing element.
Windsor Water availability and bad economic times.
Winters The current economy
Yolo County
The high cost of developing houses in rural communities (e.g., roads, sewer, water, utility, etc.) have made infill projects uncompetitive with nearby larger urban areas. There is no demand for new construction in small towns as a result. Without population growth, attracting new business development within existing downtown areas is difficult.
Yorba LindaAs the City is reaching built out, there are opportunities for infill projects. There is no one primary barrier.
Yountville Market downturn has damped infill residential and commercial activity.
Yucca Valley
The Town has no barriers to infill projects based on fact that single family residential development requires no architectural review other than the standard Building & Safety process; Per square foot residential valuation remains $55.18 per square foot for living area which is still lower than the actual construction costs at this time. Standard building plans are reviewed within ten business days. Engineered plans may take up to 15 business days to review and the Town Council has waived Development Impact Fees for all new Infill Single Family Residences.
Annual Planning Survey Results 2012 247
Appendix D: Emergency Shelters (SB 2) and Special Needs
For all Appendices, the column headings in the dark blue colors were choices provided in the questions of the Annual Planning Survey. Column headings highlighted in light blue were responses provided by survey respondents.
Appendix D:Emergency
Shelters (SB 2) and Special Needs

248 Annual Planning Survey Results 2012
Appendix D: Emergency Shelters (SB 2) and Special Needs
Page intentionally left blank
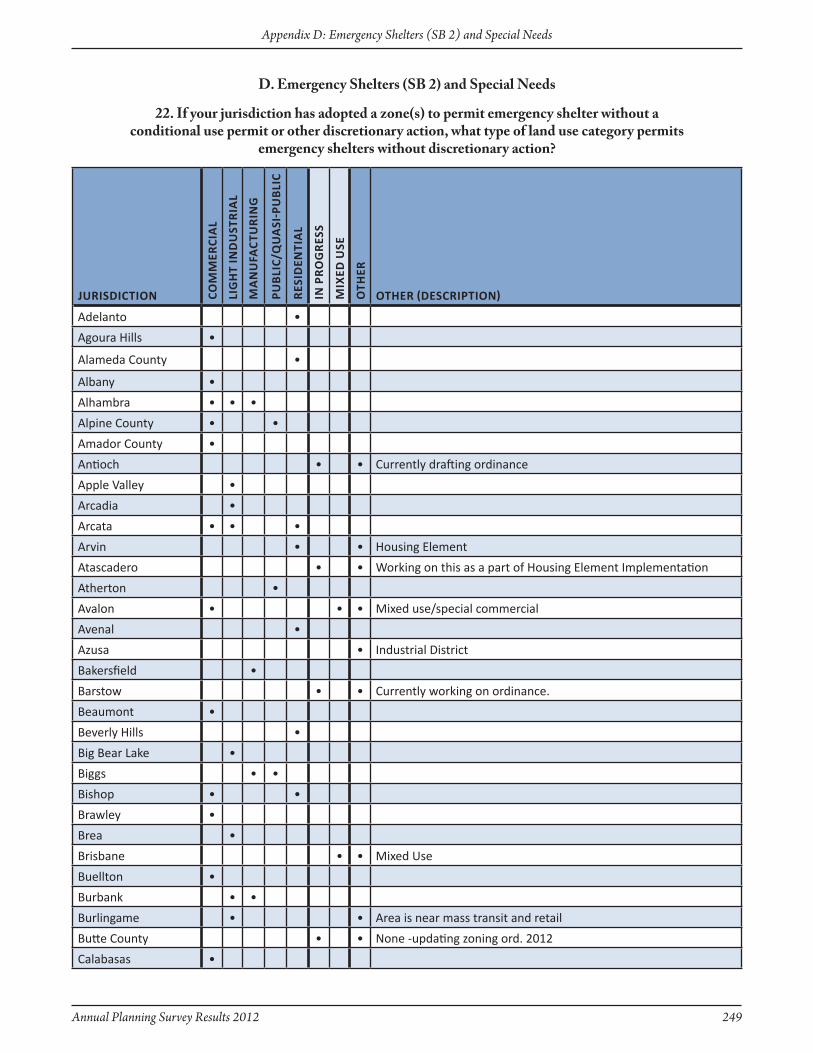
Annual Planning Survey Results 2012 249
Appendix D: Emergency Shelters (SB 2) and Special Needs
JuRisdictiOn cOM
MeR
ciA
l
liG
ht
ind
ust
RiA
l
MA
nu
fAct
uR
inG
PuB
lic/
Qu
Asi
-Pu
Bli
c
Res
iden
tiA
l
in P
RO
GR
ess
Mix
ed u
se
Oth
eR
OtheR (descRiPtiOn)
Adelanto •
Agoura Hills •
Alameda County •
Albany •
Alhambra • • •
Alpine County • •
Amador County •
Antioch • • Currently drafting ordinance
Apple Valley •
Arcadia •
Arcata • • •
Arvin • • Housing Element
Atascadero • • Working on this as a part of Housing Element Implementation
Atherton •
Avalon • • • Mixed use/special commercial
Avenal •
Azusa • Industrial District
Bakersfield •
Barstow • • Currently working on ordinance.
Beaumont •
Beverly Hills •
Big Bear Lake •
Biggs • •
Bishop • •
Brawley •
Brea •
Brisbane • • Mixed Use
Buellton •
Burbank • •
Burlingame • • Area is near mass transit and retail
Butte County • • None -updating zoning ord. 2012
Calabasas •
22. If your jurisdiction has adopted a zone(s) to permit emergency shelter without aconditional use permit or other discretionary action, what type of land use category permits
emergency shelters without discretionary action?
D. Emergency Shelters (SB 2) and Special Needs
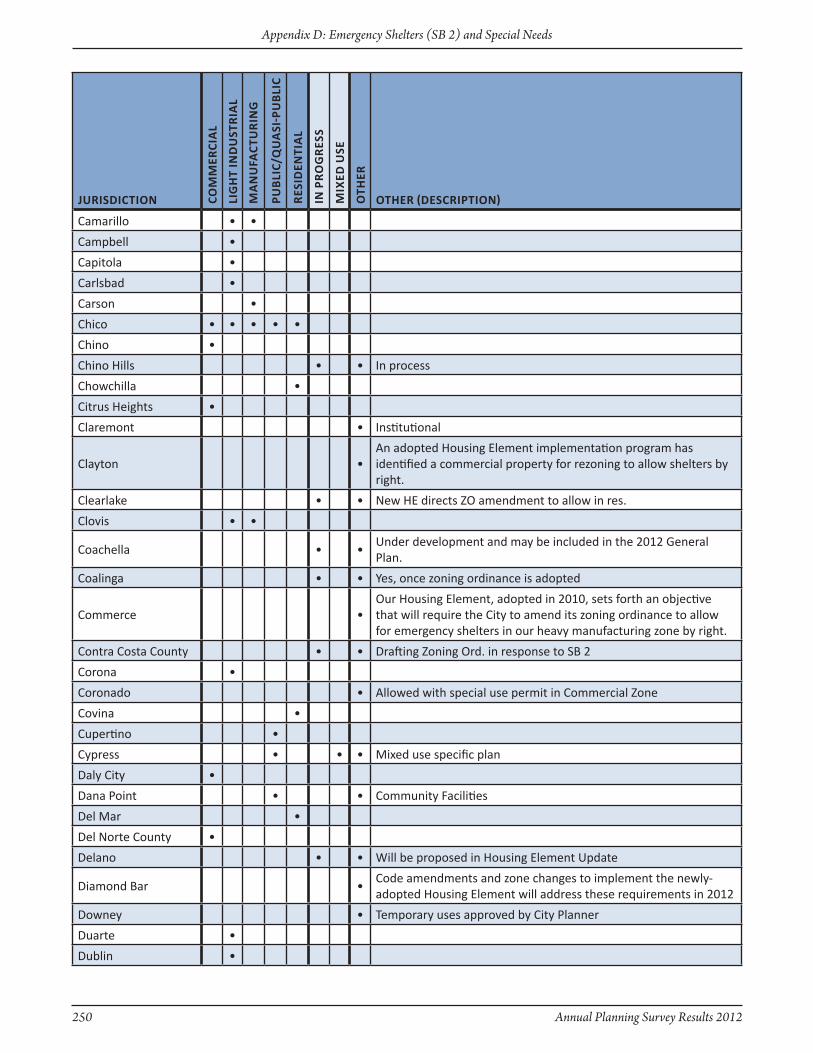
250 Annual Planning Survey Results 2012
Appendix D: Emergency Shelters (SB 2) and Special Needs
JuRisdictiOn cOM
MeR
ciA
l
liG
ht
ind
ust
RiA
l
MA
nu
fAct
uR
inG
PuB
lic/
Qu
Asi
-Pu
Bli
c
Res
iden
tiA
l
in P
RO
GR
ess
Mix
ed u
se
Oth
eR
OtheR (descRiPtiOn)
Camarillo • •
Campbell •
Capitola •
Carlsbad •
Carson •
Chico • • • • •
Chino •
Chino Hills • • In process
Chowchilla •
Citrus Heights •
Claremont • Institutional
Clayton •An adopted Housing Element implementation program has identified a commercial property for rezoning to allow shelters by right.
Clearlake • • New HE directs zO amendment to allow in res.
Clovis • •
Coachella • •Under development and may be included in the 2012 General Plan.
Coalinga • • Yes, once zoning ordinance is adopted
Commerce •Our Housing Element, adopted in 2010, sets forth an objective that will require the City to amend its zoning ordinance to allow for emergency shelters in our heavy manufacturing zone by right.
Contra Costa County • • Drafting zoning Ord. in response to SB 2
Corona •
Coronado • Allowed with special use permit in Commercial zone
Covina •
Cupertino •
Cypress • • • Mixed use specific plan
Daly City •
Dana Point • • Community Facilities
Del Mar •
Del Norte County •
Delano • • Will be proposed in Housing Element Update
Diamond Bar •Code amendments and zone changes to implement the newly-adopted Housing Element will address these requirements in 2012
Downey • Temporary uses approved by City Planner
Duarte •
Dublin •
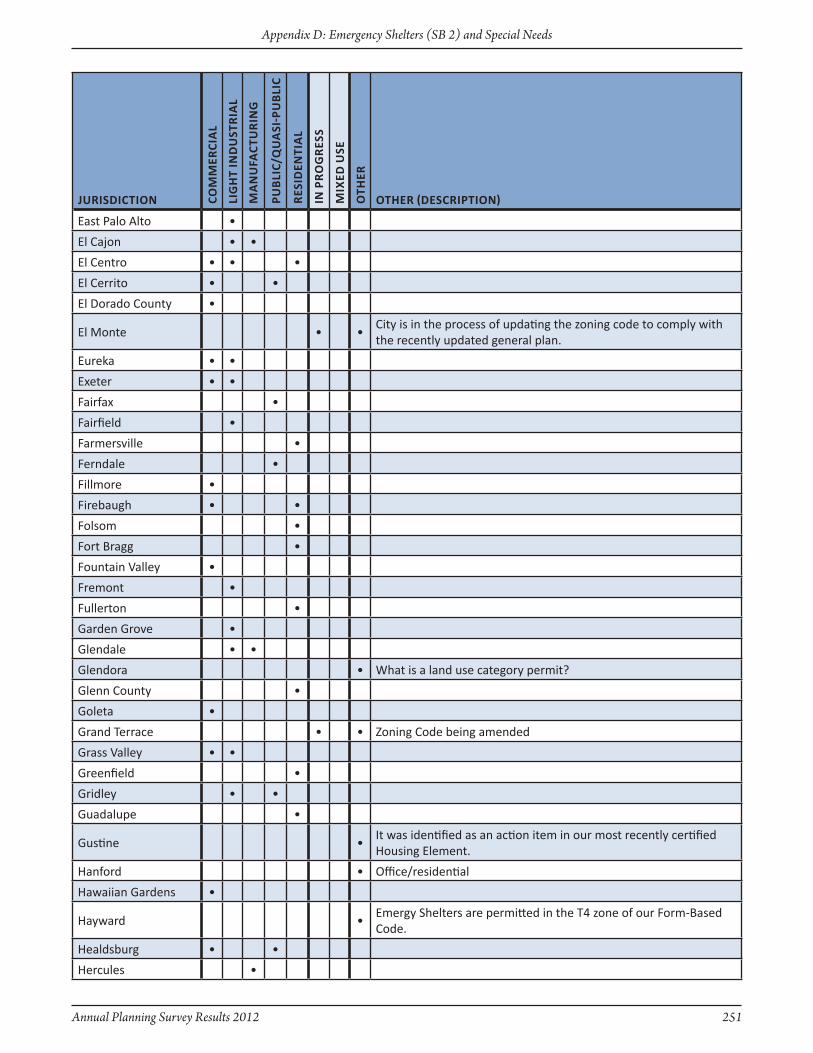
Annual Planning Survey Results 2012 251
Appendix D: Emergency Shelters (SB 2) and Special Needs
JuRisdictiOn cOM
MeR
ciA
l
liG
ht
ind
ust
RiA
l
MA
nu
fAct
uR
inG
PuB
lic/
Qu
Asi
-Pu
Bli
c
Res
iden
tiA
l
in P
RO
GR
ess
Mix
ed u
se
Oth
eR
OtheR (descRiPtiOn)
East Palo Alto •
El Cajon • •
El Centro • • •
El Cerrito • •
El Dorado County •
El Monte • •City is in the process of updating the zoning code to comply with the recently updated general plan.
Eureka • •
Exeter • •
Fairfax •
Fairfield •
Farmersville •
Ferndale •
Fillmore •
Firebaugh • •
Folsom •
Fort Bragg •
Fountain Valley •
Fremont •
Fullerton •
Garden Grove •
Glendale • •
Glendora • What is a land use category permit?
Glenn County •
Goleta •
Grand Terrace • • zoning Code being amended
Grass Valley • •
Greenfield •
Gridley • •
Guadalupe •
Gustine •It was identified as an action item in our most recently certified Housing Element.
Hanford • Office/residential
Hawaiian Gardens •
Hayward •Emergy Shelters are permitted in the T4 zone of our Form-Based Code.
Healdsburg • •
Hercules •

252 Annual Planning Survey Results 2012
Appendix D: Emergency Shelters (SB 2) and Special Needs
JuRisdictiOn cOM
MeR
ciA
l
liG
ht
ind
ust
RiA
l
MA
nu
fAct
uR
inG
PuB
lic/
Qu
Asi
-Pu
Bli
c
Res
iden
tiA
l
in P
RO
GR
ess
Mix
ed u
se
Oth
eR
OtheR (descRiPtiOn)
Hesperia • • Medium density residential and mixed use
Highland •
Hillsborough • •
Hollister • At discretion of emergency response staff
Holtville •
Hughson •
Humboldt County • • • •
Huntington Beach • • •
Huntington Park • •
Huron •
Indio •
Inglewood • • • • •Allowed without discretionary review in the above zones for facilities with 6 or fewer people
Inyo County • •
Ione • • Heavy Industrial
Irvine • • • Multi-use, Medical and Science, Institutional
Irwindale •
Kern County •
La Habra •
La Mesa • •
La Mirada •
La Palma • •Currently working on a zoning Code Text Amendment to allow them by right.
La Puente • •
Laguna Hills • • Preparing an ordinance to allow in mixed use zoning district
Laguna Niguel • • • •
Laguna Woods •
Lakeport • C-3 Service Commercial District
Lakewood •
Larkspur • • In progress-Administrative and Professional Offices
Lassen County • Housing Element, C-T and C-R District
Lawndale • • We are working on it
Lemoore •
Lincoln •
Live Oak •
Livingston • • Downtown Commercial (DTC)
Lodi • • •

Annual Planning Survey Results 2012 253
Appendix D: Emergency Shelters (SB 2) and Special Needs
JuRisdictiOn cOM
MeR
ciA
l
liG
ht
ind
ust
RiA
l
MA
nu
fAct
uR
inG
PuB
lic/
Qu
Asi
-Pu
Bli
c
Res
iden
tiA
l
in P
RO
GR
ess
Mix
ed u
se
Oth
eR
OtheR (descRiPtiOn)
Lompoc • Emergency Shelter Overlay based on unmet need.
Los Altos •
Los Altos Hills • •Will be amending the zoning Ordinance per Housing Element program
Los Angeles • •
Los Banos •
Madera •
Manteca •
Marin County •
Marina • • • Mixed Use
Mariposa County • •
Maywood •
Mendocino County • • Multi-family Residential
Merced •
Millbrae •
Mission Viejo •
Modesto • •
Montclair • •We will be adopting such zones as part of our Housing Element update
Monte Sereno •
Monterey County • • • Mixed Use
Monterey Park •
Moorpark •
Moreno Valley •
Morgan Hill •
Morro Bay • • Proposed in zoning Ordinance currently in development
Mount Shasta • R-3 multi-family and offices
Murrieta • Evaluation per Housing Element Policy
Napa •
National City •
Nevada City •
Nevada County • •
Newark •
Newman •
Newport Beach • • Open Space
Norco •
Novato • • Not now, but will as part of Housing Element update
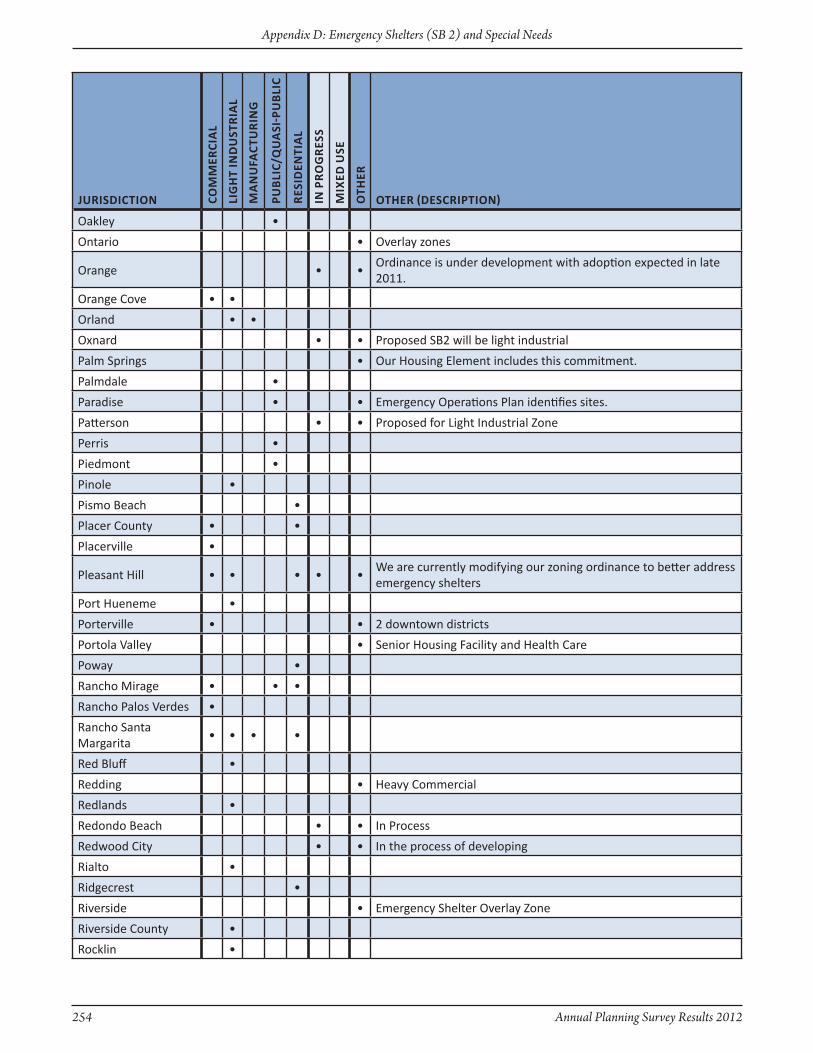
254 Annual Planning Survey Results 2012
Appendix D: Emergency Shelters (SB 2) and Special Needs
JuRisdictiOn cOM
MeR
ciA
l
liG
ht
ind
ust
RiA
l
MA
nu
fAct
uR
inG
PuB
lic/
Qu
Asi
-Pu
Bli
c
Res
iden
tiA
l
in P
RO
GR
ess
Mix
ed u
se
Oth
eR
OtheR (descRiPtiOn)
Oakley •
Ontario • Overlay zones
Orange • •Ordinance is under development with adoption expected in late 2011.
Orange Cove • •
Orland • •
Oxnard • • Proposed SB2 will be light industrial
Palm Springs • Our Housing Element includes this commitment.
Palmdale •
Paradise • • Emergency Operations Plan identifies sites.
Patterson • • Proposed for Light Industrial zone
Perris •
Piedmont •
Pinole •
Pismo Beach •
Placer County • •
Placerville •
Pleasant Hill • • • • •We are currently modifying our zoning ordinance to better address emergency shelters
Port Hueneme •
Porterville • • 2 downtown districts
Portola Valley • Senior Housing Facility and Health Care
Poway •
Rancho Mirage • • •
Rancho Palos Verdes •
Rancho Santa Margarita
• • • •
Red Bluff •
Redding • Heavy Commercial
Redlands •
Redondo Beach • • In Process
Redwood City • • In the process of developing
Rialto •
Ridgecrest •
Riverside • Emergency Shelter Overlay zone
Riverside County •
Rocklin •

Annual Planning Survey Results 2012 255
Appendix D: Emergency Shelters (SB 2) and Special Needs
JuRisdictiOn cOM
MeR
ciA
l
liG
ht
ind
ust
RiA
l
MA
nu
fAct
uR
inG
PuB
lic/
Qu
Asi
-Pu
Bli
c
Res
iden
tiA
l
in P
RO
GR
ess
Mix
ed u
se
Oth
eR
OtheR (descRiPtiOn)
Rosemead • •The City is in the process of completing a zoning code update to address this matter.
Roseville • •
Ross •
Sacramento County •
Salinas • • • MAF - Will be amending Code
San Anselmo • • In the Draft Housing Element
San Bruno • TOD zone
San Carlos • • Mixed Use
San Diego •Emergency shelters are exempt when accessory to a church or religious organization. Churches are permitted by right in multi-dwelling residential and light industrial zones.
San Diego County •
San Dimas •
San Fernando • • In progress of developing ordinance
San Gabriel •
San Juan Capistrano • • Ordinance pending
San Leandro •
San Luis Obispo •
San Luis Obispo County
• • •
San Mateo •
San Pablo • •
San Rafael •
Sand City •
Santa Barbara •
Santa Clara County •
Santa Cruz • • • SB2 compliance zoning is scheduled for November 2011
Santa Cruz County •
Santa Monica • • • •
Santa Rosa •
Santee • General Industrial
Saratoga •
Seaside •
Sebastopol •
Signal Hill •
Simi Valley • • •
Soledad •
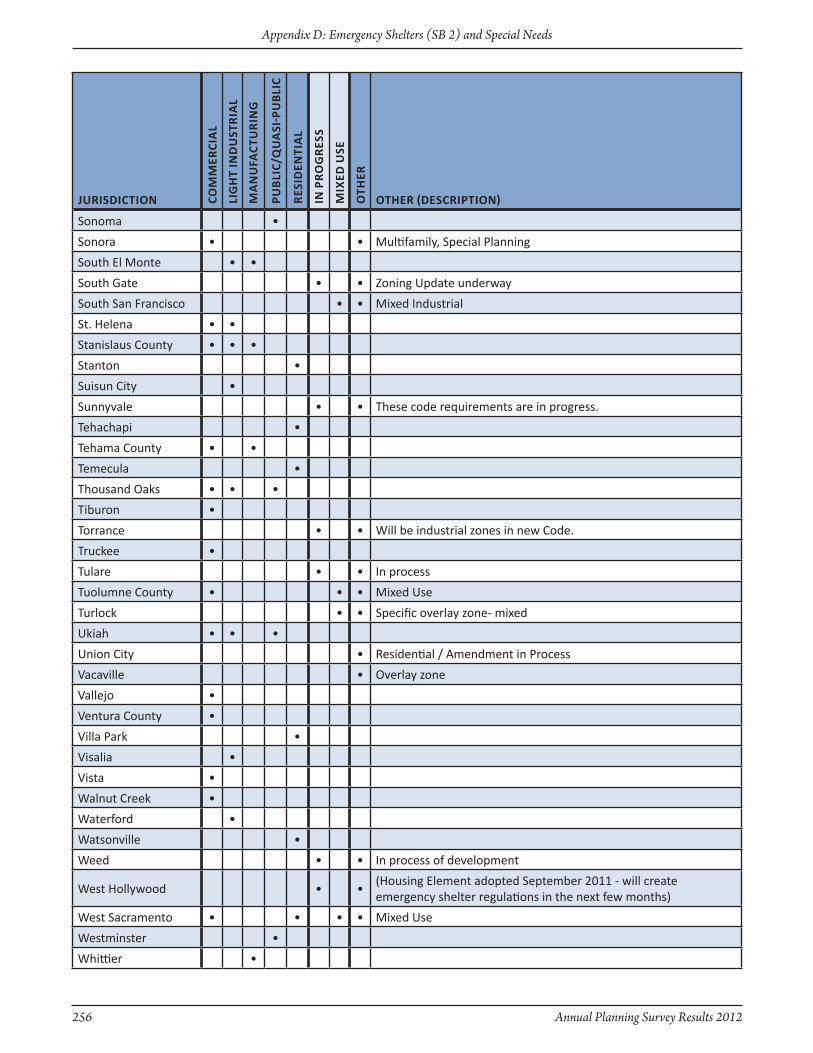
256 Annual Planning Survey Results 2012
Appendix D: Emergency Shelters (SB 2) and Special Needs
JuRisdictiOn cOM
MeR
ciA
l
liG
ht
ind
ust
RiA
l
MA
nu
fAct
uR
inG
PuB
lic/
Qu
Asi
-Pu
Bli
c
Res
iden
tiA
l
in P
RO
GR
ess
Mix
ed u
se
Oth
eR
OtheR (descRiPtiOn)
Sonoma •
Sonora • • Multifamily, Special Planning
South El Monte • •
South Gate • • zoning Update underway
South San Francisco • • Mixed Industrial
St. Helena • •
Stanislaus County • • •
Stanton •
Suisun City •
Sunnyvale • • These code requirements are in progress.
Tehachapi •
Tehama County • •
Temecula •
Thousand Oaks • • •
Tiburon •
Torrance • • Will be industrial zones in new Code.
Truckee •
Tulare • • In process
Tuolumne County • • • Mixed Use
Turlock • • Specific overlay zone- mixed
Ukiah • • •
Union City • Residential / Amendment in Process
Vacaville • Overlay zone
Vallejo •
Ventura County •
Villa Park •
Visalia •
Vista •
Walnut Creek •
Waterford •
Watsonville •
Weed • • In process of development
West Hollywood • •(Housing Element adopted September 2011 - will create emergency shelter regulations in the next few months)
West Sacramento • • • • Mixed Use
Westminster •
Whittier •
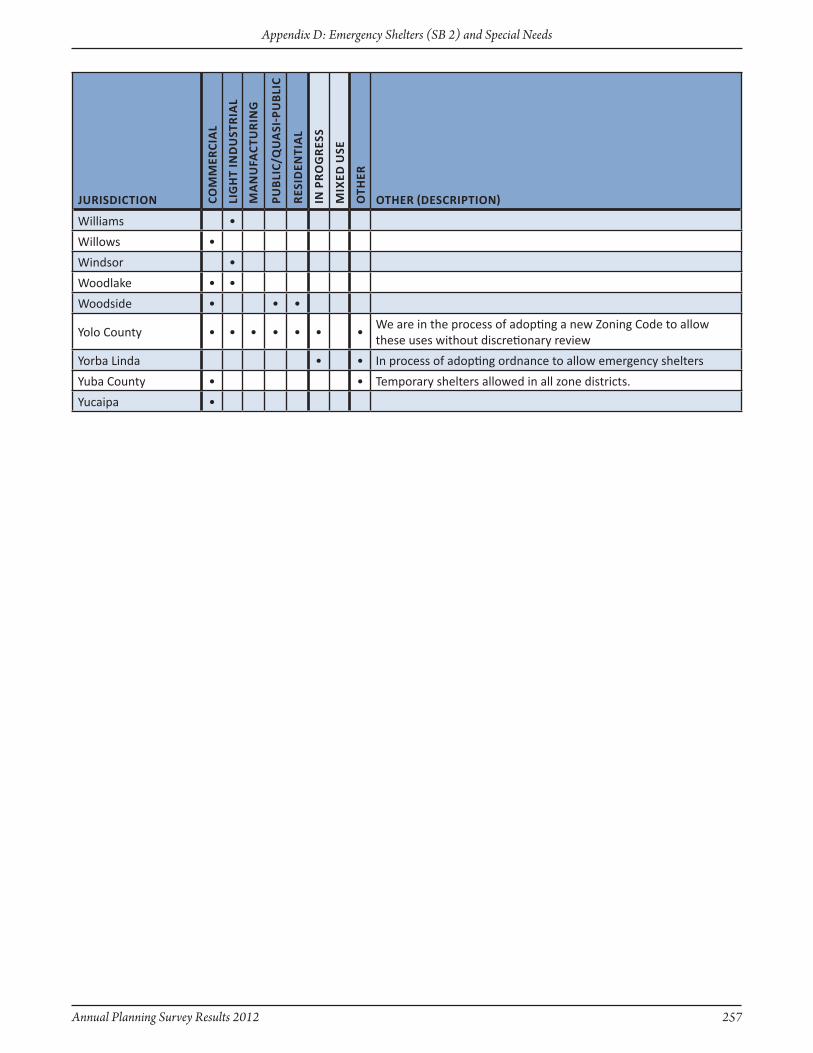
Annual Planning Survey Results 2012 257
Appendix D: Emergency Shelters (SB 2) and Special Needs
JuRisdictiOn cOM
MeR
ciA
l
liG
ht
ind
ust
RiA
l
MA
nu
fAct
uR
inG
PuB
lic/
Qu
Asi
-Pu
Bli
c
Res
iden
tiA
l
in P
RO
GR
ess
Mix
ed u
se
Oth
eR
OtheR (descRiPtiOn)
Williams •
Willows •
Windsor •
Woodlake • •
Woodside • • •
Yolo County • • • • • • •We are in the process of adopting a new zoning Code to allow these uses without discretionary review
Yorba Linda • • In process of adopting ordnance to allow emergency shelters
Yuba County • • Temporary shelters allowed in all zone districts.
Yucaipa •

258 Annual Planning Survey Results 2012
Appendix D: Emergency Shelters (SB 2) and Special Needs
Alameda CountyAlbanyAlhambraAndersonAngels CampApple ValleyArcadiaArroyo GrandeArtesiaAvalonBellBell GardensBellflowerBeniciaBig Bear LakeBiggsBishopBlytheButte CountyCalaveras CountyCalifornia CityCampbellCeresChino Hills*ChowchillaClearlakeClovisCoachellaCoalingaContra Costa CountyCovinaCupertinoDana PointDel Norte CountyDel Rey OaksDesert Hot SpringsDorrisDos PalosEl CajonEl CentroEncinitasFairfieldFillmoreFort Jones
Foster CityFullertonGardenaGlendoraGoletaGonzalesGrass ValleyHemetHerculesHuronInyo CountyLa Cañada FlintridgeLa Habra HeightsLa MiradaLa PalmaLa QuintaLa VerneLaguna HillsLaguna WoodsLassen CountyLawndaleLivingstonLodiLos Angeles CountyLos GatosLynwoodMalibuManhattan BeachMaywoodMenlo ParkMontagueMontereyMonterey ParkMurrietaNevada CityNorcoNovatoOakleyOceansideOjaiOrlandOrovillePacificaPalm Desert
Palm SpringsPalo AltoParamountParlierPerrisPlacervillePortolaRancho MirageRancho Santa MargaritaRed BluffRedondo BeachReedleyRialtoRosemeadRossSan BernardinoSan FranciscoSan JoaquinSan Joaquin CountySan MarinoSan RamonSeal BeachSierra CountySolana BeachSouth El MonteStanislaus CountySutter CreekTaftTehamaTorranceTrinidadTulare CountyTuolumne CountyUkiahVilla ParkWascoWaterfordWestmorlandWhittierWilliamsYorba LindaYucaipaYucca Valley
* City of Chino Hills:“Yes for Major and No for Minor”
23. Does your jurisdiction require Planning Commission or City Council approval for granting reasonable accommodation in zoning and land use?
The following is a list of jurisdictions that require Planning Commission or City Council approval for granting reasonable accommodation in zoning and land use.
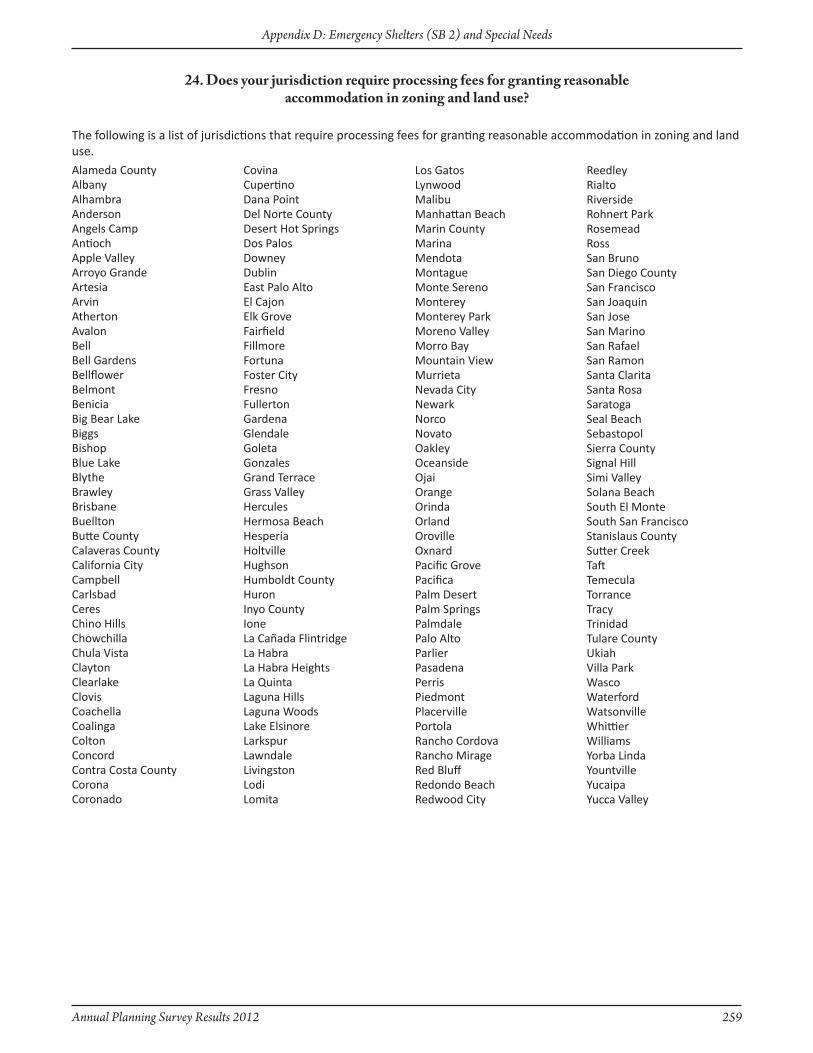
Annual Planning Survey Results 2012 259
Appendix D: Emergency Shelters (SB 2) and Special Needs
Alameda CountyAlbanyAlhambraAndersonAngels CampAntiochApple ValleyArroyo GrandeArtesiaArvinAthertonAvalonBellBell GardensBellflowerBelmontBeniciaBig Bear LakeBiggsBishopBlue LakeBlytheBrawleyBrisbaneBuelltonButte CountyCalaveras CountyCalifornia CityCampbellCarlsbadCeresChino HillsChowchillaChula VistaClaytonClearlakeClovisCoachellaCoalingaColtonConcordContra Costa CountyCoronaCoronado
CovinaCupertinoDana PointDel Norte CountyDesert Hot SpringsDos PalosDowneyDublinEast Palo AltoEl CajonElk GroveFairfieldFillmoreFortunaFoster CityFresnoFullertonGardenaGlendaleGoletaGonzalesGrand TerraceGrass ValleyHerculesHermosa BeachHesperiaHoltvilleHughsonHumboldt CountyHuronInyo CountyIoneLa Cañada FlintridgeLa HabraLa Habra HeightsLa QuintaLaguna HillsLaguna WoodsLake ElsinoreLarkspurLawndaleLivingstonLodiLomita
Los GatosLynwoodMalibuManhattan BeachMarin CountyMarinaMendotaMontagueMonte SerenoMontereyMonterey ParkMoreno ValleyMorro BayMountain ViewMurrietaNevada CityNewarkNorcoNovatoOakleyOceansideOjaiOrangeOrindaOrlandOrovilleOxnardPacific GrovePacificaPalm DesertPalm SpringsPalmdalePalo AltoParlierPasadenaPerrisPiedmontPlacervillePortolaRancho CordovaRancho MirageRed BluffRedondo BeachRedwood City
ReedleyRialtoRiversideRohnert ParkRosemeadRossSan BrunoSan Diego CountySan FranciscoSan JoaquinSan JoseSan MarinoSan RafaelSan RamonSanta ClaritaSanta RosaSaratogaSeal BeachSebastopolSierra CountySignal HillSimi ValleySolana BeachSouth El MonteSouth San FranciscoStanislaus CountySutter CreekTaftTemeculaTorranceTracyTrinidadTulare CountyUkiahVilla ParkWascoWaterfordWatsonvilleWhittierWilliamsYorba LindaYountvilleYucaipaYucca Valley
24. Does your jurisdiction require processing fees for granting reasonableaccommodation in zoning and land use?
The following is a list of jurisdictions that require processing fees for granting reasonable accommodation in zoning and land use.

260 Annual Planning Survey Results 2012
Appendix D: Emergency Shelters (SB 2) and Special Needs
Page intentionally left blank
Annual Planning Survey Results 2012 261
Appendix E: Conservation of Agricultural Land
For all Appendices, the column headings in the dark blue colors were choices provided in the questions of the Annual Planning Survey. Column headings highlighted in light blue were responses provided by survey respondents.
Appendix E:Conservation
of Agricultural Land
262 Annual Planning Survey Results 2012
Appendix E: Conservation of Agricultural Land
Page intentionally left blank
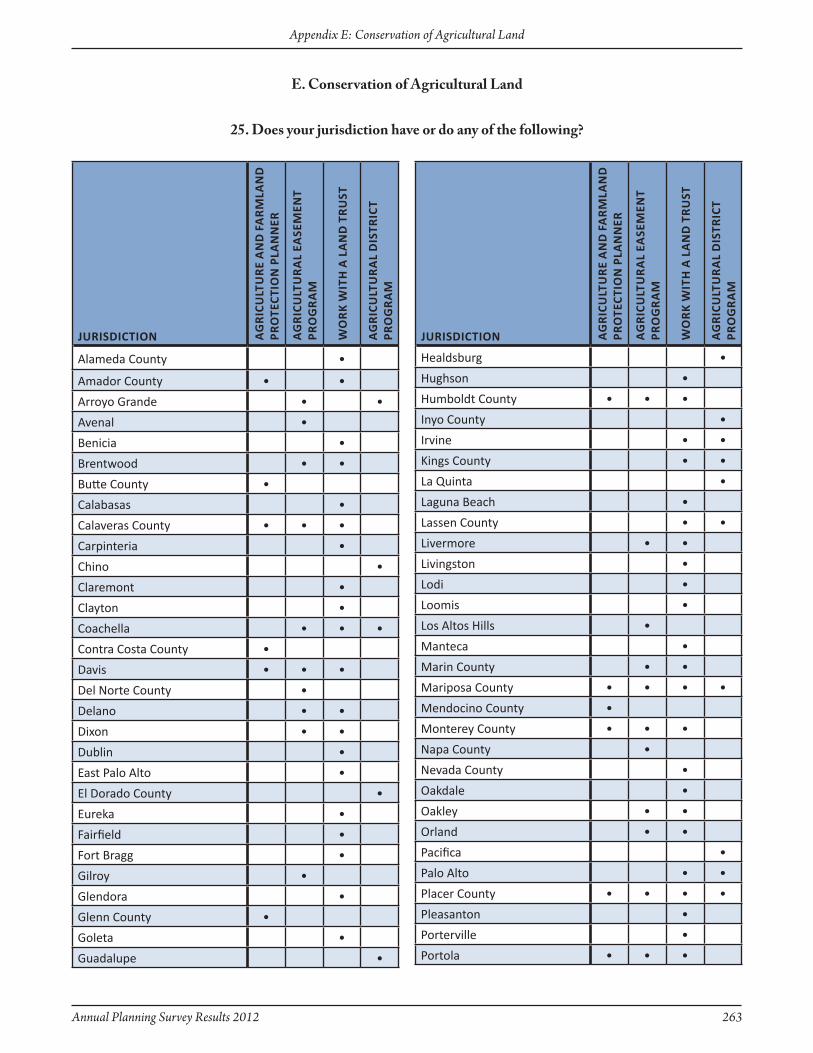
Annual Planning Survey Results 2012 263
Appendix E: Conservation of Agricultural Land
JuRisdictiOn AG
Ric
ult
uR
e A
nd
fA
RM
lAn
d
PRO
tect
iOn
PlA
nn
eR
AG
Ric
ult
uR
Al
eAse
Men
t PR
OG
RA
M
WO
Rk
Wit
h A
lA
nd
tR
ust
AG
Ric
ult
uR
Al
dis
tRic
t PR
OG
RA
M
Alameda County •
Amador County • •
Arroyo Grande • •
Avenal •
Benicia •
Brentwood • •
Butte County •
Calabasas •
Calaveras County • • •
Carpinteria •
Chino •
Claremont •
Clayton •
Coachella • • •
Contra Costa County •
Davis • • •
Del Norte County •
Delano • •
Dixon • •
Dublin •
East Palo Alto •
El Dorado County •
Eureka •
Fairfield •
Fort Bragg •
Gilroy •
Glendora •
Glenn County •
Goleta •
Guadalupe •
JuRisdictiOn AG
Ric
ult
uR
e A
nd
fA
RM
lAn
d
PRO
tect
iOn
PlA
nn
eR
AG
Ric
ult
uR
Al
eAse
Men
t PR
OG
RA
M
WO
Rk
Wit
h A
lA
nd
tR
ust
AG
Ric
ult
uR
Al
dis
tRic
t PR
OG
RA
M
Healdsburg •
Hughson •
Humboldt County • • •
Inyo County •
Irvine • •
Kings County • •
La Quinta •
Laguna Beach •
Lassen County • •
Livermore • •
Livingston •
Lodi •
Loomis •
Los Altos Hills •
Manteca •
Marin County • •
Mariposa County • • • •
Mendocino County •
Monterey County • • •
Napa County •
Nevada County •
Oakdale •
Oakley • •
Orland • •
Pacifica •
Palo Alto • •
Placer County • • • •
Pleasanton •
Porterville •
Portola • • •
25. Does your jurisdiction have or do any of the following?
E. Conservation of Agricultural Land
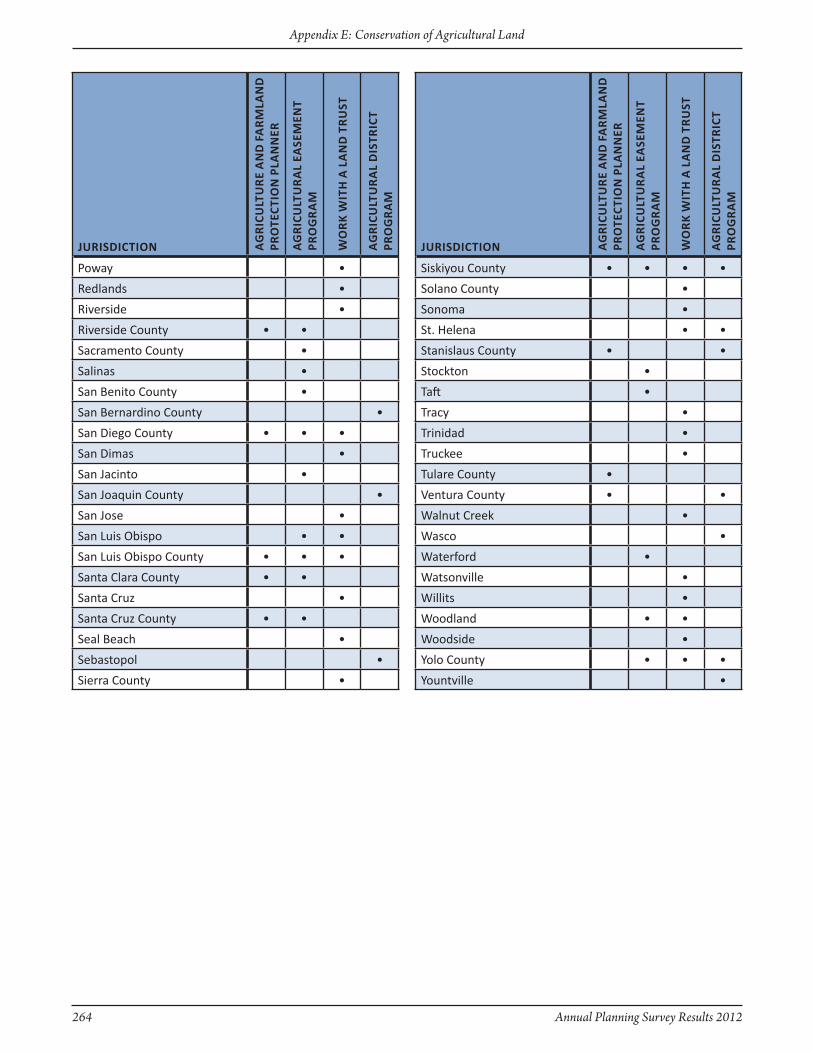
264 Annual Planning Survey Results 2012
Appendix E: Conservation of Agricultural Land
JuRisdictiOn AG
Ric
ult
uR
e A
nd
fA
RM
lAn
d
PRO
tect
iOn
PlA
nn
eR
AG
Ric
ult
uR
Al
eAse
Men
t PR
OG
RA
M
WO
Rk
Wit
h A
lA
nd
tR
ust
AG
Ric
ult
uR
Al
dis
tRic
t PR
OG
RA
M
Poway •
Redlands •
Riverside •
Riverside County • •
Sacramento County •
Salinas •
San Benito County •
San Bernardino County •
San Diego County • • •
San Dimas •
San Jacinto •
San Joaquin County •
San Jose •
San Luis Obispo • •
San Luis Obispo County • • •
Santa Clara County • •
Santa Cruz •
Santa Cruz County • •
Seal Beach •
Sebastopol •
Sierra County •
JuRisdictiOn AG
Ric
ult
uR
e A
nd
fA
RM
lAn
d
PRO
tect
iOn
PlA
nn
eR
AG
Ric
ult
uR
Al
eAse
Men
t PR
OG
RA
M
WO
Rk
Wit
h A
lA
nd
tR
ust
AG
Ric
ult
uR
Al
dis
tRic
t PR
OG
RA
M
Siskiyou County • • • •
Solano County •
Sonoma •
St. Helena • •
Stanislaus County • •
Stockton •
Taft •
Tracy •
Trinidad •
Truckee •
Tulare County •
Ventura County • •
Walnut Creek •
Wasco •
Waterford •
Watsonville •
Willits •
Woodland • •
Woodside •
Yolo County • • •
Yountville •
Annual Planning Survey Results 2012 265
Appendix F: Solar Energy Development
For all Appendices, the column headings in the dark blue colors were choices provided in the questions of the Annual Planning Survey. Column headings highlighted in light blue were responses provided by survey respondents.
Appendix F:Solar Energy Development

266 Annual Planning Survey Results 2012
Appendix F: Solar Energy Development
Page intentionally left blank
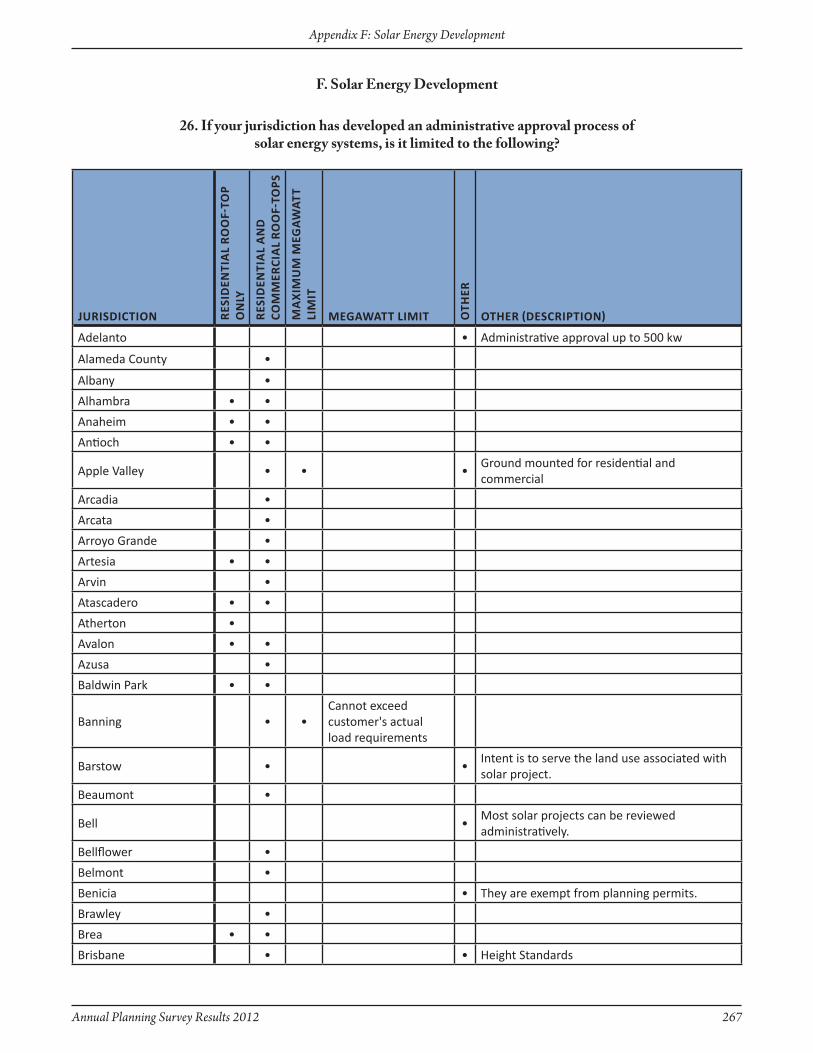
Annual Planning Survey Results 2012 267
Appendix F: Solar Energy Development
F. Solar Energy Development
JuRisdictiOn Res
iden
tiA
l R
OO
f-tO
P o
nly
Res
iden
tiA
l A
nd
cO
MM
eRci
Al
RO
Of-
tOPs
MA
xiM
uM
MeG
AW
Att
liM
itMeGAWAtt liMit O
theR
OtheR (descRiPtiOn)
Adelanto • Administrative approval up to 500 kw
Alameda County •
Albany •
Alhambra • •
Anaheim • •
Antioch • •
Apple Valley • • •Ground mounted for residential and commercial
Arcadia •
Arcata •
Arroyo Grande •
Artesia • •
Arvin •
Atascadero • •
Atherton •
Avalon • •
Azusa •
Baldwin Park • •
Banning • •Cannot exceed customer's actual load requirements
Barstow • •Intent is to serve the land use associated with solar project.
Beaumont •
Bell •Most solar projects can be reviewed administratively.
Bellflower •
Belmont •
Benicia • They are exempt from planning permits.
Brawley •
Brea • •
Brisbane • • Height Standards
26. If your jurisdiction has developed an administrative approval process ofsolar energy systems, is it limited to the following?
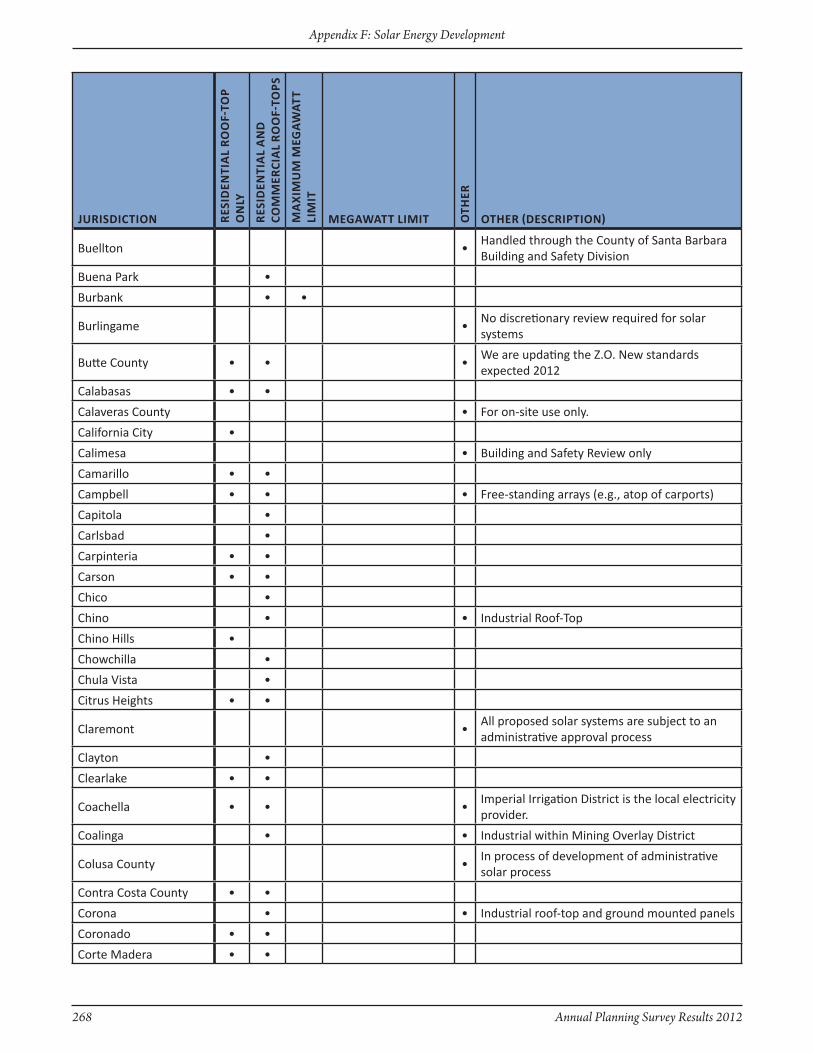
268 Annual Planning Survey Results 2012
Appendix F: Solar Energy Development
JuRisdictiOn Res
iden
tiA
l R
OO
f-tO
P o
nly
Res
iden
tiA
l A
nd
cO
MM
eRci
Al
RO
Of-
tOPs
MA
xiM
uM
MeG
AW
Att
liM
it
MeGAWAtt liMit Oth
eR
OtheR (descRiPtiOn)
Buellton •Handled through the County of Santa Barbara Building and Safety Division
Buena Park •
Burbank • •
Burlingame •No discretionary review required for solar systems
Butte County • • •We are updating the z.O. New standards expected 2012
Calabasas • •
Calaveras County • For on-site use only.
California City •
Calimesa • Building and Safety Review only
Camarillo • •
Campbell • • • Free-standing arrays (e.g., atop of carports)
Capitola •
Carlsbad •
Carpinteria • •
Carson • •
Chico •
Chino • • Industrial Roof-Top
Chino Hills •
Chowchilla •
Chula Vista •
Citrus Heights • •
Claremont •All proposed solar systems are subject to an administrative approval process
Clayton •
Clearlake • •
Coachella • • •Imperial Irrigation District is the local electricity provider.
Coalinga • • Industrial within Mining Overlay District
Colusa County •In process of development of administrative solar process
Contra Costa County • •
Corona • • Industrial roof-top and ground mounted panels
Coronado • •
Corte Madera • •

Annual Planning Survey Results 2012 269
Appendix F: Solar Energy Development
JuRisdictiOn Res
iden
tiA
l R
OO
f-tO
P o
nly
Res
iden
tiA
l A
nd
cO
MM
eRci
Al
RO
Of-
tOPs
MA
xiM
uM
MeG
AW
Att
liM
it
MeGAWAtt liMit Oth
eR
OtheR (descRiPtiOn)
Costa Mesa •
Covina • • Industrial Roof-Tops
Culver City • •
Cupertino • • And more
Cypress •
Daly City • •
Dana Point •
Davis • • Such systems are encouraged
Del Mar •
Del Norte County • •
Del Rey Oaks •
Delano • Uses existing building and electric codes
Desert Hot Springs •
Diamond Bar •
All systems may be approved administratively unless solar is a component of a comprehensive development plan; i.e., solar installations as stand-alone projects are approved administratively
Dinuba •Dinuba's administrative review process for solar energy systems is not limited to the options listed in the survey.
Dixon •
Dorris •Bldg Inspector approves plans per Building Code
Dos Palos •
Downey • •
Duarte • •
Dublin •
El Cajon • •
El Cerrito •
El Dorado County •
El Monte •
Elk Grove • Not regulated
Emeryville • Building permit only, no design review
Encinitas • •
Escondido •
Exeter • •
Fairfax •
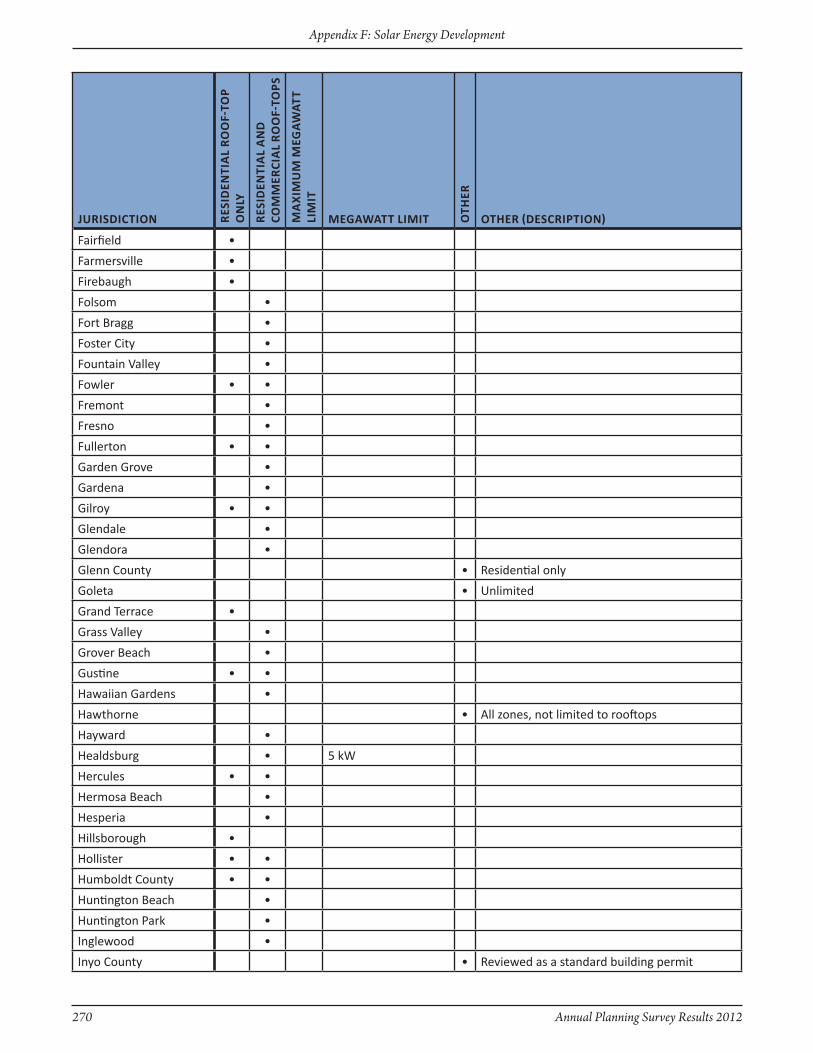
270 Annual Planning Survey Results 2012
Appendix F: Solar Energy Development
JuRisdictiOn Res
iden
tiA
l R
OO
f-tO
P o
nly
Res
iden
tiA
l A
nd
cO
MM
eRci
Al
RO
Of-
tOPs
MA
xiM
uM
MeG
AW
Att
liM
it
MeGAWAtt liMit Oth
eR
OtheR (descRiPtiOn)
Fairfield •
Farmersville •
Firebaugh •
Folsom •
Fort Bragg •
Foster City •
Fountain Valley •
Fowler • •
Fremont •
Fresno •
Fullerton • •
Garden Grove •
Gardena •
Gilroy • •
Glendale •
Glendora •
Glenn County • Residential only
Goleta • Unlimited
Grand Terrace •
Grass Valley •
Grover Beach •
Gustine • •
Hawaiian Gardens •
Hawthorne • All zones, not limited to rooftops
Hayward •
Healdsburg • 5 kW
Hercules • •
Hermosa Beach •
Hesperia •
Hillsborough •
Hollister • •
Humboldt County • •
Huntington Beach •
Huntington Park •
Inglewood •
Inyo County • Reviewed as a standard building permit

Annual Planning Survey Results 2012 271
Appendix F: Solar Energy Development
JuRisdictiOn Res
iden
tiA
l R
OO
f-tO
P o
nly
Res
iden
tiA
l A
nd
cO
MM
eRci
Al
RO
Of-
tOPs
MA
xiM
uM
MeG
AW
Att
liM
it
MeGAWAtt liMit Oth
eR
OtheR (descRiPtiOn)
Ione •All solar energy systems are limited to Building Permit approval, no discretionary approval is required
Irvine • •
Kern County • • •Accessory to an existing use for exclusive use onsite
La Habra • Require a plan check
La Habra Heights • Must meet setback and height requirements
La Mesa •
La Puente •
La Verne •
Laguna Beach •
Laguna Hills •
Laguna Niguel •
Laguna Woods •
Lake County •
Lake Elsinore •
Lakeport •
Lakewood • • • Industrial
Lancaster • •
Larkspur • • Roof top that meet certain height criteria
Lawndale •
Lemon Grove • Building permit only - project specific
Lemoore •
Lincoln • •
Livingston •
Lodi •
Lomita •
Long Beach • •
Loomis •We utilize our standard building permit review process.
Los Alamitos • Not limited
Los Altos • All solar energy systems are admin.
Los Altos Hills •All solar energy systems that complies with zoning regs. qualify for admin approval process.
Los Angeles •
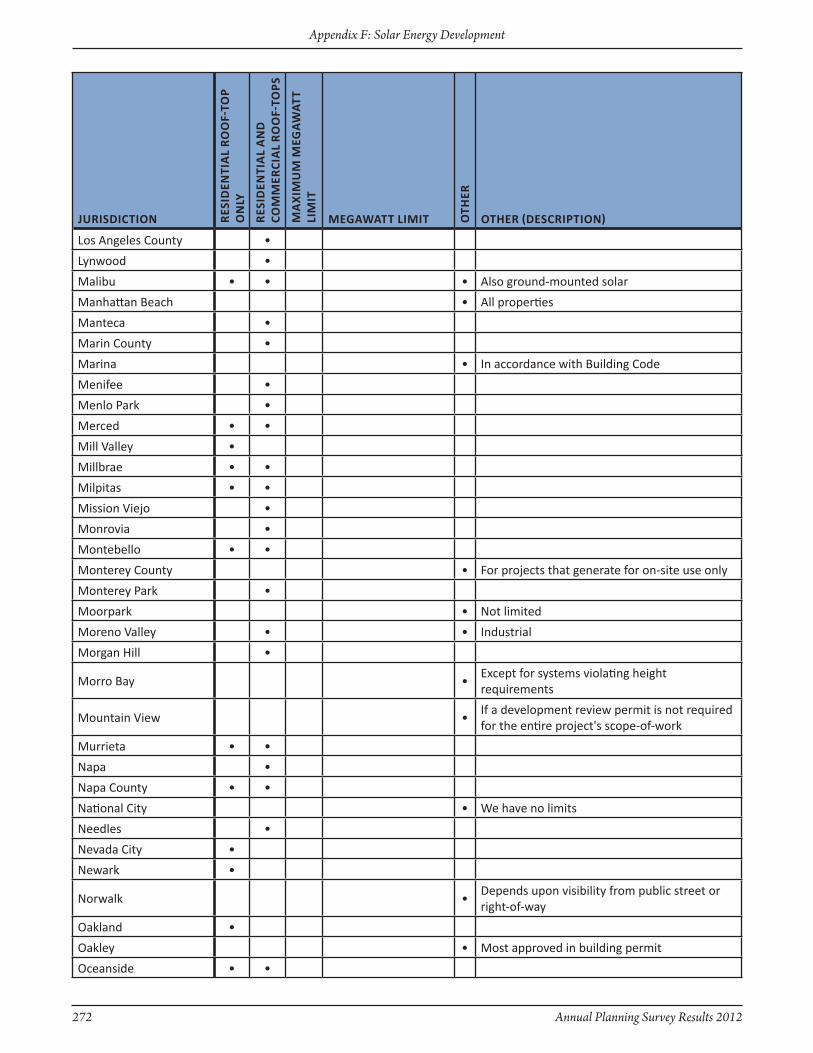
272 Annual Planning Survey Results 2012
Appendix F: Solar Energy Development
JuRisdictiOn Res
iden
tiA
l R
OO
f-tO
P o
nly
Res
iden
tiA
l A
nd
cO
MM
eRci
Al
RO
Of-
tOPs
MA
xiM
uM
MeG
AW
Att
liM
it
MeGAWAtt liMit Oth
eR
OtheR (descRiPtiOn)
Los Angeles County •
Lynwood •
Malibu • • • Also ground-mounted solar
Manhattan Beach • All properties
Manteca •
Marin County •
Marina • In accordance with Building Code
Menifee •
Menlo Park •
Merced • •
Mill Valley •
Millbrae • •
Milpitas • •
Mission Viejo •
Monrovia •
Montebello • •
Monterey County • For projects that generate for on-site use only
Monterey Park •
Moorpark • Not limited
Moreno Valley • • Industrial
Morgan Hill •
Morro Bay •Except for systems violating height requirements
Mountain View •If a development review permit is not required for the entire project's scope-of-work
Murrieta • •
Napa •
Napa County • •
National City • We have no limits
Needles •
Nevada City •
Newark •
Norwalk •Depends upon visibility from public street or right-of-way
Oakland •
Oakley • Most approved in building permit
Oceanside • •
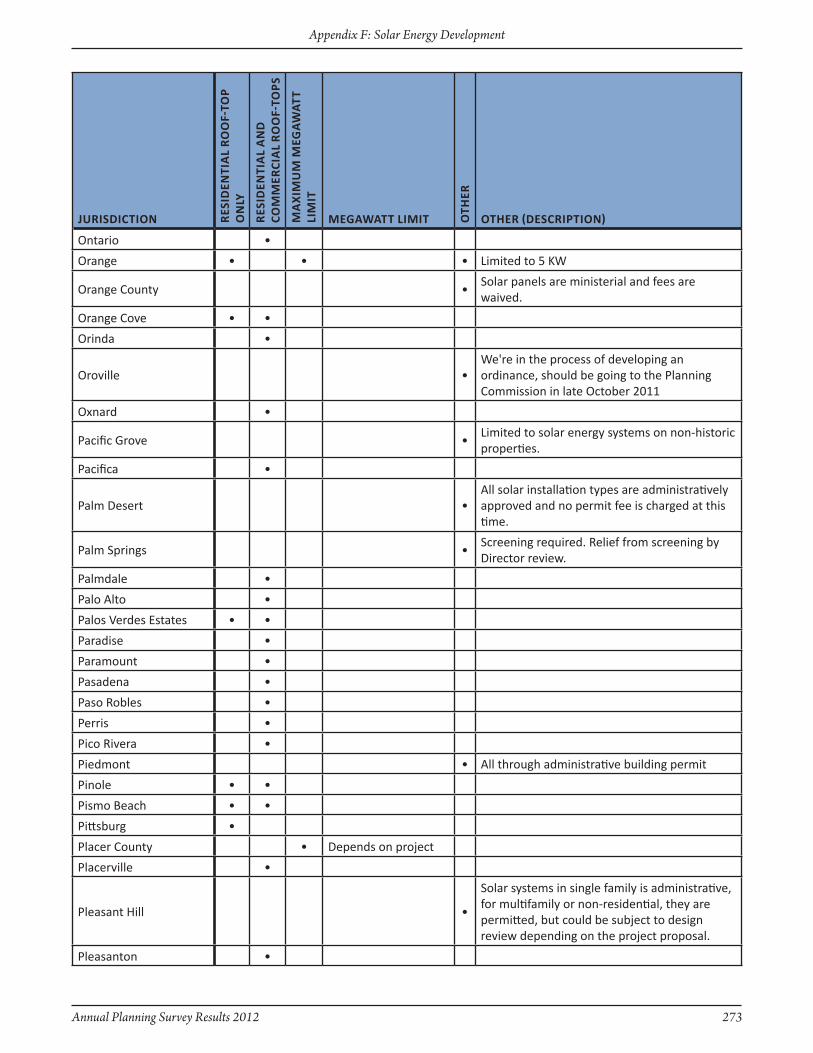
Annual Planning Survey Results 2012 273
Appendix F: Solar Energy Development
JuRisdictiOn Res
iden
tiA
l R
OO
f-tO
P o
nly
Res
iden
tiA
l A
nd
cO
MM
eRci
Al
RO
Of-
tOPs
MA
xiM
uM
MeG
AW
Att
liM
it
MeGAWAtt liMit Oth
eR
OtheR (descRiPtiOn)
Ontario •
Orange • • • Limited to 5 KW
Orange County •Solar panels are ministerial and fees are waived.
Orange Cove • •
Orinda •
Oroville •We're in the process of developing an ordinance, should be going to the Planning Commission in late October 2011
Oxnard •
Pacific Grove •Limited to solar energy systems on non-historic properties.
Pacifica •
Palm Desert •All solar installation types are administratively approved and no permit fee is charged at this time.
Palm Springs •Screening required. Relief from screening by Director review.
Palmdale •
Palo Alto •
Palos Verdes Estates • •
Paradise •
Paramount •
Pasadena •
Paso Robles •
Perris •
Pico Rivera •
Piedmont • All through administrative building permit
Pinole • •
Pismo Beach • •
Pittsburg •
Placer County • Depends on project
Placerville •
Pleasant Hill •
Solar systems in single family is administrative, for multifamily or non-residential, they are permitted, but could be subject to design review depending on the project proposal.
Pleasanton •

274 Annual Planning Survey Results 2012
Appendix F: Solar Energy Development
JuRisdictiOn Res
iden
tiA
l R
OO
f-tO
P o
nly
Res
iden
tiA
l A
nd
cO
MM
eRci
Al
RO
Of-
tOPs
MA
xiM
uM
MeG
AW
Att
liM
it
MeGAWAtt liMit Oth
eR
OtheR (descRiPtiOn)
Plumas County •
Pomona •
Porterville • • • Freestanding panels for dedicated uses.
Portola Valley •
Poway • •
Rancho Cordova • •
Rancho Cucamonga •
Rancho Mirage •
Rancho Palos Verdes • •
Rancho Santa Margarita • We follow federal law
Red Bluff • • Carports Commercial best design
Redding •Admin. approval process not adopted; only a building permit is required
Redlands •
Redondo Beach • •
Redwood City •
Rialto • •
Richmond •
Ridgecrest •
Rio Vista •
Riverbank •
Riverside • •
Riverside County • •
Rocklin •
Rohnert Park • •
Rolling Hills • • Ground mounted
Rolling Hills Estates • •
Rosemead •
Ross • •All administratively approved unless they exceed height limit or lot coverage requirements.
Salinas •
San Anselmo • Building Permit
San Benito County •
San Bernardino • Project specific analysis
San Bernardino County • •
San Bruno •
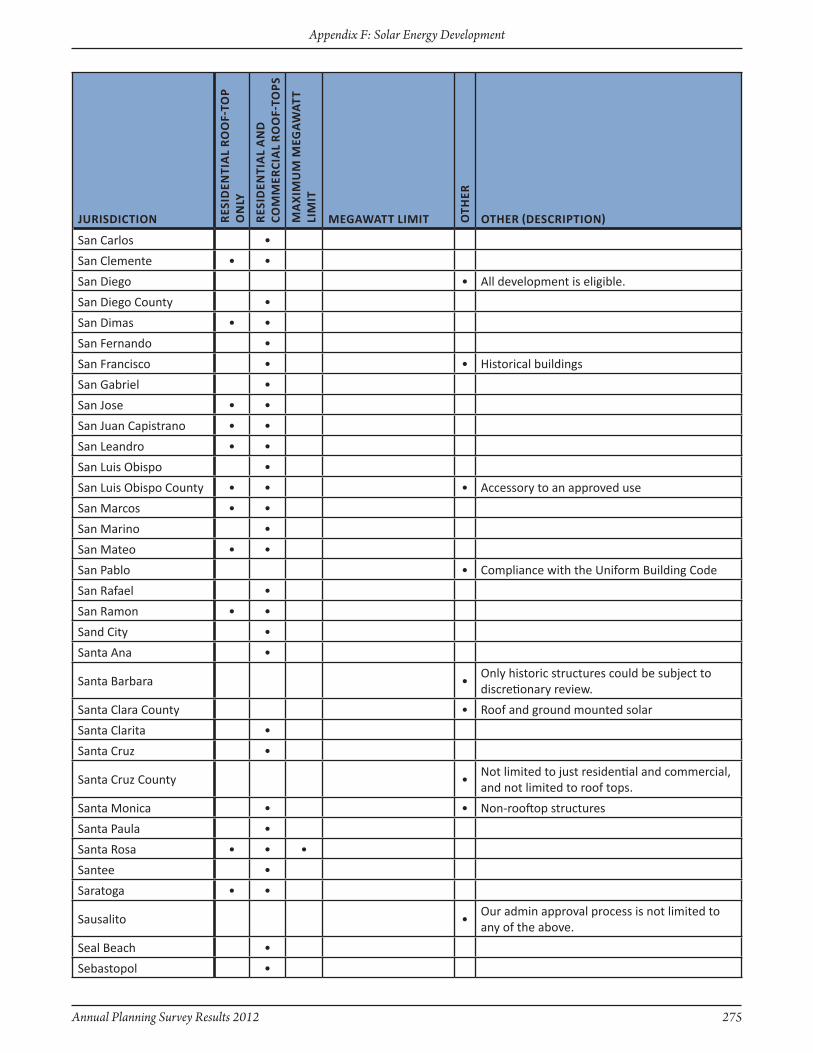
Annual Planning Survey Results 2012 275
Appendix F: Solar Energy Development
JuRisdictiOn Res
iden
tiA
l R
OO
f-tO
P o
nly
Res
iden
tiA
l A
nd
cO
MM
eRci
Al
RO
Of-
tOPs
MA
xiM
uM
MeG
AW
Att
liM
it
MeGAWAtt liMit Oth
eR
OtheR (descRiPtiOn)
San Carlos •
San Clemente • •
San Diego • All development is eligible.
San Diego County •
San Dimas • •
San Fernando •
San Francisco • • Historical buildings
San Gabriel •
San Jose • •
San Juan Capistrano • •
San Leandro • •
San Luis Obispo •
San Luis Obispo County • • • Accessory to an approved use
San Marcos • •
San Marino •
San Mateo • •
San Pablo • Compliance with the Uniform Building Code
San Rafael •
San Ramon • •
Sand City •
Santa Ana •
Santa Barbara •Only historic structures could be subject to discretionary review.
Santa Clara County • Roof and ground mounted solar
Santa Clarita •
Santa Cruz •
Santa Cruz County •Not limited to just residential and commercial, and not limited to roof tops.
Santa Monica • • Non-rooftop structures
Santa Paula •
Santa Rosa • • •
Santee •
Saratoga • •
Sausalito •Our admin approval process is not limited to any of the above.
Seal Beach •
Sebastopol •
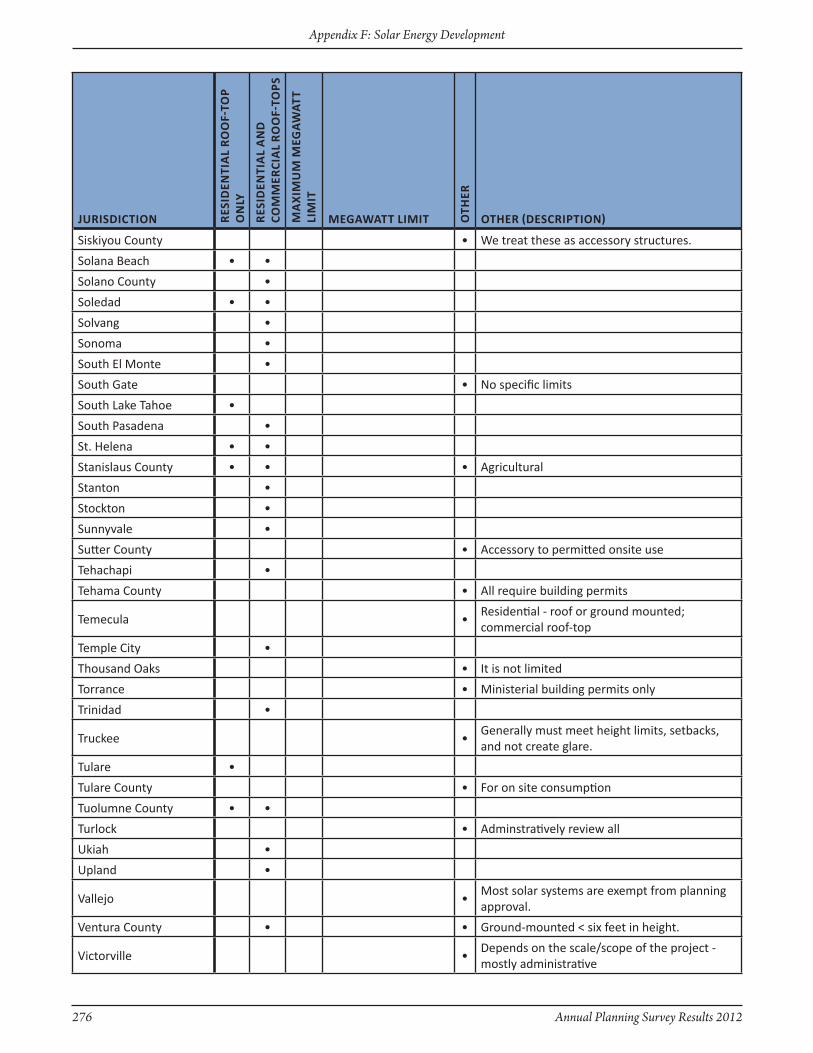
276 Annual Planning Survey Results 2012
Appendix F: Solar Energy Development
JuRisdictiOn Res
iden
tiA
l R
OO
f-tO
P o
nly
Res
iden
tiA
l A
nd
cO
MM
eRci
Al
RO
Of-
tOPs
MA
xiM
uM
MeG
AW
Att
liM
it
MeGAWAtt liMit Oth
eR
OtheR (descRiPtiOn)
Siskiyou County • We treat these as accessory structures.
Solana Beach • •
Solano County •
Soledad • •
Solvang •
Sonoma •
South El Monte •
South Gate • No specific limits
South Lake Tahoe •
South Pasadena •
St. Helena • •
Stanislaus County • • • Agricultural
Stanton •
Stockton •
Sunnyvale •
Sutter County • Accessory to permitted onsite use
Tehachapi •
Tehama County • All require building permits
Temecula •Residential - roof or ground mounted; commercial roof-top
Temple City •
Thousand Oaks • It is not limited
Torrance • Ministerial building permits only
Trinidad •
Truckee •Generally must meet height limits, setbacks, and not create glare.
Tulare •
Tulare County • For on site consumption
Tuolumne County • •
Turlock • Adminstratively review all
Ukiah •
Upland •
Vallejo •Most solar systems are exempt from planning approval.
Ventura County • • Ground-mounted < six feet in height.
Victorville •Depends on the scale/scope of the project - mostly administrative

Annual Planning Survey Results 2012 277
Appendix F: Solar Energy Development
JuRisdictiOn Res
iden
tiA
l R
OO
f-tO
P o
nly
Res
iden
tiA
l A
nd
cO
MM
eRci
Al
RO
Of-
tOPs
MA
xiM
uM
MeG
AW
Att
liM
it
MeGAWAtt liMit Oth
eR
OtheR (descRiPtiOn)
Villa Park •
Visalia •
Vista •
Walnut • • • Process for solar is flexible
Walnut Creek •
Waterford •
West Covina •
West Hollywood •All solar energy systems are approved by the building official
Westlake Village •
Westminster • •
Whittier •
Willits • Admin approval process is not limited
Windsor • •
Winters •These types of improvements are administratively reviewed and approved through the City's building permit process.
Woodlake • •
Woodside •Solar approvals are handled as building permits.
Yolo County • Maximum acreage limit of 2.5 acres
Yorba Linda • •The City allows both roof-mounted and ground-mounted solar systems.
Yountville •
Yuba County • •Varies based on use and historic on-site consumption
Yucaipa •
Yucca Valley •

278 Annual Planning Survey Results 2012
Appendix F: Solar Energy Development
AdelantoAlameda CountyAlbanyAnaheimAntiochApple ValleyBanningBeaumontBeverly HillsBrawleyBurbankButte CountyCalabasasCalifornia CityChicoChinoChino Hills*Chula VistaCitrus HeightsClaremontColusa CountyCoronadoCulver CityDavisDelanoDixonDublinEast Palo AltoEl Dorado CountyEmeryvilleEscondidoFairfaxFairfieldFremontFullertonGlendaleGlenn CountyGuadalupeGustineHaywardHemetHermosa Beach
HesperiaHighlandHillsboroughHughsonHuntington BeachInyo CountyIrvineKern CountyKings CountyLa MesaLa MiradaLaguna WoodsLake CountyLakeportLarkspurLassen CountyLemon GroveLivingstonLong BeachLoomisLos Altos HillsLos AngelesLos Angeles CountyLos GatosManhattan BeachMarin CountyMartinezMendocino CountyMendotaMenifeeModoc CountyMonroviaMonterey CountyMoreno ValleyMorro BayMurrietaNapa CountyNational CityNevada CountyNewmanNorco
OaklandOceansideOrangeOrange CountyOrindaOrovillePalm DesertPalm SpringsPalmdalePalo AltoParadisePasadenaPerrisPiedmontPinolePlacer CountyPleasant HillPleasantonPlumas CountyPortola ValleyRancho Palos VerdesRancho Santa MargaritaRed BluffReddingRedlandsRedwood CityRidgecrestRiversideRiverside CountyRosevilleSan BernardinoSan Bernardino CountySan CarlosSan DiegoSan Diego CountySan DimasSan FranciscoSan JoaquinSan JoseSan Juan CapistranoSan Luis Obispo
San Luis Obispo CountySan MateoSan RafaelSanta AnaSanta BarbaraSanta Clara CountySanta ClaritaSanta CruzSanta Cruz CountySanta MonicaSanta RosaSebastopolSimi ValleySiskiyou CountySolana BeachSolano CountySouth Lake TahoeSt. HelenaStocktonSunnyvaleTaftTiburonTorranceTulare CountyTuolumne CountyTurlockUnion CityVentura CountyVistaWalnut CreekWaterfordWatsonvilleWest HollywoodWest SacramentoWestlake VillageWillitsWindsorWintersYolo CountyYuba CountyYucaipa
* City of Chino Hills:“In Process”
27. Has your jurisdiction developed policies, programs, or ordinances to facilitate the development of renewable energy facilities?
The following is a list of jurisdictions that have developed policies, programs, or ordinances to faciliatate the development of renewable energy facilities.
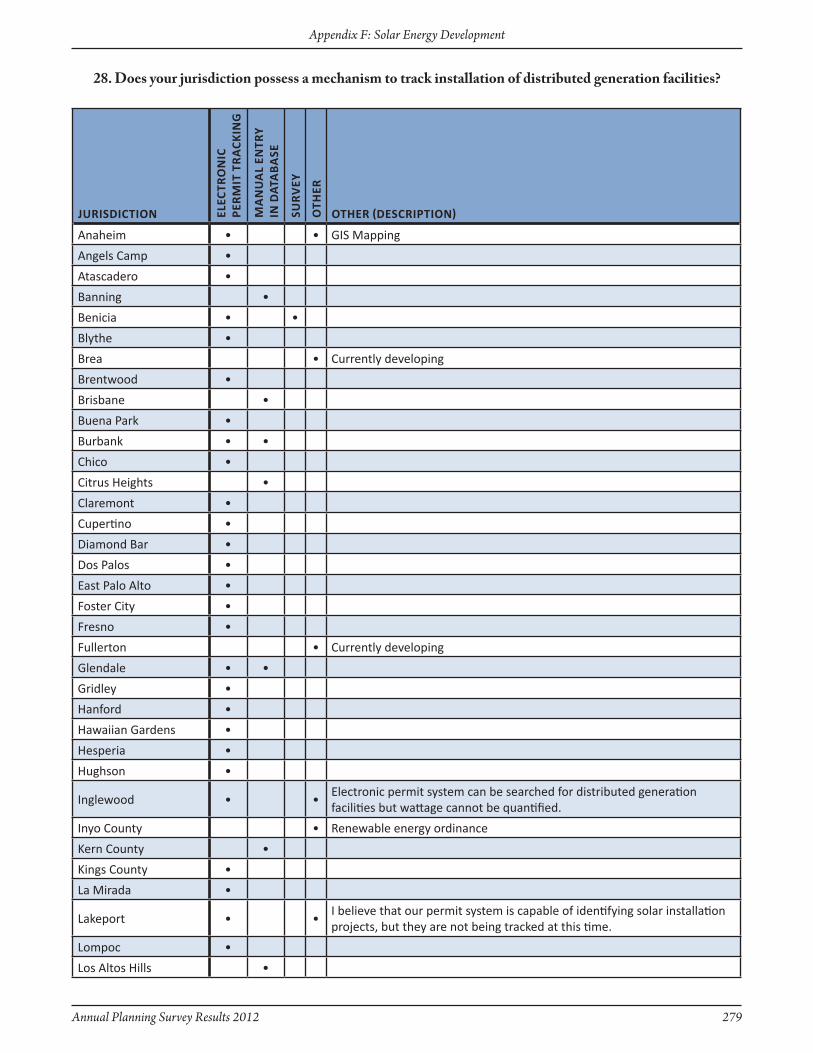
Annual Planning Survey Results 2012 279
Appendix F: Solar Energy Development
JuRisdictiOn elec
tRO
nic
Pe
RM
it t
RA
ckin
G
MA
nu
Al
entR
y in
dAt
AB
Ase
suR
vey
Oth
eR
OtheR (descRiPtiOn)
Anaheim • • GIS Mapping
Angels Camp •
Atascadero •
Banning •
Benicia • •
Blythe •
Brea • Currently developing
Brentwood •
Brisbane •
Buena Park •
Burbank • •
Chico •
Citrus Heights •
Claremont •
Cupertino •
Diamond Bar •
Dos Palos •
East Palo Alto •
Foster City •
Fresno •
Fullerton • Currently developing
Glendale • •
Gridley •
Hanford •
Hawaiian Gardens •
Hesperia •
Hughson •
Inglewood • •Electronic permit system can be searched for distributed generation facilities but wattage cannot be quantified.
Inyo County • Renewable energy ordinance
Kern County •
Kings County •
La Mirada •
Lakeport • •I believe that our permit system is capable of identifying solar installation projects, but they are not being tracked at this time.
Lompoc •
Los Altos Hills •
28. Does your jurisdiction possess a mechanism to track installation of distributed generation facilities?
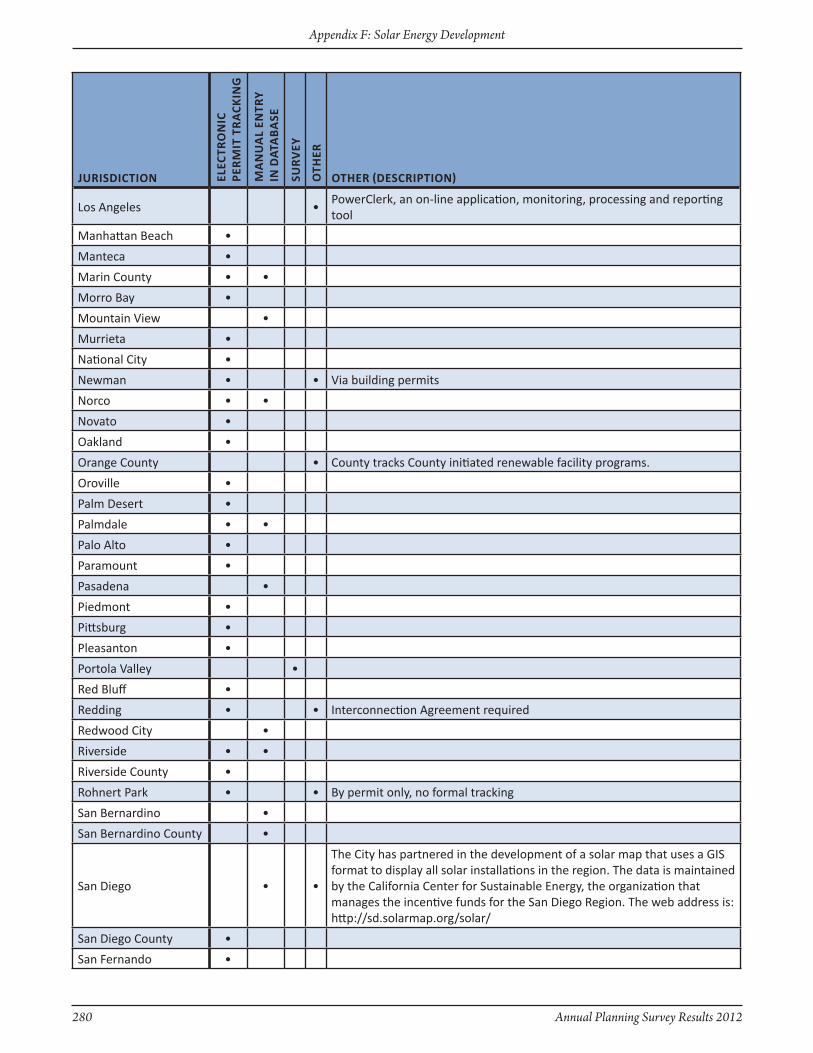
280 Annual Planning Survey Results 2012
Appendix F: Solar Energy Development
JuRisdictiOn elec
tRO
nic
Pe
RM
it t
RA
ckin
G
MA
nu
Al
entR
y in
dAt
AB
Ase
suR
vey
Oth
eR
OtheR (descRiPtiOn)
Los Angeles •PowerClerk, an on-line application, monitoring, processing and reporting tool
Manhattan Beach •
Manteca •
Marin County • •
Morro Bay •
Mountain View •
Murrieta •
National City •
Newman • • Via building permits
Norco • •
Novato •
Oakland •
Orange County • County tracks County initiated renewable facility programs.
Oroville •
Palm Desert •
Palmdale • •
Palo Alto •
Paramount •
Pasadena •
Piedmont •
Pittsburg •
Pleasanton •
Portola Valley •
Red Bluff •
Redding • • Interconnection Agreement required
Redwood City •
Riverside • •
Riverside County •
Rohnert Park • • By permit only, no formal tracking
San Bernardino •
San Bernardino County •
San Diego • •
The City has partnered in the development of a solar map that uses a GIS format to display all solar installations in the region. The data is maintained by the California Center for Sustainable Energy, the organization that manages the incentive funds for the San Diego Region. The web address is: http://sd.solarmap.org/solar/
San Diego County •
San Fernando •
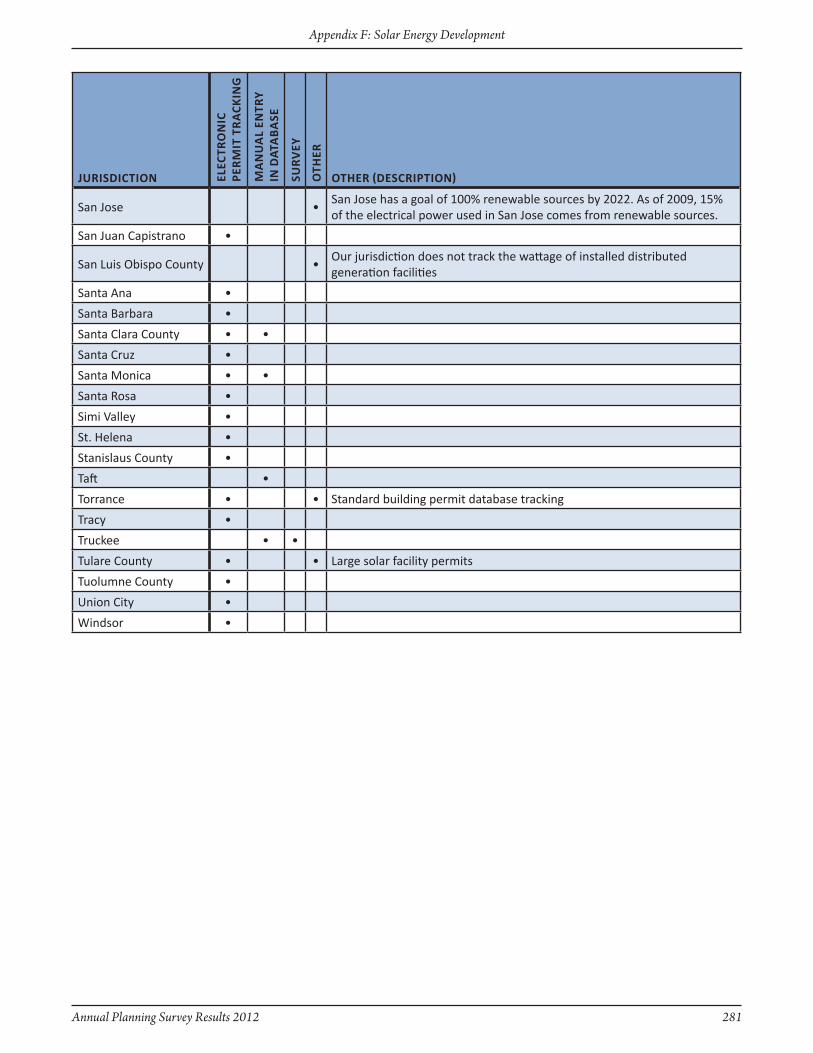
Annual Planning Survey Results 2012 281
Appendix F: Solar Energy Development
JuRisdictiOn elec
tRO
nic
Pe
RM
it t
RA
ckin
G
MA
nu
Al
entR
y in
dAt
AB
Ase
suR
vey
Oth
eR
OtheR (descRiPtiOn)
San Jose •San Jose has a goal of 100% renewable sources by 2022. As of 2009, 15% of the electrical power used in San Jose comes from renewable sources.
San Juan Capistrano •
San Luis Obispo County •Our jurisdiction does not track the wattage of installed distributed generation facilities
Santa Ana •
Santa Barbara •
Santa Clara County • •
Santa Cruz •
Santa Monica • •
Santa Rosa •
Simi Valley •
St. Helena •
Stanislaus County •
Taft •
Torrance • • Standard building permit database tracking
Tracy •
Truckee • •
Tulare County • • Large solar facility permits
Tuolumne County •
Union City •
Windsor •
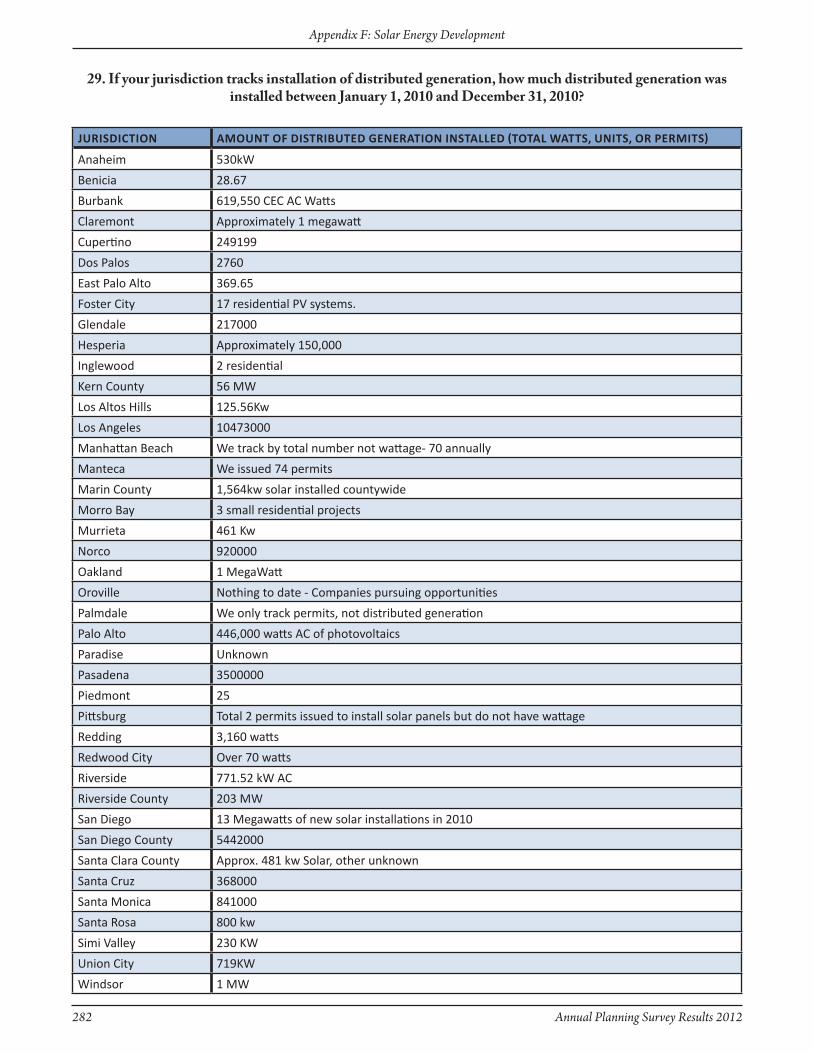
282 Annual Planning Survey Results 2012
Appendix F: Solar Energy Development
JuRisdictiOn AMOunt Of distRiButed GeneRAtiOn instAlled (tOtAl WAtts, units, OR PeRMits)
Anaheim 530kW
Benicia 28.67
Burbank 619,550 CEC AC Watts
Claremont Approximately 1 megawatt
Cupertino 249199
Dos Palos 2760
East Palo Alto 369.65
Foster City 17 residential PV systems.
Glendale 217000
Hesperia Approximately 150,000
Inglewood 2 residential
Kern County 56 MW
Los Altos Hills 125.56Kw
Los Angeles 10473000
Manhattan Beach We track by total number not wattage- 70 annually
Manteca We issued 74 permits
Marin County 1,564kw solar installed countywide
Morro Bay 3 small residential projects
Murrieta 461 Kw
Norco 920000
Oakland 1 MegaWatt
Oroville Nothing to date - Companies pursuing opportunities
Palmdale We only track permits, not distributed generation
Palo Alto 446,000 watts AC of photovoltaics
Paradise Unknown
Pasadena 3500000
Piedmont 25
Pittsburg Total 2 permits issued to install solar panels but do not have wattage
Redding 3,160 watts
Redwood City Over 70 watts
Riverside 771.52 kW AC
Riverside County 203 MW
San Diego 13 Megawatts of new solar installations in 2010
San Diego County 5442000
Santa Clara County Approx. 481 kw Solar, other unknown
Santa Cruz 368000
Santa Monica 841000
Santa Rosa 800 kw
Simi Valley 230 KW
Union City 719KW
Windsor 1 MW
29. If your jurisdiction tracks installation of distributed generation, how much distributed generation was installed between January 1, 2010 and December 31, 2010?

Annual Planning Survey Results 2012 283
Appendix G: Greenhouse Gases (GHG)/Climate Action Plan
For all Appendices, the column headings in the dark blue colors were choices provided in the questions of the Annual Planning Survey. Column headings highlighted in light blue were responses provided by survey respondents.
Appendix G:Greenhouse
Gases (GHG)/Climate Action
Plan

284 Annual Planning Survey Results 2012
Appendix G: Greenhouse Gases (GHG)/Climate Action Plan
Page intentionally left blank
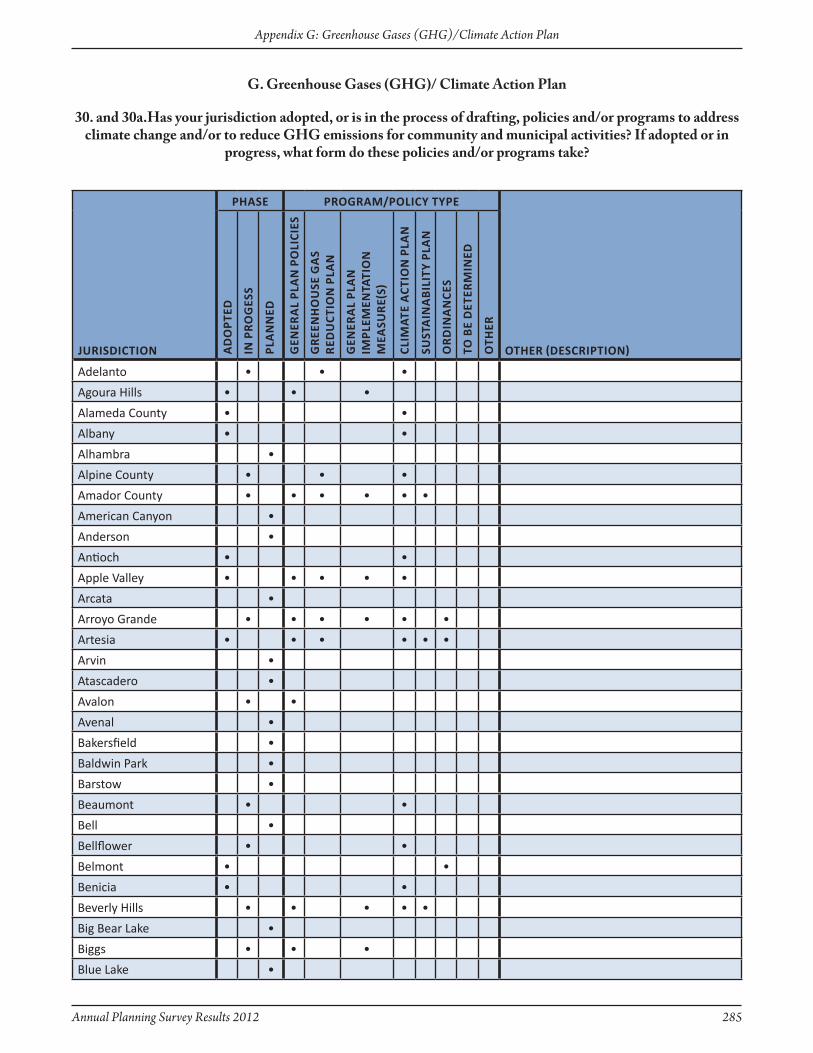
Annual Planning Survey Results 2012 285
Appendix G: Greenhouse Gases (GHG)/Climate Action Plan
G. Greenhouse Gases (GHG)/ Climate Action Plan
JuRisdictiOn
PhAse PROGRAM/POlicy tyPe
OtheR (descRiPtiOn)Ad
OPt
ed
in P
RO
Ges
s
PlA
nn
ed
Gen
eRA
l Pl
An
PO
lici
es
GR
een
hO
use
GA
s R
edu
ctiO
n P
lAn
Gen
eRA
l Pl
An
iM
PleM
entA
tiO
n
MeA
suR
e(s)
cliM
Ate
Act
iOn
PlA
n
sust
Ain
AB
ilit
y Pl
An
OR
din
An
ces
tO B
e d
eteR
Min
ed
Oth
eR
Adelanto • • •
Agoura Hills • • •
Alameda County • •
Albany • •
Alhambra •
Alpine County • • •
Amador County • • • • • •
American Canyon •
Anderson •
Antioch • •
Apple Valley • • • • •
Arcata •
Arroyo Grande • • • • • •
Artesia • • • • • •
Arvin •
Atascadero •
Avalon • •
Avenal •
Bakersfield •
Baldwin Park •
Barstow •
Beaumont • •
Bell •
Bellflower • •
Belmont • •
Benicia • •
Beverly Hills • • • • •
Big Bear Lake •
Biggs • • •
Blue Lake •
30. and 30a.Has your jurisdiction adopted, or is in the process of drafting, policies and/or programs to address climate change and/or to reduce GHG emissions for community and municipal activities? If adopted or in
progress, what form do these policies and/or programs take?
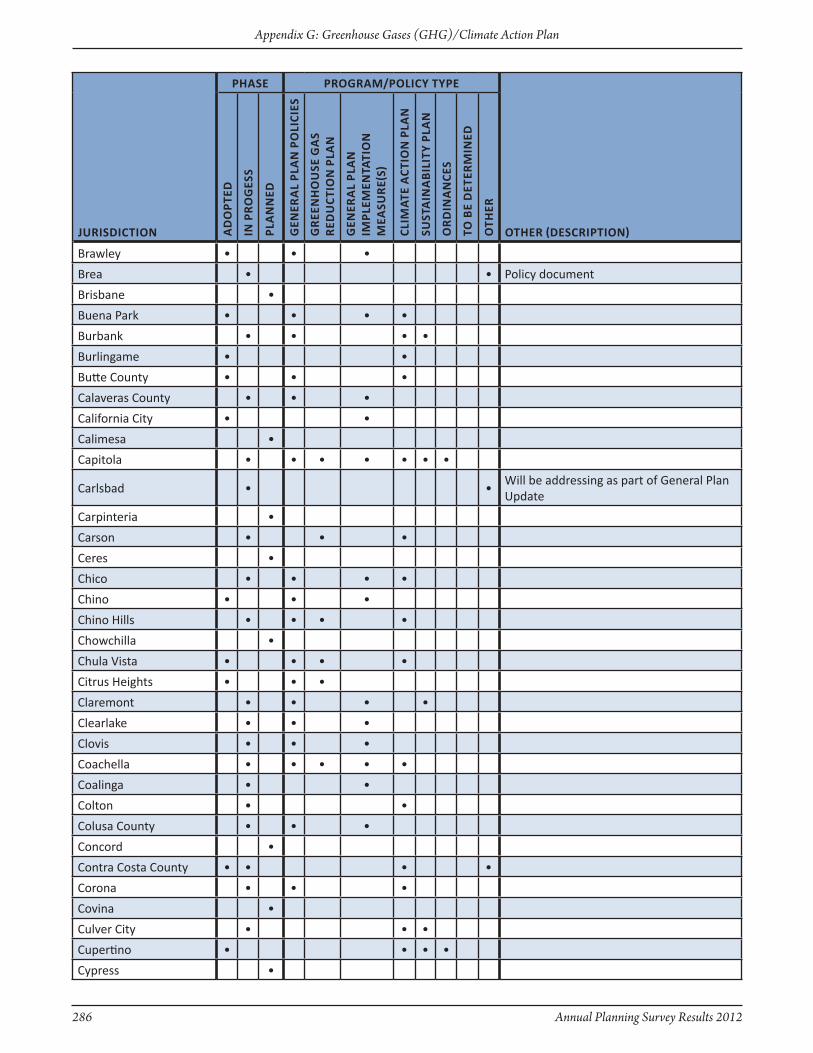
286 Annual Planning Survey Results 2012
Appendix G: Greenhouse Gases (GHG)/Climate Action Plan
JuRisdictiOn
PhAse PROGRAM/POlicy tyPe
OtheR (descRiPtiOn)Ad
OPt
ed
in P
RO
Ges
s
PlA
nn
ed
Gen
eRA
l Pl
An
PO
lici
es
GR
een
hO
use
GA
s R
edu
ctiO
n P
lAn
Gen
eRA
l Pl
An
iM
PleM
entA
tiO
n
MeA
suR
e(s)
cliM
Ate
Act
iOn
PlA
n
sust
Ain
AB
ilit
y Pl
An
OR
din
An
ces
tO B
e d
eteR
Min
ed
Oth
eR
Brawley • • •
Brea • • Policy document
Brisbane •
Buena Park • • • •
Burbank • • • •
Burlingame • •
Butte County • • •
Calaveras County • • •
California City • •
Calimesa •
Capitola • • • • • • •
Carlsbad • •Will be addressing as part of General Plan Update
Carpinteria •
Carson • • •
Ceres •
Chico • • • •
Chino • • •
Chino Hills • • • •
Chowchilla •
Chula Vista • • • •
Citrus Heights • • •
Claremont • • • •
Clearlake • • •
Clovis • • •
Coachella • • • • •
Coalinga • •
Colton • •
Colusa County • • •
Concord •
Contra Costa County • • • •
Corona • • •
Covina •
Culver City • • •
Cupertino • • • •
Cypress •
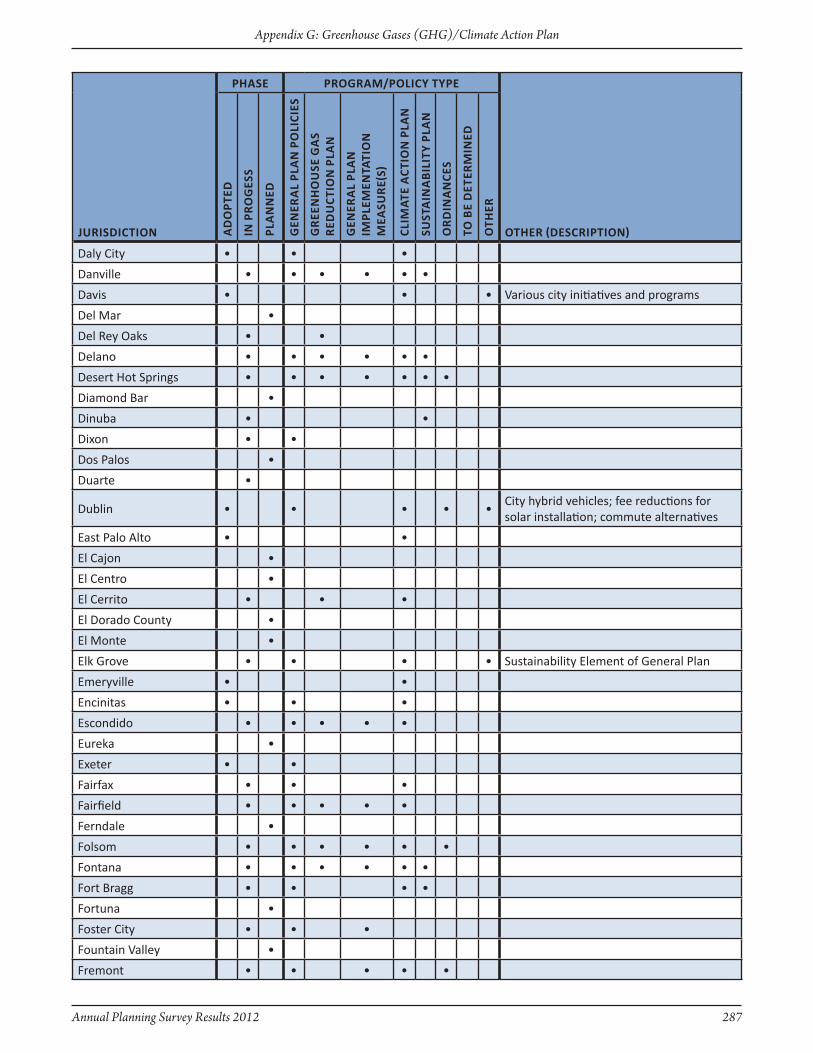
Annual Planning Survey Results 2012 287
Appendix G: Greenhouse Gases (GHG)/Climate Action Plan
JuRisdictiOn
PhAse PROGRAM/POlicy tyPe
OtheR (descRiPtiOn)Ad
OPt
ed
in P
RO
Ges
s
PlA
nn
ed
Gen
eRA
l Pl
An
PO
lici
es
GR
een
hO
use
GA
s R
edu
ctiO
n P
lAn
Gen
eRA
l Pl
An
iM
PleM
entA
tiO
n
MeA
suR
e(s)
cliM
Ate
Act
iOn
PlA
n
sust
Ain
AB
ilit
y Pl
An
OR
din
An
ces
tO B
e d
eteR
Min
ed
Oth
eR
Daly City • • •
Danville • • • • • •
Davis • • • Various city initiatives and programs
Del Mar •
Del Rey Oaks • •
Delano • • • • • •
Desert Hot Springs • • • • • • •
Diamond Bar •
Dinuba • •
Dixon • •
Dos Palos •
Duarte •
Dublin • • • • •City hybrid vehicles; fee reductions for solar installation; commute alternatives
East Palo Alto • •
El Cajon •
El Centro •
El Cerrito • • •
El Dorado County •
El Monte •
Elk Grove • • • • Sustainability Element of General Plan
Emeryville • •
Encinitas • • •
Escondido • • • • •
Eureka •
Exeter • •
Fairfax • • •
Fairfield • • • • •
Ferndale •
Folsom • • • • • •
Fontana • • • • • •
Fort Bragg • • • •
Fortuna •
Foster City • • •
Fountain Valley •
Fremont • • • • •

288 Annual Planning Survey Results 2012
Appendix G: Greenhouse Gases (GHG)/Climate Action Plan
JuRisdictiOn
PhAse PROGRAM/POlicy tyPe
OtheR (descRiPtiOn)Ad
OPt
ed
in P
RO
Ges
s
PlA
nn
ed
Gen
eRA
l Pl
An
PO
lici
es
GR
een
hO
use
GA
s R
edu
ctiO
n P
lAn
Gen
eRA
l Pl
An
iM
PleM
entA
tiO
n
MeA
suR
e(s)
cliM
Ate
Act
iOn
PlA
n
sust
Ain
AB
ilit
y Pl
An
OR
din
An
ces
tO B
e d
eteR
Min
ed
Oth
eR
Fresno • • •
Fullerton • • • •
Gardena •
Gilroy • •
Glendale • • • • •Incorporate sustainabilty policies in Community Plans
Glendora • •
Goleta • • • •
Gonzales • • •
Grand Terrace • • • •
Gridley •
Grover Beach •
Guadalupe •
Gustine •
Hanford • • • •
Hawaiian Gardens • •
Hawthorne • •
Hayward • • • •
Healdsburg • • • • •
Hemet • • • • •
Hermosa Beach • •
Hesperia • •
Highland • • • • •
Hillsborough • •
Hollister •
Hughson • •
Humboldt County • • • • • •
Huntington Beach •
Imperial Beach • • •
Inglewood • • • Energy Climate Action Plan
Inyo County • • • • • • Energy Action Plan
Ione •
Irvine • • •
Irwindale •
Jackson • • •
Kerman •
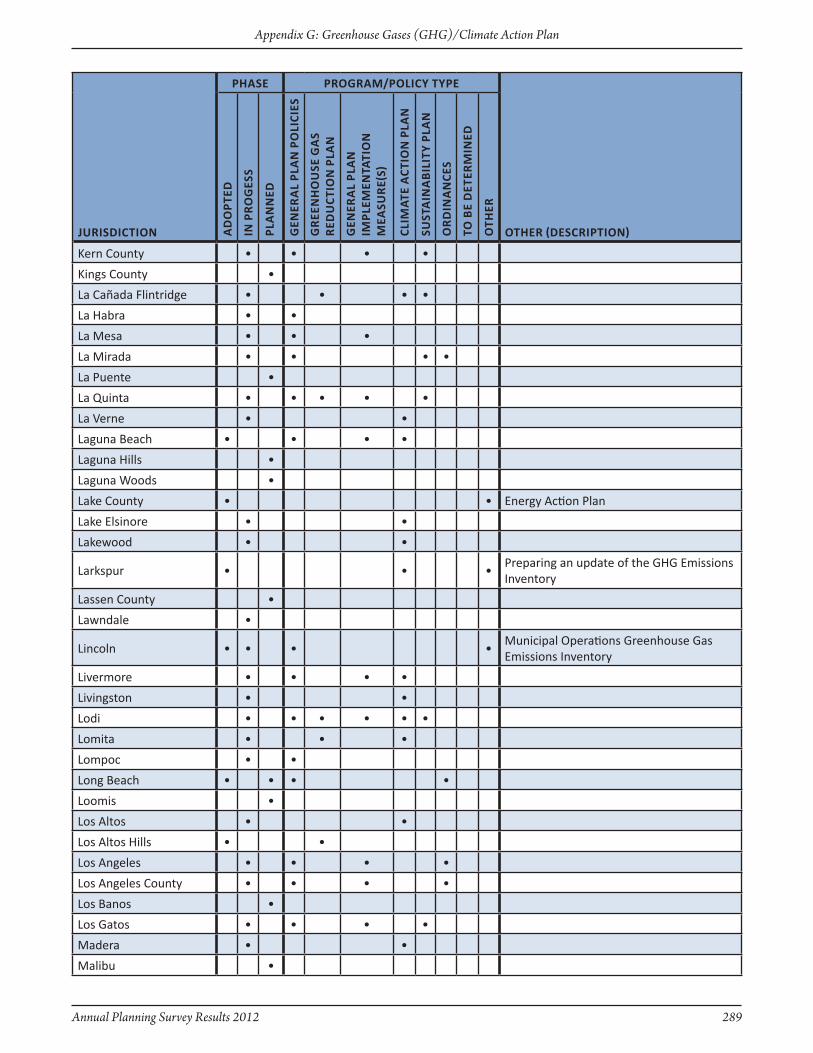
Annual Planning Survey Results 2012 289
Appendix G: Greenhouse Gases (GHG)/Climate Action Plan
JuRisdictiOn
PhAse PROGRAM/POlicy tyPe
OtheR (descRiPtiOn)Ad
OPt
ed
in P
RO
Ges
s
PlA
nn
ed
Gen
eRA
l Pl
An
PO
lici
es
GR
een
hO
use
GA
s R
edu
ctiO
n P
lAn
Gen
eRA
l Pl
An
iM
PleM
entA
tiO
n
MeA
suR
e(s)
cliM
Ate
Act
iOn
PlA
n
sust
Ain
AB
ilit
y Pl
An
OR
din
An
ces
tO B
e d
eteR
Min
ed
Oth
eR
Kern County • • • •
Kings County •
La Cañada Flintridge • • • •
La Habra • •
La Mesa • • •
La Mirada • • • •
La Puente •
La Quinta • • • • •
La Verne • •
Laguna Beach • • • •
Laguna Hills •
Laguna Woods •
Lake County • • Energy Action Plan
Lake Elsinore • •
Lakewood • •
Larkspur • • •Preparing an update of the GHG Emissions Inventory
Lassen County •
Lawndale •
Lincoln • • • •Municipal Operations Greenhouse Gas Emissions Inventory
Livermore • • • •
Livingston • •
Lodi • • • • • •
Lomita • • •
Lompoc • •
Long Beach • • • •
Loomis •
Los Altos • •
Los Altos Hills • •
Los Angeles • • • •
Los Angeles County • • • •
Los Banos •
Los Gatos • • • •
Madera • •
Malibu •
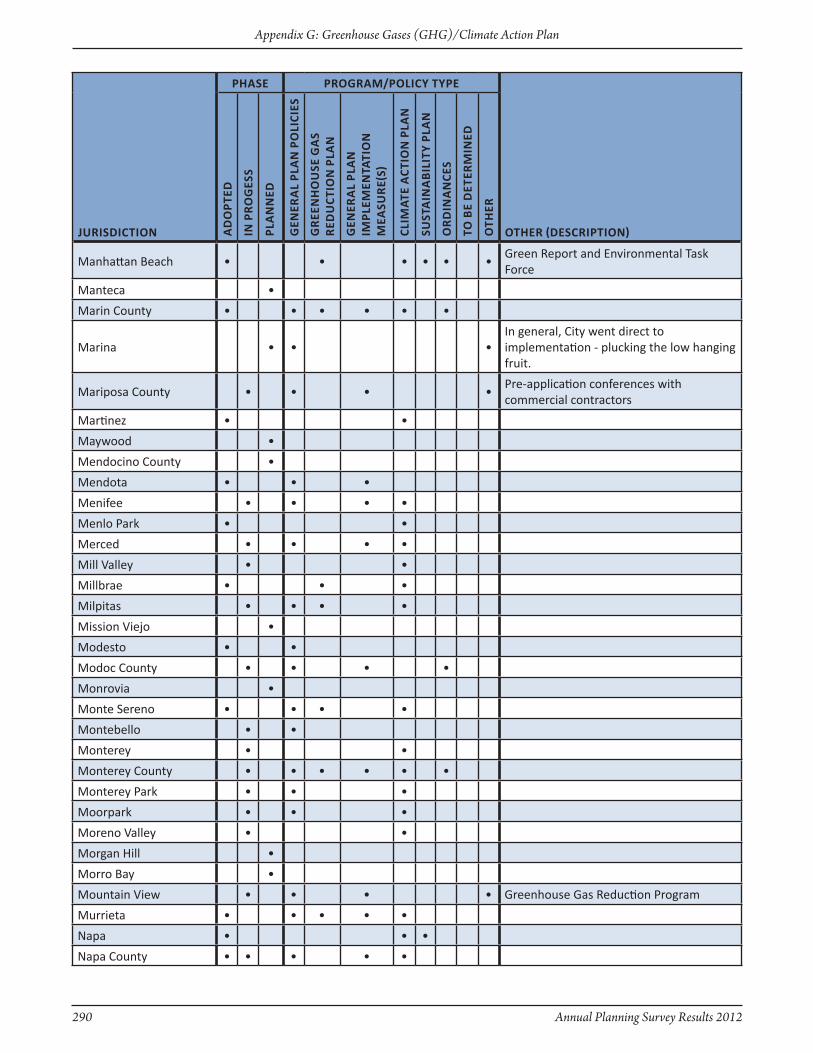
290 Annual Planning Survey Results 2012
Appendix G: Greenhouse Gases (GHG)/Climate Action Plan
JuRisdictiOn
PhAse PROGRAM/POlicy tyPe
OtheR (descRiPtiOn)Ad
OPt
ed
in P
RO
Ges
s
PlA
nn
ed
Gen
eRA
l Pl
An
PO
lici
es
GR
een
hO
use
GA
s R
edu
ctiO
n P
lAn
Gen
eRA
l Pl
An
iM
PleM
entA
tiO
n
MeA
suR
e(s)
cliM
Ate
Act
iOn
PlA
n
sust
Ain
AB
ilit
y Pl
An
OR
din
An
ces
tO B
e d
eteR
Min
ed
Oth
eR
Manhattan Beach • • • • • •Green Report and Environmental Task Force
Manteca •
Marin County • • • • • •
Marina • • •In general, City went direct to implementation - plucking the low hanging fruit.
Mariposa County • • • •Pre-application conferences with commercial contractors
Martinez • •
Maywood •
Mendocino County •
Mendota • • •
Menifee • • • •
Menlo Park • •
Merced • • • •
Mill Valley • •
Millbrae • • •
Milpitas • • • •
Mission Viejo •
Modesto • •
Modoc County • • • •
Monrovia •
Monte Sereno • • • •
Montebello • •
Monterey • •
Monterey County • • • • • •
Monterey Park • • •
Moorpark • • •
Moreno Valley • •
Morgan Hill •
Morro Bay •
Mountain View • • • • Greenhouse Gas Reduction Program
Murrieta • • • • •
Napa • • •
Napa County • • • • •
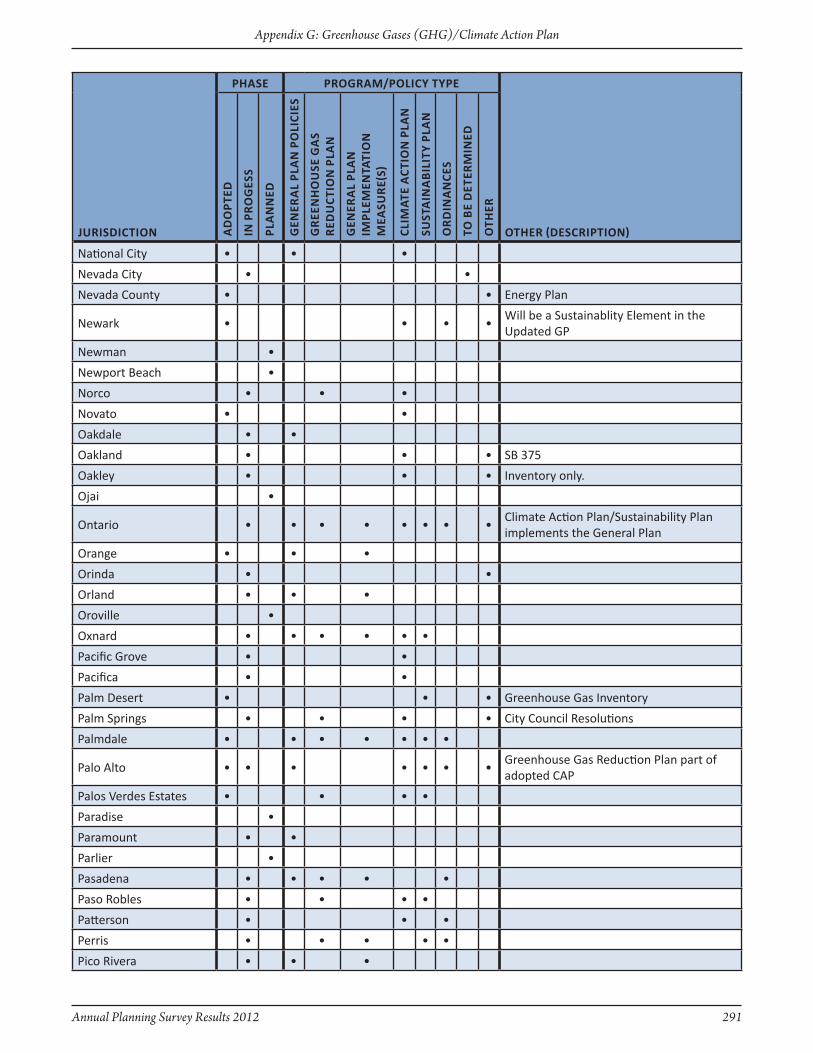
Annual Planning Survey Results 2012 291
Appendix G: Greenhouse Gases (GHG)/Climate Action Plan
JuRisdictiOn
PhAse PROGRAM/POlicy tyPe
OtheR (descRiPtiOn)Ad
OPt
ed
in P
RO
Ges
s
PlA
nn
ed
Gen
eRA
l Pl
An
PO
lici
es
GR
een
hO
use
GA
s R
edu
ctiO
n P
lAn
Gen
eRA
l Pl
An
iM
PleM
entA
tiO
n
MeA
suR
e(s)
cliM
Ate
Act
iOn
PlA
n
sust
Ain
AB
ilit
y Pl
An
OR
din
An
ces
tO B
e d
eteR
Min
ed
Oth
eR
National City • • •
Nevada City • •
Nevada County • • Energy Plan
Newark • • • •Will be a Sustainablity Element in the Updated GP
Newman •
Newport Beach •
Norco • • •
Novato • •
Oakdale • •
Oakland • • • SB 375
Oakley • • • Inventory only.
Ojai •
Ontario • • • • • • • •Climate Action Plan/Sustainability Plan implements the General Plan
Orange • • •
Orinda • •
Orland • • •
Oroville •
Oxnard • • • • • •
Pacific Grove • •
Pacifica • •
Palm Desert • • • Greenhouse Gas Inventory
Palm Springs • • • • City Council Resolutions
Palmdale • • • • • • •
Palo Alto • • • • • • •Greenhouse Gas Reduction Plan part of adopted CAP
Palos Verdes Estates • • • •
Paradise •
Paramount • •
Parlier •
Pasadena • • • • •
Paso Robles • • • •
Patterson • • •
Perris • • • • •
Pico Rivera • • •
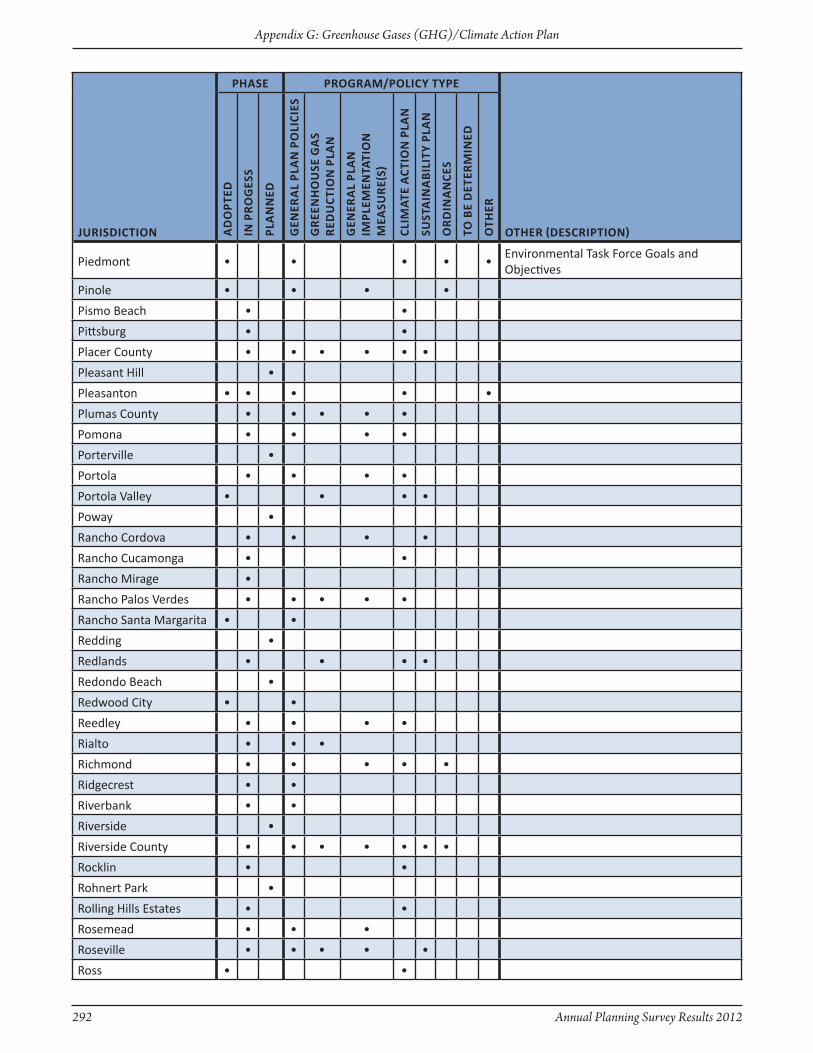
292 Annual Planning Survey Results 2012
Appendix G: Greenhouse Gases (GHG)/Climate Action Plan
JuRisdictiOn
PhAse PROGRAM/POlicy tyPe
OtheR (descRiPtiOn)Ad
OPt
ed
in P
RO
Ges
s
PlA
nn
ed
Gen
eRA
l Pl
An
PO
lici
es
GR
een
hO
use
GA
s R
edu
ctiO
n P
lAn
Gen
eRA
l Pl
An
iM
PleM
entA
tiO
n
MeA
suR
e(s)
cliM
Ate
Act
iOn
PlA
n
sust
Ain
AB
ilit
y Pl
An
OR
din
An
ces
tO B
e d
eteR
Min
ed
Oth
eR
Piedmont • • • • •Environmental Task Force Goals and Objectives
Pinole • • • •
Pismo Beach • •
Pittsburg • •
Placer County • • • • • •
Pleasant Hill •
Pleasanton • • • • •
Plumas County • • • • •
Pomona • • • •
Porterville •
Portola • • • •
Portola Valley • • • •
Poway •
Rancho Cordova • • • •
Rancho Cucamonga • •
Rancho Mirage •
Rancho Palos Verdes • • • • •
Rancho Santa Margarita • •
Redding •
Redlands • • • •
Redondo Beach •
Redwood City • •
Reedley • • • •
Rialto • • •
Richmond • • • • •
Ridgecrest • •
Riverbank • •
Riverside •
Riverside County • • • • • • •
Rocklin • •
Rohnert Park •
Rolling Hills Estates • •
Rosemead • • •
Roseville • • • • •
Ross • •
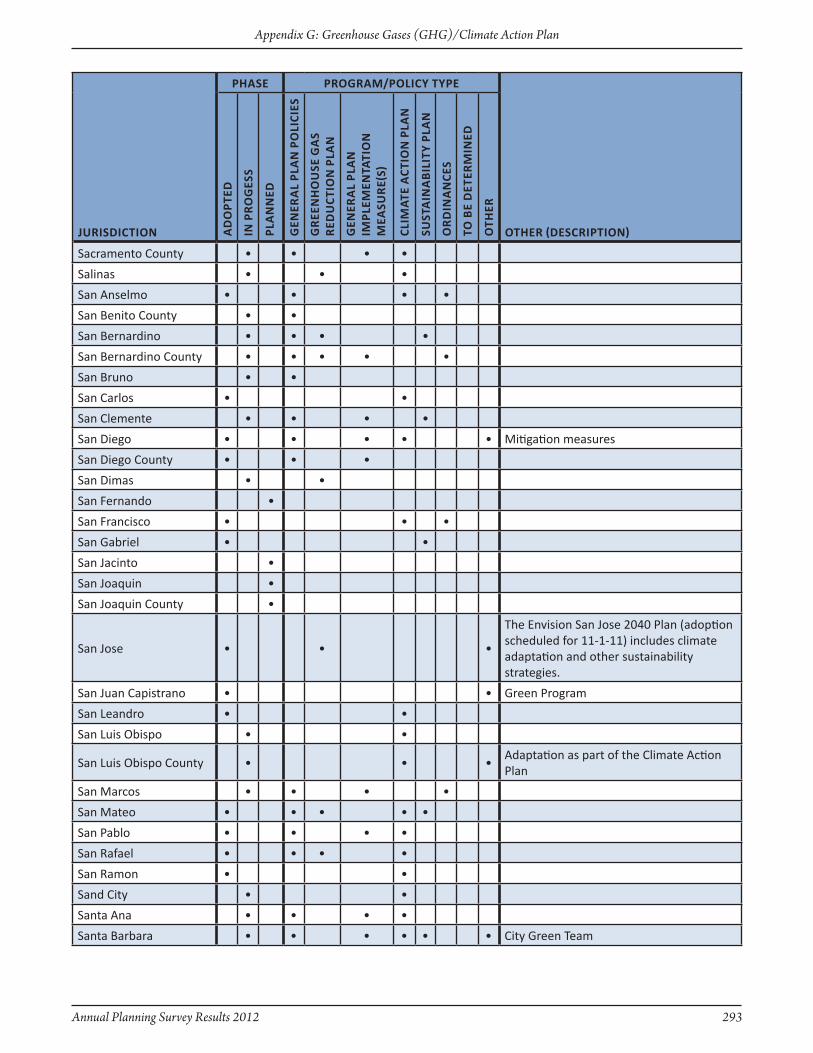
Annual Planning Survey Results 2012 293
Appendix G: Greenhouse Gases (GHG)/Climate Action Plan
JuRisdictiOn
PhAse PROGRAM/POlicy tyPe
OtheR (descRiPtiOn)Ad
OPt
ed
in P
RO
Ges
s
PlA
nn
ed
Gen
eRA
l Pl
An
PO
lici
es
GR
een
hO
use
GA
s R
edu
ctiO
n P
lAn
Gen
eRA
l Pl
An
iM
PleM
entA
tiO
n
MeA
suR
e(s)
cliM
Ate
Act
iOn
PlA
n
sust
Ain
AB
ilit
y Pl
An
OR
din
An
ces
tO B
e d
eteR
Min
ed
Oth
eR
Sacramento County • • • •
Salinas • • •
San Anselmo • • • •
San Benito County • •
San Bernardino • • • •
San Bernardino County • • • • •
San Bruno • •
San Carlos • •
San Clemente • • • •
San Diego • • • • • Mitigation measures
San Diego County • • •
San Dimas • •
San Fernando •
San Francisco • • •
San Gabriel • •
San Jacinto •
San Joaquin •
San Joaquin County •
San Jose • • •
The Envision San Jose 2040 Plan (adoption scheduled for 11-1-11) includes climate adaptation and other sustainability strategies.
San Juan Capistrano • • Green Program
San Leandro • •
San Luis Obispo • •
San Luis Obispo County • • •Adaptation as part of the Climate Action Plan
San Marcos • • • •
San Mateo • • • • •
San Pablo • • • •
San Rafael • • • •
San Ramon • •
Sand City • •
Santa Ana • • • •
Santa Barbara • • • • • • City Green Team

294 Annual Planning Survey Results 2012
Appendix G: Greenhouse Gases (GHG)/Climate Action Plan
JuRisdictiOn
PhAse PROGRAM/POlicy tyPe
OtheR (descRiPtiOn)Ad
OPt
ed
in P
RO
Ges
s
PlA
nn
ed
Gen
eRA
l Pl
An
PO
lici
es
GR
een
hO
use
GA
s R
edu
ctiO
n P
lAn
Gen
eRA
l Pl
An
iM
PleM
entA
tiO
n
MeA
suR
e(s)
cliM
Ate
Act
iOn
PlA
n
sust
Ain
AB
ilit
y Pl
An
OR
din
An
ces
tO B
e d
eteR
Min
ed
Oth
eR
Santa Clara County • • • • •
Sustainability Policies, Community Sustainability Master Plan, Environmental Stewardship Goals, Energy Efficiency and Renewable Energy programs
Santa Clarita • • • • •
Santa Cruz • • • • •
Santa Cruz County • •
Santa Monica • • • • • • •
Santa Paula • • Public Works-policy
Santa Rosa • • •
Santee • •
Saratoga • •
Sausalito • •
Seaside •
Sebastopol • • City Council resolution
Sierra County •
Signal Hill • •
Simi Valley • • • • • Green Community Action Plan
Siskiyou County •
Solana Beach • • •
Solano County • •
Solvang • •
Sonoma • • • • •
Sonora • • Use of OPR Guidelines
South El Monte •
South Gate • • • • • • • General Plan policies approved
South Lake Tahoe • • •
South San Francisco • •
St. Helena • • • • • •
Stanislaus County • • • • • • •
Stockton • • •
Suisun City • • • • •
Sunnyvale • • •
Sutter County • • •
Sutter Creek • • • • •
Taft • • • • • • •

Annual Planning Survey Results 2012 295
Appendix G: Greenhouse Gases (GHG)/Climate Action Plan
JuRisdictiOn
PhAse PROGRAM/POlicy tyPe
OtheR (descRiPtiOn)Ad
OPt
ed
in P
RO
Ges
s
PlA
nn
ed
Gen
eRA
l Pl
An
PO
lici
es
GR
een
hO
use
GA
s R
edu
ctiO
n P
lAn
Gen
eRA
l Pl
An
iM
PleM
entA
tiO
n
MeA
suR
e(s)
cliM
Ate
Act
iOn
PlA
n
sust
Ain
AB
ilit
y Pl
An
OR
din
An
ces
tO B
e d
eteR
Min
ed
Oth
eR
Tehachapi • •
Temecula • • •
Temple City •
Tiburon • •
Torrance • • •
Tracy • •
Trinidad • • •
Trinity County •
Truckee •
Tulare • •
Tulare County • •
Tuolumne County • • • Regional Blueprint
Turlock • • •
Ukiah • • •
Union City • • • •
Upland • • •
Vacaville • • Not yet adopted
Vallejo • •
Ventura County • •
Vernon • •
Victorville •
Villa Park •
Visalia • • • • •
Vista • • • •
Walnut •
Walnut Creek • • • • • •
Waterford • • • •
Watsonville •
West Hollywood • • • •
West Sacramento • • • • •
Westlake Village •
Williams • •
Willits •
Windsor • •
Winters •

296 Annual Planning Survey Results 2012
Appendix G: Greenhouse Gases (GHG)/Climate Action Plan
JuRisdictiOn
PhAse PROGRAM/POlicy tyPe
OtheR (descRiPtiOn)Ad
OPt
ed
in P
RO
Ges
s
PlA
nn
ed
Gen
eRA
l Pl
An
PO
lici
es
GR
een
hO
use
GA
s R
edu
ctiO
n P
lAn
Gen
eRA
l Pl
An
iM
PleM
entA
tiO
n
MeA
suR
e(s)
cliM
Ate
Act
iOn
PlA
n
sust
Ain
AB
ilit
y Pl
An
OR
din
An
ces
tO B
e d
eteR
Min
ed
Oth
eR
Woodland • •
Woodside •
Yolo County • •
Yountville • • • •
Yuba County • • • •
Yucaipa • • •
Yucca Valley • • •

Annual Planning Survey Results 2012 297
Appendix G: Greenhouse Gases (GHG)/Climate Action Plan
JuRisdictiOn tARGets And yeARs
Alameda County 15% below current levels by 2020
Albany 12/31/2020
Amador County Consistent with state
Antioch 25% below the baseline year of 2005 by the year 2020, and 80%
Apple Valley 15% below base year 2005 by 2020
Artesia Gateway Cities Total Daily GHG Reduction (lbs GHG per capita) is 0.120-0.177 by Year 2035
Bellflower Target to be determined, Year 2035
BeniciaReduce GHG emissions to 2005 levels by 2010 and reduce GHG emissions to 10% below 2000 levels by 2020.
Brisbane In progress
Buellton The Santa Barbara County Association of Governments is preparing this countywide
Burlingame 15% reduction over 2005 baseline by 2020; 80% by 2050
Butte CountyIdentify a process to set a reduction goal for 2030 by 2020. This will happen in conjunction with our CAP.
California City 5% by 2020
Capitola 0% per capita increase 2020, -5% in 2035; By the MPO
Carpinteria CARB target: 0% per capita increase for 2020
Chico 25% below baseline (2005) levels by the end of 2020
Chino Hills In process
Chowchilla 15% reduction from year 2007 by year 2020
Chula Vista 20% below 1990 levels by 2010
Citrus Heights 10 - 15% below 2005 levels by 2020
Clovis 5% 2020, 10% 2035
Coachella Not available until studies are completed.
Colma 80% by 2050
Contra Costa County 80% below 2005 level by 2050
Corona 1.48 MMT Co2e in 2020
Costa Mesa Part of the Orange County SCS
Danville In the works
Davis 15% below 1990 levels by 2015, 28% below 1990 levels by 2020, carbon neutral by 2050
Desert Hot Springs Don't know; a GHG inventory is in progress.
Dinubahttp://www.ranchomirageca.gov/content_files/pdf/departments/community_development/complete_General_Plan_2005.pdf
Dixon Meet the requirements of AB 32
Dublin 20% (Yr. 2020)
East Palo Alto 15% below 2005 levels by 2020 (pg. 23 of the EPA CAP)
Elk Grove 15% below 2005 levels by 2020
Emeryville 25% below 2004 by 2020
Encinitas 2015 - 15% exceed Title 24
Escondido Compliance with provisions in AB 32
Fort Bragg 15% by 2015 and 30% by 2030
31. What are your Greenhouse Gas reduction targets and years?
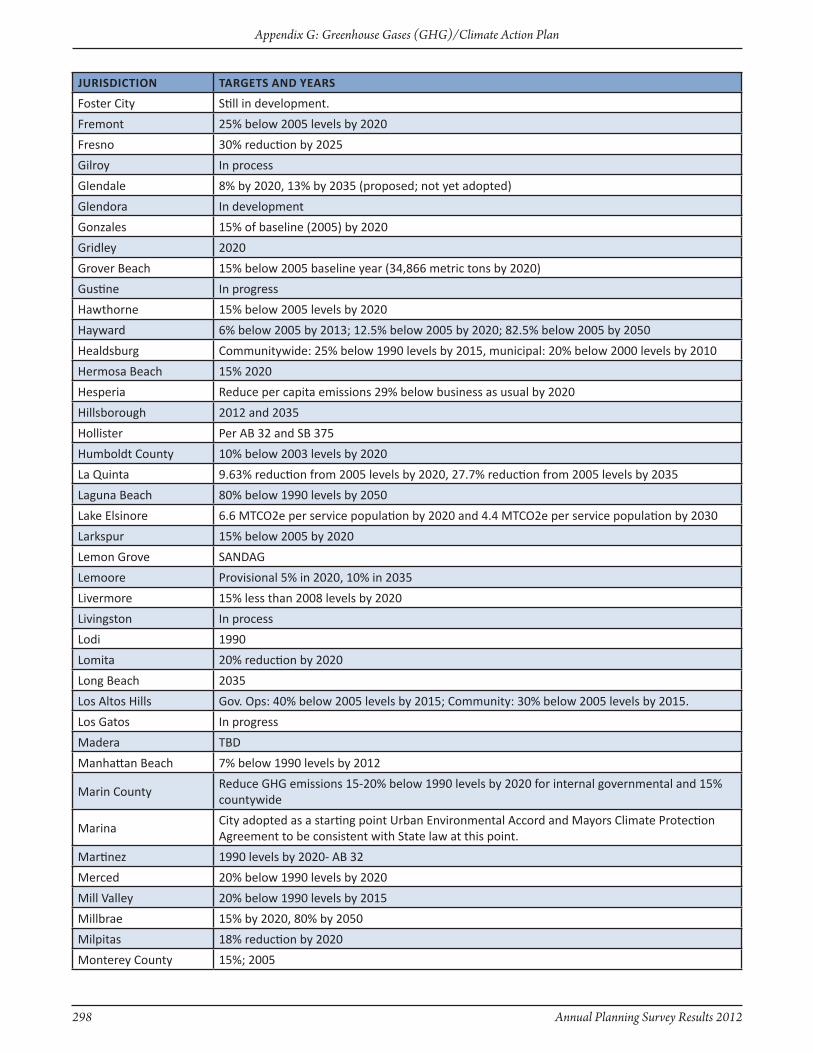
298 Annual Planning Survey Results 2012
Appendix G: Greenhouse Gases (GHG)/Climate Action Plan
JuRisdictiOn tARGets And yeARs
Foster City Still in development.
Fremont 25% below 2005 levels by 2020
Fresno 30% reduction by 2025
Gilroy In process
Glendale 8% by 2020, 13% by 2035 (proposed; not yet adopted)
Glendora In development
Gonzales 15% of baseline (2005) by 2020
Gridley 2020
Grover Beach 15% below 2005 baseline year (34,866 metric tons by 2020)
Gustine In progress
Hawthorne 15% below 2005 levels by 2020
Hayward 6% below 2005 by 2013; 12.5% below 2005 by 2020; 82.5% below 2005 by 2050
Healdsburg Communitywide: 25% below 1990 levels by 2015, municipal: 20% below 2000 levels by 2010
Hermosa Beach 15% 2020
Hesperia Reduce per capita emissions 29% below business as usual by 2020
Hillsborough 2012 and 2035
Hollister Per AB 32 and SB 375
Humboldt County 10% below 2003 levels by 2020
La Quinta 9.63% reduction from 2005 levels by 2020, 27.7% reduction from 2005 levels by 2035
Laguna Beach 80% below 1990 levels by 2050
Lake Elsinore 6.6 MTCO2e per service population by 2020 and 4.4 MTCO2e per service population by 2030
Larkspur 15% below 2005 by 2020
Lemon Grove SANDAG
Lemoore Provisional 5% in 2020, 10% in 2035
Livermore 15% less than 2008 levels by 2020
Livingston In process
Lodi 1990
Lomita 20% reduction by 2020
Long Beach 2035
Los Altos Hills Gov. Ops: 40% below 2005 levels by 2015; Community: 30% below 2005 levels by 2015.
Los Gatos In progress
Madera TBD
Manhattan Beach 7% below 1990 levels by 2012
Marin CountyReduce GHG emissions 15-20% below 1990 levels by 2020 for internal governmental and 15% countywide
MarinaCity adopted as a starting point Urban Environmental Accord and Mayors Climate Protection Agreement to be consistent with State law at this point.
Martinez 1990 levels by 2020- AB 32
Merced 20% below 1990 levels by 2020
Mill Valley 20% below 1990 levels by 2015
Millbrae 15% by 2020, 80% by 2050
Milpitas 18% reduction by 2020
Monterey County 15%; 2005

Annual Planning Survey Results 2012 299
Appendix G: Greenhouse Gases (GHG)/Climate Action Plan
JuRisdictiOn tARGets And yeARs
Monterey Park 2020 and 2035
Mountain View 15-20% below 2005 levels by 2020
Murrieta 15% (2020)
Napa County 1990 (15% below 2005) and 2020
National City 15% reduction in 2005 baseline level by 2020
Nevada County Energy Plan is focused on reducing energy use by: 25% in the first three years after adoption.
Newark Reduce to 1990 Level/ Per capita 15% reduction
Norco Targets and years being established
Novato 15% reduction below 2005 levels in 2020
Oakland 36% reduction from 2005 levels by 2010
Ontario 2020 30% reduction from business as usual 2008 baseline
Pacifica 40% by 2020; 95% by 2050
Palm Desert 7% below 1990 levels by 2020
Palm Springs2020, 2.5 tons per capita; 2035, 2.7 tons per capita; 2012, reduce 7% from 1990 levels; 2020, reduce 18.4%; 2035, reduce 18.9% (community)
Palo Alto
Short Term Goal: By 2009 the City will reduce emissions by 5% from 2005 emission levels for a total reduction of 3,266 metric tons of CO2. Medium Term Goal: By 2012 the City and Community will reduce emissions by 5% from 2005 emissions levels for a total reduction of 39,702 metric tons of CO2. Long Term Goal: By 2020, the City and Community will reduce emissions by 15% of 2005 levels, equal to 119,140
Palos Verdes Estates 10% by 2020
Paradise Planned
Pasadena In progress
Pico Rivera 8% by 2020; 13% by 2035
Piedmont 15% reduction from 2005 levels by 2020
Pinole Reduce GHG emissions from City operations by 15% from 2005 baseline levels by the year 2020
Pittsburg 15% below 2005 baseline by 2020
Pleasanton 15% below 2005 by 2020
Plumas County In development
Portola Valley 1990 levels by 2020 & 80% below 1990 levels by 2050 (AB 32 target)
Poway 7% (2020); 13% (2035)
Rancho Palos Verdes In progress
Redlands In progress, do not have figures yet
Redwood CityReduce per capita GHG emissions and total municipal GHG emissions to 15% below 2005 levels by 2020
Riverside County 40% reduction by 2020
Rocklin 2013
Rohnert Park Regional Target
Rolling Hills Estates In Progress
Roseville 2020 2035
Ross 15% by 2020
Sacramento County Pending
San Anselmo In progress
San Bernardino County 15% below 2007 levels by 2020
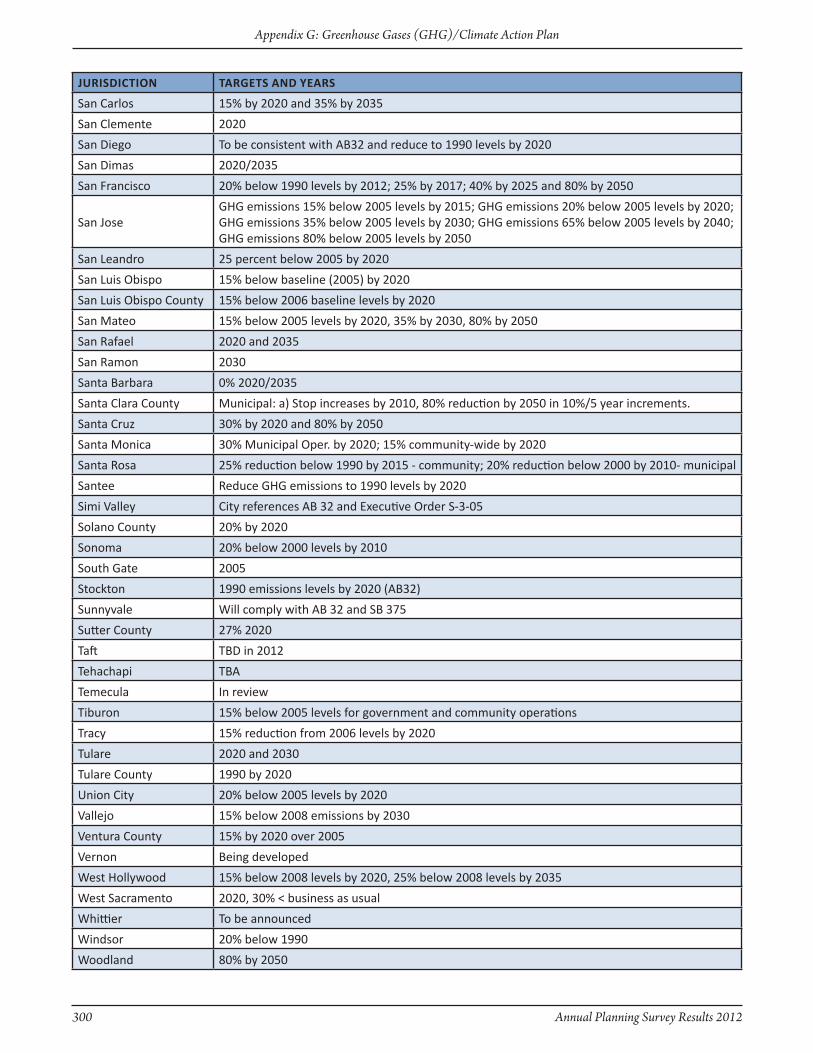
300 Annual Planning Survey Results 2012
Appendix G: Greenhouse Gases (GHG)/Climate Action Plan
JuRisdictiOn tARGets And yeARs
San Carlos 15% by 2020 and 35% by 2035
San Clemente 2020
San Diego To be consistent with AB32 and reduce to 1990 levels by 2020
San Dimas 2020/2035
San Francisco 20% below 1990 levels by 2012; 25% by 2017; 40% by 2025 and 80% by 2050
San JoseGHG emissions 15% below 2005 levels by 2015; GHG emissions 20% below 2005 levels by 2020; GHG emissions 35% below 2005 levels by 2030; GHG emissions 65% below 2005 levels by 2040; GHG emissions 80% below 2005 levels by 2050
San Leandro 25 percent below 2005 by 2020
San Luis Obispo 15% below baseline (2005) by 2020
San Luis Obispo County 15% below 2006 baseline levels by 2020
San Mateo 15% below 2005 levels by 2020, 35% by 2030, 80% by 2050
San Rafael 2020 and 2035
San Ramon 2030
Santa Barbara 0% 2020/2035
Santa Clara County Municipal: a) Stop increases by 2010, 80% reduction by 2050 in 10%/5 year increments.
Santa Cruz 30% by 2020 and 80% by 2050
Santa Monica 30% Municipal Oper. by 2020; 15% community-wide by 2020
Santa Rosa 25% reduction below 1990 by 2015 - community; 20% reduction below 2000 by 2010- municipal
Santee Reduce GHG emissions to 1990 levels by 2020
Simi Valley City references AB 32 and Executive Order S-3-05
Solano County 20% by 2020
Sonoma 20% below 2000 levels by 2010
South Gate 2005
Stockton 1990 emissions levels by 2020 (AB32)
Sunnyvale Will comply with AB 32 and SB 375
Sutter County 27% 2020
Taft TBD in 2012
Tehachapi TBA
Temecula In review
Tiburon 15% below 2005 levels for government and community operations
Tracy 15% reduction from 2006 levels by 2020
Tulare 2020 and 2030
Tulare County 1990 by 2020
Union City 20% below 2005 levels by 2020
Vallejo 15% below 2008 emissions by 2030
Ventura County 15% by 2020 over 2005
Vernon Being developed
West Hollywood 15% below 2008 levels by 2020, 25% below 2008 levels by 2035
West Sacramento 2020, 30% < business as usual
Whittier To be announced
Windsor 20% below 1990
Woodland 80% by 2050

Annual Planning Survey Results 2012 301
Appendix G: Greenhouse Gases (GHG)/Climate Action Plan
JuRisdictiOn tARGets And yeARs
Woodside CAP will plan for a 15% reduction from existing conditions.
Yolo County 396,355 MT CO2e/yr by 2020; 969,818 MT CO2e/yr by 2030
Yountville 20% by 2020
Yuba County In process
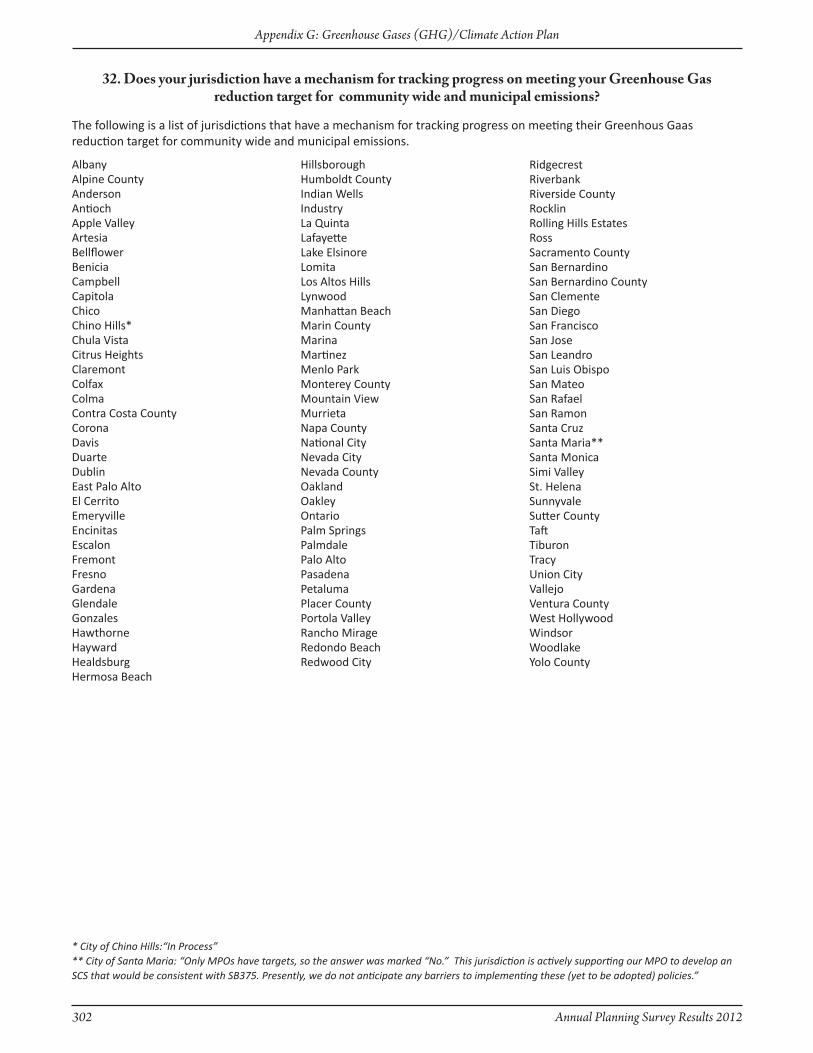
302 Annual Planning Survey Results 2012
Appendix G: Greenhouse Gases (GHG)/Climate Action Plan
AlbanyAlpine CountyAndersonAntiochApple ValleyArtesiaBellflowerBeniciaCampbellCapitolaChicoChino Hills*Chula VistaCitrus HeightsClaremontColfaxColmaContra Costa CountyCoronaDavisDuarteDublinEast Palo AltoEl CerritoEmeryvilleEncinitasEscalonFremontFresnoGardenaGlendaleGonzalesHawthorneHaywardHealdsburgHermosa Beach
HillsboroughHumboldt CountyIndian WellsIndustryLa QuintaLafayetteLake ElsinoreLomitaLos Altos HillsLynwoodManhattan BeachMarin CountyMarinaMartinezMenlo ParkMonterey CountyMountain ViewMurrietaNapa CountyNational CityNevada CityNevada CountyOaklandOakleyOntarioPalm SpringsPalmdalePalo AltoPasadenaPetalumaPlacer CountyPortola ValleyRancho MirageRedondo BeachRedwood City
RidgecrestRiverbankRiverside CountyRocklinRolling Hills EstatesRossSacramento CountySan BernardinoSan Bernardino CountySan ClementeSan DiegoSan FranciscoSan JoseSan LeandroSan Luis ObispoSan MateoSan RafaelSan RamonSanta CruzSanta Maria**Santa MonicaSimi ValleySt. HelenaSunnyvaleSutter CountyTaftTiburonTracyUnion CityVallejoVentura CountyWest HollywoodWindsorWoodlakeYolo County
* City of Chino Hills:“In Process”** City of Santa Maria: “Only MPOs have targets, so the answer was marked “No.” This jurisdiction is actively supporting our MPO to develop an SCS that would be consistent with SB375. Presently, we do not anticipate any barriers to implementing these (yet to be adopted) policies.”
32. Does your jurisdiction have a mechanism for tracking progress on meeting your Greenhouse Gas reduction target for community wide and municipal emissions?
The following is a list of jurisdictions that have a mechanism for tracking progress on meeting their Greenhous Gaas reduction target for community wide and municipal emissions.
Annual Planning Survey Results 2012 303
Appendix H: Miscellaneous
For all Appendices, the column headings in the dark blue colors were choices provided in the questions of the Annual Planning Survey. Column headings highlighted in light blue were responses provided by survey respondents.
Appendix H:Miscellaneous

304 Annual Planning Survey Results 2012
Appendix H: Miscellaneous
Page intentionally left blank

Annual Planning Survey Results 2012 305
Appendix H: Miscellaneous
H. Miscellaneuos
JuRisdictiOn tieR
1
tieR
2
Adelanto •
Apple Valley •
Artesia •
Avenal •
Bakersfield •
Baldwin Park •
Beverly Hills •
Biggs •
Buena Park •
Camarillo •
Campbell •
Carson •
Clovis •
Corona •
Culver City •
Davis •
East Palo Alto •
El Cerrito •
El Monte •
Encinitas •
Eureka •
Fremont •
Fullerton •
Gilroy •
Glendale •
Goleta •
Grass Valley •
Healdsburg •
Hemet •
Hermosa Beach •
La Mesa •
JuRisdictiOn tieR
1
tieR
2
La Mirada •
La Puente •
Larkspur •
Livermore •
Lomita •
Long Beach •
Los Alamitos •
Los Altos Hills •
Los Angeles County •
Madera •
Malibu •
Manhattan Beach •
Mendota •
Mill Valley •
Monterey •
Monterey Park •
Mountain View* •
Napa •
Newark •
Oakland •
Orange County •
Oroville •
Oxnard •
Pacific Grove •
Pacifica •
Palm Springs •
Palo Alto • •
Pasadena •
Paso Robles •
Perris •
Pismo Beach •
JuRisdictiOn tieR
1
tieR
2
Pomona •
Poway •
Rancho Cordova •
Rancho Santa Margarita •
Richmond •
Riverbank •
Riverside •
Rohnert Park •
Rolling Hills Estates •
Roseville •
Ross •
San Bruno •
San Francisco**
San Gabriel •
San Jose •
Sanger •
Santa Cruz***
Santa Rosa •
Seal Beach •
Simi Valley •
Sonoma •
St. Helena •
Stockton •
Trinity County •
Tulare •
Victorville •
West Hollywood • •
West Sacramento •
Whittier •
Windsor •
Yolo County •
*City of Mountain View: “We reference LEED and GPR and have not adopted Tier 1 or Tier 2”** City and County of San Francisco:“The City/County has not adopted Tier 1 or Tier 2; it has far more stringent standards than CalGreen Building Code.”*** City of Santa Cruz: “The City of Santa Cruz has implemented its own Green Building Ordinance as opposed to the CalGreen Building Code.”
33. If your jurisdiction has adopted standards above the CalGreen Building Code, what tier has it adopted?
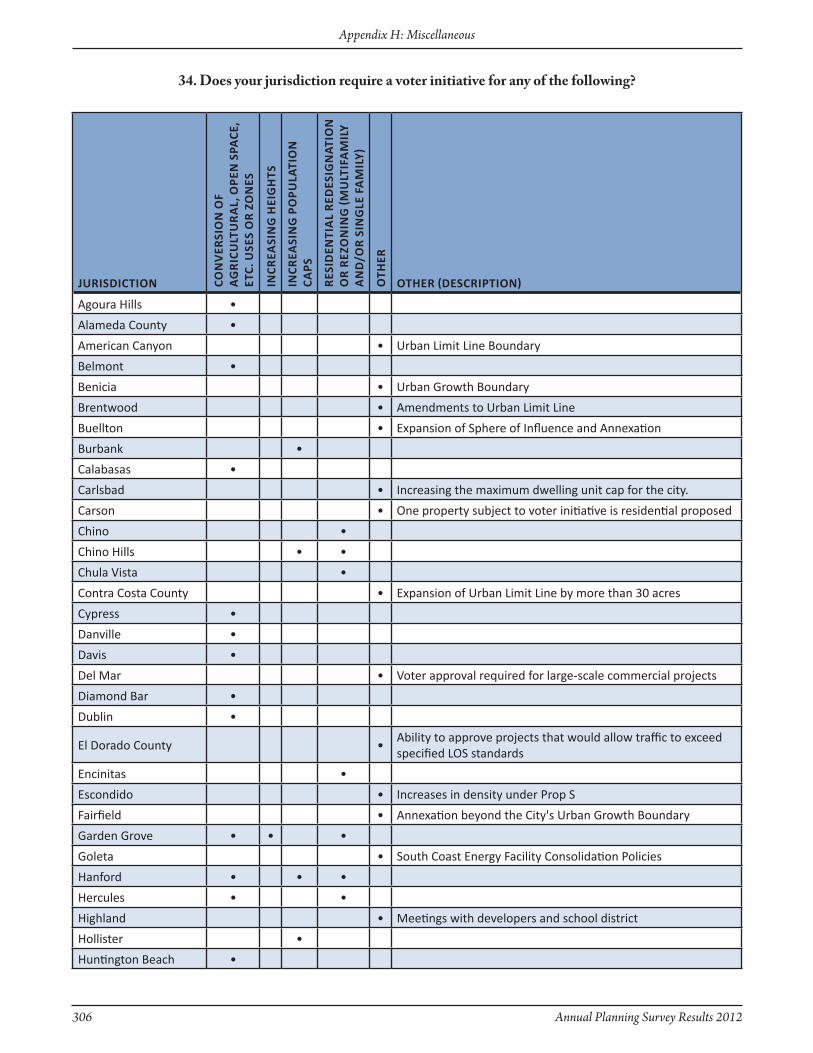
306 Annual Planning Survey Results 2012
Appendix H: Miscellaneous
JuRisdictiOn cOn
veR
siO
n O
f A
GR
icu
ltu
RA
l, O
Pen
sPA
ce,
etc.
use
s O
R Z
On
es
incR
eAsi
nG
hei
Gh
ts
incR
eAsi
nG
PO
PulA
tiO
n
cAPs
Res
iden
tiA
l R
edes
iGn
AtiO
n
OR
ReZ
On
inG
(Mu
ltif
AM
ily
An
d/O
R s
inG
le f
AM
ily)
Oth
eR
OtheR (descRiPtiOn)
Agoura Hills •
Alameda County •
American Canyon • Urban Limit Line Boundary
Belmont •
Benicia • Urban Growth Boundary
Brentwood • Amendments to Urban Limit Line
Buellton • Expansion of Sphere of Influence and Annexation
Burbank •
Calabasas •
Carlsbad • Increasing the maximum dwelling unit cap for the city.
Carson • One property subject to voter initiative is residential proposed
Chino •
Chino Hills • •
Chula Vista •
Contra Costa County • Expansion of Urban Limit Line by more than 30 acres
Cypress •
Danville •
Davis •
Del Mar • Voter approval required for large-scale commercial projects
Diamond Bar •
Dublin •
El Dorado County •Ability to approve projects that would allow traffic to exceed specified LOS standards
Encinitas •
Escondido • Increases in density under Prop S
Fairfield • Annexation beyond the City's Urban Growth Boundary
Garden Grove • • •
Goleta • South Coast Energy Facility Consolidation Policies
Hanford • • •
Hercules • •
Highland • Meetings with developers and school district
Hollister •
Huntington Beach •
34. Does your jurisdiction require a voter initiative for any of the following?

Annual Planning Survey Results 2012 307
Appendix H: Miscellaneous
JuRisdictiOn cOn
veR
siO
n O
f A
GR
icu
ltu
RA
l, O
Pen
sPA
ce,
etc.
use
s O
R Z
On
es
incR
eAsi
nG
hei
Gh
ts
incR
eAsi
nG
PO
PulA
tiO
n
cAPs
Res
iden
tiA
l R
edes
iGn
AtiO
n
OR
ReZ
On
inG
(Mu
ltif
AM
ily
An
d/O
R s
inG
le f
AM
ily)
Oth
eR
OtheR (descRiPtiOn)
Imperial Beach •
Lawndale • Large public facilities projects
Lincoln • Municipal Operations Greenhouse Gas Emissions Inventory
Manhattan Beach •For Residential- increase allowed floor area, or reduce setbacks, lot dimensions or lot area per dwelling unit
Marina •
Monrovia •
Monterey • zoning or Rezoning Visitor Accommodation Facilities
Monterey Park • • •
Moorpark • Expanding urban growth boundary
Moraga •
Morgan Hill •
Morro Bay •
Napa County •
Newport Beach • General Plan amendments that exceed certain thresholds
Novato • UGB
Oxnard •
Pacifica • •A vote of the people is required to allow housing on the Quarry Site
Piedmont • •
Pleasanton •
Poway • •
Rancho Mirage •
Redlands • Adding new General Plan designation
Redondo Beach • Major Changes in Land Use
San Bruno • • Increase density in residential districts
San Clemente •
San Juan Capistrano •
San Luis Obispo •
Santa Barbara •
Saratoga • •
Sausalito • •
Sebastopol • Changing Urban Growth Boundary
Simi Valley • Ventura SOAR
Solana Beach •

308 Annual Planning Survey Results 2012
Appendix H: Miscellaneous
JuRisdictiOn cOn
veR
siO
n O
f A
GR
icu
ltu
RA
l, O
Pen
sPA
ce,
etc.
use
s O
R Z
On
es
incR
eAsi
nG
hei
Gh
ts
incR
eAsi
nG
PO
PulA
tiO
n
cAPs
Res
iden
tiA
l R
edes
iGn
AtiO
n
OR
ReZ
On
inG
(Mu
ltif
AM
ily
An
d/O
R s
inG
le f
AM
ily)
Oth
eR
OtheR (descRiPtiOn)
Solano County •
South Pasadena •1983 voter intiative caps heights at 45 feet and limits parking variances to 5% of required parking. Changes to these two standards would require a vote.
St. Helena •
Stanislaus County •Conversion of Agriculturally zoned or designated land to Residential Uses
Thousand Oaks • • Increasing General Plan residential capacity
Union City • Change to the City's Hillside Area Plan
Ventura County •
Walnut Creek • •Increasing heights above 6 stories, or the height limit in place in 1985, whichever is lower.
Yorba Linda • • •
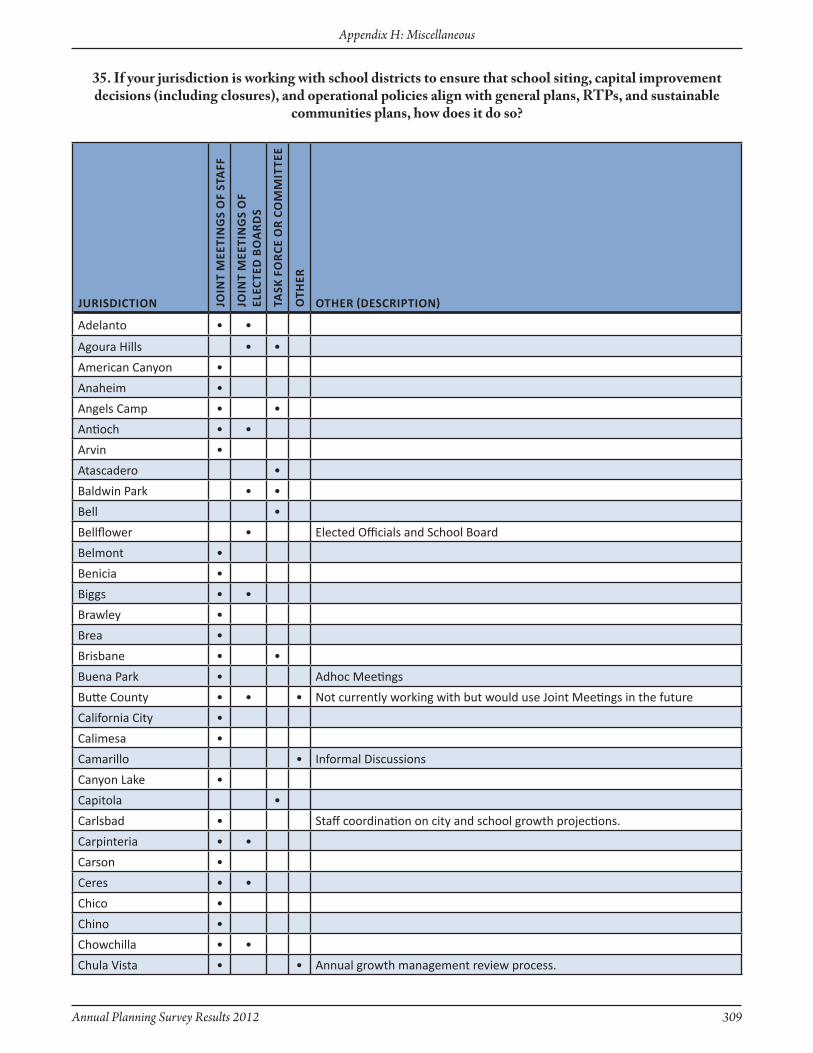
Annual Planning Survey Results 2012 309
Appendix H: Miscellaneous
JuRisdictiOn JOin
t M
eeti
nG
s O
f st
Aff
JOin
t M
eeti
nG
s O
f el
ecte
d B
OA
Rd
s
tAsk
fO
Rce
OR
cO
MM
itte
e
Oth
eROtheR (descRiPtiOn)
Adelanto • •
Agoura Hills • •
American Canyon •
Anaheim •
Angels Camp • •
Antioch • •
Arvin •
Atascadero •
Baldwin Park • •
Bell •
Bellflower • Elected Officials and School Board
Belmont •
Benicia •
Biggs • •
Brawley •
Brea •
Brisbane • •
Buena Park • Adhoc Meetings
Butte County • • • Not currently working with but would use Joint Meetings in the future
California City •
Calimesa •
Camarillo • Informal Discussions
Canyon Lake •
Capitola •
Carlsbad • Staff coordination on city and school growth projections.
Carpinteria • •
Carson •
Ceres • •
Chico •
Chino •
Chowchilla • •
Chula Vista • • Annual growth management review process.
35. If your jurisdiction is working with school districts to ensure that school siting, capital improvement decisions (including closures), and operational policies align with general plans, RTPs, and sustainable
communities plans, how does it do so?
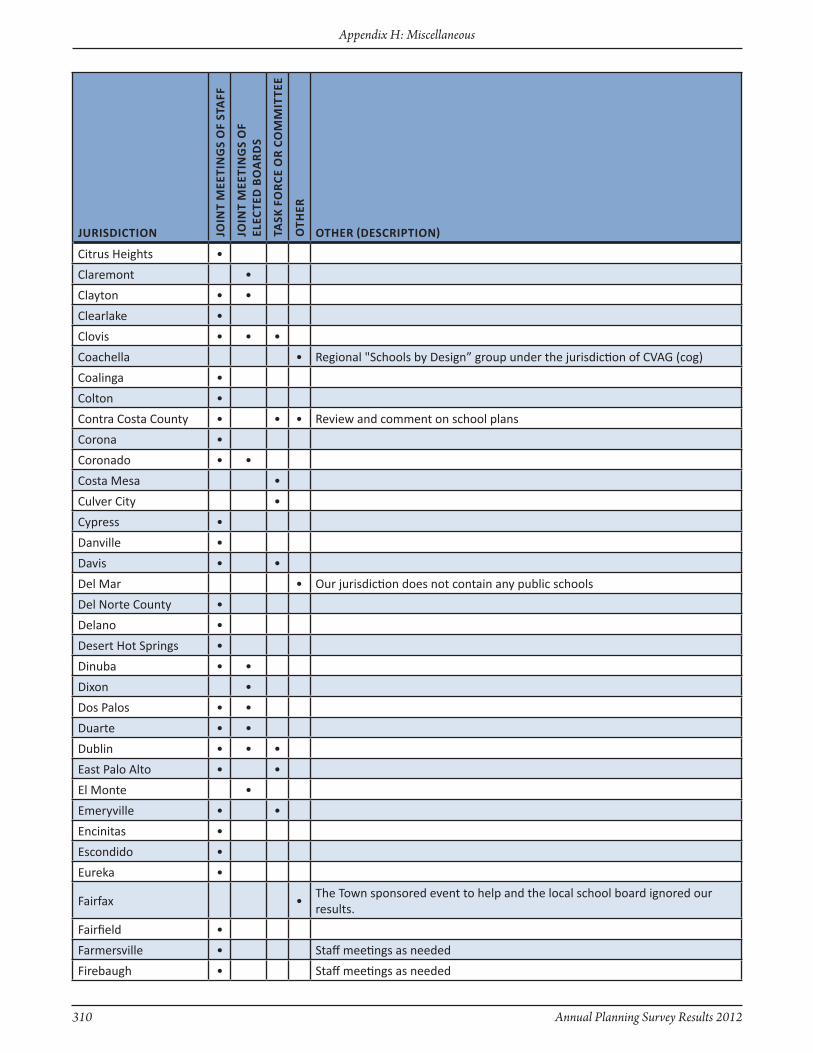
310 Annual Planning Survey Results 2012
Appendix H: Miscellaneous
JuRisdictiOn JOin
t M
eeti
nG
s O
f st
Aff
JOin
t M
eeti
nG
s O
f el
ecte
d B
OA
Rd
s
tAsk
fO
Rce
OR
cO
MM
itte
e
Oth
eR
OtheR (descRiPtiOn)
Citrus Heights •
Claremont •
Clayton • •
Clearlake •
Clovis • • •
Coachella • Regional "Schools by Design” group under the jurisdiction of CVAG (cog)
Coalinga •
Colton •
Contra Costa County • • • Review and comment on school plans
Corona •
Coronado • •
Costa Mesa •
Culver City •
Cypress •
Danville •
Davis • •
Del Mar • Our jurisdiction does not contain any public schools
Del Norte County •
Delano •
Desert Hot Springs •
Dinuba • •
Dixon •
Dos Palos • •
Duarte • •
Dublin • • •
East Palo Alto • •
El Monte •
Emeryville • •
Encinitas •
Escondido •
Eureka •
Fairfax •The Town sponsored event to help and the local school board ignored our results.
Fairfield •
Farmersville • Staff meetings as needed
Firebaugh • Staff meetings as needed
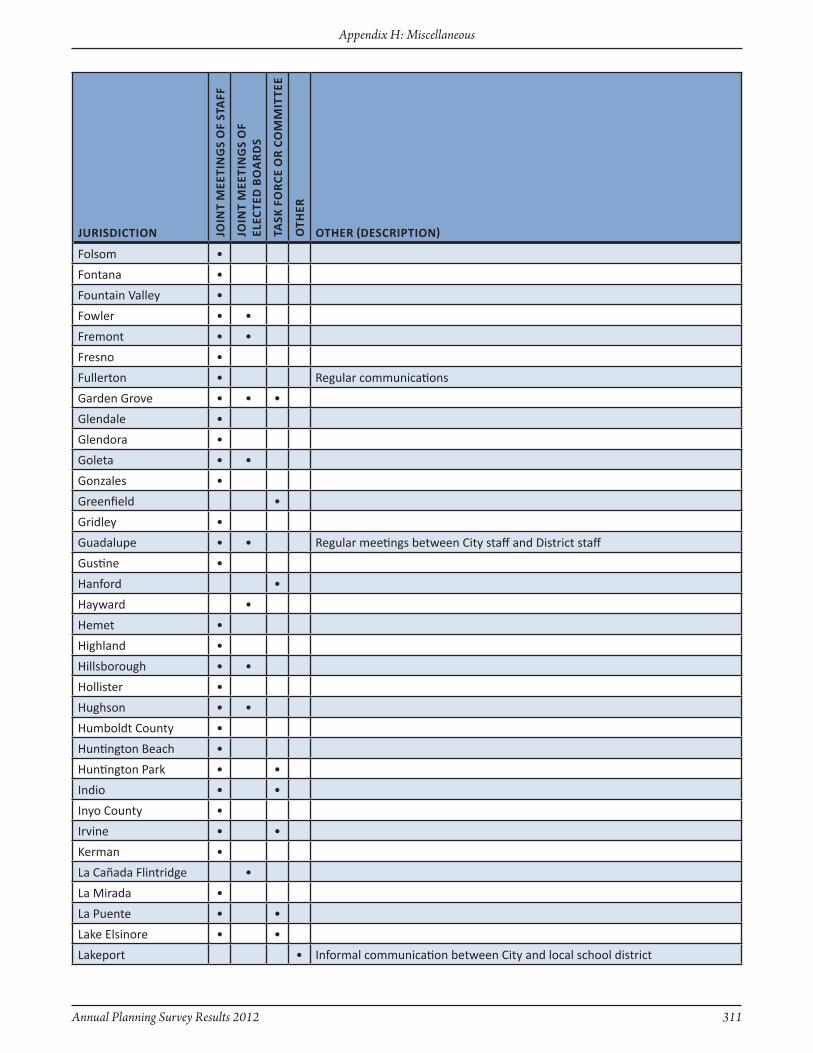
Annual Planning Survey Results 2012 311
Appendix H: Miscellaneous
JuRisdictiOn JOin
t M
eeti
nG
s O
f st
Aff
JOin
t M
eeti
nG
s O
f el
ecte
d B
OA
Rd
s
tAsk
fO
Rce
OR
cO
MM
itte
e
Oth
eR
OtheR (descRiPtiOn)
Folsom •
Fontana •
Fountain Valley •
Fowler • •
Fremont • •
Fresno •
Fullerton • Regular communications
Garden Grove • • •
Glendale •
Glendora •
Goleta • •
Gonzales •
Greenfield •
Gridley •
Guadalupe • • Regular meetings between City staff and District staff
Gustine •
Hanford •
Hayward •
Hemet •
Highland •
Hillsborough • •
Hollister •
Hughson • •
Humboldt County •
Huntington Beach •
Huntington Park • •
Indio • •
Inyo County •
Irvine • •
Kerman •
La Cañada Flintridge •
La Mirada •
La Puente • •
Lake Elsinore • •
Lakeport • Informal communication between City and local school district

312 Annual Planning Survey Results 2012
Appendix H: Miscellaneous
JuRisdictiOn JOin
t M
eeti
nG
s O
f st
Aff
JOin
t M
eeti
nG
s O
f el
ecte
d B
OA
Rd
s
tAsk
fO
Rce
OR
cO
MM
itte
e
Oth
eR
OtheR (descRiPtiOn)
Lakewood •
Larkspur •
Lassen County • •
Lawndale •
Lemon Grove • Through CEQA
Lincoln •
Livermore •
Livingston •
Lomita •
Loomis •
Los Altos • •
Los Angeles •
Los Banos • •
Los Gatos • Conferring on student generation rates
Madera • • School District is not very cooperative
Malibu • Schools not exempt from Coastal Permit Requirements
Manhattan Beach • • •
Manteca •
Marina •
Mariposa County •
Martinez • • •
Marysville • School district does not work with City
Maywood •
Mendota •
Menlo Park •
Merced •
Mill Valley •
Millbrae •
Milpitas • •
Mission Viejo • •
Moorpark •
Moraga • •
Moreno Valley • •
Mountain View •
Murrieta • •

Annual Planning Survey Results 2012 313
Appendix H: Miscellaneous
JuRisdictiOn JOin
t M
eeti
nG
s O
f st
Aff
JOin
t M
eeti
nG
s O
f el
ecte
d B
OA
Rd
s
tAsk
fO
Rce
OR
cO
MM
itte
e
Oth
eR
OtheR (descRiPtiOn)
Napa •
Nevada County •
Newark • • Coordination of Development Projects with School Officals
Newman • • Planning Commission
Norco •
Norwalk • City communicates with the school districts.
Novato • • •
Oakdale •
School districts tells us where they are locating a school site, they do not seek our land use advice and there are two school sites that are inappropriate/unsafe and the school district built a school site over the City's vigorous objections citing safety for the students.
Oakland •
Oakley • •
Ontario •Meet with districts on specific plan developments for establishing new school sites
Orinda • • •
Orland • •
Oxnard • •
Pacific Grove •
Palo Alto •
Paradise •
Paramount • • •
Parlier •
Pasadena • •
Paso Robles •
Patterson •
Perris •
Piedmont •
Pinole • •
Pittsburg •
Placer County •
Pleasant Hill •
Pleasanton • •
Pomona •
Porterville • • Coordination in developing Gen. Plan.
Portola •

314 Annual Planning Survey Results 2012
Appendix H: Miscellaneous
JuRisdictiOn JOin
t M
eeti
nG
s O
f st
Aff
JOin
t M
eeti
nG
s O
f el
ecte
d B
OA
Rd
s
tAsk
fO
Rce
OR
cO
MM
itte
e
Oth
eR
OtheR (descRiPtiOn)
Poway • We are not currently working on any of these initiatives with the schools
Rancho Cordova •
Rancho Cucamonga • Informal discussion and courtesy applications for CIP's
Rancho Mirage •
Rancho Santa Margarita
•
Red Bluff • City has no jurisdiction over School activities or districts
Redondo Beach •
Redwood City •
Reedley •
Rialto •
Richmond •
Ridgecrest •
Riverbank •
Riverside • •
Rocklin •
Rohnert Park •
Rosemead •
Roseville •
Ross • •
Sacramento County •
Salinas •
San Anselmo • • Meetings with staff and decision makers of other bodies.
San Benito County •
San Bernardino County • Public Works will comment on traffic related concerns.
San Carlos • •
San Diego •
San Diego County • Interjurisdictional review
San Dimas •
San Fernando •
San Francisco • • Technical assistance
San Gabriel • •
San Jacinto • Phone and written correspondence
San Jose •
San Juan Capistrano •
San Leandro • • Meet with elected officials and staff as needed.
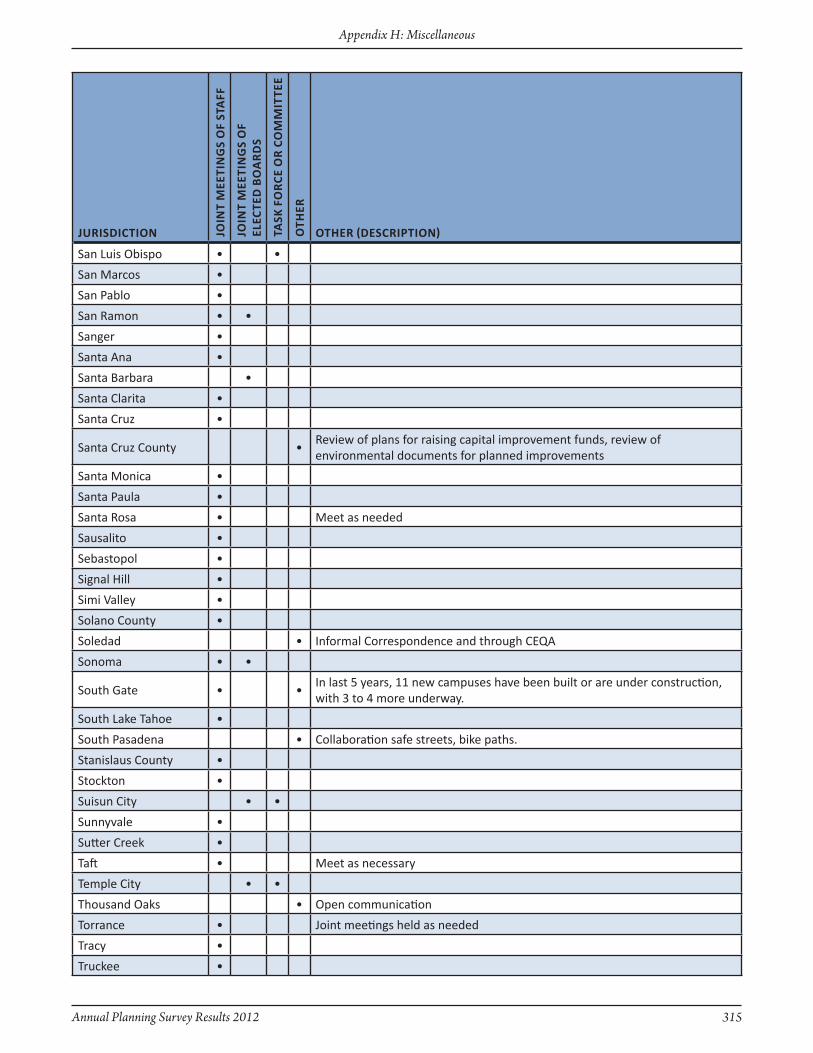
Annual Planning Survey Results 2012 315
Appendix H: Miscellaneous
JuRisdictiOn JOin
t M
eeti
nG
s O
f st
Aff
JOin
t M
eeti
nG
s O
f el
ecte
d B
OA
Rd
s
tAsk
fO
Rce
OR
cO
MM
itte
e
Oth
eR
OtheR (descRiPtiOn)
San Luis Obispo • •
San Marcos •
San Pablo •
San Ramon • •
Sanger •
Santa Ana •
Santa Barbara •
Santa Clarita •
Santa Cruz •
Santa Cruz County •Review of plans for raising capital improvement funds, review of environmental documents for planned improvements
Santa Monica •
Santa Paula •
Santa Rosa • Meet as needed
Sausalito •
Sebastopol •
Signal Hill •
Simi Valley •
Solano County •
Soledad • Informal Correspondence and through CEQA
Sonoma • •
South Gate • •In last 5 years, 11 new campuses have been built or are under construction, with 3 to 4 more underway.
South Lake Tahoe •
South Pasadena • Collaboration safe streets, bike paths.
Stanislaus County •
Stockton •
Suisun City • •
Sunnyvale •
Sutter Creek •
Taft • Meet as necessary
Temple City • •
Thousand Oaks • Open communication
Torrance • Joint meetings held as needed
Tracy •
Truckee •

316 Annual Planning Survey Results 2012
Appendix H: Miscellaneous
JuRisdictiOn JOin
t M
eeti
nG
s O
f st
Aff
JOin
t M
eeti
nG
s O
f el
ecte
d B
OA
Rd
s
tAsk
fO
Rce
OR
cO
MM
itte
e
Oth
eR
OtheR (descRiPtiOn)
Tulare • •
Tulare County • General Plan referral consultation process
Tuolumne County •
Turlock •
Ukiah •
Union City •
Upland •
Vacaville •
Ventura County • Share information on a case-by-case basis.
Victorville •
Visalia •
Vista •
Walnut •
Walnut Creek •
Wasco •
Waterford • Close working relationship with school administrators
West Sacramento •
Westlake Village •
Westminster • We have not had opportunity of new school siting.
Whittier • Public Works meets with school representatives as needed
Williams • •
Willits •
Willows • Transit meetings
Winters •
Woodland •
Yolo County •
Yorba Linda • •
Yountville • •
Yuba County •
Yucaipa •
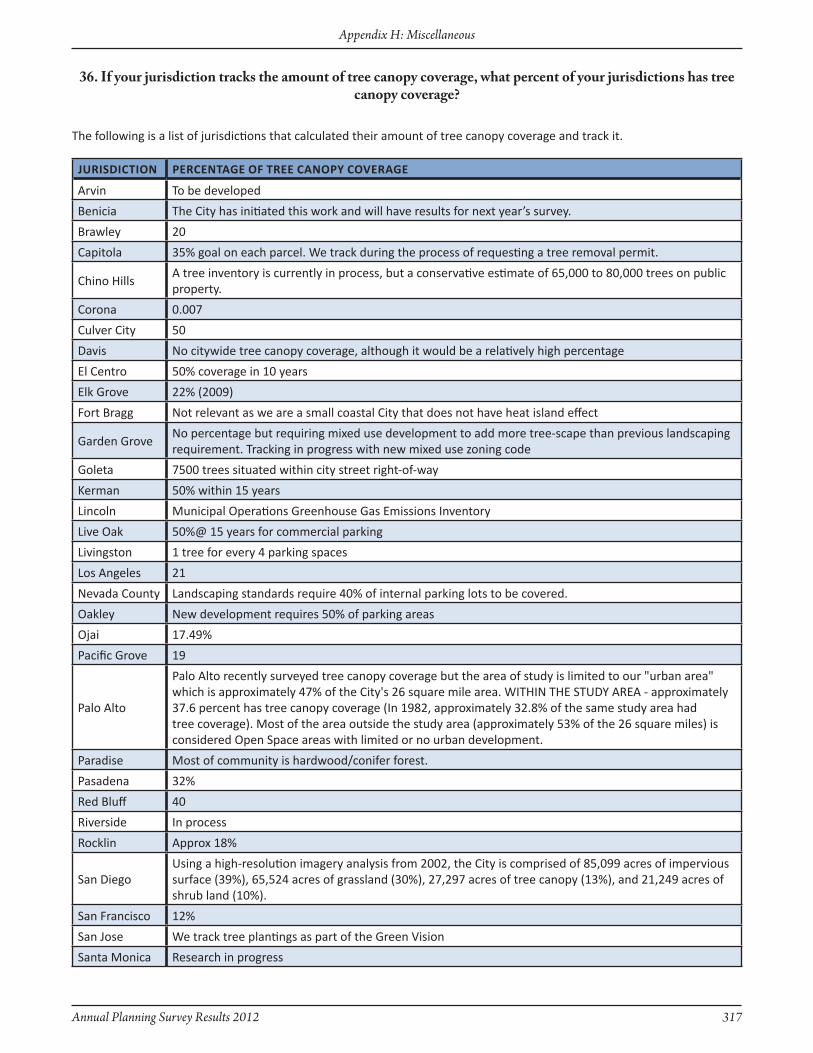
Annual Planning Survey Results 2012 317
Appendix H: Miscellaneous
JuRisdictiOn PeRcentAGe Of tRee cAnOPy cOveRAGe
Arvin To be developed
Benicia The City has initiated this work and will have results for next year’s survey.
Brawley 20
Capitola 35% goal on each parcel. We track during the process of requesting a tree removal permit.
Chino HillsA tree inventory is currently in process, but a conservative estimate of 65,000 to 80,000 trees on public property.
Corona 0.007
Culver City 50
Davis No citywide tree canopy coverage, although it would be a relatively high percentage
El Centro 50% coverage in 10 years
Elk Grove 22% (2009)
Fort Bragg Not relevant as we are a small coastal City that does not have heat island effect
Garden GroveNo percentage but requiring mixed use development to add more tree-scape than previous landscaping requirement. Tracking in progress with new mixed use zoning code
Goleta 7500 trees situated within city street right-of-way
Kerman 50% within 15 years
Lincoln Municipal Operations Greenhouse Gas Emissions Inventory
Live Oak 50%@ 15 years for commercial parking
Livingston 1 tree for every 4 parking spaces
Los Angeles 21
Nevada County Landscaping standards require 40% of internal parking lots to be covered.
Oakley New development requires 50% of parking areas
Ojai 17.49%
Pacific Grove 19
Palo Alto
Palo Alto recently surveyed tree canopy coverage but the area of study is limited to our "urban area" which is approximately 47% of the City's 26 square mile area. WITHIN THE STUDY AREA - approximately 37.6 percent has tree canopy coverage (In 1982, approximately 32.8% of the same study area had tree coverage). Most of the area outside the study area (approximately 53% of the 26 square miles) is considered Open Space areas with limited or no urban development.
Paradise Most of community is hardwood/conifer forest.
Pasadena 32%
Red Bluff 40
Riverside In process
Rocklin Approx 18%
San DiegoUsing a high-resolution imagery analysis from 2002, the City is comprised of 85,099 acres of impervious surface (39%), 65,524 acres of grassland (30%), 27,297 acres of tree canopy (13%), and 21,249 acres of shrub land (10%).
San Francisco 12%
San Jose We track tree plantings as part of the Green Vision
Santa Monica Research in progress
36. If your jurisdiction tracks the amount of tree canopy coverage, what percent of your jurisdictions has tree canopy coverage?
The following is a list of jurisdictions that calculated their amount of tree canopy coverage and track it.
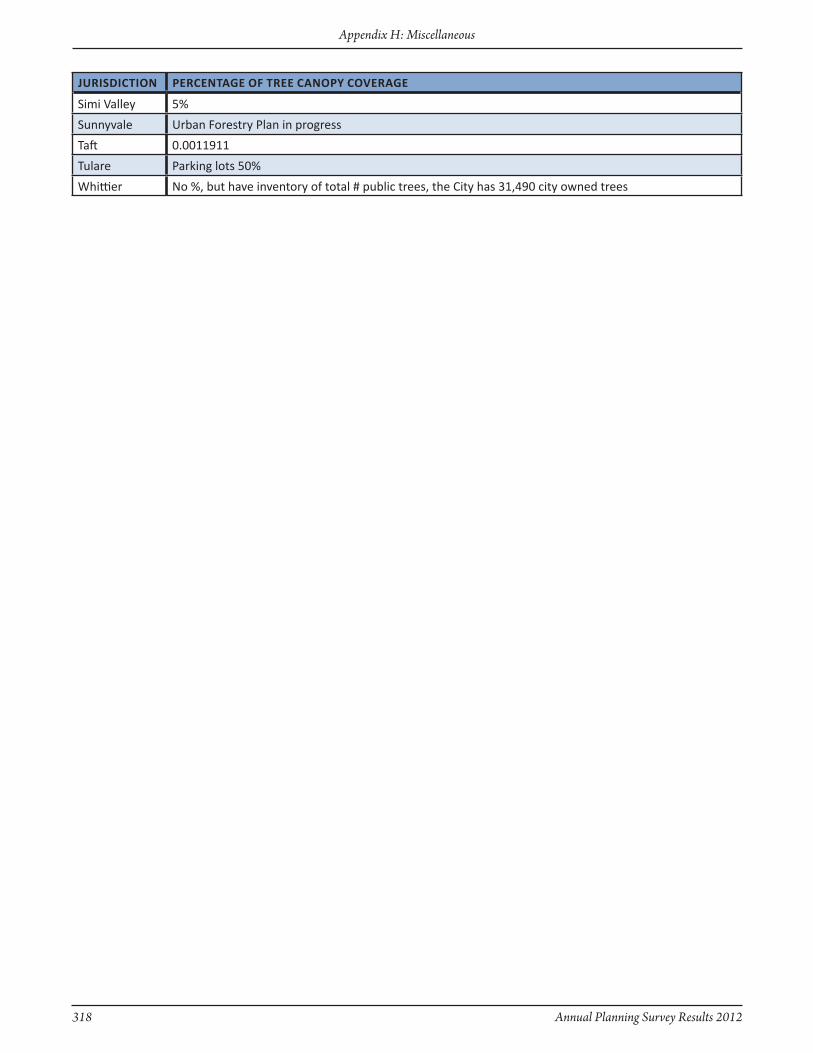
318 Annual Planning Survey Results 2012
Appendix H: Miscellaneous
JuRisdictiOn PeRcentAGe Of tRee cAnOPy cOveRAGe
Simi Valley 5%
Sunnyvale Urban Forestry Plan in progress
Taft 0.0011911
Tulare Parking lots 50%
Whittier No %, but have inventory of total # public trees, the City has 31,490 city owned trees

Annual Planning Survey Results 2012 319
Appendix H: Miscellaneous
AdelantoArcadiaBakersfieldBeniciaBeverly HillsBlytheCamarilloChino Hills
CommerceCovinaDixonFairfieldGilroyHermosa BeachHollisterLa Palma
37. Does your jurisdiction have a cool roofing/paving ordinance?
Lemon GroveLos AlamitosLos AngelesMenlo ParkMontebelloOaklandPalmdalePalo Alto
PasadenaRed BluffSangerSanta CruzSanteeSuisun CityWindsorWoodland
The following is a list of jurisdictions that have cool roofing/paving ordinances.
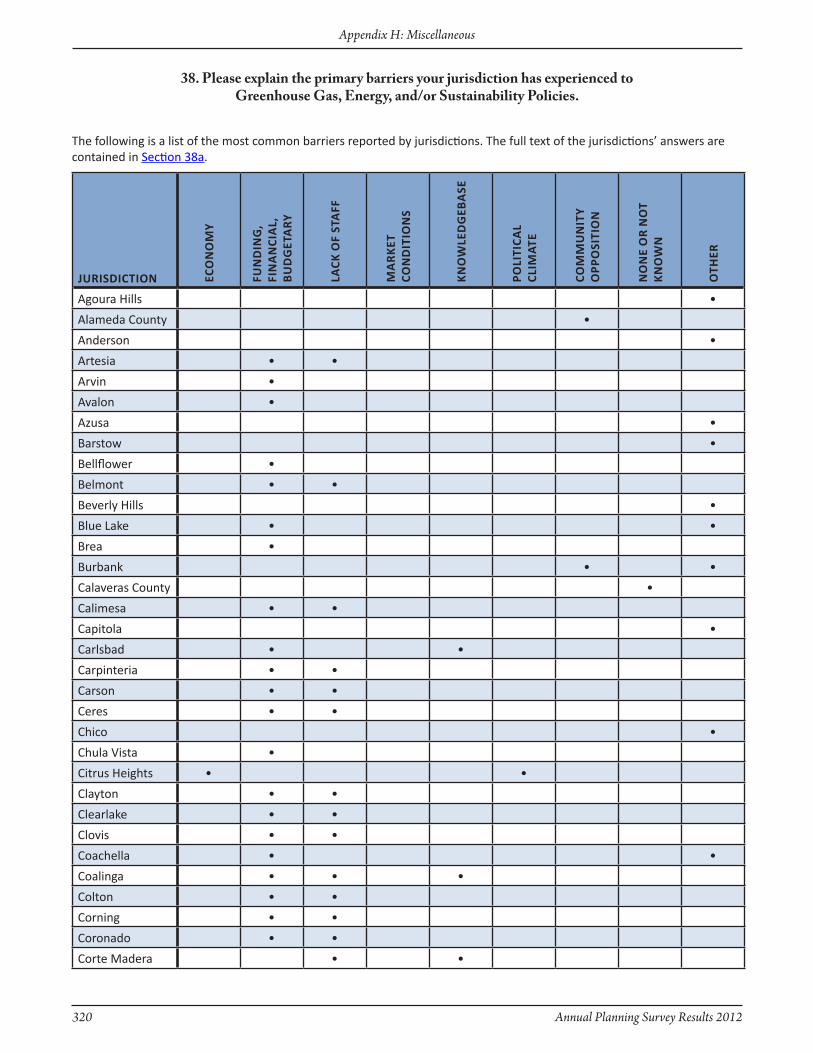
320 Annual Planning Survey Results 2012
Appendix H: Miscellaneous
JuRisdictiOn ecO
nO
My
fun
din
G,
fin
An
ciA
l,
Bu
dG
etA
Ry
lAck
Of
stA
ff
MA
Rk
et
cOn
dit
iOn
s
kn
OW
led
GeB
Ase
POli
ticA
l cl
iMAt
e
cOM
Mu
nit
y O
PPO
siti
On
nO
ne
OR
nO
t k
nO
Wn
Oth
eR
Agoura Hills •
Alameda County •
Anderson •
Artesia • •
Arvin •
Avalon •
Azusa •
Barstow •
Bellflower •
Belmont • •
Beverly Hills •
Blue Lake • •
Brea •
Burbank • •
Calaveras County •
Calimesa • •
Capitola •
Carlsbad • •
Carpinteria • •
Carson • •
Ceres • •
Chico •
Chula Vista •
Citrus Heights • •
Clayton • •
Clearlake • •
Clovis • •
Coachella • •
Coalinga • • •
Colton • •
Corning • •
Coronado • •
Corte Madera • •
38. Please explain the primary barriers your jurisdiction has experienced toGreenhouse Gas, Energy, and/or Sustainability Policies.
The following is a list of the most common barriers reported by jurisdictions. The full text of the jurisdictions’ answers are contained in Section 38a.
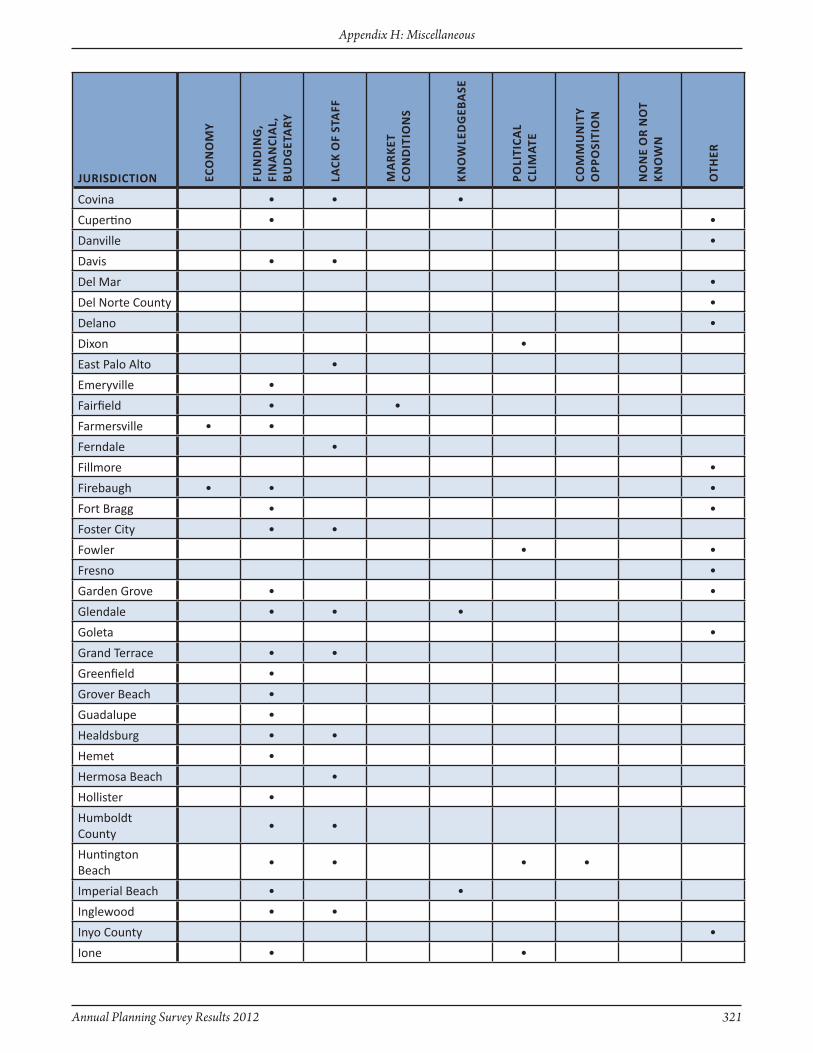
Annual Planning Survey Results 2012 321
Appendix H: Miscellaneous
JuRisdictiOn ecO
nO
My
fun
din
G,
fin
An
ciA
l,
Bu
dG
etA
Ry
lAck
Of
stA
ff
MA
Rk
et
cOn
dit
iOn
s
kn
OW
led
GeB
Ase
POli
ticA
l cl
iMAt
e
cOM
Mu
nit
y O
PPO
siti
On
nO
ne
OR
nO
t k
nO
Wn
Oth
eR
Covina • • •
Cupertino • •
Danville •
Davis • •
Del Mar •
Del Norte County •
Delano •
Dixon •
East Palo Alto •
Emeryville •
Fairfield • •
Farmersville • •
Ferndale •
Fillmore •
Firebaugh • • •
Fort Bragg • •
Foster City • •
Fowler • •
Fresno •
Garden Grove • •
Glendale • • •
Goleta •
Grand Terrace • •
Greenfield •
Grover Beach •
Guadalupe •
Healdsburg • •
Hemet •
Hermosa Beach •
Hollister •
Humboldt County
• •
Huntington Beach
• • • •
Imperial Beach • •
Inglewood • •
Inyo County •
Ione • •

322 Annual Planning Survey Results 2012
Appendix H: Miscellaneous
JuRisdictiOn ecO
nO
My
fun
din
G,
fin
An
ciA
l,
Bu
dG
etA
Ry
lAck
Of
stA
ff
MA
Rk
et
cOn
dit
iOn
s
kn
OW
led
GeB
Ase
POli
ticA
l cl
iMAt
e
cOM
Mu
nit
y O
PPO
siti
On
nO
ne
OR
nO
t k
nO
Wn
Oth
eR
Kern County •
Kings County •
La Mesa • •
La Quinta • •
Laguna Hills •
Laguna Woods •
Lakeport • •
Larkspur • •
Lawndale •
Lemon Grove • •
Livingston •
Los Alamitos •
Los Angeles •
Los Angeles County
•
Los Banos •
Madera • •
Manhattan Beach
•
Marin County • •
Marina •
Mariposa County • •
Mendocino County
•
Mendota • • •
Mill Valley • •
Millbrae •
Modesto • •
Modoc County • •
Montclair •
Montebello •
Monterey County
• •
Moorpark •
Morro Bay •
Mount Shasta •
Murrieta •
National City •
Newark •
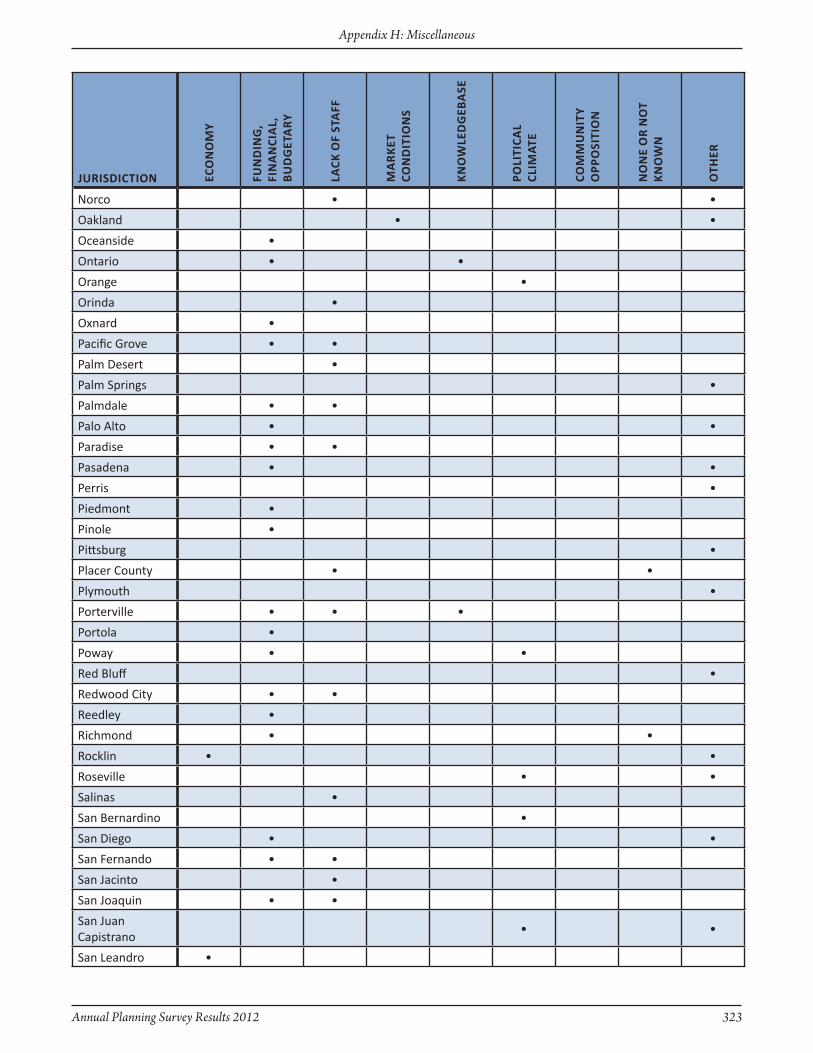
Annual Planning Survey Results 2012 323
Appendix H: Miscellaneous
JuRisdictiOn ecO
nO
My
fun
din
G,
fin
An
ciA
l,
Bu
dG
etA
Ry
lAck
Of
stA
ff
MA
Rk
et
cOn
dit
iOn
s
kn
OW
led
GeB
Ase
POli
ticA
l cl
iMAt
e
cOM
Mu
nit
y O
PPO
siti
On
nO
ne
OR
nO
t k
nO
Wn
Oth
eR
Norco • •
Oakland • •
Oceanside •
Ontario • •
Orange •
Orinda •
Oxnard •
Pacific Grove • •
Palm Desert •
Palm Springs •
Palmdale • •
Palo Alto • •
Paradise • •
Pasadena • •
Perris •
Piedmont •
Pinole •
Pittsburg •
Placer County • •
Plymouth •
Porterville • • •
Portola •
Poway • •
Red Bluff •
Redwood City • •
Reedley •
Richmond • •
Rocklin • •
Roseville • •
Salinas •
San Bernardino •
San Diego • •
San Fernando • •
San Jacinto •
San Joaquin • •
San Juan Capistrano
• •
San Leandro •
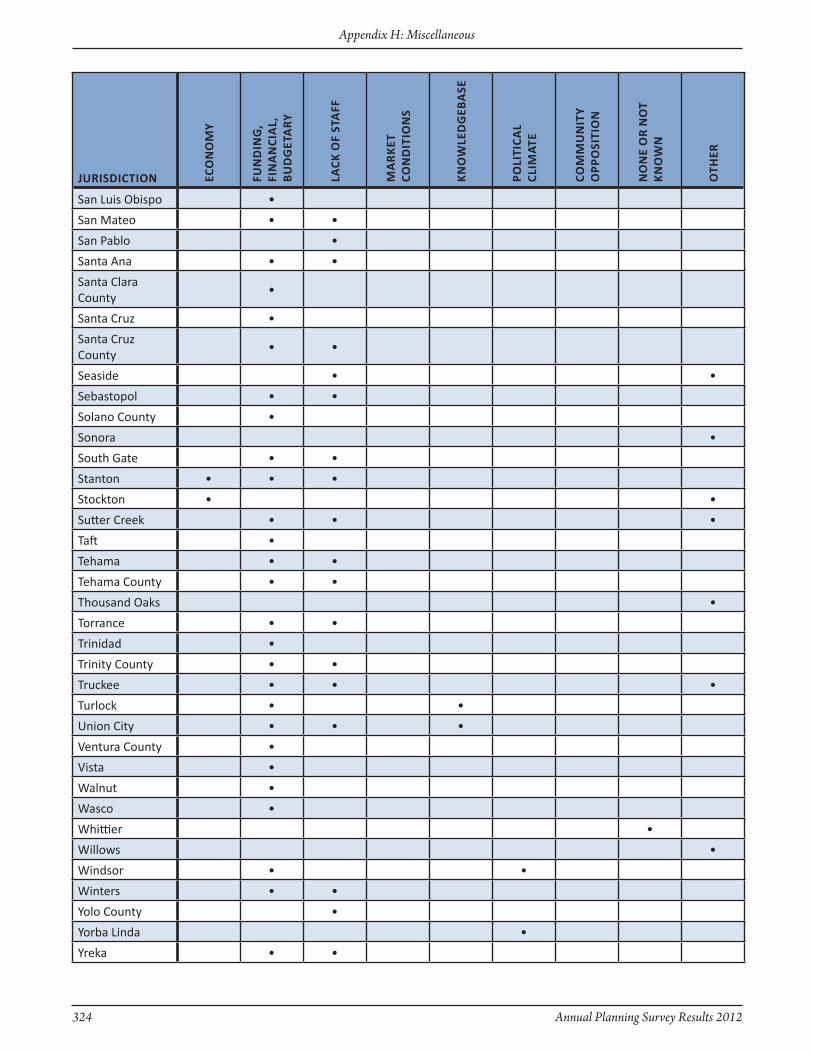
324 Annual Planning Survey Results 2012
Appendix H: Miscellaneous
JuRisdictiOn ecO
nO
My
fun
din
G,
fin
An
ciA
l,
Bu
dG
etA
Ry
lAck
Of
stA
ff
MA
Rk
et
cOn
dit
iOn
s
kn
OW
led
GeB
Ase
POli
ticA
l cl
iMAt
e
cOM
Mu
nit
y O
PPO
siti
On
nO
ne
OR
nO
t k
nO
Wn
Oth
eR
San Luis Obispo •
San Mateo • •
San Pablo •
Santa Ana • •
Santa Clara County
•
Santa Cruz •
Santa Cruz County
• •
Seaside • •
Sebastopol • •
Solano County •
Sonora •
South Gate • •
Stanton • • •
Stockton • •
Sutter Creek • • •
Taft •
Tehama • •
Tehama County • •
Thousand Oaks •
Torrance • •
Trinidad •
Trinity County • •
Truckee • • •
Turlock • •
Union City • • •
Ventura County •
Vista •
Walnut •
Wasco •
Whittier •
Willows •
Windsor • •
Winters • •
Yolo County •
Yorba Linda •
Yreka • •

Annual Planning Survey Results 2012 325
Appendix H: Miscellaneous
JuRisdictiOn BARRieRs
Agoura Hills Aesthetics related to green building design.
Alameda County Community opposition
Anderson We are a small community that works with the RTPA to implement and track GHG's.
Artesia Lack of funding and staffing
Arvin Budgetary woes
Avalon Funding
Azusa Primary barrier is the lack of such policies for staff to implement.
Barstow We have a considerable amount of transient vehicles contributing to the local air quality. Local air quality is also impacted during heavy winds when airborne pollutants are brought into our basin from outside area.
Bellflower Financing
Belmont Many of these items are in progress - staff availability and financial costs are most likely the biggest factors in delaying these actions.
Beverly Hills Fully understanding the potential ultimate outcome of implementing measures.
Blue Lake Funding - most grant funding is allocated for urban areas only; rural areas are ignored. SGC especially awards urban areas only.
Brea No funding budgeted.
Burbank Cost versus benefit of policies, programs, etc. Perceived burden to residents and/or businesses. Lack of pubic and/or political support.
Calaveras County General Plan update is underway, giving consideration to these issues. The General Plan update has not been released for public comment yet. Barriers to implementation are not yet known.
Calimesa Money and staff time
Capitola Implementing is not the challenge, we are still developing the Climate Action Plan and Greenhouse Reduction Plan. Implementing will be a challenge as many of the programs will require resources that are not available.
Carlsbad Expertise needed and the cost to prepare the necessary plans.
Carpinteria Limited staffing and costs/budgets
Carson Staffing and funding limitations.
Ceres Lack of funding, staff, and time to work on these issues.
Chico Residents' concerns over costs, government imposing more requirements, and the potential to discourage business and economic development.
Chula Vista Overcoming cost barriers (real and perceived).
Citrus Heights One of the primary barriers to implementing greenhouse gas, energy, and/or sustainability policies is the economic downturn we are all experiencing. Existing incentives offered by utilities for residential energy conservation measures and on-site renewable energy generation have not created the high demand for energy efficiency residential retrofits as anticipated. As home values have dropped and loans more difficult to obtain, residents and businesses have less capacity to make energy efficiency improvements on their properties. Additionally the national leadership has not wholeheartedly supported sustainability efforts during these difficult times. For example the FHFA halted a highly anticipated financing option, property accessed clean energy program, that would have allowed cities/counties to finance energy efficiency residential retrofits.
Clayton Staffing/Cost
Clearlake Frequent staff turnovers and severe budget cuts have prolonged the General Plan revision process and delayed adoption of energy and climate policies.
38a. Narrative answers to the barriers jurisdictions have experienced to implementingGreenhouse Gas, Energy, and/or Sustainability policies.

326 Annual Planning Survey Results 2012
Appendix H: Miscellaneous
JuRisdictiOn BARRieRs
Clovis Limitations on staffing, funding
Coachella The major barriers to developing policies and practices related to GHG, Energy and Sustainability are cost, education of local developers and gaining their acceptance of a new way of doing business and the private sector costs associated with the change. Also important to the process is the development of reliable measurement models.
Coalinga Funding availability for these types of programs have made it difficult to implement. If funding were available, consultants would be obtained due to lack of staff.
Colton Staff levels and funding.
Corning Lack of staff time and financial resources.
Coronado Lack of funding and lack of staffing capabilities
Corte Madera Limited staff resources and expertise.
Covina At this time the Planning Division lacks staff members and lacks funds to train staff to implement [these policies].
Cupertino Concerns with economic costs, distaste for mandatory requirements, very conservative approach to all things new.
Danville GHG and Sustainability policies under development as part of the general plan update.
Davis Financial and staff resources to implement programs. Inability to secure grant funding for behaviorial switch research and programs. Staff time and resources needed to attempt to secure grant funding. Federal barriers to implementation of PACE programs (Fannie/Freddie interference). State legislative and administrative barriers in the energy sector, including innovative market based renewal energy strategies.
Del Mar Having time available amongst our other duties to plan and develop climate-change programs
Del Norte County Lack of specific data as it relates to the non Metropolitan Areas in the state (i.e. rural targets and goals).
Delano The City has received a Smart Valley Places grant as part of a San Joaquin Valley Wide compact of cities and organizations, funded by HUD's Sustainable Communities Program. The grant will fund preparation of a sustainable community element and a healthy Delano and wellness element as part of the General Plan. The City is also receiving financial assistance from Southern California Edison Company and the regional COG to develop a city operations and a community greenhouse gas inventory, a Climate Action Plan, and Green Building Code program.
Dixon City Council is somewhat resistant to the whole concept of global warming.
East Palo Alto Lack of staff resources.
Emeryville Lack of funding
Fairfield Funding for planning programs and projects, funding of capital facilities, existing market conditions, local market preferences for low density suburban development.
Farmersville Lack of funding for the preparation of policies/ordinances. The economic slowdown has also reduced the perceived need to adopt such policies.
Ferndale Limited staff time to dedicate to implementing such policies.
Fillmore No community interest and views these as obstacle to progress.
Firebaugh Lack of perceived need, lack of funds, plus economic slowdown.
Fort Bragg The primary barrier is funding and time. City Council has a lot of will to do the right thing in this area. Transitioning our operations toward sustainability is an ongoing process that takes both time and money.
Foster City Staffing/funding to draft policy documents and GHG inventories.
Fowler The Council is overwhelmed trying to survive; GHG and other policies are simply not a priority
Fresno Lack of public awareness of impacts and need for mitigations.

Annual Planning Survey Results 2012 327
Appendix H: Miscellaneous
JuRisdictiOn BARRieRs
Garden Grove Costs involved with implementation of new policies and procedures, permitting costs for residence is sometimes higher than no action at all, long processing time for review of plans, energy and conservation efforts and education efforts are difficult for the type of demographics. Green Building workshops provided and created for Community Outreach but not that many participants and vendors who are interested in sustainability. For example, the public is not willing to spend the time to remove landscaping to save water; they rather pave their entire front yard with cement. It is hard for us to get the residence to apply for regular building permits to legalize illegal construction, therefore it might be even more difficult to install energy efficient utilities.
Glendale Funding for development of a Greenhouse Gas Reduction program, lack of staff expertise (or funding to hire the expertise) and cost to prepare special studies, public outreach and CEQA documents, are primary barriers in implementing policy. Glendale received a grant and that is why the City was able to hire temporary staff to draft a Greener Glendale Plan for Municipal Operations and a Greener Glendale Plan for Community Activities. These are sustainability plans and include an inventory of GHG and GHG reduction strategies and programs. Once this grant is exhausted, we will not be able to keep staff to continue implementing these programs. Unfortunately, CEQA costs are not included in the grant, which limits the effectiveness of these plans--since now every program will be subject to independent environmental review. The State should make a CEQA exemption for creation and implementation of Climate Action Plans and Sustainability Plans.
Goleta Preparation of a GHG inventory, Climate Action/GHG management plan are underway. Completion is forecast for fiscal year 2011/2012.
Grand Terrace Costs, insufficient staff resources
Greenfield Lack of priority and resources
Grover Beach Lack of funds
Guadalupe Obtaining funding to prepare a Climate Action Plan. The City has applied for such funding in the past and will continue to seek this funding.
Healdsburg Lack of staffing and financial resources
Hemet The City is currently operating with a budget deficit and is seeking additional cost-saving measures. We do not have the funding, resources or staffing to devote to tracking and implementation of these measures at this time, in addition to other unfunded mandates dictated by the State of California on local agencies.
Hermosa Beach Staff resources
Hollister Lack of city funding to prepare and implement programs.
Humboldt County Staff and financial limitations
Huntington Beach Funding; staff time; staff expertise; priorities; political leadership
Imperial Beach Funding and expertise are needed to assess sea level rise impacts along the oceanfront and river valley; and funding and expertise are needed for community-wide studies to assess for, mitigate for, and adapt to the effects of GHG impacts.
Inglewood Budget constraints; limited staff resources to be applied to this effort
Inyo County Regulatory burdens (CEQA)
Ione Fiscal cost associated with preparing analysis and planning; fiscal cost with plan implementation; no political desire to implement additional regulations.
Kern County Cost
Kings County Continual drain of Local funds to sustain qualified staff or hire qualified consultants.
La Mesa Lack of funding and lack of staff to work on it
La Quinta Political and financial
Laguna Hills Lack of funding for developing/implementing a Climate Action Plan and other policies.
Laguna Woods Our city is primarily built out. The average resident’s age is 78. Not a lot of renovations.
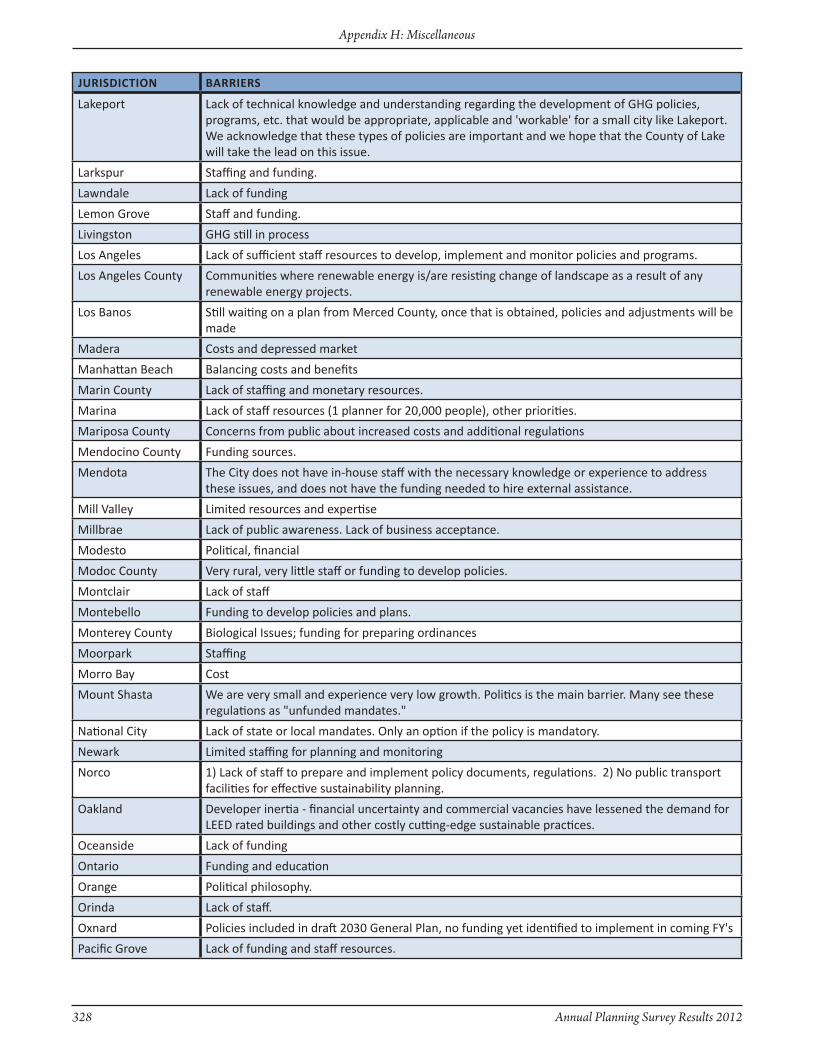
328 Annual Planning Survey Results 2012
Appendix H: Miscellaneous
JuRisdictiOn BARRieRs
Lakeport Lack of technical knowledge and understanding regarding the development of GHG policies, programs, etc. that would be appropriate, applicable and 'workable' for a small city like Lakeport. We acknowledge that these types of policies are important and we hope that the County of Lake will take the lead on this issue.
Larkspur Staffing and funding.
Lawndale Lack of funding
Lemon Grove Staff and funding.
Livingston GHG still in process
Los Angeles Lack of sufficient staff resources to develop, implement and monitor policies and programs.
Los Angeles County Communities where renewable energy is/are resisting change of landscape as a result of any renewable energy projects.
Los Banos Still waiting on a plan from Merced County, once that is obtained, policies and adjustments will be made
Madera Costs and depressed market
Manhattan Beach Balancing costs and benefits
Marin County Lack of staffing and monetary resources.
Marina Lack of staff resources (1 planner for 20,000 people), other priorities.
Mariposa County Concerns from public about increased costs and additional regulations
Mendocino County Funding sources.
Mendota The City does not have in-house staff with the necessary knowledge or experience to address these issues, and does not have the funding needed to hire external assistance.
Mill Valley Limited resources and expertise
Millbrae Lack of public awareness. Lack of business acceptance.
Modesto Political, financial
Modoc County Very rural, very little staff or funding to develop policies.
Montclair Lack of staff
Montebello Funding to develop policies and plans.
Monterey County Biological Issues; funding for preparing ordinances
Moorpark Staffing
Morro Bay Cost
Mount Shasta We are very small and experience very low growth. Politics is the main barrier. Many see these regulations as "unfunded mandates."
National City Lack of state or local mandates. Only an option if the policy is mandatory.
Newark Limited staffing for planning and monitoring
Norco 1) Lack of staff to prepare and implement policy documents, regulations. 2) No public transport facilities for effective sustainability planning.
Oakland Developer inertia - financial uncertainty and commercial vacancies have lessened the demand for LEED rated buildings and other costly cutting-edge sustainable practices.
Oceanside Lack of funding
Ontario Funding and education
Orange Political philosophy.
Orinda Lack of staff.
Oxnard Policies included in draft 2030 General Plan, no funding yet identified to implement in coming FY's
Pacific Grove Lack of funding and staff resources.

Annual Planning Survey Results 2012 329
Appendix H: Miscellaneous
JuRisdictiOn BARRieRs
Palm Desert One existing staff person has the unofficial title of Sustainability Coordinator. That staff person's main role is an Assistant Planner. One staff person to conduct two separate jobs creates a barrier when more time could be expended in two separate jobs moving initiatives forward more quickly.
Palm Springs Difficulty in relating community goals to household actions.
Palmdale 1. Not enough staff 2. Not enough funding
Palo Alto Cost of major infrastructure upgrades. Community operational data collection/data monitoring.
Paradise Severe and crippling staffing and funding constraints on a perennial basis.
Pasadena Financial; Efforts to coordinate across city departments; Legal climate
Perris The lack of education in the part of the applicant.
Piedmont Funding.
Pinole Lack of financial resources.
Pittsburg There is significant developer resistance to adoption of standards above those required in current Building Code due to the economic downturn. Adoption of sustainable standards and requirements over and above existing Building Code are seen as increasing the cost of development and therefore inhibiting growth and development.
Placer County No barriers except for reduced staffing, which limits the County's ability to draft more implementing ordinances.
Plymouth Currently working cooperatively with other jurisdictions in Amador County, Sierra Business Council, PG&E to develop GHG inventory.
Porterville Lack of staff, resources and knowledge regarding the issue.
Portola Lack of funding
Poway Need commitment on policy direction from City Council. Lack of resources.
Red Bluff The Greencode adds unbearable costs to low income projects and half of the required products are not available. Also, Greenhouse gas is emitted through human resperation and is required by plants for photosynthesis which then produces oxygen. Greenhouse gas increases crop yields and the amount of greenery that is needed to provide a viable habitat for all creatures. As far as energy, solar on structures is the best way to reduce oil dependency, as the future of electric cars could replace gas. A solar program by the state and feds could replace manufacturing jobs and construction trade jobs lost in the past two decades as long as we place standards on the products that supersede China’s products.
Redwood City Reduction in staff levels and overall budget constraints
Reedley Money - will address in current General Plan Update
Richmond No barriers, we are in the process of seeking funding and performing public outreach for our Climate Action Plan.
Rocklin The cost of the mitigation during these economic times.
Roseville Public/elected opposition regarding costs to businesses
Salinas Lack of dedicated staff resources.
San Bernardino Varying political perspectives among electeds
San Diego 1. Declining state and local funding for transit 2. Savings to come from retrofits is more difficult to implement than new construction 3. Constrained government budgets at the local and state level
San Fernando Inability to allocate financial resources as part of the annual budget at a sufficient level to contract for professional services to assist limited number of planning staff with a comprehensive general plan update that will also result in plan element updates including benchmarks for greenhouse gas emissions as part of public and/or private development projects. We are nonetheless looking at making some updates during the upcoming Fiscal Year 2012-2013 to the Housing Element.
San Jacinto 2-person Planning Dept
San Joaquin Lack of staff and funding.

330 Annual Planning Survey Results 2012
Appendix H: Miscellaneous
JuRisdictiOn BARRieRs
San Juan Capistrano Are politically viewed by some as being anti-business by imposing additional costs on businesses and their operators/owners.
San Leandro The economy is the primary obstacle.
San Luis Obispo Upfront costs to community for energy-efficiency upgrades or renewable energy systems.
San Mateo Department budget and staff constraints
San Pablo Reduced staffing levels.
Santa Ana Staff resources and funding.
Santa Clara County Re Gov't Ops for GHG/CAP implementation, OPR should organize local government activities under a common Plan template, methodology and inventory tool, allowing comparative analysis, reporting and projections on a local, regional and/or statewide basis that reflects consistency and continuity. Re: Community Energy and Sustainability Plan Implementation, SCC likely shares a shortage of funding and resources to develop and aggressively implement these plans. State agencies should engage more the sustainability officers of local gov'ts in activities under SB 375. Local gov'ts would benefit from more financing tools/mechanisms to stimulate energy efficiency programs, and for State agencies to recognize how well local governments are positioned to apply existing outreach and communications programs, and to tailor programs that are the most promising and effective.
Santa Cruz Primary barrier is funding.
Santa Cruz County In this economy, primarily a lack of funding and staff to address the issues.
Seaside Limited staff; The Regional Planning Agency (AMBAG) is taking lead role in developing policies and programs for the cities to follow.
Sebastopol Lack of funds, staff.
Solano County Funds
Sonora Lack of good models for small jurisdictions.
South Gate Staff and Money. Department has lost more than 50% of staff overall. Planning group down nearly 80%. Combined CRA/Planning, which was combined is down 75%. Housing which handles all Housing and grants (federal, state and CRA) is 50%. General Plan took 5 years due to limited finances. Received State sustainability grant to complete zoning ordinance. Also received grant on energy.
Stanton Our City currently does not have the man power to develop the necessary ordinances or programs to implement the policies or track the progression. In addition, due to the economic downturn, the City does not have any funding to contract with consultants to develop the policies and strategies for the City.
Stockton Current economic conditions/business climate/unemployment rate
Sutter Creek Currently working with ICLEI, PG&E, etal. Workforce reductions and expenses. Need additional staff and resources committed to the completion of the project.
Taft Money
Tehama Lack of resources, personnel, and funds. We are a very small city that is basically residential and agricultural as we are entirely in a floodplain.
Tehama County Lack of funds and staff necessary to draft, administrate and monitor.
Thousand Oaks The primary barriers are conflicts with other important needs and concerns, including needs and concerns pertaining to economic development, land use compatibility, housing, traffic, noise, safety, conservation and the preservation of open space.
Torrance Funding and staffing.
Trinidad Too small, no funding
Trinity County Funding and Staff
Truckee Funding/staffing/community prioritization. Currently, creating jobs and revenue are a higher priority.
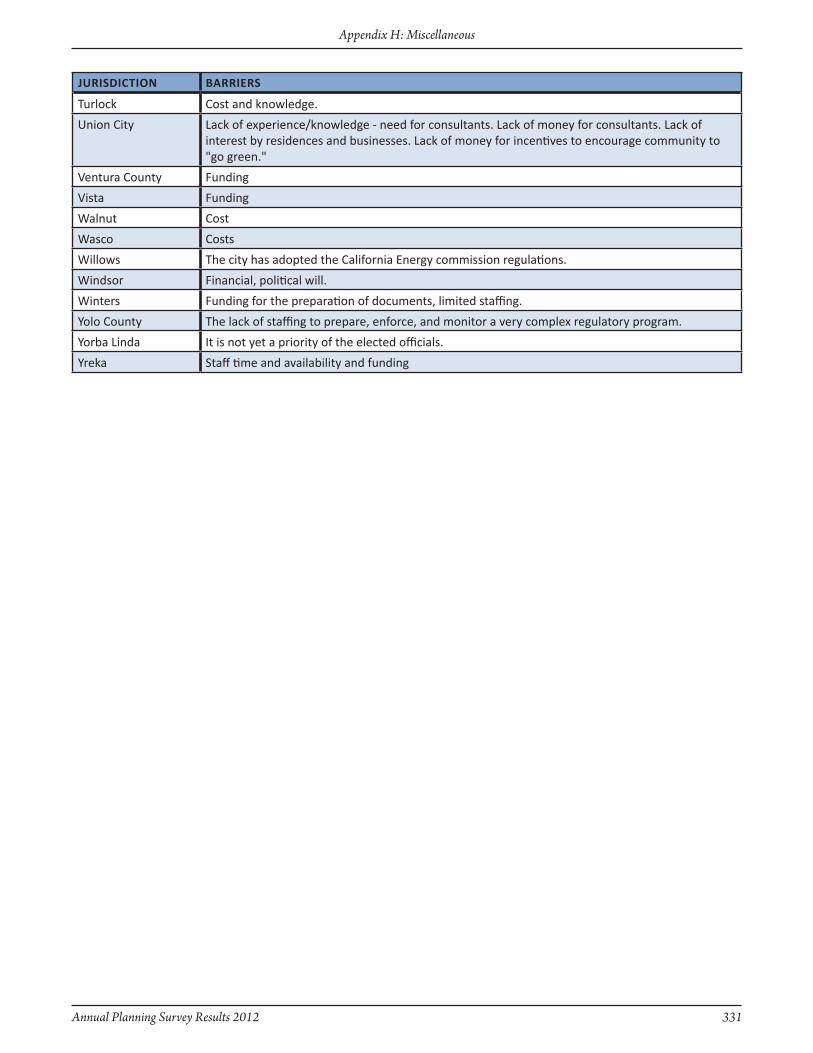
Annual Planning Survey Results 2012 331
Appendix H: Miscellaneous
JuRisdictiOn BARRieRs
Turlock Cost and knowledge.
Union City Lack of experience/knowledge - need for consultants. Lack of money for consultants. Lack of interest by residences and businesses. Lack of money for incentives to encourage community to "go green."
Ventura County Funding
Vista Funding
Walnut Cost
Wasco Costs
Willows The city has adopted the California Energy commission regulations.
Windsor Financial, political will.
Winters Funding for the preparation of documents, limited staffing.
Yolo County The lack of staffing to prepare, enforce, and monitor a very complex regulatory program.
Yorba Linda It is not yet a priority of the elected officials.
Yreka Staff time and availability and funding
332 Annual Planning Survey Results 2012
Appendix H: Miscellaneous
Page intentionally left blank

Annual Planning Survey Results 2012 333
Appendix I: Annual Planning Survey Results/Book of Lists Topic Index
Appendix I: Annual Planning Survey Results/
Book of ListsTopic Index
334 Annual Planning Survey Results 2012
Appendix I: Annual Planning Survey Results/Book of Lists Topic Index
Page intentionally left blank
Annual Planning Survey Results 2012 335
Appendix I: Annual Planning Survey Results/Book of Lists Topic Index
topic edition
Adult Business Ordinances................................................1998, 1996Aesthetics Standards...................................................................1991Affordable Housing District....................................................................................2000
Funding.................................................................................2006Overlay....................................................................................2007
Water/Sewer Service Providers................................................2009Agricultural Buffer zones.............................................................1998Agricultural Land Preservation Programs.....................................2012Airport Comprehensive Land Use Plan...........................................2005American Recovery and Reinvestment Act..................................2010Annexation Agreements.............................................................1991Annexation Policies within the General Plan................................1997Antiquated Subdivisions....................................................1993, 1998Architectural or Design Review Committee.................................1999Architectural Guidelines Manual.................................................1988Area Planning Commissions........................................................1994Areas of Benefit...........................................................................1991Assessment Districts...................................................................1991Bicycle Master Plan............................................................2001, 2009“Big Box” Policy..................................................................2001, 2005Billboard Ban Ordinances............................................................1990Bingo Parlor Regulations....................................................1986, 1991Blueprint...................................................................2009, 2010, 2011Broadband/Technology High-Speed Internet................................................................2008 Municipal Wireless Project......................................................2008Building Maintenance Ordinance/Standards....................1988, 1998Building Permits, Architectural Review.......................................1998Building/Sewer Moratoria...........................................................1986CalGreen Building Code..............................................................2012Capital Improvement Programs..................................................1994Cartography General Cartography...............................................................1994Cellular Tower/Antenna Restriction............................................1998Cellular/Radio Tower Antenna Leasing Property..........................1998Census Housing and Population Counts..............................................2003 Information Service.................................................................2003CEQA CEQAnet Database..................................................................2001 Climate Change.......................................................................2008 Electronic Archive...................................................................2005 Electronic Submission...................................................2004, 2005 Environmental Impact Report Consultants....................1998, 2000 Environmental Impact Report Preparation.............................1993 Environmental Review Fees....................................................1992 Exemption...............................................................................1996 Guidelines, Local.............................................................1989, 1999
Litigation........................................................................2000, 2005 Master Environmental Assessments.......................................1992 Master Environmental Impact Report.....................................1995 Mitigation Monitoring Programs...................................1994, 2000 Mitigation Programs................1989, 1992, 1998, 2000, 2001, 2006 Negative Declaration...............................................................1993 Policies for Selecting Consultants............................................1996 Significant Thresholds...........................................1998, 2000, 2008 Statutory Exemptions..............................................................2005 Streamlining Decisions..................................................2003, 2007 Written Policies for Selecting CEQA Consultants......................1996Charter City Consistency.............................................................1990Child Care Computerized Day Care Information......................................1997 Conditions of Approval for Child Care Facilities.......................1999 Establishment of Services or Facilities.....................................2006 Guidelines for Developers.......................................................1989 In-Lieu Fees as Condition of Project Approval..................1989, 1999 Policies....................................................................................2006Climate Change/Global Warming Planning Policies Barriers.................................................................2012 CEQA Mitigation......................................................................2009 CEQA Threshold of Significance.....................................2008, 2009
Climate Action Plan.................................................................2010 Conditions of Approval............................................................2008
Environmental Review...................................................2008, 2009 General Plan..................................................................2009, 2010 Green Building Program..........................................................2008 Policies/Programs..............................2008, 2009, 2010, 2011, 2012 Sustainability Plan...................................................................2010Code Consistency........................................................................1989Commissioner Training Handbook...............................................1996Commissioner Training Program.................................................1996Community/Urban Design Manuals..................................1986, 1988Complete Streets
Policies and Programs.....................................................2011, 2012Transportation Users...............................................................2011Street Standards.....................................................................2011
Computers Computer Applications.........................................1989, 1990, 2001 Computer Online Information.............................1996, 2001, 2005 Computerized Day Care Information......................................1997 Multi-Agency Computer System.............................................1996 Staff Computer Network.........................................................1996 Staff Computers......................................................................1996Condominium Conversion Ordinances.............................1988, 2007Conditions of Approval Building Permits.............................................................1988, 1993 Child Care Facilities.................................................................1999 Demolition Permits.................................................................1988 General Plan Amendments.....................................................1988
Annual Planning Survey Results/Book of Lists Topic Index
The following index contains a list of topics that have been raised in OPR’s Annual Planning Surveys from 1991 to present. Topics are listed alphabetically, followed by the year of the Annual Planning Survey Results (APSR) or Book of Lists publication in which the topic was mentioned. To locate past editions of the Annual Planning Survey Results (APSR) or Book of Lists, please visit www.opr.ca.gov or contact the State Clearinghouse at (916) 445-0613.
336 Annual Planning Survey Results 2012
Appendix I: Annual Planning Survey Results/Book of Lists Topic Index
Permits to Reduce Greenhouse Gas Emissions........................2008 zone Changes.................................................................1988, 1993Consultant Selection..........................................................1986, 2004Cool Roofing/Paving Ordinance...................................................2012Crime Safe Community Policies..................................................1999Data Tracking Tools......................................................................2001Density Bonus........................1986, 1991, 1992, 2000, 2006, 2009, 2012Design or Architectural Review Committee.................................1999Design Review Procedures................................1985, 1991, 1992, 2012Development Agreements.................................................1987, 1989, 1990, 2004 Moratorium............................................................................2000 Processing Fees..............................................................1985, 1992 Standards................................................................................1993Downtown/Main Street Specific Plan.........................................2007Economic Development.....................................................1992, 1997Electromagnetic Fields.......................................................1992, 1997Emergency Shelter Regulations.........................................1987, 1989Energy Conservation Ordinances..............................................1990, 2001 Consumption Tracking.............................................................2001 Element in General Plan..................................................2001, 2010 Impacts...................................................................................2000 Policy Barriers.........................................................................2012 Power Plant Siting...................................................................2001 Solar Energy Approval Process.........................................2011, 2012
Solar Energy Ordinance.........................................................2011Use.........................................................................................2010
Environmental Justice.......................................................2001, 2006Environmental Subdivisions........................................................2000Exotic Animal Ordinances...........................................................1990Expiration of Inactive Permits....................................................1991Fire Resistant Landscaping Ordinance........................................1994Fire Hazard Evaluation................................................................1994Fiscal Impact Analysis...............................................1989, 1995, 1996Flood Hazard Mapping................................................................1994Floor Area Ration (FAR) Standards...............................................1993Form-Based Codes....................................................2006, 2007, 2010Formerly Used Defense Sites (FUDS) Department of Toxic Substances Control.................................2008 OPR Technical Advisory: Consideration of FUDS......................2008 US Army Corps of Engineers..................................................2008Gated Communities, Private.......................................................1997Geographic Information System..........1994, 1996, 1997, 2003, 2004General Plan Amendments.................................................................1989, 1992 EIR..................................................................................1995, 2003 Circulation Element.................................................................2005 Climate Change....................................2008, 2009, 2010, 2011, 2012 Consulting with OPR................................................................2007 Energy Element.............................................................2001, 2010 Environmental Justice.............................................................2006 Format....................................................................................2008 Funding..........................................................................1995, 2003 Goods Movement...................................................................2005 Greenhouse Gas Emissions..................................2008, 2009, 2010 Guidelines...............................................................................2007 Health-Related Policies..........................................2008, 2010, 2012 Inclusive Community Planning................................................2007 Job-Housing Balance...............................................................2005 Level of Service Standards.......................................................2010 Military....................................................................................2008
Permit Fee...............................................................................2006 Planning Horizon.....................................................................2001 Population at Buildout.............................................................2001 Regional Plan...........................................................................2010 Renewable Energy Facilities/Development............................2005 School Siting............................................................................2009 Telecommunication Infrastructure Element............................2005 Transit Oriented Developments...............................................2010 Transportation........................................................................2010 Tribal Consultation...............................................2007, 2008, 2009 Update.................................................................1995, 1996, 2006 Urban Design Element.............................................................2005 Vision Statements...................................................................1991 Water Element........................................................................2006 Water Supply...........................................................................2006Grading Ordinances....................................................................1994Granny Flats/Second Units.....1986, 1988, 1991, 2000, 2003, 2005, 2007Grants
Implementation of Land Use Plans..........................................2011 Infrastructure.......................................................................2010
Planning.........................................................................2010, 2011Greenbelts..................................................................................1991Greenhouse Gas Emissions...............................2009, 2010, 2011, 2012 Barriers....................................................................................2012 Baseline................................................................2009, 2010, 2011 Reduction Initiative.................................................................2010 Reduction Plan.......................................................2010, 2011, 2012 Reduction Target..........................................2009, 2010, 2011, 2012 Tracking................................................................................. 2012Groundwater Management Plan.................................................2010Growth Control Ballot Measures................................................1985Growth Management........................................................1989, 2001Habitat Conservation Plan..........................................................2001Habitat Preservation...................................................................1992Hazard Mitigation Policies/Programs..........................................1997Healthy Communities........ ..............................2006, 2008, 2010, 2012 Access to Grocery Stores.........................................................2012 Local Food Production.............................................................2012 Pedestrian Friendly Neighborhoods........................................2006High-Speed Internet....................................................................2008Hillside Design Standards/Guidelines..................................................2005 Development Regulations.......................................................1993 Ordinances...........................................................1985, 1989, 1994Historic Preservation..........................................................1987, 1993Historical Resources Commission or Committee........................1999Home Occupations......................................................................1988Housing Affordable............................................................2000, 2006, 2007 Homeless................................................................................2003 Parking Requirements.............................................................2012 SB 2.........................................................................................2012 Special Housing Needs Ordinance/Program............................2007 Temporary Moratoria..............................................................1997Impact Fees....................................................1990, 1992, 1995, 2001Inclusionary Housing Programs................................1990, 1996, 2007Inclusive Community Planning....................................................2007Infill Development.............................................................2000, 2006 Barriers..........................................................................2006, 2012 Environmental Analysis...........................................................2012 Exemption....................................................2003, 2004, 2005, 2007 Identification of Infill Areas..... ................................................2012

Annual Planning Survey Results 2012 337
Appendix I: Annual Planning Survey Results/Book of Lists Topic Index
Lot Consolidation....................................................................2012 Policies....................................................................................2012Infrastructure Grants..................................................................2010Infrastructure Mapping..............................................................1994Internet Activity..........................................................................1997Jobs-Housing Balance...............................................1988, 1990, 2005Joint Development......................................................................1988Joint Powers Agreement.............................................................1993Land Banking....................................................................1986, 1989Land By Gift Deed......................................................................1991Landscape Manuals.....................................................................1988Landscaping Standards...............................................................2010Land Use Compatibility Analysis.................................................1994Land Use Distributions................................................................1989Land Use Mapping......................................................................1994Land Use Planning Funding.........................................................2008Landscaping, Water Conservation...............................................2009Level of Service Standards...........................................................2010Live-Work Ordinances.......................................................1985, 1990Local Agency Formation Commission...........................................2005Local Hazard Mitigation Plans......................................................2011Lot Design....................................................................................1994Lot Line Adjustments..................................................................1991Lot Merger Provisions.................................................................1989Low-Impact Development (LID) Standards..................................2010Low-Income Housing.........................................................1992, 1993LUPIN.........................................................................................2000Memorandum of Understanding................................................1993Military Facilities California Advisory Handbook for Community and Military Compatibility Planning.......................................................2007 California Digital Conservation Atlas........................................2007 California Military Land Use Compatibility Analyst.................2007 Coordination...........................................................................2007 Development Review Process.................................................2007 General Plan............................................................................2008 Installations.........................................................2004, 2007, 2008 Land Use Applications.............................................................2007 Point of Contact.......................................................................2007Mixed-Use Development Ordinances....................................1989, 1996, 2000 Policies....................................................................................2012Mobile Home Ordinances...........................................................1992Mom and Pop Stores...................................................................1995Multi-Cultural Advisory Councils.................................................1997Multi-Lingual Public Hearing Notices..........................................1997Municipal Advisory Councils.......................................................1990Municipal Wireless Project.........................................................2008Neighborhood-Level Planning.....................................................1997Neotraditional Development......................................................1995New Towns..................................................................................1994Noise Ordinances....................................................1987, 1991, 1998Notice of Completion Form CERES Website........................................................................2007 OPR Website...........................................................................2007Parcel Maps Merger of Lots.........................................................................1997 Tentative.................................................................................1997Parking Innovations.....................................................................2012Parks Access to Parks and Open Space............................................2012 Park/Open Space Commission................................................2000
Park Planning Standards.........................................................1989 Park and Open Space Standards.............................................2012 Park and Recreational Facilities.....................................1992, 1995Pedestrian Master Plan......................................................2001, 2009Permit Processing Programs...........................1990, 1993, 1995, 1997Performance zoning....................................................................1987Phased Growth...........................................................................1991Planned Unit Development Ordinances.......................................1988Planning Brochures.......................................................................1988, 1990 Commissions.........................................................1986, 1991, 1999 Commission Handbooks..........................................................1988 Grants....................................................................................2010 Horizon...................................................................................2001 Horizon Population at Buildout...............................................2001 Long-Range/Comprehensive Activities...................................2010 Regional, Collaborative........................................2003, 2008, 2010 Regional, Blueprint...............................................2008, 2009, 2010 Transportation........................................................................2004Power Plant Siting........................................................................2001Presentation Maps......................................................................1992Professional Planners.........................................................1991, 1993Public Art Ordinances........................................................1987, 1992Public Notice...............................................................................2003Public Participation.....................................................................2003Public Transit...............................................................................1992Quimby Act Ordinances............................................1985, 1989, 1997Reasonable Accomodation..........................................................2012Recordation of Conditions...........................................................1997Recreational Trails.......................................................................1991Recycled Water Ordinance..........................................................2010Redevelopment.................................................................1993, 1995Redevelopment Agency.....................................................1995, 1996Referendum Elections.................................................................1991Regional Plans.............................................................................2011Regional Water Quality Control Board Low Impact Development Standards.....................................2010Remote Sensing..........................................................................1994Renewable Energy Distributed Generation............................................................2012 Generation..............................................................................2010 Tracking...................................................................................2012Requests for Proposals................................................................1991R.V. Park Regulations...................................................................1986Rent Control Ordinances....................................................1987, 1992Right-to-Farm Ordinances..................................................1990, 1997Riparian Area Regulations...........................................................1993Satellite Dish Regulations/Standards..................................1986, 1991Schools Fees.........................................................................................1995 Interagency Collaboration.......................................................2012 Siting..............................................................................1991, 2009Seismic Safety.............................................................................1990Sequestration, Local....................................................................2010Service Area Establishment.........................................................1994Sewer Improvements..................................................................1992Sewer Service Providers..............................................................2009Sidewalk Café Regulations..........................................................1993Sidewalk Vendor Ordinances.............................................1988, 1991Sign Ordinances.................................................................1987, 1996Single-Room Occupancy Regulation..................................1996, 2009Specific Plans...................................................1987, 1990, 1994, 1996
338 Annual Planning Survey Results 2012
Appendix I: Annual Planning Survey Results/Book of Lists Topic Index
Downtown/Main Street..........................................................2007Sphere of Influence.....................................................................2001State Clearinghouse Service........................................................2004Storm Drainage...........................................................................1992Street Access.....................................................................................1991 Complete Streets Policies.......................................................2009 Improvements........................................................................1992 Streetscape Standards............................................................2010 Tree Ordinances.............................................................1988, 1996Subdivision Design Guidelines....................................................................1990 Ordinances.....................................................................1989, 1995Substandard Lots, Merger of........................................................1998Surplus Public Lands...................................................................1988Sustainability Barriers....................................................................................2012 Staff..........................................................................................2012 Sustainable Communities Strategy...........................................2011 Sustainable Development Policies............................................1999Tax Base......................................................................................2010T.D.R. Ordinance/Procedures...................................1985, 1986, 1990Teleport zoning...........................................................................1991Televised Board Meetings...........................................................1996Time Share Condominium Ordinances........................................1991Traffic Generation Studies.................................................................1988 Impact Fees.............................................................................1988 Mitigation Fees..............................................................1997, 2005 Traffic Signal Exactions...................................................1986, 1992Transit Oriented Development (TOD)........................2001, 2004, 2010Tree Canopy Coverage.....................................................................2012 Inventory...............................................................................2010 Ordinance......................................................................1990, 2010Tentative Subdivision Map Programs.................................1988, 1997Transportation...................................................................2005, 2009 Bicycle and Pedestrian Infrastructure Standards......................2012 Bicycle/Pedestrian Master Plan...............................................2009 Concept Report.......................................................................2005 Regional Transportation Plan.........................................1990, 2004Tribal Consultation, California Native American Conservation Easements.........................................................2009 Consultation.........................................................2006, 2007, 2009 General Plan/Specific Plan Policies........................2007, 2008, 2009 Native American Heritage Commission..........................2006, 2007 Point of Contact..............................................................2008, 2009 Pre-Consultation.....................................................................2006 Protocols/Guidelines.....................................................2006, 2009 Tribal Consultation Guidelines.................................................2006
Universal Design..........................................................................2007Urban Design Standards............................................1991, 1996, 2005Urban Forestry Management Plan...............................................2010Urban Growth Boundaries.......................................1994, 1999, 2006Urban Limit Lines.....................................................1994, 1996, 1999Vegetation Change......................................................................1994Vehicle Miles Traveled........................................................2010, 2011Vesting Tentative Map Ordinances....................................1987, 1989Visioning Processes.....................................................................1994View Protection Ordinances.......................................................1991Voter Initiative.............................................................................2012Waste Management Plans..........................................................1997Water Conservation Ordinances..............................................1990, 2009 Groundwater Management Plan.............................................2010 Groundwater Protection.........................................................2003 Landscaping Standards...........................................................2010 Recycling.......................................................................2003, 2010 Service Providers.................................................2003, 2005, 2009 Source.....................................................................................2003 Supply Assessment.................................................................2005 Supply Planning...................................................2003, 2005, 2006 Use..........................................................................................2010Wetlands Program Habitat Conservation..............................................................1996 Land Trust...............................................................................1996 Public Acquisition....................................................................1996 Scenic Easement.....................................................................1996 Wetlands Bank........................................................................1996Wild Animal Permits...................................................................1993Wildfire Hazard Regulation.........................................................1996Williamson Act............................................................................1995Wildland Fire Protection Regulations.................................1989, 1990zero Lot Line Provisions....................................................1989, 1996zoning Administrator..........................................................................1999 Artists’ Lofts.............................................................................1998 Codes......................................................................................2006 Dispute Mediating...................................................................1996 Illustrated zoning Ordinance...................................................2005 Integrated with the General Plan............................................1996 Newsracks...............................................................................1998 Ordinances (Year Adopted)..........................1988, 1994, 1995, 1999 Overlay zones................................................................2006, 2007

Annual Planning Survey Results 2012 339
Appendix J: 2011 Annual Planning Survey
Appendix J:2011 Annual
Planning Survey

340 Annual Planning Survey Results 2012
Appendix J: 2011 Annual Planning Survey
Page intentionally left blank

Annual Planning Survey Results 2012 341
Appendix J: 2011 Annual Planning Survey
GOVERNOR’S OFFICE OF PLANNING AND RESEARCH ANNUAL PLANNING SURVEY 2011
Your input is needed to maintain accurate information on your city or county planning activities. Your responses will assist us with our General Plan reporting requirements to the Attorney General’s Office (GC §65040.5). The information gathered from the surveywill be compiled and published in the 2012 edition of OPR’s California Planners’ Book of Lists. We encourage everyone to submit a survey online to reduce the amount of paper used. To complete this survey online, go our Survey website http://www.surveymonkey.com/s/2011aps. You may also complete the survey by filling out this form and using the Email button at the top of this page. If you need assistance, submit your questions via email to [email protected].
IF YOU CANNOT COMPLETE THE SURVEY ONLINE, PLEASE RETURN THE COMPLETED SURVEY TO THE OFFICE OF PLANNING AND RESEARCH BY OCTOBER 14, 2011.
P.O. Box 3044, Sacramento, CA 95812-3044 1400 Tenth Street, Sacramento, CA 95814 Phone: (916) 445-0613 FAX: (916) 323-3018 [email protected]
Page 1 of 6
JURISDICTION CONTACT INFORMATION Agency Name: Street Address: Mailing Address:
Phone: Director’s Name: Fax: Director’s Title: Email: Website: General Plan Website: ABOUT YOUR JURISDICTION County (for cities):
Charter City: Yes No Square miles: Number of Planners: GENERAL PLAN MANDATORY ELEMENTS Please list the year that your jurisdiction adopted a comprehensive update of each element:
Land Use
Circulation
Conservation
Housing
Noise
Open Space
Safety
If your jurisdiction is currently updating its General Plan, which elements is it updating? Land Use Housing Open Space Circulation Noise Safety Conservation Other (please specify):
Our jurisdiction is not currently updating any elements of the General Plan
When do you expect to complete the update of your General Plan and/or Housing Element? N/A GENERAL PLAN OPTIONAL ELEMENTSPlease check each optional element that is contained in your general plan and provide the year of that element’s most recent update. *The Air Quality Element is a required element for jurisdictions within the boundaries of the San Joaquin Valley Air Pollution Control District.
Administration: Aesthetics: Agriculture: Air Quality*: Airport: Archaeological: Bicycle: Biological: Child Care: Climate Change/Global Warming: Coastal: Commerce: Community: Cultural: Design: Economic: Education:
Emergency: Energy: Environment: Fire: Fiscal: Flood Control: Forestry: Geothermal: Governance: Growth Management: Hazardous Waste: Health: Historic Preservation: Implementation: Military Facilities: Mineral Resources:
Parking: Parks & Recreation: Public Facilities: Public Services: Redevelopment: Regionalism: Resource Conservation: Scenic Highways: Seismic: Social Services: Sustainability: Trailways: Transportation: Urban B aries: ound
Water: Waste:
Other:
Print FormSubmit by Email
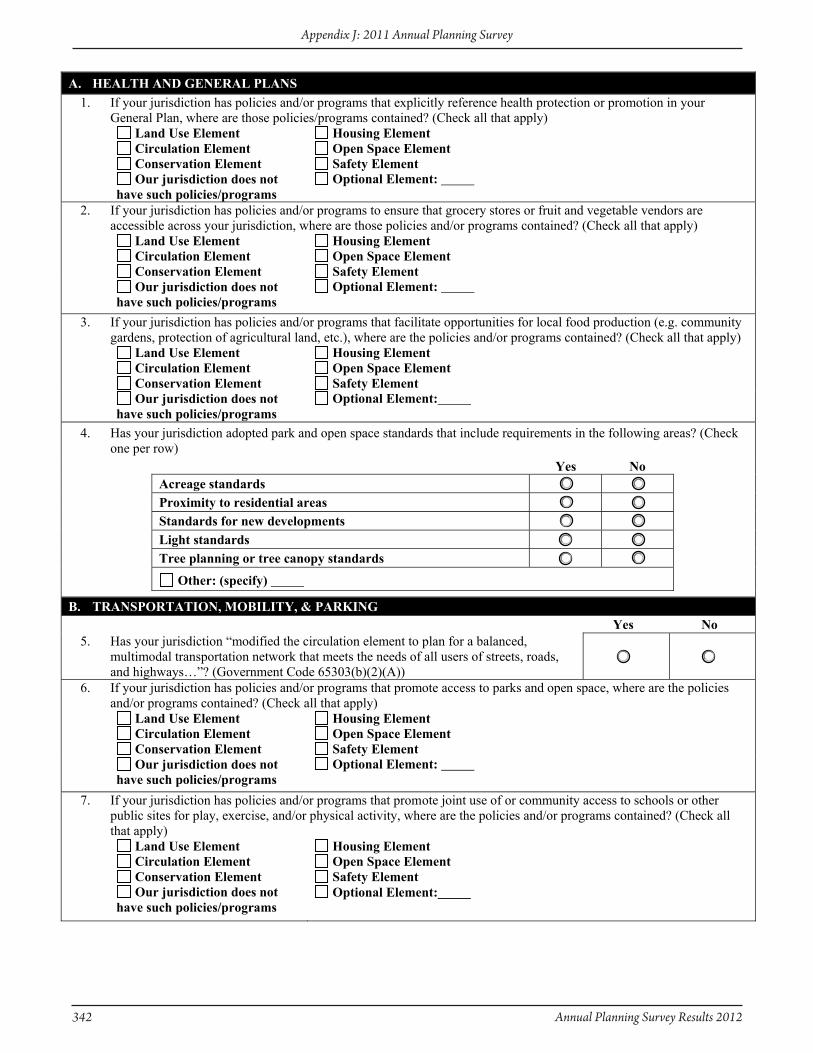
342 Annual Planning Survey Results 2012
Appendix J: 2011 Annual Planning Survey
IF YOU CANNOT COMPLETE THE SURVEY ONLINE, PLEASE RETURN THE COMPLETED SURVEY TO THE OFFICE OF PLANNING AND RESEARCH BY OCTOBER 14, 2011.
P.O. Box 3044, Sacramento, CA 95812-3044 1400 Tenth Street, Sacramento, CA 95814 Phone: (916) 445-0613 FAX: (916) 323-3018 [email protected]
Page 2 of 6
A. HEALTH AND GENERAL PLANS 1. If your jurisdiction has policies and/or programs that explicitly reference health protection or promotion in your
General Plan, where are those policies/programs contained? (Check all that apply) Land Use Element Housing Element Circulation Element Open Space Element Conservation Element Safety Element Our jurisdiction does not
have such policies/programs Optional Element:
2. If your jurisdiction has policies and/or programs to ensure that grocery stores or fruit and vegetable vendors are accessible across your jurisdiction, where are those policies and/or programs contained? (Check all that apply)
Land Use Element Housing Element Circulation Element Open Space Element Conservation Element Safety Element Our jurisdiction does not
have such policies/programs Optional Element:
3. If your jurisdiction has policies and/or programs that facilitate opportunities for local food production (e.g. community gardens, protection of agricultural land, etc.), where are the policies and/or programs contained? (Check all that apply)
Land Use Element Housing Element Circulation Element Open Space Element Conservation Element Safety Element Our jurisdiction does not
have such policies/programs Optional Element:
4. Has your jurisdiction adopted park and open space standards that include requirements in the following areas? (Check one per row)
Yes No Acreage standards Proximity to residential areas Standards for new developments Light standards Tree planning or tree canopy standards
Other: (specify)
B. TRANSPORTATION, MOBILITY, & PARKING Yes No
5. Has your jurisdiction “modified the circulation element to plan for a balanced, multimodal transportation network that meets the needs of all users of streets, roads, and highways…”? (Government Code 65303(b)(2)(A))
6. If your jurisdiction has policies and/or programs that promote access to parks and open space, where are the policies and/or programs contained? (Check all that apply)
Land Use Element Housing Element Circulation Element Open Space Element Conservation Element Safety Element Our jurisdiction does not
have such policies/programs Optional Element:
7. If your jurisdiction has policies and/or programs that promote joint use of or community access to schools or other public sites for play, exercise, and/or physical activity, where are the policies and/or programs contained? (Check all that apply)
Land Use Element Housing Element Circulation Element Open Space Element Conservation Element Safety Element Our jurisdiction does not
have such policies/programs Optional Element:

Annual Planning Survey Results 2012 343
Appendix J: 2011 Annual Planning Survey
IF YOU CANNOT COMPLETE THE SURVEY ONLINE, PLEASE RETURN THE COMPLETED SURVEY TO THE OFFICE OF PLANNING AND RESEARCH BY OCTOBER 14, 2011.
P.O. Box 3044, Sacramento, CA 95812-3044 1400 Tenth Street, Sacramento, CA 95814 Phone: (916) 445-0613 FAX: (916) 323-3018 [email protected]
8. Has your jurisdiction adopted pedestrian and/or bicycle infrastructure standards that include requirements in the following areas? (Check all that apply)
Pedestrian Bicycle Neither Proximity or integration with transit infrastructure Proximity to residential, employment, and commercial areasStandards for new developments Traffic calming Lighting standards Availability of other bicycle amenities Tree canopy and/or aesthetic standards Other: (specify)
9. What are the parking requirements (spaces per unit) for the following: Residential Use 0-1 Spaces 2 spaces 3 spaces 4 spaces Other (Explain)Multifamily Apartments
Single Family Attached (condominiums)
Duplexes
Emergency Shelters
Mixed Use
10. What parking innovations or strategies does your jurisdiction utilize? (Check all that apply) Sliding scale based on the number of bedrooms Maximum requirements Reductions in transit, mixed use or other special designated areas Shared parking De-bundling (separating parking costs from housing costs) Tandem parking Reductions for affordable or senior housing None of the above Other: (specify)
C. HOUSING, DENSITY, AND INFILL Yes No
11. Has your agency identified specific areas within its jurisdiction for infill development?
Page 3 of 6
12. Have the effects of infill development, such as traffic, noise, public services, etc., been analyzed in a programmatic environmental analysis, such as general plan environmental impact report?
13. If your agency has policies to promote or facilitate infill development, what types of policies and/or programs has your agency adopted to facilitate infill development? (Check all that apply)
Density, height and other bonuses Reduced parking requirements Infill Specific Plan Our agency does not have such policies/programs Expedited permit processing Other: (specify)
14. If your jurisdiction has policies and/or programs to facilitate mixed use development and/or the clustering of residential, employment, and commercial areas, where are the policies and/or programs contained? (Check all that apply)
Zoning Ordinance Land Use Element Housing Element Our jurisdiction does not have such policies/programs Specific Plan Other: (specify)
15. If your jurisdiction has policies and/or programs to facilitate residential and commercial density, where are the policies and/or programs contained? (Check all that apply)
Land Use Element Our jurisdiction does not have such policies/programs Other: (specify)

344 Annual Planning Survey Results 2012
Appendix J: 2011 Annual Planning Survey
IF YOU CANNOT COMPLETE THE SURVEY ONLINE, PLEASE RETURN THE COMPLETED SURVEY TO THE OFFICE OF PLANNING AND RESEARCH BY OCTOBER 14, 2011.
P.O. Box 3044, Sacramento, CA 95812-3044 1400 Tenth Street, Sacramento, CA 95814 Phone: (916) 445-0613 FAX: (916) 323-3018 [email protected]
Page 4 of 6
16. If your jurisdiction has adopted policies and/or programs that promote access to regular transit service connecting residential, employment, and commercial areas across your jurisdiction, where are the policies and/or programs integrated? (Check all that apply)
Circulation Element Our jurisdiction does not have such policies/programs Transportation Plan Other: (specify) Land Use Element
Yes No 17. Do you have staff dedicated to sustainability? 18. Have programs such as density bonuses or financial incentives been adopted to encourage lot consolidation of smaller
infill parcels? (Check all that apply) Density bonuses Our jurisdiction does not have such programs Financial incentives Other: (specify)
19. Does your jurisdiction regulate allowable densities based on performance standards and, if so, which standards? (Check all that apply)
Design attributes Our jurisdiction does not regulate densities based on such standards Off-site amenities Other: (specify) On-site project amenities
20. Have you developed a non-discretionary design review procedure for residential development and if so for which type?(Check all that apply)
Multi-family Single-family Other: (specify) 21. Please explain the primary barriers your jurisdiction has experienced to implementing infill projects. (Optional)
Explanation of primary barriers:
D. EMERGENCY SHELTERS (SB 2) AND SPECIAL NEEDS 22. If your jurisdiction has adopted a zone(s) to permit emergency shelters without a conditional use permit or other
discretionary action, what type of land use category permits emergency shelters without discretionary action? (Check all that apply)
Residential Manufacturing Commercial Public/Quasi-Public Light Industrial Other: (specify) Our jurisdiction has not adopted such zones
Yes No 23. Does your jurisdiction require Planning Commission or City Council Approval for
granting reasonable accommodation in zoning and land use? 24. Does your jurisdiction require processing fees for granting reasonable accommodation
in zoning and land use? E. CONSERVATION OF AGRICULTURAL LAND
25. Does your jurisdiction have or do any of the following? (Check all that apply) Agriculture and Farmland Protection Planner in your planning office Agricultural district program Agricultural easement program Work with a land trust Our jurisdiction does not have nor has it done any of the above
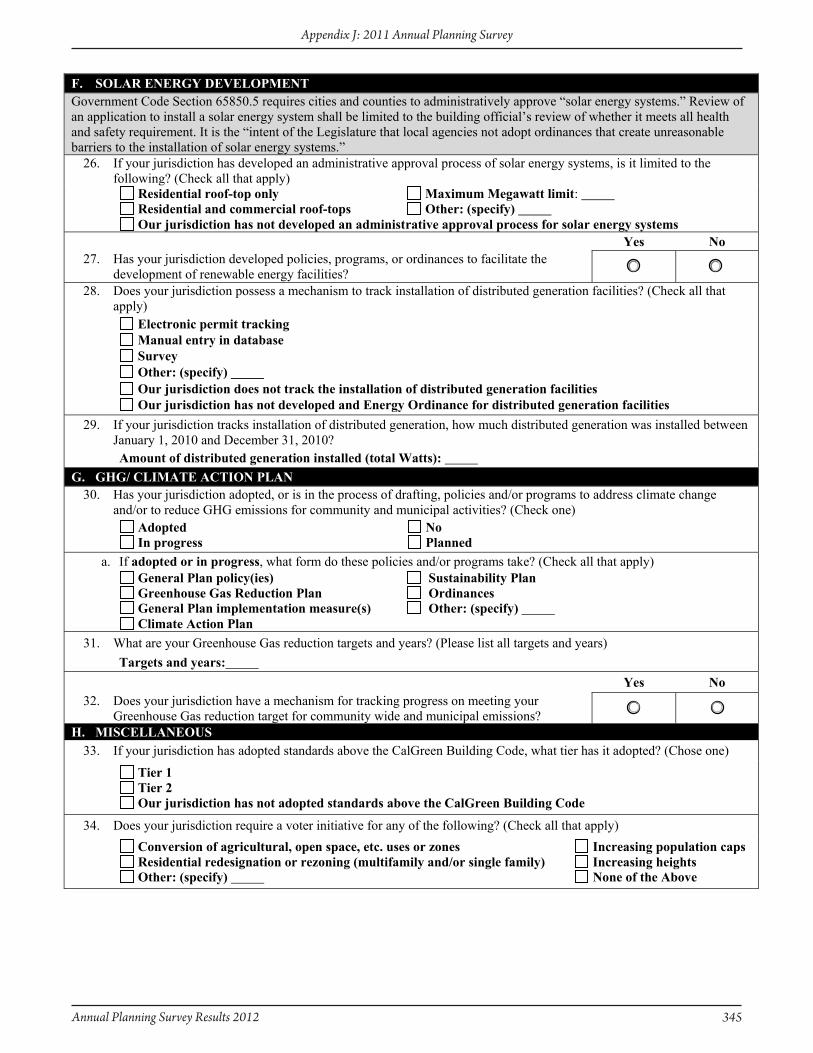
Annual Planning Survey Results 2012 345
Appendix J: 2011 Annual Planning Survey
IF YOU CANNOT COMPLETE THE SURVEY ONLINE, PLEASE RETURN THE COMPLETED SURVEY TO THE OFFICE OF PLANNING AND RESEARCH BY OCTOBER 14, 2011.
P.O. Box 3044, Sacramento, CA 95812-3044 1400 Tenth Street, Sacramento, CA 95814 Phone: (916) 445-0613 FAX: (916) 323-3018 [email protected]
Page 5 of 6
F. SOLAR ENERGY DEVELOPMENT Government Code Section 65850.5 requires cities and counties to administratively approve “solar energy systems.” Review of an application to install a solar energy system shall be limited to the building official’s review of whether it meets all health and safety requirement. It is the “intent of the Legislature that local agencies not adopt ordinances that create unreasonable barriers to the installation of solar energy systems.”
26. If your jurisdiction has developed an administrative approval process of solar energy systems, is it limited to the following? (Check all that apply)
Residential roof-top only Maximum Megawatt limit: Residential and commercial roof-tops Other: (specify) Our jurisdiction has not developed an administrative approval process for solar energy systems
Yes No 27. Has your jurisdiction developed policies, programs, or ordinances to facilitate the
development of renewable energy facilities? 28. Does your jurisdiction possess a mechanism to track installation of distributed generation facilities? (Check all that
apply) Electronic permit tracking Manual entry in database Survey Other: (specify) Our jurisdiction does not track the installation of distributed generation facilities Our jurisdiction has not developed and Energy Ordinance for distributed generation facilities
29. If your jurisdiction tracks installation of distributed generation, how much distributed generation was installed between January 1, 2010 and December 31, 2010? Amount of distributed generation installed (total Watts):
G. GHG/ CLIMATE ACTION PLAN 30. Has your jurisdiction adopted, or is in the process of drafting, policies and/or programs to address climate change
and/or to reduce GHG emissions for community and municipal activities? (Check one) Adopted No In progress Planned
a. If adopted or in progress, what form do these policies and/or programs take? (Check all that apply) General Plan policy(ies) Sustainability Plan Greenhouse Gas Reduction Plan Ordinances General Plan implementation measure(s) Other: (specify) Climate Action Plan
31. What are your Greenhouse Gas reduction targets and years? (Please list all targets and years) Targets and years:
Yes No 32. Does your jurisdiction have a mechanism for tracking progress on meeting your
Greenhouse Gas reduction target for community wide and municipal emissions? H. MISCELLANEOUS
33. If your jurisdiction has adopted standards above the CalGreen Building Code, what tier has it adopted? (Chose one)
Tier 1 Tier 2 Our jurisdiction has not adopted standards above the CalGreen Building Code
34. Does your jurisdiction require a voter initiative for any of the following? (Check all that apply) Conversion of agricultural, open space, etc. uses or zones Increasing population caps Residential redesignation or rezoning (multifamily and/or single family) Increasing heights Other: (specify) None of the Above

346 Annual Planning Survey Results 2012
Appendix J: 2011 Annual Planning Survey
IF YOU CANNOT COMPLETE THE SURVEY ONLINE, PLEASE RETURN THE COMPLETED SURVEY TO THE OFFICE OF PLANNING AND RESEARCH BY OCTOBER 14, 2011.
P.O. Box 3044, Sacramento, CA 95812-3044 1400 Tenth Street, Sacramento, CA 95814 Phone: (916) 445-0613 FAX: (916) 323-3018 [email protected]
Page 6 of 6
35. If your jurisdiction is working with school districts to ensure that school siting, capital improvement decisions (including closures), and operational policies align with general plans, RTPs, and sustainable communities plans, how does it do so? (Check all that apply)
Joint meetings of staff Task force or committee Joint meetings of elected boards Other: (specify) Our jurisdiction is not working with school districts
36. If your jurisdiction tracks the amount of tree canopy coverage, what percent of your jurisdiction has tree canopy coverage?Percentage of tree canopy coverage:
Yes No 37. Does your jurisdiction have a cool roofing/paving ordinance? 38. Please explain the primary barriers your jurisdiction has experienced to implementing Greenhouse Gas, Energy, and/or
Sustainability policies. (Optional) Explanation of primary barriers:
THANK YOU FOR PARTICIPATING!
Annual Planning Survey Results 2012 347
Appdendix K: Status of Local General Plans
Appendix K: Status of Local General Plans
Information in this Appendix is aggregated from the Annual Planning Survey and/or direct notification from the jurisdictions. Some information may not be current due to lack of notification by the jurisdictions.
348 Annual Planning Survey Results 2012
Appendix K: Status of Local General Plans
Page intentionally left blank
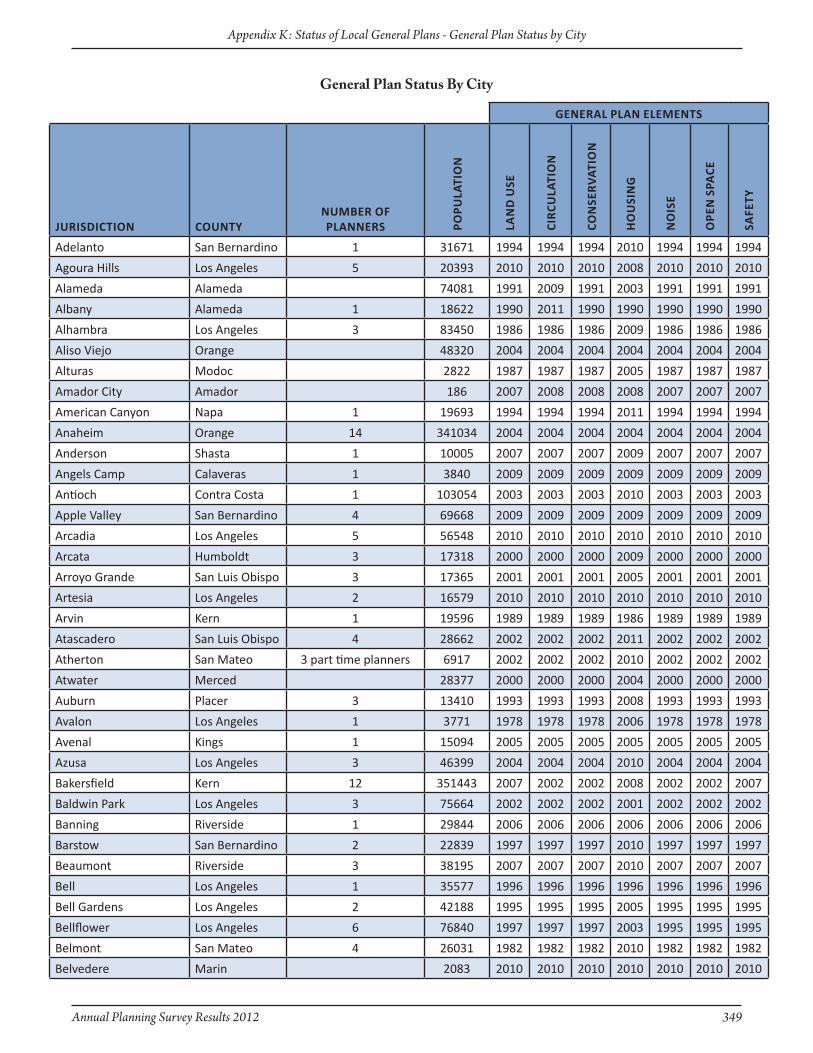
Annual Planning Survey Results 2012 349
Appendix K: Status of Local General Plans - General Plan Status by City
General Plan Status By City
GeneRAl PlAn eleMents
JuRisdictiOn CounTynuMBeR Of PlAnneRs PO
PulA
tiO
n
lAn
d u
se
ciR
culA
tiO
n
cOn
seR
vAt
iOn
Ho
uSi
ng
no
iSe
OPe
n s
PAce
Safe
Ty
Adelanto San Bernardino 1 31671 1994 1994 1994 2010 1994 1994 1994
Agoura Hills Los Angeles 5 20393 2010 2010 2010 2008 2010 2010 2010
Alameda Alameda 74081 1991 2009 1991 2003 1991 1991 1991
Albany Alameda 1 18622 1990 2011 1990 1990 1990 1990 1990
Alhambra Los Angeles 3 83450 1986 1986 1986 2009 1986 1986 1986
Aliso Viejo Orange 48320 2004 2004 2004 2004 2004 2004 2004
Alturas Modoc 2822 1987 1987 1987 2005 1987 1987 1987
Amador City Amador 186 2007 2008 2008 2008 2007 2007 2007
American Canyon Napa 1 19693 1994 1994 1994 2011 1994 1994 1994
Anaheim Orange 14 341034 2004 2004 2004 2004 2004 2004 2004
Anderson Shasta 1 10005 2007 2007 2007 2009 2007 2007 2007
Angels Camp Calaveras 1 3840 2009 2009 2009 2009 2009 2009 2009
Antioch Contra Costa 1 103054 2003 2003 2003 2010 2003 2003 2003
Apple Valley San Bernardino 4 69668 2009 2009 2009 2009 2009 2009 2009
Arcadia Los Angeles 5 56548 2010 2010 2010 2010 2010 2010 2010
Arcata Humboldt 3 17318 2000 2000 2000 2009 2000 2000 2000
Arroyo Grande San Luis Obispo 3 17365 2001 2001 2001 2005 2001 2001 2001
Artesia Los Angeles 2 16579 2010 2010 2010 2010 2010 2010 2010
Arvin Kern 1 19596 1989 1989 1989 1986 1989 1989 1989
Atascadero San Luis Obispo 4 28662 2002 2002 2002 2011 2002 2002 2002
Atherton San Mateo 3 part time planners 6917 2002 2002 2002 2010 2002 2002 2002
Atwater Merced 28377 2000 2000 2000 2004 2000 2000 2000
Auburn Placer 3 13410 1993 1993 1993 2008 1993 1993 1993
Avalon Los Angeles 1 3771 1978 1978 1978 2006 1978 1978 1978
Avenal Kings 1 15094 2005 2005 2005 2005 2005 2005 2005
Azusa Los Angeles 3 46399 2004 2004 2004 2010 2004 2004 2004
Bakersfield Kern 12 351443 2007 2002 2002 2008 2002 2002 2007
Baldwin Park Los Angeles 3 75664 2002 2002 2002 2001 2002 2002 2002
Banning Riverside 1 29844 2006 2006 2006 2006 2006 2006 2006
Barstow San Bernardino 2 22839 1997 1997 1997 2010 1997 1997 1997
Beaumont Riverside 3 38195 2007 2007 2007 2010 2007 2007 2007
Bell Los Angeles 1 35577 1996 1996 1996 1996 1996 1996 1996
Bell Gardens Los Angeles 2 42188 1995 1995 1995 2005 1995 1995 1995
Bellflower Los Angeles 6 76840 1997 1997 1997 2003 1995 1995 1995
Belmont San Mateo 4 26031 1982 1982 1982 2010 1982 1982 1982
Belvedere Marin 2083 2010 2010 2010 2010 2010 2010 2010

350 Annual Planning Survey Results 2012
Appendix K: Status of Local General Plans - General Plan Status by City
GeneRAl PlAn eleMents
JuRisdictiOn CounTynuMBeR Of PlAnneRs PO
PulA
tiO
n
lAn
d u
se
ciR
culA
tiO
n
cOn
seR
vAt
iOn
Ho
uSi
ng
no
iSe
OPe
n s
PAce
Safe
Ty
Benicia Solano 1 27118 1999 1999 1999 2003 1999 1999 1999
Berkeley Alameda 114046 2002 2002 2002 2010 2002 2002 2002
Beverly Hills Los Angeles 8 34210 2010 2010 2010 2011 2010 2010 2011
Big Bear Lake San Bernardino 5 5051 1999 1999 1999 2002 1999 1999 1999
Biggs Butte 1 1714 1998 1998 1998 2008 1998 1998 1998
Bishop Inyo 1 3893 1993 1993 1993 2010 1993 1993 1993
Blue Lake Humboldt 1 1265 2004 1986 1986 2009 1980 1980 1980
Blythe Riverside 1 20158 2007 2007 2007 2009 2007 2007 2007
Bradbury Los Angeles 1059 2007 2007 2007 2009 2007 2007 2007
Brawley Imperial 1 25304 2008 2008 2008 2008 2008 2008 2008
Brea Orange 4 40065 2003 2003 2003 2008 2003 2003 2003
Brentwood Contra Costa 4 52029 2001 2001 1993 2005 1993 1993 1993
Brisbane San Mateo 3 4328 1994 1994 1994 2011 1994 1994 1994
Buellton Santa Barbara 3 4878 2005 2005 2007 2009 2007 2007 2007
Buena Park Orange 2 80868 2010 2010 2010 2009 2010 2010 2010
Burbank Los Angeles 12 104304 1988 1965 1972 2008 1992 1972 1997
Burlingame San Mateo 3 29009 2004 2004 2004 2010 2004 2004 2004
Calabasas Los Angeles 9 23134 2008 2008 2008 2008 2008 2008 2008
Calexico Imperial 39077 2007 2007 2007 2009 2007 2007 2007
California City Kern 1 12858 2009 2009 2009 2004 2009 2009 2009
Calimesa Riverside 2 7941 1994 1994 1994 2011 1994 1994 1994
Calipatria Imperial 7665 1992 1992 1992 2008 1992 1992 1992
Calistoga Napa 5188 2003 2003 2003 2003 2003 2003 2003
Camarillo Ventura 8 65830 2003 2000 2006 2009 1996 2006 1989
Campbell Santa Clara 2 39664 2001 2001 2001 2009 2001 2001 2001
Canyon Lake Riverside 2 10647 1996 1996 1996 1996 1996 1996 1996
Capitola Santa Cruz 6 9974 1989 1989 1989 2010 1989 1989 1989
Carlsbad San Diego 18 106555 2005 2004 2005 2008 1994 2005 1994
Carmel-by-the-Sea Monterey 3738 2004 2010 2010 2010 2010 2010 2010
Carpinteria Santa Barbara 3 13104 2003 2003 2003 2003 2003 2003 2003
Carson Los Angeles 8 91548 2004 2004 2004 2010 2004 2004 2004
Cathedral City Riverside 51603 2002 2002 2002 2009 2002 2002 2002
Ceres Stanislaus 2 45670 1997 1997 1997 2007 1997 1997 1997
Cerritos Los Angeles 49181 2004 2004 2004 2010 2004 2004 2004
Chico Butte 6 86900 2011 2011 2011 2009 2011 2011 2011
Chino San Bernardino 7 78537 2010 2010 2010 2010 2010 2010 2010
Chino Hills San Bernardino 4 75345 1994 1994 1994 2008 1994 2008 1994
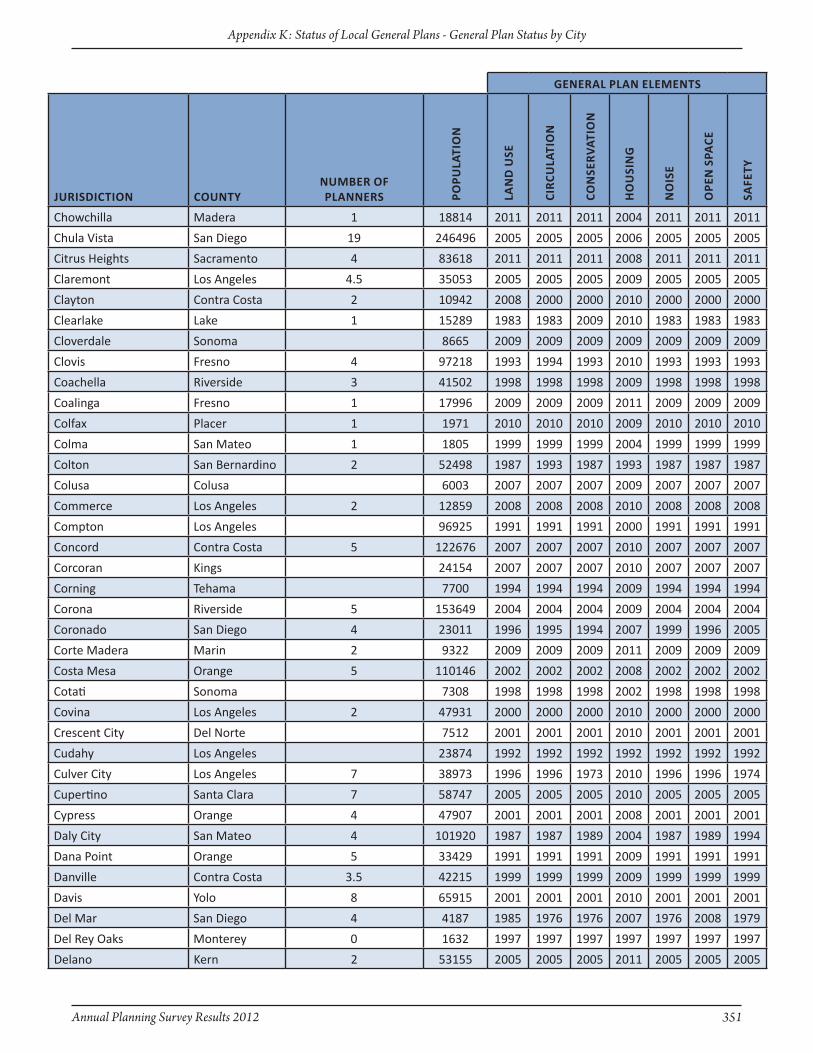
Annual Planning Survey Results 2012 351
Appendix K: Status of Local General Plans - General Plan Status by City
GeneRAl PlAn eleMents
JuRisdictiOn CounTynuMBeR Of PlAnneRs PO
PulA
tiO
n
lAn
d u
se
ciR
culA
tiO
n
cOn
seR
vAt
iOn
Ho
uSi
ng
no
iSe
OPe
n s
PAce
Safe
Ty
Chowchilla Madera 1 18814 2011 2011 2011 2004 2011 2011 2011
Chula Vista San Diego 19 246496 2005 2005 2005 2006 2005 2005 2005
Citrus Heights Sacramento 4 83618 2011 2011 2011 2008 2011 2011 2011
Claremont Los Angeles 4.5 35053 2005 2005 2005 2009 2005 2005 2005
Clayton Contra Costa 2 10942 2008 2000 2000 2010 2000 2000 2000
Clearlake Lake 1 15289 1983 1983 2009 2010 1983 1983 1983
Cloverdale Sonoma 8665 2009 2009 2009 2009 2009 2009 2009
Clovis Fresno 4 97218 1993 1994 1993 2010 1993 1993 1993
Coachella Riverside 3 41502 1998 1998 1998 2009 1998 1998 1998
Coalinga Fresno 1 17996 2009 2009 2009 2011 2009 2009 2009
Colfax Placer 1 1971 2010 2010 2010 2009 2010 2010 2010
Colma San Mateo 1 1805 1999 1999 1999 2004 1999 1999 1999
Colton San Bernardino 2 52498 1987 1993 1987 1993 1987 1987 1987
Colusa Colusa 6003 2007 2007 2007 2009 2007 2007 2007
Commerce Los Angeles 2 12859 2008 2008 2008 2010 2008 2008 2008
Compton Los Angeles 96925 1991 1991 1991 2000 1991 1991 1991
Concord Contra Costa 5 122676 2007 2007 2007 2010 2007 2007 2007
Corcoran Kings 24154 2007 2007 2007 2010 2007 2007 2007
Corning Tehama 7700 1994 1994 1994 2009 1994 1994 1994
Corona Riverside 5 153649 2004 2004 2004 2009 2004 2004 2004
Coronado San Diego 4 23011 1996 1995 1994 2007 1999 1996 2005
Corte Madera Marin 2 9322 2009 2009 2009 2011 2009 2009 2009
Costa Mesa Orange 5 110146 2002 2002 2002 2008 2002 2002 2002
Cotati Sonoma 7308 1998 1998 1998 2002 1998 1998 1998
Covina Los Angeles 2 47931 2000 2000 2000 2010 2000 2000 2000
Crescent City Del Norte 7512 2001 2001 2001 2010 2001 2001 2001
Cudahy Los Angeles 23874 1992 1992 1992 1992 1992 1992 1992
Culver City Los Angeles 7 38973 1996 1996 1973 2010 1996 1996 1974
Cupertino Santa Clara 7 58747 2005 2005 2005 2010 2005 2005 2005
Cypress Orange 4 47907 2001 2001 2001 2008 2001 2001 2001
Daly City San Mateo 4 101920 1987 1987 1989 2004 1987 1989 1994
Dana Point Orange 5 33429 1991 1991 1991 2009 1991 1991 1991
Danville Contra Costa 3.5 42215 1999 1999 1999 2009 1999 1999 1999
Davis Yolo 8 65915 2001 2001 2001 2010 2001 2001 2001
Del Mar San Diego 4 4187 1985 1976 1976 2007 1976 2008 1979
Del Rey Oaks Monterey 0 1632 1997 1997 1997 1997 1997 1997 1997
Delano Kern 2 53155 2005 2005 2005 2011 2005 2005 2005

352 Annual Planning Survey Results 2012
Appendix K: Status of Local General Plans - General Plan Status by City
GeneRAl PlAn eleMents
JuRisdictiOn CounTynuMBeR Of PlAnneRs PO
PulA
tiO
n
lAn
d u
se
ciR
culA
tiO
n
cOn
seR
vAt
iOn
Ho
uSi
ng
no
iSe
OPe
n s
PAce
Safe
Ty
Desert Hot Springs Riverside 2 27383 2000 2000 2000 2009 2000 2000 2000
Diamond Bar Los Angeles 3 55766 1995 1995 1995 2011 1995 1995 1995
Dinuba Tulare 1 21950 2008 2008 2008 2011 2008 2008 2008
Dixon Solano 2 18435 1993 1993 1993 2009 1993 1993 1993
Dorris Siskiyou 1 contract planner 941 2007 2007 2007 2010 2007 2007 2007
Dos Palos Merced 1 4973 1990 2010 1990 2008 1990 1990 1990
Downey Los Angeles 5 112103 2005 2005 2005 2009 2005 2005 2005
Duarte Los Angeles 3 21380 2007 2007 2007 2011 2007 2007 2007
Dublin Alameda 4 46743 1985 1985 1995 2010 1985 1985 1985
Dunsmuir Siskiyou 1653 2006 2006 2006 2010 2006 2006 2006
East Palo Alto San Mateo 3 28366 1999 1999 1999 2010 1999 1999 1999
Eastvale* Riverside 54303
El Cajon San Diego 4 100116 1998 1998 1998 2007 1998 1998 1998
El Centro Imperial 2 43145 2005 2007 2005 2008 2005 2005 2005
El Cerrito Contra Costa 3 23648 1999 1999 1999 2003 1999 1999 1999
El Monte Los Angeles 1 113785 2011 2011 2011 2008 2011 2011 2011
El Segundo Los Angeles 16708 1992 2004 1992 2001 1992 1992 1992
Elk Grove Sacramento 5 154594 2003 2003 2003 2003 2003 2003 2003
Emeryville Alameda 5 10125 2009 2009 2009 2009 2009 2009 2009
Encinitas San Diego 12 59910 1989 1989 1989 1989 1989 1989 1989
Escalon San Joaquin 1 7166 2010 2010 2005 2010 2005 2005 2005
Escondido San Diego 8 145196 1990 1990 1990 2005 1990 1990 1990
Etna Siskiyou 739 2005 2005 2005 2010 2005 2005 2005
Eureka Humboldt 4 27283 1997 1997 1997 2009 1997 1997 1997
Exeter Tulare 1 10395 2004 2004 1991 2010 1996 1991 1975
Fairfax Marin 2 7497 1991 2009 1975 2006 1975 1976 1976
Fairfield Solano 5 104815 2002 2002 2002 2009 2002 2002 2002
Farmersville Tulare 1 10796 2002 2002 2002 2009 1978 2002 1978
Ferndale Humboldt 1 1375 1986 1986 1986 2006 1986 1986 1986
Fillmore Ventura 1 15120 2005 2005 1988 2003 1988 1988 1988
Firebaugh Fresno 1 7619 2010 2010 2010 2009 2010 2010 2010
Folsom Sacramento 4 72439 1988 1988 1988 2009 1988 1988 1988
Fontana San Bernardino 10 198456 2010 2007 2003 2010 2003 2003 2010
Fort Bragg Mendocino 1 7308 2008 2008 2008 2009 2008 2008 2008
Fort Jones Siskiyou 0 841 1989 1989 1989 2004 1989 1989 1989
Fortuna Humboldt 2 11977 2010 2010 2010 2010 2010 2010 2010
*Upon incorporation on October 1, 2010, the City of Eastvale adopted the Riverside County General Plan (2003).
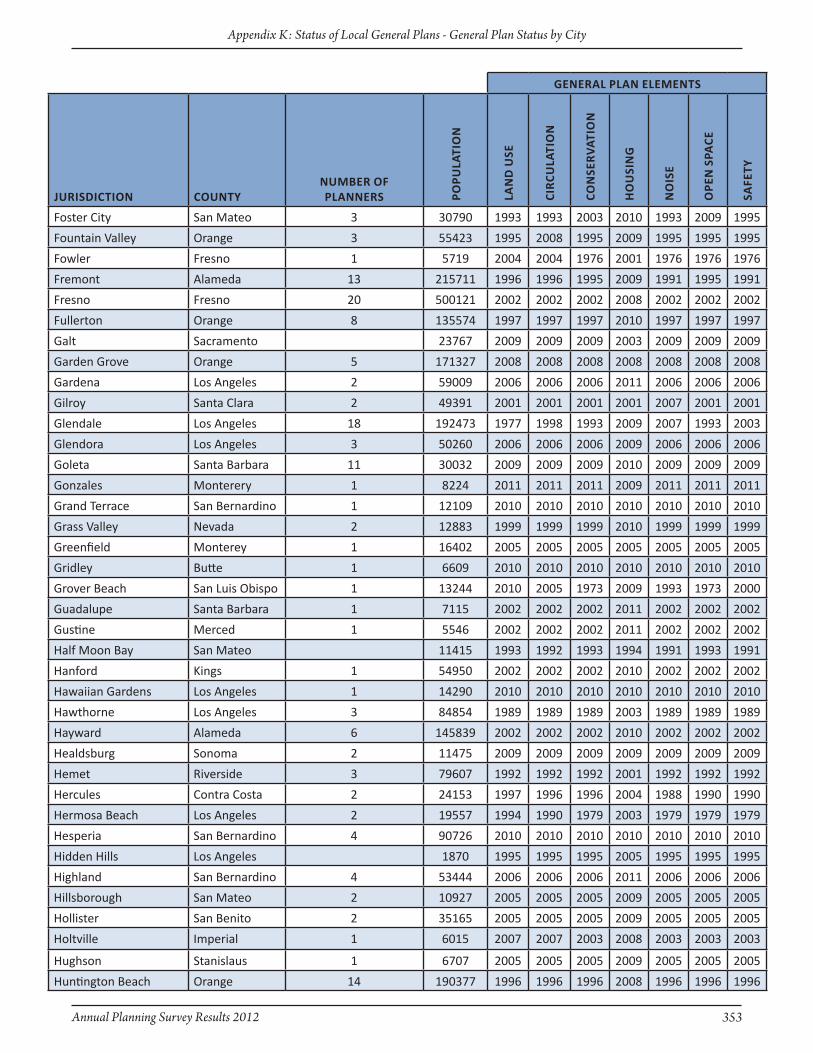
Annual Planning Survey Results 2012 353
Appendix K: Status of Local General Plans - General Plan Status by City
GeneRAl PlAn eleMents
JuRisdictiOn CounTynuMBeR Of PlAnneRs PO
PulA
tiO
n
lAn
d u
se
ciR
culA
tiO
n
cOn
seR
vAt
iOn
Ho
uSi
ng
no
iSe
OPe
n s
PAce
Safe
Ty
Foster City San Mateo 3 30790 1993 1993 2003 2010 1993 2009 1995
Fountain Valley Orange 3 55423 1995 2008 1995 2009 1995 1995 1995
Fowler Fresno 1 5719 2004 2004 1976 2001 1976 1976 1976
Fremont Alameda 13 215711 1996 1996 1995 2009 1991 1995 1991
Fresno Fresno 20 500121 2002 2002 2002 2008 2002 2002 2002
Fullerton Orange 8 135574 1997 1997 1997 2010 1997 1997 1997
Galt Sacramento 23767 2009 2009 2009 2003 2009 2009 2009
Garden Grove Orange 5 171327 2008 2008 2008 2008 2008 2008 2008
Gardena Los Angeles 2 59009 2006 2006 2006 2011 2006 2006 2006
Gilroy Santa Clara 2 49391 2001 2001 2001 2001 2007 2001 2001
Glendale Los Angeles 18 192473 1977 1998 1993 2009 2007 1993 2003
Glendora Los Angeles 3 50260 2006 2006 2006 2009 2006 2006 2006
Goleta Santa Barbara 11 30032 2009 2009 2009 2010 2009 2009 2009
Gonzales Monterery 1 8224 2011 2011 2011 2009 2011 2011 2011
Grand Terrace San Bernardino 1 12109 2010 2010 2010 2010 2010 2010 2010
Grass Valley Nevada 2 12883 1999 1999 1999 2010 1999 1999 1999
Greenfield Monterey 1 16402 2005 2005 2005 2005 2005 2005 2005
Gridley Butte 1 6609 2010 2010 2010 2010 2010 2010 2010
Grover Beach San Luis Obispo 1 13244 2010 2005 1973 2009 1993 1973 2000
Guadalupe Santa Barbara 1 7115 2002 2002 2002 2011 2002 2002 2002
Gustine Merced 1 5546 2002 2002 2002 2011 2002 2002 2002
Half Moon Bay San Mateo 11415 1993 1992 1993 1994 1991 1993 1991
Hanford Kings 1 54950 2002 2002 2002 2010 2002 2002 2002
Hawaiian Gardens Los Angeles 1 14290 2010 2010 2010 2010 2010 2010 2010
Hawthorne Los Angeles 3 84854 1989 1989 1989 2003 1989 1989 1989
Hayward Alameda 6 145839 2002 2002 2002 2010 2002 2002 2002
Healdsburg Sonoma 2 11475 2009 2009 2009 2009 2009 2009 2009
Hemet Riverside 3 79607 1992 1992 1992 2001 1992 1992 1992
Hercules Contra Costa 2 24153 1997 1996 1996 2004 1988 1990 1990
Hermosa Beach Los Angeles 2 19557 1994 1990 1979 2003 1979 1979 1979
Hesperia San Bernardino 4 90726 2010 2010 2010 2010 2010 2010 2010
Hidden Hills Los Angeles 1870 1995 1995 1995 2005 1995 1995 1995
Highland San Bernardino 4 53444 2006 2006 2006 2011 2006 2006 2006
Hillsborough San Mateo 2 10927 2005 2005 2005 2009 2005 2005 2005
Hollister San Benito 2 35165 2005 2005 2005 2009 2005 2005 2005
Holtville Imperial 1 6015 2007 2007 2003 2008 2003 2003 2003
Hughson Stanislaus 1 6707 2005 2005 2005 2009 2005 2005 2005
Huntington Beach Orange 14 190377 1996 1996 1996 2008 1996 1996 1996

354 Annual Planning Survey Results 2012
Appendix K: Status of Local General Plans - General Plan Status by City
GeneRAl PlAn eleMents
JuRisdictiOn CounTynuMBeR Of PlAnneRs PO
PulA
tiO
n
lAn
d u
se
ciR
culA
tiO
n
cOn
seR
vAt
iOn
Ho
uSi
ng
no
iSe
OPe
n s
PAce
Safe
Ty
Huntington Park Los Angeles 4 58280 1991 1991 1992 2009 1992 1992 1992
Huron Fresno 6790 2007 2007 2007 2005 2007 2007 2007
Imperial Imperial 15089 1992 1992 1992 2008 1992 1992 1992
Imperial Beach San Diego 3 37708 1994 2009 1994 2009 1994 1994 1999
Indian Wells Riverside 2 5010 2007 2008 2009 2009 2008 2008 2005
Indio Riverside 3 77165 1993 2009 1993 2008 1993 1993 1993
Industry Los Angeles 2 451 1971 1971 1971 2007 1974 1971 1975
Inglewood Los Angeles 6 110028 1980 1992 1997 2005 1987 1995 1995
Ione Amador 1 7580 2009 2009 2009 2009 2009 2009 2009
Irvine Orange 22 219156 2000 2000 2000 2000 2000 2000 2000
Irwindale Los Angeles 2 1426 2008 2008 2008 2011 2008 2008 2008
Isleton Sacramento 808 2000 2000 2000 2000 2000 2000 2000
Jackson Amador 1 4671 2008 2008 1987 2010 1987 1987 1981
Jurupa Valley* Riverside N/A
Kerman Fresno 1 13751 2007 2007 2007 2001 2007 2007 2007
King City Monterey 12946 1998 1998 1998 2010 1998 1998 1998
Kingsburg Fresno 11509 1992 1992 1992 2002 1992 1992 1992
La Cañada Flintridge Los Angeles 6 20301 1993 1995 1980 1993 1980 1980 1980
La Habra Orange 5 60432 1990 1990 1990 2008 1990 1990 1990
La Habra Heights Los Angeles 1 5340 2004 2004 2004 2004 2004 2004 2004
La Mesa San Diego 5 58041 1996 1996 1996 2005 1996 1996 1996
La Mirada Los Angeles 4 48659 2003 2003 2003 2011 2003 2003 2003
La Palma Orange 1 15596 1999 1999 1999 2010 1999 1999 1999
La Puente Los Angeles 1 39930 2004 2004 2004 2008 2004 2004 2004
La Quinta Riverside 5 37836 2002 2002 2002 2011 2002 2002 2002
La Verne Los Angeles 5 31153 1998 1998 1998 2010 1998 1998 1998
Lafayette Contra Costa 6 24025 2002 2002 2002 2011 2002 2002 2002
Laguna Beach Orange 9 22792 2009 1999 1993 2008 2005 1993 1995
Laguna Hills Orange 1.5 30410 2009 2009 2009 2009 2009 2009 2009
Laguna Niguel Orange 6 63228 1992 1992 1992 2000 1992 1992 1992
Laguna Woods Orange 1 16224 2011 2003 2003 2009 2003 2003 2003
Lake Elsinore Riverside 5 52503 1998 1998 1998 2005 1998 1998 1998
Lake Forest Orange 77490 2010 2008 2010 2010 2001 2010 2001
Lakeport Lake 2 4745 2009 2009 2009 2009 2009 2009 2009
Lakewood Los Angeles 5 80260 1996 1996 1996 2010 1996 1996 1996
Lancaster Los Angeles 7 157795 2009 2009 2009 2008 2009 2009 2009
*Upon incorporation in 2011, the City of Jurupa Valley adopted the Riverside County General Plan (2003).

Annual Planning Survey Results 2012 355
Appendix K: Status of Local General Plans - General Plan Status by City
*Upon incorporation in 2008, the City of Menifee adopted the Riverside County General Plan (2003). The City plans on adopting a new General Plan in 2012.
GeneRAl PlAn eleMents
JuRisdictiOn CounTynuMBeR Of PlAnneRs PO
PulA
tiO
n
lAn
d u
se
ciR
culA
tiO
n
cOn
seR
vAt
iOn
Ho
uSi
ng
no
iSe
OPe
n s
PAce
Safe
Ty
Larkspur Marin 4 12014 1990 1990 1990 2010 1990 1990 1990
Lathrop San Joaquin 18656 2004 2004 2004 2004 2004 2004 2004
Lawndale Los Angeles 3 32860 1991 1991 1991 2010 1991 1991 1991
Lemon Grove San Diego 3 25478 1996 1996 1996 2006 1996 1996 1996
Lemoore Kings 2 24835 2008 2008 2008 2010 2008 2008 2008
Lincoln Placer 2 43248 2008 2008 2008 2010 2008 2008 2008
Lindsay Tulare 12020 1989 1989 1989 2010 1989 1989 1989
Live Oak Sutter 0.3 8586 2010 2010 2010 2010 2010 2010 2010
Livermore Alameda 9 81687 2004 2004 2004 2010 2004 2004 2004
Livingston Merced 1 13266 2008 2008 2008 2010 2008 2008 2008
Lodi San Joaquin 1 62473 2010 2010 2010 2010 2010 2010 2010
Loma Linda San Bernardino 23395 2009 2009 2009 2009 2009 2009 2009
Lomita Los Angeles 2 20319 1989 1989 1989 2011 1989 1989 1989
Lompoc Santa Barbara 2 42262 1997 1997 1997 2010 1997 1997 1997
Long Beach Los Angeles 14 463894 1989 1991 1973 2009 1975 2002 1975
Loomis Placer 1 6475 2001 2001 2001 2006 2001 2001 2001
Los Alamitos Orange 1 11474 2001 2001 2001 2009 2001 2001 2001
Los Altos Santa Clara 4 29176 2002 2002 2002 2009 2002 2002 2002
Los Altos Hills Santa Clara 3 7980 2008 1999 2007 2010 2007 2008 2007
Los Angeles Los Angeles 150 3810129 2004 1999 1973 2009 1999 1973 1996
Los Banos Merced 2 36525 2009 2009 2009 2009 2009 2009 2009
Los Gatos Santa Clara 6 29651 2010 2010 2010 2010 2010 2010 2010
Loyalton Sierra 770 2008 2008 2008 2008 2008 2008 2008
Lynwood Los Angeles 2 69970 2003 2003 2003 2003 2003 2003 2003
Madera Madera 2 61879 2009 2009 2009 2009 2009 2009 2009
Malibu Los Angeles 9 12683 1995 1995 1995 2001 1995 1995 1995
Mammoth Lakes Mono 8286 2007 2007 2007 2010 1997 2007 2007
Manhattan Beach Los Angeles 5 plus director 35248 2003 2003 2003 2009 2003 2003 2003
Manteca San Joaquin 5 68410 2003 2011 2003 2010 2003 2003 2003
Maricopa Kern 1161 2009 2009 1990 1990 1990 1990 1990
Marina Monterey 1 19808 2000 2000 2000 2010 2000 2000 2000
Martinez Contra Costa 3 35958 1973 1992 1973 2011 1985 1973 1973
Marysville Yuba 1 12233 1985 1985 1985 2003 1985 1985 1985
Maywood Los Angeles 1 fulltime, 1 part-time 27481 2009 2009 2003 2011 2003 2003 2004
McFarland Kern 12739 1992 1992 1992 2007 1992 1992 1992
Mendota Fresno 1 11081 2009 2009 2009 2004 2009 2009 2009

356 Annual Planning Survey Results 2012
Appendix K: Status of Local General Plans - General Plan Status by City
GeneRAl PlAn eleMents
JuRisdictiOn CounTynuMBeR Of PlAnneRs PO
PulA
tiO
n
lAn
d u
se
ciR
culA
tiO
n
cOn
seR
vAt
iOn
Ho
uSi
ng
no
iSe
OPe
n s
PAce
Safe
Ty
Menifee Riverside 2 79444
Menlo Park San Mateo 5 32319 1994 1994 1973 1992 1978 1973 1976
Merced Merced 5 planners, 1 planning tech, and 2 clerical in the Planning Division
79259 1997 1997 1997 2011 1997 1997 1995
Mill Valley Marin 3 14064 1989 1989 1989 2003 1989 1989 1989
Millbrae San Mateo 1 21714 1998 1998 1998 1998 1998 1998 1998
Milpitas Santa Clara 3 67476 2010 2010 2010 2009 2010 2010 2010
Mission Viejo Orange 4 93483 1998 2006 1999 2009 2009 1999 2009
Modesto Stanislaus 8 202290 1995 1995 1995 2011 1995 1995 1995
Monrovia Los Angeles 3 36686 2008 2008 1966 2003 2002 1966 2002
Montague Siskiyou 0 contracted out 1446 1992 1992 1992 2009 1992 1992 1992
Montclair San Bernardino 2 37031 2000 2000 2000 2001 2000 2000 2000
Monte Sereno Santa Clara 2 3364 2009 2009 2009 2010 2009 2009 2009
Montebello Los Angeles 3 62792 1973 1973 1975 1993 1975 1973 1975
Monterey Monterey 5 29440 2005 2005 2005 2009 2005 2005 2005
Monterey Park Los Angeles 2 60435 2001 2001 2001 2009 2001 2001 2001
Moorpark Ventura 4 34710 1992 1992 1986 2001 1998 1986 2001
Moraga Contra Costa 2 16076 2002 2002 2002 2010 2002 2002 2002
Moreno Valley Riverside 6 195216 2006 2006 2006 2008 2006 2006 2006
Morgan Hill Santa Clara 4 38309 2001 2010 2001 2010 2001 2001 2001
Morro Bay San Luis Obispo 2 10329 1988 1988 1988 2009 1993 1988 1988
Mount Shasta Siskiyou 1 3402 2007 2007 2007 2009 2007 2007 2007
Mountain View Santa Clara 11 74723 1992 1992 1992 2011 1992 1992 1992
Murrieta Riverside 6 104459 2011 2011 2011 2011 2011 2011 2011
Napa Napa 6 77464 1998 1998 1998 2009 1998 1998 1998
National City San Diego 2 58785 2011 2011 2011 2005 2011 2011 2011
Needles San Bernardino 0 4874 1986 1986 1986 2005 1986 1986 1986
Nevada City Nevada 1 66895 1986 1986 1986 2009 1986 1986 1986
Newark Alameda 3 42764 1992 1992 1992 2010 1992 1992 1992
Newman Stanislaus 1 10505 2007 2007 2007 2010 2007 2007 2007
Newport Beach Orange 16 85376 2006 2006 2006 2011 2006 2006 2006
Norco Riverside 2.5 27060 2009 2000 2002 2009 2003 1989 1976
Norwalk Los Angeles 3 105808 1996 1996 1996 2001 1996 1996 1996
Novato Marin 6 52311 1996 1996 1996 2009 1996 1996 1996
Oakdale Stanislaus 2 20839 1993 1993 1993 2010 1993 1993 1993
Oakland Alameda 31 392932 1998 1998 1996 2010 2005 1996 2004
Oakley Contra Costa 2 35997 2002 2002 2002 2010 2002 2002 2000
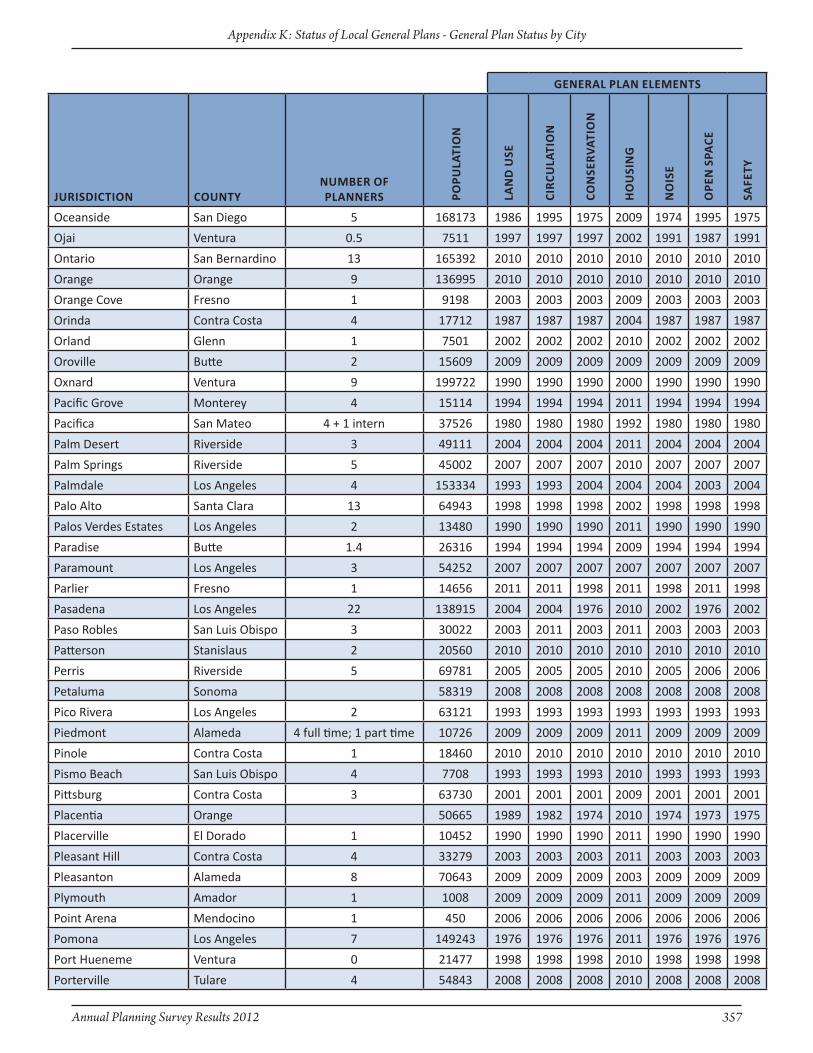
Annual Planning Survey Results 2012 357
Appendix K: Status of Local General Plans - General Plan Status by City
GeneRAl PlAn eleMents
JuRisdictiOn CounTynuMBeR Of PlAnneRs PO
PulA
tiO
n
lAn
d u
se
ciR
culA
tiO
n
cOn
seR
vAt
iOn
Ho
uSi
ng
no
iSe
OPe
n s
PAce
Safe
Ty
Oceanside San Diego 5 168173 1986 1995 1975 2009 1974 1995 1975
Ojai Ventura 0.5 7511 1997 1997 1997 2002 1991 1987 1991
Ontario San Bernardino 13 165392 2010 2010 2010 2010 2010 2010 2010
Orange Orange 9 136995 2010 2010 2010 2010 2010 2010 2010
Orange Cove Fresno 1 9198 2003 2003 2003 2009 2003 2003 2003
Orinda Contra Costa 4 17712 1987 1987 1987 2004 1987 1987 1987
Orland Glenn 1 7501 2002 2002 2002 2010 2002 2002 2002
Oroville Butte 2 15609 2009 2009 2009 2009 2009 2009 2009
Oxnard Ventura 9 199722 1990 1990 1990 2000 1990 1990 1990
Pacific Grove Monterey 4 15114 1994 1994 1994 2011 1994 1994 1994
Pacifica San Mateo 4 + 1 intern 37526 1980 1980 1980 1992 1980 1980 1980
Palm Desert Riverside 3 49111 2004 2004 2004 2011 2004 2004 2004
Palm Springs Riverside 5 45002 2007 2007 2007 2010 2007 2007 2007
Palmdale Los Angeles 4 153334 1993 1993 2004 2004 2004 2003 2004
Palo Alto Santa Clara 13 64943 1998 1998 1998 2002 1998 1998 1998
Palos Verdes Estates Los Angeles 2 13480 1990 1990 1990 2011 1990 1990 1990
Paradise Butte 1.4 26316 1994 1994 1994 2009 1994 1994 1994
Paramount Los Angeles 3 54252 2007 2007 2007 2007 2007 2007 2007
Parlier Fresno 1 14656 2011 2011 1998 2011 1998 2011 1998
Pasadena Los Angeles 22 138915 2004 2004 1976 2010 2002 1976 2002
Paso Robles San Luis Obispo 3 30022 2003 2011 2003 2011 2003 2003 2003
Patterson Stanislaus 2 20560 2010 2010 2010 2010 2010 2010 2010
Perris Riverside 5 69781 2005 2005 2005 2010 2005 2006 2006
Petaluma Sonoma 58319 2008 2008 2008 2008 2008 2008 2008
Pico Rivera Los Angeles 2 63121 1993 1993 1993 1993 1993 1993 1993
Piedmont Alameda 4 full time; 1 part time 10726 2009 2009 2009 2011 2009 2009 2009
Pinole Contra Costa 1 18460 2010 2010 2010 2010 2010 2010 2010
Pismo Beach San Luis Obispo 4 7708 1993 1993 1993 2010 1993 1993 1993
Pittsburg Contra Costa 3 63730 2001 2001 2001 2009 2001 2001 2001
Placentia Orange 50665 1989 1982 1974 2010 1974 1973 1975
Placerville El Dorado 1 10452 1990 1990 1990 2011 1990 1990 1990
Pleasant Hill Contra Costa 4 33279 2003 2003 2003 2011 2003 2003 2003
Pleasanton Alameda 8 70643 2009 2009 2009 2003 2009 2009 2009
Plymouth Amador 1 1008 2009 2009 2009 2011 2009 2009 2009
Point Arena Mendocino 1 450 2006 2006 2006 2006 2006 2006 2006
Pomona Los Angeles 7 149243 1976 1976 1976 2011 1976 1976 1976
Port Hueneme Ventura 0 21477 1998 1998 1998 2010 1998 1998 1998
Porterville Tulare 4 54843 2008 2008 2008 2010 2008 2008 2008
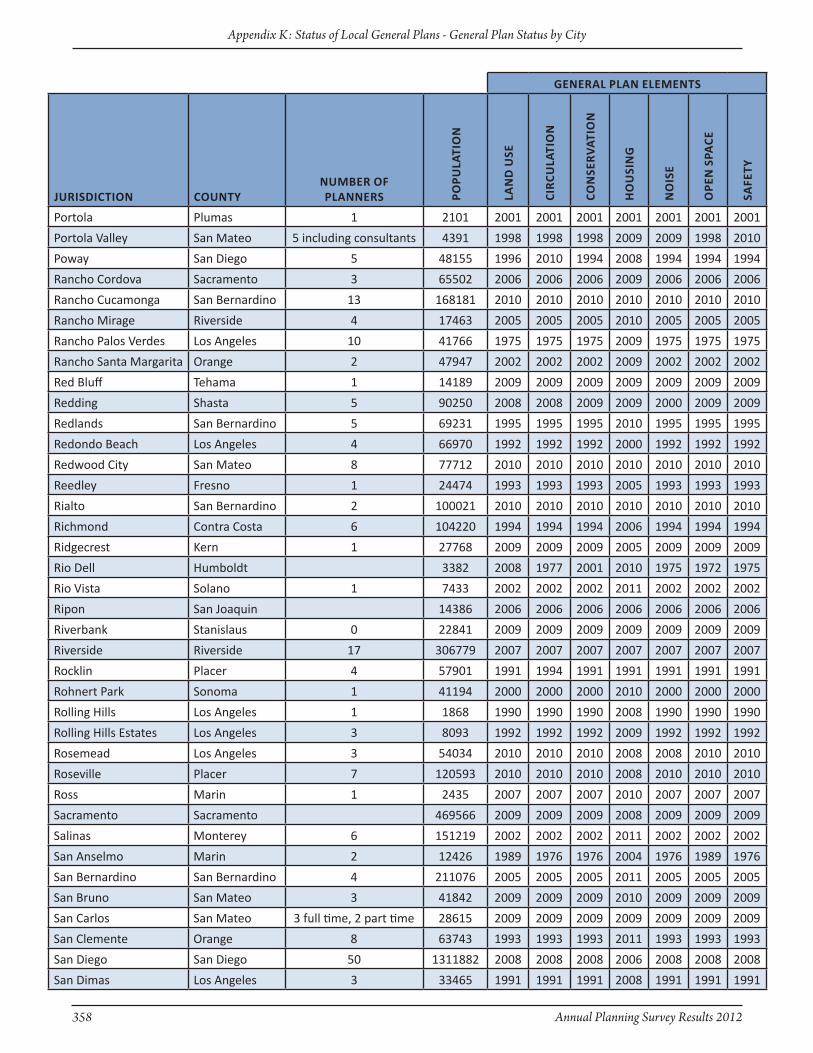
358 Annual Planning Survey Results 2012
Appendix K: Status of Local General Plans - General Plan Status by City
GeneRAl PlAn eleMents
JuRisdictiOn CounTynuMBeR Of PlAnneRs PO
PulA
tiO
n
lAn
d u
se
ciR
culA
tiO
n
cOn
seR
vAt
iOn
Ho
uSi
ng
no
iSe
OPe
n s
PAce
Safe
Ty
Portola Plumas 1 2101 2001 2001 2001 2001 2001 2001 2001
Portola Valley San Mateo 5 including consultants 4391 1998 1998 1998 2009 2009 1998 2010
Poway San Diego 5 48155 1996 2010 1994 2008 1994 1994 1994
Rancho Cordova Sacramento 3 65502 2006 2006 2006 2009 2006 2006 2006
Rancho Cucamonga San Bernardino 13 168181 2010 2010 2010 2010 2010 2010 2010
Rancho Mirage Riverside 4 17463 2005 2005 2005 2010 2005 2005 2005
Rancho Palos Verdes Los Angeles 10 41766 1975 1975 1975 2009 1975 1975 1975
Rancho Santa Margarita Orange 2 47947 2002 2002 2002 2009 2002 2002 2002
Red Bluff Tehama 1 14189 2009 2009 2009 2009 2009 2009 2009
Redding Shasta 5 90250 2008 2008 2009 2009 2000 2009 2009
Redlands San Bernardino 5 69231 1995 1995 1995 2010 1995 1995 1995
Redondo Beach Los Angeles 4 66970 1992 1992 1992 2000 1992 1992 1992
Redwood City San Mateo 8 77712 2010 2010 2010 2010 2010 2010 2010
Reedley Fresno 1 24474 1993 1993 1993 2005 1993 1993 1993
Rialto San Bernardino 2 100021 2010 2010 2010 2010 2010 2010 2010
Richmond Contra Costa 6 104220 1994 1994 1994 2006 1994 1994 1994
Ridgecrest Kern 1 27768 2009 2009 2009 2005 2009 2009 2009
Rio Dell Humboldt 3382 2008 1977 2001 2010 1975 1972 1975
Rio Vista Solano 1 7433 2002 2002 2002 2011 2002 2002 2002
Ripon San Joaquin 14386 2006 2006 2006 2006 2006 2006 2006
Riverbank Stanislaus 0 22841 2009 2009 2009 2009 2009 2009 2009
Riverside Riverside 17 306779 2007 2007 2007 2007 2007 2007 2007
Rocklin Placer 4 57901 1991 1994 1991 1991 1991 1991 1991
Rohnert Park Sonoma 1 41194 2000 2000 2000 2010 2000 2000 2000
Rolling Hills Los Angeles 1 1868 1990 1990 1990 2008 1990 1990 1990
Rolling Hills Estates Los Angeles 3 8093 1992 1992 1992 2009 1992 1992 1992
Rosemead Los Angeles 3 54034 2010 2010 2010 2008 2008 2010 2010
Roseville Placer 7 120593 2010 2010 2010 2008 2010 2010 2010
Ross Marin 1 2435 2007 2007 2007 2010 2007 2007 2007
Sacramento Sacramento 469566 2009 2009 2009 2008 2009 2009 2009
Salinas Monterey 6 151219 2002 2002 2002 2011 2002 2002 2002
San Anselmo Marin 2 12426 1989 1976 1976 2004 1976 1989 1976
San Bernardino San Bernardino 4 211076 2005 2005 2005 2011 2005 2005 2005
San Bruno San Mateo 3 41842 2009 2009 2009 2010 2009 2009 2009
San Carlos San Mateo 3 full time, 2 part time 28615 2009 2009 2009 2009 2009 2009 2009
San Clemente Orange 8 63743 1993 1993 1993 2011 1993 1993 1993
San Diego San Diego 50 1311882 2008 2008 2008 2006 2008 2008 2008
San Dimas Los Angeles 3 33465 1991 1991 1991 2008 1991 1991 1991
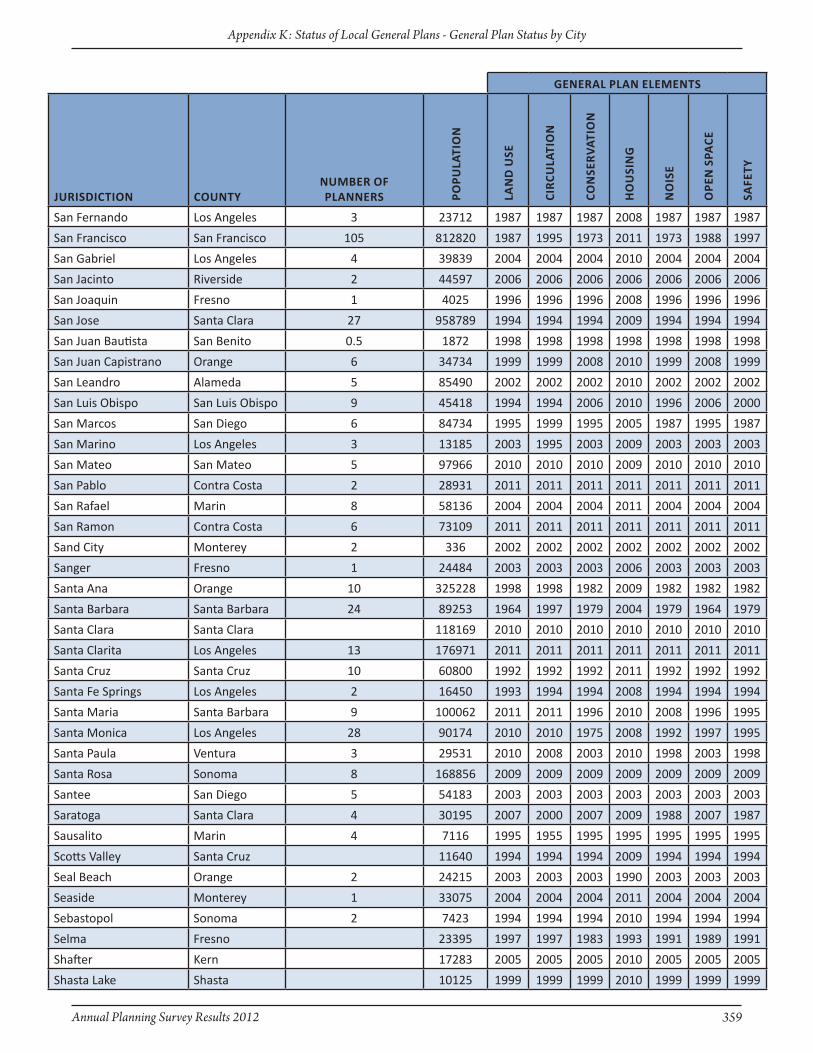
Annual Planning Survey Results 2012 359
Appendix K: Status of Local General Plans - General Plan Status by City
GeneRAl PlAn eleMents
JuRisdictiOn CounTynuMBeR Of PlAnneRs PO
PulA
tiO
n
lAn
d u
se
ciR
culA
tiO
n
cOn
seR
vAt
iOn
Ho
uSi
ng
no
iSe
OPe
n s
PAce
Safe
Ty
San Fernando Los Angeles 3 23712 1987 1987 1987 2008 1987 1987 1987
San Francisco San Francisco 105 812820 1987 1995 1973 2011 1973 1988 1997
San Gabriel Los Angeles 4 39839 2004 2004 2004 2010 2004 2004 2004
San Jacinto Riverside 2 44597 2006 2006 2006 2006 2006 2006 2006
San Joaquin Fresno 1 4025 1996 1996 1996 2008 1996 1996 1996
San Jose Santa Clara 27 958789 1994 1994 1994 2009 1994 1994 1994
San Juan Bautista San Benito 0.5 1872 1998 1998 1998 1998 1998 1998 1998
San Juan Capistrano Orange 6 34734 1999 1999 2008 2010 1999 2008 1999
San Leandro Alameda 5 85490 2002 2002 2002 2010 2002 2002 2002
San Luis Obispo San Luis Obispo 9 45418 1994 1994 2006 2010 1996 2006 2000
San Marcos San Diego 6 84734 1995 1999 1995 2005 1987 1995 1987
San Marino Los Angeles 3 13185 2003 1995 2003 2009 2003 2003 2003
San Mateo San Mateo 5 97966 2010 2010 2010 2009 2010 2010 2010
San Pablo Contra Costa 2 28931 2011 2011 2011 2011 2011 2011 2011
San Rafael Marin 8 58136 2004 2004 2004 2011 2004 2004 2004
San Ramon Contra Costa 6 73109 2011 2011 2011 2011 2011 2011 2011
Sand City Monterey 2 336 2002 2002 2002 2002 2002 2002 2002
Sanger Fresno 1 24484 2003 2003 2003 2006 2003 2003 2003
Santa Ana Orange 10 325228 1998 1998 1982 2009 1982 1982 1982
Santa Barbara Santa Barbara 24 89253 1964 1997 1979 2004 1979 1964 1979
Santa Clara Santa Clara 118169 2010 2010 2010 2010 2010 2010 2010
Santa Clarita Los Angeles 13 176971 2011 2011 2011 2011 2011 2011 2011
Santa Cruz Santa Cruz 10 60800 1992 1992 1992 2011 1992 1992 1992
Santa Fe Springs Los Angeles 2 16450 1993 1994 1994 2008 1994 1994 1994
Santa Maria Santa Barbara 9 100062 2011 2011 1996 2010 2008 1996 1995
Santa Monica Los Angeles 28 90174 2010 2010 1975 2008 1992 1997 1995
Santa Paula Ventura 3 29531 2010 2008 2003 2010 1998 2003 1998
Santa Rosa Sonoma 8 168856 2009 2009 2009 2009 2009 2009 2009
Santee San Diego 5 54183 2003 2003 2003 2003 2003 2003 2003
Saratoga Santa Clara 4 30195 2007 2000 2007 2009 1988 2007 1987
Sausalito Marin 4 7116 1995 1955 1995 1995 1995 1995 1995
Scotts Valley Santa Cruz 11640 1994 1994 1994 2009 1994 1994 1994
Seal Beach Orange 2 24215 2003 2003 2003 1990 2003 2003 2003
Seaside Monterey 1 33075 2004 2004 2004 2011 2004 2004 2004
Sebastopol Sonoma 2 7423 1994 1994 1994 2010 1994 1994 1994
Selma Fresno 23395 1997 1997 1983 1993 1991 1989 1991
Shafter Kern 17283 2005 2005 2005 2010 2005 2005 2005
Shasta Lake Shasta 10125 1999 1999 1999 2010 1999 1999 1999
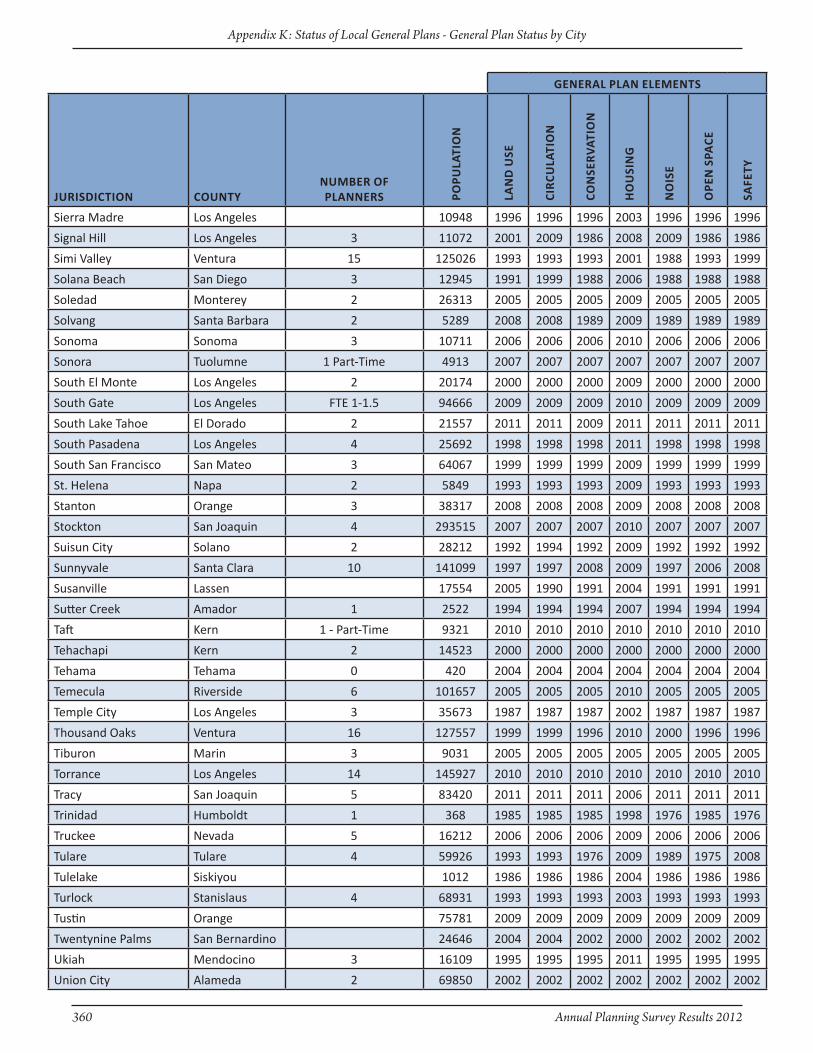
360 Annual Planning Survey Results 2012
Appendix K: Status of Local General Plans - General Plan Status by City
GeneRAl PlAn eleMents
JuRisdictiOn CounTynuMBeR Of PlAnneRs PO
PulA
tiO
n
lAn
d u
se
ciR
culA
tiO
n
cOn
seR
vAt
iOn
Ho
uSi
ng
no
iSe
OPe
n s
PAce
Safe
Ty
Sierra Madre Los Angeles 10948 1996 1996 1996 2003 1996 1996 1996
Signal Hill Los Angeles 3 11072 2001 2009 1986 2008 2009 1986 1986
Simi Valley Ventura 15 125026 1993 1993 1993 2001 1988 1993 1999
Solana Beach San Diego 3 12945 1991 1999 1988 2006 1988 1988 1988
Soledad Monterey 2 26313 2005 2005 2005 2009 2005 2005 2005
Solvang Santa Barbara 2 5289 2008 2008 1989 2009 1989 1989 1989
Sonoma Sonoma 3 10711 2006 2006 2006 2010 2006 2006 2006
Sonora Tuolumne 1 Part-Time 4913 2007 2007 2007 2007 2007 2007 2007
South El Monte Los Angeles 2 20174 2000 2000 2000 2009 2000 2000 2000
South Gate Los Angeles FTE 1-1.5 94666 2009 2009 2009 2010 2009 2009 2009
South Lake Tahoe El Dorado 2 21557 2011 2011 2009 2011 2011 2011 2011
South Pasadena Los Angeles 4 25692 1998 1998 1998 2011 1998 1998 1998
South San Francisco San Mateo 3 64067 1999 1999 1999 2009 1999 1999 1999
St. Helena Napa 2 5849 1993 1993 1993 2009 1993 1993 1993
Stanton Orange 3 38317 2008 2008 2008 2009 2008 2008 2008
Stockton San Joaquin 4 293515 2007 2007 2007 2010 2007 2007 2007
Suisun City Solano 2 28212 1992 1994 1992 2009 1992 1992 1992
Sunnyvale Santa Clara 10 141099 1997 1997 2008 2009 1997 2006 2008
Susanville Lassen 17554 2005 1990 1991 2004 1991 1991 1991
Sutter Creek Amador 1 2522 1994 1994 1994 2007 1994 1994 1994
Taft Kern 1 - Part-Time 9321 2010 2010 2010 2010 2010 2010 2010
Tehachapi Kern 2 14523 2000 2000 2000 2000 2000 2000 2000
Tehama Tehama 0 420 2004 2004 2004 2004 2004 2004 2004
Temecula Riverside 6 101657 2005 2005 2005 2010 2005 2005 2005
Temple City Los Angeles 3 35673 1987 1987 1987 2002 1987 1987 1987
Thousand Oaks Ventura 16 127557 1999 1999 1996 2010 2000 1996 1996
Tiburon Marin 3 9031 2005 2005 2005 2005 2005 2005 2005
Torrance Los Angeles 14 145927 2010 2010 2010 2010 2010 2010 2010
Tracy San Joaquin 5 83420 2011 2011 2011 2006 2011 2011 2011
Trinidad Humboldt 1 368 1985 1985 1985 1998 1976 1985 1976
Truckee Nevada 5 16212 2006 2006 2006 2009 2006 2006 2006
Tulare Tulare 4 59926 1993 1993 1976 2009 1989 1975 2008
Tulelake Siskiyou 1012 1986 1986 1986 2004 1986 1986 1986
Turlock Stanislaus 4 68931 1993 1993 1993 2003 1993 1993 1993
Tustin Orange 75781 2009 2009 2009 2009 2009 2009 2009
Twentynine Palms San Bernardino 24646 2004 2004 2002 2000 2002 2002 2002
Ukiah Mendocino 3 16109 1995 1995 1995 2011 1995 1995 1995
Union City Alameda 2 69850 2002 2002 2002 2002 2002 2002 2002
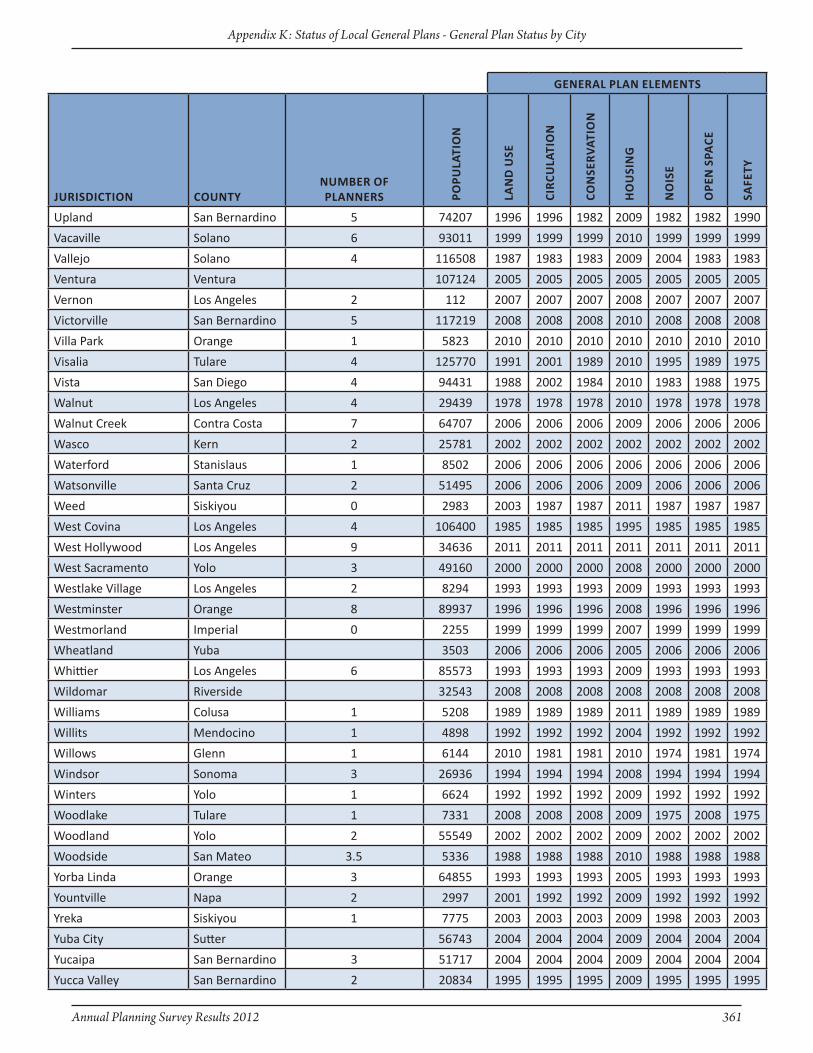
Annual Planning Survey Results 2012 361
Appendix K: Status of Local General Plans - General Plan Status by City
GeneRAl PlAn eleMents
JuRisdictiOn CounTynuMBeR Of PlAnneRs PO
PulA
tiO
n
lAn
d u
se
ciR
culA
tiO
n
cOn
seR
vAt
iOn
Ho
uSi
ng
no
iSe
OPe
n s
PAce
Safe
Ty
Upland San Bernardino 5 74207 1996 1996 1982 2009 1982 1982 1990
Vacaville Solano 6 93011 1999 1999 1999 2010 1999 1999 1999
Vallejo Solano 4 116508 1987 1983 1983 2009 2004 1983 1983
Ventura Ventura 107124 2005 2005 2005 2005 2005 2005 2005
Vernon Los Angeles 2 112 2007 2007 2007 2008 2007 2007 2007
Victorville San Bernardino 5 117219 2008 2008 2008 2010 2008 2008 2008
Villa Park Orange 1 5823 2010 2010 2010 2010 2010 2010 2010
Visalia Tulare 4 125770 1991 2001 1989 2010 1995 1989 1975
Vista San Diego 4 94431 1988 2002 1984 2010 1983 1988 1975
Walnut Los Angeles 4 29439 1978 1978 1978 2010 1978 1978 1978
Walnut Creek Contra Costa 7 64707 2006 2006 2006 2009 2006 2006 2006
Wasco Kern 2 25781 2002 2002 2002 2002 2002 2002 2002
Waterford Stanislaus 1 8502 2006 2006 2006 2006 2006 2006 2006
Watsonville Santa Cruz 2 51495 2006 2006 2006 2009 2006 2006 2006
Weed Siskiyou 0 2983 2003 1987 1987 2011 1987 1987 1987
West Covina Los Angeles 4 106400 1985 1985 1985 1995 1985 1985 1985
West Hollywood Los Angeles 9 34636 2011 2011 2011 2011 2011 2011 2011
West Sacramento Yolo 3 49160 2000 2000 2000 2008 2000 2000 2000
Westlake Village Los Angeles 2 8294 1993 1993 1993 2009 1993 1993 1993
Westminster Orange 8 89937 1996 1996 1996 2008 1996 1996 1996
Westmorland Imperial 0 2255 1999 1999 1999 2007 1999 1999 1999
Wheatland Yuba 3503 2006 2006 2006 2005 2006 2006 2006
Whittier Los Angeles 6 85573 1993 1993 1993 2009 1993 1993 1993
Wildomar Riverside 32543 2008 2008 2008 2008 2008 2008 2008
Williams Colusa 1 5208 1989 1989 1989 2011 1989 1989 1989
Willits Mendocino 1 4898 1992 1992 1992 2004 1992 1992 1992
Willows Glenn 1 6144 2010 1981 1981 2010 1974 1981 1974
Windsor Sonoma 3 26936 1994 1994 1994 2008 1994 1994 1994
Winters Yolo 1 6624 1992 1992 1992 2009 1992 1992 1992
Woodlake Tulare 1 7331 2008 2008 2008 2009 1975 2008 1975
Woodland Yolo 2 55549 2002 2002 2002 2009 2002 2002 2002
Woodside San Mateo 3.5 5336 1988 1988 1988 2010 1988 1988 1988
Yorba Linda Orange 3 64855 1993 1993 1993 2005 1993 1993 1993
Yountville Napa 2 2997 2001 1992 1992 2009 1992 1992 1992
Yreka Siskiyou 1 7775 2003 2003 2003 2009 1998 2003 2003
Yuba City Sutter 56743 2004 2004 2004 2009 2004 2004 2004
Yucaipa San Bernardino 3 51717 2004 2004 2004 2009 2004 2004 2004
Yucca Valley San Bernardino 2 20834 1995 1995 1995 2009 1995 1995 1995
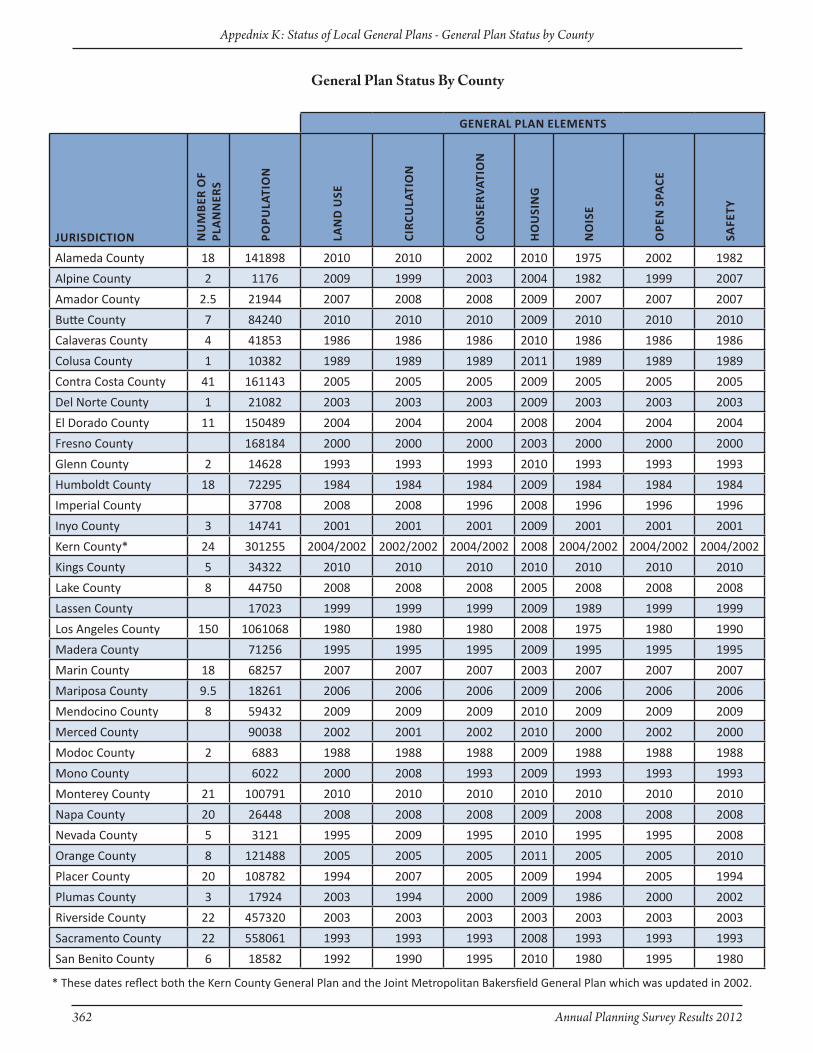
362 Annual Planning Survey Results 2012
Appednix K: Status of Local General Plans - General Plan Status by County
General Plan Status By County
GeneRAl PlAn eleMents
JuRisdictiOn nu
MB
eR O
f Pl
An
neR
s
POPu
lAti
On
lAn
d u
se
ciR
culA
tiO
n
cOn
seR
vAt
iOn
Ho
uSi
ng
no
iSe
OPe
n s
PAce
Safe
Ty
Alameda County 18 141898 2010 2010 2002 2010 1975 2002 1982
Alpine County 2 1176 2009 1999 2003 2004 1982 1999 2007
Amador County 2.5 21944 2007 2008 2008 2009 2007 2007 2007
Butte County 7 84240 2010 2010 2010 2009 2010 2010 2010
Calaveras County 4 41853 1986 1986 1986 2010 1986 1986 1986
Colusa County 1 10382 1989 1989 1989 2011 1989 1989 1989
Contra Costa County 41 161143 2005 2005 2005 2009 2005 2005 2005
Del Norte County 1 21082 2003 2003 2003 2009 2003 2003 2003
El Dorado County 11 150489 2004 2004 2004 2008 2004 2004 2004
Fresno County 168184 2000 2000 2000 2003 2000 2000 2000
Glenn County 2 14628 1993 1993 1993 2010 1993 1993 1993
Humboldt County 18 72295 1984 1984 1984 2009 1984 1984 1984
Imperial County 37708 2008 2008 1996 2008 1996 1996 1996
Inyo County 3 14741 2001 2001 2001 2009 2001 2001 2001
Kern County* 24 301255 2004/2002 2002/2002 2004/2002 2008 2004/2002 2004/2002 2004/2002
Kings County 5 34322 2010 2010 2010 2010 2010 2010 2010
Lake County 8 44750 2008 2008 2008 2005 2008 2008 2008
Lassen County 17023 1999 1999 1999 2009 1989 1999 1999
Los Angeles County 150 1061068 1980 1980 1980 2008 1975 1980 1990
Madera County 71256 1995 1995 1995 2009 1995 1995 1995
Marin County 18 68257 2007 2007 2007 2003 2007 2007 2007
Mariposa County 9.5 18261 2006 2006 2006 2009 2006 2006 2006
Mendocino County 8 59432 2009 2009 2009 2010 2009 2009 2009
Merced County 90038 2002 2001 2002 2010 2000 2002 2000
Modoc County 2 6883 1988 1988 1988 2009 1988 1988 1988
Mono County 6022 2000 2008 1993 2009 1993 1993 1993
Monterey County 21 100791 2010 2010 2010 2010 2010 2010 2010
Napa County 20 26448 2008 2008 2008 2009 2008 2008 2008
Nevada County 5 3121 1995 2009 1995 2010 1995 1995 2008
Orange County 8 121488 2005 2005 2005 2011 2005 2005 2010
Placer County 20 108782 1994 2007 2005 2009 1994 2005 1994
Plumas County 3 17924 2003 1994 2000 2009 1986 2000 2002
Riverside County 22 457320 2003 2003 2003 2003 2003 2003 2003
Sacramento County 22 558061 1993 1993 1993 2008 1993 1993 1993
San Benito County 6 18582 1992 1990 1995 2010 1980 1995 1980
* These dates reflect both the Kern County General Plan and the Joint Metropolitan Bakersfield General Plan which was updated in 2002.
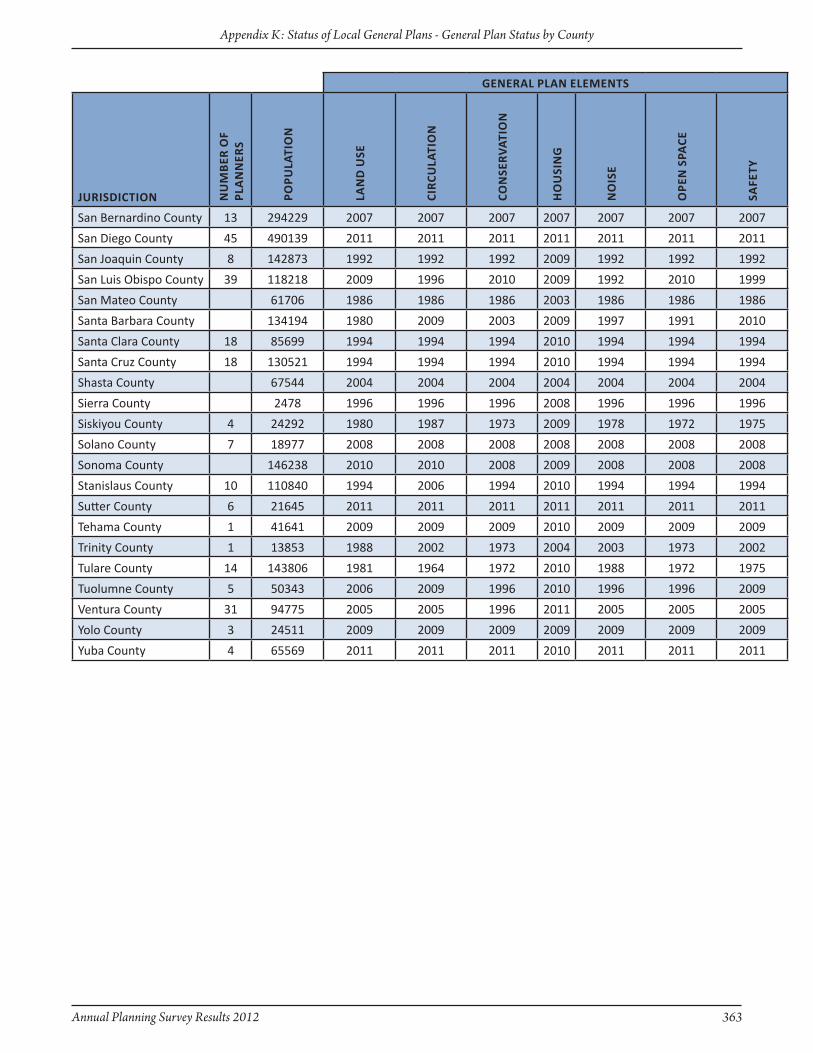
Annual Planning Survey Results 2012 363
Appendix K: Status of Local General Plans - General Plan Status by County
GeneRAl PlAn eleMents
JuRisdictiOn nu
MB
eR O
f Pl
An
neR
s
POPu
lAti
On
lAn
d u
se
ciR
culA
tiO
n
cOn
seR
vAt
iOn
Ho
uSi
ng
no
iSe
OPe
n s
PAce
Safe
Ty
San Bernardino County 13 294229 2007 2007 2007 2007 2007 2007 2007
San Diego County 45 490139 2011 2011 2011 2011 2011 2011 2011
San Joaquin County 8 142873 1992 1992 1992 2009 1992 1992 1992
San Luis Obispo County 39 118218 2009 1996 2010 2009 1992 2010 1999
San Mateo County 61706 1986 1986 1986 2003 1986 1986 1986
Santa Barbara County 134194 1980 2009 2003 2009 1997 1991 2010
Santa Clara County 18 85699 1994 1994 1994 2010 1994 1994 1994
Santa Cruz County 18 130521 1994 1994 1994 2010 1994 1994 1994
Shasta County 67544 2004 2004 2004 2004 2004 2004 2004
Sierra County 2478 1996 1996 1996 2008 1996 1996 1996
Siskiyou County 4 24292 1980 1987 1973 2009 1978 1972 1975
Solano County 7 18977 2008 2008 2008 2008 2008 2008 2008
Sonoma County 146238 2010 2010 2008 2009 2008 2008 2008
Stanislaus County 10 110840 1994 2006 1994 2010 1994 1994 1994
Sutter County 6 21645 2011 2011 2011 2011 2011 2011 2011
Tehama County 1 41641 2009 2009 2009 2010 2009 2009 2009
Trinity County 1 13853 1988 2002 1973 2004 2003 1973 2002
Tulare County 14 143806 1981 1964 1972 2010 1988 1972 1975
Tuolumne County 5 50343 2006 2009 1996 2010 1996 1996 2009
Ventura County 31 94775 2005 2005 1996 2011 2005 2005 2005
Yolo County 3 24511 2009 2009 2009 2009 2009 2009 2009
Yuba County 4 65569 2011 2011 2011 2010 2011 2011 2011
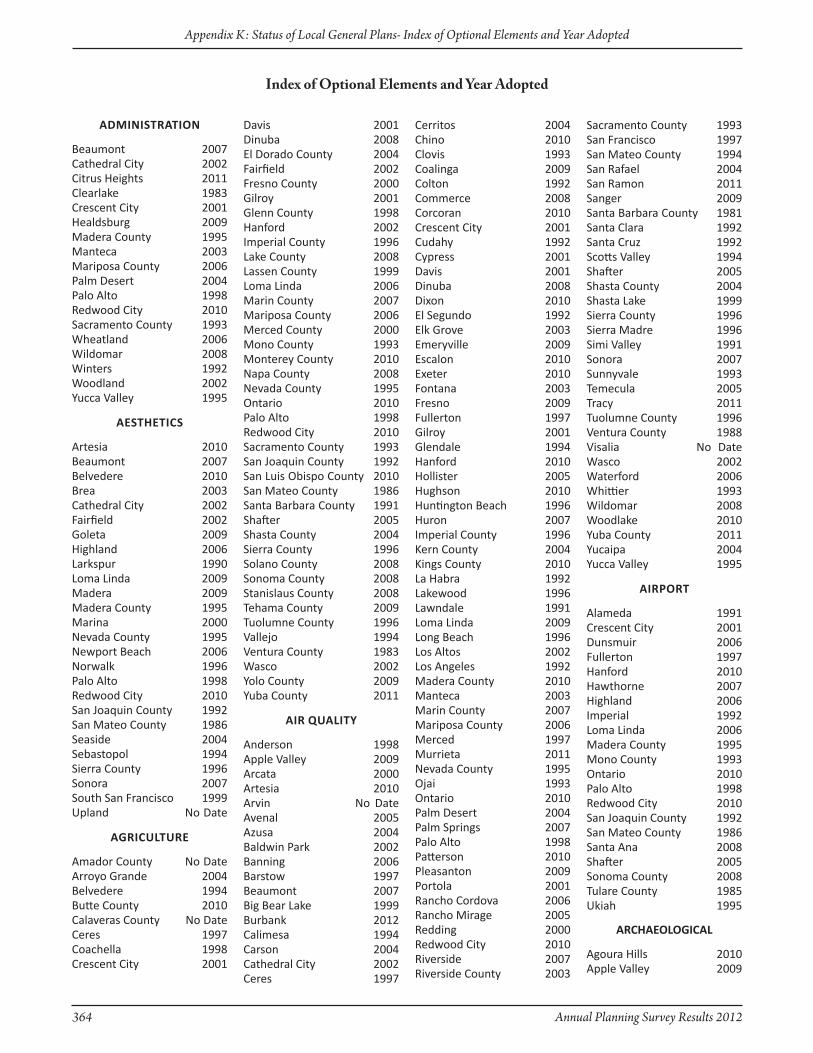
364 Annual Planning Survey Results 2012
Appendix K: Status of Local General Plans- Index of Optional Elements and Year Adopted
AdMinistRAtiOn
Beaumont 2007Cathedral City 2002Citrus Heights 2011Clearlake 1983Crescent City 2001Healdsburg 2009Madera County 1995Manteca 2003Mariposa County 2006Palm Desert 2004Palo Alto 1998Redwood City 2010Sacramento County 1993Wheatland 2006Wildomar 2008Winters 1992Woodland 2002Yucca Valley 1995
aeSTHeTiCS
Artesia 2010Beaumont 2007Belvedere 2010Brea 2003Cathedral City 2002Fairfield 2002Goleta 2009Highland 2006Larkspur 1990Loma Linda 2009Madera 2009Madera County 1995Marina 2000Nevada County 1995Newport Beach 2006Norwalk 1996Palo Alto 1998Redwood City 2010San Joaquin County 1992San Mateo County 1986Seaside 2004Sebastopol 1994Sierra County 1996Sonora 2007South San Francisco 1999Upland No Date
AGRicultuRe
Amador County No DateArroyo Grande 2004Belvedere 1994Butte County 2010Calaveras County No DateCeres 1997Coachella 1998Crescent City 2001
Davis 2001Dinuba 2008El Dorado County 2004Fairfield 2002Fresno County 2000Gilroy 2001Glenn County 1998Hanford 2002Imperial County 1996Lake County 2008Lassen County 1999Loma Linda 2006Marin County 2007Mariposa County 2006Merced County 2000Mono County 1993Monterey County 2010Napa County 2008Nevada County 1995Ontario 2010Palo Alto 1998Redwood City 2010Sacramento County 1993San Joaquin County 1992San Luis Obispo County 2010San Mateo County 1986Santa Barbara County 1991Shafter 2005Shasta County 2004Sierra County 1996Solano County 2008Sonoma County 2008Stanislaus County 2008Tehama County 2009Tuolumne County 1996Vallejo 1994Ventura County 1983Wasco 2002Yolo County 2009Yuba County 2011
AiR QuAlity
Anderson 1998Apple Valley 2009Arcata 2000Artesia 2010Arvin No DateAvenal 2005Azusa 2004Baldwin Park 2002Banning 2006Barstow 1997Beaumont 2007Big Bear Lake 1999Burbank 2012Calimesa 1994Carson 2004Cathedral City 2002Ceres 1997
Cerritos 2004Chino 2010Clovis 1993Coalinga 2009Colton 1992Commerce 2008Corcoran 2010Crescent City 2001Cudahy 1992Cypress 2001Davis 2001Dinuba 2008Dixon 2010El Segundo 1992Elk Grove 2003Emeryville 2009Escalon 2010Exeter 2010Fontana 2003Fresno 2009Fullerton 1997Gilroy 2001Glendale 1994Hanford 2010Hollister 2005Hughson 2010Huntington Beach 1996Huron 2007Imperial County 1996Kern County 2004Kings County 2010La Habra 1992Lakewood 1996Lawndale 1991Loma Linda 2009Long Beach 1996Los Altos 2002Los Angeles 1992Madera County 2010Manteca 2003Marin County 2007Mariposa County 2006Merced 1997Murrieta 2011Nevada County 1995Ojai 1993Ontario 2010Palm Desert 2004Palm Springs 2007Palo Alto 1998Patterson 2010Pleasanton 2009Portola 2001Rancho Cordova 2006Rancho Mirage 2005Redding 2000Redwood City 2010Riverside 2007Riverside County 2003
Sacramento County 1993San Francisco 1997San Mateo County 1994San Rafael 2004San Ramon 2011Sanger 2009Santa Barbara County 1981Santa Clara 1992Santa Cruz 1992Scotts Valley 1994Shafter 2005Shasta County 2004Shasta Lake 1999Sierra County 1996Sierra Madre 1996Simi Valley 1991Sonora 2007Sunnyvale 1993Temecula 2005Tracy 2011Tuolumne County 1996Ventura County 1988Visalia No DateWasco 2002Waterford 2006Whittier 1993Wildomar 2008Woodlake 2010Yuba County 2011Yucaipa 2004Yucca Valley 1995
AiRPORt
Alameda 1991Crescent City 2001Dunsmuir 2006Fullerton 1997Hanford 2010Hawthorne 2007Highland 2006Imperial 1992Loma Linda 2006Madera County 1995Mono County 1993Ontario 2010Palo Alto 1998Redwood City 2010San Joaquin County 1992San Mateo County 1986Santa Ana 2008Shafter 2005Sonoma County 2008Tulare County 1985Ukiah 1995
ARchAeOlOGicAl
Agoura Hills 2010Apple Valley 2009
Index of Optional Elements and Year Adopted
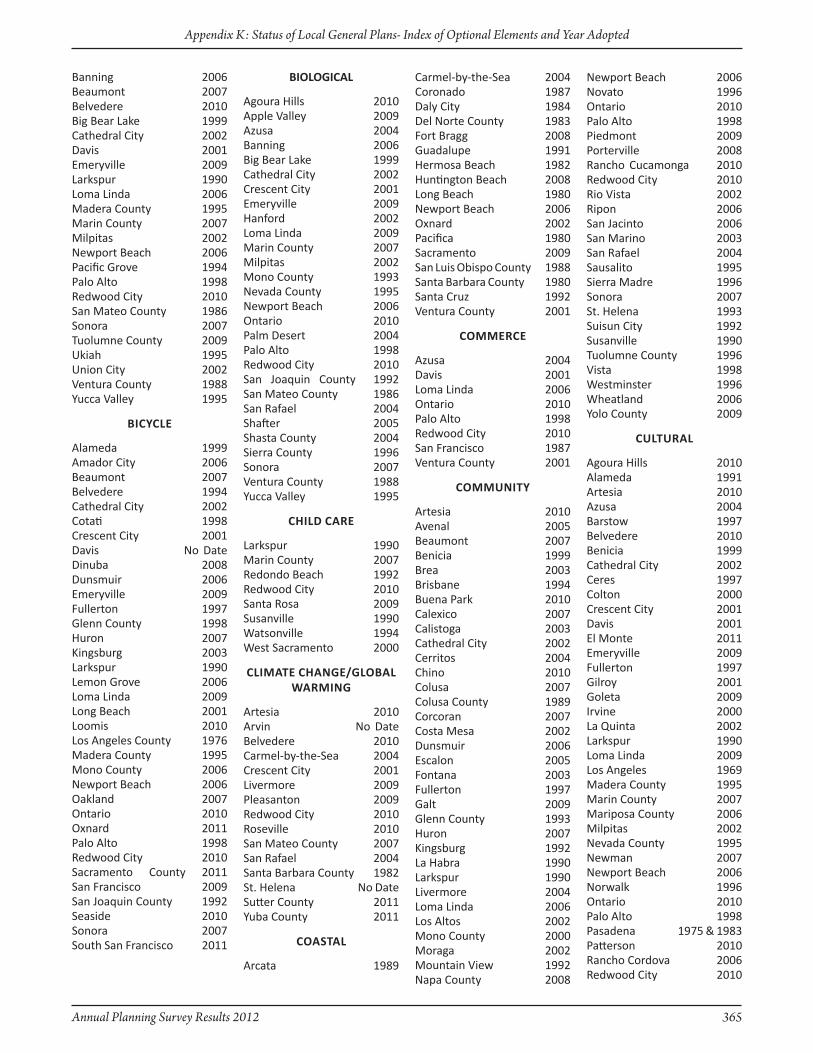
Annual Planning Survey Results 2012 365
Appendix K: Status of Local General Plans- Index of Optional Elements and Year Adopted
Banning 2006Beaumont 2007Belvedere 2010Big Bear Lake 1999Cathedral City 2002Davis 2001Emeryville 2009Larkspur 1990Loma Linda 2006Madera County 1995Marin County 2007Milpitas 2002Newport Beach 2006Pacific Grove 1994Palo Alto 1998Redwood City 2010San Mateo County 1986Sonora 2007Tuolumne County 2009Ukiah 1995Union City 2002Ventura County 1988Yucca Valley 1995
biCyCle
Alameda 1999Amador City 2006Beaumont 2007Belvedere 1994Cathedral City 2002Cotati 1998Crescent City 2001Davis No DateDinuba 2008Dunsmuir 2006Emeryville 2009Fullerton 1997Glenn County 1998Huron 2007Kingsburg 2003Larkspur 1990Lemon Grove 2006Loma Linda 2009Long Beach 2001Loomis 2010Los Angeles County 1976Madera County 1995Mono County 2006Newport Beach 2006Oakland 2007Ontario 2010Oxnard 2011Palo Alto 1998Redwood City 2010Sacramento County 2011San Francisco 2009San Joaquin County 1992Seaside 2010Sonora 2007South San Francisco 2011
biologiCal
Agoura Hills 2010Apple Valley 2009Azusa 2004Banning 2006Big Bear Lake 1999Cathedral City 2002Crescent City 2001Emeryville 2009Hanford 2002Loma Linda 2009Marin County 2007Milpitas 2002Mono County 1993Nevada County 1995Newport Beach 2006Ontario 2010Palm Desert 2004Palo Alto 1998Redwood City 2010San Joaquin County 1992San Mateo County 1986San Rafael 2004Shafter 2005Shasta County 2004Sierra County 1996Sonora 2007Ventura County 1988Yucca Valley 1995
child cARe
Larkspur 1990Marin County 2007Redondo Beach 1992Redwood City 2010Santa Rosa 2009Susanville 1990Watsonville 1994West Sacramento 2000
cliMAte chAnGe/GlOBAl WARMinG
Artesia 2010Arvin No DateBelvedere 2010Carmel-by-the-Sea 2004Crescent City 2001Livermore 2009Pleasanton 2009Redwood City 2010Roseville 2010San Mateo County 2007San Rafael 2004Santa Barbara County 1982St. Helena No Date Sutter County 2011Yuba County 2011
CoaSTal
Arcata 1989
Carmel-by-the-Sea 2004Coronado 1987Daly City 1984Del Norte County 1983Fort Bragg 2008Guadalupe 1991Hermosa Beach 1982Huntington Beach 2008Long Beach 1980Newport Beach 2006Oxnard 2002Pacifica 1980Sacramento 2009San Luis Obispo County 1988Santa Barbara County 1980Santa Cruz 1992Ventura County 2001
cOMMeRce
Azusa 2004Davis 2001Loma Linda 2006Ontario 2010Palo Alto 1998Redwood City 2010San Francisco 1987Ventura County 2001
cOMMunity
Artesia 2010Avenal 2005Beaumont 2007Benicia 1999Brea 2003Brisbane 1994Buena Park 2010Calexico 2007Calistoga 2003Cathedral City 2002Cerritos 2004Chino 2010Colusa 2007Colusa County 1989Corcoran 2007Costa Mesa 2002Dunsmuir 2006Escalon 2005Fontana 2003Fullerton 1997Galt 2009Glenn County 1993Huron 2007Kingsburg 1992La Habra 1990Larkspur 1990Livermore 2004Loma Linda 2006Los Altos 2002Mono County 2000Moraga 2002Mountain View 1992Napa County 2008
Newport Beach 2006Novato 1996Ontario 2010Palo Alto 1998Piedmont 2009Porterville 2008Rancho Cucamonga 2010Redwood City 2010Rio Vista 2002Ripon 2006San Jacinto 2006San Marino 2003San Rafael 2004Sausalito 1995Sierra Madre 1996Sonora 2007St. Helena 1993Suisun City 1992Susanville 1990Tuolumne County 1996Vista 1998Westminster 1996Wheatland 2006Yolo County 2009
cultuRAl
Agoura Hills 2010Alameda 1991Artesia 2010Azusa 2004Barstow 1997Belvedere 2010Benicia 1999Cathedral City 2002Ceres 1997Colton 2000Crescent City 2001Davis 2001El Monte 2011Emeryville 2009Fullerton 1997Gilroy 2001Goleta 2009Irvine 2000La Quinta 2002Larkspur 1990Loma Linda 2009Los Angeles 1969Madera County 1995Marin County 2007Mariposa County 2006Milpitas 2002Nevada County 1995Newman 2007Newport Beach 2006Norwalk 1996Ontario 2010Palo Alto 1998Pasadena 1975 & 1983Patterson 2010Rancho Cordova 2006Redwood City 2010
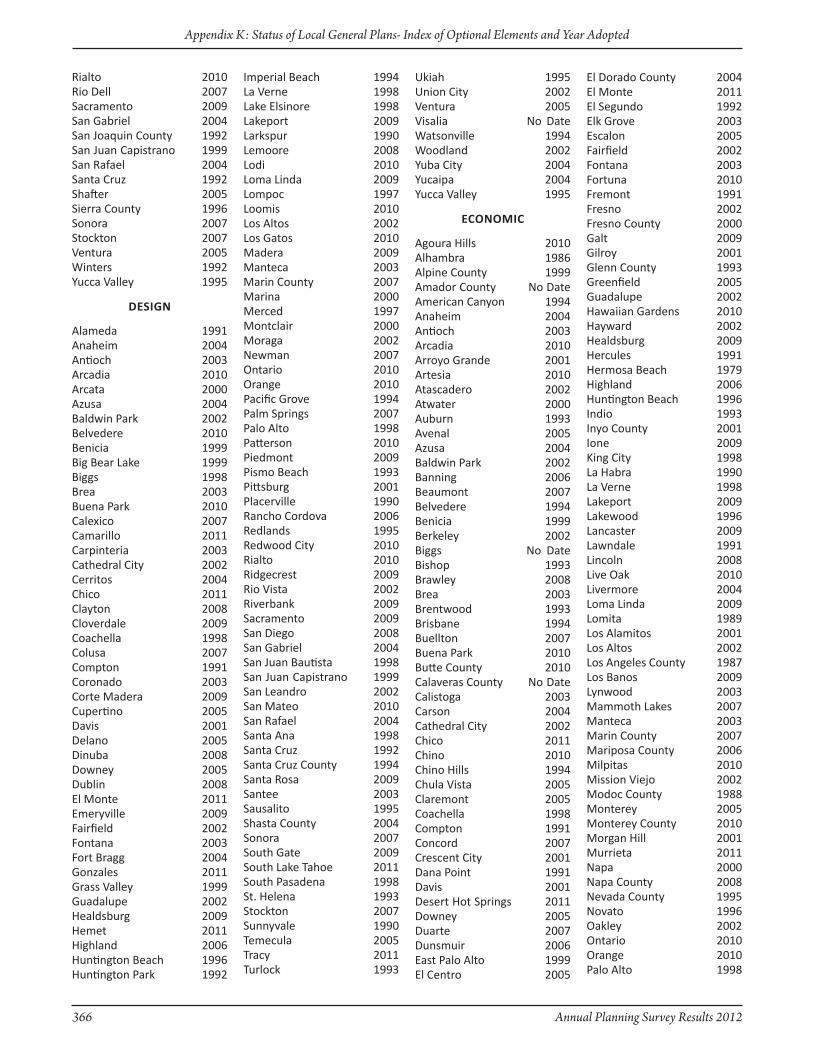
366 Annual Planning Survey Results 2012
Appendix K: Status of Local General Plans- Index of Optional Elements and Year Adopted
Rialto 2010Rio Dell 2007Sacramento 2009San Gabriel 2004San Joaquin County 1992San Juan Capistrano 1999San Rafael 2004Santa Cruz 1992Shafter 2005Sierra County 1996Sonora 2007Stockton 2007Ventura 2005Winters 1992Yucca Valley 1995
desiGn
Alameda 1991Anaheim 2004Antioch 2003Arcadia 2010Arcata 2000Azusa 2004Baldwin Park 2002Belvedere 2010Benicia 1999Big Bear Lake 1999Biggs 1998Brea 2003Buena Park 2010Calexico 2007Camarillo 2011Carpinteria 2003Cathedral City 2002Cerritos 2004Chico 2011Clayton 2008Cloverdale 2009Coachella 1998Colusa 2007Compton 1991Coronado 2003Corte Madera 2009Cupertino 2005Davis 2001Delano 2005Dinuba 2008Downey 2005Dublin 2008El Monte 2011Emeryville 2009Fairfield 2002Fontana 2003Fort Bragg 2004Gonzales 2011Grass Valley 1999Guadalupe 2002Healdsburg 2009Hemet 2011Highland 2006Huntington Beach 1996Huntington Park 1992
Imperial Beach 1994La Verne 1998Lake Elsinore 1998Lakeport 2009Larkspur 1990Lemoore 2008Lodi 2010Loma Linda 2009Lompoc 1997Loomis 2010Los Altos 2002Los Gatos 2010Madera 2009Manteca 2003Marin County 2007Marina 2000Merced 1997Montclair 2000Moraga 2002Newman 2007Ontario 2010Orange 2010Pacific Grove 1994Palm Springs 2007Palo Alto 1998Patterson 2010Piedmont 2009Pismo Beach 1993Pittsburg 2001Placerville 1990Rancho Cordova 2006Redlands 1995Redwood City 2010Rialto 2010Ridgecrest 2009Rio Vista 2002Riverbank 2009Sacramento 2009San Diego 2008San Gabriel 2004San Juan Bautista 1998San Juan Capistrano 1999San Leandro 2002San Mateo 2010San Rafael 2004Santa Ana 1998Santa Cruz 1992Santa Cruz County 1994Santa Rosa 2009Santee 2003Sausalito 1995Shasta County 2004Sonora 2007South Gate 2009South Lake Tahoe 2011South Pasadena 1998St. Helena 1993Stockton 2007Sunnyvale 1990Temecula 2005Tracy 2011Turlock 1993
Ukiah 1995Union City 2002Ventura 2005Visalia No DateWatsonville 1994Woodland 2002Yuba City 2004Yucaipa 2004Yucca Valley 1995
ecOnOMic
Agoura Hills 2010Alhambra 1986Alpine County 1999Amador County No DateAmerican Canyon 1994Anaheim 2004Antioch 2003Arcadia 2010Arroyo Grande 2001Artesia 2010Atascadero 2002Atwater 2000Auburn 1993Avenal 2005Azusa 2004Baldwin Park 2002Banning 2006Beaumont 2007Belvedere 1994Benicia 1999Berkeley 2002Biggs No DateBishop 1993Brawley 2008Brea 2003Brentwood 1993Brisbane 1994Buellton 2007Buena Park 2010Butte County 2010Calaveras County No DateCalistoga 2003Carson 2004Cathedral City 2002Chico 2011Chino 2010Chino Hills 1994Chula Vista 2005Claremont 2005Coachella 1998Compton 1991Concord 2007Crescent City 2001Dana Point 1991Davis 2001Desert Hot Springs 2011Downey 2005Duarte 2007Dunsmuir 2006East Palo Alto 1999El Centro 2005
El Dorado County 2004El Monte 2011El Segundo 1992Elk Grove 2003Escalon 2005Fairfield 2002Fontana 2003Fortuna 2010Fremont 1991Fresno 2002Fresno County 2000Galt 2009Gilroy 2001Glenn County 1993Greenfield 2005Guadalupe 2002Hawaiian Gardens 2010Hayward 2002Healdsburg 2009Hercules 1991Hermosa Beach 1979Highland 2006Huntington Beach 1996Indio 1993Inyo County 2001Ione 2009King City 1998La Habra 1990La Verne 1998Lakeport 2009Lakewood 1996Lancaster 2009Lawndale 1991Lincoln 2008Live Oak 2010Livermore 2004Loma Linda 2009Lomita 1989Los Alamitos 2001Los Altos 2002Los Angeles County 1987Los Banos 2009Lynwood 2003Mammoth Lakes 2007Manteca 2003Marin County 2007Mariposa County 2006Milpitas 2010Mission Viejo 2002Modoc County 1988Monterey 2005Monterey County 2010Morgan Hill 2001Murrieta 2011Napa 2000Napa County 2008Nevada County 1995Novato 1996Oakley 2002Ontario 2010Orange 2010Palo Alto 1998

Annual Planning Survey Results 2012 367
Appendix K: Status of Local General Plans- Index of Optional Elements and Year Adopted
Paramount 2007Pasadena 1984Patterson 2010Pittsburg 2001Pleasant Hill 2003Pleasanton 2009Pomona 1976Port Hueneme 1998Porterville 2008Portola 2001Rancho Cordova 2006Rancho Cucamonga 2010Rancho Mirage 2005Rancho Santa Margarita 2002Redding 2000Redlands 1995Redwood City 2010Rialto 2010Richmond 1994Rio Vista 2002Ripon 2006Riverbank 2009Sacramento 2009Sacramento County No Date San Bernardino No DateSan Bernardino County 2007San Bruno 2009San Diego 2008San Gabriel 2004San Luis Obispo County 1999San Marino 2003San Pablo 2011San Rafael 2004San Ramon 2011Sanger 2003Santa Ana 1998Santa Clara County 1994Santa Clarita 2011Santa Cruz 1992Santa Maria 2006Santa Rosa 2009Sausalito 1995Seaside 2004Sebastopol 1994Shasta County 2004Sierra County 1996Sierra Madre 1996Simi Valley 1988Solana Beach 1988Solano County 2008Soledad 2005Sonoma 2006Sonora 2007South Gate 2009South Lake Tahoe 2011South Pasadena 1998South San Francisco 1999St. Helena 1993Stockton 2007Sunnyvale 1997Susanville 1991Taft 2010
Tehama County 2009Temecula 2005Tracy 2011Truckee 2006Tuolumne County 2011Ukiah 1995Vallejo 2003Ventura 2005West Hollywood 2011Westminster 1996Wheatland 2006Willits 1992Woodland 2002Yolo County 2009Yuba City 2004Yuba County 2011Yucaipa 2004Yucca Valley 1995
educAtiOn
Agoura Hills 2010Banning 2006Beaumont 2007Cathedral City 2002Davis 2001Emeryville 2009Gilroy 2001Larkspur 1990Marin County 2007National City 2011Nevada County 1995Ontario 2010Orinda 1987Palo Alto 1998Paradise 1994Redwood City 2010Riverside 2007Sacramento 2009San Marino 2003Santa Ana 1988South San Francisco 1999Stockton 2007Union City 2002Upland No DateVallejo 1990Ventura 2005Ventura County 1988Wheatland 2006
eMeRGency
Apple Valley 2009Banning 2006Beaumont 2007Cathedral City 2002Coronado 1991Crescent City 2001Dunsmuir 2006Hanford 2002Huron 2007Lemon Grove 2010Loma Linda 2009
Madera County 1995Milpitas 2010Ontario 2010Palo Alto 1998Redwood City 2010Rialto 2010San Joaquin County 1992San Marino 2003Santa Cruz 1992Shafter 2005Sonora 2007Ventura County 2011Yucca Valley 1995
eneRGy
Agoura Hills 2010Alameda 1979Alturas 1993Apple Valley 2009Banning 2006Beaumont 2007Belvedere 2004Cathedral City 2002Davis 2001Dixon 2010Emeryville 2009Glenn County 1993Irvine 2000Kern County 2004Lawndale 1991Loma Linda 2009Madera County 1995Marin County 2007Modoc County 1993Mono County 1993Ontario 2010Palo Alto 1998Pasadena 1983Pleasanton 2009Redwood City 2010Riverside County 2012Sacramento County 1993Santa Ana 1982Santa Barbara County 1994Santa Cruz 1992Shafter 2005Shasta County 2004Sierra County 1996Siskiyou County 1993Sonora 2007Taft 2010Ukiah 1995Ventura County 2004Wheatland 2006Yucca Valley 1995
enviROnMent
Azusa 2004Beaumont 2007Belvedere 1994Berkeley 2002
Carmel-by-the-Sea 2009Cathedral City 2002Chula Vista 2005Cupertino 2005Davis 2001Emeryville 2009Fairfield 2002Fort Bragg 2008La Habra 1990Loma Linda 2006Los Gatos 2010Marin County 2007Mariposa County 2006Mountain View 1992Newport Beach 2006Ontario 2010Orinda 1987Palo Alto 1998Redwood City 2010Sacramento 2009San Carlos 2009San Francisco 1973San Mateo County 1986San Rafael 2004Santa Barbara County 1980Santa Clara 1992Santa Cruz 1992Sausalito 1995Shafter 2005Sutter Creek 1994Tulare County 1972Watsonville 1994Wheatland 2006
fiRe
Agoura Hills 2010Banning 2006Beaumont 2007Cathedral City 2002Clearlake 1980Crescent City 2001Davis 2001Dunsmuir 2006Fairfield 2002Huron 2007Loma Linda 2009Madera County 1995Mariposa County 2006Ontario 2010Palo Alto 1998Redwood City 2010Rialto 2010San Joaquin County 1992San Mateo County 1986Shafter 2005Shasta County 2004Sierra Madre 1996Sonora 2007Ventura County 2011Yucca Valley 1995
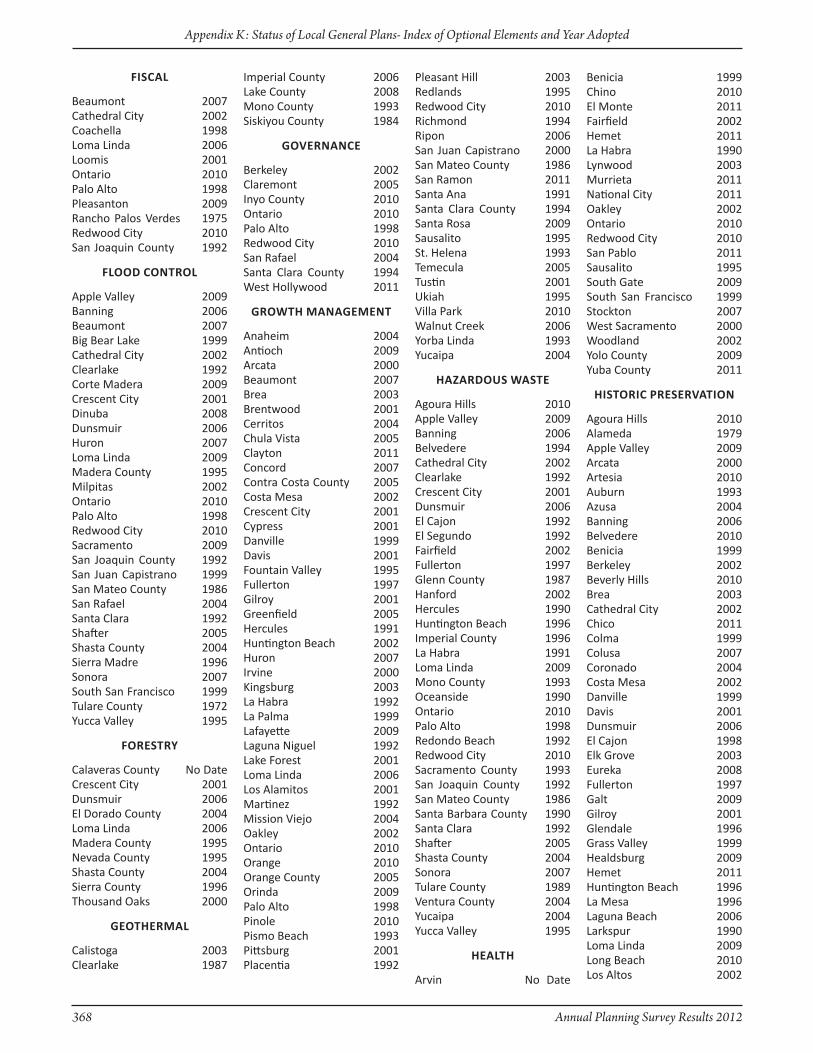
368 Annual Planning Survey Results 2012
Appendix K: Status of Local General Plans- Index of Optional Elements and Year Adopted
fiSCal
Beaumont 2007Cathedral City 2002Coachella 1998Loma Linda 2006Loomis 2001Ontario 2010Palo Alto 1998Pleasanton 2009Rancho Palos Verdes 1975Redwood City 2010San Joaquin County 1992
flOOd cOntROl
Apple Valley 2009Banning 2006Beaumont 2007Big Bear Lake 1999Cathedral City 2002Clearlake 1992Corte Madera 2009Crescent City 2001Dinuba 2008Dunsmuir 2006Huron 2007Loma Linda 2009Madera County 1995Milpitas 2002Ontario 2010Palo Alto 1998Redwood City 2010Sacramento 2009San Joaquin County 1992San Juan Capistrano 1999San Mateo County 1986San Rafael 2004Santa Clara 1992Shafter 2005Shasta County 2004Sierra Madre 1996Sonora 2007South San Francisco 1999Tulare County 1972Yucca Valley 1995
fORestRy
Calaveras County No DateCrescent City 2001Dunsmuir 2006El Dorado County 2004Loma Linda 2006Madera County 1995Nevada County 1995Shasta County 2004Sierra County 1996Thousand Oaks 2000
GeOtheRMAl
Calistoga 2003Clearlake 1987
Imperial County 2006Lake County 2008Mono County 1993Siskiyou County 1984
GOveRnAnce
Berkeley 2002Claremont 2005Inyo County 2010Ontario 2010Palo Alto 1998Redwood City 2010San Rafael 2004Santa Clara County 1994West Hollywood 2011
GROWth MAnAGeMent
Anaheim 2004Antioch 2009Arcata 2000Beaumont 2007Brea 2003Brentwood 2001Cerritos 2004Chula Vista 2005Clayton 2011Concord 2007Contra Costa County 2005Costa Mesa 2002Crescent City 2001Cypress 2001Danville 1999Davis 2001Fountain Valley 1995Fullerton 1997Gilroy 2001Greenfield 2005Hercules 1991Huntington Beach 2002Huron 2007Irvine 2000Kingsburg 2003La Habra 1992La Palma 1999Lafayette 2009Laguna Niguel 1992Lake Forest 2001Loma Linda 2006Los Alamitos 2001Martinez 1992Mission Viejo 2004Oakley 2002Ontario 2010Orange 2010Orange County 2005Orinda 2009Palo Alto 1998Pinole 2010Pismo Beach 1993Pittsburg 2001Placentia 1992
Pleasant Hill 2003Redlands 1995Redwood City 2010Richmond 1994Ripon 2006San Juan Capistrano 2000San Mateo County 1986San Ramon 2011Santa Ana 1991Santa Clara County 1994Santa Rosa 2009Sausalito 1995St. Helena 1993Temecula 2005Tustin 2001Ukiah 1995Villa Park 2010Walnut Creek 2006Yorba Linda 1993Yucaipa 2004
hAZARdOus WAste
Agoura Hills 2010Apple Valley 2009Banning 2006Belvedere 1994Cathedral City 2002Clearlake 1992Crescent City 2001Dunsmuir 2006El Cajon 1992El Segundo 1992Fairfield 2002Fullerton 1997Glenn County 1987Hanford 2002Hercules 1990Huntington Beach 1996Imperial County 1996La Habra 1991Loma Linda 2009Mono County 1993Oceanside 1990Ontario 2010Palo Alto 1998Redondo Beach 1992Redwood City 2010Sacramento County 1993San Joaquin County 1992San Mateo County 1986Santa Barbara County 1990Santa Clara 1992Shafter 2005Shasta County 2004Sonora 2007Tulare County 1989Ventura County 2004Yucaipa 2004Yucca Valley 1995
HealTH
Arvin No Date
Benicia 1999Chino 2010El Monte 2011Fairfield 2002Hemet 2011La Habra 1990Lynwood 2003Murrieta 2011National City 2011Oakley 2002Ontario 2010Redwood City 2010San Pablo 2011Sausalito 1995South Gate 2009South San Francisco 1999Stockton 2007West Sacramento 2000Woodland 2002Yolo County 2009Yuba County 2011
histORic PReseRvAtiOn
Agoura Hills 2010Alameda 1979Apple Valley 2009Arcata 2000Artesia 2010Auburn 1993Azusa 2004Banning 2006Belvedere 2010Benicia 1999Berkeley 2002Beverly Hills 2010Brea 2003Cathedral City 2002Chico 2011Colma 1999Colusa 2007Coronado 2004Costa Mesa 2002Danville 1999Davis 2001Dunsmuir 2006El Cajon 1998Elk Grove 2003Eureka 2008Fullerton 1997Galt 2009Gilroy 2001Glendale 1996Grass Valley 1999Healdsburg 2009Hemet 2011Huntington Beach 1996La Mesa 1996Laguna Beach 2006Larkspur 1990Loma Linda 2009Long Beach 2010Los Altos 2002
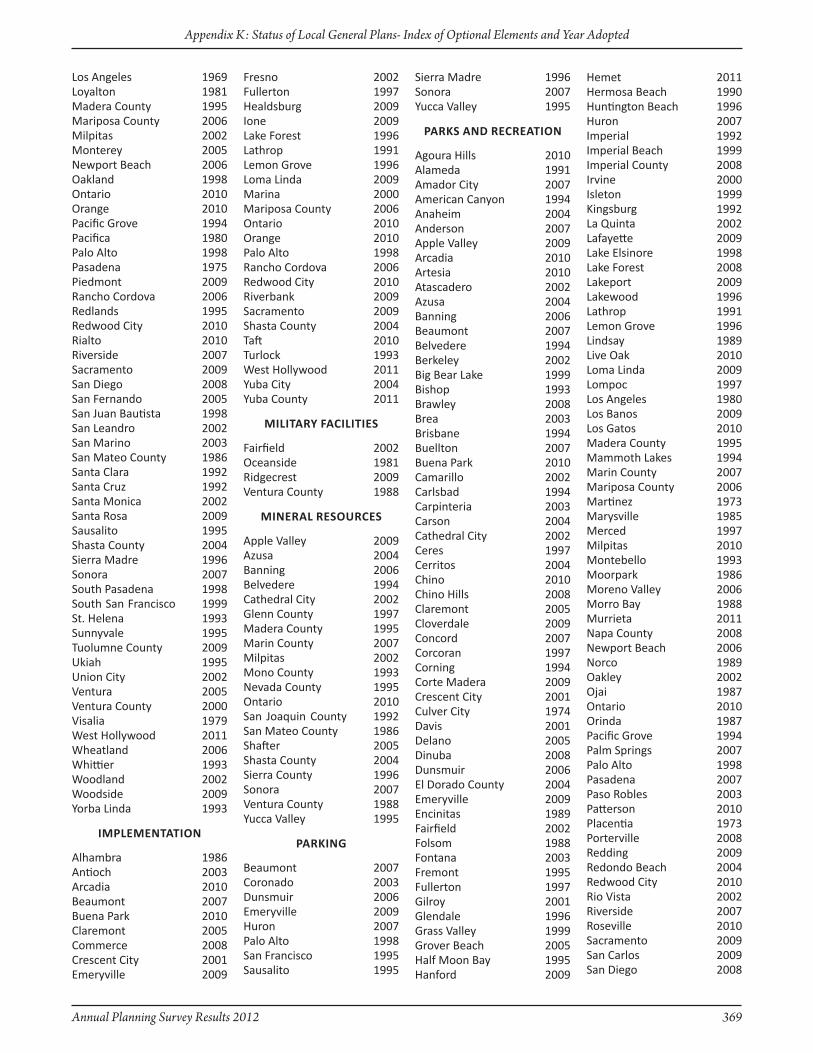
Annual Planning Survey Results 2012 369
Appendix K: Status of Local General Plans- Index of Optional Elements and Year Adopted
Los Angeles 1969Loyalton 1981Madera County 1995Mariposa County 2006Milpitas 2002Monterey 2005Newport Beach 2006Oakland 1998Ontario 2010Orange 2010Pacific Grove 1994Pacifica 1980Palo Alto 1998Pasadena 1975Piedmont 2009Rancho Cordova 2006Redlands 1995Redwood City 2010Rialto 2010Riverside 2007Sacramento 2009San Diego 2008San Fernando 2005San Juan Bautista 1998San Leandro 2002San Marino 2003San Mateo County 1986Santa Clara 1992Santa Cruz 1992Santa Monica 2002Santa Rosa 2009Sausalito 1995Shasta County 2004Sierra Madre 1996Sonora 2007South Pasadena 1998South San Francisco 1999St. Helena 1993Sunnyvale 1995Tuolumne County 2009Ukiah 1995Union City 2002Ventura 2005Ventura County 2000Visalia 1979West Hollywood 2011Wheatland 2006Whittier 1993Woodland 2002Woodside 2009Yorba Linda 1993
iMPleMentAtiOn
Alhambra 1986Antioch 2003Arcadia 2010Beaumont 2007Buena Park 2010Claremont 2005Commerce 2008Crescent City 2001Emeryville 2009
Fresno 2002Fullerton 1997Healdsburg 2009Ione 2009Lake Forest 1996Lathrop 1991Lemon Grove 1996Loma Linda 2009Marina 2000Mariposa County 2006Ontario 2010Orange 2010Palo Alto 1998Rancho Cordova 2006Redwood City 2010Riverbank 2009Sacramento 2009Shasta County 2004Taft 2010Turlock 1993West Hollywood 2011Yuba City 2004Yuba County 2011
MilitARy fAcilities
Fairfield 2002Oceanside 1981Ridgecrest 2009Ventura County 1988
MineRAl ResOuRces
Apple Valley 2009Azusa 2004Banning 2006Belvedere 1994Cathedral City 2002Glenn County 1997Madera County 1995Marin County 2007Milpitas 2002Mono County 1993Nevada County 1995Ontario 2010San Joaquin County 1992San Mateo County 1986Shafter 2005Shasta County 2004Sierra County 1996Sonora 2007Ventura County 1988Yucca Valley 1995
PARkinG
Beaumont 2007Coronado 2003Dunsmuir 2006Emeryville 2009Huron 2007Palo Alto 1998San Francisco 1995Sausalito 1995
Sierra Madre 1996Sonora 2007Yucca Valley 1995
PARks And RecReAtiOn
Agoura Hills 2010Alameda 1991Amador City 2007American Canyon 1994Anaheim 2004Anderson 2007Apple Valley 2009Arcadia 2010Artesia 2010Atascadero 2002Azusa 2004Banning 2006Beaumont 2007Belvedere 1994Berkeley 2002Big Bear Lake 1999Bishop 1993Brawley 2008Brea 2003Brisbane 1994Buellton 2007Buena Park 2010Camarillo 2002Carlsbad 1994Carpinteria 2003Carson 2004Cathedral City 2002Ceres 1997Cerritos 2004Chino 2010Chino Hills 2008Claremont 2005Cloverdale 2009Concord 2007Corcoran 1997Corning 1994Corte Madera 2009Crescent City 2001Culver City 1974Davis 2001Delano 2005Dinuba 2008Dunsmuir 2006El Dorado County 2004Emeryville 2009Encinitas 1989Fairfield 2002Folsom 1988Fontana 2003Fremont 1995Fullerton 1997Gilroy 2001Glendale 1996Grass Valley 1999Grover Beach 2005Half Moon Bay 1995Hanford 2009
Hemet 2011Hermosa Beach 1990Huntington Beach 1996Huron 2007Imperial 1992Imperial Beach 1999Imperial County 2008Irvine 2000Isleton 1999Kingsburg 1992La Quinta 2002Lafayette 2009Lake Elsinore 1998Lake Forest 2008Lakeport 2009Lakewood 1996Lathrop 1991Lemon Grove 1996Lindsay 1989Live Oak 2010Loma Linda 2009Lompoc 1997Los Angeles 1980Los Banos 2009Los Gatos 2010Madera County 1995Mammoth Lakes 1994Marin County 2007Mariposa County 2006Martinez 1973Marysville 1985Merced 1997Milpitas 2010Montebello 1993Moorpark 1986Moreno Valley 2006Morro Bay 1988Murrieta 2011Napa County 2008Newport Beach 2006Norco 1989Oakley 2002Ojai 1987Ontario 2010Orinda 1987Pacific Grove 1994Palm Springs 2007Palo Alto 1998Pasadena 2007Paso Robles 2003Patterson 2010Placentia 1973Porterville 2008Redding 2009Redondo Beach 2004Redwood City 2010Rio Vista 2002Riverside 2007Roseville 2010Sacramento 2009San Carlos 2009San Diego 2008

370 Annual Planning Survey Results 2012
Appendix K: Status of Local General Plans- Index of Optional Elements and Year Adopted
San Francisco 1988San Joaquin County 1992San Juan Capistrano 1999San Leandro 2002San Luis Obispo 2001San Luis Obispo County 2006San Marino 2003San Mateo 2010San Mateo County 1986San Rafael 2004San Ramon 2011Santa Ana 1982Santa Barbara 1982Santa Clara County 1994Santa Cruz County 1994Santa Rosa 2009Scotts Valley 1994Selma 1989Shafter 2005Shasta County 2004Sierra County 1996Sierra Madre 1996Simi Valley 1988Soledad 2005Solvang 2009Sonora 2007South Lake Tahoe 2011South Pasadena 1998South San Francisco 1999St. Helena 1993Stockton 2007Susanville 1990Sutter Creek 1994Thousand Oaks 1971Tiburon 2005Torrance 2010Tulare County 1972Tuolumne County 1996Twentynine Palms 2002Ukiah 1995Vallejo 1994Ventura 2005Ventura County 1988Visalia 1989Watsonville 1994West Hollywood 2011Wheatland 2006Willits 1992Winters 1992Woodland 2002Yorba Linda 1993Yreka 2003Yuba County 2011Yucca Valley 1995
PuBlic fAcilities
Agoura Hills 2010Anaheim 2004Antioch 2003Apple Valley 2009Arcadia 2010Arcata 2000
Atwater 2000Avenal 2005Bakersfield 2002Banning 2006Beaumont 2007Bishop 1993Buellton 2007Buena Park 2010Butte County 2010Carmel-by-the-Sea 2010Carpinteria 2003Cathedral City 2002Chico 2011Chino 2010Chula Vista 2005Clayton 2001Clovis 1993Coachella 1998Colusa 2007Concord 2007Contra Costa County 2005Corcoran 2007Corning 1994Coronado 2007Crescent City 2001Davis 2001Dinuba 2008Elk Grove 2003Emeryville 2009Escalon 2005Etna 2005Fairfield 2002Fontana 2003Fremont 1991Fresno 2002Fresno County 2000Galt 2009Gonzales 2011Gridley 2010Guadalupe 2002Gustine 2002Hanford 2002Hayward 2002Huntington Beach 1996Huntington Park 1992Huron 2007Imperial 1992Ione 2009Irvine 2000La Mesa 1996Laguna Niguel 1992Lake Forest 2001Lancaster 2009Larkspur 1990Live Oak 2010Loma Linda 2009Loomis 2001Los Altos 2002Los Angeles 1968Lynwood 2003Madera County 1995Manteca 2003
Marin County 2007Martinez 1990Merced 1997Mission Viejo 2003Monterey 2005Newman 2007Norwalk 1996Novato 1996Oceanside 1990Orange County 2005Orland 2002Pacific Grove 1994Palo Alto 1998Paramount 2007Pasadena 1975Patterson 2010Placerville 1990Pleasanton 2009Porterville 2008Portola 2001Rancho Cucamonga 2010Rancho Mirage 2005Redding 2000Redwood City 2010Richmond 1994Rio Vista 2002Riverside 2007Sacramento 2009Sacramento County 1993San Bruno 2009San Diego 2008San Gabriel 2004San Joaquin County 1992San Leandro 2002San Rafael 2004San Ramon 2011Santa Ana 1982Santa Clara 1992Santa Cruz 1992Santa Cruz County 1994Santa Rosa 2009Scotts Valley 1994Shasta County 2004Sierra County 1996Soledad 2005Sonoma County 2008Sonora 2007South Gate 2009South Lake Tahoe 2011South San Francisco 1999St. Helena 1993Stockton 2007Suisun City 1992Sutter Creek 1994Taft 2010Temecula 2005Tracy 2011Tuolumne County 1996Turlock 1993Ukiah 1995Union City 2002Ventura County 1988
Visalia No DateWaterford 2006Watsonville 1994Wheatland 2006Williams 2012Woodland 2002Yolo County 2009Yreka 2003Yuba County 2011Yucaipa 2004Yucca Valley 1995
PuBlic seRvices
Agoura Hills 2010Anaheim 2004Antioch 2003Artesia 2010Avenal 2005Azusa 2004Beverly Hills 2010Big Bear Lake 1999Buellton 2007Calistoga 2003Carmel-by-the-Sea 2009Carpinteria 2003Cathedral City 2002Chino 2010Contra Costa County 2005Corcoran 2007Crescent City 2001Davis 2001Delano 2005Dinuba 2008El Dorado County 2004Emeryville 2009Escalon 2005Fairfield 2002Fontana 2003Galt 2009Goleta 2009Grand Terrace 2010Hanford 2002Hawaiian Gardens 2010Healdsburg 2009Huron 2007Imperial County 1996La Mesa 1996La Quinta 2002Laguna Niguel 1992Larkspur 1990Live Oak 2010Livermore 2004Loma Linda 2009Lompoc 1997Loomis 2001Madera County 1995Manteca 2003Mariposa County 2006Merced 1997Milpitas 2010Monterey County 2010Nevada County 1995
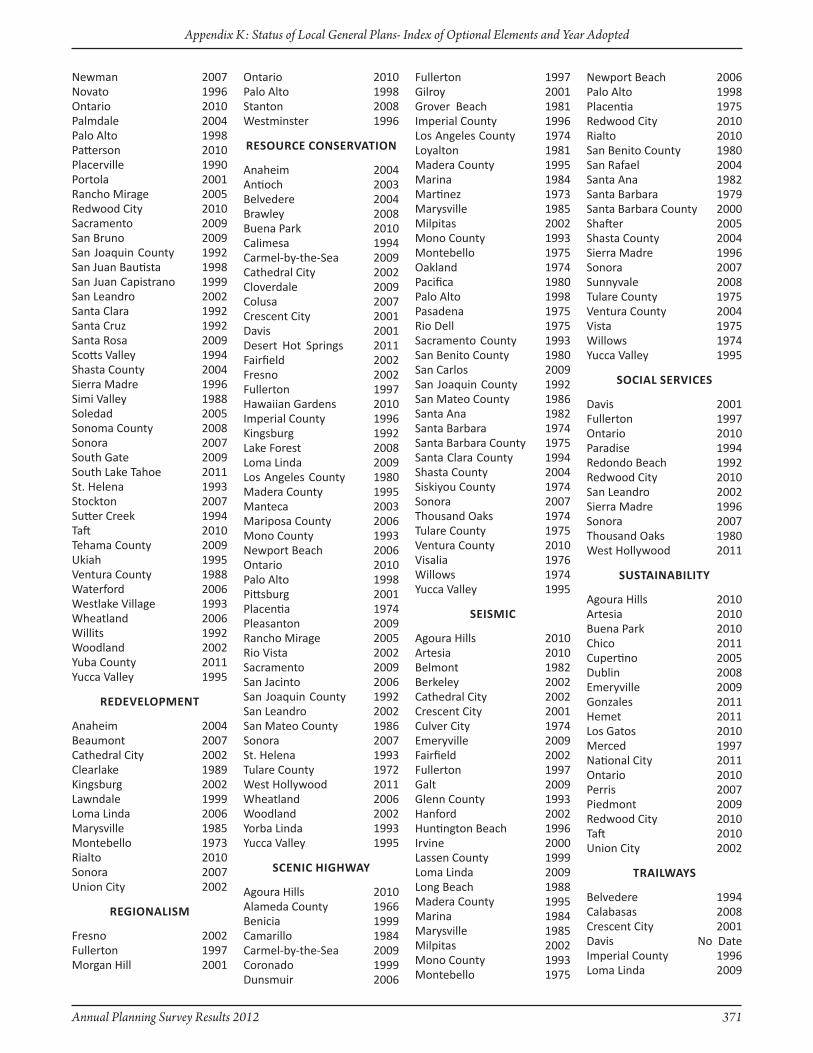
Annual Planning Survey Results 2012 371
Appendix K: Status of Local General Plans- Index of Optional Elements and Year Adopted
Newman 2007Novato 1996Ontario 2010Palmdale 2004Palo Alto 1998Patterson 2010Placerville 1990Portola 2001Rancho Mirage 2005Redwood City 2010Sacramento 2009San Bruno 2009San Joaquin County 1992San Juan Bautista 1998San Juan Capistrano 1999San Leandro 2002Santa Clara 1992Santa Cruz 1992Santa Rosa 2009Scotts Valley 1994Shasta County 2004Sierra Madre 1996Simi Valley 1988Soledad 2005Sonoma County 2008Sonora 2007South Gate 2009South Lake Tahoe 2011St. Helena 1993Stockton 2007Sutter Creek 1994Taft 2010Tehama County 2009Ukiah 1995Ventura County 1988Waterford 2006Westlake Village 1993Wheatland 2006Willits 1992Woodland 2002Yuba County 2011Yucca Valley 1995
RedevelOPMent
Anaheim 2004Beaumont 2007Cathedral City 2002Clearlake 1989Kingsburg 2002Lawndale 1999Loma Linda 2006Marysville 1985Montebello 1973Rialto 2010Sonora 2007Union City 2002
ReGiOnAlisM
Fresno 2002Fullerton 1997Morgan Hill 2001
Ontario 2010Palo Alto 1998Stanton 2008Westminster 1996
ResOuRce cOnseRvAtiOn
Anaheim 2004Antioch 2003Belvedere 2004Brawley 2008Buena Park 2010Calimesa 1994Carmel-by-the-Sea 2009Cathedral City 2002Cloverdale 2009Colusa 2007Crescent City 2001Davis 2001Desert Hot Springs 2011Fairfield 2002Fresno 2002Fullerton 1997Hawaiian Gardens 2010Imperial County 1996Kingsburg 1992Lake Forest 2008Loma Linda 2009Los Angeles County 1980Madera County 1995Manteca 2003Mariposa County 2006Mono County 1993Newport Beach 2006Ontario 2010Palo Alto 1998Pittsburg 2001Placentia 1974Pleasanton 2009Rancho Mirage 2005Rio Vista 2002Sacramento 2009San Jacinto 2006San Joaquin County 1992San Leandro 2002San Mateo County 1986Sonora 2007St. Helena 1993Tulare County 1972West Hollywood 2011Wheatland 2006Woodland 2002Yorba Linda 1993Yucca Valley 1995
SCeniC HigHway
Agoura Hills 2010Alameda County 1966Benicia 1999Camarillo 1984Carmel-by-the-Sea 2009Coronado 1999Dunsmuir 2006
Fullerton 1997Gilroy 2001Grover Beach 1981Imperial County 1996Los Angeles County 1974Loyalton 1981Madera County 1995Marina 1984Martinez 1973Marysville 1985Milpitas 2002Mono County 1993Montebello 1975Oakland 1974Pacifica 1980Palo Alto 1998Pasadena 1975Rio Dell 1975Sacramento County 1993San Benito County 1980San Carlos 2009San Joaquin County 1992San Mateo County 1986Santa Ana 1982Santa Barbara 1974Santa Barbara County 1975Santa Clara County 1994Shasta County 2004Siskiyou County 1974Sonora 2007Thousand Oaks 1974Tulare County 1975Ventura County 2010Visalia 1976Willows 1974Yucca Valley 1995
seisMic
Agoura Hills 2010Artesia 2010Belmont 1982Berkeley 2002Cathedral City 2002Crescent City 2001Culver City 1974Emeryville 2009Fairfield 2002Fullerton 1997Galt 2009Glenn County 1993Hanford 2002Huntington Beach 1996Irvine 2000Lassen County 1999Loma Linda 2009Long Beach 1988Madera County 1995Marina 1984Marysville 1985Milpitas 2002Mono County 1993Montebello 1975
Newport Beach 2006Palo Alto 1998Placentia 1975Redwood City 2010Rialto 2010San Benito County 1980San Rafael 2004Santa Ana 1982Santa Barbara 1979Santa Barbara County 2000Shafter 2005Shasta County 2004Sierra Madre 1996Sonora 2007Sunnyvale 2008Tulare County 1975Ventura County 2004Vista 1975Willows 1974Yucca Valley 1995
sOciAl seRvices
Davis 2001Fullerton 1997Ontario 2010Paradise 1994Redondo Beach 1992Redwood City 2010San Leandro 2002Sierra Madre 1996Sonora 2007Thousand Oaks 1980West Hollywood 2011
SuSTainabiliTy
Agoura Hills 2010Artesia 2010Buena Park 2010Chico 2011Cupertino 2005Dublin 2008Emeryville 2009Gonzales 2011Hemet 2011Los Gatos 2010Merced 1997National City 2011Ontario 2010Perris 2007Piedmont 2009Redwood City 2010Taft 2010Union City 2002
tRAilWAys
Belvedere 1994Calabasas 2008Crescent City 2001Davis No DateImperial County 1996Loma Linda 2009
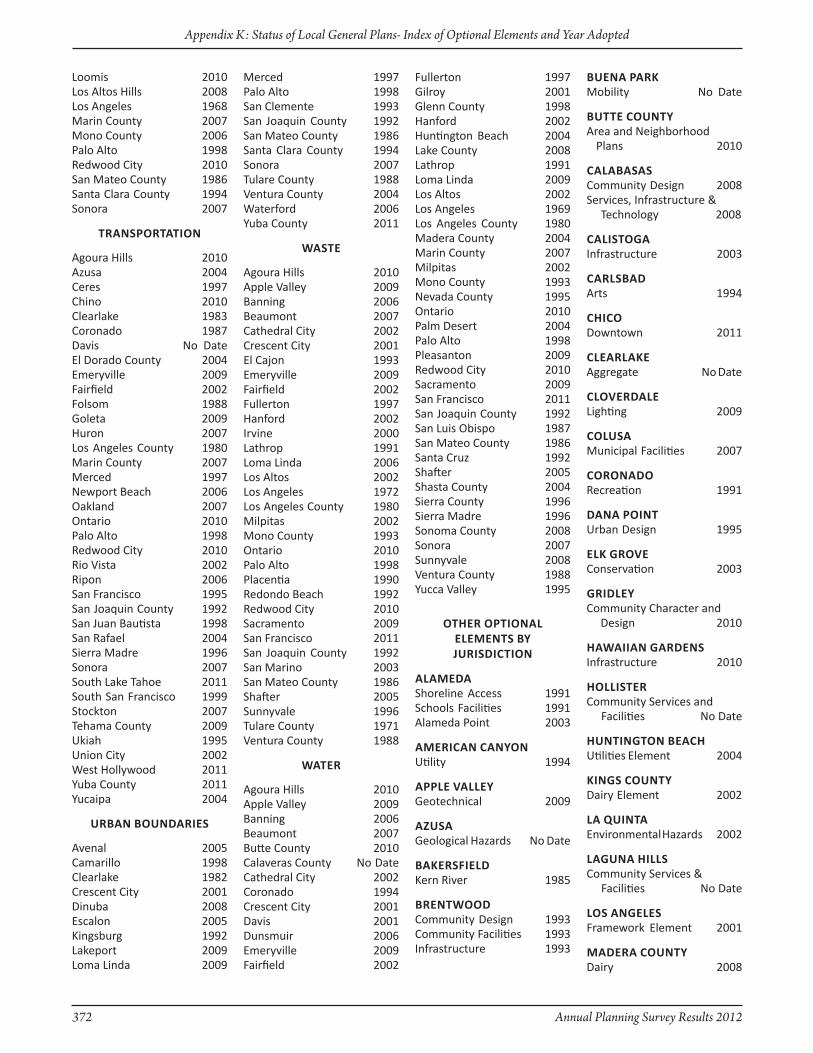
372 Annual Planning Survey Results 2012
Appendix K: Status of Local General Plans- Index of Optional Elements and Year Adopted
Loomis 2010Los Altos Hills 2008Los Angeles 1968Marin County 2007Mono County 2006Palo Alto 1998Redwood City 2010San Mateo County 1986Santa Clara County 1994Sonora 2007
tRAnsPORtAtiOn
Agoura Hills 2010Azusa 2004Ceres 1997Chino 2010Clearlake 1983Coronado 1987Davis No DateEl Dorado County 2004Emeryville 2009Fairfield 2002Folsom 1988Goleta 2009Huron 2007Los Angeles County 1980Marin County 2007Merced 1997Newport Beach 2006Oakland 2007Ontario 2010Palo Alto 1998Redwood City 2010Rio Vista 2002Ripon 2006San Francisco 1995San Joaquin County 1992San Juan Bautista 1998San Rafael 2004Sierra Madre 1996Sonora 2007South Lake Tahoe 2011South San Francisco 1999Stockton 2007Tehama County 2009Ukiah 1995Union City 2002West Hollywood 2011Yuba County 2011Yucaipa 2004
uRBAn BOundARies
Avenal 2005Camarillo 1998Clearlake 1982Crescent City 2001Dinuba 2008Escalon 2005Kingsburg 1992Lakeport 2009Loma Linda 2009
Merced 1997Palo Alto 1998San Clemente 1993San Joaquin County 1992San Mateo County 1986Santa Clara County 1994Sonora 2007Tulare County 1988Ventura County 2004Waterford 2006Yuba County 2011
waSTe
Agoura Hills 2010Apple Valley 2009Banning 2006Beaumont 2007Cathedral City 2002Crescent City 2001El Cajon 1993Emeryville 2009Fairfield 2002Fullerton 1997Hanford 2002Irvine 2000Lathrop 1991Loma Linda 2006Los Altos 2002Los Angeles 1972Los Angeles County 1980Milpitas 2002Mono County 1993Ontario 2010Palo Alto 1998Placentia 1990Redondo Beach 1992Redwood City 2010Sacramento 2009San Francisco 2011San Joaquin County 1992San Marino 2003San Mateo County 1986Shafter 2005Sunnyvale 1996Tulare County 1971Ventura County 1988
WAteR
Agoura Hills 2010Apple Valley 2009Banning 2006Beaumont 2007Butte County 2010Calaveras County No DateCathedral City 2002Coronado 1994Crescent City 2001Davis 2001Dunsmuir 2006Emeryville 2009Fairfield 2002
Fullerton 1997Gilroy 2001Glenn County 1998Hanford 2002Huntington Beach 2004Lake County 2008Lathrop 1991Loma Linda 2009Los Altos 2002Los Angeles 1969Los Angeles County 1980Madera County 2004Marin County 2007Milpitas 2002Mono County 1993Nevada County 1995Ontario 2010Palm Desert 2004Palo Alto 1998Pleasanton 2009Redwood City 2010Sacramento 2009San Francisco 2011San Joaquin County 1992San Luis Obispo 1987San Mateo County 1986Santa Cruz 1992Shafter 2005Shasta County 2004Sierra County 1996Sierra Madre 1996Sonoma County 2008Sonora 2007Sunnyvale 2008Ventura County 1988Yucca Valley 1995
OtheR OPtiOnAl eleMents By JuRisdictiOn
AlAMedA Shoreline Access 1991Schools Facilities 1991Alameda Point 2003
AMeRicAn cAnyOnUtility 1994
APPle vAlleyGeotechnical 2009
aZuSaGeological Hazards No Date
BAkeRsfieldKern River 1985
BRentWOOdCommunity Design 1993Community Facilities 1993Infrastructure 1993
BuenA PARkMobility No Date
buTTe CounTyArea and Neighborhood Plans 2010
CalabaSaSCommunity Design 2008Services, Infrastructure & Technology 2008
CaliSToga Infrastructure 2003
cARlsBAdArts 1994
CHiCoDowntown 2011
cleARlAke Aggregate No Date
clOveRdAleLighting 2009
ColuSaMunicipal Facilities 2007
cOROnAdORecreation 1991
dAnA POintUrban Design 1995
elk GROveConservation 2003
GRidleyCommunity Character and Design 2010
hAWAiiAn GARdensInfrastructure 2010
hOllisteRCommunity Services and Facilities No Date
HunTingTon beaCHUtilities Element 2004
kinGs cOuntyDairy Element 2002
lA QuintAEnvironmental Hazards 2002
laguna HillSCommunity Services & Facilities No Date
loS angeleSFramework Element 2001
MAdeRA cOuntyDairy 2008

Annual Planning Survey Results 2012 373
Appendix K: Status of Local General Plans- Index of Optional Elements and Year Adopted
MARiPOsA cOuntyArea Plans No DateArts No DateInfrastructure No DateTourism No Date
MeRcedPublic Services & Facilities 1997Sustainable Development 1997Urban Design 1997Urban Expansion 1997
MOnteBellOPopulation 1973
MOnteReySocial 2005Urban Design 2005
MOnteRey cOuntyAgriculture and Winery Corridor Plan 2010
MuRRietAInfrastructure 2011
OAklAndCentral Estuary Plan 1999
ORAnGeInfrastructure 2010
ORindAUtilities 1987
PAcificACommuity Design 1980Community Facility 1980
PAlM deseRtArchaeological and Cultural Resources 2004Arts and Culture 2004Community Design 2004Economic and Fiscal 2004Emergency Preparedness 2004Energy and Mineral Resources 2004Fire and Police Protection 2004Flooding and Hydrology 2004Geotechnical 2004Hazardous and Toxic Materials 2004Health Services 2004Public Building and Facilities 2004Schools and Libraries 2004Water, Sewer, and Utilities 2004
PinOleCommunity Character 2010Community Services and Facilities 2010Sustainability 2010
PittsBuRGDowntown 2001
PleAsAntOnCommunity Character No DateSubregional No Date
PORtOlACommunity Design 2001
RAnchO PAlOs veRdesSocial 1975
RiveRsideArts and Culture 2007Community Mobility 2007Infrastructure 2007 Urban Design 2007
RiveRside cOuntyHealthy Community 2011
sAcRAMentOUtilities 2009
sAcRAMentO cOuntyTOD No Date
sAn fRAnciscOArts 1991Urban Design 1972
sAn luis OBisPO cOuntyOff Shore Energy 1992
sAn RAfAelSustainability 2004
sAntA BARBARA cOuntyEnvironmental Resource Management 1980
tiBuROnDowntown 2005
tulARe cOuntyAnimal Confinement Facility Plan 2000
union CiTyYouth, Family, Seniors & Health No Date
ventuRACitizen Input 2005
vistACommunity Facilities 1990
yuba CiTyPublic Utilities 2004

374 Annual Planning Survey Results 2012
Appendix K: Status of Local General Plans: General Plan Update
General Plan Update
Jurisdictions that are currently undergoing an update ofone or more General Plan Elements
JuRisdictiOn
eleMents uPdAtinG
exPected yeAR Of
cOMPletiOnlAn
d u
se
ciR
culA
tiO
n
cOn
seR
vAt
iOn
Ho
uSi
ng
no
iSe
OPe
n s
PAce
Safe
Ty
OPt
iOn
Al
eleM
ents
sPecific OPtiOnAl eleMents And OtheR GeneRAl cOMMents
Alameda • • •
Alameda County • • • • 2012
Albany • • • • • • 2012
Alhambra • • • • 2012
Alpine County • • 2011
Amador City • • 2008
Amador County • • • • • • • Economic and Agriculture 2012
American Canyon • • 2012
Arroyo Grande • 2011
Arvin • • • • • • Air Quality, Health 2012
Atherton • 2012
Atwater • •
Avalon • • • • • • • 2012
Bakersfield • • • • • • • • Public Services, Kern River 2013
Baldwin Park • 2011
Banning • • • Plan to adopt in 6 months from October 2012
Barstow • • • • • • • • To be determined. 2013
Bell • • • • • • • 2014
Bell Gardens • 2012
Bellflower • 2012
Belmont • • • • • • • 2014
Benicia • 2019
Berkeley •
Beverly Hills • • 2011
Big Bear Lake • 2011
Biggs • • • • • • •Community Enhancement, Economic Development
2012
Bishop • 2012
Blue Lake • • • • • • 2013
Brentwood • 2012
Brisbane • • • • • • 2013

Annual Planning Survey Results 2012 375
Appendix K: Status of Local General Plans: General Plan Update
JuRisdictiOn
eleMents uPdAtinG
exPected yeAR Of
cOMPletiOnlAn
d u
se
ciR
culA
tiO
n
cOn
seR
vAt
iOn
Ho
uSi
ng
no
iSe
OPe
n s
PAce
Safe
Ty
OPt
iOn
Al
eleM
ents
sPecific OPtiOnAl eleMents And OtheR GeneRAl cOMMents
Burbank • • • • • • • Air Quality & Climate Change Element (NEW) 2012
Butte County • • No others at this time-new GP adopted in 2010 2012
Calaveras County • • • • • • • Draft Water, Economic, and Agriculture/Forestry 2011
California City • 2012
Calimesa • • • • • • • Sustainability 2014
Calipatria • • • • • • • July 2008
Calistoga •
Camarillo • • Comm. Design 2011
Canyon Lake • • 2011
Capitola • • • • • • 2013
Carlsbad • • • • • • • • Parks and Recreation, Arts 2013
Carmel-by-the-Sea • • • • • •
Carpinteria • 2011
Cathedral City • • • • • • •
Ceres • 2012
Cerritos • • • • • •
Chino Hills • • • • • • • • Economic Development 2012
Chowchilla • 2011
Chula Vista • 2013
Clearlake • • • • • 2014
Cloverdale • • •
Clovis • • • • • • • 2013
Coachella • • • • • • 2012
Colma • • 2012
Colton • • • 2012
Colusa • • • • • • •
Colusa County • • • • • • •Agriculture, Community Character, Economic Development, Public Services and Facilities
2012
Concord • • • • • • • • Growth Management, Economic Vitality 2012
Contra Costa County • 2014
Corcoran •
Coronado • • 2013
Costa Mesa No elements indicated 2014
Crescent City • • • • 2010
Cudahy • • • • • •
Daly City • • • • • • • • Coastal Element 2012

376 Annual Planning Survey Results 2012
Appendix K: Status of Local General Plans: General Plan Update
JuRisdictiOn
eleMents uPdAtinG
exPected yeAR Of
cOMPletiOnlAn
d u
se
ciR
culA
tiO
n
cOn
seR
vAt
iOn
Ho
uSi
ng
no
iSe
OPe
n s
PAce
Safe
Ty
OPt
iOn
Al
eleM
ents
sPecific OPtiOnAl eleMents And OtheR GeneRAl cOMMents
Danville • • • • • • • • Historic Preservation/Growth Management 2012
Davis • 2012
Del Mar • 2012
Del Rey Oaks • 2012
Delano • • • • • 2012
Desert Hot Springs • • • • • • • Economic Development 2011
Dinuba • 2011
Dunsmuir 2009
Eastvale • • • • • • •
El Cerrito • • 2011
El Dorado County • • • • • • Agriculture 2013
Encinitas • • • • • • • • Public Health 2013
Escondido • • • • • • • •Growth Mgt, Economic Prosperity, Health and Services
2012
Etna
Fairfax • • • • • • • Town Center Element 2012
Farmersville • Air Quality 2011
Ferndale • • Historical and Cultural Resources 2012
Folsom • • • • • • • 2014
Fort Jones • 2012
Foster City • • 2012
Fowler • • • • • • 2013
Fremont • • • • • • •Economic Development, Parks and Recreation, Sustainability, Community Character, Public Facilities
2011
Fresno • • • • • • • Health, Economic Development 2013
Fullerton • • • • • • •
Historic Preservation, Bicycle, Growth Management, Economic Development, Redevelopment and Revitalization, Public Health, Public Safety, Parks and Recreation, Arts and Culture, Education, Community Involvement, Water, Air Quality and Climate Change, Integrated Waste Management
2012
Gilroy • 2011
Glendale • • • • • Recreation 2011
Goleta • 2011
Greenfield • 2011
Half Moon Bay •
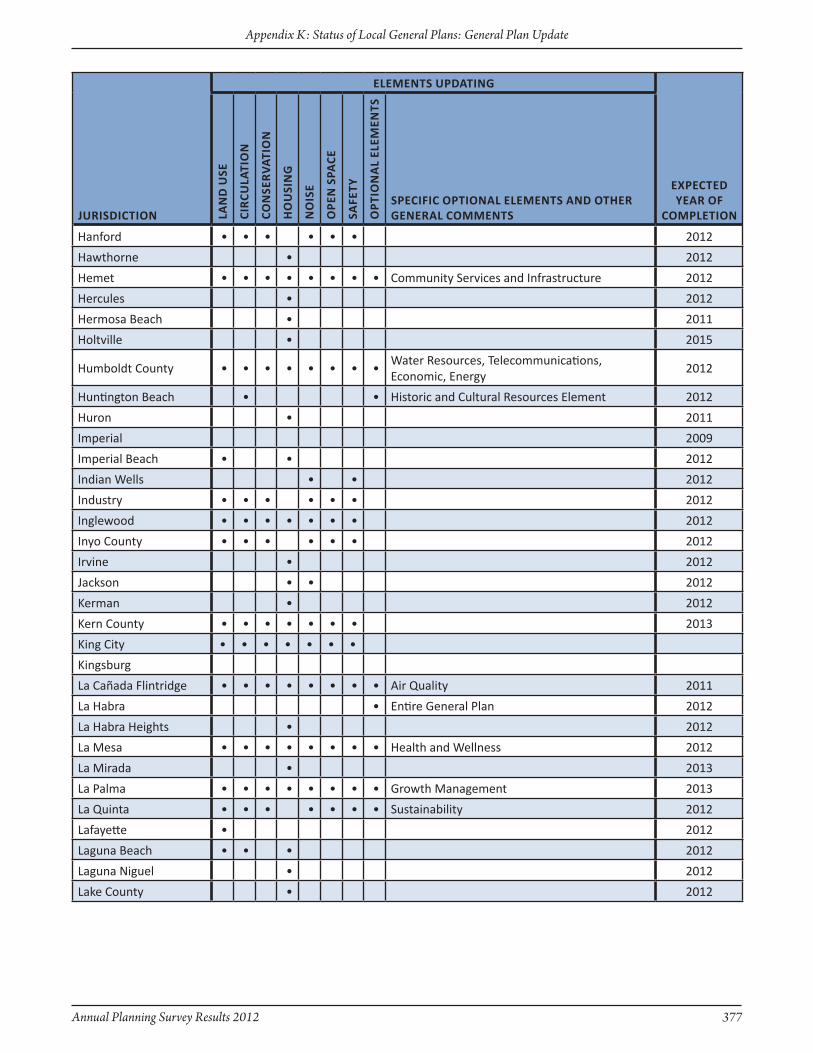
Annual Planning Survey Results 2012 377
Appendix K: Status of Local General Plans: General Plan Update
JuRisdictiOn
eleMents uPdAtinG
exPected yeAR Of
cOMPletiOnlAn
d u
se
ciR
culA
tiO
n
cOn
seR
vAt
iOn
Ho
uSi
ng
no
iSe
OPe
n s
PAce
Safe
Ty
OPt
iOn
Al
eleM
ents
sPecific OPtiOnAl eleMents And OtheR GeneRAl cOMMents
Hanford • • • • • • 2012
Hawthorne • 2012
Hemet • • • • • • • • Community Services and Infrastructure 2012
Hercules • 2012
Hermosa Beach • 2011
Holtville • 2015
Humboldt County • • • • • • • •Water Resources, Telecommunications, Economic, Energy
2012
Huntington Beach • • Historic and Cultural Resources Element 2012
Huron • 2011
Imperial 2009
Imperial Beach • • 2012
Indian Wells • • 2012
Industry • • • • • • 2012
Inglewood • • • • • • • 2012
Inyo County • • • • • • 2012
Irvine • 2012
Jackson • • 2012
Kerman • 2012
Kern County • • • • • • • 2013
King City • • • • • • •
Kingsburg
La Cañada Flintridge • • • • • • • • Air Quality 2011
La Habra • Entire General Plan 2012
La Habra Heights • 2012
La Mesa • • • • • • • • Health and Wellness 2012
La Mirada • 2013
La Palma • • • • • • • • Growth Management 2013
La Quinta • • • • • • • Sustainability 2012
Lafayette • 2012
Laguna Beach • • • 2012
Laguna Niguel • 2012
Lake County • 2012

378 Annual Planning Survey Results 2012
Appendix K: Status of Local General Plans: General Plan Update
JuRisdictiOn
eleMents uPdAtinG
exPected yeAR Of
cOMPletiOnlAn
d u
se
ciR
culA
tiO
n
cOn
seR
vAt
iOn
Ho
uSi
ng
no
iSe
OPe
n s
PAce
Safe
Ty
OPt
iOn
Al
eleM
ents
sPecific OPtiOnAl eleMents And OtheR GeneRAl cOMMents
Lake Elsinore • • • • • • • •
Aesthetics, Air Quality, Biological, Community, Cultural, Growth Management, Hazards and Hazardous Waste, Historic Preservation, Parks and Recreation, Public Facilities, Public Services, Resource Conservation, Sustainability
2011
Larkspur • • • • • • •Community Character, Community Facilities and Services
2012
Lassen County • Energy 2014
Lathrop • • 2010
Lemon Grove • 2013
Lindsay • • • • • • •
Lodi • Climate Action Plan 2012
Loma Linda • • • • • • •
Lompoc • • • • • • •Parks and Recreation, Public Service, Urban Design
2012
Long Beach • • • • 2014
Loomis • • Park, Recreation & Open Space 2012
Los Alamitos • • • • • • 2011
Los Angeles • • • 2013
Los Angeles County • • • • • • 2012
Madera County • • • • • • • 2010
Malibu • 2012
Mammoth Lakes • • 2010
Manhattan Beach • 2011
Maricopa •
Marin County • 2012
Marina • •
Housing Element update is now December 31, 2015 (within 18 months of RTP adoption). I would anticipate that the comprehensive update will take place in approximately 2020.
2015
Mariposa County • • • • • All optional elements already adopted 2013
Martinez • • • • • • 2012
Marysville • 2012
Maywood • 2012
McFarland • • • • • •
Menifee • • • • • • • •The City is in the process of completing our first general plan
2012
Merced • • • • • •General Plan Update scheduled to be adopted on October 17, 2011
2011
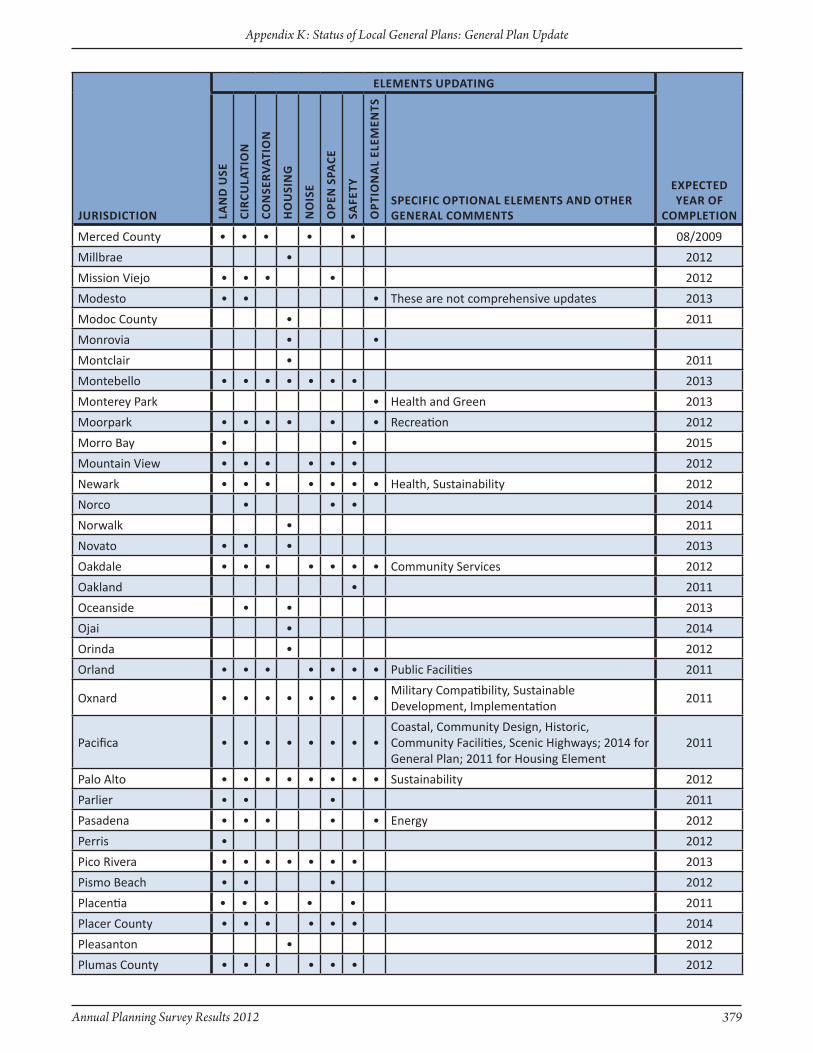
Annual Planning Survey Results 2012 379
Appendix K: Status of Local General Plans: General Plan Update
JuRisdictiOn
eleMents uPdAtinG
exPected yeAR Of
cOMPletiOnlAn
d u
se
ciR
culA
tiO
n
cOn
seR
vAt
iOn
Ho
uSi
ng
no
iSe
OPe
n s
PAce
Safe
Ty
OPt
iOn
Al
eleM
ents
sPecific OPtiOnAl eleMents And OtheR GeneRAl cOMMents
Merced County • • • • • 08/2009
Millbrae • 2012
Mission Viejo • • • • 2012
Modesto • • • These are not comprehensive updates 2013
Modoc County • 2011
Monrovia • •
Montclair • 2011
Montebello • • • • • • • 2013
Monterey Park • Health and Green 2013
Moorpark • • • • • • Recreation 2012
Morro Bay • • 2015
Mountain View • • • • • • 2012
Newark • • • • • • • Health, Sustainability 2012
Norco • • • 2014
Norwalk • 2011
Novato • • • 2013
Oakdale • • • • • • • Community Services 2012
Oakland • 2011
Oceanside • • 2013
Ojai • 2014
Orinda • 2012
Orland • • • • • • • Public Facilities 2011
Oxnard • • • • • • • •Military Compatibility, Sustainable Development, Implementation
2011
Pacifica • • • • • • • •Coastal, Community Design, Historic, Community Facilities, Scenic Highways; 2014 for General Plan; 2011 for Housing Element
2011
Palo Alto • • • • • • • • Sustainability 2012
Parlier • • • 2011
Pasadena • • • • • Energy 2012
Perris • 2012
Pico Rivera • • • • • • • 2013
Pismo Beach • • • 2012
Placentia • • • • • 2011
Placer County • • • • • • 2014
Pleasanton • 2012
Plumas County • • • • • • 2012

380 Annual Planning Survey Results 2012
Appendix K: Status of Local General Plans: General Plan Update
JuRisdictiOn
eleMents uPdAtinG
exPected yeAR Of
cOMPletiOnlAn
d u
se
ciR
culA
tiO
n
cOn
seR
vAt
iOn
Ho
uSi
ng
no
iSe
OPe
n s
PAce
Safe
Ty
OPt
iOn
Al
eleM
ents
sPecific OPtiOnAl eleMents And OtheR GeneRAl cOMMents
Pomona • • • • • • 2012
Portola • • • • • • • •Community Design, Economic Development, Public Services and Facilities, Air Quality
2011
Portola Valley • Historic, Housing & Overview of all elements 2012
Poway • 2012
Rancho Palos Verdes • • • • • • • • Visual Resources, Fiscal, Social Services 2012
Redondo Beach • • 2011
Reedley • • • • • • • 2012
Richmond • • • • • • • •Community Facilities, Economic Development, Growth Management
2012
Ridgecrest • 2012
Rio Dell • • • • • •
Riverside County • • • • • • Air 2011
Rocklin • • • • • • • • Recreation 2012
Rosemead • 2011
Roseville • • • • • • 2012
Sacramento County • • • • • • • 2011
Salinas • 2012
San Anselmo • 2011
San Benito County • • • • • • • •Economic Development, Administration, Public Facilities
2012
San Bernardino • 2012
San Bernardino County • 2012
San Clemente • • • • • • 2012
San Diego • 2013
San Francisco • • 2012
San Jacinto • 2011
San Joaquin • • • • • • • •
San Joaquin County • • • • • • 2012
San Jose • • • • • • • 2011
San Juan Bautista • 2012
San Luis Obispo • • 2014
San Luis Obispo County • • • Economic Element 2014
San Marcos • • • • • • • Parks and Recreation 2012
San Mateo County •
Santa Ana • 2012
Santa Barbara • • • 2011
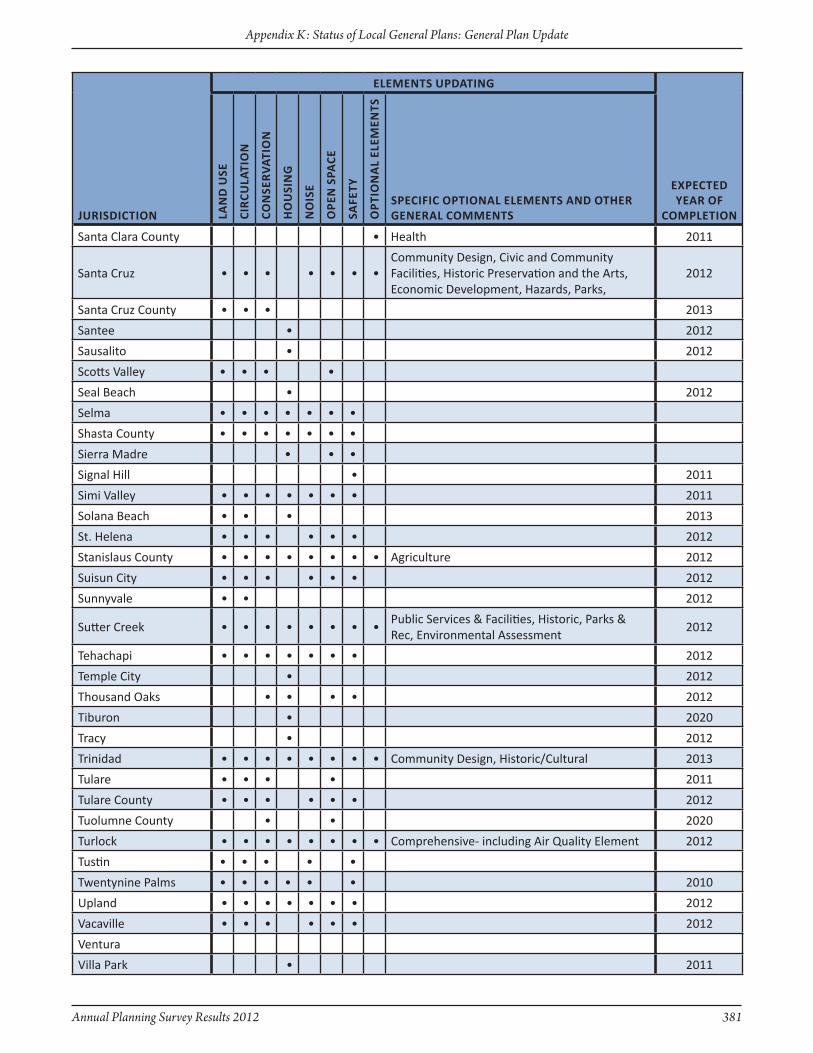
Annual Planning Survey Results 2012 381
Appendix K: Status of Local General Plans: General Plan Update
JuRisdictiOn
eleMents uPdAtinG
exPected yeAR Of
cOMPletiOnlAn
d u
se
ciR
culA
tiO
n
cOn
seR
vAt
iOn
Ho
uSi
ng
no
iSe
OPe
n s
PAce
Safe
Ty
OPt
iOn
Al
eleM
ents
sPecific OPtiOnAl eleMents And OtheR GeneRAl cOMMents
Santa Clara County • Health 2011
Santa Cruz • • • • • • •Community Design, Civic and Community Facilities, Historic Preservation and the Arts, Economic Development, Hazards, Parks,
2012
Santa Cruz County • • • 2013
Santee • 2012
Sausalito • 2012
Scotts Valley • • • •
Seal Beach • 2012
Selma • • • • • • •
Shasta County • • • • • • •
Sierra Madre • • •
Signal Hill • 2011
Simi Valley • • • • • • • 2011
Solana Beach • • • 2013
St. Helena • • • • • • 2012
Stanislaus County • • • • • • • • Agriculture 2012
Suisun City • • • • • • 2012
Sunnyvale • • 2012
Sutter Creek • • • • • • • •Public Services & Facilities, Historic, Parks & Rec, Environmental Assessment
2012
Tehachapi • • • • • • • 2012
Temple City • 2012
Thousand Oaks • • • • 2012
Tiburon • 2020
Tracy • 2012
Trinidad • • • • • • • • Community Design, Historic/Cultural 2013
Tulare • • • • 2011
Tulare County • • • • • • 2012
Tuolumne County • • 2020
Turlock • • • • • • • • Comprehensive- including Air Quality Element 2012
Tustin • • • • •
Twentynine Palms • • • • • • 2010
Upland • • • • • • • 2012
Vacaville • • • • • • 2012
Ventura
Villa Park • 2011

382 Annual Planning Survey Results 2012
Appendix K: Status of Local General Plans: General Plan Update
JuRisdictiOn
eleMents uPdAtinG
exPected yeAR Of
cOMPletiOnlAn
d u
se
ciR
culA
tiO
n
cOn
seR
vAt
iOn
Ho
uSi
ng
no
iSe
OPe
n s
PAce
Safe
Ty
OPt
iOn
Al
eleM
ents
sPecific OPtiOnAl eleMents And OtheR GeneRAl cOMMents
Visalia • • • • • • •Historic Preservation, Parks and Recreation, and Scenic Highways
2012
Vista • • • • • • • 2012
Walnut • • • • • 2013
Watsonville • • 2012
West Sacramento • • • • • • • Health 2013
Westlake Village • • • • • • • Public Services 2012
Williams • • • • • • • Public Facilities 2012
Willits • •
Windsor • 2013
Woodside • • • • • • • • Historic Preservation, and Public Utilities 2012
Yorba Linda • 2012
Yuba City • • • • • •
Yucca Valley • • • • • • • •