Annual Meeting 2010 John Williamson Chief Executive Annual Meeting | Hellaby Holdings | 11 November...
12
-
Upload
lenard-carson -
Category
Documents
-
view
214 -
download
0
Transcript of Annual Meeting 2010 John Williamson Chief Executive Annual Meeting | Hellaby Holdings | 11 November...


Annual Meeting 2010
John WilliamsonChief Executive
Annual Meeting | Hellaby Holdings | 11 November 2010
2

Achievements this year
• Completed three year turnaround of Hellaby
• Significant effort to transform culture and performance
• Rigorous focus on cashflow generation and working capital
• Tight financial disciplines, simple clear strategies and excellent management teams
• Total shareholder return increased 39.5% for year to 30 June 2010
• Total shareholder return further increased 40% over past four months
• Conservative capital structure, financial flexibility, positioned for future growth
Annual Meeting | Hellaby Holdings | 11 November 2010
3

Balance sheet reform • Total net debt high point (December 2007) $165.6 million; debt
gearing 65%
• Last year net debt reduced to $73.3 million; debt gearing 42.3%
• Debt reduction has exceeded market expectations
• Now targeting debt gearing of < 45% going forward
0%
10%
20%
30%
40%
50%
60%
70%
-
20,000
40,000
60,000
80,000
100,000
120,000
140,000
160,000
2006 2007 2008 2009 2010
Debt ($000's)
Capital Notes Other Interest Bearing Debt Gearing Ratio (total debt / (total debt + equity))
Annual Meeting | Hellaby Holdings | 11 November 2010
4

Capital management
• Balance sheet reform has created opportunities
• August 2010 refinanced with Westpac to July 2012
• September 2010 successfully raised $28.4 million through rights offer
• October 2010, signalled early cash redemption of $50 million capital notes to reduce interest costs
• Balance sheet and capital structure reform has exceeded market expectations
• Dividends resumed April 2010; dividend policy confirmed at 50% of NPAT
Annual Meeting | Hellaby Holdings | 11 November 2010
5

Group financial performance
• Last year, group revenue down 4.8% - tough trading conditions
• Significant EBIT and EBITDA improvement
• NPAT of $10.3 million ($0.7 million previous year)
• Earnings per share 20.3 cents (1.4 cents previous year)
• ROFE 17.4% (12.8% previous year)
• Free cashflow $36.0 million
– an outstanding achievement
-30.0
-20.0
-10.0
-
10.0
20.0
30.0
40.0
50.0
60.0
2006 2007 2008 2009 2010
Earnings per Share (cps)
Annual Meeting | Hellaby Holdings | 11 November 2010
6

Operational achievements
• Diesel Distributors reaping benefits from working capital plus restructuring initiatives in previous year
• Elldex Packaging improved EBIT 153%, through better internal processes and margins
Focus shifts to trans-tasman sales growth
Benefits flowing from successful acquisitions and integration from 2007
• Number 1 Shoes significant performance turnaround under new leadership
Major repositioning underway
Annual Meeting | Hellaby Holdings | 11 November 2010
7

First quarter FY11
• First quarter group financial performance ahead of same period last year
• Still no ‘green shoots’, although sales up 2.4% for first quarter
• First quarter EBITDA $3.1 million ahead of last year
• First quarter NPAT $2.7 million ahead of last year
• Equipment and Footwear performing better than last year
• Debt gearing dropped to 30% at 31 October (61% two years ago)
Annual Meeting | Hellaby Holdings | 11 November 2010
8

People
• Created leadership culture of ownership, accountability and continuous improvement
• Excellent management teams across all subsidiaries
• Small, lean corporate office
• Decentralise leadership and performance accountabilities to subsidiaries
• Subsidiaries have full responsibility for achieving profit and ROFE targets
Annual Meeting | Hellaby Holdings | 11 November 2010
9
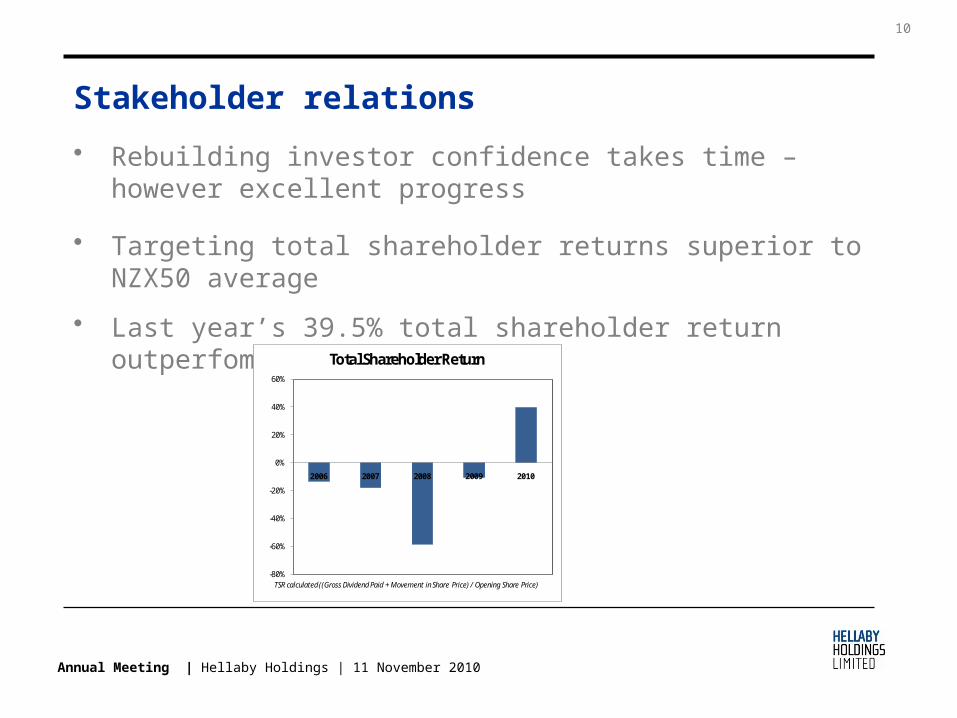
Stakeholder relations
• Rebuilding investor confidence takes time – however excellent progress
• Targeting total shareholder returns superior to NZX50 average
• Last year’s 39.5% total shareholder return outperfomed NZX50
-80%
-60%
-40%
-20%
0%
20%
40%
60%
2006 2007 2008 2009 2010
Total Shareholder Return
TSR calculated ((Gross Dividend Paid + Movement in Share Price) / Opening Share Price)
Annual Meeting | Hellaby Holdings | 11 November 2010
10

Conclusion
• Slow economic recovery – few ‘green shoots’
• Subsidiaries lean and well positioned
• Investor confidence in Hellaby returning with improved performance
• Hellaby now in good shape to take advantage of opportunities
• Proud of our achievements – We now have momentum
Annual Meeting | Hellaby Holdings | 11 November 2010
11