Annual General Meeting Thursday 15 April 2010. Carl-Henric Svanberg Chairman.
57
Annual General Meeting Thursday 15 April 2010
-
Upload
alvin-martin -
Category
Documents
-
view
219 -
download
1
Transcript of Annual General Meeting Thursday 15 April 2010. Carl-Henric Svanberg Chairman.

Annual General MeetingThursday 15 April 2010

Carl-Henric SvanbergChairman

3
The Resolutions
1 Annual Report and Accounts
2 Directors’ Remuneration Report
3-16 Election and re-election of Directors
17 Reappointment of Auditors
18 Adoption of new Articles of Association
19 Share buyback
4
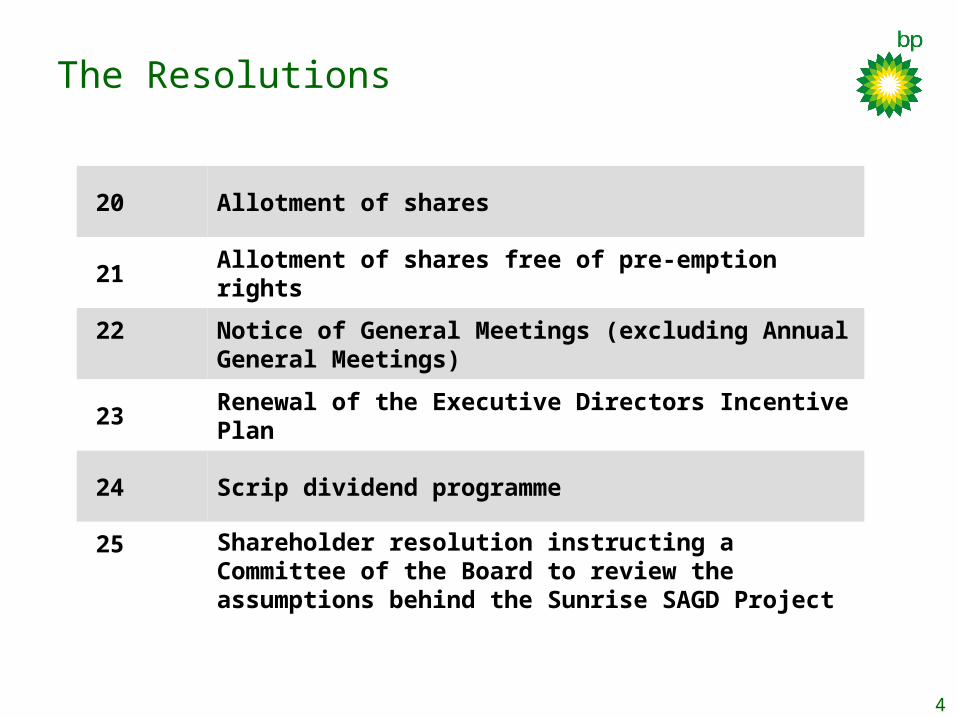
The Resolutions
20 Allotment of shares
21 Allotment of shares free of pre-emption rights
22 Notice of General Meetings (excluding Annual General Meetings)
23Renewal of the Executive Directors Incentive Plan
24 Scrip dividend programme
25 Shareholder resolution instructing a Committee of the Board to review the assumptions behind the Sunrise SAGD Project

5
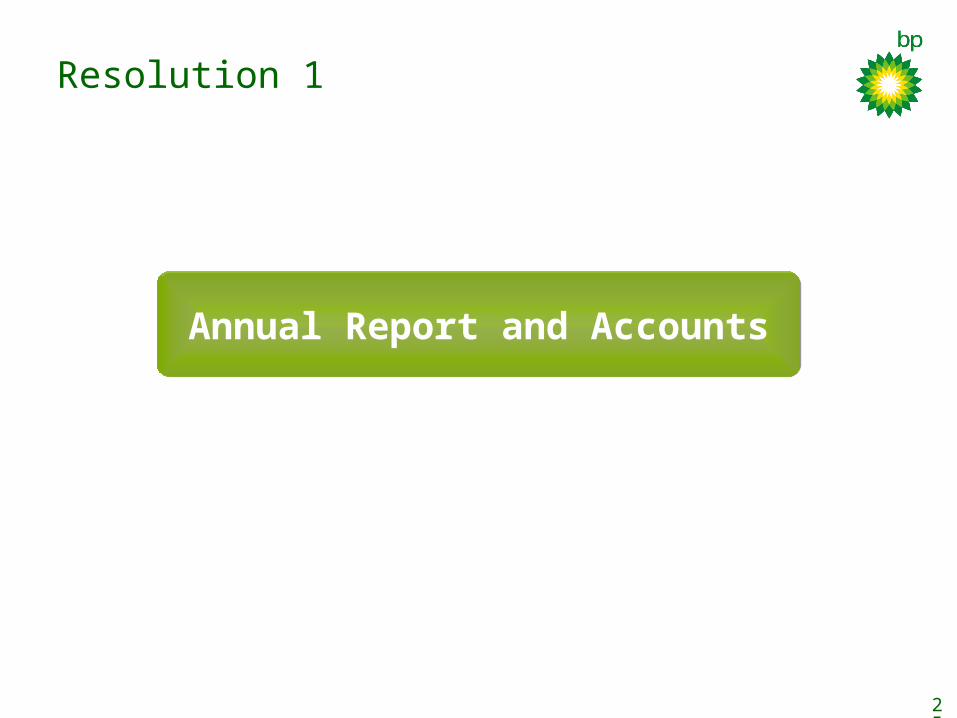
Resolution 1
Annual Report and AccountsAnnual Report and Accounts

Tony HaywardGroup Chief Executive

7
Long-term energy outlook
Demand
• Growth resumes post recession
• Driven by non-OECD
• Evolution to lower-carbon economy
Supply
• Diverse energy mix required
• Leveraging technology
• Carbon pricing
Energy consumption to 2030
Source: BP estimates
Mb
oed
OECD
Non-OECD
0
100
200
300
400
2000 2010 2020 2030
Renewables
Hydro
Nuclear
Coal
Gas
Biofuels
Oil0
100
200
300
400
2000 2010 2020 2030
Mb
oed

8
BP’s approach to a lower-carbon future
• Energy efficiency within BP operations
• Including the price of carbon in investment decisions
• Promoting lowest-cost energy pathways e.g. gas for power generation
• Continued investment in Alternative Energy
− biofuels
− wind
− solar
− carbon capture and sequestration
• Investing in research and technology

9
Forward Agenda
Safe and reliable operations
• Continue journey in personal safety
• Implement Operating Management System
• Compliance
People
• Building capability
• Leadership and behaviours
Performance
• Restore revenues
• Reduce complexity and cost

10
Safe, reliable and efficient operations
Loss of Primary Containment Incidents
0
50
100
150
200
1Q08 2Q08 3Q08 4Q08 1Q09 2Q09 3Q09 4Q09
(1) Data for 2008 and 2009 is aligned to incident impact severity rather than volume released
Integrity Management Major Incidents(1)
0
5
10
15
20
25
30
35
2004 2005 2006 2007 2008 2009
Recordable Injury Frequency
0.0
0.5
1.0
1.5
2000200120022003200420052006200720082009
Industry range - six majors

11
People and organization
• Leadership and culture
• Restructuring and delayering
• Skills and capability
• Diversity and inclusion
• Reward for performance
Changing the culture

12
2004
2005
2006
2007
2008
2009
Restoring revenues
Refining availability(1)Production Rolling 4-quarters to 4Q09
Shell
Total
Chevron
ExxonMobil
BP
mb
oed
2000
2500
3000
3500
4000
4500
1Q
00
1Q
01
1Q
02
1Q
03
1Q
04
1Q
05
1Q
06
1Q
07
1Q
08
1Q
09
Note: Chevron includes Texaco, prior to the mergerBarrels of oil equivalent as reported in company disclosures (1) Solomon availability
70%
75%
80%
85%
90%
95%
100%

13
Controlling cash costs
Cash costs - indexed(Total BP Group)
A definition of cash costs can be found on our website at www.bp.com
80
90
100
110
120
130
140
150
2004 2005 2006 2007 2008 2009

14
2009 momentum versus peers
Underlying Net Income $bn(1) 14.6 19.2 11.6 9.5 Year on Year % -44% -56% -59% -58%
Cash from Operations $bn 27.7 28.4 21.0 Year on Year % -27% -52% -52% -35%
Reported Volumes mboed 3998 3932 3152 2704 Year on Year % 4% 0% -3% 7%
Market Capitalisation $bn(2)
vs. end 2008 %
Capital Expenditure $bn(3) 20.0 27.1 30.6 22.2 Year on Year % -8% 4% 2% -2%
10.9-47%
17.2-37%
2281-3%
18.6-7%
(1) For BP underlying net income is replacement cost for the year adjusted for non-operating items and fair value accounting effects. For other companies, underlying includes adjustments for all identified non-recurring items.
(2) as at 31/12/2009(3) BP organic; ExxonMobil, Royal Dutch Shell, Chevron and Total as disclosed
181 323 185 15424% -21% 13% 3%
15015%
19.4

15
BP vs peers – since January 2009
Conoco Phillips
Exxon Mobil
BP
ChevronRDSB
Total
Source: Datastream, 14 April 2010
J F M A M J J A S O N D J F M A60
70
80
90
100
110
120
130
140

16
Strategic progress in 2009
E&P• New access: Iraq, Indonesia, Jordan, new acreage in US Gulf of Mexico and
Egypt • Exploration and appraisal success: Tiber, Mad Dog South, Angola Block 31• Major projects: 7 start-ups and 2 sanctioned developments• Resource replacement: over 250%• Reserves replacement: 129%• Production growth: 4%
R&M• Revenues restored: US refining portfolio fully operational• Simplification: US convenience retail, reduced marketing footprint• Cost efficiency: cash costs down by more than 15% on 2008
Alternative Energy• Focused and disciplined: $4bn invested since 2006
Corporate Simplification• Headcount: reduced by ~ 7500 to date• Cash costs: down by more than $4bn in 2009
Reserve replacement as reported on a combined basis of subsidiaries and equity accounting entities, excluding acquisitions and divestments

17
2009 exploration and access
ANGOLALeda, Oberon, TebeBlock 31BP (27%) and operatorNineteen discoveries in block
US GULF OF MEXICOTiberBP (62%) and operatorGiant oil discovery
CANADAEllice J-27BP (25%)
EGYPTNile Delta2,900km2 net in two
blocks
IRAQRumailaRedevelopment of supergiant
PAKISTANOnshore5,000km2 in two blocks
INDONESIAKalimantanNet 640km2 of Coal Bed Methane
INDONESIAWest Papua2620km2 net in two blocks
US GULF OF MEXICO61 leases from OCS 208, 210
US SHALE GASEagle FordNew ~5tcf position
ExplorationAccess
JORDANRisha7,000km2 block

18
Growth to 2015
2010-2015 BP projections at $60/bbl
TNK-BP
Angola
Gulf of Mexico
Asia Pacific
South America
N. Africa, Middle Eastand Caspian
Trinidad & Tobago
North Sea
North America Onshore0
1,000
2,000
3,000
4,000
5,000
2008 2009 2010 2011 2012 2013 2014 2015
mboed

19
Project start-ups 2010–2015
AlaskaLiberty *
* BP Operated
2010 Start Ups
2011 Start Ups
2012-2015 Start Ups
Canada Canada Noel * Sunrise
Gulf of MexicoGreat WhiteGalapagos *Na Kika Phase 3 *Mad Dog Phase 2 *Na Kika Phase 4 * Tubular Bells *Freedom Kaskida *Mars B Horn Mountain Phase 2 *Atlantis Phase 3 *
Trinidad & TobagoSerrette *Trinidad Compression *Juniper *
AngolaB31 PSVM *PazflorClochas MavacolaAngola LNGKizomba Satellites Phase 2B18 West *CLOV
Asia PacificNorth Rankin 2Tangguh Expansion *Sanga Sanga Coal Bed Methane
AzerbaijanChirag Oil *
North SeaSkarv *Valhall Redevelopment * Devenick *Kinnoull *Clair Ridge *WoS Q204 *
EgyptWND Gas *
Algeria & LibyaIn Salah Gas CompressionIn Salah Southern FieldsIn Amenas Compression
Middle EastOman FFD *
Russia (TNK-BP)RusskoyeSuzunVerkhnechonskoye FFD
2012 and 2015 BP projections at $60/bbl
2012 2015
400
1000

20
Total oil and gas initially in place
Portfolio qualityEfficient and successful
explorer
High quality refining
RDSCVX
BP
XOM
COP
TOT
0
1
2
3
4
5
5 10 15Exploration spend $bn
Dis
covere
d r
eso
urc
e b
nb
oe
Majors' relative performance 2004 - 2008
Leverage to improved recovery
Strong reserve replacement track record (1)
+1% = 2 bnboe
18
45
41
bn boe
Currently unrecoverabl
e hydrocarbon
Produced
Proved
Non-proved
World class international businesses
0%
20%
40%
60%
80%
100%
120%
5-Y
ear
Avera
ge O
rgan
ic R
RR
’0
4-’
08
(excl
ud
ing
oil
san
ds,
usi
ng
year-
en
d p
rici
ng
)
(1) BP estimates using company disclosure
Robust medium-term growth
2010-2015 BP projections at $60/bbl
1,000
2,000
3,000
4,000
5,000
200
8
200
9
201
0
201
1
201
2
201
3
201
4
201
5
TNK-BP
Angola
Gulf of Mexico
Asia Pacific
South America
N Africa, Middle East and CaspianTrinidad
North Sea
North America Onshore
mb
oed
0
Source: Oil & Gas Journal 2010
Avera
ge R
efin
ery
Siz
e (
kbd
)
Alliance MombasaCoryton ReichstettGrangemouthSalt LakeLavera Singapore Mandan Yorktown
BP Divestments ’00-’09
Divested
100
150
200
250
7 8 9 10 11Nelson Complexity
• Material market shares
• 40% of capital employed in growth markets
• Leading technologies
• Strong customer relationships
• Premium brands
• Margin share growth

21
The opportunity
Project Cost Performance
Inflation ProjectManagement
120% 5%15%
SanctionEstimate
100%
ROACE vs PeersEarnings vs Peers
Projects efficiencyPerformance gap in US Fuels Value
Chains
Drilling efficiency
Underlying net income gap $bn
(25)
(20)
(15)
(10)
(5)
0
5
BP gap to Shell BP gap to ExxonMobil(absolute)
2001 2002 2003 2004 2005 2006 2007 2008 2009 0%
5%
10%
15%
20%
25%
30%
35%
40%
2003 2004 2005 2006 2007 2008 20092003 2004 2005 2006 2007 2008 2009
Underlying ROACE
BP
Other Supermajors
Dril
ling
Cap
ital $
m
Industry Average
Best in
Basin
$500m Opportunity
2009 BP Actual
Performance
Pre-tax RCOP per barrel, rolling 4Q indexed
US Peers
BP
Refining efficiency
YearBP portfolio average Top 3 R&M refinery sites
Solo
mon
Availab
ilit
y %
70
75
80
85
90
95
100
R&M refining cost efficiency(1)
2012
2007
2009
140 120 100130 110
2004
Refining performance
(1) Based on Solomon non-energy operating expense per Effective Distillation Capacity (indexed to top three R&M refineries)
(100)
(50)
0
50
100
150
200
1Q
05
2Q
05
3Q
05
4Q
05
1Q
06
2Q
06
3Q
06
4Q
06
1Q
07
2Q
07
3Q
07
4Q
07
1Q
08
2Q
08
3Q
08
4Q
08
1Q
09
2Q
09
3Q
09
4Q
09
Source: Benchmarking data based on BP internal and industry
Data based on BP Operated Major Projects portfolio in 2004-2008

22
Realising the opportunity
• Capital efficiency
• Cost efficiency
• Technology
• Culture

23
Strategy
• Upstream profit growth, cost and capital efficiency
• Downstream turnaround, cost efficiency
• Alternative Energy focused and disciplined
• Corporate efficiency

Carl-Henric SvanbergChairman
25
Resolution 1
Annual Report and AccountsAnnual Report and Accounts

26
Resolution 12009 Annual Report and Accounts
Voted For 11,079,621,694
Voted Against 21,499,097
Vote Withheld 66,436,113
For
Against
Results to date:
99.8%
0.2%

27
Resolution 2
Directors’ Remuneration Report
Directors’ Remuneration Report

28
Resolution 2Directors’ Remuneration Report
Voted For 9,398,720,859
Voted Against 931,578,571
Vote Withheld 837,212,009
Results to date:
For
Against
91.0%
9.0%

29
Resolutions 3-15Election or re-election of Directors
Mr P Anderson
Mr A Burgmans
Mrs C B Carroll
Sir William Castell
Mr I C Conn
Mr G David
Mr I E L Davis
Mr R Dudley
Mr D J Flint
Dr B E Grote
Dr A B Hayward
Mr A G Inglis
Dr D S Julius

30
Resolutions 3-15Election or re-election of Directors
Vote for Vote against Vote withheld
Mr P Anderson 10,977,409,512 151,066,543 38,993,692
Result to date: For 98.6% Against 1.4%
Mr A Burgmans 10,965,134,434 164,050,721 38,302,403
Result to date: For 98.5% Against 1.5%
Mrs C B Carroll 11,027,057,453 102,533,368 37,902,173
Result to date: For 99.1% Against 0.9%
Sir William Castell 11,025,041,912 103,761,424 38,702,079
Result to date: For 99.1% Against 0.9%

31
Resolutions 3-15Election or re-election of Directors
Vote for Vote against Vote withheld
Mr I C Conn 10,938,403,093 191,087,047 38,041,584
Result to date: For 98.3% Against 1.7%
Mr G David 10,733,392,610 395,475,212 38,614,107
Result to date: For 96.4% Against 3.6%
Mr I E L Davis 10,975,611,000 152,716,758 39,155,414
Result to date: For 98.6% Against 1.4%

32
Resolutions 3-15Election or re-election of Directors
Vote for Vote against Vote withheld
Mr R Dudley 10,940,166,275 188,849,910 38,478,595
Result to date: For 98.3% Against 1.7%
Mr D J Flint 10,899,035,276 102,425,031 166,033,213
Result to date: For 99.1% Against 0.9%
Dr B E Grote 10,939,048,013 190,239,704 38,228,537
Result to date: For 98.3% Against 1.7%

33
Resolutions 3-15Election or re-election of Directors
Vote for Vote against Vote withheld
Dr A B Hayward 11,024,928,701 104,948,195 37,664,239
Result to date: For 99.1% Against 0.9%
Mr A G Inglis 10,939,126,761 190,109,903 38,288,567
Result to date: For 98.3% Against 1.7%
Dr D S Julius 10,809,445,155 320,094,978 37,952,418
Result to date: For 97.1% Against 2.9%

34
Resolution16
Election of Mr C-H SvanbergElection of Mr C-H Svanberg

35
Resolution 16Election of Mr C-H Svanberg
Voted For 10,930,203,696
Voted Against 198,508,861
Vote Withheld 38,772,903
Results to date:
For
Against
98.2%
1.8%

36
Resolution17
Reappointment of AuditorsReappointment of Auditors

37
Resolution 17Reappointment of Auditors
Voted For 11,033,820,135
Voted Against 82,465,621
Vote Withheld 51,260,548
Results to date:
For
Against
99.3%
0.7%

38
Resolution18
Special Resolution:Adoption of New Articles
Special Resolution:Adoption of New Articles

39
Resolution 18Adoption of New Articles
Voted For 10,875,402,957
Voted Against 100,262,826
Vote Withheld 191,793,500
Results to date:
For
Against
99.1%
0.9%

40
Resolution19
Special Resolution:Authority to repurchase
shares
Special Resolution:Authority to repurchase
shares

41
Resolution 19Authority to repurchase shares
Voted For 11,049,776,527
Voted Against 54,030,655
Vote Withheld 63,742,541
Results to date:
For
Against
99.5%
0.5%
42
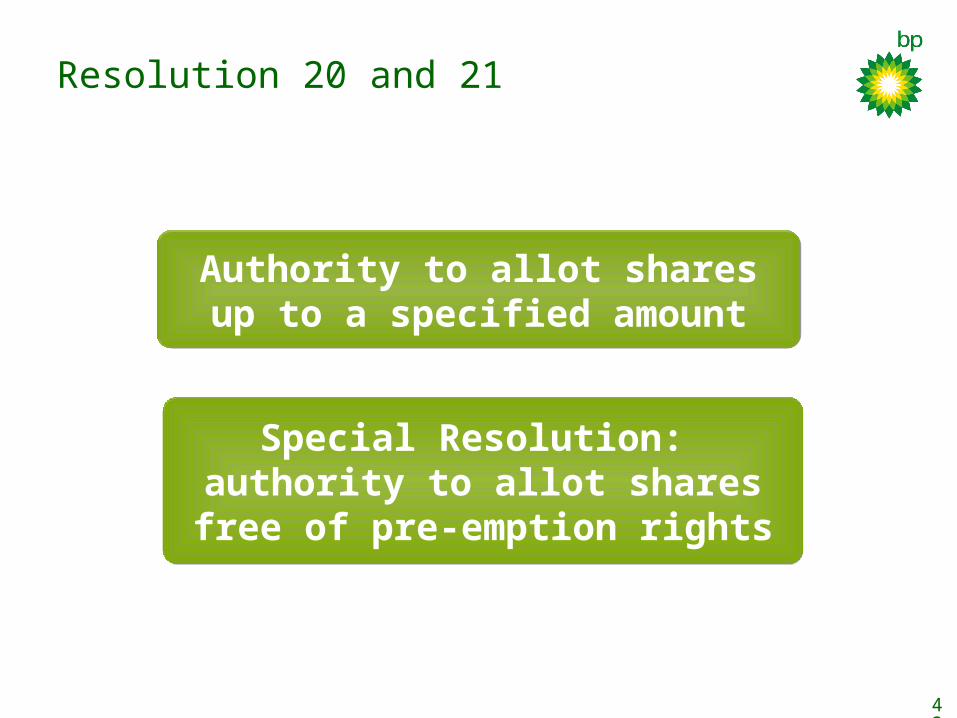
Resolution 20 and 21
Authority to allot shares up to a specified amount
Authority to allot shares up to a specified amount
Special Resolution: authority to allot shares free
of pre-emption rights
Special Resolution: authority to allot shares free
of pre-emption rights
43
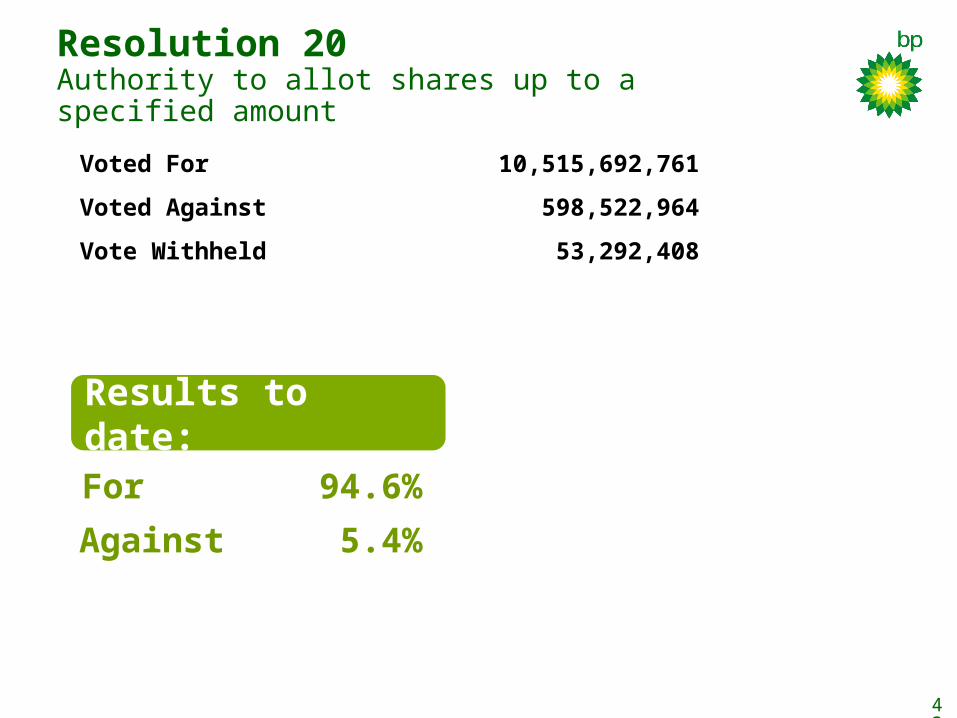
Resolution 20Authority to allot shares up to a specified amount
Voted For 10,515,692,761
Voted Against 598,522,964
Vote Withheld 53,292,408
Results to date:
For
Against
94.6%
5.4%

44
Resolution 21Authority to allot shares free of pre-emption rights
Voted For 10,936,954,354
Voted Against 172,496,006
Vote Withheld 58,061,690
Results to date:
For
Against
98.4%
1.6%

45
Resolution 22
Special Resolution:Notice of General Meetings
(excluding AGMs)
Special Resolution:Notice of General Meetings
(excluding AGMs)

46
Resolution 22Notice of General Meetings (excluding AGMs)
Voted For 10,531,741,736
Voted Against 591,822,173
Vote Withheld 44,000,807
Results to date:
For
Against
94.7%
5.3%

47
Resolution 23
Renewal of the Executive Directors’ Incentive PlanRenewal of the Executive Directors’ Incentive Plan

48
Resolution 23Renewal of the Executive Directors’ Incentive Plan
Voted For 10,259,000,528
Voted Against 766,588,209
Vote Withheld 141,936,021
Results to date:
For
Against
93.0%
7.0%

49
Resolution 24
The Scrip Dividend Programme
The Scrip Dividend Programme
50
Resolution 24The Scrip Dividend Programme
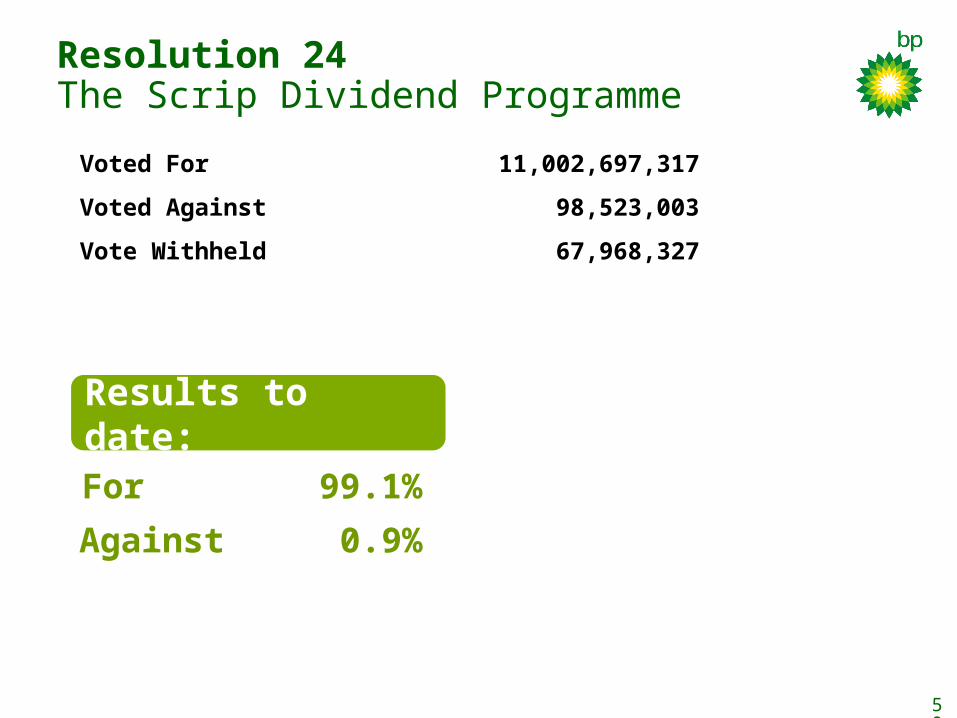
Voted For 11,002,697,317
Voted Against 98,523,003
Vote Withheld 67,968,327
Results to date:
For
Against
99.1%
0.9%

51
Resolution 25
Shareholder ResolutionShareholder Resolution
Special Resolution: Instructing a Committee of
the Board to review the assumptions behind the
Sunrise SAGD Project
Special Resolution: Instructing a Committee of
the Board to review the assumptions behind the
Sunrise SAGD Project

52
A typical Steam Assisted Gravity Drainage (SAGD) Well Pad

53
SAGD Schematic

54
Resolution 25Instructing a Committee of the Board to review the assumptions behind the Sunrise SAGD Project
Voted For 622,272,418
Voted Against 9,497,638,714
Vote Withheld 1,020,301,075
Results to date:
For
Against
6.1%
93.9%
55
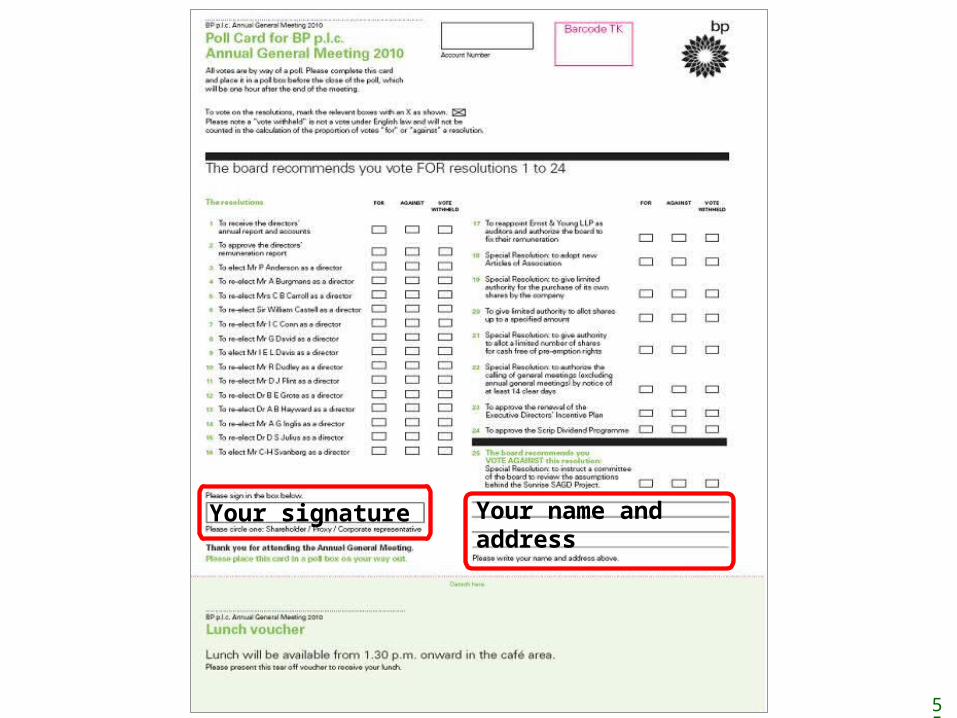
Your signature Your name and address

56
Please complete your
poll cards and place
them in the boxes
provided

57
The BP p.l.c. AGM 2010 is now concluded
Thank you for your attendance