ANNUAL FINANCIAL STATEMENTS 2015 Financial Statements 2015_1.pdf– retail clothing, jewellery,...
88
ANNUAL FINANCIAL STATEMENTS 2015
Transcript of ANNUAL FINANCIAL STATEMENTS 2015 Financial Statements 2015_1.pdf– retail clothing, jewellery,...

ANNUAL FINANCIAL STATEMENTS
2015
CONTENTS The reports and statements set out below comprise of the consolidated and separate annual financial statements presented to the shareholders:
Directors’ Responsibility for and Approval of the Consolidated and Separate Annual Financial Statements 1
Directors' Report 2 – 4
Company Secretary’s Certificate 5
Board Audit Committee Report 6 – 11
Independent Auditor's Report 12
Consolidated Statement of Financial Position 14
Consolidated Income Statement 15
Consolidated Statement of Comprehensive Income 16
Consolidated Statement of Changes in Equity 17 – 18
Consolidated Cash Flow Statement 19
Consolidated Segmental Analysis 20 – 23
Notes to the Financial Statements 24 – 75
Company Annual Financial Statements 76 – 79
Appendix 1: Shareholdings 80 – 81
Appendix 2: Definitions 82
Administration and Shareholders’ Calendar IBC
These financial statements represent the financial information of The Foschini Group Limited and have been audited in compliance with Section 30 of the Companies Act of 2008. These financial statements were prepared by the TFG Finance and Advisory department of The Foschini Group Limited acting under supervision of Ronnie Stein CA(SA), CFO of The Foschini Group Limited.
These statements were authorised by the board of directors on 29 June 2015 and published on 22 July 2015.
TFG / 2015 ANNUAL FINANCIAL STATEMENTS 1
The directors are responsible for the preparation and fair presentation of the consolidated and separate annual financial statements of The Foschini Group Limited, comprising the statements of financial position at 31 March 2015, and the income statements, the statements of comprehensive income, changes in equity and cash flows for the year then ended, and the notes to the financial statements which includes a summary of significant accounting policies and other explanatory notes, in accordance with International Financial Reporting Standards and the requirements of the Companies Act of South Africa, and the directors’ report.
The directors are also responsible for such internal control as the directors determine is necessary to enable the preparation of financial statements that are free from material misstatement, whether due to fraud or error, and for maintaining adequate accounting records and an effective system of risk management as well as the preparation of the supplementary schedules included in these financial statements.
The directors have made an assessment of the ability of the company and its subsidiaries to continue as going concerns and have no reason to believe that the businesses will not be going concerns in the foreseeable future.
The auditor is responsible for reporting on whether the consolidated and separate financial statements are fairly presented in accordance with the applicable financial reporting framework.
APPROVAL OF CONSOLIDATED AND SEPARATE ANNUAL FINANCIAL STATEMENTSThe consolidated and separate annual financial statements of The Foschini Group Limited, as identified in the first paragraph, were approved by the board of directors on 29 June 2015 and signed by:
M Lewis A D MurrayChairman Chief Executive Officer
Authorised director Authorised director
DIRECTORS’ RESPONSIBILITY FOR AND APPROVAL OF THE CONSOLIDATED AND SEPARATE
ANNUAL FINANCIAL STATEMENTSFOR THE YEAR ENDED 31 MARCH 2015
2 TFG / 2015 ANNUAL FINANCIAL STATEMENTS
REVIEW OF ACTIVITIESBackground to these results During the current financial year two significant transactions took place as documented below.
As was announced on SENS on 16 January 2015, the group acquired a c.85% holding in Phase Eight. Phase Eight is a UK based international women’s clothing and accessories retailer trading out of 444 outlets across the UK and Ireland as well as 17 other international markets. For this financial year, two months of Phase Eight trading (February and March 2015) has been included in these results. Accordingly, to assist analysis, where relevant, we reflect the TFG position excluding Phase Eight as well as the combined position including the impact of the acquisition.
In addition, the results of the RCS Group for the three month period (April, May and June 2014) are included as profit from discontinued operations. As reported in our interim results, the transaction in relation to TFG’s 55% interest in the RCS Group was completed with an effective date of 30 June 2014. TFG’s share of the transaction proceeds was R1,4 billion.
Nature of business The Foschini Group Limited is an investment holding company whose subsidiaries, through their retail brands – @home, @homelivingspace, Exact, Foschini, Donnaclaire, Charles & Keith, American Swiss, Mat & May, Sterns, Markham, Fabiani, G-Star, Sportscene, Totalsports, Duesouth, Fashion Express, hi and newly acquired Phase Eight – retail clothing, jewellery, cellphones, accessories, cosmetics, sporting and outdoor apparel and equipment, and homeware and furniture across diverse LSM groupings from value to upper end consumers internationally.
The group operates predominantly within the South African Common Monetary Area. Retail turnover emanating from Botswana, Nigeria, Zambia and Ghana accounts for 1,7% of the group’s turnover while the remaining international turnover emanating from Phase Eight accounts for 2,5% of the groups’ turnover.
Dress Holdco A Limited is the ultimate UK holding company of Phase Eight. Phase Eight operates through retail outlets throughout the United Kingdom and internationally as well as online.
GENERAL REVIEW The financial results are reflected in the annual financial statements on pages 14 to 79. The analysis of shareholdings and definitions are contained in the appendices on pages 80 to 82.
AUTHORISED AND ISSUED SHARE CAPITAL The group’s share buy-back programme commenced at the end of May 2001. At 31 March 2015, 1,0 (2014: 12,0) million shares are owned by a subsidiary of the company, 2,3 (2014: 2,1) million shares held by employees of TFG in terms of share incentive schemes and 2,3 (2014: 3,6) million shares owned by the share incentive trust. These have been eliminated on consolidation. For further details of authorised and issued share capital and treasury shares refer to notes 12 and 13.
At the annual general meeting of the company held on 1 September 2014, shareholders approved a specific repurchase of 11 million ordinary shares held by a wholly-owned subsidiary.
The specific repurchase was implemented on 19 September 2014 at an average price of R117,39 per share, whereafter the shares were cancelled and restored to authorised share capital. On 21 October 2014, 11,0 million shares were delisted reducing the total shares in issue from 222 005 054 shares to 211 005 054 shares.
DISTRIBUTIONSInterim ordinary The directors declared an interim ordinary dividend of 263,0 (2014: 243,0) cents per ordinary share, which was paid on Monday, 5 January 2015 to ordinary shareholders recorded in the books of the company at the close of business on Friday, 2 January 2015.
DIRECTORS' REPORT FOR THE YEAR ENDED 31 MARCH 2015
TFG / 2015 ANNUAL FINANCIAL STATEMENTS 3
Final ordinaryThe directors declared a final scrip distribution with a cash dividend alternative of 325,0 (2014: 293,0) cents per ordinary share, payable on Monday, 20 July 2015 to ordinary shareholders recorded in the books of the company at the close of business on Friday, 10 July 2015.
Preference The company paid the following dividends to holders of 6,5% cumulative preference shares:
22 September 2014 – R13 000 (23 September 2013 – R13 000)
23 March 2015 – R13 000 (24 March 2014 – R13 000)
DIRECTORS The names of the company’s directors at the year-end are:
Independent non-executive directors D M Nurek (resigned as chairman and from the board 19 June 2015)
M Lewis (appointed as chairman 19 June 2015)
Prof. F Abrahams
S E Abrahams
B L M Makgabo-Fiskerstrand
E Oblowitz
N V Simamane
Non-executive director D Friedland
Executive directors A D Murray (CEO)
R Stein (CFO)
P S Meiring (Group director – TFG Financial Services)
There were no changes in directors during the current year. On 28 May 2015, Mr Lewis was appointed as deputy chairman and as chairman on 19 June 2015 following Mr D M Nurek’s resignation from the board. Whilst effective after the date of the report, it is noted that Mr R Stein and P S Meiring will retire at the end of June 2015 and will therefore no longer serve as executive directors. Mr R Stein will, however, remain on the board in a non-executive capacity following his retirement.
The following directors retire by rotation in terms of the memorandum of incorporation (“MOI”) but, being eligible, offer themselves for re-election as directors:
E Oblowitz
N V Simamane
B L M Makgabo-Fiskerstrand
In addition, the current CFO-elect Mr A Thunström will be proposed for election as an executive director.
For details of directors’ interests in the company’s issued shares, refer to note 12. Details of directors’ remuneration are set out in note 37.
4 TFG / 2015 ANNUAL FINANCIAL STATEMENTS
AUDIT COMMITTEE The directors confirm that the audit committee has addressed the specific responsibilities required in terms of section 94(7) of the Companies Act No. 71 of 2008. Further details are contained within the Board Audit Committee Report.
SUBSIDIARIES The names of, and certain financial information relating to, the company’s key subsidiaries appear in note 2 of the company annual financial statements.
SPECIAL RESOLUTIONS On 1 September 2014 shareholders authorised the company to acquire the treasury shares held by Foschini Stores (Pty) Ltd by way of a specific repurchase and thereafter to cancel these shares in accordance with the memorandum of incorporation and the applicable provisions of the Companies Act No. 71 of 2008 and the JSE Listings Requirements.
On 1 September 2014 shareholders approved the remuneration to be paid to non-executive directors for the year ending 31 March 2015, and further approved that fees paid to directors from 1 April 2015 until the following annual general meeting on 1 September 2015 be authorised by the remuneration committee subject to the provision that the annual increase may not be more than 2% in excess of CPI.
On 1 September 2014 shareholders renewed the approval, as a general authority, of the acquisition by the company or any of its subsidiaries of the issued ordinary shares of the company, valid until the next annual general meeting. At the next annual general meeting to be held on 1 September 2015, shareholders will be asked to renew this general authority, as set out in the notice of annual general meeting.
On 1 September 2014 shareholders also approved that the company may provide direct or indirect financial assistance to a related or interrelated company or corporation provided that such financial assistance may only be provided within two years from the date of the adoption of the special resolution and subject further to sections 44 and 45 of the Companies Act No. 71 of 2008 and the JSE Listings Requirements.
SPECIAL RESOLUTIONS PASSED BY SUBSIDIARY COMPANIES No special resolutions of any significance were passed during the year under review.
STAFF SHARE INCENTIVE AND OPTION SCHEMES Details are reflected in note 36.
SUBSEQUENT EVENTS Details are reflected in note 26.
GOING CONCERN These financial statements have been prepared on the going concern basis.
The board has performed a review of the company and its subsidiaries’ ability to continue trading as going concerns in the foreseeable future and, based on this review, the directors are satisfied that the group is a going concern and have continued to adopt the going concern basis in preparing the financial statements.
DIRECTORS' REPORT (CONTINUED)FOR THE YEAR ENDED 31 MARCH 2015

TFG / 2015 ANNUAL FINANCIAL STATEMENTS 5
I certify that The Foschini Group Limited has lodged with the Companies and Intellectual Property Commission (CIPC) all returns as required by a public company in terms of the Companies Act of South Africa, and that all such returns appear to be true, correct and up to date.
D Sheard Company Secretary
29 June 2015
COMPANY SECRETARY’S CERTIFICATE FOR THE YEAR ENDED 31 MARCH 2015
6 TFG / 2015 ANNUAL FINANCIAL STATEMENTS
The audit committee is pleased to present its report for the financial year ended 31 March 2015 to the shareholders of TFG.
This report is in compliance with the requirements of the Companies Act of South Africa No. 71 of 2008 (the Act) and the King Code of Governance for South Africa 2009 (King III).
AUDIT COMMITTEE MANDATEThe committee is governed by a formal audit committee charter that has recently been reviewed and which incorporates all the requirements of the Act. This charter guides the committee in terms of its objectives, authority and responsibilities, both statutory and those assigned by the board.
The audit committee recognises its important role as part of the risk management and corporate governance processes and procedures of TFG.
DUTIES OF THE COMMITTEEThe duties of the audit committee are, inter alia:
STATUTORY DUTIES AS PRESCRIBED IN THE ACTGeneral• The committee will receive and deal appropriately with any concerns or complaints (whether internal or
external) or on its own initiative relating to the accounting practices and internal audit of TFG; the content or auditing of TFG’s financial statements; the internal financial controls of TFG; or any related matter.
External auditors• to evaluate the independence, effectiveness, and performance of the external auditors and obtain assurance
from the auditors that adequate accounting records are being maintained and appropriate accounting policies are in place which have been consistently applied;
• to evaluate the appointment of the external auditors on an annual basis and to ensure that such appointment is in terms of the provisions of the Act and any other legislation;
• to approve the audit fee and fees in respect of any non-audit services; and
• to determine the nature and extent of any non-audit services that the auditor may provide to the group and pre-approve any proposed agreements for non-audit services.
Financial results• to make submissions to the board on any matter concerning the group’s accounting policies, financial control,
records and reporting; and
• to provide as part of the integrated annual report, a report by the audit committee.
DUTIES ASSIGNED AND DELEGATED BY THE BOARDGeneral• to ensure that the respective roles and functions of external audit and internal audit are sufficiently clarified and
co-ordinated and that the combined assurance received is appropriate to address all significant risks; and
• to assist the board in carrying out its risk management and IT responsibilities.
External auditors• to consider and respond to any questions from the main board and shareholders regarding the resignation or
dismissal of the external auditor, if necessary;
• to review and approve the external audit plan; and
• to ensure that the scope of the external audit has no limitations imposed by management and that there is no impairment on its independence.
BOARD AUDIT COMMITTEE REPORTFOR THE YEAR ENDED 31 MARCH 2015
TFG / 2015 ANNUAL FINANCIAL STATEMENTS 7
Internal control and internal audit• to review the effectiveness of the group’s systems of internal control, including internal financial control and risk
management, and to ensure that effective internal control systems are maintained;
• to ensure that written representations on internal control are submitted to the board annually by all divisional managing directors and general managers (these being representations that provide assurance on the adequacy and effectiveness of the group’s systems of internal control);
• to monitor and supervise the effective functioning and performance of the internal auditors;
• to review and approve the annual internal audit plan and the internal audit charter; and
• to ensure that the scope of the internal audit function has no limitations imposed by management and that there is no impairment on its independence.
Finance function• to consider the appropriateness of the expertise and experience of the financial director; and
• to satisfy itself of the expertise, resources and experience of the finance function.
Financial results• to consider any accounting treatments, significant unusual transactions, or accounting judgements that could be
contentious;
• to review management’s assessment of going concern and make a recommendation to the board that the going concern concept be adopted by the group; and
• to review the integrated annual report, as well as annual financial statements, interim reports, preliminary reports or other financial information prior to submission and approval by the board.
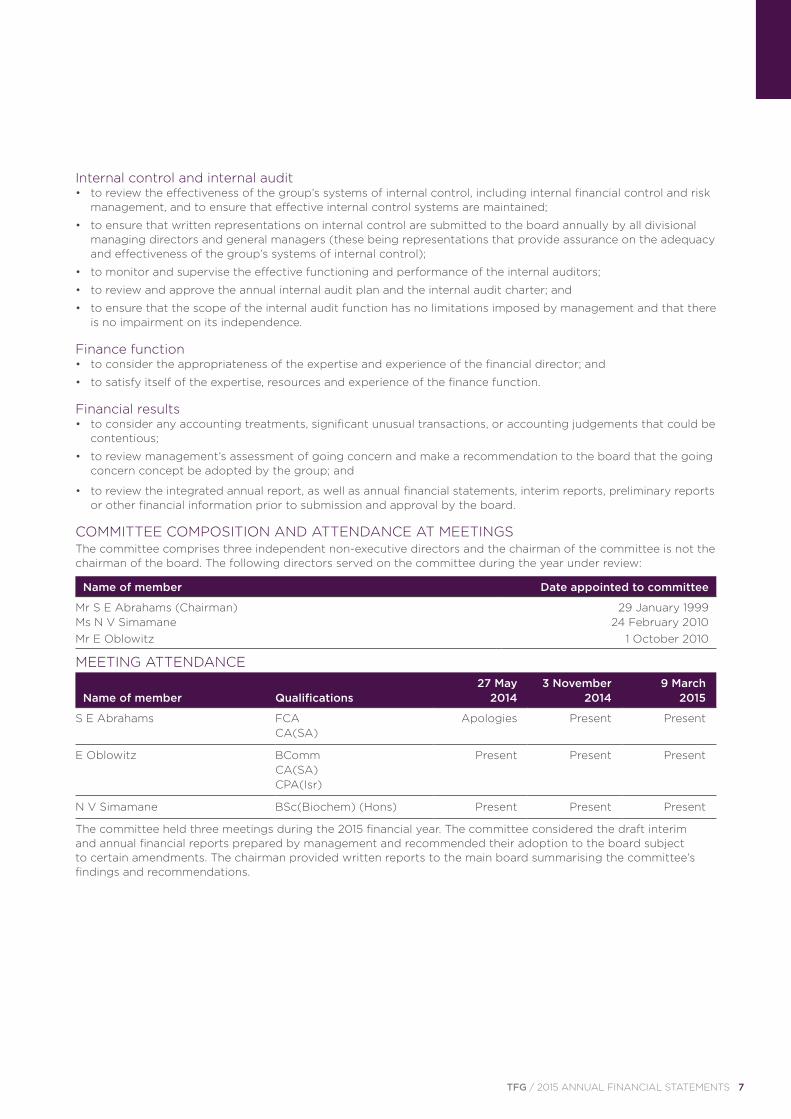
COMMITTEE COMPOSITION AND ATTENDANCE AT MEETINGSThe committee comprises three independent non-executive directors and the chairman of the committee is not the chairman of the board. The following directors served on the committee during the year under review:
Name of member Date appointed to committee
Mr S E Abrahams (Chairman) 29 January 1999Ms N V Simamane 24 February 2010Mr E Oblowitz 1 October 2010
MEETING ATTENDANCE 27 May 3 November 9 March
Name of member Qualifications 2014 2014 2015
S E Abrahams FCA Apologies Present PresentCA(SA)
E Oblowitz BComm Present Present PresentCA(SA) CPA(Isr)
N V Simamane BSc(Biochem) (Hons) Present Present Present
The committee held three meetings during the 2015 financial year. The committee considered the draft interim and annual financial reports prepared by management and recommended their adoption to the board subject to certain amendments. The chairman provided written reports to the main board summarising the committee’s findings and recommendations.
8 TFG / 2015 ANNUAL FINANCIAL STATEMENTS
Details of fees paid to committee members appear in note 37 of the annual financial statements.
The chief executive officer, the chief financial officer, the head of Internal Audit, the company secretary and the external audit partner and staff attend meetings at the regular invitation of the committee. David Friedland, a non-executive director also attends the meetings at the invitation of the committee. In addition, other members of executive management are invited to attend various meetings on an ad-hoc invitational basis. The chairman of the group has an open invitation to attend meetings of the audit committee.
COMMITTEE EVALUATIONThe annual board evaluation (which includes an evaluation of all sub-committees) is due to take place shortly after the issue of this report. This evaluation will formally assess the performance of audit committee members during the past year. The chairman of the committee has, however, performed an informal assessment and is satisfied with the performance of the members of the committee. Members have also been assessed in terms of the independence requirements of King III and the Companies Act. It is noted that all members of the committee continue to meet the independence requirements.
RE-ELECTION OF COMMITTEE MEMBERS The following members have made themselves available for re-election to the committee. Such re-election has been recommended by the nomination committee and will be proposed to shareholders at the upcoming annual general meeting:
S E AbrahamsE OblowitzN V Simamane
COMMITTEE FUNCTIONING The committee typically meets three times a year with the main focus of each respective meeting being as follows:
• consideration of control risks and risk management (typically in February/March each year);
• approval of annual results (typically in May each year); and
• approval of interim results (typically in November each year).
Independently of management, members of the committee meet separately with the head of internal audit and the external auditors respectively. The head of internal audit reports directly to the audit committee.
Meeting dates and topics are agreed well in advance each year. Each meeting is preceded by the distribution to each attendee of an audit committee pack, inter alia, comprising:
• detailed agenda;
• minutes of previous meeting;
• report by the external auditors; and
• written reports by management including:
– compliance and legal;
– internal audit;
– loss statistics; and
– fraud.
The chairman of this committee has an open invitation to attend meetings of the risk committee.
BOARD AUDIT COMMITTEE REPORT (CONTINUED)FOR THE YEAR ENDED 31 MARCH 2015
TFG / 2015 ANNUAL FINANCIAL STATEMENTS 9
SPECIFIC RESPONSIBILITIESThe committee confirms that it has carried out its functions in terms of the board audit committee charter and section 94 (7) of the Companies Act, No. 71 of 2008 by:
• confirming the nomination of KPMG Inc. as the group’s registered auditor for the year ending 31 March 2016 and being satisfied that they are independent of the company;
• approving the terms of engagement and fees to be paid to KPMG Inc.;
• ensuring that the appointment of KPMG Inc. complies with the provisions of the Companies Act;
• determining the nature and extent of any non-audit services which the external auditors provide to the company, or a related company;
• pre-approving any proposed agreement with KPMG Inc. for the provision of any non-audit services;
• preparing this report for inclusion in the annual financial statements as well as in the integrated annual report;
• receiving and dealing appropriately with any relevant concerns or complaints;
• making submissions to the board on any matter concerning the company’s accounting policies, financial control, records and reporting; and
• performing such other oversight functions as may be determined by the board.
INTERNAL FINANCIAL CONTROL AND INTERNAL AUDITBased on the assessment of the system of internal financial controls conducted by Internal Audit, as well as information and explanations given by management and discussions held with the external auditor on the results of their audit, the committee is of the opinion that TFG’s system of internal financial controls is effective and forms a basis for the preparation of reliable financial statements in respect of the year under review.
In addition, during the 2015 financial year, the committee:
• were not made aware of any:
– material breaches of any laws or legislation; or
– material breach of internal controls or procedures.
The committee is pleased to report that an independent quality review of the internal audit function was recently conducted by Deloitte & Touche with the outcome of this review reflecting very favourably on the overall quality of TFG’s internal audit function. The committee commends the Head of Internal Audit and his team on this outcome.
RISK MANAGEMENTWhilst the board is ultimately responsible for the maintenance of an effective risk management process, the committee, together with the risk committee, assist the board in assessing the adequacy of the risk management process. The chairman of this committee has an open invitation to risk committee meetings to ensure that relevant information is regularly shared. The committee fulfils an oversight role regarding financial reporting risks, internal financial controls, fraud risk as it relates to financial reporting and information technology risks as they relate to financial reporting.
During the course of the 2015 financial year, the charters of both the audit committee and the risk committee were reviewed to ensure that there was clarity as to the role of each committee in the risk management process. This has resulted in more focussed and appropriate risk reporting to both committees. In addition, the audit committee considered the risk management approach as well as key control risks, and believe that the approach is relevant and that all key control risks are being adequately addressed by management.
Further detail on the risk management approach and process is included in the Risk report which appears elsewhere in this report.
10 TFG / 2015 ANNUAL FINANCIAL STATEMENTS
RCS GROUPAs reported last year, the audit committee has retained its oversight role in respect of the RCS disposal transaction and continues to receive regular updates on the few outstanding issues.
PHASE EIGHTDuring the year, the group acquired Poppy Holdco Limited trading as Phase Eight. The chairman of this committee as well as one of its members served on the board sub-committee which was constituted to evaluate the acquisition and make a recommendation to the board. Due consideration was therefore given to matters of concern to this committee, such as the conversion from UK GAAP to IFRS, as well as the maturity of the various governance structures within Phase Eight. The governance, compliance, internal audit and risk management functions of Phase Eight are less mature than the processes within TFG and this committee is therefore ensuring that management works towards aligning these over a period of time.
In addition, the audit committee received detailed reports from senior executive management on, inter alia, the extensive due diligence process that was undertaken prior to the acquisition of Phase Eight. This included consultation with lawyers and accountants to ensure appropriate cover of legal risks and complex accounting matters which emanated from the transaction.
THE FINANCIAL AND BUSINESS ENVIRONMENT As presented in the 2014 integrated annual report, the concerns expressed in this report relating to the financial and business environment remain relevant and accordingly are once again presented in this report.
The concern of the ability of credit retail customers to service their debts, given the tightening of credit facilities made available to these customers continued throughout the year under review. TFG recognised the need to watch credit trends carefully and, as anticipated, bad debts continued to escalate during the year under review. Since the audit committee identified this issue as the single most significant financial risk facing TFG, considerable time was expended in questioning, assessing and evaluating the year end carrying value of receivables. The audit committee interrogated those charged with the management and administration of the various categories of accounts customers. This overview included the external auditors who independently reviewed the adequacy of the provisioning/allowance applied and therefore the efficacy of the year end balances. From our perspective, I can report that it is our view that management has made adequate provision for those of our customers who have and are experiencing credit pressures.
The other major business associated risk which is drawn to the attention of all stakeholders is the ever increasing volumes of fraud and IT associated activity, including cyber-crime which continues to escalate in a significant manner. Management and IT management are actively addressing controls to counter fraud and cyber-crime risks. Regular reports are made to both the audit and risk committees on progress. Cyber-crime is certainly not a TFG specific matter, it is of concern to all entities throughout the world.
The audit committee noted the continued increased trend in losses emanating from fraud related activity, burglaries, armed robberies etc. We received regular reports analysing the losses and noted management vigilance in attempting to alleviate losses from these activities.
In addition, as required, by King III we reviewed the levels of corporate governance in relation to the IT support division.
Although we remain concerned by the increased levels of crime-related losses being incurred, we believe that the appropriate level of senior management time and effort is being devoted to bolstering and strengthening the control environment. Although senior IT skilled resources remains a scarce commodity in South Africa, there are currently no critical IT vacancies and our committee believes that TFG management is approaching recruitment of key positions as a high priority.
BOARD AUDIT COMMITTEE REPORT (CONTINUED)FOR THE YEAR ENDED 31 MARCH 2015
TFG / 2015 ANNUAL FINANCIAL STATEMENTS 11
EXTERNAL AUDITORS The group’s external auditors are KPMG Inc. and the designated auditor is Mr H du Plessis.
KPMG Inc. is afforded unrestricted access to the group’s records and management and present any significant issues arising from the annual audit to the committee. In addition, Mr H du Plessis, where necessary, raises matters of concern directly with the chairman of the committee.
The committee gave due consideration to the independence of the external auditors and is satisfied that KPMG Inc. is independent of the group and management and therefore able to express an independent opinion on the group’s annual financial statements.
The committee has nominated, for approval at the annual general meeting, KPMG Inc. as the external auditor for the 2016 financial year, having satisfied itself that the audit firm is accredited by the JSE. As Mr H du Plessis, the designated auditor, is required to rotate in terms of Companies Act, No. 71 of 2008, the committee has nominated Mr P Farrand as the designated auditor for the 2016 financial year, having satisfied itself that the designated auditor is accredited by the JSE.
FINANCIAL STATEMENTS The committee has reviewed the financial statements of the company and the group and is satisfied that they comply with International Financial Reporting Standards (IFRS) and the requirements of the Companies Act of South Africa.
In addition, the committee has reviewed management’s assessment of going concern and recommended to the board that the going concern concept be adopted by TFG.
INTEGRATED ANNUAL REPORT The committee fulfils an oversight role in respect of TFG’s integrated annual report. In this regard the committee gave due consideration to the need for assurance on the sustainability information contained in this report and concluded that the obtaining of independent assurance would not be beneficial to stakeholders.
The committee has considered the sustainability information as disclosed in the integrated annual report and has assessed its consistency with the annual financial statements and is satisfied that the sustainability information is in no way contradictory to that disclosed in the annual financial statements.
EXPERTISE OF FINANCIAL DIRECTOR AND FINANCE FUNCTIONThe committee considers the appropriateness of the expertise and experience of the financial director and finance function on an annual basis.
In respect of the above requirement, the committee believes that Mr R Stein, the chief financial officer, possesses the appropriate expertise and experience to meet his responsibilities in that position. As Mr R Stein is retiring at the end of June 2015, members of the committee were involved in the selection committee regarding the appointment of his successor. The committee is satisfied that Mr A Thunström, CFO-elect, possesses the necessary expertise and experience to fulfil the role of finance director in future.
The committee further considers that the expertise, resources and experience of the finance function are appropriate based on the nature, complexity and size of the group’s operations.
APPROVAL The committee recommended the approval of the annual financial statements and the integrated annual report to the board.
S E AbrahamsChairman: Audit committee
29 June 2015
12 TFG / 2015 ANNUAL FINANCIAL STATEMENTS
TO THE SHAREHOLDERS OF THE FOSCHINI GROUP LIMITED
We have audited the consolidated and separate financial statements of The Foschini Group Limited, which comprise the statements of financial position at 31 March 2015, and the income statements, the statements of comprehensive income, changes in equity and cash flows for the year then ended, and the notes to the financial statements, which include a summary of significant accounting policies and other explanatory notes, as set out on pages 14 to 79.
DIRECTORS' RESPONSIBILITY FOR THE FINANCIAL STATEMENTS The company’s directors are responsible for the preparation and fair presentation of these financial statements in accordance with International Financial Reporting Standards and the requirements of the Companies Act of South Africa, and for such internal control as the directors determine is necessary to enable the preparation of financial statements that are free from material misstatements, whether due to fraud or error.
AUDITOR'S RESPONSIBILITY Our responsibility is to express an opinion on these financial statements based on our audit. We conducted our audit in accordance with International Standards on Auditing. Those standards require that we comply with ethical requirements and plan and perform the audit to obtain reasonable assurance about whether the financial statements are free from material misstatement.
An audit involves performing procedures to obtain audit evidence about the amounts and disclosures in the financial statements. The procedures selected depend on the auditor’s judgement, including the assessment of the risks of material misstatement of the financial statements, whether due to fraud or error. In making those risk assessments, the auditor considers internal control relevant to the entity’s preparation and fair presentation of the financial statements in order to design audit procedures that are appropriate in the circumstances, but not for the purpose of expressing an opinion on the effectiveness of the entity’s internal control. An audit also includes evaluating the appropriateness of accounting policies used and the reasonableness of accounting estimates made by management, as well as evaluating the overall presentation of the financial statements.
We believe that the audit evidence we have obtained is sufficient and appropriate to provide a basis for our audit opinion.
OPINION In our opinion, the financial statements present fairly, in all material respects, the consolidated and separate financial position of The Foschini Group Limited at 31 March 2015, and its consolidated and separate financial performance and consolidated and separate cash flows for the year then ended in accordance with International Financial Reporting Standards and the requirements of the Companies Act of South Africa.
OTHER MATTER The supplementary schedules set out on pages 80 to 82 do not form part of the financial statements and are presented as additional information. We have not audited these schedules and accordingly we do not express an opinion on them.
OTHER REPORTS REQUIRED BY THE COMPANIES ACT As part of our audit of the financial statements for the year ended 31 March 2015, we have read the Directors’ Report, the Board Audit Committee’s Report and the Company Secretary’s Certificate for the purpose of identifying whether there are material inconsistencies between these reports and the audited financial statements. These reports are the responsibility of the respective preparers. Based on reading these reports we have not identified material inconsistencies between these reports and the audited financial statements. However, we have not audited these reports and accordingly do not express an opinion on these reports.
KPMG Inc. Registered Auditor
Per: Henry du Plessis Chartered Accountant (SA)Registered Auditor Director
8th Floor, MSC House1 Mediterranean Street Cape Town, 8001 29 June 2015
INDEPENDENT AUDITOR'S REPORT

TFG / 2015 ANNUAL FINANCIAL STATEMENTS 13
14 TFG / 2015 ANNUAL FINANCIAL STATEMENTS
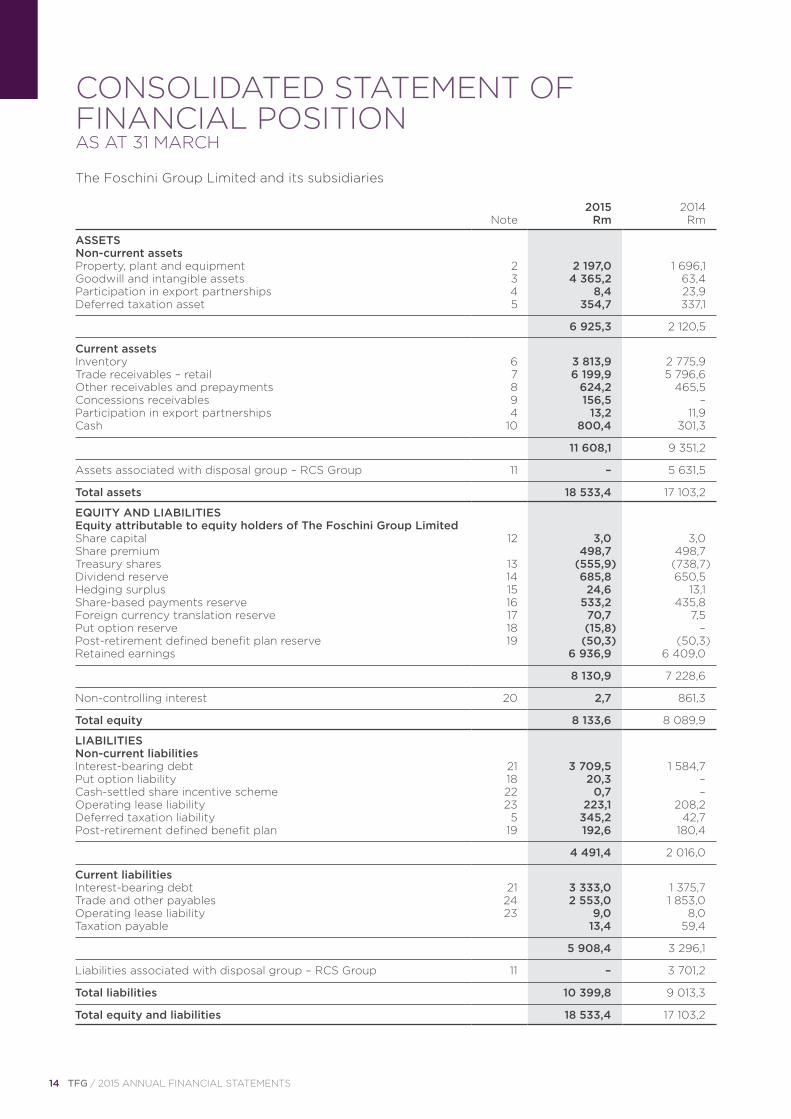
2015 2014 Note Rm Rm
ASSETS Non-current assets Property, plant and equipment 2 2 197,0 1 696,1Goodwill and intangible assets 3 4 365,2 63,4Participation in export partnerships 4 8,4 23,9Deferred taxation asset 5 354,7 337,1
6 925,3 2 120,5
Current assets Inventory 6 3 813,9 2 775,9Trade receivables – retail 7 6 199,9 5 796,6Other receivables and prepayments 8 624,2 465,5Concessions receivables 9 156,5 –Participation in export partnerships 4 13,2 11,9Cash 10 800,4 301,3
11 608,1 9 351,2
Assets associated with disposal group – RCS Group 11 – 5 631,5
Total assets 18 533,4 17 103,2
EQUITY AND LIABILITIES Equity attributable to equity holders of The Foschini Group Limited Share capital 12 3,0 3,0 Share premium 498,7 498,7 Treasury shares 13 (555,9) (738,7) Dividend reserve 14 685,8 650,5 Hedging surplus 15 24,6 13,1 Share-based payments reserve 16 533,2 435,8 Foreign currency translation reserve 17 70,7 7,5 Put option reserve 18 (15,8) –Post-retirement defined benefit plan reserve 19 (50,3) (50,3) Retained earnings 6 936,9 6 409,0
8 130,9 7 228,6
Non-controlling interest 20 2,7 861,3
Total equity 8 133,6 8 089,9
LIABILITIES Non-current liabilities Interest-bearing debt 21 3 709,5 1 584,7Put option liability 18 20,3 –Cash-settled share incentive scheme 22 0,7 –Operating lease liability 23 223,1 208,2Deferred taxation liability 5 345,2 42,7Post-retirement defined benefit plan 19 192,6 180,4
4 491,4 2 016,0
Current liabilities Interest-bearing debt 21 3 333,0 1 375,7Trade and other payables 24 2 553,0 1 853,0Operating lease liability 23 9,0 8,0Taxation payable 13,4 59,4
5 908,4 3 296,1
Liabilities associated with disposal group – RCS Group 11 – 3 701,2
Total liabilities 10 399,8 9 013,3
Total equity and liabilities 18 533,4 17 103,2
CONSOLIDATED STATEMENT OF FINANCIAL POSITIONAS AT 31 MARCH
The Foschini Group Limited and its subsidiaries
TFG / 2015 ANNUAL FINANCIAL STATEMENTS 15
The Foschini Group Limited and its subsidiaries
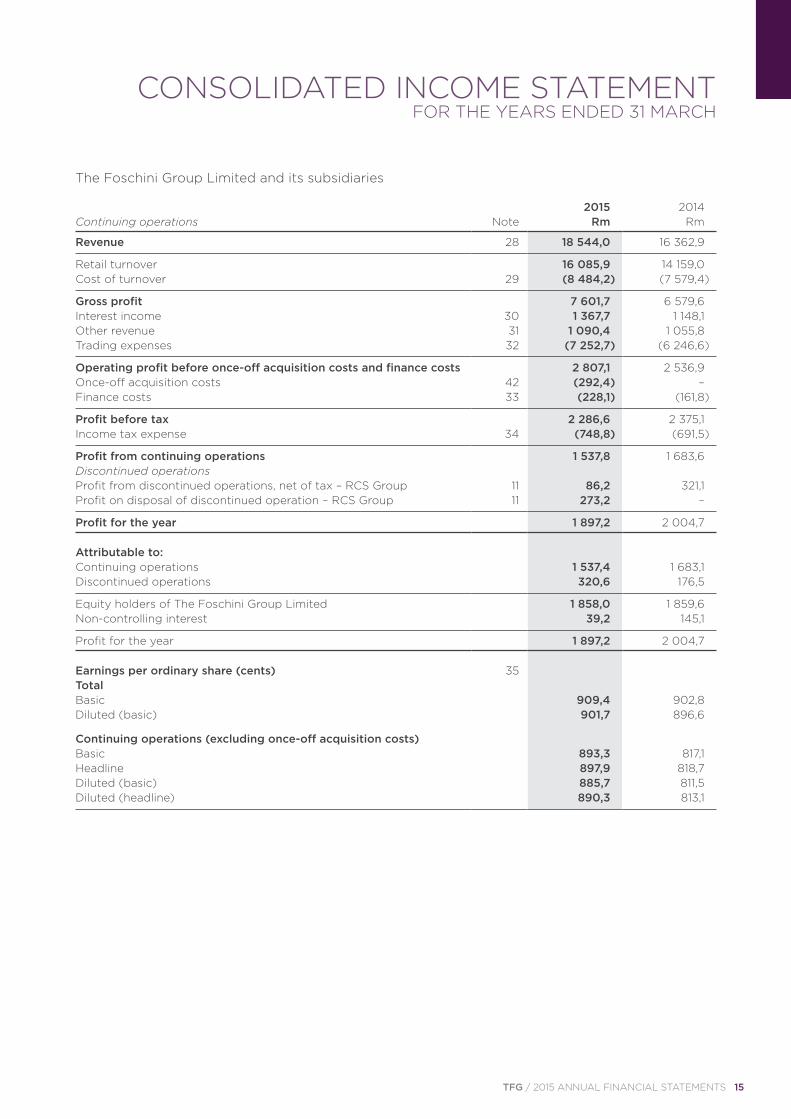
2015 2014Continuing operations Note Rm Rm
Revenue 28 18 544,0 16 362,9
Retail turnover 16 085,9 14 159,0Cost of turnover 29 (8 484,2) (7 579,4)
Gross profit 7 601,7 6 579,6Interest income 30 1 367,7 1 148,1Other revenue 31 1 090,4 1 055,8Trading expenses 32 (7 252,7) (6 246,6)
Operating profit before once-off acquisition costs and finance costs 2 807,1 2 536,9Once-off acquisition costs 42 (292,4) –Finance costs 33 (228,1) (161,8)
Profit before tax 2 286,6 2 375,1Income tax expense 34 (748,8) (691,5)
Profit from continuing operations 1 537,8 1 683,6Discontinued operations Profit from discontinued operations, net of tax – RCS Group 11 86,2 321,1Profit on disposal of discontinued operation – RCS Group 11 273,2 –
Profit for the year 1 897,2 2 004,7
Attributable to: Continuing operations 1 537,4 1 683,1Discontinued operations 320,6 176,5
Equity holders of The Foschini Group Limited 1 858,0 1 859,6Non-controlling interest 39,2 145,1
Profit for the year 1 897,2 2 004,7
Earnings per ordinary share (cents) 35 Total Basic 909,4 902,8Diluted (basic) 901,7 896,6
Continuing operations (excluding once-off acquisition costs) Basic 893,3 817,1 Headline 897,9 818,7 Diluted (basic) 885,7 811,5 Diluted (headline) 890,3 813,1
CONSOLIDATED INCOME STATEMENTFOR THE YEARS ENDED 31 MARCH

16 TFG / 2015 ANNUAL FINANCIAL STATEMENTS
2015 2014 Rm Rm
Profit for the year 1 897,2 2 004,7
Other comprehensive income: Items that will never be reclassified to profit or loss Actuarial losses on post-retirement defined benefit plan – (69,8)Deferred tax on items that will never be reclassified to profit or loss – 19,5Items that are or may be reclassified to profit or loss Movement in effective portion of changes in fair value of cash flow hedges 32,9 40,6
Continuing operations 41,1 6,9Discontinued operations (8,2) 33,7
Foreign currency translation reserve movement 66,0 (3,2)
Continuing operations 66,0 (5,0)Discontinued operations – 1,8
Deferred tax on items that are or may be reclassified to profit or loss (9,2) (11,3)
Other comprehensive income for the year, net of tax 89,7 (24,2)
Total comprehensive income for the year 1 986,9 1 980,5
Attributable to: Continuing operations 1 633,0 1 632,8Discontinued operations 317,4 191,6
Equity holders of The Foschini Group Limited 1 950,4 1 824,4Non-controlling interest 36,5 156,1
Total comprehensive income for the year 1 986,9 1 980,5
CONSOLIDATED STATEMENT OF COMPREHENSIVE INCOMEFOR THE YEARS ENDED 31 MARCH
The Foschini Group Limited and its subsidiaries
TFG / 2015 ANNUAL FINANCIAL STATEMENTS 17
The Foschini Group Limited and its subsidiaries
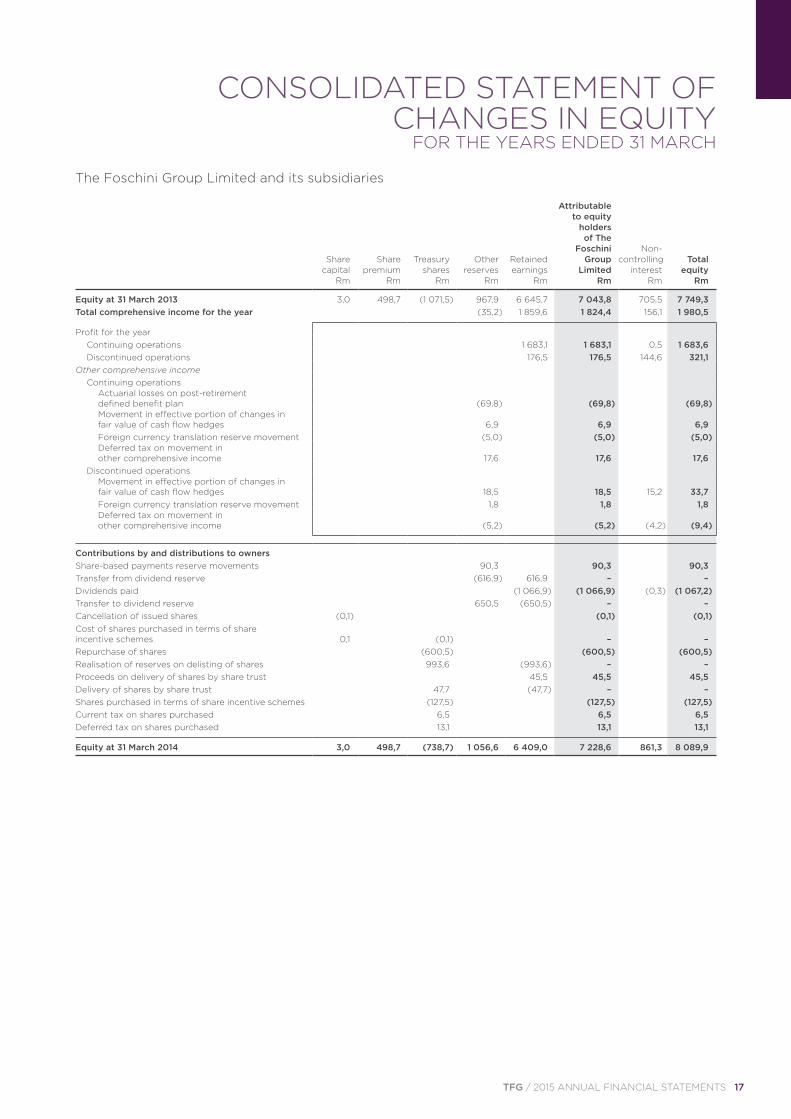
Attributable to equity holders of The Foschini Non- Share Share Treasury Other Retained Group controlling Total capital premium shares reserves earnings Limited interest equity Rm Rm Rm Rm Rm Rm Rm Rm
Equity at 31 March 2013 3,0 498,7 (1 071,5) 967,9 6 645,7 7 043,8 705,5 7 749,3Total comprehensive income for the year (35,2) 1 859,6 1 824,4 156,1 1 980,5
Profit for the year Continuing operations 1 683,1 1 683,1 0,5 1 683,6Discontinued operations 176,5 176,5 144,6 321,1
Other comprehensive income Continuing operations
Actuarial losses on post-retirement defined benefit plan (69,8) (69,8) (69,8)Movement in effective portion of changes in fair value of cash flow hedges 6,9 6,9 6,9 Foreign currency translation reserve movement (5,0) (5,0) (5,0)Deferred tax on movement in other comprehensive income 17,6 17,6 17,6
Discontinued operations Movement in effective portion of changes in fair value of cash flow hedges 18,5 18,5 15,2 33,7Foreign currency translation reserve movement 1,8 1,8 1,8Deferred tax on movement in other comprehensive income (5,2) (5,2) (4,2) (9,4)
Contributions by and distributions to owners Share-based payments reserve movements 90,3 90,3 90,3Transfer from dividend reserve (616,9) 616,9 – – Dividends paid (1 066,9) (1 066,9) (0,3) (1 067,2)Transfer to dividend reserve 650,5 (650,5) – –Cancellation of issued shares (0,1) (0,1) (0,1)Cost of shares purchased in terms of share incentive schemes 0,1 (0,1) – –Repurchase of shares (600,5) (600,5) (600,5)Realisation of reserves on delisting of shares 993,6 (993,6) – –Proceeds on delivery of shares by share trust 45,5 45,5 45,5Delivery of shares by share trust 47,7 (47,7) – – Shares purchased in terms of share incentive schemes (127,5) (127,5) (127,5)Current tax on shares purchased 6,5 6,5 6,5 Deferred tax on shares purchased 13,1 13,1 13,1
Equity at 31 March 2014 3,0 498,7 (738,7) 1 056,6 6 409,0 7 228,6 861,3 8 089,9
CONSOLIDATED STATEMENT OF CHANGES IN EQUITY
FOR THE YEARS ENDED 31 MARCH
18 TFG / 2015 ANNUAL FINANCIAL STATEMENTS
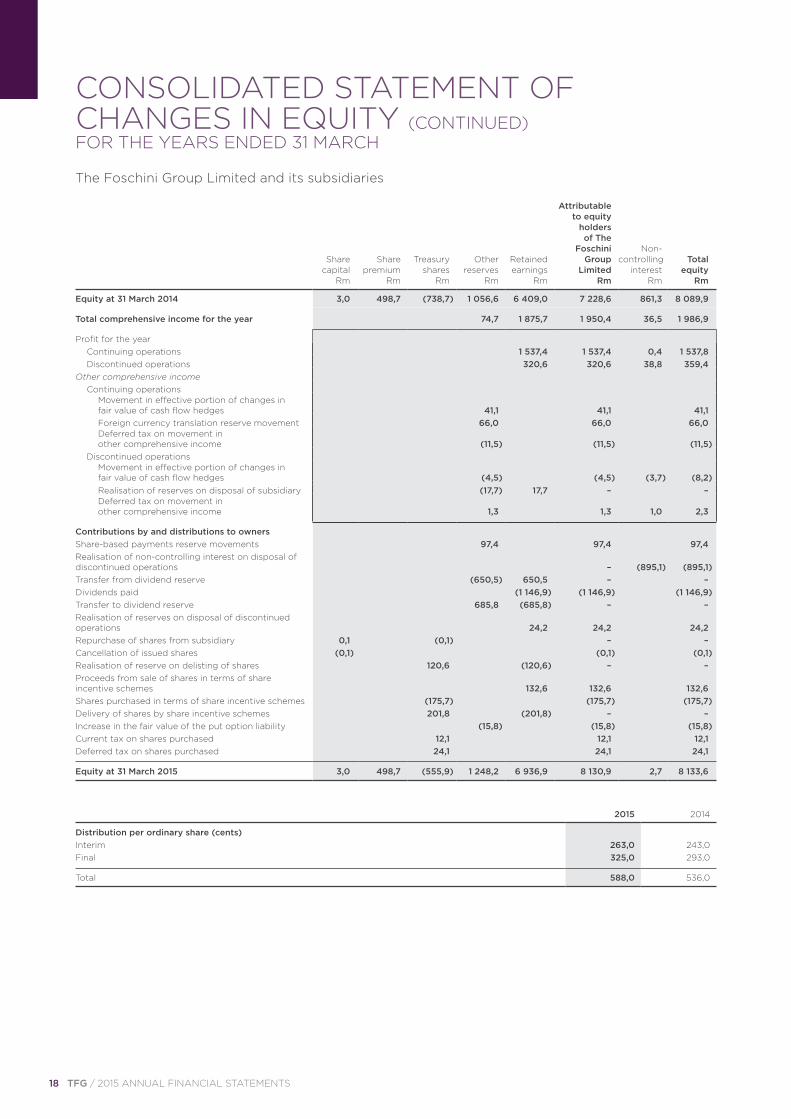
CONSOLIDATED STATEMENT OF CHANGES IN EQUITY (CONTINUED)FOR THE YEARS ENDED 31 MARCH
The Foschini Group Limited and its subsidiaries
Attributable to equity holders of The Foschini Non- Share Share Treasury Other Retained Group controlling Total capital premium shares reserves earnings Limited interest equity Rm Rm Rm Rm Rm Rm Rm Rm
Equity at 31 March 2014 3,0 498,7 (738,7) 1 056,6 6 409,0 7 228,6 861,3 8 089,9
Total comprehensive income for the year 74,7 1 875,7 1 950,4 36,5 1 986,9
Profit for the year Continuing operations 1 537,4 1 537,4 0,4 1 537,8Discontinued operations 320,6 320,6 38,8 359,4
Other comprehensive income Continuing operations
Movement in effective portion of changes in fair value of cash flow hedges 41,1 41,1 41,1Foreign currency translation reserve movement 66,0 66,0 66,0Deferred tax on movement in other comprehensive income (11,5) (11,5) (11,5)
Discontinued operations Movement in effective portion of changes in fair value of cash flow hedges (4,5) (4,5) (3,7) (8,2)Realisation of reserves on disposal of subsidiary (17,7) 17,7 – –Deferred tax on movement in other comprehensive income 1,3 1,3 1,0 2,3
Contributions by and distributions to owners Share-based payments reserve movements 97,4 97,4 97,4Realisation of non-controlling interest on disposal of discontinued operations – (895,1) (895,1)Transfer from dividend reserve (650,5) 650,5 – – Dividends paid (1 146,9) (1 146,9) (1 146,9)Transfer to dividend reserve 685,8 (685,8) – –Realisation of reserves on disposal of discontinued operations 24,2 24,2 24,2Repurchase of shares from subsidiary 0,1 (0,1) – –Cancellation of issued shares (0,1) (0,1) (0,1)Realisation of reserve on delisting of shares 120,6 (120,6) – – Proceeds from sale of shares in terms of share incentive schemes 132,6 132,6 132,6Shares purchased in terms of share incentive schemes (175,7) (175,7) (175,7)Delivery of shares by share incentive schemes 201,8 (201,8) – –Increase in the fair value of the put option liability (15,8) (15,8) (15,8)Current tax on shares purchased 12,1 12,1 12,1Deferred tax on shares purchased 24,1 24,1 24,1
Equity at 31 March 2015 3,0 498,7 (555,9) 1 248,2 6 936,9 8 130,9 2,7 8 133,6
2015 2014
Distribution per ordinary share (cents) Interim 263,0 243,0 Final 325,0 293,0
Total 588,0 536,0
TFG / 2015 ANNUAL FINANCIAL STATEMENTS 19
The Foschini Group Limited and its subsidiaries
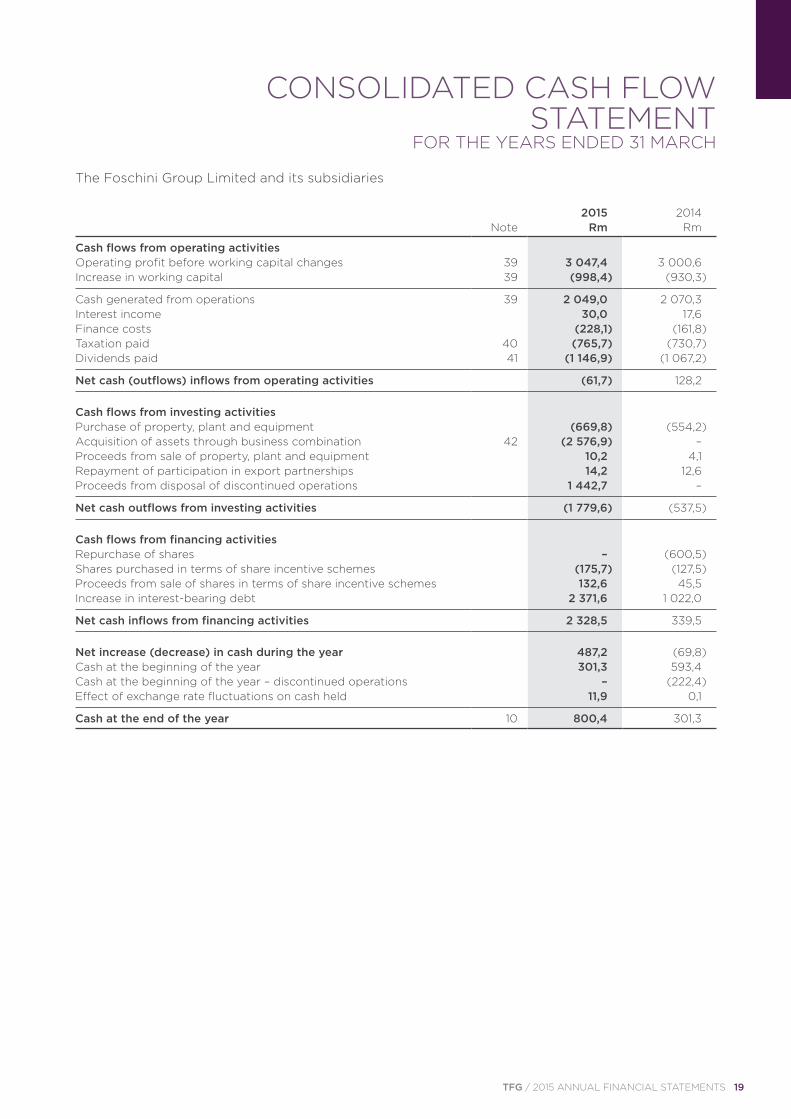
2015 2014 Note Rm Rm
Cash flows from operating activities Operating profit before working capital changes 39 3 047,4 3 000,6Increase in working capital 39 (998,4) (930,3)
Cash generated from operations 39 2 049,0 2 070,3Interest income 30,0 17,6Finance costs (228,1) (161,8)Taxation paid 40 (765,7) (730,7)Dividends paid 41 (1 146,9) (1 067,2)
Net cash (outflows) inflows from operating activities (61,7) 128,2
Cash flows from investing activities Purchase of property, plant and equipment (669,8) (554,2)Acquisition of assets through business combination 42 (2 576,9) –Proceeds from sale of property, plant and equipment 10,2 4,1Repayment of participation in export partnerships 14,2 12,6Proceeds from disposal of discontinued operations 1 442,7 –
Net cash outflows from investing activities (1 779,6) (537,5)
Cash flows from financing activities Repurchase of shares – (600,5)Shares purchased in terms of share incentive schemes (175,7) (127,5)Proceeds from sale of shares in terms of share incentive schemes 132,6 45,5Increase in interest-bearing debt 2 371,6 1 022,0
Net cash inflows from financing activities 2 328,5 339,5
Net increase (decrease) in cash during the year 487,2 (69,8)Cash at the beginning of the year 301,3 593,4Cash at the beginning of the year – discontinued operations – (222,4)Effect of exchange rate fluctuations on cash held 11,9 0,1
Cash at the end of the year 10 800,4 301,3
CONSOLIDATED CASH FLOW STATEMENT
FOR THE YEARS ENDED 31 MARCH
20 TFG / 2015 ANNUAL FINANCIAL STATEMENTS
CONSOLIDATED SEGMENTAL ANALYSISFOR THE YEARS ENDED 31 MARCH
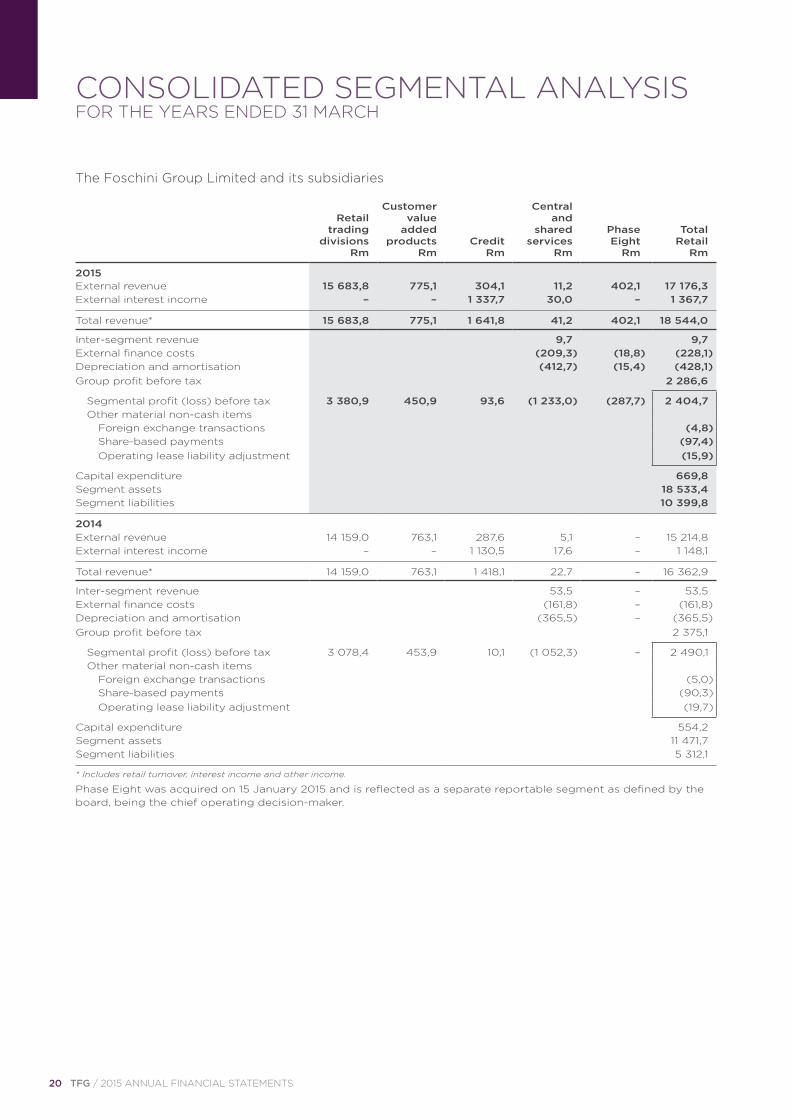
Customer Central Retail value and trading added shared Phase Total divisions products Credit services Eight Retail
Rm Rm Rm Rm Rm Rm
External revenue 15 683,8 775,1 304,1 11,2 402,1 17 176,3 External interest income – – 1 337,7 30,0 – 1 367,7
Total revenue* 15 683,8 775,1 1 641,8 41,2 402,1 18 544,0
Inter-segment revenue 9,7 9,7 External finance costs (209,3) (18,8) (228,1)Depreciation and amortisation (412,7) (15,4) (428,1)Group profit before tax 2 286,6
Segmental profit (loss) before tax 3 380,9 450,9 93,6 (1 233,0) (287,7) 2 404,7 Other material non-cash items
Foreign exchange transactions (4,8)Share-based payments (97,4)Operating lease liability adjustment (15,9)
Capital expenditure 669,8 Segment assets 18 533,4 Segment liabilities 10 399,8
2014 External revenue 14 159,0 763,1 287,6 5,1 – 15 214,8 External interest income – – 1 130,5 17,6 – 1 148,1
Total revenue* 14 159,0 763,1 1 418,1 22,7 – 16 362,9
Inter-segment revenue 53,5 – 53,5 External finance costs (161,8) – (161,8)Depreciation and amortisation (365,5) – (365,5)Group profit before tax 2 375,1
Segmental profit (loss) before tax 3 078,4 453,9 10,1 (1 052,3) – 2 490,1 Other material non-cash items
Foreign exchange transactions (5,0)Share-based payments (90,3)Operating lease liability adjustment (19,7)
Capital expenditure 554,2 Segment assets 11 471,7 Segment liabilities 5 312,1
* Includes retail turnover, interest income and other income.
Phase Eight was acquired on 15 January 2015 and is reflected as a separate reportable segment as defined by the board, being the chief operating decision-maker.
2015
The Foschini Group Limited and its subsidiaries
TFG / 2015 ANNUAL FINANCIAL STATEMENTS 21
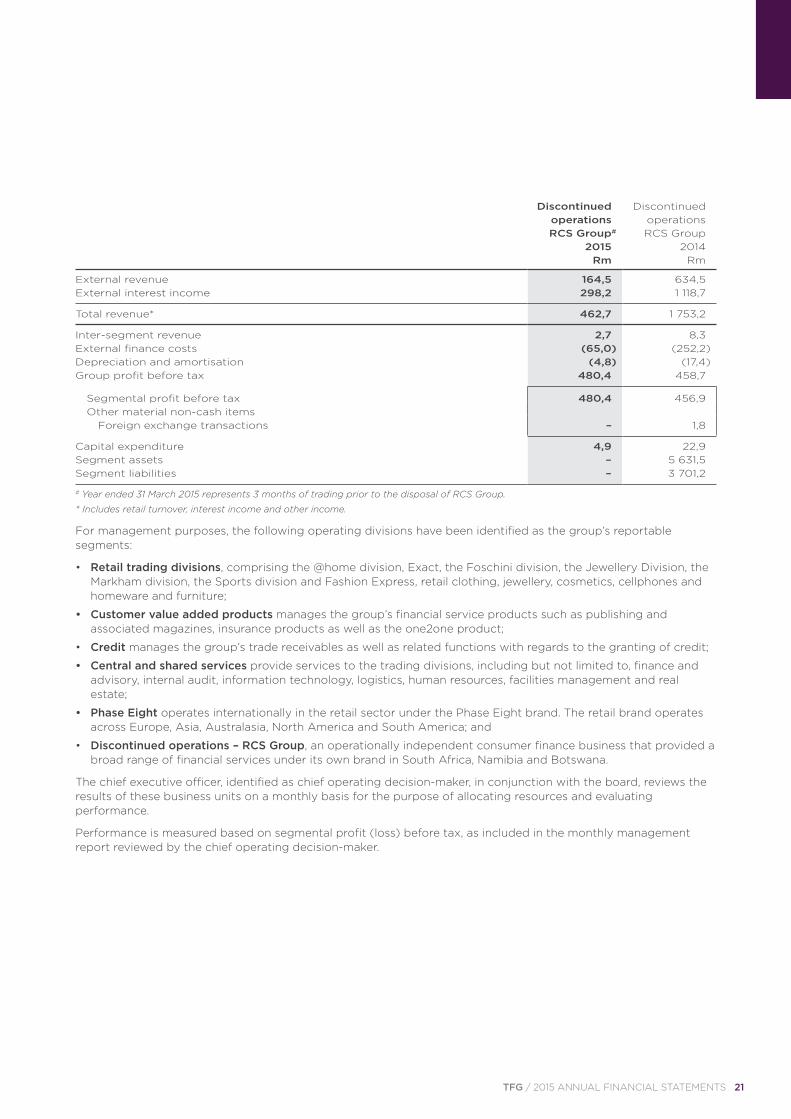
Discontinued Discontinued operations operations RCS Group# RCS Group 2015 2014 Rm Rm
External revenue 164,5 634,5 External interest income 298,2 1 118,7
Total revenue* 462,7 1 753,2
Inter-segment revenue 2,7 8,3 External finance costs (65,0) (252,2)Depreciation and amortisation (4,8) (17,4)Group profit before tax 480,4 458,7
Segmental profit before tax 480,4 456,9 Other material non-cash items
Foreign exchange transactions – 1,8
Capital expenditure 4,9 22,9 Segment assets – 5 631,5 Segment liabilities – 3 701,2
# Year ended 31 March 2015 represents 3 months of trading prior to the disposal of RCS Group.
* Includes retail turnover, interest income and other income.
For management purposes, the following operating divisions have been identified as the group’s reportable segments:
• Retail trading divisions, comprising the @home division, Exact, the Foschini division, the Jewellery Division, the Markham division, the Sports division and Fashion Express, retail clothing, jewellery, cosmetics, cellphones and homeware and furniture;
• Customer value added products manages the group’s financial service products such as publishing and associated magazines, insurance products as well as the one2one product;
• Credit manages the group’s trade receivables as well as related functions with regards to the granting of credit;
• Central and shared services provide services to the trading divisions, including but not limited to, finance and advisory, internal audit, information technology, logistics, human resources, facilities management and real estate;
• Phase Eight operates internationally in the retail sector under the Phase Eight brand. The retail brand operates across Europe, Asia, Australasia, North America and South America; and
• Discontinued operations – RCS Group, an operationally independent consumer finance business that provided a broad range of financial services under its own brand in South Africa, Namibia and Botswana.
The chief executive officer, identified as chief operating decision-maker, in conjunction with the board, reviews the results of these business units on a monthly basis for the purpose of allocating resources and evaluating performance.
Performance is measured based on segmental profit (loss) before tax, as included in the monthly management report reviewed by the chief operating decision-maker.
22 TFG / 2015 ANNUAL FINANCIAL STATEMENTS
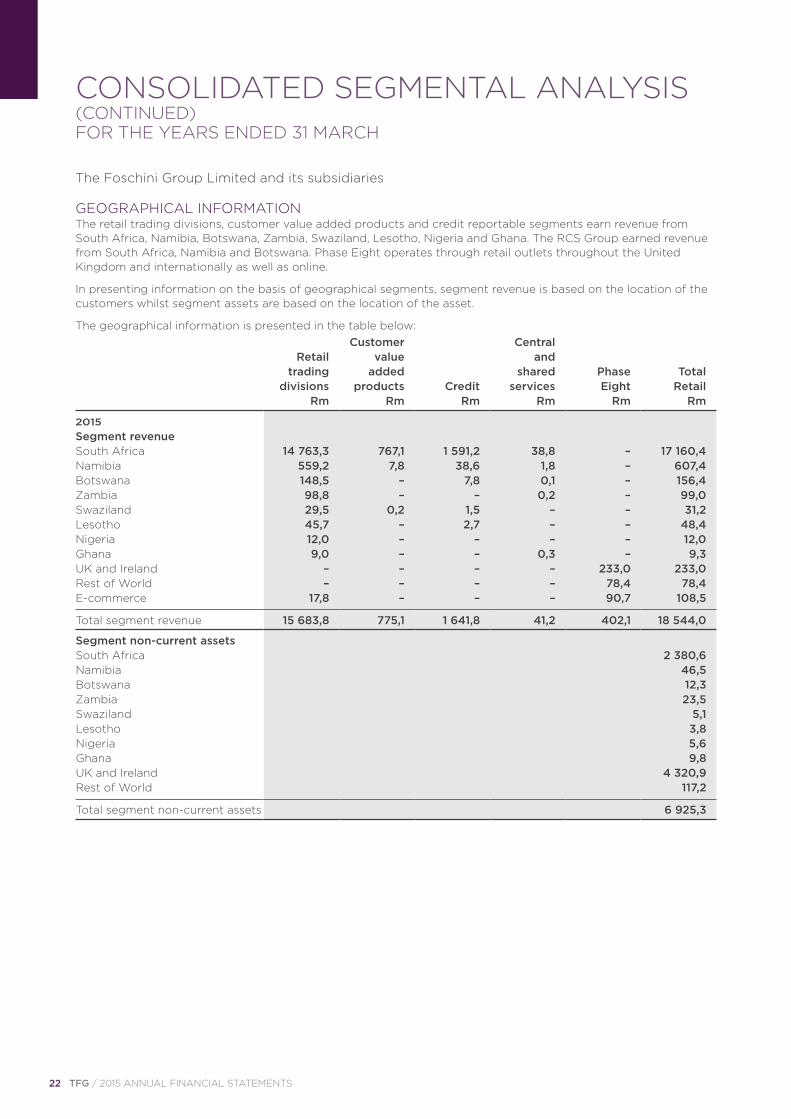
GEOGRAPHICAL INFORMATIONThe retail trading divisions, customer value added products and credit reportable segments earn revenue from South Africa, Namibia, Botswana, Zambia, Swaziland, Lesotho, Nigeria and Ghana. The RCS Group earned revenue from South Africa, Namibia and Botswana. Phase Eight operates through retail outlets throughout the United Kingdom and internationally as well as online.
In presenting information on the basis of geographical segments, segment revenue is based on the location of the customers whilst segment assets are based on the location of the asset.
The geographical information is presented in the table below: Customer Central Retail value and trading added shared Phase Total divisions products Credit services Eight Retail
Rm Rm Rm Rm Rm Rm
Segment revenue South Africa 14 763,3 767,1 1 591,2 38,8 – 17 160,4 Namibia 559,2 7,8 38,6 1,8 – 607,4 Botswana 148,5 – 7,8 0,1 – 156,4 Zambia 98,8 – – 0,2 – 99,0 Swaziland 29,5 0,2 1,5 – – 31,2 Lesotho 45,7 – 2,7 – – 48,4 Nigeria 12,0 – – – – 12,0 Ghana 9,0 – – 0,3 – 9,3 UK and Ireland – – – – 233,0 233,0 Rest of World – – – – 78,4 78,4 E-commerce 17,8 – – – 90,7 108,5
Total segment revenue 15 683,8 775,1 1 641,8 41,2 402,1 18 544,0
Segment non-current assets South Africa 2 380,6 Namibia 46,5 Botswana 12,3 Zambia 23,5 Swaziland 5,1 Lesotho 3,8 Nigeria 5,6 Ghana 9,8 UK and Ireland 4 320,9 Rest of World 117,2
Total segment non-current assets 6 925,3
CONSOLIDATED SEGMENTAL ANALYSIS (CONTINUED)FOR THE YEARS ENDED 31 MARCH
2015
The Foschini Group Limited and its subsidiaries
TFG / 2015 ANNUAL FINANCIAL STATEMENTS 23
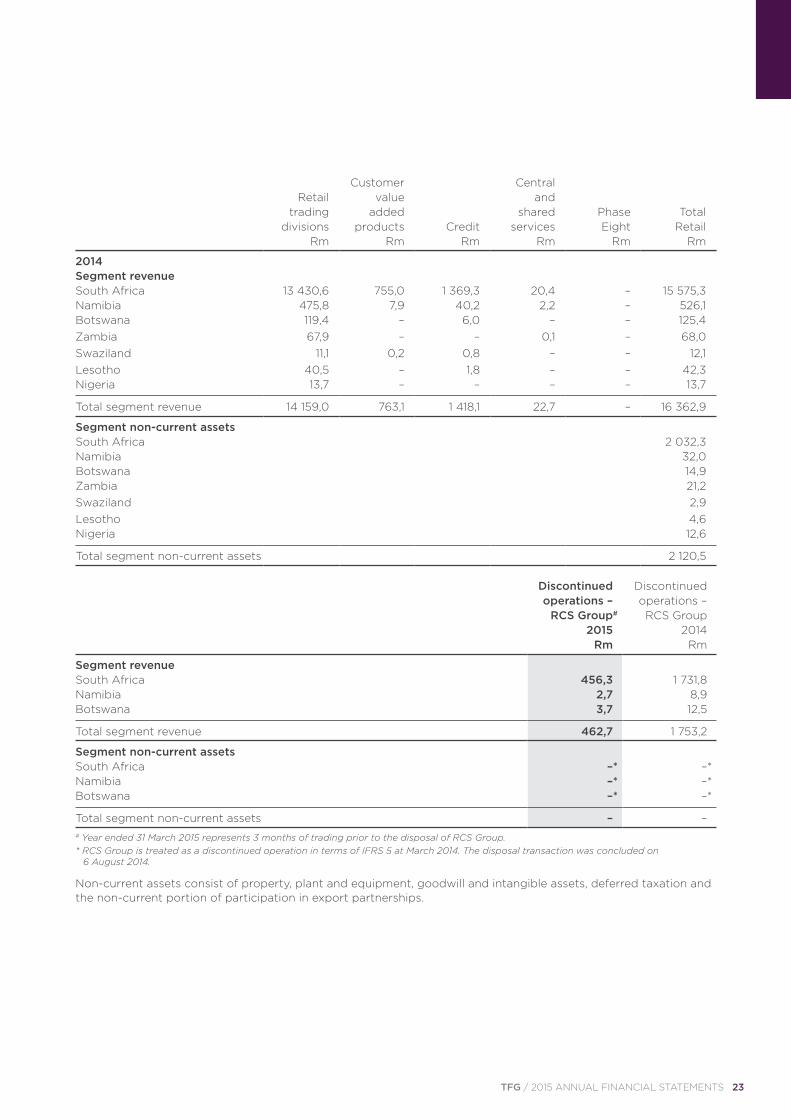
2014Segment revenue South Africa 13 430,6 755,0 1 369,3 20,4 – 15 575,3 Namibia 475,8 7,9 40,2 2,2 – 526,1 Botswana 119,4 – 6,0 – – 125,4 Zambia 67,9 – – 0,1 – 68,0 Swaziland 11,1 0,2 0,8 – – 12,1 Lesotho 40,5 – 1,8 – – 42,3 Nigeria 13,7 – – – – 13,7
Total segment revenue 14 159,0 763,1 1 418,1 22,7 – 16 362,9
Segment non-current assets South Africa 2 032,3 Namibia 32,0 Botswana 14,9 Zambia 21,2 Swaziland 2,9 Lesotho 4,6 Nigeria 12,6
Total segment non-current assets 2 120,5
Customer Central Retail value and trading added shared Phase Total divisions products Credit services Eight Retail
Rm Rm Rm Rm Rm Rm
Discontinued Discontinued operations – operations – RCS Group# RCS Group 2015 2014 Rm Rm
Segment revenue South Africa 456,3 1 731,8 Namibia 2,7 8,9 Botswana 3,7 12,5
Total segment revenue 462,7 1 753,2
Segment non-current assets South Africa –* –* Namibia –* –* Botswana –* –*
Total segment non-current assets – – # Year ended 31 March 2015 represents 3 months of trading prior to the disposal of RCS Group. * RCS Group is treated as a discontinued operation in terms of IFRS 5 at March 2014. The disposal transaction was concluded on
6 August 2014.
Non-current assets consist of property, plant and equipment, goodwill and intangible assets, deferred taxation and the non-current portion of participation in export partnerships.
24 TFG / 2015 ANNUAL FINANCIAL STATEMENTS
1. ACCOUNTING POLICIES Reporting entity The Foschini Group Limited (the “company”) is a company domiciled in South Africa. The address of the company’s registered office is Stanley Lewis Centre, 340 Voortrekker Road, Parow East, 7500, South Africa. The consolidated financial statements of the company for the year ended 31 March 2015 comprises the company and its subsidiaries (together referred to as the “group”).
Nature of businessThe Foschini Group Limited is an investment holding company whose subsidiaries, through their retail brands - @home, @homelivingspace, Exact, Foschini, Donnaclaire, Charles & Keith, American Swiss, Mat & May, Sterns, Markham, Fabiani, G-Star, Sportscene, Totalsports, Duesouth, Fashion Express, hi and newly acquired Phase Eight - retail clothing, jewellery, cellphones, accessories, cosmetics, sporting and outdoor apparel and equipment, and homeware and furniture across diverse LSM groupings from value to upper end consumers internationally.
The group operates predominantly within the South African Common Monetary Area. Retail turnover emanating from Botswana, Nigeria, Zambia and Ghana accounts for 1,7% of the group’s turnover while the remaining international turnover emanating from Phase Eight accounts for 2,5% of the groups’ turnover.
Dress Holdco A Limited is the ultimate UK holding company of Phase Eight. Phase Eight operates through retail outlets throughout the United Kingdom and internationally as well as online.
1.1 Basis of preparation Statement of compliance The consolidated financial statements are prepared in accordance with the group’s accounting policies, which comply with International Financial Reporting Standards (IFRS), The South African Institute of Chartered Accountants Financial Reporting Guides as issued by the Accounting Practice Committee, Financial Reporting Pronouncements as issued by the Financial Reporting Standards Council and disclosures required by the Companies Act No. 71 of 2008 and the JSE Listings Requirements, and have been consistently applied with those adopted in the prior year except as described in note 45.
The financial statements were authorised for issue by the directors on 29 June 2015.
Basis of measurement The consolidated financial statements are prepared on the going concern and historical cost basis, except where otherwise stated.
Functional and presentation currency The consolidated financial statements are presented in South African Rands, which is the company's functional currency, rounded to the nearest million, unless otherwise stated.
1.2 Significant judgements and estimates The preparation of financial statements in conformity with IFRS requires management to make judgements, estimates and assumptions that affect the application of accounting policies and reported amounts of assets, liabilities, income and expenses. Actual results may differ from these estimates.
Estimates and underlying assumptions are reviewed on an ongoing basis. Revisions to accounting estimates are recognised in the period in which the estimates are revised and in any future periods affected.
Significant areas of estimation, uncertainty and critical judgements made in applying the group’s accounting policies, that potentially have a significant effect on the amounts recognised in the financial statements are as follows:
NOTES TO THE FINANCIAL STATEMENTS FOR THE YEARS ENDED 31 MARCH
The Foschini Group Limited and its subsidiaries
TFG / 2015 ANNUAL FINANCIAL STATEMENTS 25
Trade receivables impairment Trade receivables are disclosed net of any accumulated impairment losses. The calculation of the impairment amount is performed using the internationally recognised Markov model. The Markov model is a statistical model utilised to quantify the probability of default by analysing the observed patterns of delinquency and default over an appropriate period of time, to determine the inherent rate of bad debt in a debtors’ book. The probability of default is applied to the accounts receivable balance at statement of financial position date. Accounts that are known to have applied for debt review are fully impaired. The board of directors believe that the application of the Markov model results in trade receivable balances being measured reliably (refer to note 25).
Inventory valuation Inventory is valued at the lower of cost and net realisable value. The allowances for mark-down and obsolescence of inventory take into account historic information related to sales trends and represent the expected mark-down between the original cost and the estimated net realisable value. The net realisable value assigned to this inventory is the net selling price in the ordinary course of business less the estimated costs of completion (where applicable) less the estimated costs to make the sale (refer to note 6).
Fair value estimation The fair value of financial instruments traded in active markets is based on quoted market prices at the end of the reporting period. The quoted market price used for financial assets held by the group is the current bid price.
The fair value of financial instruments that are not traded in an active market is determined by using valuation techniques. The group uses a variety of methods and makes assumptions that are based on market conditions existing at the end of each reporting period. Quoted market prices or dealer quotes for similar instruments are used for long-term debt. Other techniques, such as estimated discounted cash flows, are used to determine fair value for the remaining financial instruments. The fair value of interest rate swaps is calculated as the present value of the estimated future cash flows. The fair value of forward foreign exchange contracts is determined using quoted forward exchange rates at the end of the reporting period.
The carrying value less impairment provision of trade receivables and payables are assumed to approximate their fair values due to their short-term nature. The fair value of non-current financial liabilities for disclosure purposes is estimated by discounting the future contractual cash flows at the current market interest rate that is available to the group for similar financial instruments (refer to note 25).
Taxation The group is subject to income tax in more than one jurisdiction. Judgement is required in determining the provision for income taxes due to the complexity of legislation. There are many transactions and calculations for which the ultimate tax determination is uncertain during the ordinary course of business. The group recognises liabilities for anticipated tax audit issues based on estimates of whether additional taxes will be due. Where the final tax outcome of these matters is different from the amounts that were initially recorded, such differences will impact the income tax and deferred tax provisions in the period in which such determination is made (refer to note 34).
Other Further estimates and judgements are made relating to residual values, useful lives and depreciation methods (refer to note 2); goodwill impairment tests (refer to note 3); estimating the fair value of share incentives granted (refer to note 36); provisions; and pension fund and employee obligations (refer to note 36).
26 TFG / 2015 ANNUAL FINANCIAL STATEMENTS
NOTES TO THE FINANCIAL STATEMENTS (CONTINUED)FOR THE YEARS ENDED 31 MARCH
The Foschini Group Limited and its subsidiaries
1.3 Consolidation Basis of consolidation The consolidated financial statements incorporate the financial statements of the company, its subsidiaries and structured entities. The financial statements of subsidiaries are prepared using consistent accounting policies.
Subsidiaries and structured entities are entities controlled by the group. The group controls an entity when it is exposed to, or has rights to, variable returns from its involvement with the entity and has the ability to use power over the entity to affect the amount of the investor’s returns. In assessing control, potential voting rights that are presently exercisable are taken into account. The financial statements of subsidiaries are included in the consolidated financial statements from the date on which control commences until the date on which control ceases. Adjustments made on changes of interest in subsidiaries are recognised in equity when control is retained, and in profit or loss when control is lost.
When the group loses control over a subsidiary, it derecognises the assets and liabilities of the subsidiary, and any related non-controlling interest (NCI) and other components of equity. Any resultant gain or loss is recognised in profit or loss. Any interest retained in the former subsidiary is measured at fair value when control is lost.
The group has established a structured entity in the form of the share incentive trust. The group does not have any direct or indirect shareholding in the share incentive trust. The results of the share incentive trust that in substance are controlled by the group, are consolidated.
All intra-group transactions, intra-group balances and any unrealised gains and losses are eliminated on consolidation.
The financial statements of foreign operations are translated in terms of the accounting policy on foreign currencies.
The company’s financial statements measure investments in subsidiaries at fair value.
Business combinations Business combinations are accounted for using the acquisition method as at the acquisition date, which is the date on which control is transferred to the group.
The acquiree's identifiable assets, liabilities and contingent liabilities which meet the recognition conditions of IFRS 3 Business Combinations are recognised at their fair values at acquisition date, except for non-current assets (or disposal group) that are classified as held-for-sale in accordance with IFRS 5 Non-current Assets Held-for-Sale and Discontinued Operations, which are recognised at the lower of carrying value and fair value less costs to sell.
The group measures goodwill at the acquisition date as:
– the fair value of the consideration transferred; plus
– the recognised amount of any non-controlling interest in the acquiree; plus
– if the business combination is achieved in stages, the fair value of the pre-existing equity interest in the acquiree; less
– the net recognised amount (generally fair value) of the identifiable assets acquired and liabilities assumed.
Where the purchase price of a highly probable future business combination has been hedged using a cash flow hedge, the effective portion of that hedge is capitalised as part of the purchase price paid when the business combination occurs.
When the excess is negative, a bargain purchase gain is recognised immediately in profit or loss.
The consideration transferred does not include amounts related to the settlement of pre-existing relationships. Such amounts generally are recognised in profit or loss.
Transaction costs, other than those associated with the issue of debt or equity securities, that the group incurs in connection with a business combination are expensed as incurred.
1. ACCOUNTING POLICIES (CONTINUED)
TFG / 2015 ANNUAL FINANCIAL STATEMENTS 27
Non-controlling interests arising from a business combination, which are present ownership interests, and entitle their holders to a proportionate share of the entity’s net assets in the event of liquidation, are measured either at the present ownership interests’ proportionate share in the recognised amounts of the acquiree’s identifiable net assets or at fair value. The treatment is an accounting policy choice but is selected for each individual business combination, and disclosed in the note for business combinations. All other components of non-controlling interests are measured at their acquisition date fair values, unless another measurement basis is required by IFRS’s. Any contingent consideration payable is measured at fair value at the acquisition date. If the contingent consideration is classified as equity, then it is not remeasured. Otherwise, subsequent changes in the fair value of the contingent consideration are recognised in profit or loss.
1.4 Cost of turnover Cost of turnover is calculated as the cost of goods sold, including all costs of purchase, costs of conversion and other costs, including costs incurred in bringing inventories to their present location and condition. Costs of purchase include royalties paid, import duties and other taxes, and transport costs. Inventory write-downs are recognised in cost of turnover.
1.5 Distributions Dividend distributions are accounted for in the period when the dividend is declared. Dividends declared on equity instruments after the reporting date, are accordingly not recognised as liabilities at the reporting date. Final dividends declared after the reporting date, are however, transferred to a dividend reserve.
1.6 Earnings per share The group presents basic and diluted earnings per share (EPS) data for its ordinary shares. Basic EPS is calculated by dividing the profit or loss attributable to ordinary shareholders of the company by the weighted average number of ordinary shares outstanding during the period. Diluted EPS is calculated by dividing the profit or loss attributable to ordinary shareholders by the weighted average number of ordinary shares outstanding, adjusted for the effects of all dilutive potential ordinary shares, which comprise share incentives granted to employees.
Headline EPS is calculated per the requirements of SAICA Circular 2/2013, using the same number of shares as the EPS and diluted EPS calculation.
1.7 Employee benefits Short-term employee benefits The cost of all short-term employee benefits is recognised during the period in which the employee renders the related service. The accruals for employee entitlements to wages, salaries, annual and sick leave represent the amount which the group has a present obligation to pay as a result of employees’ services provided to the reporting date. The short-term employee benefits are calculated at undiscounted amounts based on current wage and salary rates.
Post-employment benefits The company and its subsidiaries contribute to several defined benefit and defined contribution plans.
Defined contribution plans A defined contribution plan is a post-employment benefit plan under which an entity pays fixed contributions into a separate entity and will have no legal or constructive obligation to pay further amounts. Obligations for contributions to defined contribution pension, provident and retirement funds are recognised as an employee benefit expense in profit or loss when the related service is provided. Prepaid contributions are recognised as an asset to the extent that a cash refund or a reduction in future payments is available.
28 TFG / 2015 ANNUAL FINANCIAL STATEMENTS
NOTES TO THE FINANCIAL STATEMENTS (CONTINUED)FOR THE YEARS ENDED 31 MARCH
The Foschini Group Limited and its subsidiaries
Defined benefit plans Post-retirement medical aid benefits Where the group has an obligation to provide post-retirement medical aid benefits to employees, the group recognises the cost of these benefits in the year in which the employees render the services using the accounting methodology as described in respect of defined benefit plans below.
A defined benefit plan is a post-employment benefit plan other than a defined contribution plan. The group’s net obligation in respect of a defined benefit plan is calculated separately for each plan by estimating the amount of future benefits that employees have earned in return for their service in the current and prior periods, that benefit is discounted to determine its present value.
The Projected Unit Credit Method is used to determine the present value of the defined benefit post-retirement medical aid obligations and the related current service cost and, where applicable, past service cost. This calculation is performed by a qualified actuary. When the calculation results in a benefit to the group, the recognised asset is limited to the total of any unrecognised past service costs and the present value of economic benefits available in the form of any future refunds from the plan or reductions in future contributions to the plan. An economic benefit is available to the group if it is realisable during the life of the plan or on settlement of the plan liabilities.
Remeasurements of the net defined benefit liability, which comprise actuarial gains and losses, the return on plan assets (excluding interest) and the effect of the asset ceiling (if any, excluding interest), are recognised immediately in OCI. The group determines the net interest expense (income) on the net defined benefit liability (asset) for the period by applying the discount rate used to measure the defined benefit obligation at the beginning of the annual period to the then-net defined benefit liability (asset), taking into account any changes in the net defined benefit liability (asset) during the period as a result of contributions and benefit payments. Net interest expense and other expenses related to defined benefit plans are recognised in profit and loss.
When the benefits of a plan are changed or when a plan is curtailed, the resulting change in benefit that relates to past service or the gain or loss on curtailment is recognised immediately in profit or loss. The group recognises gains or losses on the settlement of a defined benefit plan when the settlement occurs.
Share-based payment transactions The group grants equity-settled share instruments to certain employees under an employee share plan. These share instruments will be settled in shares. The grant date fair value of options, share appreciation rights (SARs) and forfeitable shares granted to employees is recognised as an expense with a corresponding increase in equity in a separate reserve over the period that the employees become unconditionally entitled to the instruments. The fair value is measured at the grant date using a binomial option-pricing model and is spread over the vesting period. The amount recognised as an expense is adjusted to reflect the actual number of share instruments for which the related service and non-market vesting conditions are expected to be met such that the amount ultimately recognised as an expense is based on the number of share instruments that meet the related service and non-market performance conditions at vesting date. Costs incurred in administering the schemes are expensed as incurred.
Shares forfeited are sold on the open market and resultant gain or loss is recognised in equity.
Cash-settled share-based optionsCertain employees of the group receive remuneration in the form of cash-settled share options, whereby they render services in exchange for remuneration based on the EBITDA adjusted for net debt.
The fair value of the amount payable to employees in respect of the options, which are settled in cash, is recognised as an expense with a corresponding increase in liabilities, over the period during which the employees become unconditionally entitled to payment. The liability is remeasured at each reporting date and at settlement date based on the fair value of the options. Any changes in the liability are recognised in profit or loss.
1. ACCOUNTING POLICIES (CONTINUED)1.7 Employee benefits (continued)
TFG / 2015 ANNUAL FINANCIAL STATEMENTS 29
1.8 Expenses Finance costs Finance costs comprises of interest paid and payable on borrowings calculated using the effective interest method. All borrowing costs are recognised in profit or loss.
Operating lease payments Leases where the lessor retains the risks and rewards of ownership of the underlying asset are classified as operating leases. Payments made under operating leases are recognised in profit or loss on a straight-line basis over the term of the lease. Contingent rent is expensed as incurred.
1.9 Financial instruments A financial instrument is recognised when the group becomes a party to the contractual provisions of the instrument.
The group derecognises a financial asset when the contractual rights to the cash flows from the asset expire, or it transfers the rights to receive cash flows in a transaction in which substantially all of the risks and rewards of ownership of the financial asset are transferred, or it neither transfers nor retains substantially all of the risks and rewards of ownership and does not retain control over the transferred asset. Any interest in such derecognised financial asset that is created or retained by the group is recognised as a separate asset or liability.
The group derecognises a financial liability when its contractual obligations are discharged or cancelled, or expire.
Initial measurement Financial instruments are initially recognised at fair value. Subsequent to initial recognition, financial instruments are measured as described below.
Non-derivative financial instruments Non-derivative financial instruments recognised in the statement of financial position include cash, trade and other receivables, concessions receivables, participation in export partnerships, investments, interest-bearing debt and trade and other payables.
Cash Cash comprises cash on hand and amounts held on deposit at financial institutions. Cash is measured at amortised cost, based on the relevant exchange rates at reporting date. Outstanding cheques are included in trade and other payables and added back to cash balances included in the statement of financial position.
Loans and receivables Trade receivables – retail, concessions receivables and participation in export partnerships are classified as loans and receivables and are carried at amortised cost using the effective interest method, less any accumulated impairment losses. Amortised cost for the group’s participation in export partnerships is the group’s cost of original participation less principal subsequent repayments received, plus the cumulative amortisation of the difference between the initial amount and the maturity amount, less any write-down for impairment as a result of uncollectibility.
The fair value of loans and receivables determined for disclosure purposes, is estimated based on the present value of future principal and interest cash flows, discounted at the relevant market rate of interest for a similar instrument at the reporting date.
Financial liabilities measured at amortised cost Non-derivative financial liabilities including interest-bearing debt and trade and other payables are recognised at amortised cost, comprising original debt less principal payments and amortisations.
The fair value of non-derivative financial liabilities, determined for disclosure purposes, is estimated based on the present value of future principal and interest cash flows, discounted at the relevant market rate of interest for a similar instrument at the reporting date.
30 TFG / 2015 ANNUAL FINANCIAL STATEMENTS
NOTES TO THE FINANCIAL STATEMENTS (CONTINUED)FOR THE YEARS ENDED 31 MARCH
The Foschini Group Limited and its subsidiaries
Gains and losses on subsequent measurement Hedged instruments are accounted for as described in the hedge accounting policy note (refer to note 1.13).
Put option to acquire the Phase Eight group equityWhere a minority shareholder has the right to put equity instruments of a subsidiary to another group entity, the group records a financial liability for its obligation to pay the put option exercise price, and derecognises the related non-controlling interest. This recognition occurs when the put option contract is signed.
Where the put option is entered into as part of a business combination, the put option is accounted for as a financial liability and is recognised as a component of the consideration transferred. No non-controlling interest is recorded.
Subsequent to this recognition, the put option liability is re-measured as a financial liability at fair value through profit or loss, with changes in the carrying amount of the liability recorded directly in equity in the put option reserve. Changes in the carrying amount of the liability include translation differences arising from translating foreign currency put option liabilities into the presentation currency.
When the put option is exercised, the amount paid by the group will be recognised as a reduction in the put option liability. If the put option is not exercised, the put option liability is reclassified as a non-controlling interest on the date when the option lapses.
Where the put option arises as part of a share-based payment transaction, accounting policy 1.7 is applied.
Forward agreement to acquire the Phase Eight group equityWhere a minority shareholder has the right to require the group to acquire the shares of a subsidiary, the group records a financial liability for its obligation to pay the forward price, and derecognises the related non-controlling interest. This recognition occurs when the forward contract is signed.
Where the forward is entered into as part of a business combination, the forward is accounted for as a financial liability and is recognised as a component of the consideration transferred. No non-controlling interest is recorded.
Subsequent to this recognition, the forward liability is re-measured as a financial liability at fair value through profit or loss, with changes in the carrying amount of the liability recorded in profit or loss. Changes in the carrying amount of the liability include translation differences arising from translating foreign currency put option liabilities into the presentation currency.
When the forward is exercised, the amount paid by the group will be recognised as a reduction in the forward liability.
Where the forward arises as part of a share-based payment transaction, accounting policy 1.7 is applied.
Call option to acquire the Phase Eight group equityWhere the group has a call option to acquire a non-controlling Interest, this instrument is regarded as an equity instrument and is recognised directly in equity at cost. When the call option is exercised, the purchase price is recognised in equity, and the related interests of the parent and non-controlling interest are adjusted to reflect the revised interests. Any gain or loss on the transaction arising with the non-controlling interest (calculated as the purchase price paid compared to the carrying value of the non-controlling interest acquired) is recognised directly in equity.
Derivative financial instruments The group uses derivative financial instruments to hedge its exposure to foreign exchange and interest rate risks arising from operational, financing and investment activities. In accordance with its treasury policy, the group does not hold or issue derivative financial instruments for trading purposes.
1. ACCOUNTING POLICIES (CONTINUED)1.9 Financial instruments (continued)

TFG / 2015 ANNUAL FINANCIAL STATEMENTS 31
Derivative financial instruments are subsequently measured at fair value, with the gain or loss on remeasurement being recognised immediately in profit or loss. However, where derivatives qualify for hedge accounting, recognition of any gain or loss depends on the nature of the hedge (refer to note 1.13).
The fair value of interest rate swaps is the estimated amount that the group would receive or pay to terminate the swap at the reporting date, taking into account current interest rates and the current creditworthiness of the swap counterparties.
The fair value of forward exchange contracts is the present value of their forward price.
Fair value determination The fair values of any quoted investments in the company are based on current bid prices. If the market for a financial asset is not active (and for unlisted securities), the group establishes fair value by using valuation techniques. These include the use of recent arm’s length transactions, reference to other instruments that are substantially the same, discounted cash flow analysis, and option pricing models making maximum use of market inputs and relying as little as possible on entity-specific inputs.
Offset Financial assets and financial liabilities are offset and the net amount presented in the statement of financial position when the group and company has a legally enforceable right to offset the recognised amounts, and intends either to settle them on a net basis, or to realise the financial asset and settle the financial liability simultaneously.
1.10 Share capital Ordinary shares Ordinary shares are classified as equity. Incremental costs directly attributable to the issue of ordinary shares and share instruments are recognised as a deduction from equity, net of any tax effects.
Preference share capital Preference share capital is classified as equity. Dividends thereon are recognised as distributions within equity.
Treasury shares The Foschini Group Limited shares purchased and held by the company or its subsidiaries are classified as treasury shares and are presented as a deduction from equity. Dividend income on treasury shares is eliminated on consolidation. Gains or losses on disposal of treasury shares are accounted for directly in equity. Issued and weighted average numbers of shares are reduced by treasury shares for earnings per share purposes.
1.11 Foreign currencies The functional currency of each entity within the group is determined based on the currency of the primary economic environment in which that entity operates.
Foreign currency transactions Transactions in currencies other than the entity’s functional currency are translated at the rates of exchange ruling on the transaction date.
Monetary assets and liabilities denominated in such currencies are translated at the rates of exchange ruling at the reporting date.
Non-monetary assets and liabilities denominated in such currencies are measured based on historical cost and translated using the exchange rate at the date of the transaction.
Foreign currency gains and losses arising on translation are recognised in profit or loss.
Foreign operationsAs at the reporting date, the assets and liabilities of foreign operations, including goodwill and fair value adjustments arising on acquisition, are translated into the presentation currency of the group at the rate of exchange ruling at the reporting date. The income statements and statements of comprehensive income are translated at the exchange rates at the dates of the transactions or the average rates if it approximates the actual rates.
32 TFG / 2015 ANNUAL FINANCIAL STATEMENTS
NOTES TO THE FINANCIAL STATEMENTS (CONTINUED)FOR THE YEARS ENDED 31 MARCH
The Foschini Group Limited and its subsidiaries
Foreign currency differences are recognised in other comprehensive income and accumulated in the foreign currency translation reserve in equity. When a foreign operation is disposed in its entirety or partially such that control, significant influence or joint control is lost, the cumulative amount in the transaction reserve related to that foreign operation is reclassified to profit or loss as part of the gain or loss on disposal.
1.12 Goodwill For business combinations prior to 1 April 2010, goodwill represents amounts arising on acquisition of subsidiaries and is the difference between the cost of the acquisition and the group’s interest in the net fair value of the identifiable assets, liabilities and contingent liabilities of the acquiree. When the difference is negative (negative goodwill), it is recognised immediately in profit or loss.
For business combinations after 1 April 2010, goodwill is measured as the difference between the aggregate of the acquisition-date fair value of the consideration transferred, the amount of any non-controlling interest, and in a business combination achieved in stages, the acquisition-date fair value of the acquirer’s previously held interest in the acquiree, and the net of the acquisition-date amounts of identifiable assets acquired and the liabilities assumed (measured in accordance with IFRS 3). If the difference between the above is negative, the resulting gain is recognised as a bargain purchase in profit or loss.
Goodwill arising on the acquisition of subsidiaries is subsequently measured at cost less accumulated impairment losses.
Goodwill is allocated to cash-generating units and tested annually for impairment and whenever there is an indication of impairment.
1.13 Hedge accounting Changes in the fair value of a derivative hedging instrument designated as a fair value hedge are recognised in profit or loss. The hedged item is adjusted to reflect changes in its fair value in respect of the risk being hedged; the gain or loss attributable to the hedged risk is recognised in profit or loss with an adjustment to the carrying amount of the hedged item.
To the extent that they are effective, gains and losses from remeasuring the hedging instruments relating to a cash flow hedge to fair value are initially recognised directly in other comprehensive income and accumulated in the hedging reserve in equity. If the hedged firm commitment or forecast transaction results in the recognition of a non-financial asset or a liability, the cumulative amount recognised in other comprehensive income up to the transaction date is adjusted against the initial measurement of the asset or liability.
For other cash flow hedges, the cumulative amount recognised in other comprehensive income is included in profit or loss in the period when the hedged item affects profit or loss. The ineffective portion of any gain or loss is recognised immediately in profit or loss.
1.14 Impairment of assets Non-derivative financial assets A financial asset not classified as at fair value through profit or loss is assessed at each reporting date to determine whether there is any objective evidence that it is impaired. A financial asset is considered to be impaired if objective evidence indicates that one or more events have had a negative effect on the estimated future cash flows of that asset, that can be reliably measured.
An impairment loss in respect of a financial asset measured at amortised cost is calculated as the difference between its carrying amount and the present value of the estimated future cash flows discounted at the original effective interest rate.
Individually significant financial assets are tested for impairment on an individual basis. Those found not to be specifically impaired are then collectively assessed for any impairment that has been incurred but not yet individually identified. Assets that are not individually significant are collectively assessed for impairment by grouping together assets with similar risk characteristics.
All impairment losses are recognised in profit or loss.
1. ACCOUNTING POLICIES (CONTINUED)1.11 Foreign currencies (continued)
TFG / 2015 ANNUAL FINANCIAL STATEMENTS 33
An impairment loss is reversed if the reversal can be related objectively to an event occurring after the impairment loss was recognised. For financial assets measured at amortised cost the reversal is recognised in profit or loss.
Non-financial assets The carrying values of the group’s non-financial assets, other than inventories and deferred taxation assets, are reviewed at each reporting date to determine whether there is any indication of impairment. If any such indication exists then the asset’s recoverable amount is estimated. For goodwill and intangible assets that have indefinite useful lives or that are not yet available for use, the recoverable amount is estimated at each reporting date.
An impairment loss is recognised if the carrying amount of an asset or its cash-generating unit exceeds its recoverable amount. A cash-generating unit is the smallest identifiable asset group that generates cash inflows that are largely independent of the cash inflows from other assets or asset groups. Impairment losses are recognised in profit or loss. Impairment losses recognised in respect of cash-generating units are allocated first to reduce the carrying amount of any goodwill allocated to the units and then to reduce the carrying amount of the other assets in the unit (group of units) on a pro rata basis. The recoverable amount of an asset or cash-generating unit is the greater of its value in use and its fair value less costs to sell. In assessing value in use, the estimated future cash flows are discounted to their present value using a pre-tax discount rate that reflects current market assessments of the time value of money and the risks specific to the asset.
An impairment loss in respect of goodwill is not reversed. In respect of other assets, impairment losses recognised in prior periods are assessed at each reporting date for any indications that the loss has decreased or no longer exists. An impairment loss is reversed if there has been a change in the estimates used to determine the recoverable amount. An impairment loss is reversed only to the extent that the asset’s carrying amount does not exceed the carrying amount that would have been determined, net of depreciation or amortisation, if no impairment loss had been recognised.
1.15 Intangible assets (excluding goodwill) Intangible assets that are acquired by the group, which have finite useful lives, are measured at cost less accumulated amortisation and accumulated impairment losses.
Subsequent expenditure is capitalised only when it increases the future economic benefits embodied in the specific asset to which it relates. All other expenditure, including expenditure on internally generated goodwill and brands, is recognised in profit or loss as incurred.
The useful life of an intangible asset that is considered to be indefinite, is assessed annually or whenever there is an indication that the intangible asset may be impaired. Currently the Instinct, Fabiani, G-Star and Prestige trademarks are considered to have indefinite useful lives.
The acquisition of Phase Eight has resulted in an intangible asset for the Phase Eight brand which has been considered to have an indefinite useful life.
Amortisation methods, useful lives and residual values are reassessed at each reporting date.
1.16 Inventories Inventories are measured at the lower of cost and net realisable value. Net realisable value is the estimated selling price in the ordinary course of business, less the estimated costs of completion and selling expenses.
The cost of inventories is based on the first-in-first-out principle and includes expenditure incurred in acquiring the inventories and bringing them to their present location and condition. Costs may also include transfers from equity of any gain or loss on qualifying cash flow hedges of foreign currency purchases of inventories.
34 TFG / 2015 ANNUAL FINANCIAL STATEMENTS
NOTES TO THE FINANCIAL STATEMENTS (CONTINUED)FOR THE YEARS ENDED 31 MARCH
The Foschini Group Limited and its subsidiaries
1.17 Property, plant and equipment Items of property, plant and equipment are measured at cost or deemed cost less accumulated depreciation and accumulated impairment losses. The cost of self-constructed assets, including computer software, includes the cost of materials, direct labour, any other costs directly attributable to bringing the asset to a working condition for its intended use, and the costs of dismantling and removing the items and restoring the site on which they are located.
Cost includes expenditures that are directly attributable to the acquisition of the asset.
When significant parts of an item of property, plant and equipment have different useful lives, they are accounted for as separate items (major components) of property, plant and equipment.
Certain items of property, plant and equipment that had been revalued to fair value on or prior to transition to IFRS, are measured on the basis of deemed cost, being the fair value at the date of transition.
Items of property, plant and equipment are depreciated on a straight-line basis over the periods of their estimated useful lives, at the following rates per annum: Shopfittings 20% Passenger vehicle 20% Commercial vehicles 20% Computer equipment 8,33% – 33% Office equipment 4% – 33,3% Furniture and fixtures 16,67% Buildings 3,33% Computer software 8,33% – 20% Leasehold improvements over the period of leaseLand is not depreciated.
The above depreciation rates are consistent with the comparative period except for the inclusion of leasehold improvements.
Depreciation of an item of property, plant and equipment commences when the item is ready for its intended use. Depreciation methods, useful lives and residual values are reassessed at each reporting date.
The cost of replacing part of an item of property, plant and equipment is recognised in the carrying amount of the item if it is probable that the future economic benefits embodied within the part will flow to the group, and its cost can be measured reliably. The carrying amount of the replaced part is derecognised. The day-to-day servicing costs of property, plant and equipment are recognised in profit or loss as incurred.
Gains or losses on the disposal of property, plant and equipment are recognised in profit or loss. The gain or loss is the difference between the net disposal proceeds and the carrying amount of the asset.
1.18 Revenue recognition Revenue is defined as the sum of the items described in further detail below:
Retail turnover Turnover represents the invoiced value of retail sales, excluding intra-group sales and Value Added Tax. Sales are recognised when significant risks and rewards of ownership are transferred to the buyer, there is no continuing management involvement with the goods, the amount of revenue can be measured reliably, costs and possible return of goods can be measured reliably and receipt of the future economic benefits is probable.
Revenue is measured at the fair value of the consideration received or receivable, net of returns and rebates.
Interest income Interest is recognised using the effective interest rate method.
1. ACCOUNTING POLICIES (CONTINUED)
TFG / 2015 ANNUAL FINANCIAL STATEMENTS 35
Dividend income Dividends received on equity instruments are recognised in profit or loss when the right to receive payment is established.
Publishing income, collection cost recovery and mobile one2one airtime income Publishing income and mobile one2one airtime income is recognised in profit or loss over the period during which the services are provided. Publishing income and mobile one2one airtime income arises when the publishing products and mobile one2one services are provided by the group. Revenue is recognised in the month during which the service is rendered. Collection cost recovery is recognised in profit and loss as incurred.
Insurance and sundry income Insurance and sundry income is recognised in profit or loss when due and no further services are required.
1.19 Segmental reporting An operating segment is a component of the group that engages in business activities from which it may earn revenues and incur expenses, including revenues and expenses that relate to transactions with any of the group’s other components. All operating segments’ operating results are reviewed regularly by the board, identified as the chief operating decision-maker, to make decisions about resources to be allocated to the segment and assess its performance and for which internal financial information is available.
Segment results that are reported to the board include items directly attributable to a segment as well as those that can be allocated on a reasonable basis. Unallocated items comprise mainly the operating lease liability adjustment and the share-based payments reserve movements.
Segment capital expenditure is the total cost incurred during the year to acquire property, plant and equipment.
Amounts reported in the group segmental analysis are measured in accordance with IFRS.
The group is organised into six reportable operating divisions:
• Retail trading divisions, comprising the @home division, Exact, the Foschini division, the Jewellery division, the Markham division, Fashion Express division and the Sports division, retail clothing, jewellery, cosmetics, cellphones and homeware and furniture;
• Customer value added products manages the group’s financial service products such as publishing and associated magazines, insurance products as well as the mobile one2one airtime product;
• Credit manages the group’s trade receivables as well as related functions with regard to the granting of credit;
• Central and shared services provide services to the trading divisions including but not limited to finance and advisory, internal audit, information technology, logistics, human resources, facilities management and real estate;
• Phase Eight operates as a retailer of clothing, footwear, and accessories for women under the Phase Eight brand. The division operates through retail outlets in the United Kingdom and internationally as well as online; and
• Discontinued operations – RCS Group, an operationally independent consumer finance business that provided a broad range of financial services under its own brand in South Africa, Namibia and Botswana.
The group operates in South Africa, Namibia, Botswana, Zambia, Swaziland, Lesotho, Nigeria and Ghana. In presenting information on the basis of geographical segment, segment revenue is based on the location of the customers whilst segment assets are based on the location of the asset.
Inter-segment pricing is determined on an arm’s length basis.
36 TFG / 2015 ANNUAL FINANCIAL STATEMENTS
NOTES TO THE FINANCIAL STATEMENTS (CONTINUED)FOR THE YEARS ENDED 31 MARCH
The Foschini Group Limited and its subsidiaries
1.20 Taxation Income tax expense comprises current and deferred taxation.
Income tax expense is recognised in profit or loss except to the extent that it relates to a transaction that is recognised directly in other comprehensive income or in equity, in which case it is recognised in other comprehensive income or equity as appropriate.
Current tax is the expected taxation payable, calculated on the basis of taxable income for the year, using the tax rates enacted or substantively enacted at the reporting date, and any adjustment of taxation payable for previous years.
Deferred taxation is recognised in respect of temporary differences between the tax base of an asset or liability and its carrying amount. Deferred taxation is not recognised for the following temporary differences: the initial recognition of goodwill; the initial recognition of assets and liabilities in a transaction that is not a business combination and that affects neither accounting nor taxable profit or loss; and differences relating to investments in subsidiaries to the extent that the group is able to control the timing of the reversal of the temporary differences and it is probable that they probably will not reverse in the foreseeable future.
Deferred taxation is measured at the tax rates that are expected to be applied to temporary differences when they reverse, based on the laws that have been enacted or substantively enacted at the reporting date.
Deferred taxation assets and liabilities are offset if there is a legally enforceable right to offset current tax liabilities and assets, and they relate to income taxes levied by the same tax authority on the same taxable entity, or on different tax entities, but they intend to settle current tax liabilities and assets on a net basis, or their tax assets and liabilities will be realised simultaneously.
Deferred taxation assets are recognised for all deductible temporary differences and assessed losses to the extent that it is probable that taxable profit will be available against which such deductible temporary differences and assessed losses can be utilised. Deferred taxation assets are reviewed at each reporting date and are reduced to the extent that it is no longer probable that the related tax benefit will be realised.
1.21 Non-current assets held for sale Non-current assets or disposal groups comprised of assets and liabilities, are classified as held-for-sale if it is highly probable that they will be recovered primarily through sale rather than continuing use.
Non-current assets held for sale (or disposal group) are measured at the lower of its carrying amount and fair value less costs to sell. Any impairment loss on a disposal group is allocated first to goodwill, and then the remaining assets and liabilities on a pro rata basis. No loss can be allocated to inventories, financial assets, deferred tax assets and employee benefit assets, which continues to be measured in accordance with the group’s accounting policies.
A non-current asset is not depreciated (or amortised) while it is classified as held for sale, or while it is part of a disposal group classified as held for sale.
1.22 Reinsurance contracts Reinsurance contracts issued in cell captive arrangements Reinsurance contracts issued are those contracts that transfer significant insurance risk from the insurer to the group in a cell captive arrangement. The group agrees to compensate the insurer if a specified uncertain future event adversely affects the underwriting business carried out by the insurer in the cell captive arrangement.
Reinsurance premium revenue Reinsurance revenue consists of premiums received or receivable from the insurer. Reinsurance premiums are recognised on a straight-line basis over the period of the contract as insurance risk is covered by the group evenly throughout each year.
1. ACCOUNTING POLICIES (CONTINUED)
TFG / 2015 ANNUAL FINANCIAL STATEMENTS 37
Claims Claims incurred and reported and the movement in the provisions for claims incurred but not reported are recognised in profit or loss when the loss events occur. Claims incurred but not yet reported are estimated for compensation payable to the insurer and are recognised in profit or loss.
Underwriting fees Underwriting fees are recognised in profit or loss when services are received from the insurer.
Amount receivable from insurer The amount receivable from the insurer is initially recognised as the amount paid for the ordinary shares issued by the insurer to the group.
The amount receivable from the insurer represents the right to the residual interest in the cell captive and is after initial recognition measured based on the net asset position of the cell captive at the end of the reporting period. This amount is reduced by dividends declared by the insurer on the ordinary shares held by the group.
The amount receivable from the insurer is assessed for impairment at each reporting period. If there is objective evidence that the amount receivable is impaired, the carrying amount of the reinsurance asset is reduced to its recoverable amount. The impairment loss is recognised in profit or loss.
Investment income Interest receivable on the amount receivable is calculated on a monthly basis based on the cash held in the cell and is presented as interest income in profit or loss.
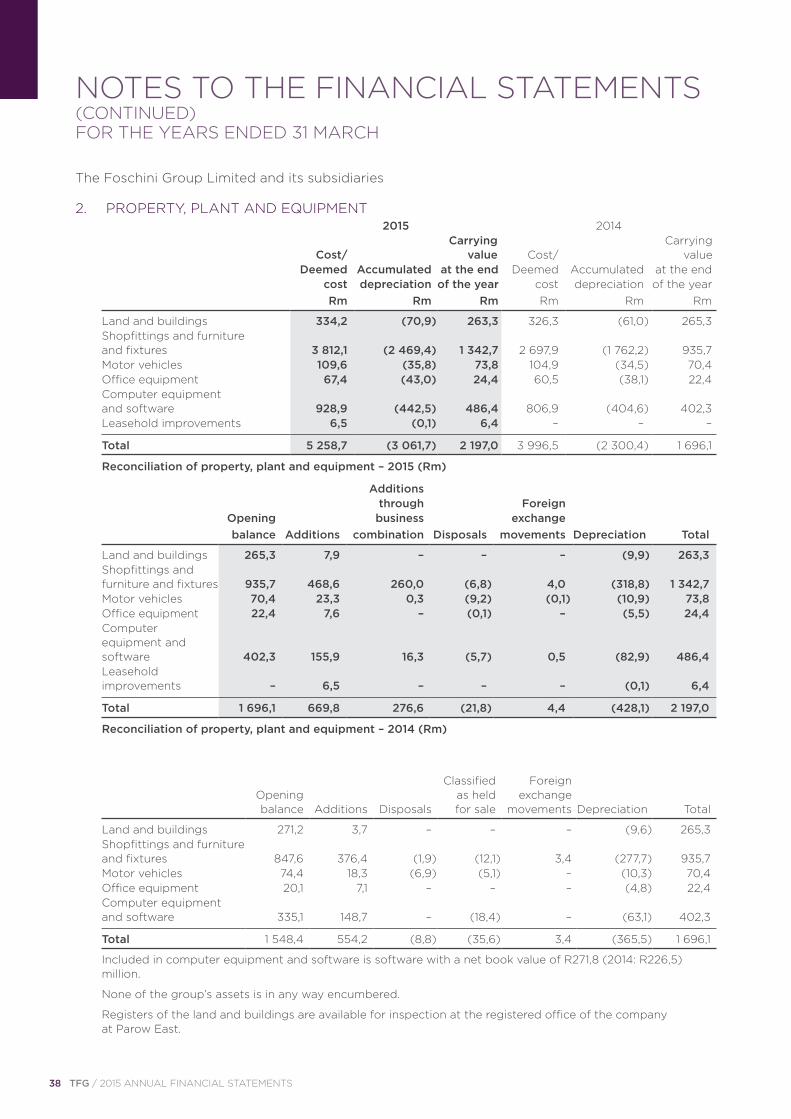
38 TFG / 2015 ANNUAL FINANCIAL STATEMENTS
NOTES TO THE FINANCIAL STATEMENTS (CONTINUED)FOR THE YEARS ENDED 31 MARCH
The Foschini Group Limited and its subsidiaries
2. PROPERTY, PLANT AND EQUIPMENT 2015 2014
Cost/ Carrying
value Cost/ Carrying
value Deemed Accumulated at the end Deemed Accumulated at the end cost depreciation of the year cost depreciation of the year Rm Rm Rm Rm Rm Rm
Land and buildings 334,2 (70,9) 263,3 326,3 (61,0) 265,3
Shopfittings and furniture and fixtures 3 812,1 (2 469,4) 1 342,7 2 697,9 (1 762,2) 935,7
Motor vehicles 109,6 (35,8) 73,8 104,9 (34,5) 70,4 Office equipment 67,4 (43,0) 24,4 60,5 (38,1) 22,4
Computer equipment and software 928,9 (442,5) 486,4 806,9 (404,6) 402,3
Leasehold improvements 6,5 (0,1) 6,4 – – –
Total 5 258,7 (3 061,7) 2 197,0 3 996,5 (2 300,4) 1 696,1
Reconciliation of property, plant and equipment – 2015 (Rm)
Additions through Foreign Opening business exchange balance Additions combination Disposals movements Depreciation Total
Land and buildings 265,3 7,9 – – – (9,9) 263,3
Shopfittings and furniture and fixtures 935,7 468,6 260,0 (6,8) 4,0 (318,8) 1 342,7
Motor vehicles 70,4 23,3 0,3 (9,2) (0,1) (10,9) 73,8 Office equipment 22,4 7,6 – (0,1) – (5,5) 24,4
Computer equipment and software 402,3 155,9 16,3 (5,7) 0,5 (82,9) 486,4
Leasehold improvements – 6,5 – – – (0,1) 6,4
Total 1 696,1 669,8 276,6 (21,8) 4,4 (428,1) 2 197,0
Reconciliation of property, plant and equipment – 2014 (Rm)
Opening balance Additions Disposals
Classifiedas held for sale
Foreignexchange
movements Depreciation Total
Land and buildings 271,2 3,7 – – – (9,6) 265,3
Shopfittings and furniture and fixtures 847,6 376,4 (1,9) (12,1) 3,4 (277,7) 935,7
Motor vehicles 74,4 18,3 (6,9) (5,1) – (10,3) 70,4 Office equipment 20,1 7,1 – – – (4,8) 22,4
Computer equipment and software 335,1 148,7 – (18,4) – (63,1) 402,3
Total 1 548,4 554,2 (8,8) (35,6) 3,4 (365,5) 1 696,1
Included in computer equipment and software is software with a net book value of R271,8 (2014: R226,5) million.
None of the group’s assets is in any way encumbered.
Registers of the land and buildings are available for inspection at the registered office of the company at Parow East.
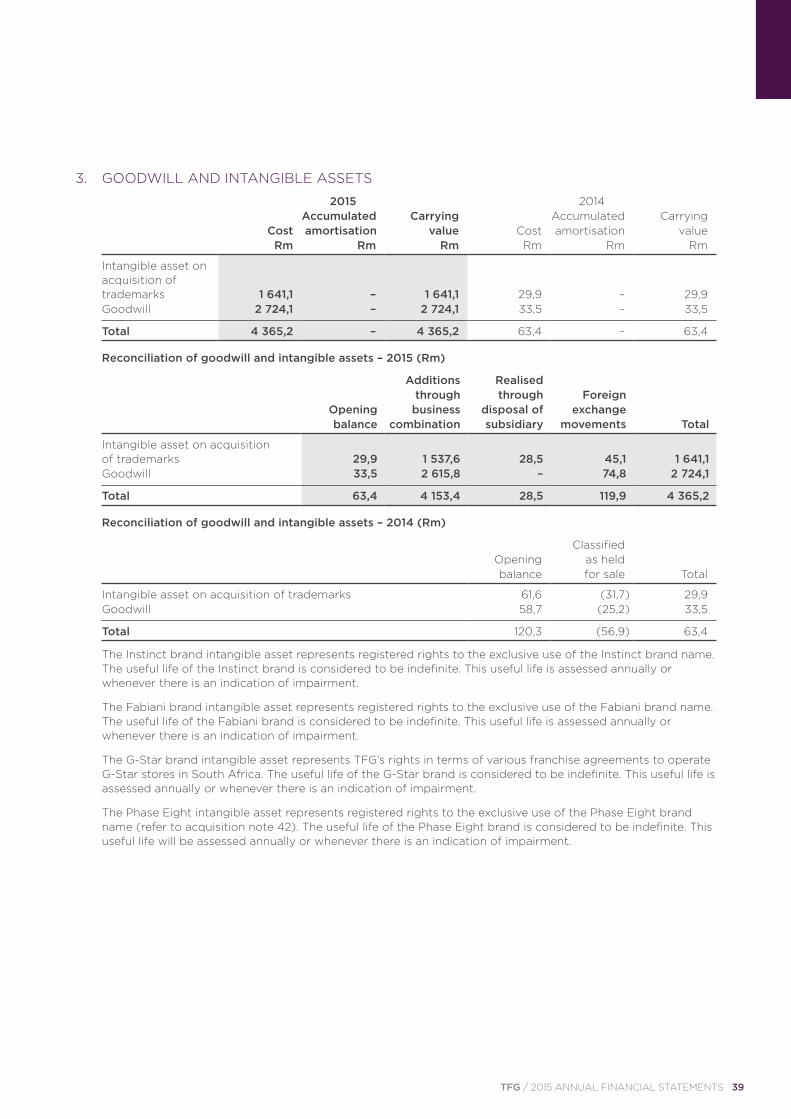
TFG / 2015 ANNUAL FINANCIAL STATEMENTS 39
3. GOODWILL AND INTANGIBLE ASSETS
2015 2014 Accumulated Carrying Accumulated Carrying Cost amortisation value Cost amortisation value
Rm Rm Rm Rm Rm Rm
Intangible asset on acquisition of trademarks 1 641,1 – 1 641,1 29,9 – 29,9
Goodwill 2 724,1 – 2 724,1 33,5 – 33,5
Total 4 365,2 – 4 365,2 63,4 – 63,4
Reconciliation of goodwill and intangible assets – 2015 (Rm)
Additions Realised through through Foreign Opening business disposal of exchange balance combination subsidiary movements Total
Intangible asset on acquisition of trademarks 29,9 1 537,6 28,5 45,1 1 641,1
Goodwill 33,5 2 615,8 – 74,8 2 724,1
Total 63,4 4 153,4 28,5 119,9 4 365,2
Reconciliation of goodwill and intangible assets – 2014 (Rm)
Classified Opening as held
balance for sale Total
Intangible asset on acquisition of trademarks 61,6 (31,7) 29,9
Goodwill 58,7 (25,2) 33,5
Total 120,3 (56,9) 63,4
The Instinct brand intangible asset represents registered rights to the exclusive use of the Instinct brand name. The useful life of the Instinct brand is considered to be indefinite. This useful life is assessed annually or whenever there is an indication of impairment.
The Fabiani brand intangible asset represents registered rights to the exclusive use of the Fabiani brand name. The useful life of the Fabiani brand is considered to be indefinite. This useful life is assessed annually or whenever there is an indication of impairment.
The G-Star brand intangible asset represents TFG’s rights in terms of various franchise agreements to operate G-Star stores in South Africa. The useful life of the G-Star brand is considered to be indefinite. This useful life is assessed annually or whenever there is an indication of impairment.
The Phase Eight intangible asset represents registered rights to the exclusive use of the Phase Eight brand name (refer to acquisition note 42). The useful life of the Phase Eight brand is considered to be indefinite. This useful life will be assessed annually or whenever there is an indication of impairment.
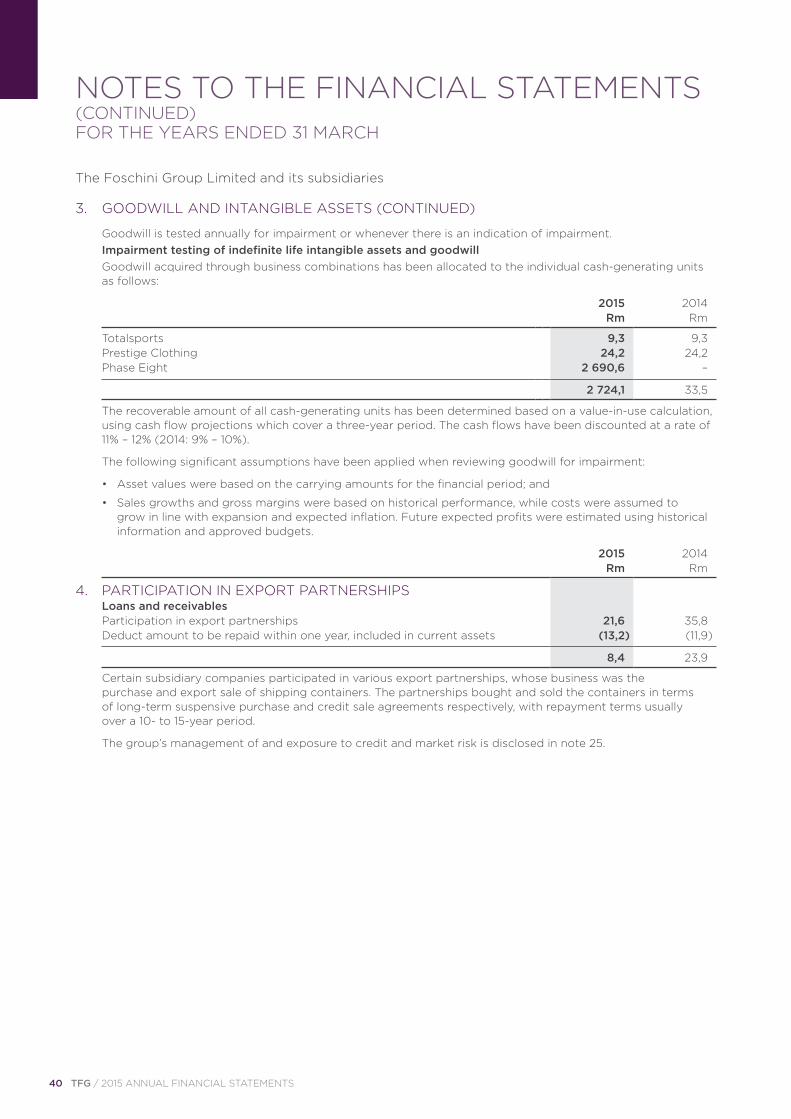
40 TFG / 2015 ANNUAL FINANCIAL STATEMENTS
NOTES TO THE FINANCIAL STATEMENTS (CONTINUED)FOR THE YEARS ENDED 31 MARCH
The Foschini Group Limited and its subsidiaries
Goodwill is tested annually for impairment or whenever there is an indication of impairment. Impairment testing of indefinite life intangible assets and goodwill
Goodwill acquired through business combinations has been allocated to the individual cash-generating units as follows:
2015 2014
Rm Rm
Totalsports 9,3 9,3 Prestige Clothing 24,2 24,2
Phase Eight 2 690,6 –
2 724,1 33,5
The recoverable amount of all cash-generating units has been determined based on a value-in-use calculation, using cash flow projections which cover a three-year period. The cash flows have been discounted at a rate of 11% – 12% (2014: 9% – 10%).
The following significant assumptions have been applied when reviewing goodwill for impairment:
• Asset values were based on the carrying amounts for the financial period; and
• Sales growths and gross margins were based on historical performance, while costs were assumed to grow in line with expansion and expected inflation. Future expected profits were estimated using historical information and approved budgets.
2015 2014
Rm Rm
4. PARTICIPATION IN EXPORT PARTNERSHIPS Loans and receivables Participation in export partnerships 21,6 35,8
Deduct amount to be repaid within one year, included in current assets (13,2) (11,9)
8,4 23,9
Certain subsidiary companies participated in various export partnerships, whose business was the purchase and export sale of shipping containers. The partnerships bought and sold the containers in terms of long-term suspensive purchase and credit sale agreements respectively, with repayment terms usually over a 10- to 15-year period.
The group’s management of and exposure to credit and market risk is disclosed in note 25.
3. GOODWILL AND INTANGIBLE ASSETS (CONTINUED)
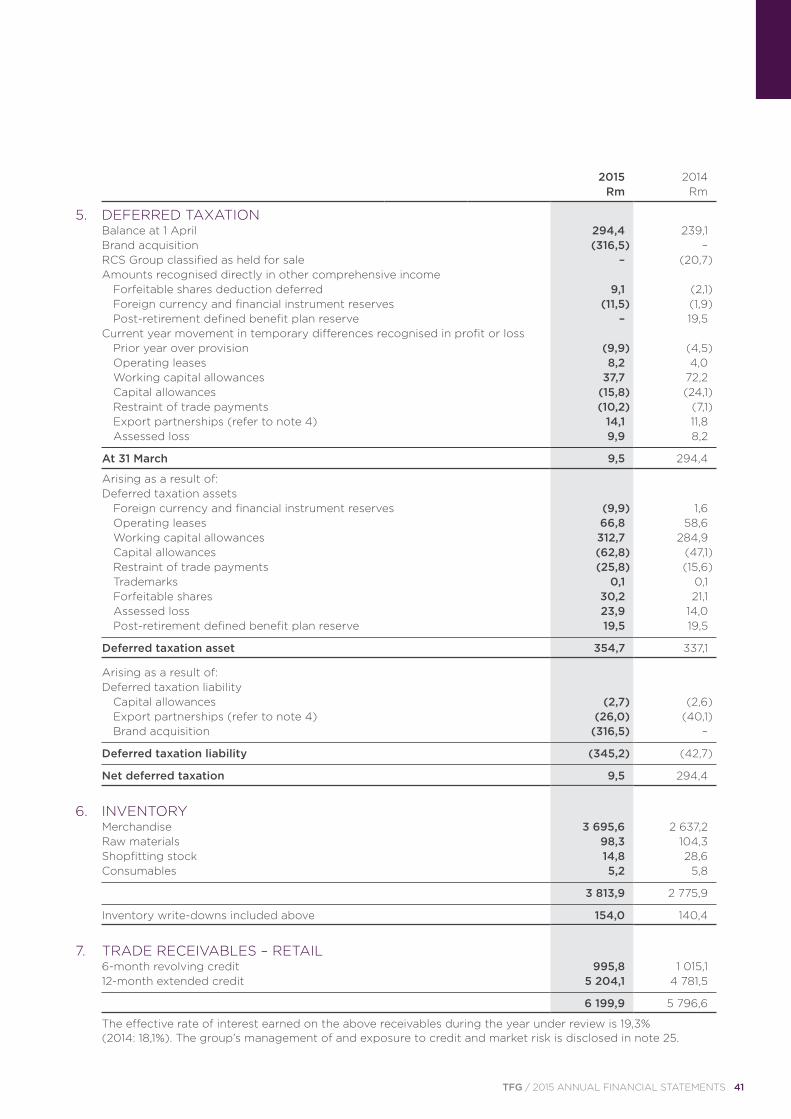
TFG / 2015 ANNUAL FINANCIAL STATEMENTS 41
5. DEFERRED TAXATION Balance at 1 April 294,4 239,1 Brand acquisition (316,5) – RCS Group classified as held for sale – (20,7) Amounts recognised directly in other comprehensive income Forfeitable shares deduction deferred 9,1 (2,1) Foreign currency and financial instrument reserves (11,5) (1,9) Post-retirement defined benefit plan reserve – 19,5 Current year movement in temporary differences recognised in profit or loss Prior year over provision (9,9) (4,5) Operating leases 8,2 4,0 Working capital allowances 37,7 72,2 Capital allowances (15,8) (24,1) Restraint of trade payments (10,2) (7,1) Export partnerships (refer to note 4) 14,1 11,8 Assessed loss 9,9 8,2
At 31 March 9,5 294,4
Arising as a result of: Deferred taxation assets Foreign currency and financial instrument reserves (9,9) 1,6 Operating leases 66,8 58,6 Working capital allowances 312,7 284,9 Capital allowances (62,8) (47,1) Restraint of trade payments (25,8) (15,6) Trademarks 0,1 0,1 Forfeitable shares 30,2 21,1 Assessed loss 23,9 14,0
Post-retirement defined benefit plan reserve 19,5 19,5
Deferred taxation asset 354,7 337,1
Arising as a result of: Deferred taxation liability Capital allowances (2,7) (2,6) Export partnerships (refer to note 4) (26,0) (40,1)
Brand acquisition (316,5) –
Deferred taxation liability (345,2) (42,7)
Net deferred taxation 9,5 294,4
6. INVENTORY Merchandise 3 695,6 2 637,2 Raw materials 98,3 104,3 Shopfitting stock 14,8 28,6
Consumables 5,2 5,8
3 813,9 2 775,9
Inventory write-downs included above 154,0 140,4
7. TRADE RECEIVABLES – RETAIL 6-month revolving credit 995,8 1 015,1
12-month extended credit 5 204,1 4 781,5
6 199,9 5 796,6
The effective rate of interest earned on the above receivables during the year under review is 19,3% (2014: 18,1%). The group’s management of and exposure to credit and market risk is disclosed in note 25.
2015 2014
Rm Rm
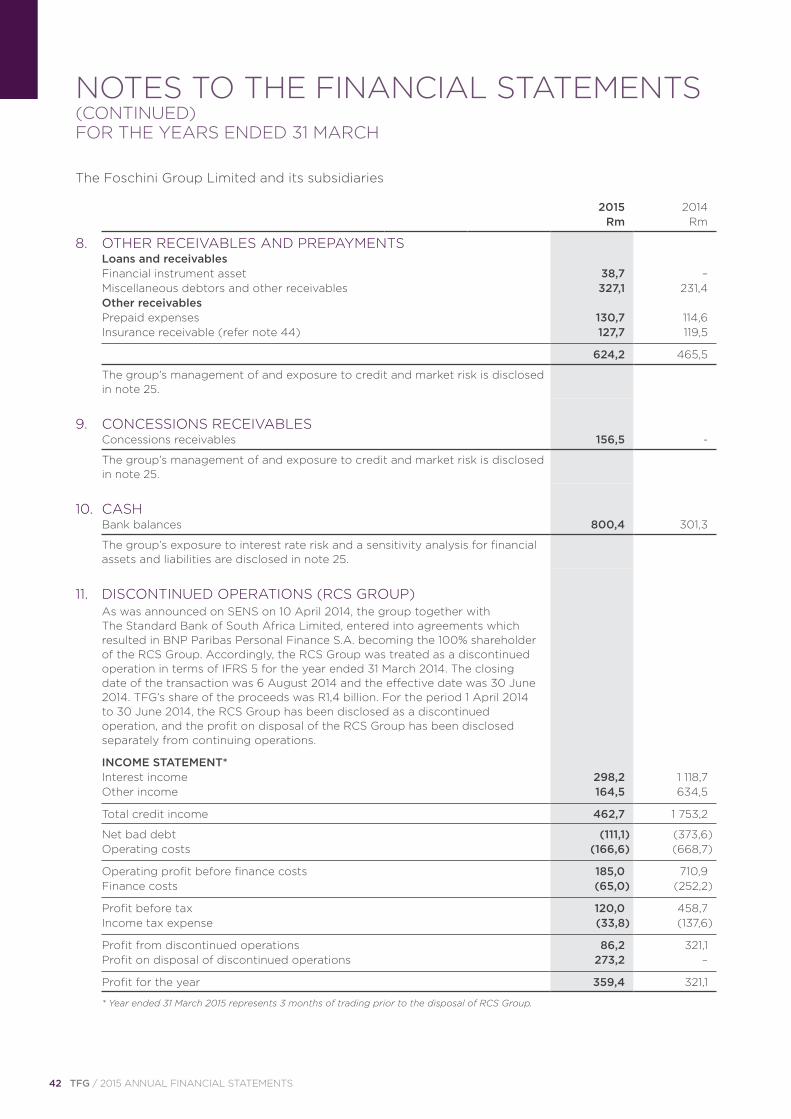
42 TFG / 2015 ANNUAL FINANCIAL STATEMENTS
NOTES TO THE FINANCIAL STATEMENTS (CONTINUED)FOR THE YEARS ENDED 31 MARCH
The Foschini Group Limited and its subsidiaries
8. OTHER RECEIVABLES AND PREPAYMENTS Loans and receivables Financial instrument asset 38,7 – Miscellaneous debtors and other receivables 327,1 231,4 Other receivables Prepaid expenses 130,7 114,6
Insurance receivable (refer note 44) 127,7 119,5
624,2 465,5
The group’s management of and exposure to credit and market risk is disclosed in note 25.
9. CONCESSIONS RECEIVABLES
Concessions receivables 156,5 -
The group’s management of and exposure to credit and market risk is disclosed in note 25.
10. CASH
Bank balances 800,4 301,3
The group’s exposure to interest rate risk and a sensitivity analysis for financial assets and liabilities are disclosed in note 25.
11. DISCONTINUED OPERATIONS (RCS GROUP)
As was announced on SENS on 10 April 2014, the group together with The Standard Bank of South Africa Limited, entered into agreements which resulted in BNP Paribas Personal Finance S.A. becoming the 100% shareholder of the RCS Group. Accordingly, the RCS Group was treated as a discontinued operation in terms of IFRS 5 for the year ended 31 March 2014. The closing date of the transaction was 6 August 2014 and the effective date was 30 June 2014. TFG’s share of the proceeds was R1,4 billion. For the period 1 April 2014 to 30 June 2014, the RCS Group has been disclosed as a discontinued operation, and the profit on disposal of the RCS Group has been disclosed separately from continuing operations.
INCOME STATEMENT* Interest income 298,2 1 118,7
Other income 164,5 634,5
Total credit income 462,7 1 753,2
Net bad debt (111,1) (373,6)
Operating costs (166,6) (668,7)
Operating profit before finance costs 185,0 710,9
Finance costs (65,0) (252,2)
Profit before tax 120,0 458,7
Income tax expense (33,8) (137,6)
Profit from discontinued operations 86,2 321,1
Profit on disposal of discontinued operations 273,2 –
Profit for the year 359,4 321,1
* Year ended 31 March 2015 represents 3 months of trading prior to the disposal of RCS Group.
2015 2014
Rm Rm
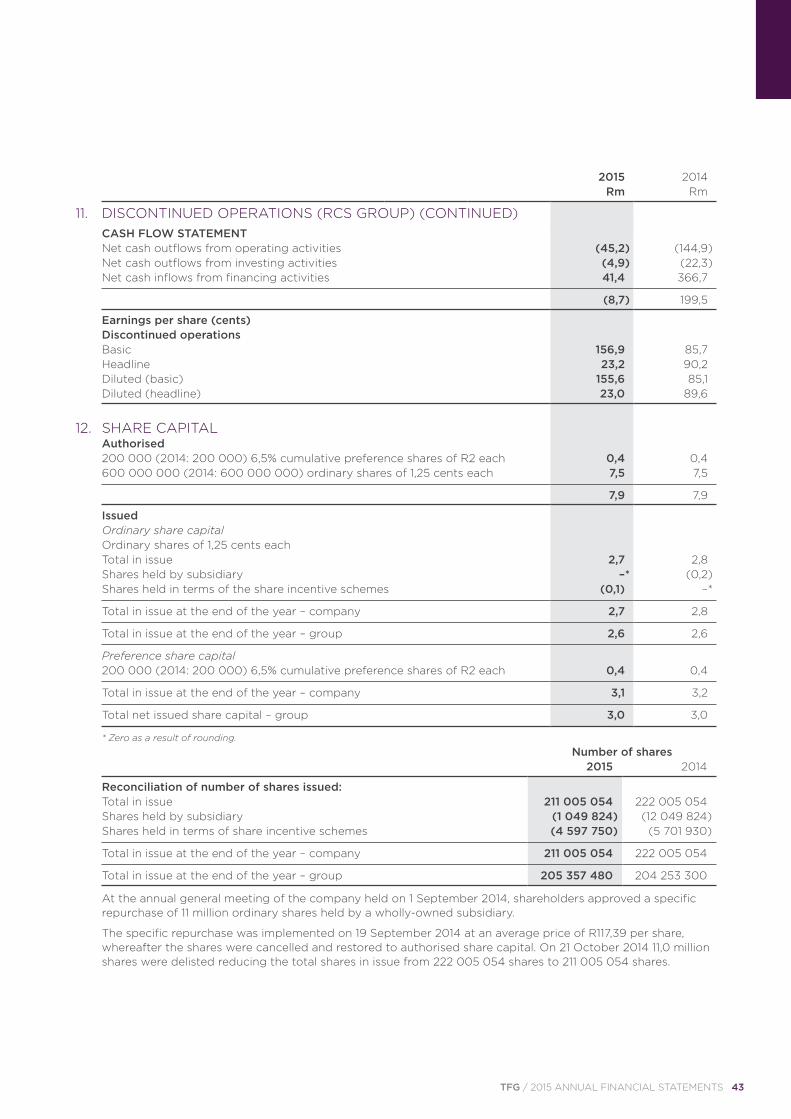
TFG / 2015 ANNUAL FINANCIAL STATEMENTS 43
12. SHARE CAPITAL Authorised 200 000 (2014: 200 000) 6,5% cumulative preference shares of R2 each 0,4 0,4
600 000 000 (2014: 600 000 000) ordinary shares of 1,25 cents each 7,5 7,5
7,9 7,9
Issued Ordinary share capital Ordinary shares of 1,25 cents each Total in issue 2,7 2,8 Shares held by subsidiary –* (0,2)
Shares held in terms of the share incentive schemes (0,1) –*
Total in issue at the end of the year – company 2,7 2,8
Total in issue at the end of the year – group 2,6 2,6
Preference share capital
200 000 (2014: 200 000) 6,5% cumulative preference shares of R2 each 0,4 0,4
Total in issue at the end of the year – company 3,1 3,2
Total net issued share capital – group 3,0 3,0
* Zero as a result of rounding.
Number of shares
2015 2014
Reconciliation of number of shares issued: Total in issue 211 005 054 222 005 054 Shares held by subsidiary (1 049 824) (12 049 824)
Shares held in terms of share incentive schemes (4 597 750) (5 701 930)
Total in issue at the end of the year – company 211 005 054 222 005 054
Total in issue at the end of the year – group 205 357 480 204 253 300
At the annual general meeting of the company held on 1 September 2014, shareholders approved a specific repurchase of 11 million ordinary shares held by a wholly-owned subsidiary.
The specific repurchase was implemented on 19 September 2014 at an average price of R117,39 per share, whereafter the shares were cancelled and restored to authorised share capital. On 21 October 2014 11,0 million shares were delisted reducing the total shares in issue from 222 005 054 shares to 211 005 054 shares.
CASH FLOW STATEMENT Net cash outflows from operating activities (45,2) (144,9) Net cash outflows from investing activities (4,9) (22,3)
Net cash inflows from financing activities 41,4 366,7
(8,7) 199,5
Earnings per share (cents) Discontinued operations Basic 156,9 85,7 Headline 23,2 90,2 Diluted (basic) 155,6 85,1
Diluted (headline) 23,0 89,6
2015 2014
Rm Rm
11. DISCONTINUED OPERATIONS (RCS GROUP) (CONTINUED)
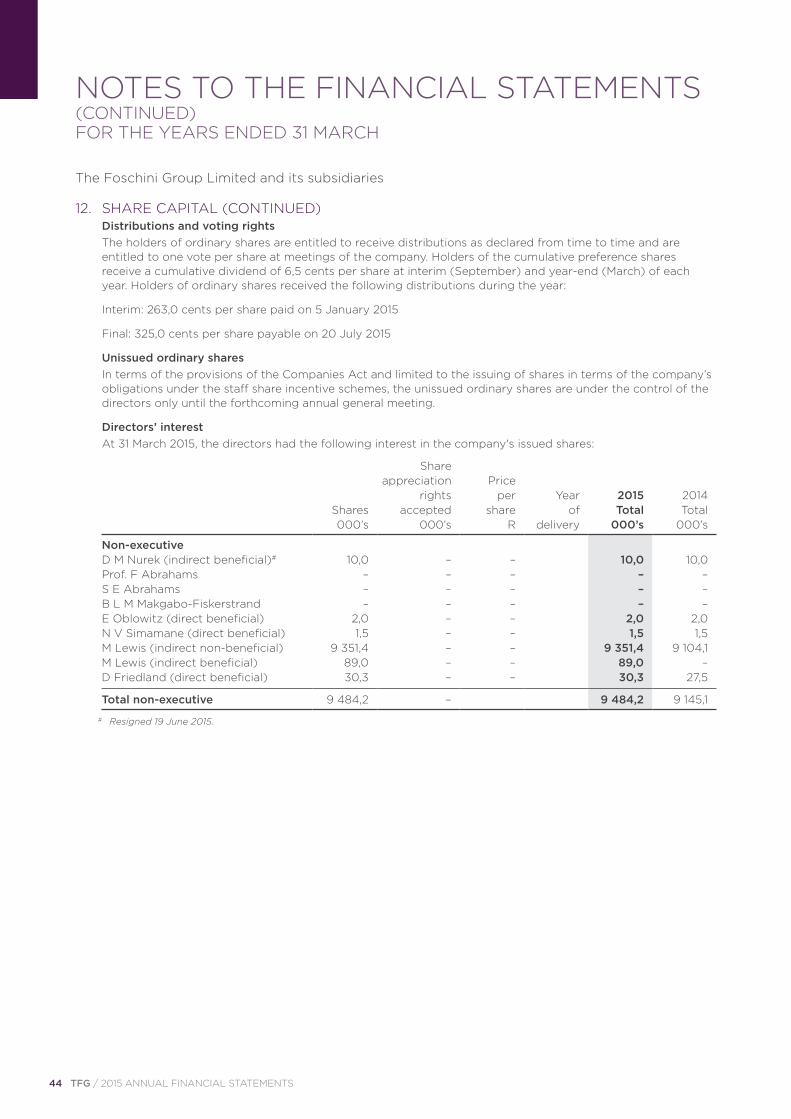
44 TFG / 2015 ANNUAL FINANCIAL STATEMENTS
NOTES TO THE FINANCIAL STATEMENTS (CONTINUED)FOR THE YEARS ENDED 31 MARCH
The Foschini Group Limited and its subsidiaries
Distributions and voting rights
The holders of ordinary shares are entitled to receive distributions as declared from time to time and are entitled to one vote per share at meetings of the company. Holders of the cumulative preference shares receive a cumulative dividend of 6,5 cents per share at interim (September) and year-end (March) of each year. Holders of ordinary shares received the following distributions during the year:
Interim: 263,0 cents per share paid on 5 January 2015
Final: 325,0 cents per share payable on 20 July 2015
Unissued ordinary shares
In terms of the provisions of the Companies Act and limited to the issuing of shares in terms of the company’s obligations under the staff share incentive schemes, the unissued ordinary shares are under the control of the directors only until the forthcoming annual general meeting.
Directors’ interest At 31 March 2015, the directors had the following interest in the company's issued shares:
Share appreciation Price rights per Year 2015 2014 Shares accepted share of Total Total
000’s 000’s R delivery 000’s 000’s
Non-executive D M Nurek (indirect beneficial)# 10,0 – – 10,0 10,0 Prof. F Abrahams – – – – – S E Abrahams – – – – – B L M Makgabo-Fiskerstrand – – – – – E Oblowitz (direct beneficial) 2,0 – – 2,0 2,0 N V Simamane (direct beneficial) 1,5 – – 1,5 1,5 M Lewis (indirect non-beneficial) 9 351,4 – – 9 351,4 9 104,1 M Lewis (indirect beneficial) 89,0 – – 89,0 –
D Friedland (direct beneficial) 30,3 – – 30,3 27,5
Total non-executive 9 484,2 – 9 484,2 9 145,1
# Resigned 19 June 2015.
12. SHARE CAPITAL (CONTINUED)
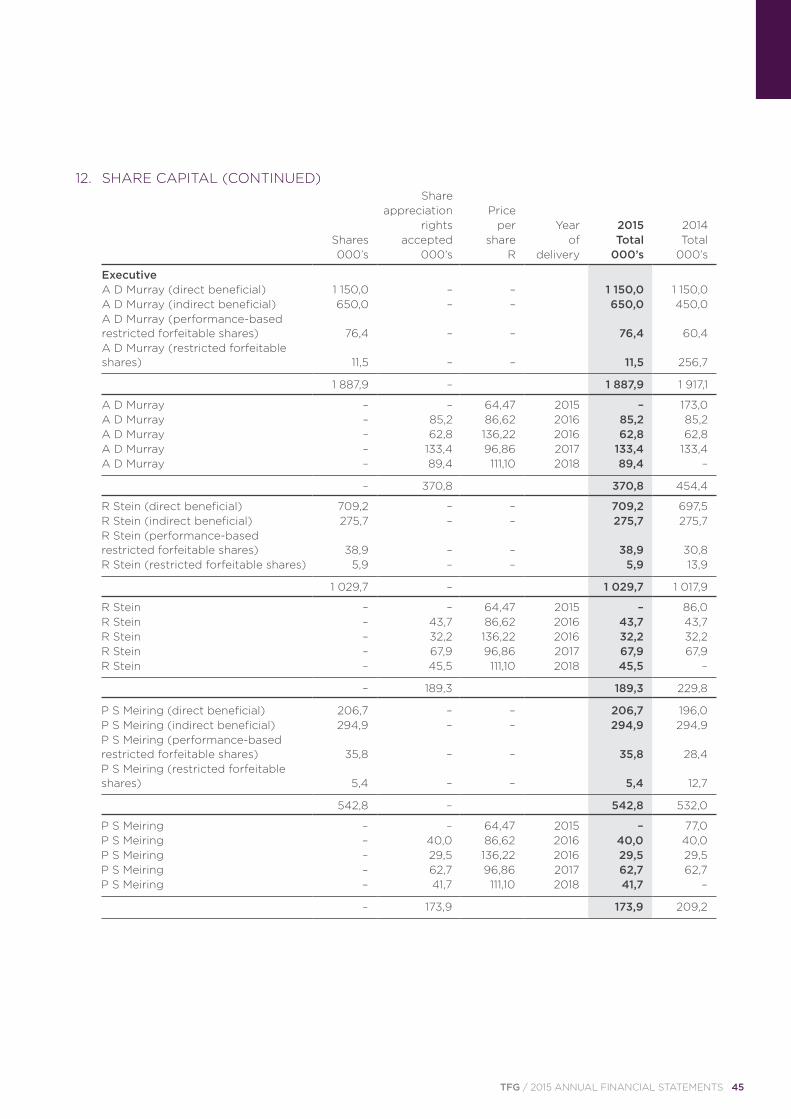
TFG / 2015 ANNUAL FINANCIAL STATEMENTS 45
Share appreciation Price rights per Year 2015 2014 Shares accepted share of Total Total
000’s 000’s R delivery 000’s 000’s
Executive A D Murray (direct beneficial) 1 150,0 – – 1 150,0 1 150,0 A D Murray (indirect beneficial) 650,0 – – 650,0 450,0
A D Murray (performance-based restricted forfeitable shares) 76,4 – – 76,4 60,4
A D Murray (restricted forfeitable shares) 11,5 – – 11,5 256,7
1 887,9 – 1 887,9 1 917,1
A D Murray – – 64,47 2015 – 173,0 A D Murray – 85,2 86,62 2016 85,2 85,2 A D Murray – 62,8 136,22 2016 62,8 62,8 A D Murray – 133,4 96,86 2017 133,4 133,4
A D Murray – 89,4 111,10 2018 89,4 –
– 370,8 370,8 454,4
R Stein (direct beneficial) 709,2 – – 709,2 697,5 R Stein (indirect beneficial) 275,7 – – 275,7 275,7
R Stein (performance-based restricted forfeitable shares) 38,9 – – 38,9 30,8
R Stein (restricted forfeitable shares) 5,9 – – 5,9 13,9
1 029,7 – 1 029,7 1 017,9
R Stein – – 64,47 2015 – 86,0 R Stein – 43,7 86,62 2016 43,7 43,7 R Stein – 32,2 136,22 2016 32,2 32,2 R Stein – 67,9 96,86 2017 67,9 67,9
R Stein – 45,5 111,10 2018 45,5 –
– 189,3 189,3 229,8
P S Meiring (direct beneficial) 206,7 – – 206,7 196,0 P S Meiring (indirect beneficial) 294,9 – – 294,9 294,9
P S Meiring (performance-based restricted forfeitable shares) 35,8 – – 35,8 28,4
P S Meiring (restricted forfeitable shares) 5,4 – – 5,4 12,7
542,8 – 542,8 532,0
P S Meiring – – 64,47 2015 – 77,0 P S Meiring – 40,0 86,62 2016 40,0 40,0 P S Meiring – 29,5 136,22 2016 29,5 29,5 P S Meiring – 62,7 96,86 2017 62,7 62,7
P S Meiring – 41,7 111,10 2018 41,7 –
– 173,9 173,9 209,2
12. SHARE CAPITAL (CONTINUED)
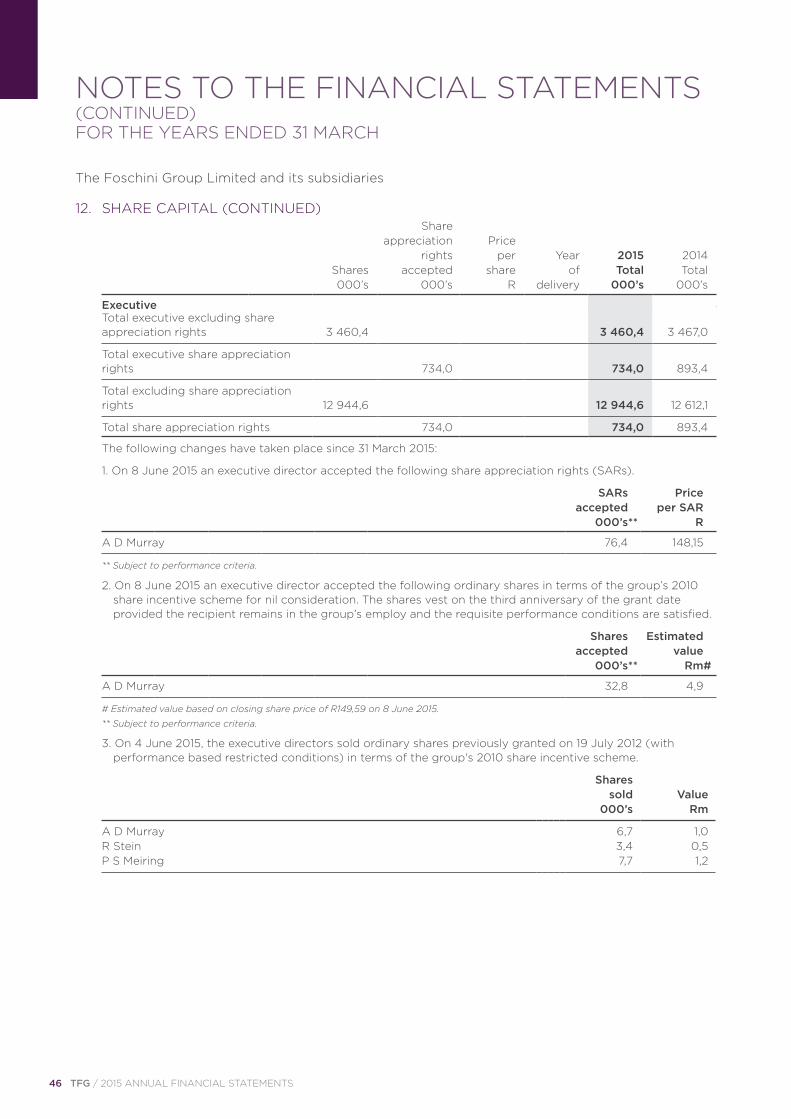
46 TFG / 2015 ANNUAL FINANCIAL STATEMENTS
NOTES TO THE FINANCIAL STATEMENTS (CONTINUED)FOR THE YEARS ENDED 31 MARCH
The Foschini Group Limited and its subsidiaries
Total executive excluding share appreciation rights 3 460,4 3 460,4 3 467,0
Total executive share appreciation rights 734,0 734,0 893,4
Total excluding share appreciation rights 12 944,6 12 944,6 12 612,1
Total share appreciation rights 734,0 734,0 893,4
The following changes have taken place since 31 March 2015:
1. On 8 June 2015 an executive director accepted the following share appreciation rights (SARs).
SARs Price accepted per SAR
000’s** R
A D Murray 76,4 148,15
** Subject to performance criteria.
2. On 8 June 2015 an executive director accepted the following ordinary shares in terms of the group’s 2010 share incentive scheme for nil consideration. The shares vest on the third anniversary of the grant date provided the recipient remains in the group’s employ and the requisite performance conditions are satisfied.
Shares Estimated accepted value
000’s** Rm#
A D Murray 32,8 4,9
# Estimated value based on closing share price of R149,59 on 8 June 2015.
** Subject to performance criteria.
3. On 4 June 2015, the executive directors sold ordinary shares previously granted on 19 July 2012 (with
performance based restricted conditions) in terms of the group's 2010 share incentive scheme.
Shares sold Value
000’s Rm
A D Murray 6,7 1,0 R Stein 3,4 0,5
P S Meiring 7,7 1,2
Share appreciation Price rights per Year 2015 2014 Shares accepted share of Total Total
000’s 000’s R delivery 000’s 000’s
Executive
12. SHARE CAPITAL (CONTINUED)
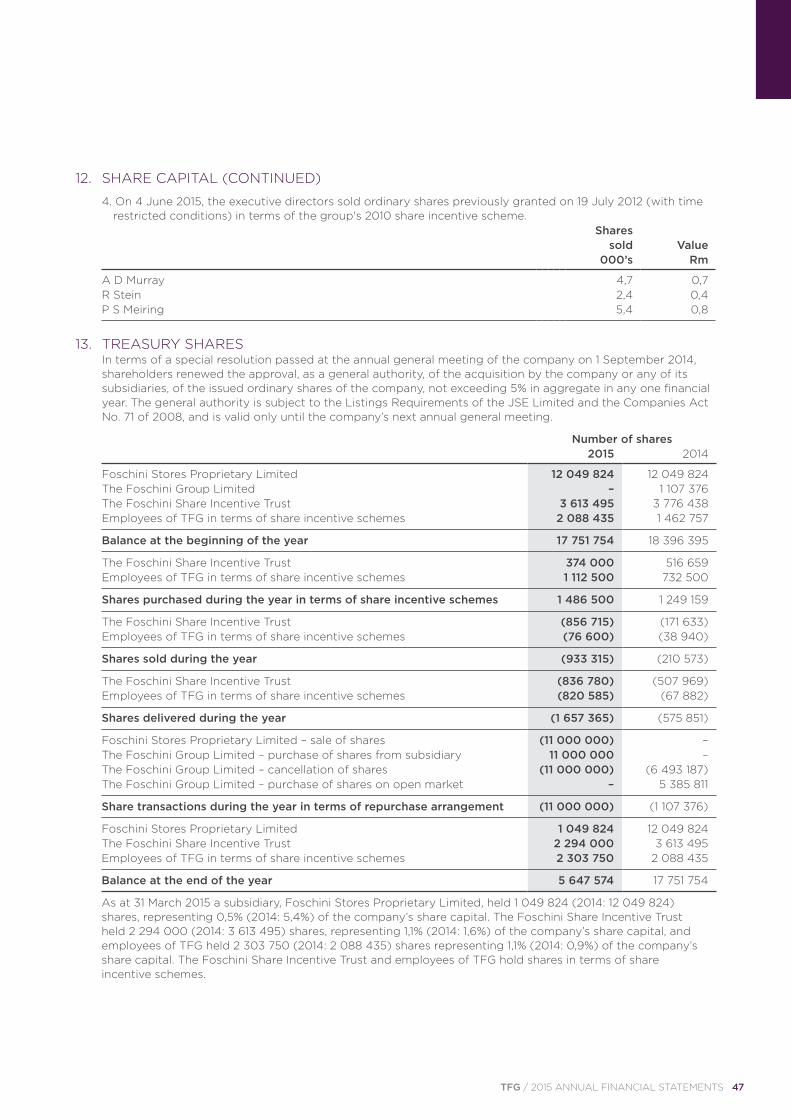
TFG / 2015 ANNUAL FINANCIAL STATEMENTS 47
13. TREASURY SHARES
In terms of a special resolution passed at the annual general meeting of the company on 1 September 2014, shareholders renewed the approval, as a general authority, of the acquisition by the company or any of its subsidiaries, of the issued ordinary shares of the company, not exceeding 5% in aggregate in any one financial year. The general authority is subject to the Listings Requirements of the JSE Limited and the Companies Act No. 71 of 2008, and is valid only until the company’s next annual general meeting.
Number of shares
2015 2014
Foschini Stores Proprietary Limited 12 049 824 12 049 824 The Foschini Group Limited – 1 107 376 The Foschini Share Incentive Trust 3 613 495 3 776 438
Employees of TFG in terms of share incentive schemes 2 088 435 1 462 757
Balance at the beginning of the year 17 751 754 18 396 395
The Foschini Share Incentive Trust 374 000 516 659
Employees of TFG in terms of share incentive schemes 1 112 500 732 500
Shares purchased during the year in terms of share incentive schemes 1 486 500 1 249 159
The Foschini Share Incentive Trust (856 715) (171 633)
Employees of TFG in terms of share incentive schemes (76 600) (38 940)
Shares sold during the year (933 315) (210 573)
The Foschini Share Incentive Trust (836 780) (507 969)
Employees of TFG in terms of share incentive schemes (820 585) (67 882)
Shares delivered during the year (1 657 365) (575 851)
Foschini Stores Proprietary Limited – sale of shares (11 000 000) – The Foschini Group Limited – purchase of shares from subsidiary 11 000 000 – The Foschini Group Limited – cancellation of shares (11 000 000) (6 493 187)
The Foschini Group Limited – purchase of shares on open market – 5 385 811
Share transactions during the year in terms of repurchase arrangement (11 000 000) (1 107 376)
Foschini Stores Proprietary Limited 1 049 824 12 049 824 The Foschini Share Incentive Trust 2 294 000 3 613 495
Employees of TFG in terms of share incentive schemes 2 303 750 2 088 435
Balance at the end of the year 5 647 574 17 751 754
As at 31 March 2015 a subsidiary, Foschini Stores Proprietary Limited, held 1 049 824 (2014: 12 049 824) shares, representing 0,5% (2014: 5,4%) of the company’s share capital. The Foschini Share Incentive Trust held 2 294 000 (2014: 3 613 495) shares, representing 1,1% (2014: 1,6%) of the company’s share capital, and employees of TFG held 2 303 750 (2014: 2 088 435) shares representing 1,1% (2014: 0,9%) of the company’s share capital. The Foschini Share Incentive Trust and employees of TFG hold shares in terms of share incentive schemes.
12. SHARE CAPITAL (CONTINUED)
4. On 4 June 2015, the executive directors sold ordinary shares previously granted on 19 July 2012 (with time
restricted conditions) in terms of the group's 2010 share incentive scheme. Shares sold Value
000’s Rm
A D Murray 4,7 0,7 R Stein 2,4 0,4
P S Meiring 5,4 0,8

48 TFG / 2015 ANNUAL FINANCIAL STATEMENTS
NOTES TO THE FINANCIAL STATEMENTS (CONTINUED)FOR THE YEARS ENDED 31 MARCH
The Foschini Group Limited and its subsidiaries
14. DIVIDEND RESERVE
A liability for cash dividends is recognised in the period when the dividend is declared. An amount equal to dividends declared subsequent to the reporting date is transferred to the dividend reserve. A prudent approach has been followed to recognise the full final distribution in the dividend reserve which is consistent with the approach followed in the prior year.
A final scrip distribution with a cash alternative of 325,0 (2014: 293,0) cents per ordinary share was declared on 28 May 2015 payable on 20 July 2015.
No liability has been raised, as this distribution was declared subsequent to the reporting date.
Balance at 1 April 650,5 616,9 Transfer from dividend reserve to distributable earnings (650,5) (616,9)
Transfer to dividend reserve from distributable earnings 685,8 650,5
Balance at 31 March 685,8 650,5
15. HEDGING SURPLUS
The hedging deficit comprises the effective portion of the cumulative net change in the fair value of cash flow hedging instruments related to hedged transactions that have not yet occurred.
Balance at 1 April 13,1 (5,2)Continuing operations
Effective portion of changes in fair value of cash flow hedges 41,1 6,9 Deferred tax on movement in effective portion of cash flow hedges (11,5) (1,9)
Discontinued operationsEffective portion of changes in fair value of cash flow hedges (4,5) 18,5Deferred tax on movement in effective portion of cash flow hedges 1,3 (5,2)
Realisation of reserve on disposal of subsidiaryEffective portion of changes in fair value of cash flow hedges (20,7) –Deferred tax on movement in effective portion of cash flow hedges 5,8 –
Balance at 31 March 24,6 13,1
Comprised as follows: Interest rate swaps (asset) – fair value (net of non-controlling interest) – 25,4 Interest rate swaps (liability) – fair value (net of non-controlling interest) – (0,2)
Forward exchange contracts – fair value 34,6 (6,5)
Total fair value of cash flow hedges 34,6 18,7
Deferred tax on interest rate swaps – (7,1)
Deferred tax on forward exchange contracts (10,0) 1,5
Total deferred tax on cash flow hedges (10,0) (5,6)
Balance at 31 March 24,6 13,1
The opening balance of R13,1 million was realised during the year and recycled to profit or loss. The forward exchange contracts are used to hedge the estimated foreign currency exposure to forecast purchases over the next six months.
2015 2014
Rm Rm

TFG / 2015 ANNUAL FINANCIAL STATEMENTS 49
17. FOREIGN CURRENCY TRANSLATION RESERVE
The foreign currency translation reserve comprises gains and losses arising on translation of the assets, liabilities, income and expenses of foreign operations.
Balance at 1 April 7,5 10,7 Foreign currency translation differences 66,0 (3,2)
Realisation of reserve on disposal of subsidiary (2,8) –
Balance at 31 March 70,7 7,5
18. PUT OPTION RESERVE AND LIABILITY
Through put/call arrangements, the group has the right to acquire and management the right to sell all Dress Holdco B Limited (which houses the Phase Eight investment) shares held by management in three equal tranches on the earlier of (i) the publication of the audited accounts of Dress Holdco B Limited for each of the fourth, fifth and sixth years following completion of the Phase Eight acquisition or (ii) 6 months following the fourth, fifth and sixth year anniversaries of completion of the acquisition. As these put/call arrangements are a consequence of the business combination, they are accounted for as a financial liability. Accordingly, no non-controlling interest is recorded as indicated in accounting policy 1.9. The exercise price is based on a formula which is designed to approximate the fair value of the shares. The acquisition of the management shares will be performed on the basis of a 9,36 times EBITDA adjusted for net debt applied to the audited financial results of Phase Eight at the applicable time as mentioned above.
Balance at 1 April – – Additions through business combinations 4,3 – Increase in the fair value of the put option liability 15,8 –
Foreign exchange movements 0,2 –
Balance at 31 March 20,3 –
Put option reserve movement Balance at 1 April – –
Increase in the fair value of the put option liability 15,8 –
Balance at 31 March 15,8 –
The group’s management of and exposure to cash flow and liquidity risk is disclosed in note 25.
16. SHARE-BASED PAYMENTS RESERVE
The share-based payments reserve comprises the cumulative fair value of options, share appreciation rights and forfeitable shares granted to employees after 7 November 2002.
Balance at 1 April 435,8 345,5 Fair value of share instruments granted in prior years 62,6 64,9
Fair value of share instruments granted during the year 34,8 25,4
Balance at 31 March 533,2 435,8
2015 2014
Rm Rm
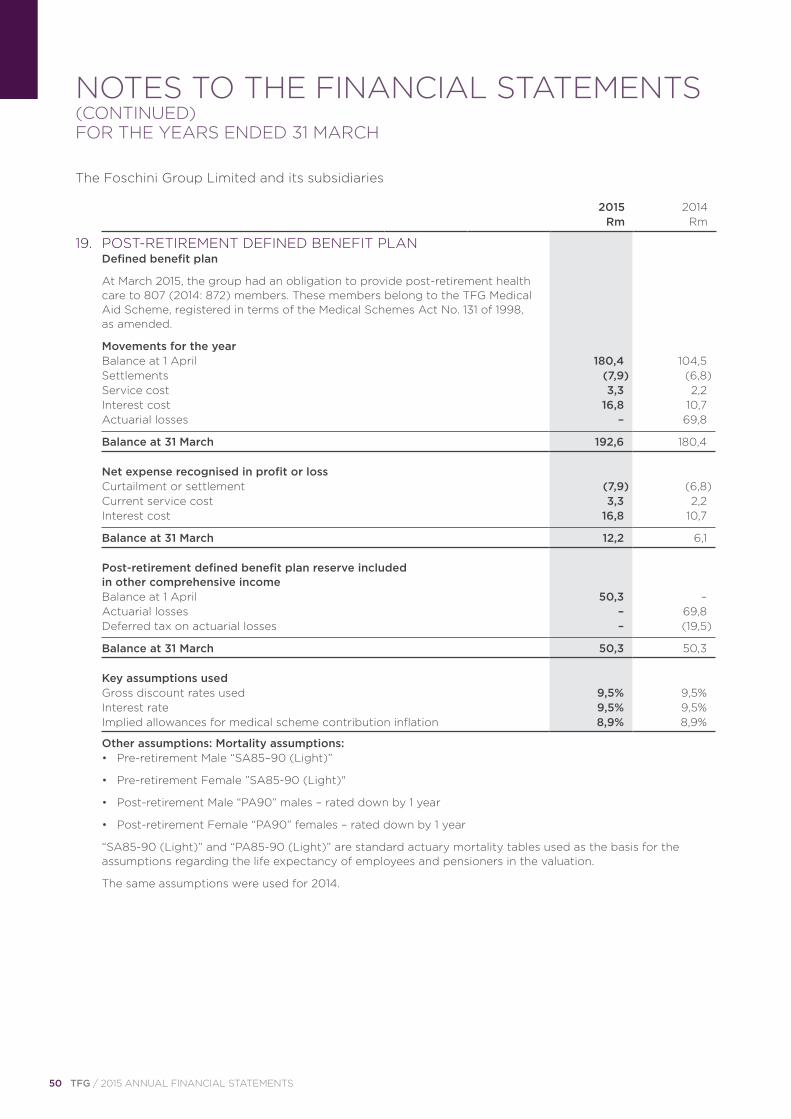
50 TFG / 2015 ANNUAL FINANCIAL STATEMENTS
NOTES TO THE FINANCIAL STATEMENTS (CONTINUED)FOR THE YEARS ENDED 31 MARCH
The Foschini Group Limited and its subsidiaries
19. POST-RETIREMENT DEFINED BENEFIT PLAN Defined benefit plan
At March 2015, the group had an obligation to provide post-retirement health care to 807 (2014: 872) members. These members belong to the TFG Medical Aid Scheme, registered in terms of the Medical Schemes Act No. 131 of 1998, as amended.
Movements for the year Balance at 1 April 180,4 104,5 Settlements (7,9) (6,8) Service cost 3,3 2,2 Interest cost 16,8 10,7
Actuarial losses – 69,8
Balance at 31 March 192,6 180,4
Net expense recognised in profit or loss Curtailment or settlement (7,9) (6,8) Current service cost 3,3 2,2
Interest cost 16,8 10,7
Balance at 31 March 12,2 6,1
Post-retirement defined benefit plan reserve included in other comprehensive income
Balance at 1 April 50,3 – Actuarial losses – 69,8
Deferred tax on actuarial losses – (19,5)
Balance at 31 March 50,3 50,3
Key assumptions used Gross discount rates used 9,5% 9,5% Interest rate 9,5% 9,5%
Implied allowances for medical scheme contribution inflation 8,9% 8,9%
Other assumptions: Mortality assumptions: • Pre-retirement Male “SA85–90 (Light)”
• Pre-retirement Female ”SA85-90 (Light)"
• Post-retirement Male “PA90” males – rated down by 1 year
• Post-retirement Female “PA90” females – rated down by 1 year
“SA85-90 (Light)” and “PA85-90 (Light)” are standard actuary mortality tables used as the basis for the assumptions regarding the life expectancy of employees and pensioners in the valuation.
The same assumptions were used for 2014.
2015 2014
Rm Rm
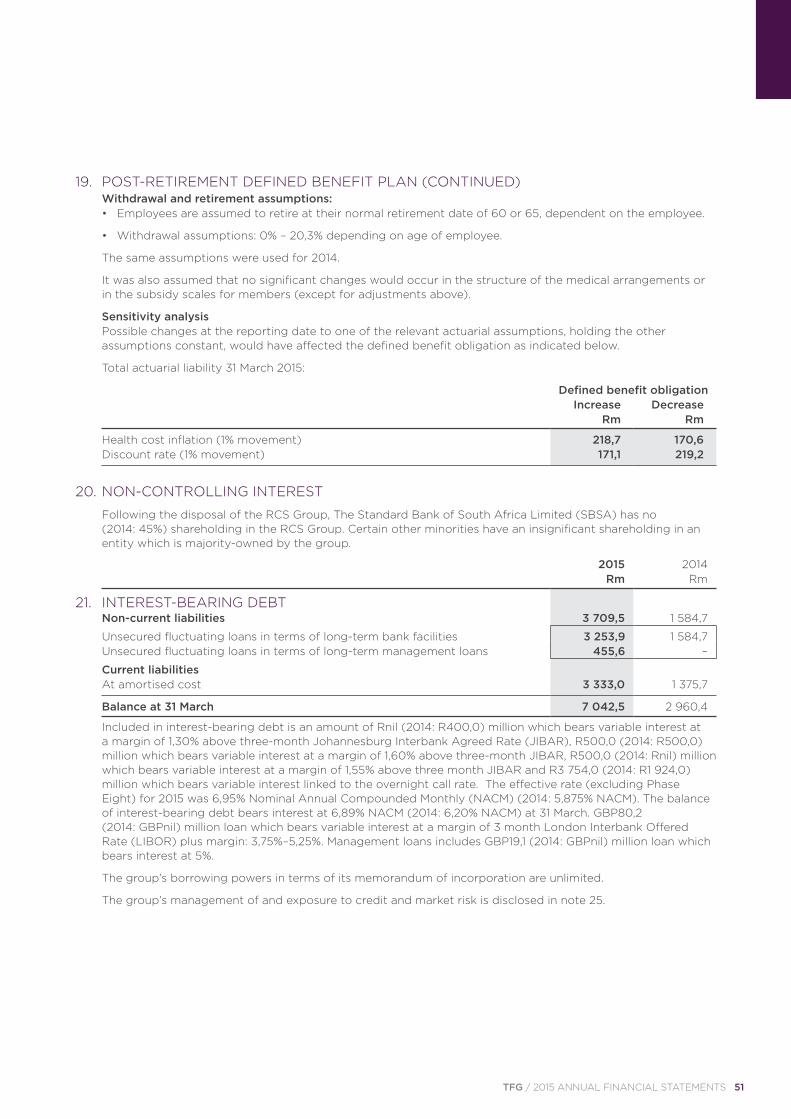
TFG / 2015 ANNUAL FINANCIAL STATEMENTS 51
Withdrawal and retirement assumptions: • Employees are assumed to retire at their normal retirement date of 60 or 65, dependent on the employee.
• Withdrawal assumptions: 0% – 20,3% depending on age of employee.
The same assumptions were used for 2014.
It was also assumed that no significant changes would occur in the structure of the medical arrangements or in the subsidy scales for members (except for adjustments above).
Sensitivity analysis
Possible changes at the reporting date to one of the relevant actuarial assumptions, holding the other assumptions constant, would have affected the defined benefit obligation as indicated below.
Total actuarial liability 31 March 2015:
Defined benefit obligation Increase Decrease
Rm Rm
Health cost inflation (1% movement) 218,7 170,6
Discount rate (1% movement) 171,1 219,2
20. NON-CONTROLLING INTEREST
Following the disposal of the RCS Group, The Standard Bank of South Africa Limited (SBSA) has no (2014: 45%) shareholding in the RCS Group. Certain other minorities have an insignificant shareholding in an entity which is majority-owned by the group.
2015 2014
Rm Rm
21. INTEREST-BEARING DEBT Non-current liabilities 3 709,5 1 584,7
Unsecured fluctuating loans in terms of long-term bank facilities 3 253,9 1 584,7 Unsecured fluctuating loans in terms of long-term management loans 455,6 –
Current liabilities
At amortised cost 3 333,0 1 375,7
Balance at 31 March 7 042,5 2 960,4
Included in interest-bearing debt is an amount of Rnil (2014: R400,0) million which bears variable interest at a margin of 1,30% above three-month Johannesburg Interbank Agreed Rate (JIBAR), R500,0 (2014: R500,0) million which bears variable interest at a margin of 1,60% above three-month JIBAR, R500,0 (2014: Rnil) million which bears variable interest at a margin of 1,55% above three month JIBAR and R3 754,0 (2014: R1 924,0) million which bears variable interest linked to the overnight call rate. The effective rate (excluding Phase Eight) for 2015 was 6,95% Nominal Annual Compounded Monthly (NACM) (2014: 5,875% NACM). The balance of interest-bearing debt bears interest at 6,89% NACM (2014: 6,20% NACM) at 31 March. GBP80,2 (2014: GBPnil) million loan which bears variable interest at a margin of 3 month London Interbank Offered Rate (LIBOR) plus margin: 3,75%–5,25%. Management loans includes GBP19,1 (2014: GBPnil) million loan which bears interest at 5%.
The group’s borrowing powers in terms of its memorandum of incorporation are unlimited.
The group’s management of and exposure to credit and market risk is disclosed in note 25.
19. POST-RETIREMENT DEFINED BENEFIT PLAN (CONTINUED)
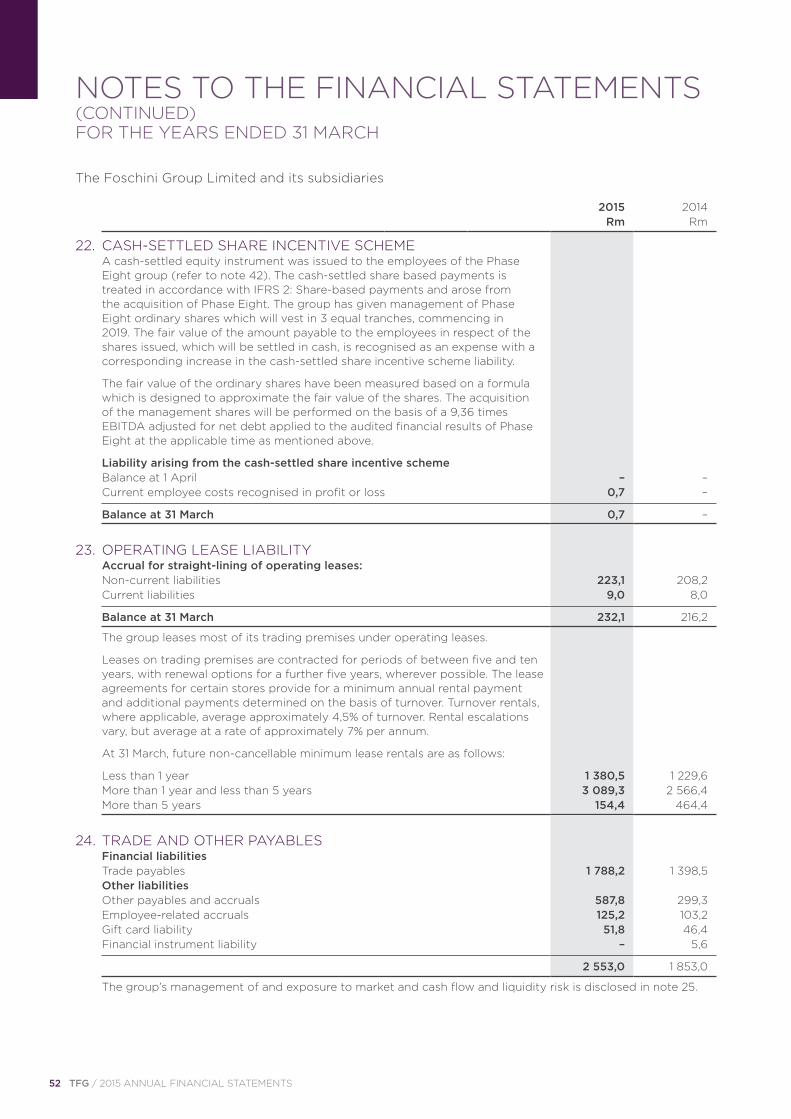
52 TFG / 2015 ANNUAL FINANCIAL STATEMENTS
NOTES TO THE FINANCIAL STATEMENTS (CONTINUED)FOR THE YEARS ENDED 31 MARCH
The Foschini Group Limited and its subsidiaries
23. OPERATING LEASE LIABILITY Accrual for straight-lining of operating leases: Non-current liabilities 223,1 208,2
Current liabilities 9,0 8,0
Balance at 31 March 232,1 216,2
The group leases most of its trading premises under operating leases.
Leases on trading premises are contracted for periods of between five and ten years, with renewal options for a further five years, wherever possible. The lease agreements for certain stores provide for a minimum annual rental payment and additional payments determined on the basis of turnover. Turnover rentals, where applicable, average approximately 4,5% of turnover. Rental escalations vary, but average at a rate of approximately 7% per annum.
At 31 March, future non-cancellable minimum lease rentals are as follows:
Less than 1 year 1 380,5 1 229,6 More than 1 year and less than 5 years 3 089,3 2 566,4
More than 5 years 154,4 464,4
24. TRADE AND OTHER PAYABLES Financial liabilities Trade payables 1 788,2 1 398,5 Other liabilities Other payables and accruals 587,8 299,3 Employee-related accruals 125,2 103,2 Gift card liability 51,8 46,4
Financial instrument liability – 5,6
2 553,0 1 853,0
The group’s management of and exposure to market and cash flow and liquidity risk is disclosed in note 25.
22. CASH-SETTLED SHARE INCENTIVE SCHEME
A cash-settled equity instrument was issued to the employees of the Phase Eight group (refer to note 42). The cash-settled share based payments is treated in accordance with IFRS 2: Share-based payments and arose from the acquisition of Phase Eight. The group has given management of Phase Eight ordinary shares which will vest in 3 equal tranches, commencing in 2019. The fair value of the amount payable to the employees in respect of the shares issued, which will be settled in cash, is recognised as an expense with a corresponding increase in the cash-settled share incentive scheme liability.
The fair value of the ordinary shares have been measured based on a formula which is designed to approximate the fair value of the shares. The acquisition of the management shares will be performed on the basis of a 9,36 times EBITDA adjusted for net debt applied to the audited financial results of Phase Eight at the applicable time as mentioned above.
Liability arising from the cash-settled share incentive scheme Balance at 1 April – –
Current employee costs recognised in profit or loss 0,7 –
Balance at 31 March 0,7 –
2015 2014
Rm Rm
TFG / 2015 ANNUAL FINANCIAL STATEMENTS 53
25. RISK MANAGEMENT Overview The group has exposure to the following risks from its use of financial instruments:
• credit risk;
• liquidity risk; and
• market risk;
This note presents information about the group’s exposure to each of the above risks and the group’s objectives, policies and processes for measuring and managing risk. Further quantitative disclosures are included throughout these consolidated financial statements.
Risk management framework
The board of directors has overall responsibility for the establishment and oversight of the group’s risk management framework. The board has established the risk committee, which is responsible for developing and monitoring the group’s risk management policies. The committee reports quarterly to the board of directors on its activities.
The group’s risk management policies are established to identify and analyse the risks faced by the group, to set appropriate risk limits and controls, and to monitor risks and adherence to limits. Risk management policies and systems are reviewed regularly to reflect changes in market conditions and the group’s activities. The group, through its training and management standards and procedures, aims to develop a disciplined and constructive control environment in which all employees understand their roles and obligations.
The group audit committee oversees how management monitors compliance with the group’s risk management policies and procedures, and reviews the adequacy of the risk management framework in relation to the risks faced by the group. The group audit committee is assisted in its oversight role by internal audit. Internal audit undertakes both regular and ad hoc reviews of risk management controls and procedures, the results of which are reported to the audit committee and to the risk committee.
Credit risk
Credit risk is the risk of financial loss to the group if a customer or counterparty to a financial instrument fails to meet its contractual obligations and arises on trade and other receivables, concession debtors, cash and participation in export partnerships. The group does not consider there to be any significant concentration of credit risk in respect of which adequate impairment has not been raised.
Trade receivables
The group does not have any balances which are past due date which have not been adequately provided for, as the provisioning methodology applied takes the entire debtor population into consideration.
The risk arising on retail trade receivables is managed through a stringent group policy on the granting, continual review and monitoring of credit facilities. The group has established a credit policy under which each application for a new credit facility is analysed individually for creditworthiness. This process applies information submitted by the applicant as well as external bureau data (where this is available) to statistical credit scoring models and includes an assessment of affordability, before terms and conditions are offered. A credit facility is established for each customer, which represents the maximum possible exposure to any account holder. The facility is made available to the account holder over time depending on the quality of credit management displayed by the customer. These credit facilities are reviewed annually, subject to the requirements of the National Credit Act. The scorecards are monitored regularly and redeveloped as appropriate. Account holders who are more than one cycle delinquent will be unable to spend. Depending on the duration of the delinquency credit limits may be adjusted downwards. The group does not typically require collateral for lending. However, certain categories of customers may be required to make a deposit with each purchase. There is a large, diverse and widely distributed customer base. Therefore, the group does not consider there to be any significant concentration of credit risk.
54 TFG / 2015 ANNUAL FINANCIAL STATEMENTS
NOTES TO THE FINANCIAL STATEMENTS (CONTINUED)FOR THE YEARS ENDED 31 MARCH
The Foschini Group Limited and its subsidiaries
The group establishes an allowance for impairment that represents its estimate of incurred losses in respect of trade receivables. The allowance is calculated using the internationally-recognised Markov model. The Markov model is a statistical model utilised to quantify the probability of default by analysing the observed patterns of delinquency and default over an appropriate period of time to determine the inherent rate of bad debt in a debtors’ book. The probability of default is applied to the accounts receivable balance at balance sheet date. Accounts that are known to have applied for the debt review are fully impaired. The board of directors believes that the application of these techniques results in trade receivables balances being measured reliably. There is a large, diverse and widely distributed customer base. Therefore, the group does not consider there to be any significant concentration of credit risk in respect of which any further impairment of accounts receivable is required.
Other receivables and prepayments
Other receivables are neither past due nor impaired. Accordingly the group is not exposed to significant credit risk.
Concessions receivables
Concession debtors are neither past due nor impaired. Accordingly the group is not exposed to significant credit risk.
Cash and investments
The group limits its exposure to credit risk through dealing with well-established financial institutions with high credit standings, and thus management does not expect any counterparty to fail to meet its obligations.
Participation in export partnership
A company listed on the JSE Limited has warranted certain important cash flow aspects of the subsidiary companies’ participation in export partnerships. This company is considered creditworthy and no risk of loss is expected.
Exposure
The maximum exposure to credit risk is represented by the carrying amount of each financial asset in the statement of financial position.
In determining the recoverability of trade receivables, the group considers any changes in credit quality of the receivables up to reporting date. The concentration of credit risk is limited, as the customer base is large and unrelated.
The maximum exposure to credit risk at the reporting date was:
2015 2014
Rm Rm
Continuing operations Loans and receivables Participation in export partnerships 21,6 35,8 Trade receivables – retail 6 199,9 5 796,6 Other receivables 493,5 350,9 Concessions receivables 156,5 – Cash 800,4 301,3 Discontinued operations Loans and receivables RCS Group card receivables – 3 785,0 RCS Group loan receivables – 960,0 Other receivables – 348,7 Cash – 421,9 Interest rate swaps used for hedging
Assets – 40,4
7 671,9 12 040,6
Other receivables and concessions receivables are neither past due nor impaired. The group believes that there is no significant concentration of credit risk.
25. RISK MANAGEMENT (CONTINUED)
TFG / 2015 ANNUAL FINANCIAL STATEMENTS 55
Impairment losses: trade receivables – retail
The group manages the ageing of its trade receivables book on both a contractual and recency basis, but uses the recency basis to calculate write-off and impairment losses. Recency refers to the number of payment cycles that have elapsed since the last qualifying payment was received.
Recency categories range from 0 to 5, at which point the account will be written off, unless the payment profile score is above a fixed level.
The ageing of past due unimpaired trade receivables at 31 March was: Carrying amount 2015 2014
Rm Rm
Recency 1 722,2 744,8 Recency 2 203,7 201,6 Recency 3 96,5 98,8 Recency 4 33,9 34,0
Recency 5 13,0 12,4
1 069,3 1 091,6
The movement in the allowance for impairment in respect of trade receivables during the year was as follows:
Balance at 1 April 816,0 604,1
Movement in allowance for impairment 160,3 211,9
Balance at 31 March 976,3 816,0
Customers that are not past due and have a good track record with the group make up 77,9% of the trade receivables book (2014: 76,8%).
Cash flow and liquidity risk
Liquidity risk is the risk that the group will encounter difficulty in meeting the obligations associated with its financial liabilities that are settled by delivering cash or another financial asset. The group’s approach to managing liquidity is to ensure that it will always have sufficient cash flow to meet its liabilities when due, under both normal and stressed conditions, without incurring unacceptable losses or risking damage to the group’s reputation.
This risk is managed through cash flow forecasts, the optimisation of daily cash management and by ensuring that adequate borrowing facilities are maintained. In terms of its memorandum of incorporation, the group’s borrowing powers are unlimited.
25. RISK MANAGEMENT (CONTINUED)
56 TFG / 2015 ANNUAL FINANCIAL STATEMENTS
NOTES TO THE FINANCIAL STATEMENTS (CONTINUED)FOR THE YEARS ENDED 31 MARCH
The Foschini Group Limited and its subsidiaries
Cash flow and liquidity risk
The following are the remaining contractual maturities of financial liabilities at the reporting date. The amounts are gross and undiscounted, and include estimated interest payments and exclude the impact of netting agreements:
Carrying Less than More than amount Cash flows 1 year 1 – 2 years 2 years
Rm Rm Rm Rm Rm
31 March 2015 Non-derivative financial liabilities Interest-bearing debt 7 042,5 7 787,0 3 603,9 1 135,6 3 047,5 Trade and other payables 2 553,0 2 501,2 2 501,2 – – Derivative financial liabilities Put option liability 20,3 433,9 – – 433,9
9 615,8 10 722,1 6 105,1 1 135,6 3 481,4
31 March 2014 Non-derivative financial liabilities Interest-bearing debt 2 960,4 3 134,5 1 456,6 1 148,5 529,4 RCS Group external funding 3 315,8 3 847,1 1 027,6 1 326,6 1 492,9 Trade and other payables 2 238,4 2 192,0 2 192,0 – – Derivative financial liabilities
Interest rate swaps used for hedging 0,3 0,3 0,3 – –
Forward exchange contracts used for hedging 6,5 673,2 673,2 – –
8 521,4 9 847,1 5 349,7 2 475,1 2 022,3
The following table indicates the periods in which the cash flows associated with derivatives that are cash flow hedges are expected to occur and impact profit or loss:
Carrying Less than More than amount Cash flows 1 year 1 – 2 years 2 years
31 March 2015 Rm Rm Rm Rm Rm
Forward exchange contracts
Asset 38,7 (769,3) (769,3) – –
38,7 (769,3) (769,3) – –
31 March 2014 Interest rate swaps Liability (0,3) (0,3) (0,3) – – Asset 40,4 13,9 6,9 5,8 1,2 Forward exchange contracts
Liability (6,5) (673,2) (673,2) – –
33,6 (659,6) (666,6) 5,8 1,2
25. RISK MANAGEMENT (CONTINUED)
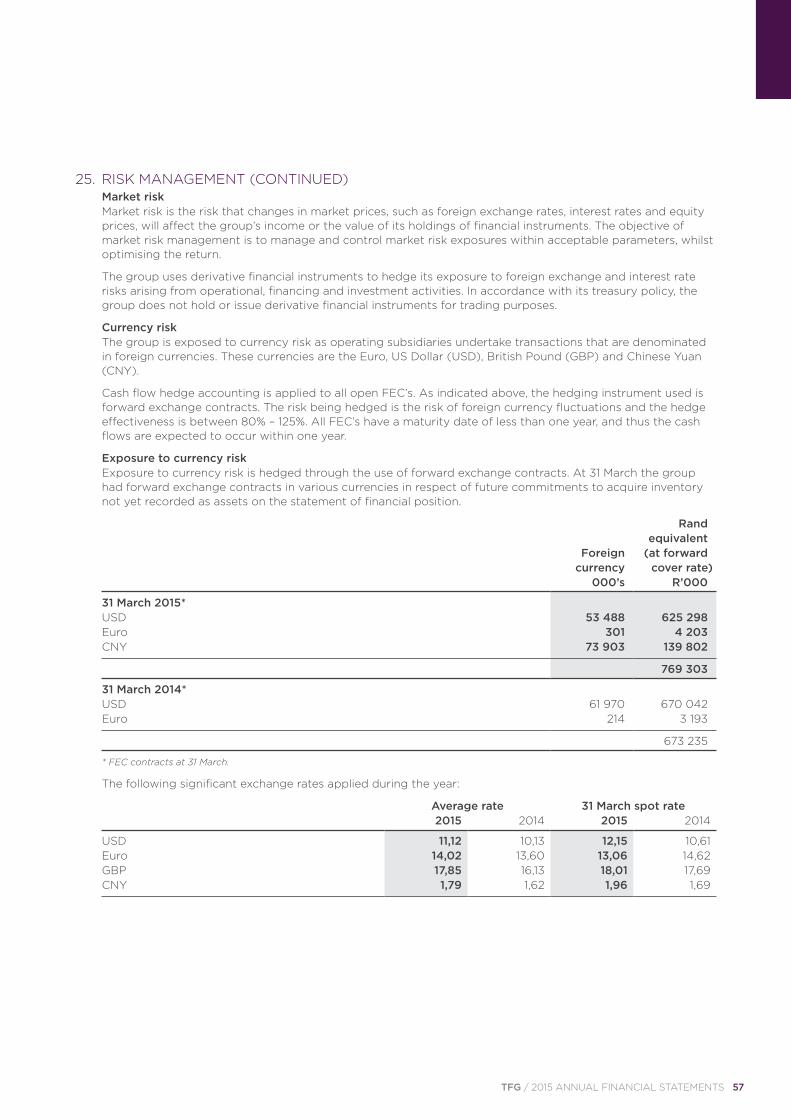
TFG / 2015 ANNUAL FINANCIAL STATEMENTS 57
Market risk
Market risk is the risk that changes in market prices, such as foreign exchange rates, interest rates and equity prices, will affect the group’s income or the value of its holdings of financial instruments. The objective of market risk management is to manage and control market risk exposures within acceptable parameters, whilst optimising the return.
The group uses derivative financial instruments to hedge its exposure to foreign exchange and interest rate risks arising from operational, financing and investment activities. In accordance with its treasury policy, the group does not hold or issue derivative financial instruments for trading purposes.
Currency risk
The group is exposed to currency risk as operating subsidiaries undertake transactions that are denominated in foreign currencies. These currencies are the Euro, US Dollar (USD), British Pound (GBP) and Chinese Yuan (CNY).
Cash flow hedge accounting is applied to all open FEC’s. As indicated above, the hedging instrument used is forward exchange contracts. The risk being hedged is the risk of foreign currency fluctuations and the hedge effectiveness is between 80% – 125%. All FEC’s have a maturity date of less than one year, and thus the cash flows are expected to occur within one year.
Exposure to currency risk
Exposure to currency risk is hedged through the use of forward exchange contracts. At 31 March the group had forward exchange contracts in various currencies in respect of future commitments to acquire inventory not yet recorded as assets on the statement of financial position.
Rand equivalent Foreign (at forward currency cover rate)
000’s R’000
31 March 2015* USD 53 488 625 298 Euro 301 4 203
CNY 73 903 139 802
769 303
31 March 2014* USD 61 970 670 042
Euro 214 3 193
673 235
* FEC contracts at 31 March.
The following significant exchange rates applied during the year:
Average rate 31 March spot rate
2015 2014 2015 2014
USD 11,12 10,13 12,15 10,61 Euro 14,02 13,60 13,06 14,62 GBP 17,85 16,13 18,01 17,69
CNY 1,79 1,62 1,96 1,69
25. RISK MANAGEMENT (CONTINUED)
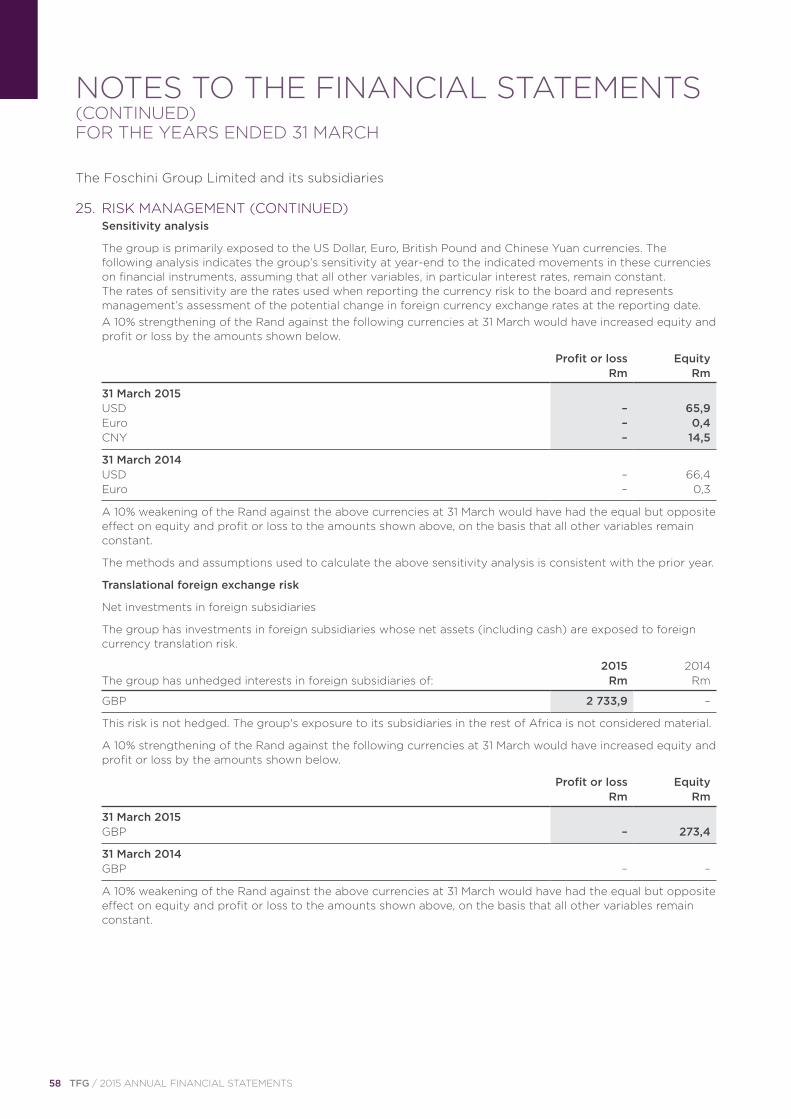
58 TFG / 2015 ANNUAL FINANCIAL STATEMENTS
NOTES TO THE FINANCIAL STATEMENTS (CONTINUED)FOR THE YEARS ENDED 31 MARCH
The Foschini Group Limited and its subsidiaries
Sensitivity analysis
The group is primarily exposed to the US Dollar, Euro, British Pound and Chinese Yuan currencies. The following analysis indicates the group’s sensitivity at year-end to the indicated movements in these currencies on financial instruments, assuming that all other variables, in particular interest rates, remain constant. The rates of sensitivity are the rates used when reporting the currency risk to the board and represents management’s assessment of the potential change in foreign currency exchange rates at the reporting date.
A 10% strengthening of the Rand against the following currencies at 31 March would have increased equity and profit or loss by the amounts shown below.
Profit or loss Equity
Rm Rm
31 March 2015 USD – 65,9 Euro – 0,4
CNY – 14,5
31 March 2014 USD – 66,4
Euro – 0,3
A 10% weakening of the Rand against the above currencies at 31 March would have had the equal but opposite effect on equity and profit or loss to the amounts shown above, on the basis that all other variables remain constant.
The methods and assumptions used to calculate the above sensitivity analysis is consistent with the prior year.
Translational foreign exchange risk
Net investments in foreign subsidiaries
The group has investments in foreign subsidiaries whose net assets (including cash) are exposed to foreign currency translation risk.
2015 2014
The group has unhedged interests in foreign subsidiaries of: Rm Rm
GBP 2 733,9 –
This risk is not hedged. The group's exposure to its subsidiaries in the rest of Africa is not considered material.
A 10% strengthening of the Rand against the following currencies at 31 March would have increased equity and profit or loss by the amounts shown below.
Profit or loss Equity
Rm Rm
31 March 2015
GBP – 273,4
31 March 2014
GBP – –
A 10% weakening of the Rand against the above currencies at 31 March would have had the equal but opposite effect on equity and profit or loss to the amounts shown above, on the basis that all other variables remain constant.
25. RISK MANAGEMENT (CONTINUED)
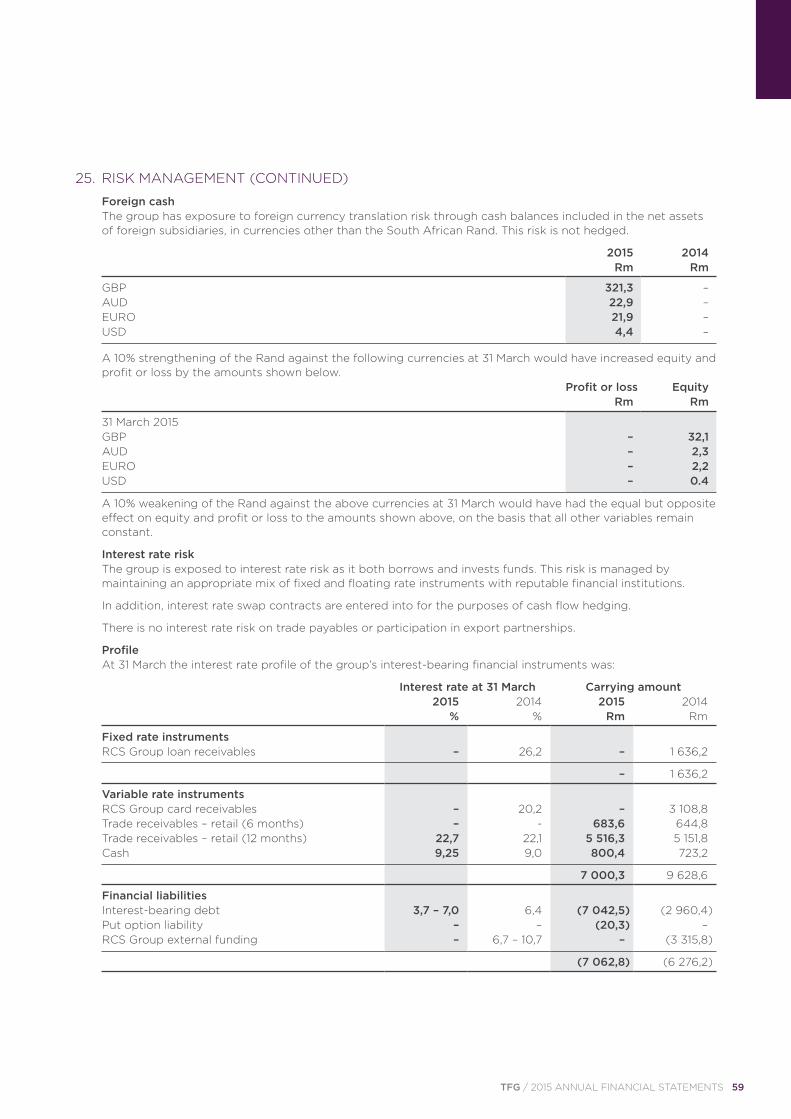
TFG / 2015 ANNUAL FINANCIAL STATEMENTS 59
Foreign cash
The group has exposure to foreign currency translation risk through cash balances included in the net assets of foreign subsidiaries, in currencies other than the South African Rand. This risk is not hedged.
2015 2014
Rm Rm
GBP 321,3 – AUD 22,9 – EURO 21,9 –
USD 4,4 –
A 10% strengthening of the Rand against the following currencies at 31 March would have increased equity and profit or loss by the amounts shown below.
Profit or loss Equity
Rm Rm
31 March 2015 GBP – 32,1 AUD – 2,3 EURO – 2,2
USD – 0.4
A 10% weakening of the Rand against the above currencies at 31 March would have had the equal but opposite effect on equity and profit or loss to the amounts shown above, on the basis that all other variables remain constant.
Interest rate risk
The group is exposed to interest rate risk as it both borrows and invests funds. This risk is managed by maintaining an appropriate mix of fixed and floating rate instruments with reputable financial institutions.
In addition, interest rate swap contracts are entered into for the purposes of cash flow hedging.
There is no interest rate risk on trade payables or participation in export partnerships.
Profile At 31 March the interest rate profile of the group’s interest-bearing financial instruments was:
Interest rate at 31 March Carrying amount 2015 2014 2015 2014
% % Rm Rm
Fixed rate instruments
RCS Group loan receivables – 26,2 – 1 636,2
– 1 636,2
Variable rate instruments RCS Group card receivables – 20,2 – 3 108,8 Trade receivables – retail (6 months) – - 683,6 644,8 Trade receivables – retail (12 months) 22,7 22,1 5 516,3 5 151,8
Cash 9,25 9,0 800,4 723,2
7 000,3 9 628,6
Financial liabilities Interest-bearing debt 3,7 – 7,0 6,4 (7 042,5) (2 960,4) Put option liability – – (20,3) –
RCS Group external funding – 6,7 – 10,7 – (3 315,8)
(7 062,8) (6 276,2)
25. RISK MANAGEMENT (CONTINUED)
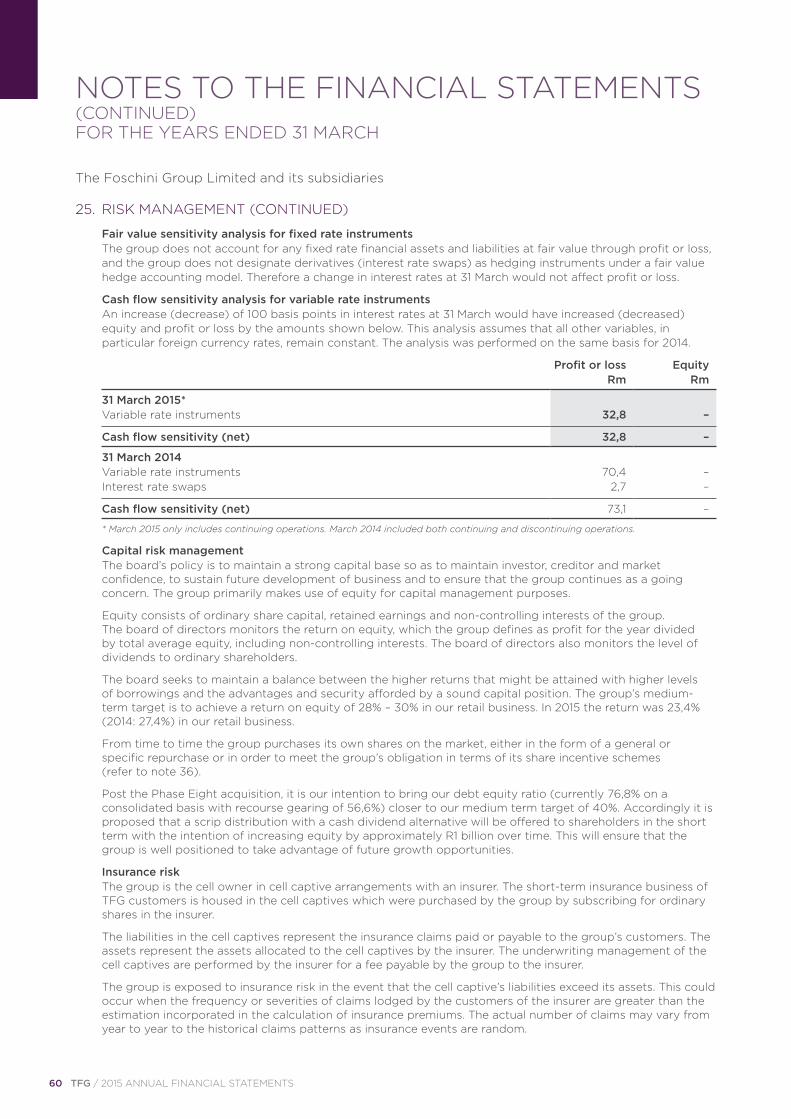
60 TFG / 2015 ANNUAL FINANCIAL STATEMENTS
NOTES TO THE FINANCIAL STATEMENTS (CONTINUED)FOR THE YEARS ENDED 31 MARCH
The Foschini Group Limited and its subsidiaries
Fair value sensitivity analysis for fixed rate instruments
The group does not account for any fixed rate financial assets and liabilities at fair value through profit or loss, and the group does not designate derivatives (interest rate swaps) as hedging instruments under a fair value hedge accounting model. Therefore a change in interest rates at 31 March would not affect profit or loss.
Cash flow sensitivity analysis for variable rate instruments
An increase (decrease) of 100 basis points in interest rates at 31 March would have increased (decreased) equity and profit or loss by the amounts shown below. This analysis assumes that all other variables, in particular foreign currency rates, remain constant. The analysis was performed on the same basis for 2014.
Profit or loss Equity
Rm Rm
31 March 2015*
Variable rate instruments 32,8 –
Cash flow sensitivity (net) 32,8 –
31 March 2014 Variable rate instruments 70,4 –
Interest rate swaps 2,7 –
Cash flow sensitivity (net) 73,1 –
* March 2015 only includes continuing operations. March 2014 included both continuing and discontinuing operations.
Capital risk management
The board’s policy is to maintain a strong capital base so as to maintain investor, creditor and market confidence, to sustain future development of business and to ensure that the group continues as a going concern. The group primarily makes use of equity for capital management purposes.
Equity consists of ordinary share capital, retained earnings and non-controlling interests of the group. The board of directors monitors the return on equity, which the group defines as profit for the year divided by total average equity, including non-controlling interests. The board of directors also monitors the level of dividends to ordinary shareholders.
The board seeks to maintain a balance between the higher returns that might be attained with higher levels of borrowings and the advantages and security afforded by a sound capital position. The group’s medium-term target is to achieve a return on equity of 28% – 30% in our retail business. In 2015 the return was 23,4% (2014: 27,4%) in our retail business.
From time to time the group purchases its own shares on the market, either in the form of a general or specific repurchase or in order to meet the group’s obligation in terms of its share incentive schemes (refer to note 36).
Post the Phase Eight acquisition, it is our intention to bring our debt equity ratio (currently 76,8% on a consolidated basis with recourse gearing of 56,6%) closer to our medium term target of 40%. Accordingly it is proposed that a scrip distribution with a cash dividend alternative will be offered to shareholders in the short term with the intention of increasing equity by approximately R1 billion over time. This will ensure that the group is well positioned to take advantage of future growth opportunities.
Insurance risk
The group is the cell owner in cell captive arrangements with an insurer. The short-term insurance business of TFG customers is housed in the cell captives which were purchased by the group by subscribing for ordinary shares in the insurer.
The liabilities in the cell captives represent the insurance claims paid or payable to the group’s customers. The assets represent the assets allocated to the cell captives by the insurer. The underwriting management of the cell captives are performed by the insurer for a fee payable by the group to the insurer.
The group is exposed to insurance risk in the event that the cell captive’s liabilities exceed its assets. This could occur when the frequency or severities of claims lodged by the customers of the insurer are greater than the estimation incorporated in the calculation of insurance premiums. The actual number of claims may vary from year to year to the historical claims patterns as insurance events are random.
25. RISK MANAGEMENT (CONTINUED)
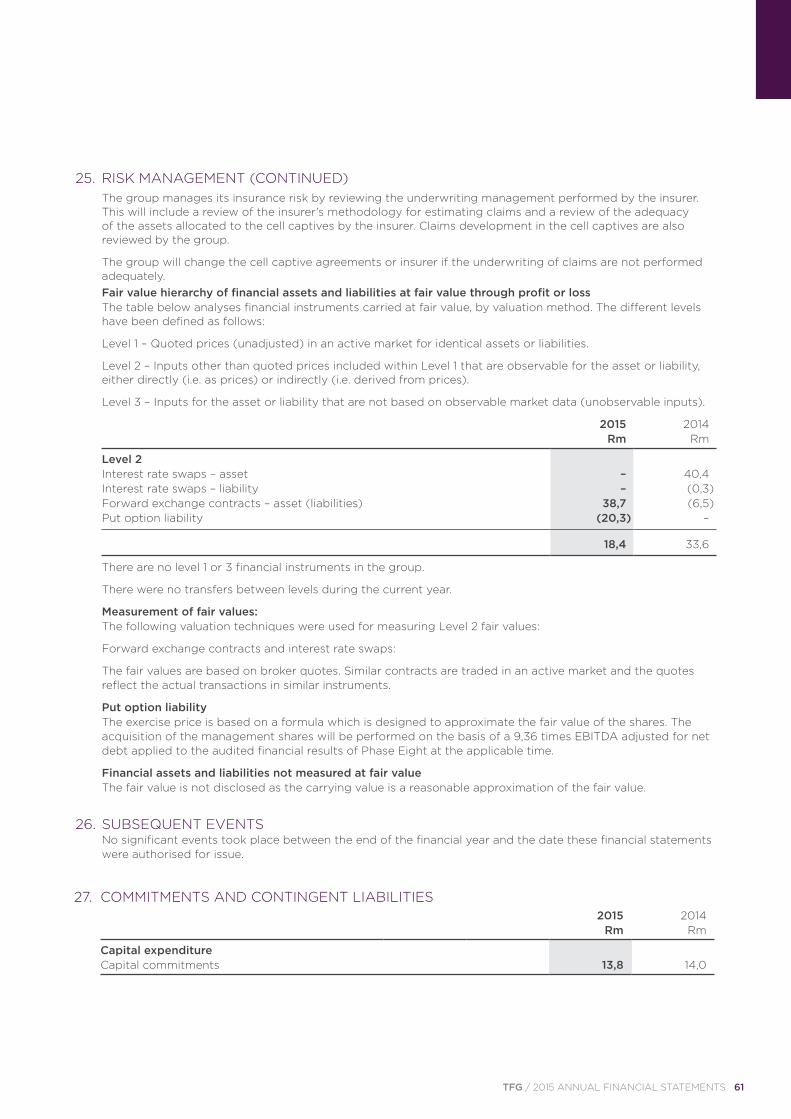
TFG / 2015 ANNUAL FINANCIAL STATEMENTS 61
The group manages its insurance risk by reviewing the underwriting management performed by the insurer. This will include a review of the insurer’s methodology for estimating claims and a review of the adequacy of the assets allocated to the cell captives by the insurer. Claims development in the cell captives are also reviewed by the group.
The group will change the cell captive agreements or insurer if the underwriting of claims are not performed adequately.
Fair value hierarchy of financial assets and liabilities at fair value through profit or loss
The table below analyses financial instruments carried at fair value, by valuation method. The different levels have been defined as follows:
Level 1 – Quoted prices (unadjusted) in an active market for identical assets or liabilities.
Level 2 – Inputs other than quoted prices included within Level 1 that are observable for the asset or liability, either directly (i.e. as prices) or indirectly (i.e. derived from prices).
Level 3 – Inputs for the asset or liability that are not based on observable market data (unobservable inputs).
2015 2014
Rm Rm
Level 2 Interest rate swaps – asset – 40,4 Interest rate swaps – liability – (0,3) Forward exchange contracts – asset (liabilities) 38,7 (6,5)
Put option liability (20,3) –
18,4 33,6
There are no level 1 or 3 financial instruments in the group.
There were no transfers between levels during the current year.
Measurement of fair values: The following valuation techniques were used for measuring Level 2 fair values:
Forward exchange contracts and interest rate swaps:
The fair values are based on broker quotes. Similar contracts are traded in an active market and the quotes reflect the actual transactions in similar instruments.
Put option liability
The exercise price is based on a formula which is designed to approximate the fair value of the shares. The acquisition of the management shares will be performed on the basis of a 9,36 times EBITDA adjusted for net debt applied to the audited financial results of Phase Eight at the applicable time.
Financial assets and liabilities not measured at fair value The fair value is not disclosed as the carrying value is a reasonable approximation of the fair value.
26. SUBSEQUENT EVENTS
No significant events took place between the end of the financial year and the date these financial statements were authorised for issue.
25. RISK MANAGEMENT (CONTINUED)
27. COMMITMENTS AND CONTINGENT LIABILITIES
Capital expenditure
Capital commitments 13,8 14,0
2015 2014
Rm Rm
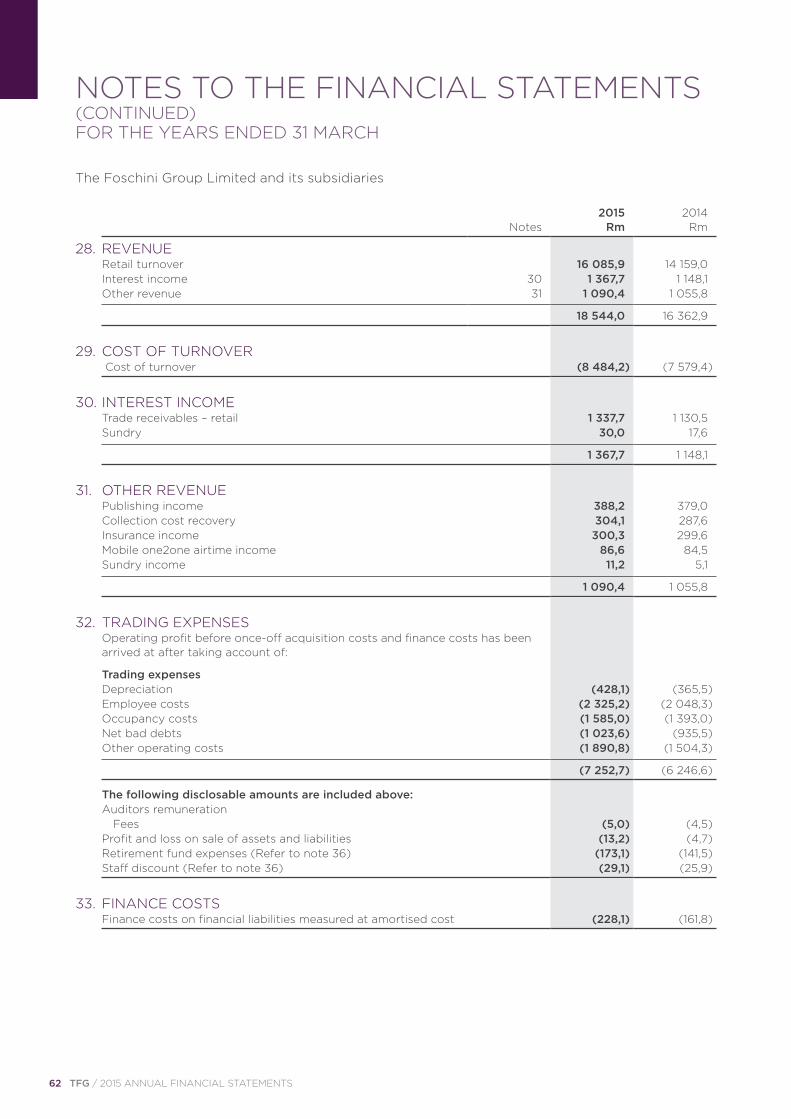
62 TFG / 2015 ANNUAL FINANCIAL STATEMENTS
NOTES TO THE FINANCIAL STATEMENTS (CONTINUED)FOR THE YEARS ENDED 31 MARCH
The Foschini Group Limited and its subsidiaries
Notes2015
Rm2014
Rm
28. REVENUE Retail turnover 16 085,9 14 159,0 Interest income 30 1 367,7 1 148,1
Other revenue 31 1 090,4 1 055,8
18 544,0 16 362,9
29. COST OF TURNOVER
Cost of turnover (8 484,2) (7 579,4)
30. INTEREST INCOME Trade receivables – retail 1 337,7 1 130,5
Sundry 30,0 17,6
1 367,7 1 148,1
31. OTHER REVENUE Publishing income 388,2 379,0 Collection cost recovery 304,1 287,6 Insurance income 300,3 299,6 Mobile one2one airtime income 86,6 84,5
Sundry income 11,2 5,1
1 090,4 1 055,8
32. TRADING EXPENSES
Operating profit before once-off acquisition costs and finance costs has been arrived at after taking account of:
Trading expenses Depreciation (428,1) (365,5) Employee costs (2 325,2) (2 048,3) Occupancy costs (1 585,0) (1 393,0) Net bad debts (1 023,6) (935,5)
Other operating costs (1 890,8) (1 504,3)
(7 252,7) (6 246,6)
The following disclosable amounts are included above: Auditors remuneration Fees (5,0) (4,5) Profit and loss on sale of assets and liabilities (13,2) (4,7) Retirement fund expenses (Refer to note 36) (173,1) (141,5)
Staff discount (Refer to note 36) (29,1) (25,9)
33. FINANCE COSTS
Finance costs on financial liabilities measured at amortised cost (228,1) (161,8)
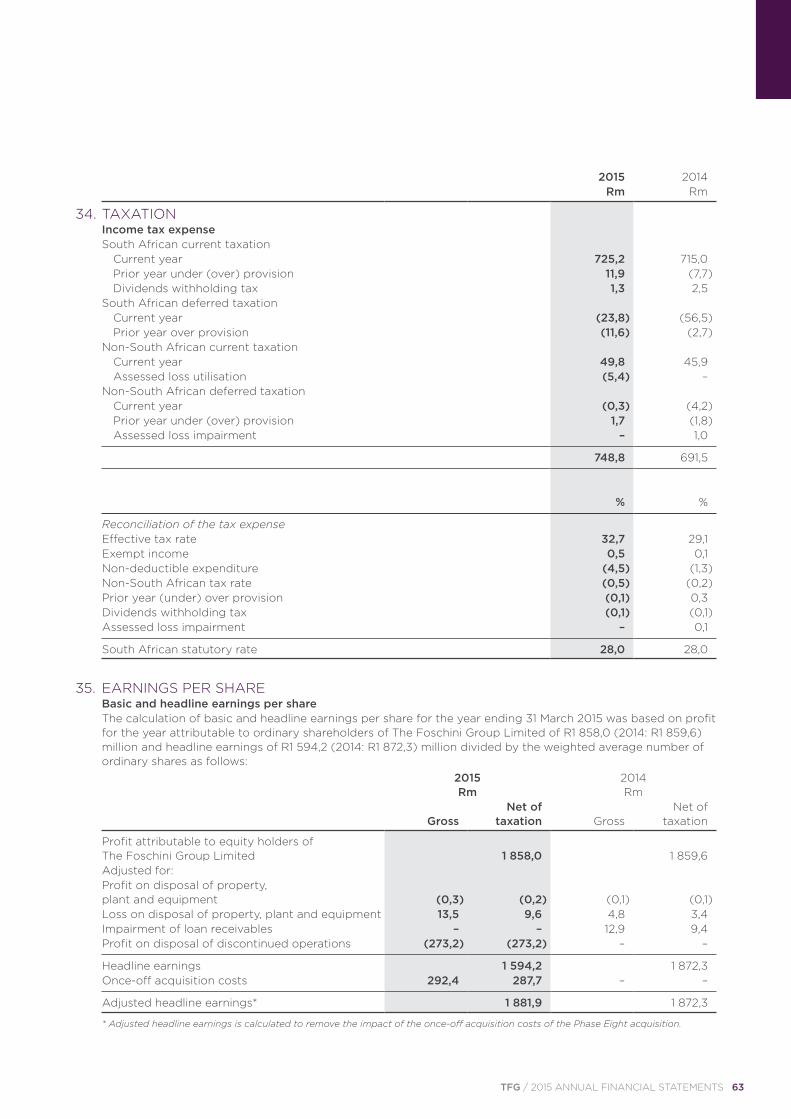
TFG / 2015 ANNUAL FINANCIAL STATEMENTS 63
34. TAXATION Income tax expense South African current taxation Current year 725,2 715,0 Prior year under (over) provision 11,9 (7,7) Dividends withholding tax 1,3 2,5 South African deferred taxation Current year (23,8) (56,5) Prior year over provision (11,6) (2,7) Non-South African current taxation Current year 49,8 45,9 Assessed loss utilisation (5,4) – Non-South African deferred taxation Current year (0,3) (4,2) Prior year under (over) provision 1,7 (1,8)
Assessed loss impairment – 1,0
748,8 691,5
% %
Reconciliation of the tax expense Effective tax rate 32,7 29,1 Exempt income 0,5 0,1 Non-deductible expenditure (4,5) (1,3) Non-South African tax rate (0,5) (0,2) Prior year (under) over provision (0,1) 0,3 Dividends withholding tax (0,1) (0,1)
Assessed loss impairment – 0,1
South African statutory rate 28,0 28,0
2015 2014
Rm Rm
35. EARNINGS PER SHARE Basic and headline earnings per share
The calculation of basic and headline earnings per share for the year ending 31 March 2015 was based on profit for the year attributable to ordinary shareholders of The Foschini Group Limited of R1 858,0 (2014: R1 859,6) million and headline earnings of R1 594,2 (2014: R1 872,3) million divided by the weighted average number of ordinary shares as follows:
2015Rm
2014Rm
GrossNet of
taxation GrossNet of
taxation
Profit attributable to equity holders of The Foschini Group Limited 1 858,0 1 859,6
Adjusted for:
Profit on disposal of property, plant and equipment (0,3) (0,2) (0,1) (0,1)
Loss on disposal of property, plant and equipment 13,5 9,6 4,8 3,4 Impairment of loan receivables – – 12,9 9,4
Profit on disposal of discontinued operations (273,2) (273,2) – –
Headline earnings 1 594,2 1 872,3
Once-off acquisition costs 292,4 287,7 – –
Adjusted headline earnings* 1 881,9 1 872,3
* Adjusted headline earnings is calculated to remove the impact of the once-off acquisition costs of the Phase Eight acquisition.
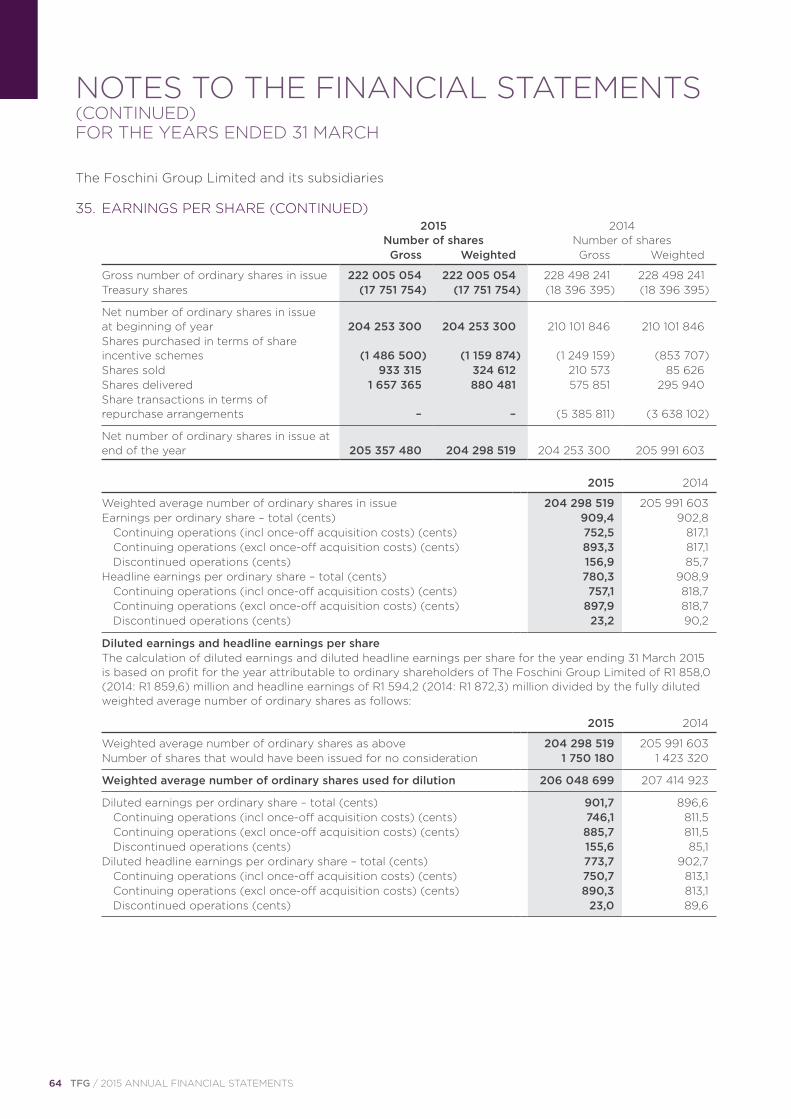
64 TFG / 2015 ANNUAL FINANCIAL STATEMENTS
NOTES TO THE FINANCIAL STATEMENTS (CONTINUED)FOR THE YEARS ENDED 31 MARCH
The Foschini Group Limited and its subsidiaries
2015
Number of shares2014
Number of shares
Gross Weighted Gross Weighted
Gross number of ordinary shares in issue 222 005 054 222 005 054 228 498 241 228 498 241
Treasury shares (17 751 754) (17 751 754) (18 396 395) (18 396 395)
Net number of ordinary shares in issueat beginning of year 204 253 300 204 253 300 210 101 846 210 101 846
Shares purchased in terms of share incentive schemes (1 486 500) (1 159 874) (1 249 159) (853 707)
Shares sold 933 315 324 612 210 573 85 626 Shares delivered 1 657 365 880 481 575 851 295 940
Share transactions in terms of repurchase arrangements – – (5 385 811) (3 638 102)
Net number of ordinary shares in issue at end of the year 205 357 480 204 298 519 204 253 300 205 991 603
2015 2014
Weighted average number of ordinary shares in issue 204 298 519 205 991 603 Earnings per ordinary share – total (cents) 909,4 902,8 Continuing operations (incl once-off acquisition costs) (cents) 752,5 817,1 Continuing operations (excl once-off acquisition costs) (cents) 893,3 817,1 Discontinued operations (cents) 156,9 85,7 Headline earnings per ordinary share – total (cents) 780,3 908,9 Continuing operations (incl once-off acquisition costs) (cents) 757,1 818,7 Continuing operations (excl once-off acquisition costs) (cents) 897,9 818,7
Discontinued operations (cents) 23,2 90,2
Diluted earnings and headline earnings per share
The calculation of diluted earnings and diluted headline earnings per share for the year ending 31 March 2015 is based on profit for the year attributable to ordinary shareholders of The Foschini Group Limited of R1 858,0 (2014: R1 859,6) million and headline earnings of R1 594,2 (2014: R1 872,3) million divided by the fully diluted weighted average number of ordinary shares as follows:
2015 2014
Weighted average number of ordinary shares as above 204 298 519 205 991 603
Number of shares that would have been issued for no consideration 1 750 180 1 423 320
Weighted average number of ordinary shares used for dilution 206 048 699 207 414 923
Diluted earnings per ordinary share – total (cents) 901,7 896,6 Continuing operations (incl once-off acquisition costs) (cents) 746,1 811,5 Continuing operations (excl once-off acquisition costs) (cents) 885,7 811,5 Discontinued operations (cents) 155,6 85,1 Diluted headline earnings per ordinary share – total (cents) 773,7 902,7 Continuing operations (incl once-off acquisition costs) (cents) 750,7 813,1 Continuing operations (excl once-off acquisition costs) (cents) 890,3 813,1
Discontinued operations (cents) 23,0 89,6
35. EARNINGS PER SHARE (CONTINUED)
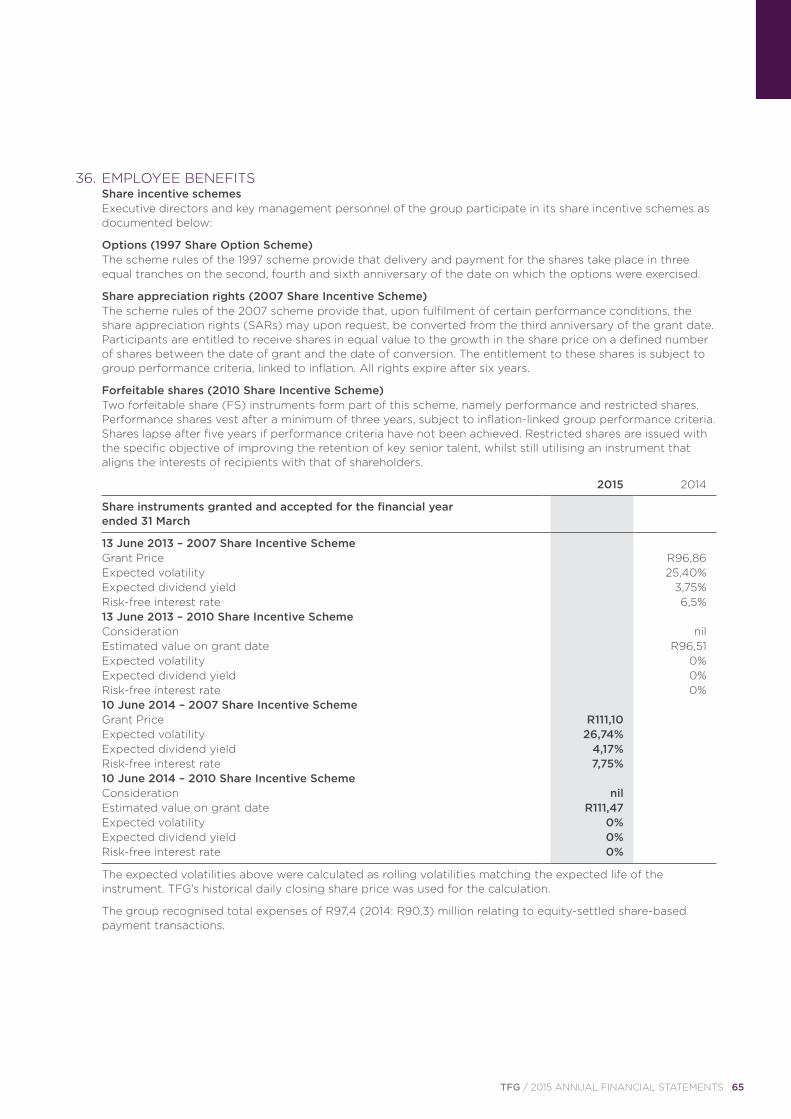
TFG / 2015 ANNUAL FINANCIAL STATEMENTS 65
36. EMPLOYEE BENEFITS Share incentive schemes
Executive directors and key management personnel of the group participate in its share incentive schemes as documented below:
Options (1997 Share Option Scheme)
The scheme rules of the 1997 scheme provide that delivery and payment for the shares take place in three equal tranches on the second, fourth and sixth anniversary of the date on which the options were exercised.
Share appreciation rights (2007 Share Incentive Scheme)
The scheme rules of the 2007 scheme provide that, upon fulfilment of certain performance conditions, the share appreciation rights (SARs) may upon request, be converted from the third anniversary of the grant date. Participants are entitled to receive shares in equal value to the growth in the share price on a defined number of shares between the date of grant and the date of conversion. The entitlement to these shares is subject to group performance criteria, linked to inflation. All rights expire after six years.
Forfeitable shares (2010 Share Incentive Scheme)
Two forfeitable share (FS) instruments form part of this scheme, namely performance and restricted shares. Performance shares vest after a minimum of three years, subject to inflation-linked group performance criteria. Shares lapse after five years if performance criteria have not been achieved. Restricted shares are issued with the specific objective of improving the retention of key senior talent, whilst still utilising an instrument that aligns the interests of recipients with that of shareholders.
2015 2014
Share instruments granted and accepted for the financial year ended 31 March
13 June 2013 – 2007 Share Incentive Scheme Grant Price R96,86 Expected volatility 25,40% Expected dividend yield 3,75% Risk-free interest rate 6,5% 13 June 2013 – 2010 Share Incentive Scheme Consideration nil Estimated value on grant date R96,51 Expected volatility 0% Expected dividend yield 0% Risk-free interest rate 0% 10 June 2014 – 2007 Share Incentive Scheme Grant Price R111,10 Expected volatility 26,74% Expected dividend yield 4,17% Risk-free interest rate 7,75% 10 June 2014 – 2010 Share Incentive Scheme Consideration nil Estimated value on grant date R111,47 Expected volatility 0% Expected dividend yield 0%
Risk-free interest rate 0%
The expected volatilities above were calculated as rolling volatilities matching the expected life of the instrument. TFG’s historical daily closing share price was used for the calculation.
The group recognised total expenses of R97,4 (2014: R90,3) million relating to equity-settled share-based payment transactions.
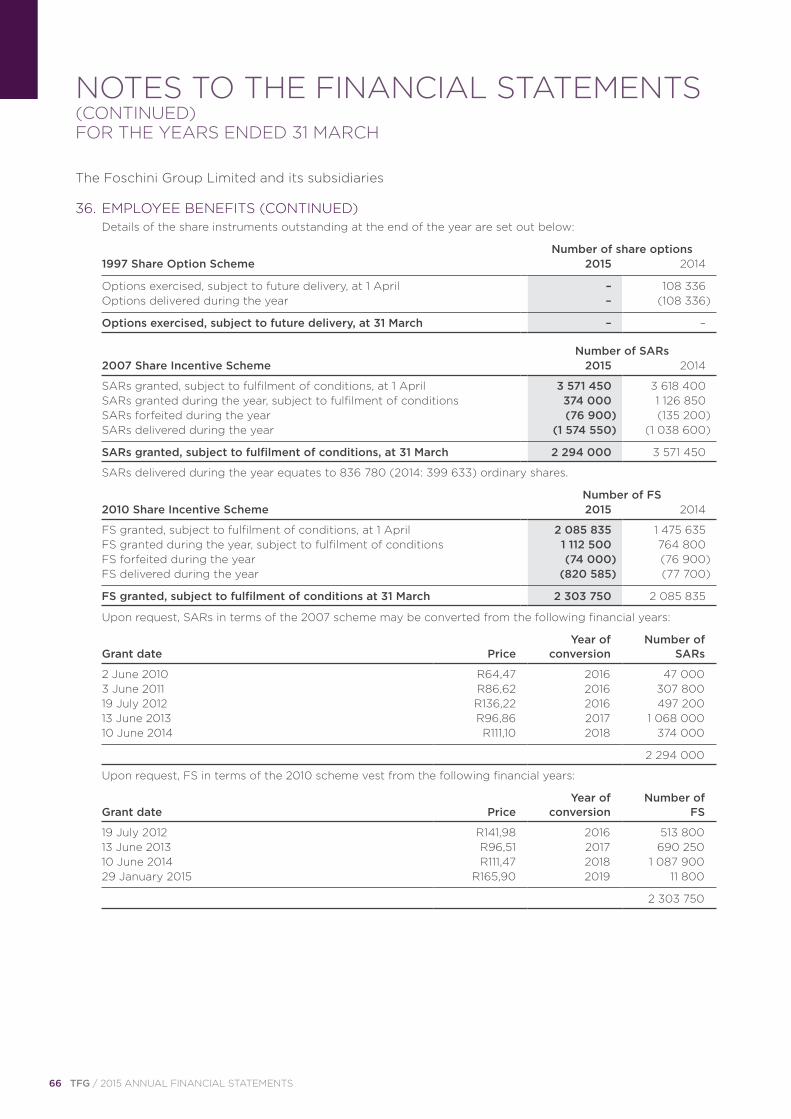
66 TFG / 2015 ANNUAL FINANCIAL STATEMENTS
NOTES TO THE FINANCIAL STATEMENTS (CONTINUED)FOR THE YEARS ENDED 31 MARCH
The Foschini Group Limited and its subsidiaries
Details of the share instruments outstanding at the end of the year are set out below:
Number of share options
1997 Share Option Scheme 2015 2014
Options exercised, subject to future delivery, at 1 April – 108 336
Options delivered during the year – (108 336)
Options exercised, subject to future delivery, at 31 March – –
Number of SARs
2007 Share Incentive Scheme 2015 2014
SARs granted, subject to fulfilment of conditions, at 1 April 3 571 450 3 618 400 SARs granted during the year, subject to fulfilment of conditions 374 000 1 126 850 SARs forfeited during the year (76 900) (135 200)
SARs delivered during the year (1 574 550) (1 038 600)
SARs granted, subject to fulfilment of conditions, at 31 March 2 294 000 3 571 450
SARs delivered during the year equates to 836 780 (2014: 399 633) ordinary shares.
Number of FS
2010 Share Incentive Scheme 2015 2014
FS granted, subject to fulfilment of conditions, at 1 April 2 085 835 1 475 635 FS granted during the year, subject to fulfilment of conditions 1 112 500 764 800 FS forfeited during the year (74 000) (76 900)
FS delivered during the year (820 585) (77 700)
FS granted, subject to fulfilment of conditions at 31 March 2 303 750 2 085 835
Upon request, SARs in terms of the 2007 scheme may be converted from the following financial years:
Grant date PriceYear of
conversionNumber of
SARs
2 June 2010 R64,47 2016 47 000 3 June 2011 R86,62 2016 307 800 19 July 2012 R136,22 2016 497 200 13 June 2013 R96,86 2017 1 068 000
10 June 2014 R111,10 2018 374 000
2 294 000
Upon request, FS in terms of the 2010 scheme vest from the following financial years:
Grant date PriceYear of
conversionNumber of
FS
19 July 2012 R141,98 2016 513 800 13 June 2013 R96,51 2017 690 250 10 June 2014 R111,47 2018 1 087 900
29 January 2015 R165,90 2019 11 800
2 303 750
36. EMPLOYEE BENEFITS (CONTINUED)
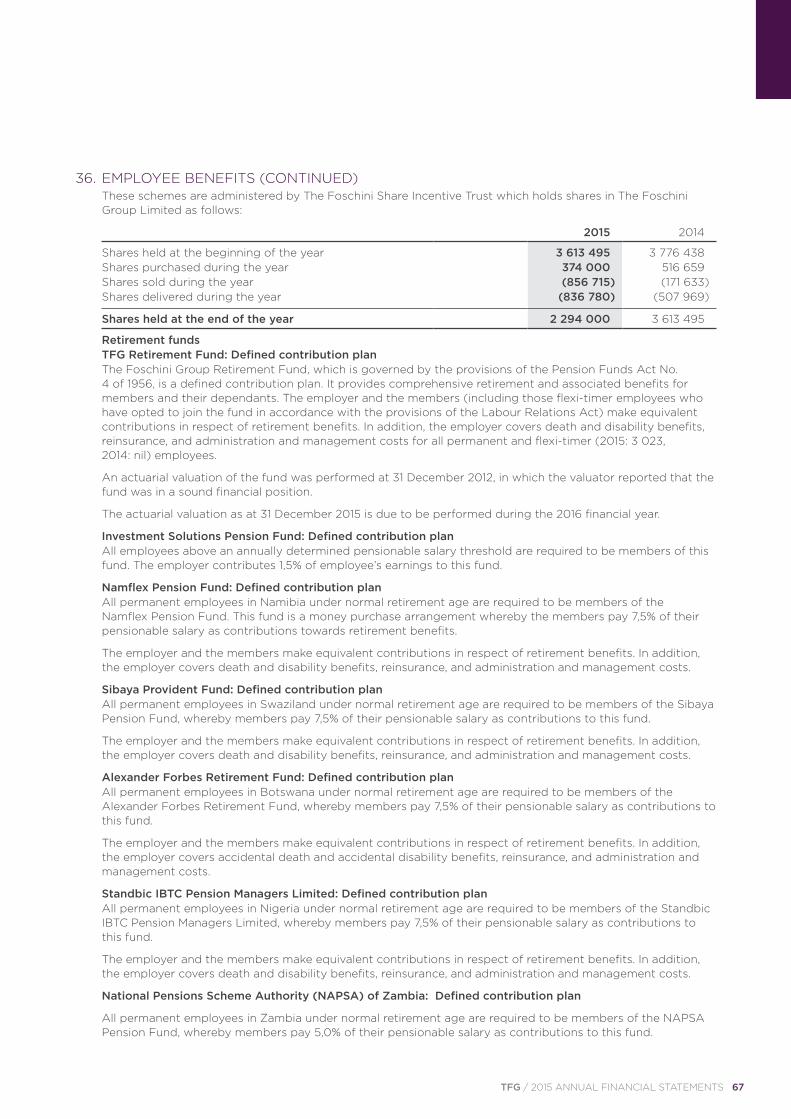
TFG / 2015 ANNUAL FINANCIAL STATEMENTS 67
These schemes are administered by The Foschini Share Incentive Trust which holds shares in The Foschini Group Limited as follows:
2015 2014
Shares held at the beginning of the year 3 613 495 3 776 438 Shares purchased during the year 374 000 516 659 Shares sold during the year (856 715) (171 633)
Shares delivered during the year (836 780) (507 969)
Shares held at the end of the year 2 294 000 3 613 495
Retirement funds TFG Retirement Fund: Defined contribution plan
The Foschini Group Retirement Fund, which is governed by the provisions of the Pension Funds Act No. 4 of 1956, is a defined contribution plan. It provides comprehensive retirement and associated benefits for members and their dependants. The employer and the members (including those flexi-timer employees who have opted to join the fund in accordance with the provisions of the Labour Relations Act) make equivalent contributions in respect of retirement benefits. In addition, the employer covers death and disability benefits, reinsurance, and administration and management costs for all permanent and flexi-timer (2015: 3 023, 2014: nil) employees.
An actuarial valuation of the fund was performed at 31 December 2012, in which the valuator reported that the fund was in a sound financial position.
The actuarial valuation as at 31 December 2015 is due to be performed during the 2016 financial year.
Investment Solutions Pension Fund: Defined contribution plan
All employees above an annually determined pensionable salary threshold are required to be members of this fund. The employer contributes 1,5% of employee’s earnings to this fund.
Namflex Pension Fund: Defined contribution plan
All permanent employees in Namibia under normal retirement age are required to be members of the Namflex Pension Fund. This fund is a money purchase arrangement whereby the members pay 7,5% of their pensionable salary as contributions towards retirement benefits.
The employer and the members make equivalent contributions in respect of retirement benefits. In addition, the employer covers death and disability benefits, reinsurance, and administration and management costs.
Sibaya Provident Fund: Defined contribution plan
All permanent employees in Swaziland under normal retirement age are required to be members of the Sibaya Pension Fund, whereby members pay 7,5% of their pensionable salary as contributions to this fund.
The employer and the members make equivalent contributions in respect of retirement benefits. In addition, the employer covers death and disability benefits, reinsurance, and administration and management costs.
Alexander Forbes Retirement Fund: Defined contribution plan
All permanent employees in Botswana under normal retirement age are required to be members of the Alexander Forbes Retirement Fund, whereby members pay 7,5% of their pensionable salary as contributions to this fund.
The employer and the members make equivalent contributions in respect of retirement benefits. In addition, the employer covers accidental death and accidental disability benefits, reinsurance, and administration and management costs.
Standbic IBTC Pension Managers Limited: Defined contribution plan
All permanent employees in Nigeria under normal retirement age are required to be members of the Standbic IBTC Pension Managers Limited, whereby members pay 7,5% of their pensionable salary as contributions to this fund.
The employer and the members make equivalent contributions in respect of retirement benefits. In addition, the employer covers death and disability benefits, reinsurance, and administration and management costs.
National Pensions Scheme Authority (NAPSA) of Zambia: Defined contribution plan
All permanent employees in Zambia under normal retirement age are required to be members of the NAPSA Pension Fund, whereby members pay 5,0% of their pensionable salary as contributions to this fund.
36. EMPLOYEE BENEFITS (CONTINUED)
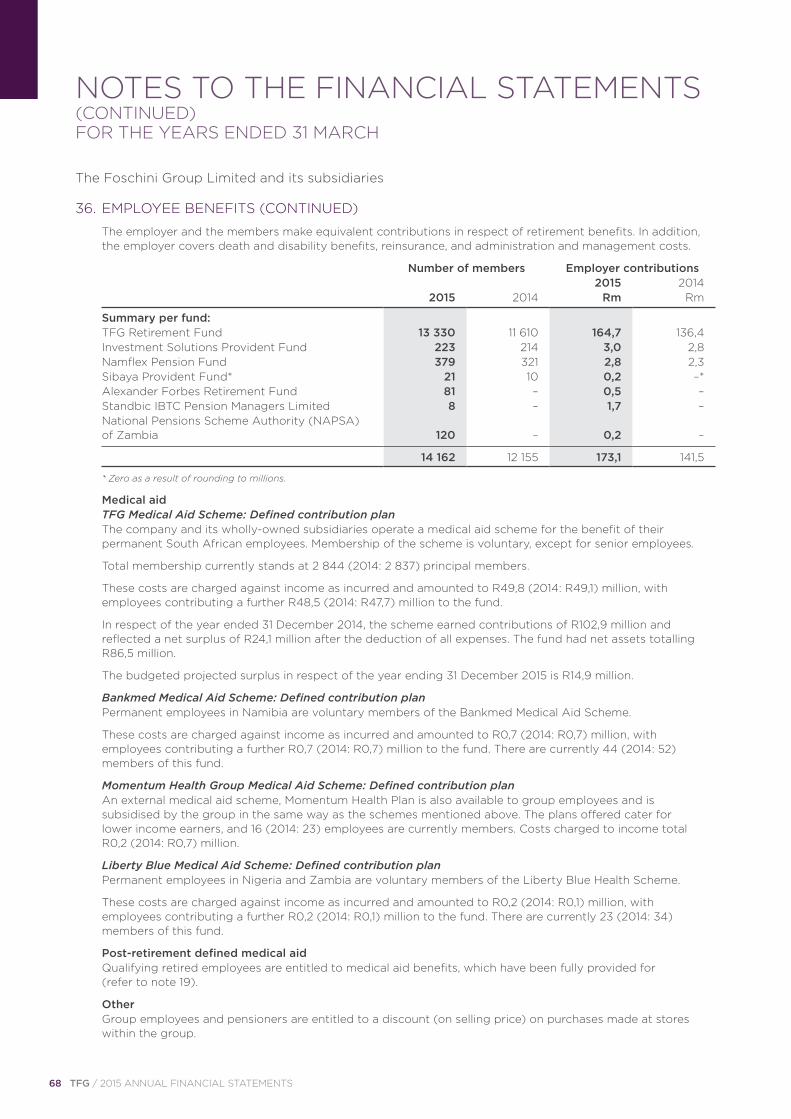
68 TFG / 2015 ANNUAL FINANCIAL STATEMENTS
NOTES TO THE FINANCIAL STATEMENTS (CONTINUED)FOR THE YEARS ENDED 31 MARCH
The Foschini Group Limited and its subsidiaries
The employer and the members make equivalent contributions in respect of retirement benefits. In addition, the employer covers death and disability benefits, reinsurance, and administration and management costs.
Number of members Employer contributions 2015 2014
2015 2014 Rm Rm
Summary per fund: TFG Retirement Fund 13 330 11 610 164,7 136,4 Investment Solutions Provident Fund 223 214 3,0 2,8 Namflex Pension Fund 379 321 2,8 2,3 Sibaya Provident Fund* 21 10 0,2 –* Alexander Forbes Retirement Fund 81 – 0,5 – Standbic IBTC Pension Managers Limited 8 – 1,7 –
National Pensions Scheme Authority (NAPSA) of Zambia 120 – 0,2 –
14 162 12 155 173,1 141,5
* Zero as a result of rounding to millions.
Medical aid TFG Medical Aid Scheme: Defined contribution plan
The company and its wholly-owned subsidiaries operate a medical aid scheme for the benefit of their permanent South African employees. Membership of the scheme is voluntary, except for senior employees.
Total membership currently stands at 2 844 (2014: 2 837) principal members.
These costs are charged against income as incurred and amounted to R49,8 (2014: R49,1) million, with employees contributing a further R48,5 (2014: R47,7) million to the fund.
In respect of the year ended 31 December 2014, the scheme earned contributions of R102,9 million and reflected a net surplus of R24,1 million after the deduction of all expenses. The fund had net assets totalling R86,5 million.
The budgeted projected surplus in respect of the year ending 31 December 2015 is R14,9 million.
Bankmed Medical Aid Scheme: Defined contribution plan Permanent employees in Namibia are voluntary members of the Bankmed Medical Aid Scheme.
These costs are charged against income as incurred and amounted to R0,7 (2014: R0,7) million, with employees contributing a further R0,7 (2014: R0,7) million to the fund. There are currently 44 (2014: 52) members of this fund.
Momentum Health Group Medical Aid Scheme: Defined contribution plan
An external medical aid scheme, Momentum Health Plan is also available to group employees and is subsidised by the group in the same way as the schemes mentioned above. The plans offered cater for lower income earners, and 16 (2014: 23) employees are currently members. Costs charged to income total R0,2 (2014: R0,7) million.
Liberty Blue Medical Aid Scheme: Defined contribution plan Permanent employees in Nigeria and Zambia are voluntary members of the Liberty Blue Health Scheme.
These costs are charged against income as incurred and amounted to R0,2 (2014: R0,1) million, with employees contributing a further R0,2 (2014: R0,1) million to the fund. There are currently 23 (2014: 34) members of this fund.
Post-retirement defined medical aid
Qualifying retired employees are entitled to medical aid benefits, which have been fully provided for (refer to note 19).
Other
Group employees and pensioners are entitled to a discount (on selling price) on purchases made at stores within the group.
36. EMPLOYEE BENEFITS (CONTINUED)
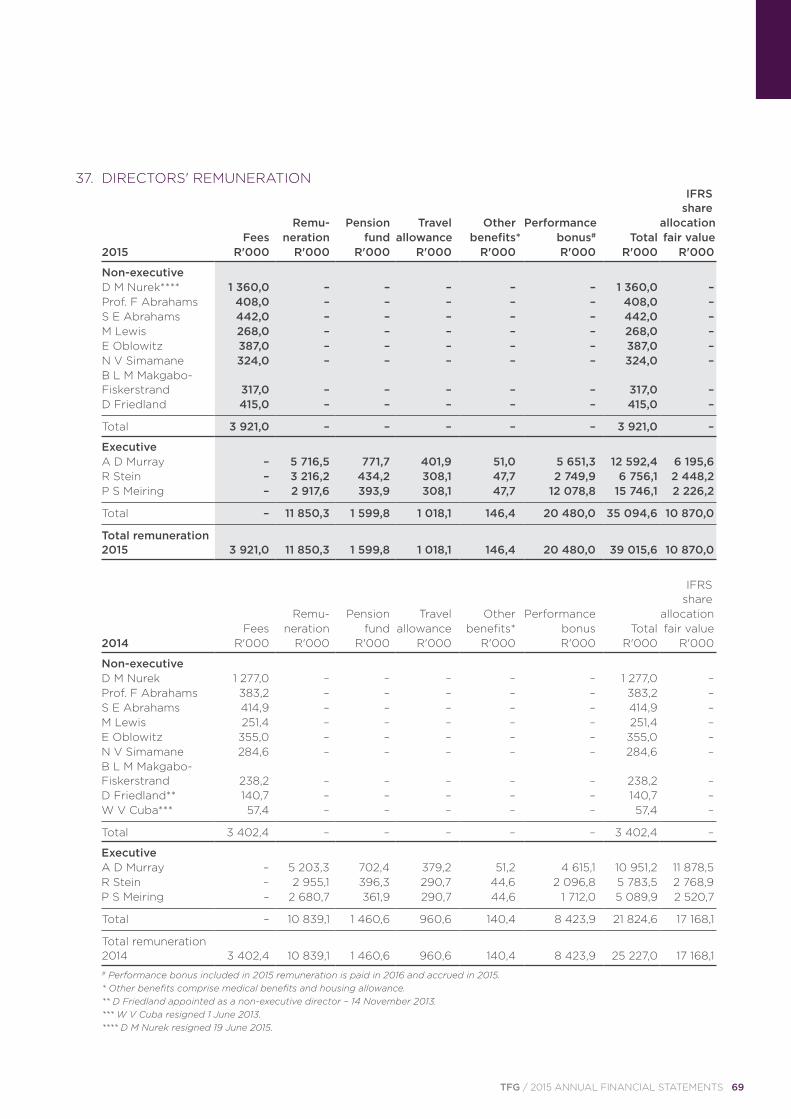
TFG / 2015 ANNUAL FINANCIAL STATEMENTS 69
37. DIRECTORS' REMUNERATION
IFRS
share Remu- Pension Travel Other Performance allocation Fees neration fund allowance benefits* bonus# Total fair value
2015 R'000 R'000 R'000 R'000 R'000 R'000 R'000 R'000
Non-executive D M Nurek**** 1 360,0 – – – – – 1 360,0 – Prof. F Abrahams 408,0 – – – – – 408,0 – S E Abrahams 442,0 – – – – – 442,0 – M Lewis 268,0 – – – – – 268,0 – E Oblowitz 387,0 – – – – – 387,0 – N V Simamane 324,0 – – – – – 324,0 –
B L M Makgabo-Fiskerstrand 317,0 – – – – – 317,0 –
D Friedland 415,0 – – – – – 415,0 –
Total 3 921,0 – – – – – 3 921,0 –
Executive A D Murray – 5 716,5 771,7 401,9 51,0 5 651,3 12 592,4 6 195,6 R Stein – 3 216,2 434,2 308,1 47,7 2 749,9 6 756,1 2 448,2
P S Meiring – 2 917,6 393,9 308,1 47,7 12 078,8 15 746,1 2 226,2
Total – 11 850,3 1 599,8 1 018,1 146,4 20 480,0 35 094,6 10 870,0
Total remuneration 2015 3 921,0 11 850,3 1 599,8 1 018,1 146,4 20 480,0 39 015,6 10 870,0
IFRS
share Remu- Pension Travel Other Performance allocation Fees neration fund allowance benefits* bonus Total fair value
2014 R'000 R'000 R'000 R'000 R'000 R'000 R'000 R'000
Non-executive D M Nurek 1 277,0 – – – – – 1 277,0 – Prof. F Abrahams 383,2 – – – – – 383,2 – S E Abrahams 414,9 – – – – – 414,9 – M Lewis 251,4 – – – – – 251,4 – E Oblowitz 355,0 – – – – – 355,0 – N V Simamane 284,6 – – – – – 284,6 –
B L M Makgabo-Fiskerstrand 238,2 – – – – – 238,2 –
D Friedland** 140,7 – – – – – 140,7 –
W V Cuba*** 57,4 – – – – – 57,4 –
Total 3 402,4 – – – – – 3 402,4 –
Executive A D Murray – 5 203,3 702,4 379,2 51,2 4 615,1 10 951,2 11 878,5 R Stein – 2 955,1 396,3 290,7 44,6 2 096,8 5 783,5 2 768,9
P S Meiring – 2 680,7 361,9 290,7 44,6 1 712,0 5 089,9 2 520,7
Total – 10 839,1 1 460,6 960,6 140,4 8 423,9 21 824,6 17 168,1
Total remuneration 2014 3 402,4 10 839,1 1 460,6 960,6 140,4 8 423,9 25 227,0 17 168,1
# Performance bonus included in 2015 remuneration is paid in 2016 and accrued in 2015. * Other benefits comprise medical benefits and housing allowance. ** D Friedland appointed as a non-executive director – 14 November 2013. *** W V Cuba resigned 1 June 2013.
**** D M Nurek resigned 19 June 2015.
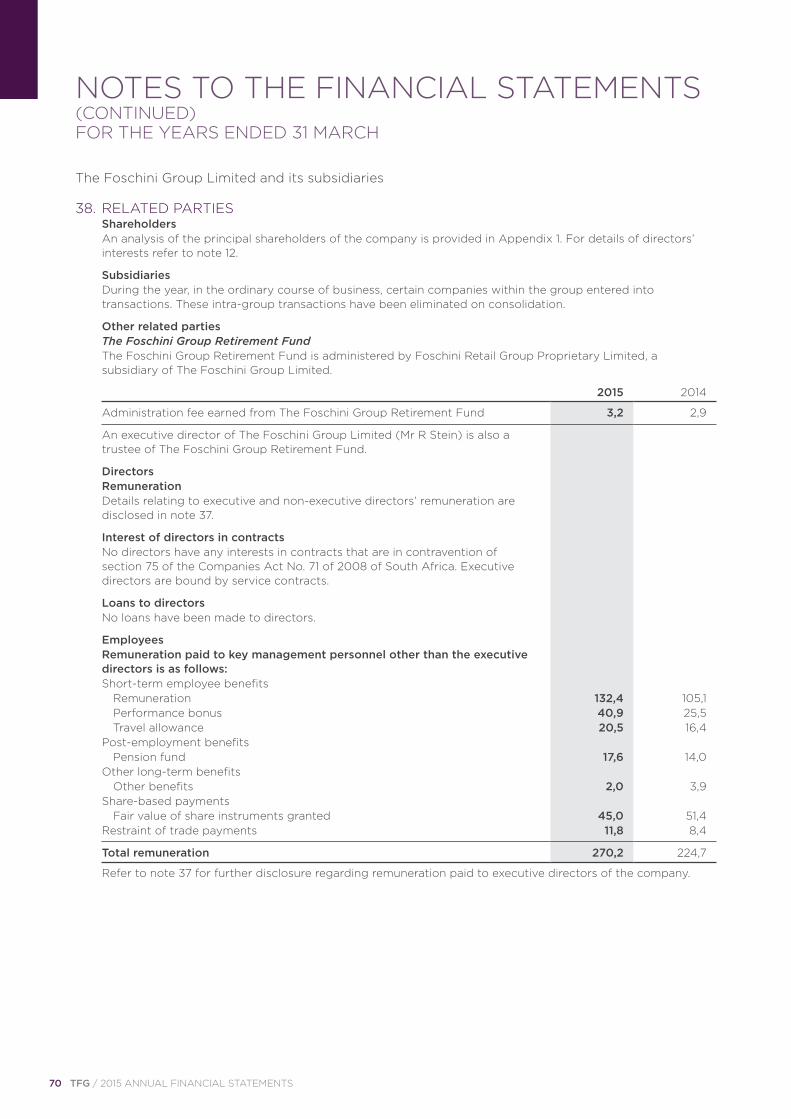
70 TFG / 2015 ANNUAL FINANCIAL STATEMENTS
NOTES TO THE FINANCIAL STATEMENTS (CONTINUED)FOR THE YEARS ENDED 31 MARCH
The Foschini Group Limited and its subsidiaries
38. RELATED PARTIES Shareholders
An analysis of the principal shareholders of the company is provided in Appendix 1. For details of directors’ interests refer to note 12.
Subsidiaries
During the year, in the ordinary course of business, certain companies within the group entered into transactions. These intra-group transactions have been eliminated on consolidation.
Other related parties The Foschini Group Retirement Fund
The Foschini Group Retirement Fund is administered by Foschini Retail Group Proprietary Limited, a subsidiary of The Foschini Group Limited.
2015 2014
Administration fee earned from The Foschini Group Retirement Fund 3,2 2,9
An executive director of The Foschini Group Limited (Mr R Stein) is also a trustee of The Foschini Group Retirement Fund.
Directors Remuneration
Details relating to executive and non-executive directors’ remuneration are disclosed in note 37.
Interest of directors in contracts
No directors have any interests in contracts that are in contravention of section 75 of the Companies Act No. 71 of 2008 of South Africa. Executive directors are bound by service contracts.
Loans to directors No loans have been made to directors.
Employees
Remuneration paid to key management personnel other than the executive directors is as follows:
Short-term employee benefits Remuneration 132,4 105,1 Performance bonus 40,9 25,5 Travel allowance 20,5 16,4 Post-employment benefits Pension fund 17,6 14,0 Other long-term benefits Other benefits 2,0 3,9 Share-based payments Fair value of share instruments granted 45,0 51,4
Restraint of trade payments 11,8 8,4
Total remuneration 270,2 224,7
Refer to note 37 for further disclosure regarding remuneration paid to executive directors of the company.
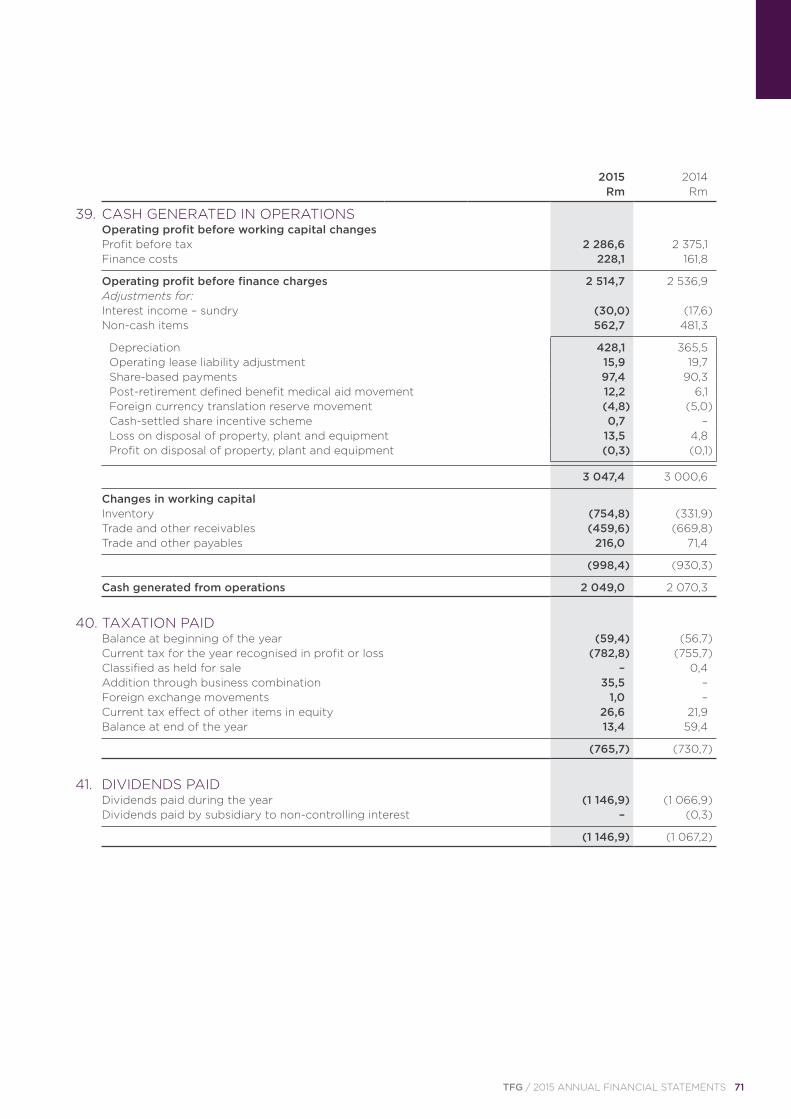
TFG / 2015 ANNUAL FINANCIAL STATEMENTS 71
39. CASH GENERATED IN OPERATIONS Operating profit before working capital changes Profit before tax 2 286,6 2 375,1
Finance costs 228,1 161,8
Operating profit before finance charges 2 514,7 2 536,9 Adjustments for: Interest income – sundry (30,0) (17,6) Non-cash items 562,7 481,3
Depreciation 428,1 365,5 Operating lease liability adjustment 15,9 19,7 Share-based payments 97,4 90,3 Post-retirement defined benefit medical aid movement 12,2 6,1 Foreign currency translation reserve movement (4,8) (5,0) Cash-settled share incentive scheme 0,7 – Loss on disposal of property, plant and equipment 13,5 4,8 Profit on disposal of property, plant and equipment (0,3) (0,1)
3 047,4 3 000,6
Changes in working capital Inventory (754,8) (331,9) Trade and other receivables (459,6) (669,8)
Trade and other payables 216,0 71,4
(998,4) (930,3)
Cash generated from operations 2 049,0 2 070,3
40. TAXATION PAID Balance at beginning of the year (59,4) (56,7) Current tax for the year recognised in profit or loss (782,8) (755,7) Classified as held for sale – 0,4 Addition through business combination 35,5 – Foreign exchange movements 1,0 – Current tax effect of other items in equity 26,6 21,9
Balance at end of the year 13,4 59,4
(765,7) (730,7)
41. DIVIDENDS PAID Dividends paid during the year (1 146,9) (1 066,9)
Dividends paid by subsidiary to non-controlling interest – (0,3)
(1 146,9) (1 067,2)
2015 2014
Rm Rm
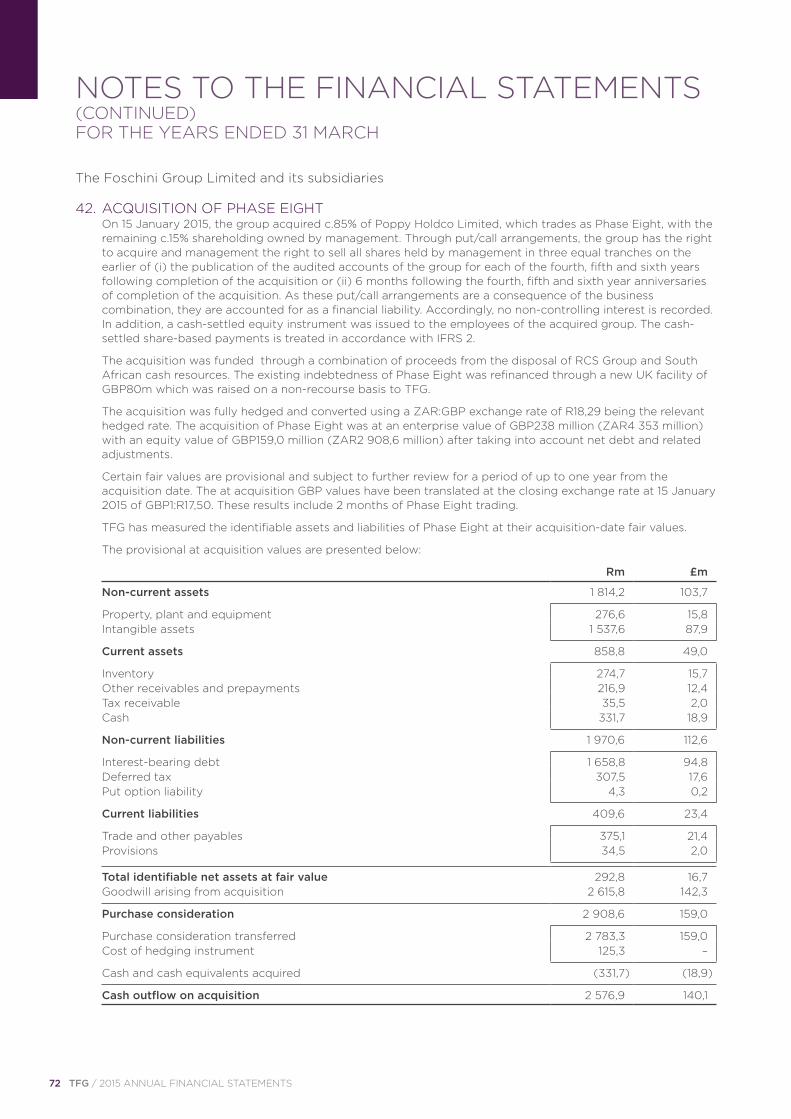
72 TFG / 2015 ANNUAL FINANCIAL STATEMENTS
NOTES TO THE FINANCIAL STATEMENTS (CONTINUED)FOR THE YEARS ENDED 31 MARCH
The Foschini Group Limited and its subsidiaries
42. ACQUISITION OF PHASE EIGHT
On 15 January 2015, the group acquired c.85% of Poppy Holdco Limited, which trades as Phase Eight, with the remaining c.15% shareholding owned by management. Through put/call arrangements, the group has the right to acquire and management the right to sell all shares held by management in three equal tranches on the earlier of (i) the publication of the audited accounts of the group for each of the fourth, fifth and sixth years following completion of the acquisition or (ii) 6 months following the fourth, fifth and sixth year anniversaries of completion of the acquisition. As these put/call arrangements are a consequence of the business combination, they are accounted for as a financial liability. Accordingly, no non-controlling interest is recorded. In addition, a cash-settled equity instrument was issued to the employees of the acquired group. The cash-settled share-based payments is treated in accordance with IFRS 2.
The acquisition was funded through a combination of proceeds from the disposal of RCS Group and South African cash resources. The existing indebtedness of Phase Eight was refinanced through a new UK facility of GBP80m which was raised on a non-recourse basis to TFG.
The acquisition was fully hedged and converted using a ZAR:GBP exchange rate of R18,29 being the relevant hedged rate. The acquisition of Phase Eight was at an enterprise value of GBP238 million (ZAR4 353 million) with an equity value of GBP159,0 million (ZAR2 908,6 million) after taking into account net debt and related adjustments.
Certain fair values are provisional and subject to further review for a period of up to one year from the acquisition date. The at acquisition GBP values have been translated at the closing exchange rate at 15 January 2015 of GBP1:R17,50. These results include 2 months of Phase Eight trading.
TFG has measured the identifiable assets and liabilities of Phase Eight at their acquisition-date fair values.
The provisional at acquisition values are presented below:
Rm £m
Non-current assets 1 814,2 103,7
Property, plant and equipment 276,6 15,8 Intangible assets 1 537,6 87,9
Current assets 858,8 49,0
Inventory 274,7 15,7 Other receivables and prepayments 216,9 12,4 Tax receivable 35,5 2,0 Cash 331,7 18,9
Non-current liabilities 1 970,6 112,6
Interest-bearing debt 1 658,8 94,8 Deferred tax 307,5 17,6 Put option liability 4,3 0,2
Current liabilities 409,6 23,4
Trade and other payables 375,1 21,4 Provisions 34,5 2,0
Total identifiable net assets at fair value 292,8 16,7
Goodwill arising from acquisition 2 615,8 142,3
Purchase consideration 2 908,6 159,0
Purchase consideration transferred 2 783,3 159,0 Cost of hedging instrument 125,3 –
Cash and cash equivalents acquired (331,7) (18,9)
Cash outflow on acquisition 2 576,9 140,1
TFG / 2015 ANNUAL FINANCIAL STATEMENTS 73
Goodwill of GBP 142,3 million (R2,6 billion) and the Phase Eight brand amounting to GBP 87,9 million (R1,5 billion) have been recognised as intangible assets at acquisition. Goodwill represents the value paid in excess of the provisional fair value of the net assets. This consists largely of the value assigned to the unique operating business model and future growth prospects. Once-off acquisition costs related to the acquisition of R292,4 million have been expensed in the current period.
42. ACQUISITION OF PHASE EIGHT (CONTINUED)
43. INTERESTS IN UNCONSOLIDATED STRUCTURED ENTITIES
43.1 TFG Foundation
The TFG Foundation is an unconsolidated structured entity of the group. The trust earns dividends and interest from investments held in the trust. The funds earned are disbursed to a number of non-profit organisations (NPO’s)/non-governmental organisation (NGO’s) across South Africa. The TFG Foundation disbursed funds totaling R8,6 (2014: R5,3) million across 46 (2014: 72) organisations nationally this past year. The group is not required to provide any financial assistance. There is no loan or receivable outstanding between the trust and the group at year-end.
43.2 The Feel Good Project
The project is run in partnership with one of our long-standing NPO partners, Learn 2 Earn and aims to create opportunities for employment in the South African retail sector. The project generated R10,4 (2014: R9,2) million turnover in the current financial year which is used to fund the project. The group is not required to provide any financial assistance. There is no loan or receivable outstanding between Learn 2 Earn and the group at year-end.
44. INSURANCE RECEIVABLE
2015
Rm2014
Rm
Balance at 1 April 119,5 253,0 Transfer to discontinued operations – (159,4) Increase in working capital of cell captive receivable 111,2 110,1
Dividends received (103,0) (84,2)
127,7 119,5
45. ACCOUNTING STANDARDS AND INTERPRETATIONS ADOPTED IN THE CURRENT YEAR
The financial statements have been prepared in accordance with International Financial Reporting Standards on a basis consistent with the prior year except for the adoption of the following new or revised standards.
IFRS 10, IFRS 12 and IAS 27 Investment Entities
During the current year the group adopted amendments to IFRS 10, IFRS 12 and IAS 27.
In terms of the amendment a qualifying investment company is required to account for investments in controlled companies, as well as investments in associates and joint ventures, at fair value through profit or loss; the only exception would be subsidiaries that are considered an extension of the investment company’s investment activities.
The adoption of the amendments had no material effect on these financial statements.
IAS 32 Financial Instruments: Presentation (Offsetting Financial Assets and Financial Liabilities)
During the current year the group adopted amendments IAS 32 Financial Instruments: Presentation.
The amendments clarify when a group can offset financial assets and financial liabilities.
The adoption of the amendments had no material effect on these financial statements.
74 TFG / 2015 ANNUAL FINANCIAL STATEMENTS
NOTES TO THE FINANCIAL STATEMENTS (CONTINUED)FOR THE YEARS ENDED 31 MARCH
The Foschini Group Limited and its subsidiaries
45. ACCOUNTING STANDARDS AND INTERPRETATIONS ADOPTED IN THE CURRENT YEAR (CONTINUED)
IAS 36 Impairment of assets (Recoverable Amount Disclosures for Non-Financial Assets)
During the current year the group adopted amendments to IAS 36 Impairment of assets.
The amendments reverse the unintended requirement in IFRS 13 Fair Value Measurement to disclose the recoverable amount of every cash-generating unit to which significant goodwill or indefinite-lived intangible assets have been allocated. Under the amendments, the recoverable amount is required to be disclosed only when an impairment loss has been recognised or reversed.
The adoption of the amendments had no material effect on these financial statements.
IAS 39 Financial Instruments: Recognition and Measurement (Novation of Derivatives and Continuation of Hedge Accounting)
During the current year the group adopted amendments to IAS 39 Financial Instruments.
In terms of the amendment the group should discontinue hedge accounting if the derivative hedging instrument is novated to a clearing counterparty, unless the hedging instrument is being replaced as part of the entity’s original documented hedging strategy.
The amendments add a limited exception to IAS 39, to provide relief from discounting an existing hedging relationship, when a novation was not contemplated in the original hedging documentation that meets specific criteria.
The adoption of the amendments had no material effect on these financial statements.
IFRIC 21 Levies
During the current year the group adopted IFRIC 21 Levies.
IFRIC 21 provides guidance on accounting for levies in accordance with IAS 37 Provisions, Contingent Liabilities and Assets.
The adoption of the amendments had no material effect on these financial statements.
46. ACCOUNTING STANDARDS AND INTERPRETATIONS TO BE ADOPTED IN FUTURE YEARS
There are standards and interpretations in issue that are not yet effective. These include the following standards and interpretations that are applicable to the group and may have an impact on future financial statements:
IFRS 9 Financial Instruments
IFRS 9 will be adopted by the group for the first time for its financial reporting period ending 31 March 2019. The amendments to the standards will be applied retrospectively, subject to transitional provisions.
On 24 July 2014 the IASB issued the final IFRS 9 Financial Instruments Standard, which replaces earlier versions of IFRS 9 and completes the IASB’s project to replace IAS 39 Financial Instruments: Recognition and Measurement.
The group is in the process of assessing the overall impact the new standard will have on the financial statements.
IFRS 15 Revenue from Contracts with Customers
IFRS 15 will be adopted by the company for the first time for its financial reporting period ending 31 March 2018. The amendments to the standard will be applied retrospectively, subject to transitional provisions.
This standard replaces IAS 11 Construction Contracts, IAS 18 Revenue, IFRIC 13 Customer Loyalty Programmes, IFRIC 15 Agreements for the Construction of Real Estate, IFRIC 18 Transfer of Assets from Customers and SIC-31 Revenue – Barter of Transactions Involving Advertising Services.
The standard contains a single model that applies to contracts with customers and two approaches to recognising revenue: at a point in time or over time. The model features a contract-based five-step analysis of transactions to determine whether, how much and when revenue is recognised.
The group is in the process of assessing the overall impact the new standard will have on the financial statements.
TFG / 2015 ANNUAL FINANCIAL STATEMENTS 75
46. ACCOUNTING STANDARDS AND INTERPRETATIONS TO BE ADOPTED IN FUTURE YEARS (CONTINUED)
IAS 19 Employee Benefits: Defined benefits plan (Employee Contributions)
The amendment to IAS 19 will be adopted by the company for the first time for its financial reporting period ending 31 March 2016. The amendments to the standards will be applied retrospectively, subject to transitional provisions.
The amendments introduce relief that will reduce the complexity and burden of accounting for certain contributions from employees or third parties. Such contributions are eligible for practical expedient if they are:
• set out in the formal terms of the plan;
• linked to service; and
• independent of the number of years of service.
When contributions are eligible for the practical expedient, a company is permitted (but not required) to recognise them as a reduction of the service cost in the period in which the related service is rendered.
The group is in the process of assessing the overall impact the new standard will have on the financial statements.
Annual Improvements 2010 – 2012 cycle
The annual improvements 2010 – 2012 cycle will be adopted by the group for the first time for its financial reporting period ending 31 March 2016.
• IFRS 2 Share-based payment
• IFRS 3 Business combinations
• IFRS 8 Operating segments
• IFRS 15 Fair value measurement
• IAS 16 Property plant and equipment, and IAS 38 Intangible assets
• IAS 24 Related party disclosure
The group is in the process of assessing the overall impact of these amendments on the financial statements.
Annual Improvements 2011 – 2013 cycle
The annual improvements 2011 – 2013 cycle will be adopted by the group for the first time for its financial reporting period ending 31 March 2016.
• IFRS 1 First-time adoption of International Financial Reporting Standards
• IFRS 3 Business combinations
• IFRS 13 Fair value measurement
• IAS 40 Investment property
The group is in the process of assessing the overall impact of these amendments on the financial statements.
Annual Improvements 2012 – 2014 cycle
The annual improvements 2012 – 2014 cycle will be adopted by the group for the first time for its financial reporting period ending 31 March 2017.
• IFRS 5 Non-current assets held for sale and discontinued operations
• IFRS 7 Financial instruments: Disclosure
• IAS 19 Employee benefits
• IAS 34 Interim financial reporting
The group is in the process of assessing the overall impact of these amendments on the financial statements.
76 TFG / 2015 ANNUAL FINANCIAL STATEMENTS
STATEMENT OF FINANCIAL POSITION: COMPANY 2015 2014 Note Rm Rm
ASSETS Non-current assets Interest in subsidiaries 2 41 264,0 24 851,8
41 264,0 24 851,8
Current assets Interest in subsidiaries 2 50,9 30,9 Other receivables 0,2 0,2 Cash 108,6 1,9
159,7 33,0
Total assets 41 423,7 24 884,8
EQUITY AND LIABILITIES Capital and reserves Share capital 12 3,1 3,2 Share premium 498,7 498,7 Dividend reserve 14 685,8 650,5 Revaluation reserve 38 101,4 23 788,1Distributable reserve 834,1 (64,9)
40 123,1 24 875,6
Current liabilities Other payables 6,2 5,6Taxation payable 2,2 2,7 Interest in subsidiaries 2 1 292,2 0,9
1 300,6 9,2
Total equity and liabilities 41 423,7 24 884,8
Guarantee: The company has guaranteed the overdraft facilities of subsidiary companies. The amounts utilised amounted to 4 754,0 2 824,0
THE FOSCHINI GROUP LIMITEDAS AT 31 MARCH
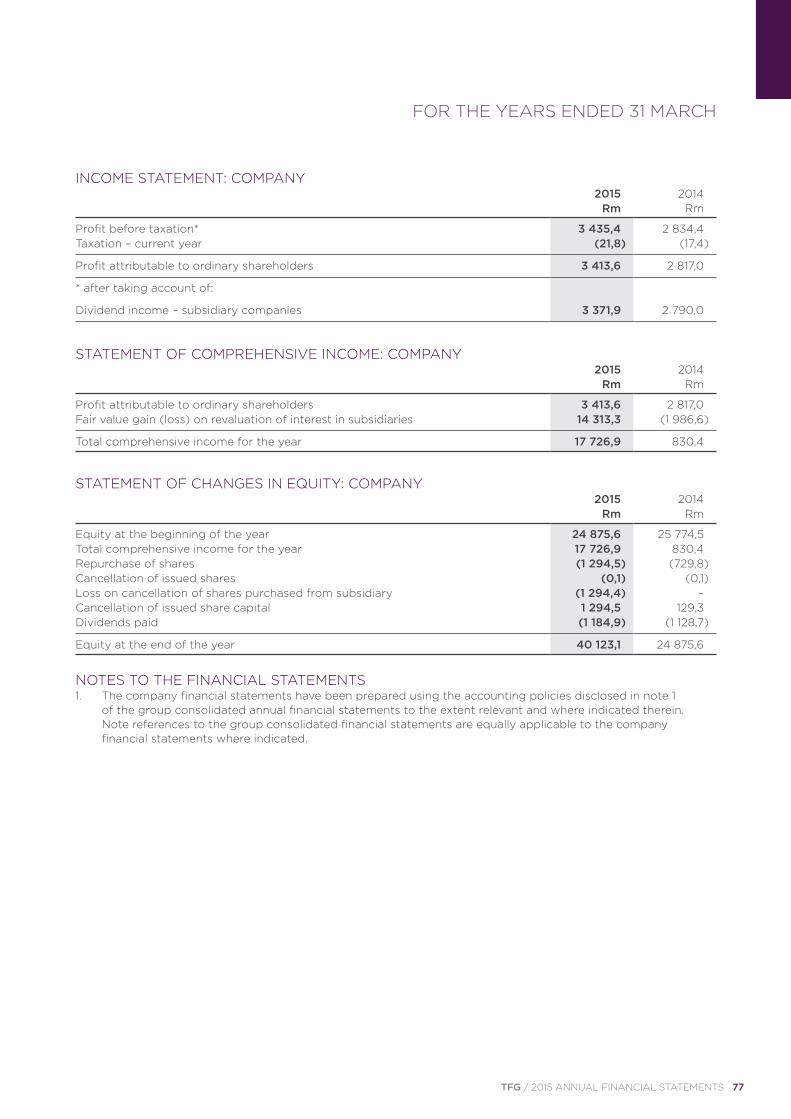
TFG / 2015 ANNUAL FINANCIAL STATEMENTS 77
INCOME STATEMENT: COMPANY 2015 2014 Rm Rm
Profit before taxation* 3 435,4 2 834,4Taxation – current year (21,8) (17,4)
Profit attributable to ordinary shareholders 3 413,6 2 817,0
* after taking account of:
Dividend income – subsidiary companies 3 371,9 2 790,0
STATEMENT OF COMPREHENSIVE INCOME: COMPANY 2015 2014 Rm Rm
Profit attributable to ordinary shareholders 3 413,6 2 817,0Fair value gain (loss) on revaluation of interest in subsidiaries 14 313,3 (1 986,6)
Total comprehensive income for the year 17 726,9 830,4
STATEMENT OF CHANGES IN EQUITY: COMPANY 2015 2014 Rm Rm
Equity at the beginning of the year 24 875,6 25 774,5 Total comprehensive income for the year 17 726,9 830,4Repurchase of shares (1 294,5) (729,8)Cancellation of issued shares (0,1) (0,1)Loss on cancellation of shares purchased from subsidiary (1 294,4) –Cancellation of issued share capital 1 294,5 129,3Dividends paid (1 184,9) (1 128,7)
Equity at the end of the year 40 123,1 24 875,6
NOTES TO THE FINANCIAL STATEMENTS1. The company financial statements have been prepared using the accounting policies disclosed in note 1
of the group consolidated annual financial statements to the extent relevant and where indicated therein. Note references to the group consolidated financial statements are equally applicable to the company financial statements where indicated.
FOR THE YEARS ENDED 31 MARCH
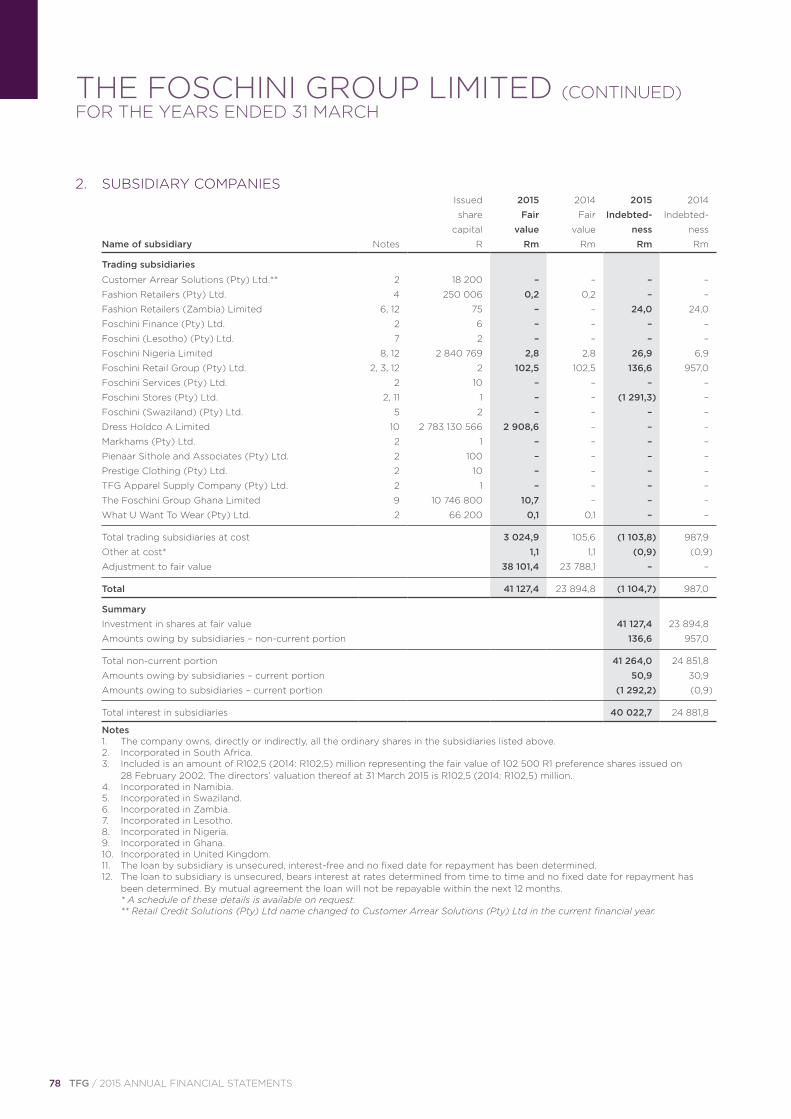
78 TFG / 2015 ANNUAL FINANCIAL STATEMENTS
THE FOSCHINI GROUP LIMITED (CONTINUED)FOR THE YEARS ENDED 31 MARCH
2. SUBSIDIARY COMPANIES Issued 2015 2014 2015 2014
share Fair Fair Indebted- Indebted-
capital value value ness ness
Name of subsidiary Notes R Rm Rm Rm Rm
Trading subsidiaries
Customer Arrear Solutions (Pty) Ltd.** 2 18 200 – – – –
Fashion Retailers (Pty) Ltd. 4 250 006 0,2 0,2 – –
Fashion Retailers (Zambia) Limited 6, 12 75 – – 24,0 24,0
Foschini Finance (Pty) Ltd. 2 6 – – – –
Foschini (Lesotho) (Pty) Ltd. 7 2 – – – –
Foschini Nigeria Limited 8, 12 2 840 769 2,8 2,8 26,9 6,9
Foschini Retail Group (Pty) Ltd. 2, 3, 12 2 102,5 102,5 136,6 957,0
Foschini Services (Pty) Ltd. 2 10 – – – –
Foschini Stores (Pty) Ltd. 2, 11 1 – – (1 291,3) –
Foschini (Swaziland) (Pty) Ltd. 5 2 – – – –
Dress Holdco A Limited 10 2 783 130 566 2 908,6 – – –
Markhams (Pty) Ltd. 2 1 – – – –
Pienaar Sithole and Associates (Pty) Ltd. 2 100 – – – –
Prestige Clothing (Pty) Ltd. 2 10 – – – –
TFG Apparel Supply Company (Pty) Ltd. 2 1 – – – –
The Foschini Group Ghana Limited 9 10 746 800 10,7 – – –
What U Want To Wear (Pty) Ltd. 2 66 200 0,1 0,1 – –
Total trading subsidiaries at cost 3 024,9 105,6 (1 103,8) 987,9
Other at cost* 1,1 1,1 (0,9) (0,9)
Adjustment to fair value 38 101,4 23 788,1 – –
Total 41 127,4 23 894,8 (1 104,7) 987,0
Summary
Investment in shares at fair value 41 127,4 23 894,8
Amounts owing by subsidiaries – non-current portion 136,6 957,0
Total non-current portion 41 264,0 24 851,8
Amounts owing by subsidiaries – current portion 50,9 30,9
Amounts owing to subsidiaries – current portion (1 292,2) (0,9)
Total interest in subsidiaries 40 022,7 24 881,8
Notes 1. The company owns, directly or indirectly, all the ordinary shares in the subsidiaries listed above. 2. Incorporated in South Africa. 3. Included is an amount of R102,5 (2014: R102,5) million representing the fair value of 102 500 R1 preference shares issued on
28 February 2002. The directors’ valuation thereof at 31 March 2015 is R102,5 (2014: R102,5) million. 4. Incorporated in Namibia. 5. Incorporated in Swaziland. 6. Incorporated in Zambia. 7. Incorporated in Lesotho. 8. Incorporated in Nigeria. 9. Incorporated in Ghana. 10. Incorporated in United Kingdom. 11. The loan by subsidiary is unsecured, interest-free and no fixed date for repayment has been determined. 12. The loan to subsidiary is unsecured, bears interest at rates determined from time to time and no fixed date for repayment has
been determined. By mutual agreement the loan will not be repayable within the next 12 months. * A schedule of these details is available on request. ** Retail Credit Solutions (Pty) Ltd name changed to Customer Arrear Solutions (Pty) Ltd in the current financial year.
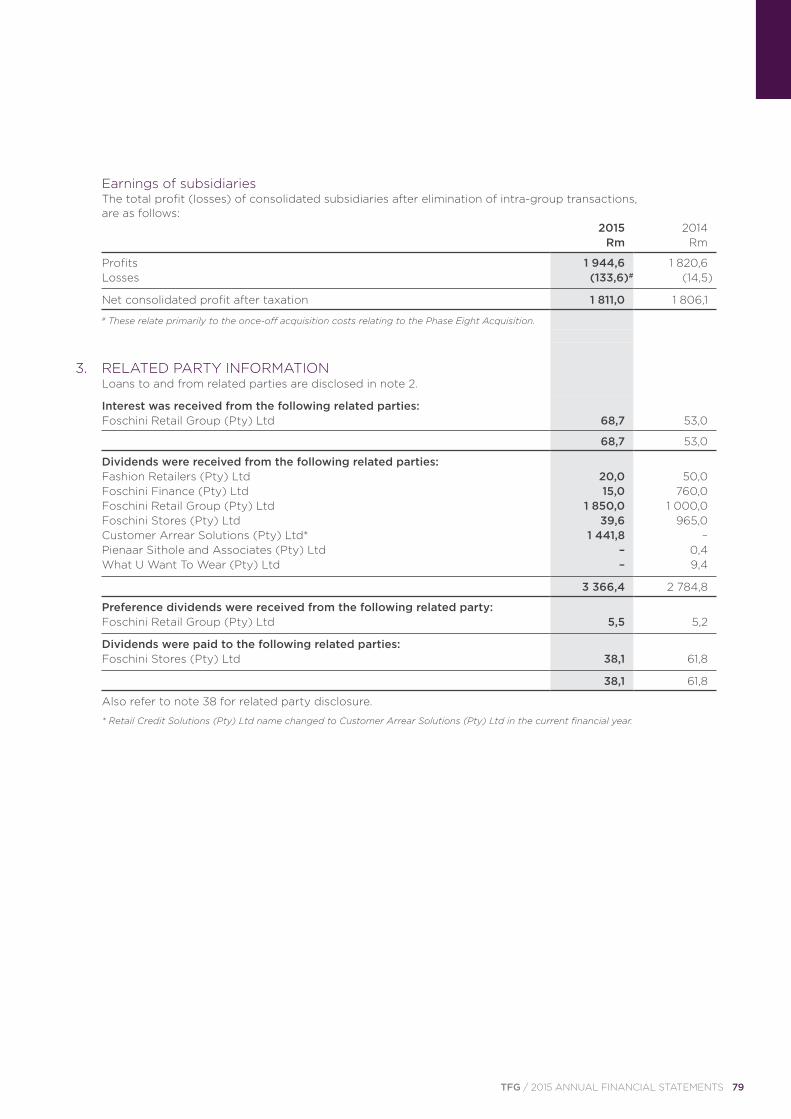
TFG / 2015 ANNUAL FINANCIAL STATEMENTS 79
Earnings of subsidiaries
The total profit (losses) of consolidated subsidiaries after elimination of intra-group transactions, are as follows:
2015 2014
Rm Rm
Profits 1 944,6 1 820,6
Losses (133,6)# (14,5)
Net consolidated profit after taxation 1 811,0 1 806,1
# These relate primarily to the once-off acquisition costs relating to the Phase Eight Acquisition.
3. RELATED PARTY INFORMATION Loans to and from related parties are disclosed in note 2.
Interest was received from the following related parties: Foschini Retail Group (Pty) Ltd 68,7 53,0
68,7 53,0
Dividends were received from the following related parties: Fashion Retailers (Pty) Ltd 20,0 50,0 Foschini Finance (Pty) Ltd 15,0 760,0 Foschini Retail Group (Pty) Ltd 1 850,0 1 000,0 Foschini Stores (Pty) Ltd 39,6 965,0 Customer Arrear Solutions (Pty) Ltd* 1 441,8 – Pienaar Sithole and Associates (Pty) Ltd – 0,4
What U Want To Wear (Pty) Ltd – 9,4
3 366,4 2 784,8
Preference dividends were received from the following related party:
Foschini Retail Group (Pty) Ltd 5,5 5,2
Dividends were paid to the following related parties:
Foschini Stores (Pty) Ltd 38,1 61,8
38,1 61,8
Also refer to note 38 for related party disclosure.
* Retail Credit Solutions (Pty) Ltd name changed to Customer Arrear Solutions (Pty) Ltd in the current financial year.
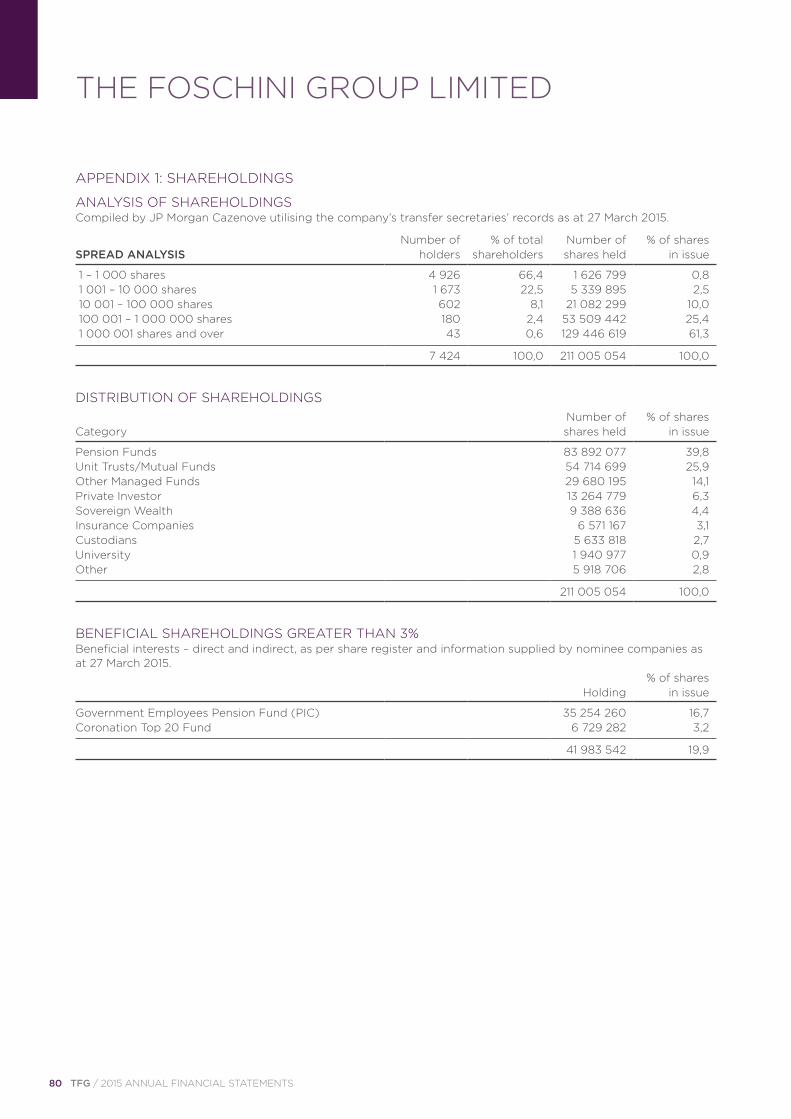
80 TFG / 2015 ANNUAL FINANCIAL STATEMENTS
THE FOSCHINI GROUP LIMITED
APPENDIX 1: SHAREHOLDINGS
ANALYSIS OF SHAREHOLDINGSCompiled by JP Morgan Cazenove utilising the company’s transfer secretaries’ records as at 27 March 2015.
Number of % of total Number of % of sharesSPREAD ANALYSIS holders shareholders shares held in issue
1 – 1 000 shares 4 926 66,4 1 626 799 0,8 1 001 – 10 000 shares 1 673 22,5 5 339 895 2,5 10 001 – 100 000 shares 602 8,1 21 082 299 10,0 100 001 – 1 000 000 shares 180 2,4 53 509 442 25,4 1 000 001 shares and over 43 0,6 129 446 619 61,3
7 424 100,0 211 005 054 100,0
DISTRIBUTION OF SHAREHOLDINGS Number of % of sharesCategory shares held in issue
Pension Funds 83 892 077 39,8Unit Trusts/Mutual Funds 54 714 699 25,9Other Managed Funds 29 680 195 14,1Private Investor 13 264 779 6,3Sovereign Wealth 9 388 636 4,4Insurance Companies 6 571 167 3,1Custodians 5 633 818 2,7University 1 940 977 0,9Other 5 918 706 2,8
211 005 054 100,0
BENEFICIAL SHAREHOLDINGS GREATER THAN 3%Beneficial interests – direct and indirect, as per share register and information supplied by nominee companies as at 27 March 2015. % of shares Holding in issue
Government Employees Pension Fund (PIC) 35 254 260 16,7Coronation Top 20 Fund 6 729 282 3,2
41 983 542 19,9
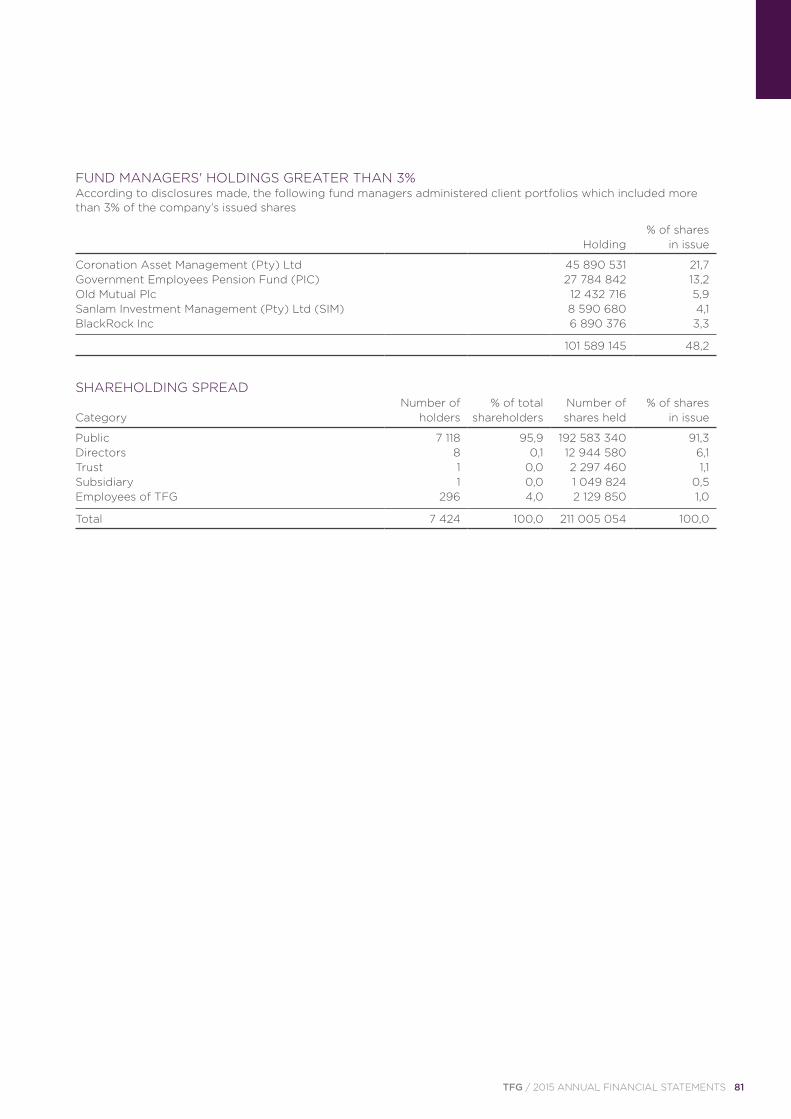
TFG / 2015 ANNUAL FINANCIAL STATEMENTS 81
FUND MANAGERS' HOLDINGS GREATER THAN 3%According to disclosures made, the following fund managers administered client portfolios which included more than 3% of the company’s issued shares
% of shares Holding in issue
Coronation Asset Management (Pty) Ltd 45 890 531 21,7Government Employees Pension Fund (PIC) 27 784 842 13,2Old Mutual Plc 12 432 716 5,9Sanlam Investment Management (Pty) Ltd (SIM) 8 590 680 4,1BlackRock Inc 6 890 376 3,3
101 589 145 48,2
SHAREHOLDING SPREAD Number of % of total Number of % of sharesCategory holders shareholders shares held in issue
Public 7 118 95,9 192 583 340 91,3 Directors 8 0,1 12 944 580 6,1Trust 1 0,0 2 297 460 1,1Subsidiary 1 0,0 1 049 824 0,5Employees of TFG 296 4,0 2 129 850 1,0
Total 7 424 100,0 211 005 054 100,0
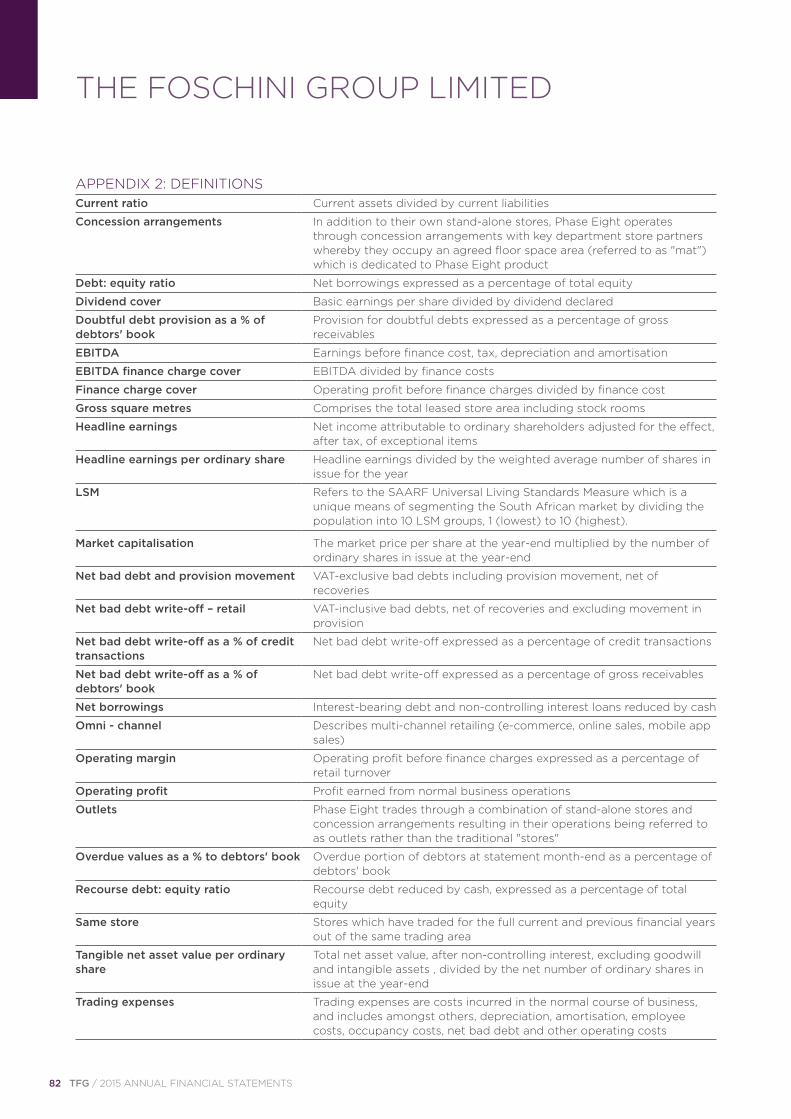
82 TFG / 2015 ANNUAL FINANCIAL STATEMENTS
APPENDIX 2: DEFINITIONS
Current ratio Current assets divided by current liabilities
Concession arrangements In addition to their own stand-alone stores, Phase Eight operates through concession arrangements with key department store partners whereby they occupy an agreed floor space area (referred to as "mat") which is dedicated to Phase Eight product
Debt: equity ratio Net borrowings expressed as a percentage of total equity
Dividend cover Basic earnings per share divided by dividend declared
Doubtful debt provision as a % of debtors' book
Provision for doubtful debts expressed as a percentage of gross receivables
EBITDA Earnings before finance cost, tax, depreciation and amortisation
EBITDA finance charge cover EBITDA divided by finance costs
Finance charge cover Operating profit before finance charges divided by finance cost
Gross square metres Comprises the total leased store area including stock rooms
Headline earnings Net income attributable to ordinary shareholders adjusted for the effect, after tax, of exceptional items
Headline earnings per ordinary share Headline earnings divided by the weighted average number of shares in issue for the year
LSM Refers to the SAARF Universal Living Standards Measure which is a unique means of segmenting the South African market by dividing the population into 10 LSM groups, 1 (lowest) to 10 (highest).
Market capitalisation The market price per share at the year-end multiplied by the number of ordinary shares in issue at the year-end
Net bad debt and provision movement VAT-exclusive bad debts including provision movement, net of recoveries
Net bad debt write-off – retail VAT-inclusive bad debts, net of recoveries and excluding movement in provision
Net bad debt write-off as a % of credit transactions
Net bad debt write-off expressed as a percentage of credit transactions
Net bad debt write-off as a % of debtors' book
Net bad debt write-off expressed as a percentage of gross receivables
Net borrowings Interest-bearing debt and non-controlling interest loans reduced by cash
Omni - channel Describes multi-channel retailing (e-commerce, online sales, mobile app sales)
Operating margin Operating profit before finance charges expressed as a percentage of retail turnover
Operating profit Profit earned from normal business operations
Outlets Phase Eight trades through a combination of stand-alone stores and concession arrangements resulting in their operations being referred to as outlets rather than the traditional "stores"
Overdue values as a % to debtors' book Overdue portion of debtors at statement month-end as a percentage of debtors' book
Recourse debt: equity ratio Recourse debt reduced by cash, expressed as a percentage of total equity
Same store Stores which have traded for the full current and previous financial years out of the same trading area
Tangible net asset value per ordinary share
Total net asset value, after non-controlling interest, excluding goodwill and intangible assets , divided by the net number of ordinary shares in issue at the year-end
Trading expenses Trading expenses are costs incurred in the normal course of business, and includes amongst others, depreciation, amortisation, employee costs, occupancy costs, net bad debt and other operating costs
THE FOSCHINI GROUP LIMITED

TFG / 2015 ANNUAL FINANCIAL STATEMENTS 83

84 TFG / 2015 ANNUAL FINANCIAL STATEMENTS
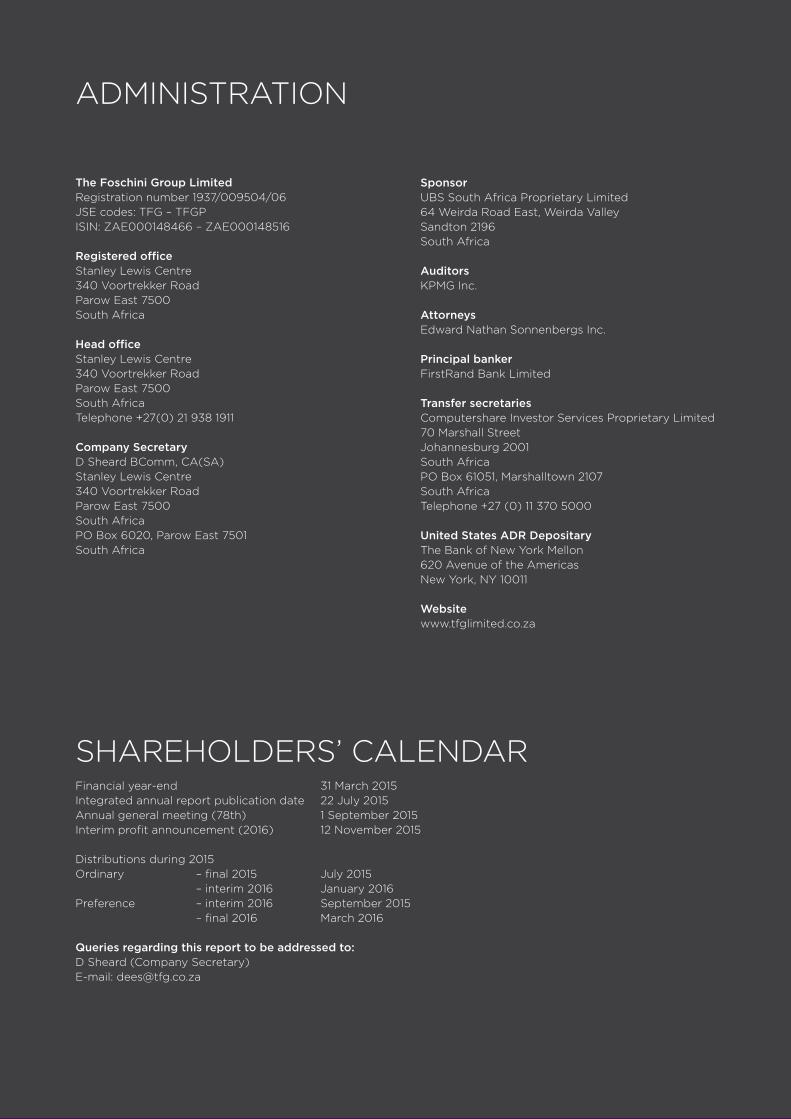
The Foschini Group LimitedRegistration number 1937/009504/06JSE codes: TFG – TFGPISIN: ZAE000148466 – ZAE000148516 Registered officeStanley Lewis Centre340 Voortrekker RoadParow East 7500South Africa Head officeStanley Lewis Centre340 Voortrekker RoadParow East 7500South AfricaTelephone +27(0) 21 938 1911 Company SecretaryD Sheard BComm, CA(SA) Stanley Lewis Centre340 Voortrekker RoadParow East 7500South AfricaPO Box 6020, Parow East 7501South Africa
ADMINISTRATION
SponsorUBS South Africa Proprietary Limited64 Weirda Road East, Weirda ValleySandton 2196South Africa AuditorsKPMG Inc. AttorneysEdward Nathan Sonnenbergs Inc. Principal bankerFirstRand Bank Limited Transfer secretariesComputershare Investor Services Proprietary Limited70 Marshall StreetJohannesburg 2001South AfricaPO Box 61051, Marshalltown 2107South AfricaTelephone +27 (0) 11 370 5000 United States ADR DepositaryThe Bank of New York Mellon620 Avenue of the AmericasNew York, NY 10011 Websitewww.tfglimited.co.za
SHAREHOLDERS’ CALENDARFinancial year-end 31 March 2015Integrated annual report publication date 22 July 2015Annual general meeting (78th) 1 September 2015Interim profit announcement (2016) 12 November 2015 Distributions during 2015Ordinary – final 2015 July 2015 – interim 2016 January 2016Preference – interim 2016 September 2015 – final 2016 March 2016 Queries regarding this report to be addressed to:D Sheard (Company Secretary) E-mail: [email protected]

www.tfglimited.co.za