ANNUAL FINANCIAL STATEMENTS BMO Europe … FINANCIAL STATEMENTS BMO Europe High Dividend Covered...
26
ANNUAL FINANCIAL STATEMENTS BMO Europe High Dividend Covered Call Hedged to CAD ETF (ZWE) December 31, 2017
Transcript of ANNUAL FINANCIAL STATEMENTS BMO Europe … FINANCIAL STATEMENTS BMO Europe High Dividend Covered...
ANNUAL FINANCIAL STATEMENTS
BMO Europe High Dividend Covered Call Hedged to CAD ETF (ZWE)December 31, 2017
Independent Auditor’s Report
To the Unitholders of: BMO Equal Weight Global Gold Index ETFBMO Mid Federal Bond Index ETF (formerly BMO S&P/TSX Equal Weight Global Gold Index ETF)BMO S&P/TSX Capped Composite Index ETF BMO S&P 500 Index ETFBMO S&P 500 Hedged to CAD Index ETF BMO US Dividend Hedged To CAD ETFBMO MSCI EAFE Hedged to CAD Index ETF BMO US Dividend ETFBMO MSCI Emerging Markets Index ETF BMO Low Volatility US Equity ETFBMO Global Infrastructure Index ETF BMO Mid-Term US IG Corporate Bond Hedged To CAD Index ETFBMO Dow Jones Industrial Average Hedged to CAD Index ETF BMO Mid-Term US IG Corporate Bond Index ETFBMO Short Federal Bond Index ETF BMO Mid Provincial Bond Index ETFBMO Short Provincial Bond Index ETF BMO Long Provincial Bond Index ETFBMO Short Corporate Bond Index ETF BMO MSCI EAFE Index ETFBMO High Yield US Corporate Bond Hedged to CAD Index ETF BMO Laddered Preferred Share Index ETFBMO Equal Weight Banks Index ETF BMO Equal Weight US Banks Index ETF (formerly BMO S&P/TSX Equal Weight Banks Index ETF) BMO Discount Bond Index ETFBMO Equal Weight Oil & Gas Index ETF BMO MSCI Europe High Quality Hedged to CAD Index ETF (formerly BMO S&P/TSX Equal Weight Oil & Gas Index ETF) BMO Short-Term US IG Corporate Bond Hedged to CAD Index ETFBMO Equal Weight Global Base Metals Hedged to BMO US High Dividend Covered Call ETF CAD Index ETF BMO Floating Rate High Yield ETF (formerly BMO S&P/TSX Equal Weight Global Base Metals BMO MSCI All Country World High Quality Index ETF Hedged to CAD Index ETF) BMO International Dividend ETFBMO China Equity Index ETF BMO MSCI USA High Quality Index ETFBMO India Equity Index ETF BMO Low Volatility International Equity ETFBMO Equal Weight Utilities Index ETF BMO Europe High Dividend Covered Call Hedged to CAD ETFBMO Nasdaq 100 Equity Hedged to CAD Index ETF BMO US Put Write ETFBMO Junior Gold Index ETF BMO International Dividend Hedged to CAD ETFBMO Mid Corporate Bond Index ETF BMO Low Volatility Emerging Markets Equity ETFBMO Long Corporate Bond Index ETF BMO Low Volatility International Equity Hedged to CAD ETFBMO Aggregate Bond Index ETF BMO Low Volatility US Equity Hedged to CAD ETFBMO Equal Weight REITs Index ETF BMO Canadian High Dividend Covered Call ETFBMO Junior Oil Index ETF BMO US Put Write Hedged to CAD ETFBMO Junior Gas Index ETF BMO Global Banks Hedged to CAD Index ETFBMO Equal Weight US Health Care Hedged to CAD Index ETF BMO Global Consumer Discretionary Hedged to CAD Index ETFBMO Equal Weight US Banks Hedged to CAD Index ETF BMO Global Consumer Staples Hedged to CAD Index ETFBMO Long Federal Bond Index ETF BMO Global Insurance Hedged to CAD Index ETFBMO Real Return Bond Index ETF BMO US Preferred Share Hedged to CAD Index ETFBMO Emerging Markets Bond Hedged to CAD Index ETF BMO Long-Term US Treasury Bond Index ETFBMO Monthly Income ETF BMO Mid-Term US Treasury Bond Index ETFBMO Covered Call Canadian Banks ETF BMO Short-Term US Treasury Bond Index ETFBMO Ultra Short-Term Bond ETF BMO US Preferred Share Index ETFBMO Covered Call Utilities ETF BMO MSCI Canada Value Index ETFBMO Covered Call Dow Jones Industrial Average Hedged BMO MSCI EAFE Value Index ETF to CAD ETF BMO MSCI USA Value Index ETFBMO Canadian Dividend ETF BMO Shiller Select US Index ETFBMO Low Volatility Canadian Equity ETF BMO High Yield US Corporate Bond Index ETFBMO Equal Weight Industrials Index ETF (formerly BMO S&P/TSX Equal Weight Industrials Index ETF)
(collectively the “ETFs”)
Independent Auditor’s Report
We have audited the accompanying financial statements of each of the ETFs, which comprise the statements of financial po-sition, comprehensive income, changes in net assets attributable to holders of redeemable units and cash flows as at and for the periods indicated in note 1, and the related notes, which comprise a summary of significant accounting policies and other explanatory information.
Management’s responsibility for the financial statementsManagement is responsible for the preparation and fair presentation of the financial statements of each of the ETFs in accor-dance with International Financial Reporting Standards, and for such internal control as management determines is necessary to enable the preparation of financial statements that are free from material misstatement, whether due to fraud or error.
Auditor’s responsibilityOur responsibility is to express an opinion on the financial statements of each of the ETFs based on our audits. We conducted our audits in accordance with Canadian generally accepted auditing standards. Those standards require that we comply with ethical requirements and plan and perform the audit to obtain reasonable assurance about whether the financial statements are free from material misstatement.
An audit involves performing procedures to obtain audit evidence about the amounts and disclosures in the financial state-ments. The procedures selected depend on the auditor’s judgment, including the assessment of the risks of material mis-statement of the financial statements, whether due to fraud or error. In making those risk assessments, the auditor considers internal control relevant to the entity’s preparation and fair presentation of the financial statements in order to design audit procedures that are appropriate in the circumstances, but not for the purpose of expressing an opinion on the effectiveness of the entity’s internal control. An audit also includes evaluating the appropriateness of accounting policies used and the rea-sonableness of accounting estimates made by management, as well as evaluating the overall presentation of the financial statements.
We believe that the audit evidence we have obtained in each of our audits is sufficient and appropriate to provide a basis for our audit opinion.
OpinionIn our opinion, the financial statements of each of the ETFs present fairly, in all material respects, the financial position, finan-cial performance and cash flows of each of the ETFs as at and for the periods indicated in note 1, in accordance with Interna-tional Financial Reporting Standards.
Chartered Professional Accountants, Licensed Public AccountantsToronto, Ontario
March 23, 2018
BMO Europe High Dividend Covered Call Hedged to CAD ETF
The accompanying notes are an integral part of these financial statements.
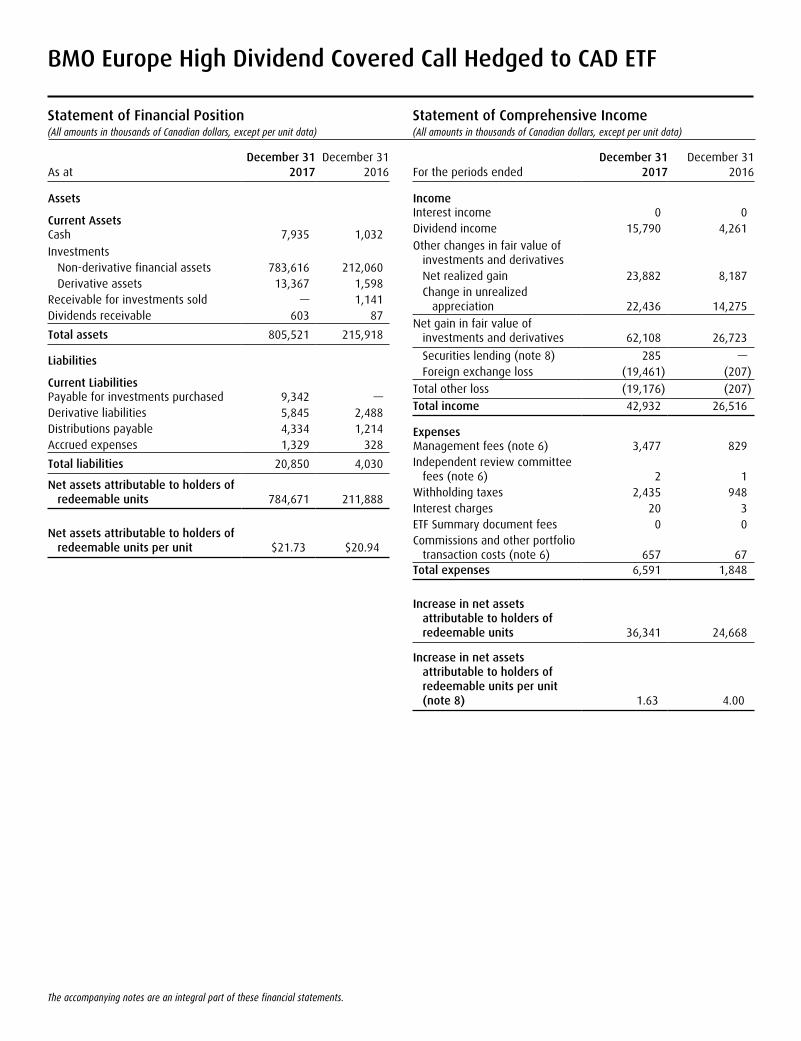
Statement of Financial Position(All amounts in thousands of Canadian dollars, except per unit data)
Statement of Comprehensive Income(All amounts in thousands of Canadian dollars, except per unit data)
December 31 December 31As at 2017 2016
Assets
Current AssetsCash 7,935 1,032
InvestmentsNon-derivative financial assets 783,616 212,060Derivative assets 13,367 1,598
Receivable for investments sold — 1,141Dividends receivable 603 87
Total assets 805,521 215,918
Liabilities
Current LiabilitiesPayable for investments purchased 9,342 —Derivative liabilities 5,845 2,488Distributions payable 4,334 1,214Accrued expenses 1,329 328
Total liabilities 20,850 4,030
Net assets attributable to holders of redeemable units 784,671 211,888
Net assets attributable to holders of redeemable units per unit $21.73 $20.94
December 31 December 31For the periods ended 2017 2016
IncomeInterest income 0 0Dividend income 15,790 4,261
Other changes in fair value of investments and derivativesNet realized gain 23,882 8,187Change in unrealized
appreciation 22,436 14,275
Net gain in fair value of investments and derivatives 62,108 26,723
Securities lending (note 8) 285 —Foreign exchange loss (19,461) (207)
Total other loss (19,176) (207)
Total income 42,932 26,516
ExpensesManagement fees (note 6) 3,477 829Independent review committee
fees (note 6) 2 1Withholding taxes 2,435 948Interest charges 20 3ETF Summary document fees 0 0Commissions and other portfolio
transaction costs (note 6) 657 67Total expenses 6,591 1,848
Increase in net assets attributable to holders of redeemable units 36,341 24,668
Increase in net assets attributable to holders of redeemable units per unit (note 8) 1.63 4.00
BMO Europe High Dividend Covered Call Hedged to CAD ETF
The accompanying notes are an integral part of these financial statements.
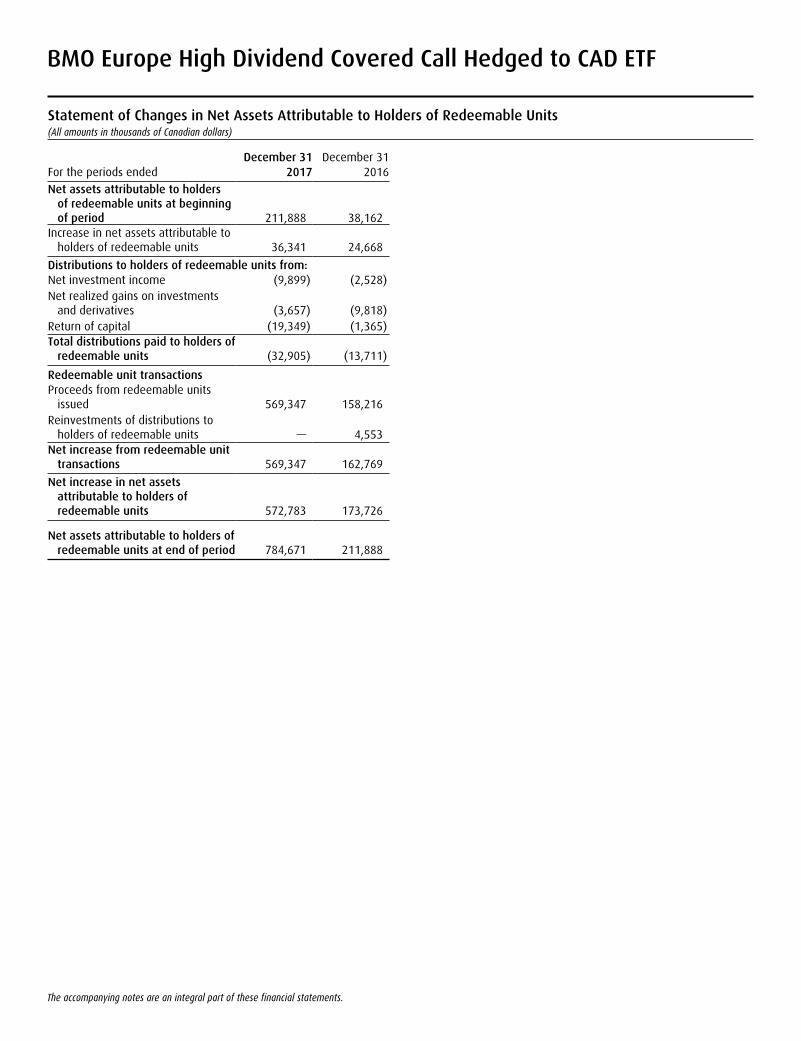
Statement of Changes in Net Assets Attributable to Holders of Redeemable Units(All amounts in thousands of Canadian dollars)
December 31 December 31For the periods ended 2017 2016
Net assets attributable to holders of redeemable units at beginning of period 211,888 38,162
Increase in net assets attributable to holders of redeemable units 36,341 24,668
Distributions to holders of redeemable units from:Net investment income (9,899) (2,528)Net realized gains on investments
and derivatives (3,657) (9,818)Return of capital (19,349) (1,365)Total distributions paid to holders of
redeemable units (32,905) (13,711)
Redeemable unit transactionsProceeds from redeemable units
issued 569,347 158,216Reinvestments of distributions to
holders of redeemable units — 4,553Net increase from redeemable unit
transactions 569,347 162,769
Net increase in net assets attributable to holders of redeemable units 572,783 173,726
Net assets attributable to holders of redeemable units at end of period 784,671 211,888
BMO Europe High Dividend Covered Call Hedged to CAD ETF
The accompanying notes are an integral part of these financial statements.
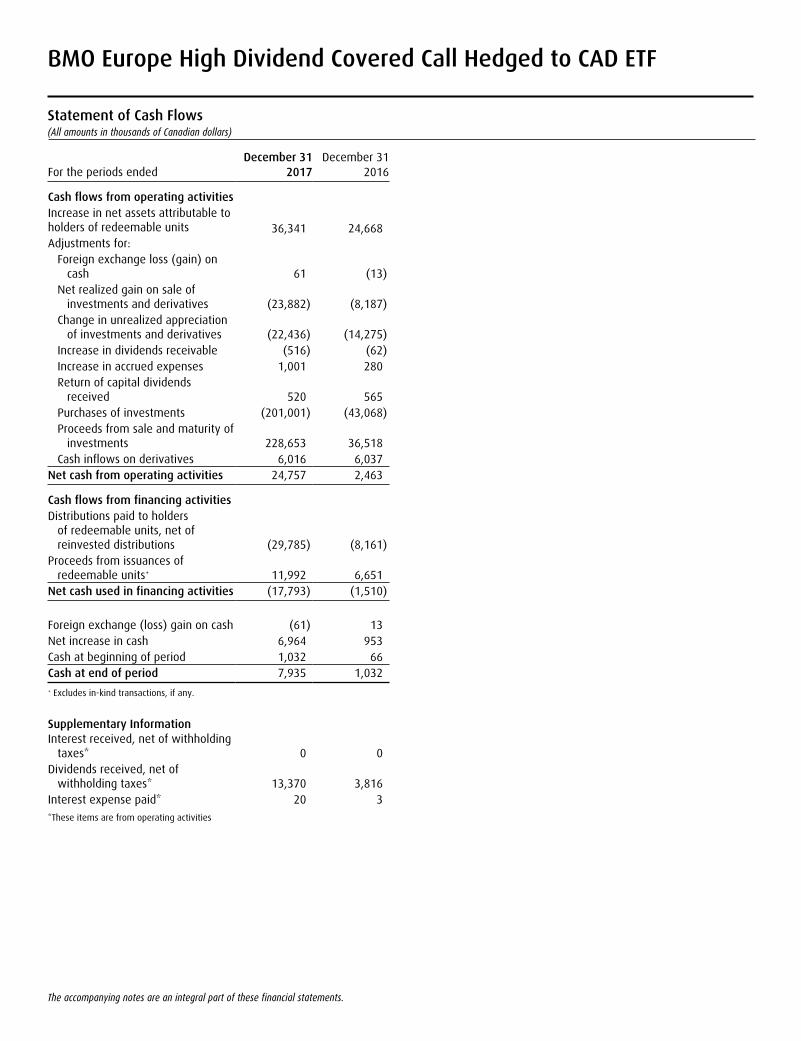
Statement of Cash Flows(All amounts in thousands of Canadian dollars)
December 31 December 31For the periods ended 2017 2016
Cash flows from operating activitiesIncrease in net assets attributable to holders of redeemable units 36,341 24,668Adjustments for:
Foreign exchange loss (gain) on cash 61 (13)
Net realized gain on sale of investments and derivatives (23,882) (8,187)
Change in unrealized appreciation of investments and derivatives (22,436) (14,275)
Increase in dividends receivable (516) (62)Increase in accrued expenses 1,001 280Return of capital dividends
received 520 565Purchases of investments (201,001) (43,068)Proceeds from sale and maturity of
investments 228,653 36,518Cash inflows on derivatives 6,016 6,037
Net cash from operating activities 24,757 2,463
Cash flows from financing activitiesDistributions paid to holders
of redeemable units, net of reinvested distributions (29,785) (8,161)
Proceeds from issuances of redeemable units+ 11,992 6,651
Net cash used in financing activities (17,793) (1,510)
Foreign exchange (loss) gain on cash (61) 13Net increase in cash 6,964 953Cash at beginning of period 1,032 66Cash at end of period 7,935 1,032+ Excludes in-kind transactions, if any.
Supplementary InformationInterest received, net of withholding
taxes* 0 0Dividends received, net of
withholding taxes* 13,370 3,816Interest expense paid* 20 3
*These items are from operating activities
BMO Europe High Dividend Covered Call Hedged to CAD ETF
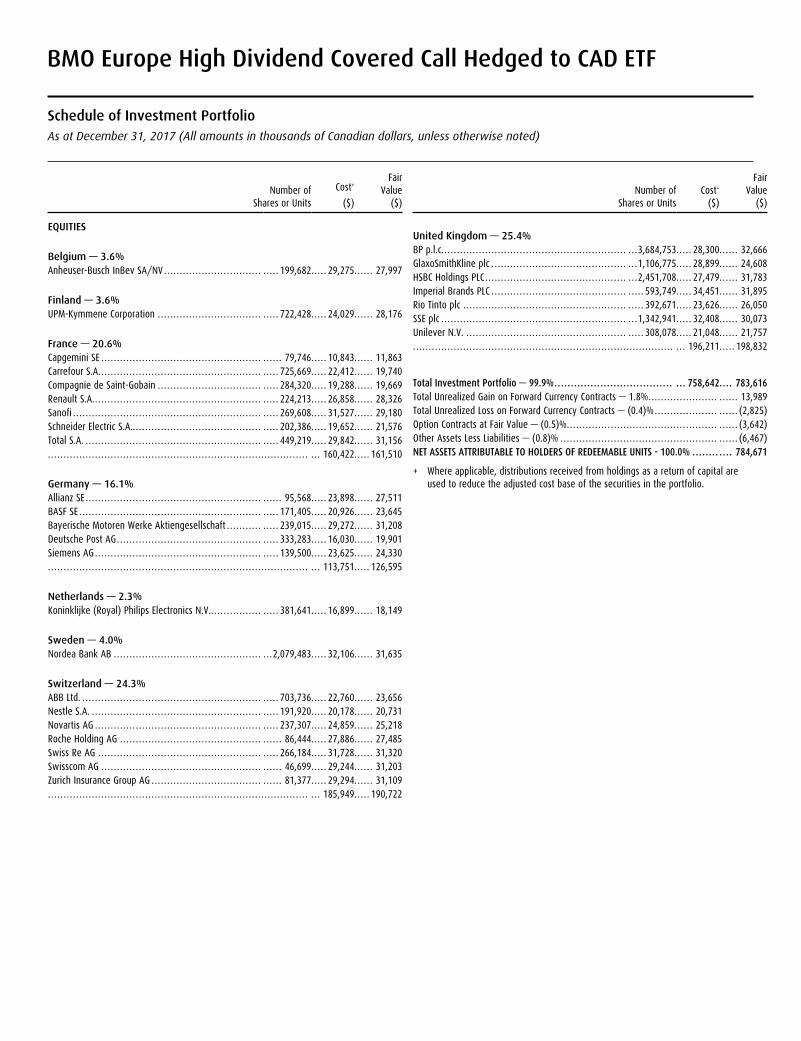
Schedule of Investment PortfolioAs at December 31, 2017 (All amounts in thousands of Canadian dollars, unless otherwise noted)
Number of Shares or Units
Cost+
($)
Fair Value
($)
EQUITIES
Belgium — 3.6%Anheuser-Busch InBev SA/NV ..... . . . . . . . . . . . . . . . . . . . . . . . . . . . . . . . 199,682..... 29,275..... . 27,997
Finland — 3.6%UPM-Kymmene Corporation .... . . . . . . . . . . . . . . . . . . . . . . . . . . . . . . . . . . 722,428..... 24,029..... . 28,176
France — 20.6%Capgemini SE .... . . . . . . . . . . . . . . . . . . . . . . . . . . . . . . . . . . . . . . . . . . . . . . . . . . . . . 79,746..... 10,843..... . 11,863Carrefour S.A. ... . . . . . . . . . . . . . . . . . . . . . . . . . . . . . . . . . . . . . . . . . . . . . . . . . . . . . 725,669..... 22,412..... . 19,740Compagnie de Saint-Gobain .... . . . . . . . . . . . . . . . . . . . . . . . . . . . . . . . . . . 284,320..... 19,288..... . 19,669Renault S.A. ... . . . . . . . . . . . . . . . . . . . . . . . . . . . . . . . . . . . . . . . . . . . . . . . . . . . . . . . 224,213..... 26,858..... . 28,326Sanofi ... . . . . . . . . . . . . . . . . . . . . . . . . . . . . . . . . . . . . . . . . . . . . . . . . . . . . . . . . . . . . . . 269,608..... 31,527..... . 29,180Schneider Electric S.A..... . . . . . . . . . . . . . . . . . . . . . . . . . . . . . . . . . . . . . . . . . . 202,386..... 19,652..... . 21,576Total S.A. ... . . . . . . . . . . . . . . . . . . . . . . . . . . . . . . . . . . . . . . . . . . . . . . . . . . . . . . . . . . 449,219..... 29,842..... . 31,156..... . . . . . . . . . . . . . . . . . . . . . . . . . . . . . . . . . . . . . . . . . . . . . . . . . . . . . . . . . . . . . . . . . . . . . . . . . . . . . . . . . 160,422..... 161,510
Germany — 16.1%Allianz SE .... . . . . . . . . . . . . . . . . . . . . . . . . . . . . . . . . . . . . . . . . . . . . . . . . . . . . . . . . . . 95,568..... 23,898..... . 27,511BASF SE .... . . . . . . . . . . . . . . . . . . . . . . . . . . . . . . . . . . . . . . . . . . . . . . . . . . . . . . . . . . . 171,405..... 20,926..... . 23,645Bayerische Motoren Werke Aktiengesellschaft ... . . . . . . . . . . . . . 239,015..... 29,272..... . 31,208Deutsche Post AG ..... . . . . . . . . . . . . . . . . . . . . . . . . . . . . . . . . . . . . . . . . . . . . . . 333,283..... 16,030..... . 19,901Siemens AG ..... . . . . . . . . . . . . . . . . . . . . . . . . . . . . . . . . . . . . . . . . . . . . . . . . . . . . . 139,500..... 23,625..... . 24,330..... . . . . . . . . . . . . . . . . . . . . . . . . . . . . . . . . . . . . . . . . . . . . . . . . . . . . . . . . . . . . . . . . . . . . . . . . . . . . . . . . . 113,751..... 126,595
Netherlands — 2.3%Koninklijke (Royal) Philips Electronics N.V. ... . . . . . . . . . . . . . . . . . . 381,641..... 16,899..... . 18,149
Sweden — 4.0%Nordea Bank AB ..... . . . . . . . . . . . . . . . . . . . . . . . . . . . . . . . . . . . . . . . . . . . . .2,079,483..... 32,106..... . 31,635
Switzerland — 24.3%ABB Ltd. ... . . . . . . . . . . . . . . . . . . . . . . . . . . . . . . . . . . . . . . . . . . . . . . . . . . . . . . . . . . . 703,736..... 22,760..... . 23,656Nestle S.A. ... . . . . . . . . . . . . . . . . . . . . . . . . . . . . . . . . . . . . . . . . . . . . . . . . . . . . . . . . 191,920..... 20,178..... . 20,731Novartis AG ..... . . . . . . . . . . . . . . . . . . . . . . . . . . . . . . . . . . . . . . . . . . . . . . . . . . . . . 237,307..... 24,859..... . 25,218Roche Holding AG ..... . . . . . . . . . . . . . . . . . . . . . . . . . . . . . . . . . . . . . . . . . . . . . . 86,444..... 27,886..... . 27,485Swiss Re AG ..... . . . . . . . . . . . . . . . . . . . . . . . . . . . . . . . . . . . . . . . . . . . . . . . . . . . . 266,184..... 31,728..... . 31,320Swisscom AG ..... . . . . . . . . . . . . . . . . . . . . . . . . . . . . . . . . . . . . . . . . . . . . . . . . . . . . 46,699..... 29,244..... . 31,203Zurich Insurance Group AG ..... . . . . . . . . . . . . . . . . . . . . . . . . . . . . . . . . . . . . 81,377..... 29,294..... . 31,109..... . . . . . . . . . . . . . . . . . . . . . . . . . . . . . . . . . . . . . . . . . . . . . . . . . . . . . . . . . . . . . . . . . . . . . . . . . . . . . . . . . 185,949..... 190,722
Number of Shares or Units
Cost+
($)
Fair Value
($)
United Kingdom — 25.4%BP p.l.c. ... . . . . . . . . . . . . . . . . . . . . . . . . . . . . . . . . . . . . . . . . . . . . . . . . . . . . . . . . . .3,684,753..... 28,300..... . 32,666GlaxoSmithKline plc .... . . . . . . . . . . . . . . . . . . . . . . . . . . . . . . . . . . . . . . . . . .1,106,775..... 28,899..... . 24,608HSBC Holdings PLC .... . . . . . . . . . . . . . . . . . . . . . . . . . . . . . . . . . . . . . . . . . . . .2,451,708..... 27,479..... . 31,783Imperial Brands PLC .... . . . . . . . . . . . . . . . . . . . . . . . . . . . . . . . . . . . . . . . . . . . . 593,749..... 34,451..... . 31,895Rio Tinto plc .... . . . . . . . . . . . . . . . . . . . . . . . . . . . . . . . . . . . . . . . . . . . . . . . . . . . . . 392,671..... 23,626..... . 26,050SSE plc .... . . . . . . . . . . . . . . . . . . . . . . . . . . . . . . . . . . . . . . . . . . . . . . . . . . . . . . . . . .1,342,941..... 32,408..... . 30,073Unilever N.V. ... . . . . . . . . . . . . . . . . . . . . . . . . . . . . . . . . . . . . . . . . . . . . . . . . . . . . . 308,078..... 21,048..... . 21,757..... . . . . . . . . . . . . . . . . . . . . . . . . . . . . . . . . . . . . . . . . . . . . . . . . . . . . . . . . . . . . . . . . . . . . . . . . . . . . . . . . . 196,211..... 198,832
Total Investment Portfolio — 99.9% .................................... ... 758,642.... 783,616Total Unrealized Gain on Forward Currency Contracts — 1.8% ..... . . . . . . . . . . . . . . . . . . . . . . . 13,989Total Unrealized Loss on Forward Currency Contracts — (0.4)% ..... . . . . . . . . . . . . . . . . . . . . . (2,825)Option Contracts at Fair Value — (0.5)% ..... . . . . . . . . . . . . . . . . . . . . . . . . . . . . . . . . . . . . . . . . . . . . . . . . . (3,642)Other Assets Less Liabilities — (0.8)% ..... . . . . . . . . . . . . . . . . . . . . . . . . . . . . . . . . . . . . . . . . . . . . . . . . . . . (6,467)NET ASSETS ATTRIBUTABLE TO HOLDERS OF REDEEMABLE UNITS - 100.0% ........ .... 784,671
+ Where applicable, distributions received from holdings as a return of capital are used to reduce the adjusted cost base of the securities in the portfolio.
BMO Europe High Dividend Covered Call Hedged to CAD ETF
Schedule of Investment Portfolio (cont’d)
As at December 31, 2017 (All amounts in thousands of Canadian dollars, unless otherwise noted)
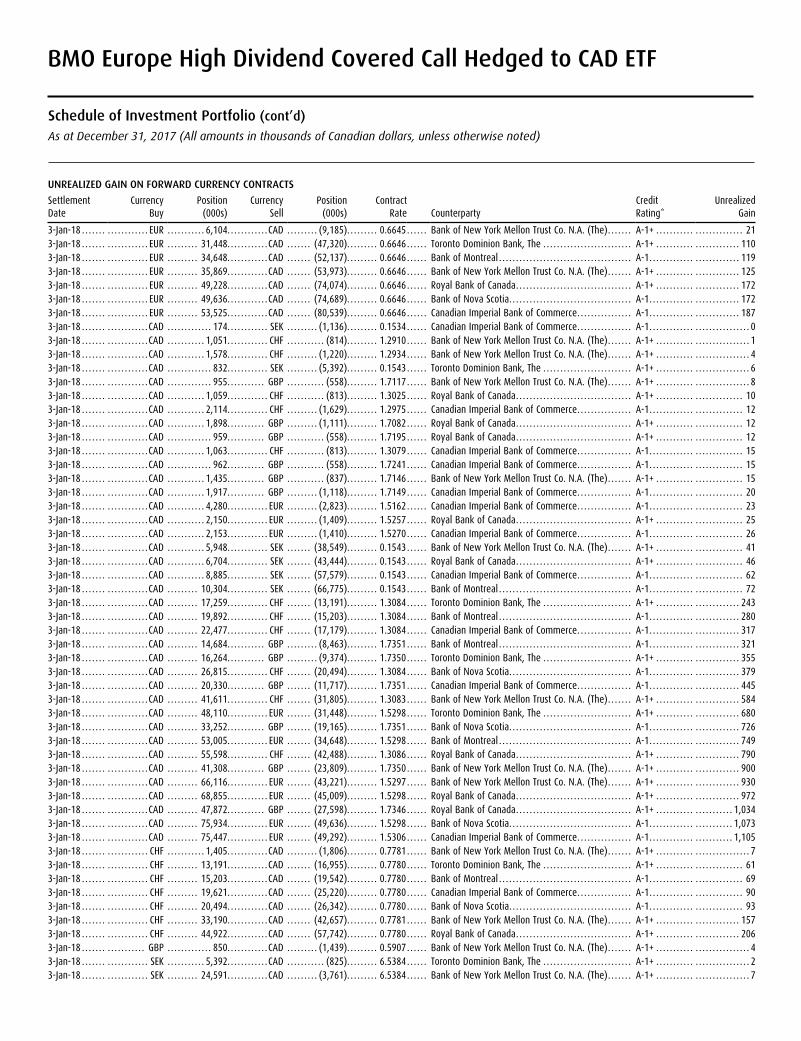
UNREALIZED GAIN ON FORWARD CURRENCY CONTRACTS
Settlement Date
Currency Buy
Position (000s)
Currency Sell
Position (000s)
Contract Rate Counterparty
Credit Rating*
Unrealized Gain
3-Jan-18 . . . . . . . . . . . . . . . . . . . EUR . . . . . . . . . . . 6,104. . . . . . . . . . . .CAD . . . . . . . . . (9,185). . . . . . . . . 0.6645. . . . . . Bank of New York Mellon Trust Co. N.A. (The) . . . . . . . A-1+ . . . . . . . . . . . . . . . . . . . . . . . . . 213-Jan-18 . . . . . . . . . . . . . . . . . . . EUR . . . . . . . . . 31,448. . . . . . . . . . . .CAD . . . . . . . (47,320). . . . . . . . . 0.6646. . . . . . Toronto Dominion Bank, The . . . . . . . . . . . . . . . . . . . . . . . . . . A-1+ . . . . . . . . . . . . . . . . . . . . . . . . 1103-Jan-18 . . . . . . . . . . . . . . . . . . . EUR . . . . . . . . . 34,648. . . . . . . . . . . .CAD . . . . . . . (52,137). . . . . . . . . 0.6646. . . . . . Bank of Montreal . . . . . . . . . . . . . . . . . . . . . . . . . . . . . . . . . . . . . . . A-1 . . . . . . . . . . . . . . . . . . . . . . . . . . 1193-Jan-18 . . . . . . . . . . . . . . . . . . . EUR . . . . . . . . . 35,869. . . . . . . . . . . .CAD . . . . . . . (53,973). . . . . . . . . 0.6646. . . . . . Bank of New York Mellon Trust Co. N.A. (The) . . . . . . . A-1+ . . . . . . . . . . . . . . . . . . . . . . . . 1253-Jan-18 . . . . . . . . . . . . . . . . . . . EUR . . . . . . . . . 49,228. . . . . . . . . . . .CAD . . . . . . . (74,074). . . . . . . . . 0.6646. . . . . . Royal Bank of Canada . . . . . . . . . . . . . . . . . . . . . . . . . . . . . . . . . . A-1+ . . . . . . . . . . . . . . . . . . . . . . . . 1723-Jan-18 . . . . . . . . . . . . . . . . . . . EUR . . . . . . . . . 49,636. . . . . . . . . . . .CAD . . . . . . . (74,689). . . . . . . . . 0.6646. . . . . . Bank of Nova Scotia . . . . . . . . . . . . . . . . . . . . . . . . . . . . . . . . . . . . A-1 . . . . . . . . . . . . . . . . . . . . . . . . . . 1723-Jan-18 . . . . . . . . . . . . . . . . . . . EUR . . . . . . . . . 53,525. . . . . . . . . . . .CAD . . . . . . . (80,539). . . . . . . . . 0.6646. . . . . . Canadian Imperial Bank of Commerce . . . . . . . . . . . . . . . . A-1 . . . . . . . . . . . . . . . . . . . . . . . . . . 1873-Jan-18 . . . . . . . . . . . . . . . . . . .CAD . . . . . . . . . . . . . 174. . . . . . . . . . . . SEK . . . . . . . . . (1,136). . . . . . . . . 0.1534. . . . . . Canadian Imperial Bank of Commerce . . . . . . . . . . . . . . . . A-1 . . . . . . . . . . . . . . . . . . . . . . . . . . . . . 03-Jan-18 . . . . . . . . . . . . . . . . . . .CAD . . . . . . . . . . . 1,051. . . . . . . . . . . . CHF . . . . . . . . . . . (814). . . . . . . . . 1.2910. . . . . . Bank of New York Mellon Trust Co. N.A. (The) . . . . . . . A-1+ . . . . . . . . . . . . . . . . . . . . . . . . . . . 13-Jan-18 . . . . . . . . . . . . . . . . . . .CAD . . . . . . . . . . . 1,578. . . . . . . . . . . . CHF . . . . . . . . . (1,220). . . . . . . . . 1.2934. . . . . . Bank of New York Mellon Trust Co. N.A. (The) . . . . . . . A-1+ . . . . . . . . . . . . . . . . . . . . . . . . . . . 43-Jan-18 . . . . . . . . . . . . . . . . . . .CAD . . . . . . . . . . . . . 832. . . . . . . . . . . . SEK . . . . . . . . . (5,392). . . . . . . . . 0.1543. . . . . . Toronto Dominion Bank, The . . . . . . . . . . . . . . . . . . . . . . . . . . A-1+ . . . . . . . . . . . . . . . . . . . . . . . . . . . 63-Jan-18 . . . . . . . . . . . . . . . . . . .CAD . . . . . . . . . . . . . 955. . . . . . . . . . . GBP . . . . . . . . . . . (558). . . . . . . . . 1.7117. . . . . . Bank of New York Mellon Trust Co. N.A. (The) . . . . . . . A-1+ . . . . . . . . . . . . . . . . . . . . . . . . . . . 83-Jan-18 . . . . . . . . . . . . . . . . . . .CAD . . . . . . . . . . . 1,059. . . . . . . . . . . . CHF . . . . . . . . . . . (813). . . . . . . . . 1.3025. . . . . . Royal Bank of Canada . . . . . . . . . . . . . . . . . . . . . . . . . . . . . . . . . . A-1+ . . . . . . . . . . . . . . . . . . . . . . . . . 103-Jan-18 . . . . . . . . . . . . . . . . . . .CAD . . . . . . . . . . . 2,114. . . . . . . . . . . . CHF . . . . . . . . . (1,629). . . . . . . . . 1.2975. . . . . . Canadian Imperial Bank of Commerce . . . . . . . . . . . . . . . . A-1 . . . . . . . . . . . . . . . . . . . . . . . . . . . 123-Jan-18 . . . . . . . . . . . . . . . . . . .CAD . . . . . . . . . . . 1,898. . . . . . . . . . . GBP . . . . . . . . . (1,111). . . . . . . . . 1.7082. . . . . . Royal Bank of Canada . . . . . . . . . . . . . . . . . . . . . . . . . . . . . . . . . . A-1+ . . . . . . . . . . . . . . . . . . . . . . . . . 123-Jan-18 . . . . . . . . . . . . . . . . . . .CAD . . . . . . . . . . . . . 959. . . . . . . . . . . GBP . . . . . . . . . . . (558). . . . . . . . . 1.7195. . . . . . Royal Bank of Canada . . . . . . . . . . . . . . . . . . . . . . . . . . . . . . . . . . A-1+ . . . . . . . . . . . . . . . . . . . . . . . . . 123-Jan-18 . . . . . . . . . . . . . . . . . . .CAD . . . . . . . . . . . 1,063. . . . . . . . . . . . CHF . . . . . . . . . . . (813). . . . . . . . . 1.3079. . . . . . Canadian Imperial Bank of Commerce . . . . . . . . . . . . . . . . A-1 . . . . . . . . . . . . . . . . . . . . . . . . . . . 153-Jan-18 . . . . . . . . . . . . . . . . . . .CAD . . . . . . . . . . . . . 962. . . . . . . . . . . GBP . . . . . . . . . . . (558). . . . . . . . . 1.7241. . . . . . Canadian Imperial Bank of Commerce . . . . . . . . . . . . . . . . A-1 . . . . . . . . . . . . . . . . . . . . . . . . . . . 153-Jan-18 . . . . . . . . . . . . . . . . . . .CAD . . . . . . . . . . . 1,435. . . . . . . . . . . GBP . . . . . . . . . . . (837). . . . . . . . . 1.7146. . . . . . Bank of New York Mellon Trust Co. N.A. (The) . . . . . . . A-1+ . . . . . . . . . . . . . . . . . . . . . . . . . 153-Jan-18 . . . . . . . . . . . . . . . . . . .CAD . . . . . . . . . . . 1,917. . . . . . . . . . . GBP . . . . . . . . . (1,118). . . . . . . . . 1.7149. . . . . . Canadian Imperial Bank of Commerce . . . . . . . . . . . . . . . . A-1 . . . . . . . . . . . . . . . . . . . . . . . . . . . 203-Jan-18 . . . . . . . . . . . . . . . . . . .CAD . . . . . . . . . . . 4,280. . . . . . . . . . . . EUR . . . . . . . . . (2,823). . . . . . . . . 1.5162. . . . . . Canadian Imperial Bank of Commerce . . . . . . . . . . . . . . . . A-1 . . . . . . . . . . . . . . . . . . . . . . . . . . . 233-Jan-18 . . . . . . . . . . . . . . . . . . .CAD . . . . . . . . . . . 2,150. . . . . . . . . . . . EUR . . . . . . . . . (1,409). . . . . . . . . 1.5257. . . . . . Royal Bank of Canada . . . . . . . . . . . . . . . . . . . . . . . . . . . . . . . . . . A-1+ . . . . . . . . . . . . . . . . . . . . . . . . . 253-Jan-18 . . . . . . . . . . . . . . . . . . .CAD . . . . . . . . . . . 2,153. . . . . . . . . . . . EUR . . . . . . . . . (1,410). . . . . . . . . 1.5270. . . . . . Canadian Imperial Bank of Commerce . . . . . . . . . . . . . . . . A-1 . . . . . . . . . . . . . . . . . . . . . . . . . . . 263-Jan-18 . . . . . . . . . . . . . . . . . . .CAD . . . . . . . . . . . 5,948. . . . . . . . . . . . SEK . . . . . . . (38,549). . . . . . . . . 0.1543. . . . . . Bank of New York Mellon Trust Co. N.A. (The) . . . . . . . A-1+ . . . . . . . . . . . . . . . . . . . . . . . . . 413-Jan-18 . . . . . . . . . . . . . . . . . . .CAD . . . . . . . . . . . 6,704. . . . . . . . . . . . SEK . . . . . . . (43,444). . . . . . . . . 0.1543. . . . . . Royal Bank of Canada . . . . . . . . . . . . . . . . . . . . . . . . . . . . . . . . . . A-1+ . . . . . . . . . . . . . . . . . . . . . . . . . 463-Jan-18 . . . . . . . . . . . . . . . . . . .CAD . . . . . . . . . . . 8,885. . . . . . . . . . . . SEK . . . . . . . (57,579). . . . . . . . . 0.1543. . . . . . Canadian Imperial Bank of Commerce . . . . . . . . . . . . . . . . A-1 . . . . . . . . . . . . . . . . . . . . . . . . . . . 623-Jan-18 . . . . . . . . . . . . . . . . . . .CAD . . . . . . . . . 10,304. . . . . . . . . . . . SEK . . . . . . . (66,775). . . . . . . . . 0.1543. . . . . . Bank of Montreal . . . . . . . . . . . . . . . . . . . . . . . . . . . . . . . . . . . . . . . A-1 . . . . . . . . . . . . . . . . . . . . . . . . . . . 723-Jan-18 . . . . . . . . . . . . . . . . . . .CAD . . . . . . . . . 17,259. . . . . . . . . . . . CHF . . . . . . . (13,191). . . . . . . . . 1.3084. . . . . . Toronto Dominion Bank, The . . . . . . . . . . . . . . . . . . . . . . . . . . A-1+ . . . . . . . . . . . . . . . . . . . . . . . . 2433-Jan-18 . . . . . . . . . . . . . . . . . . .CAD . . . . . . . . . 19,892. . . . . . . . . . . . CHF . . . . . . . (15,203). . . . . . . . . 1.3084. . . . . . Bank of Montreal . . . . . . . . . . . . . . . . . . . . . . . . . . . . . . . . . . . . . . . A-1 . . . . . . . . . . . . . . . . . . . . . . . . . . 2803-Jan-18 . . . . . . . . . . . . . . . . . . .CAD . . . . . . . . . 22,477. . . . . . . . . . . . CHF . . . . . . . (17,179). . . . . . . . . 1.3084. . . . . . Canadian Imperial Bank of Commerce . . . . . . . . . . . . . . . . A-1 . . . . . . . . . . . . . . . . . . . . . . . . . . 3173-Jan-18 . . . . . . . . . . . . . . . . . . .CAD . . . . . . . . . 14,684. . . . . . . . . . . GBP . . . . . . . . . (8,463). . . . . . . . . 1.7351. . . . . . Bank of Montreal . . . . . . . . . . . . . . . . . . . . . . . . . . . . . . . . . . . . . . . A-1 . . . . . . . . . . . . . . . . . . . . . . . . . . 3213-Jan-18 . . . . . . . . . . . . . . . . . . .CAD . . . . . . . . . 16,264. . . . . . . . . . . GBP . . . . . . . . . (9,374). . . . . . . . . 1.7350. . . . . . Toronto Dominion Bank, The . . . . . . . . . . . . . . . . . . . . . . . . . . A-1+ . . . . . . . . . . . . . . . . . . . . . . . . 3553-Jan-18 . . . . . . . . . . . . . . . . . . .CAD . . . . . . . . . 26,815. . . . . . . . . . . . CHF . . . . . . . (20,494). . . . . . . . . 1.3084. . . . . . Bank of Nova Scotia . . . . . . . . . . . . . . . . . . . . . . . . . . . . . . . . . . . . A-1 . . . . . . . . . . . . . . . . . . . . . . . . . . 3793-Jan-18 . . . . . . . . . . . . . . . . . . .CAD . . . . . . . . . 20,330. . . . . . . . . . . GBP . . . . . . . (11,717). . . . . . . . . 1.7351. . . . . . Canadian Imperial Bank of Commerce . . . . . . . . . . . . . . . . A-1 . . . . . . . . . . . . . . . . . . . . . . . . . . 4453-Jan-18 . . . . . . . . . . . . . . . . . . .CAD . . . . . . . . . 41,611. . . . . . . . . . . . CHF . . . . . . . (31,805). . . . . . . . . 1.3083. . . . . . Bank of New York Mellon Trust Co. N.A. (The) . . . . . . . A-1+ . . . . . . . . . . . . . . . . . . . . . . . . 5843-Jan-18 . . . . . . . . . . . . . . . . . . .CAD . . . . . . . . . 48,110. . . . . . . . . . . . EUR . . . . . . . (31,448). . . . . . . . . 1.5298. . . . . . Toronto Dominion Bank, The . . . . . . . . . . . . . . . . . . . . . . . . . . A-1+ . . . . . . . . . . . . . . . . . . . . . . . . 6803-Jan-18 . . . . . . . . . . . . . . . . . . .CAD . . . . . . . . . 33,252. . . . . . . . . . . GBP . . . . . . . (19,165). . . . . . . . . 1.7351. . . . . . Bank of Nova Scotia . . . . . . . . . . . . . . . . . . . . . . . . . . . . . . . . . . . . A-1 . . . . . . . . . . . . . . . . . . . . . . . . . . 7263-Jan-18 . . . . . . . . . . . . . . . . . . .CAD . . . . . . . . . 53,005. . . . . . . . . . . . EUR . . . . . . . (34,648). . . . . . . . . 1.5298. . . . . . Bank of Montreal . . . . . . . . . . . . . . . . . . . . . . . . . . . . . . . . . . . . . . . A-1 . . . . . . . . . . . . . . . . . . . . . . . . . . 7493-Jan-18 . . . . . . . . . . . . . . . . . . .CAD . . . . . . . . . 55,598. . . . . . . . . . . . CHF . . . . . . . (42,488). . . . . . . . . 1.3086. . . . . . Royal Bank of Canada . . . . . . . . . . . . . . . . . . . . . . . . . . . . . . . . . . A-1+ . . . . . . . . . . . . . . . . . . . . . . . . 7903-Jan-18 . . . . . . . . . . . . . . . . . . .CAD . . . . . . . . . 41,308. . . . . . . . . . . GBP . . . . . . . (23,809). . . . . . . . . 1.7350. . . . . . Bank of New York Mellon Trust Co. N.A. (The) . . . . . . . A-1+ . . . . . . . . . . . . . . . . . . . . . . . . 9003-Jan-18 . . . . . . . . . . . . . . . . . . .CAD . . . . . . . . . 66,116. . . . . . . . . . . . EUR . . . . . . . (43,221). . . . . . . . . 1.5297. . . . . . Bank of New York Mellon Trust Co. N.A. (The) . . . . . . . A-1+ . . . . . . . . . . . . . . . . . . . . . . . . 9303-Jan-18 . . . . . . . . . . . . . . . . . . .CAD . . . . . . . . . 68,855. . . . . . . . . . . . EUR . . . . . . . (45,009). . . . . . . . . 1.5298. . . . . . Royal Bank of Canada . . . . . . . . . . . . . . . . . . . . . . . . . . . . . . . . . . A-1+ . . . . . . . . . . . . . . . . . . . . . . . . 9723-Jan-18 . . . . . . . . . . . . . . . . . . .CAD . . . . . . . . . 47,872. . . . . . . . . . . GBP . . . . . . . (27,598). . . . . . . . . 1.7346. . . . . . Royal Bank of Canada . . . . . . . . . . . . . . . . . . . . . . . . . . . . . . . . . . A-1+ . . . . . . . . . . . . . . . . . . . . . . 1,0343-Jan-18 . . . . . . . . . . . . . . . . . . .CAD . . . . . . . . . 75,934. . . . . . . . . . . . EUR . . . . . . . (49,636). . . . . . . . . 1.5298. . . . . . Bank of Nova Scotia . . . . . . . . . . . . . . . . . . . . . . . . . . . . . . . . . . . . A-1 . . . . . . . . . . . . . . . . . . . . . . . . 1,0733-Jan-18 . . . . . . . . . . . . . . . . . . .CAD . . . . . . . . . 75,447. . . . . . . . . . . . EUR . . . . . . . (49,292). . . . . . . . . 1.5306. . . . . . Canadian Imperial Bank of Commerce . . . . . . . . . . . . . . . . A-1 . . . . . . . . . . . . . . . . . . . . . . . . 1,1053-Jan-18 . . . . . . . . . . . . . . . . . . . CHF . . . . . . . . . . . 1,405. . . . . . . . . . . .CAD . . . . . . . . . (1,806). . . . . . . . . 0.7781. . . . . . Bank of New York Mellon Trust Co. N.A. (The) . . . . . . . A-1+ . . . . . . . . . . . . . . . . . . . . . . . . . . . 73-Jan-18 . . . . . . . . . . . . . . . . . . . CHF . . . . . . . . . 13,191. . . . . . . . . . . .CAD . . . . . . . (16,955). . . . . . . . . 0.7780. . . . . . Toronto Dominion Bank, The . . . . . . . . . . . . . . . . . . . . . . . . . . A-1+ . . . . . . . . . . . . . . . . . . . . . . . . . 613-Jan-18 . . . . . . . . . . . . . . . . . . . CHF . . . . . . . . . 15,203. . . . . . . . . . . .CAD . . . . . . . (19,542). . . . . . . . . 0.7780. . . . . . Bank of Montreal . . . . . . . . . . . . . . . . . . . . . . . . . . . . . . . . . . . . . . . A-1 . . . . . . . . . . . . . . . . . . . . . . . . . . . 693-Jan-18 . . . . . . . . . . . . . . . . . . . CHF . . . . . . . . . 19,621. . . . . . . . . . . .CAD . . . . . . . (25,220). . . . . . . . . 0.7780. . . . . . Canadian Imperial Bank of Commerce . . . . . . . . . . . . . . . . A-1 . . . . . . . . . . . . . . . . . . . . . . . . . . . 903-Jan-18 . . . . . . . . . . . . . . . . . . . CHF . . . . . . . . . 20,494. . . . . . . . . . . .CAD . . . . . . . (26,342). . . . . . . . . 0.7780. . . . . . Bank of Nova Scotia . . . . . . . . . . . . . . . . . . . . . . . . . . . . . . . . . . . . A-1 . . . . . . . . . . . . . . . . . . . . . . . . . . . 933-Jan-18 . . . . . . . . . . . . . . . . . . . CHF . . . . . . . . . 33,190. . . . . . . . . . . .CAD . . . . . . . (42,657). . . . . . . . . 0.7781. . . . . . Bank of New York Mellon Trust Co. N.A. (The) . . . . . . . A-1+ . . . . . . . . . . . . . . . . . . . . . . . . 1573-Jan-18 . . . . . . . . . . . . . . . . . . . CHF . . . . . . . . . 44,922. . . . . . . . . . . .CAD . . . . . . . (57,742). . . . . . . . . 0.7780. . . . . . Royal Bank of Canada . . . . . . . . . . . . . . . . . . . . . . . . . . . . . . . . . . A-1+ . . . . . . . . . . . . . . . . . . . . . . . . 2063-Jan-18 . . . . . . . . . . . . . . . . . . GBP . . . . . . . . . . . . . 850. . . . . . . . . . . .CAD . . . . . . . . . (1,439). . . . . . . . . 0.5907. . . . . . Bank of New York Mellon Trust Co. N.A. (The) . . . . . . . A-1+ . . . . . . . . . . . . . . . . . . . . . . . . . . . 43-Jan-18 . . . . . . . . . . . . . . . . . . . SEK . . . . . . . . . . . 5,392. . . . . . . . . . . .CAD . . . . . . . . . . . (825). . . . . . . . . 6.5384. . . . . . Toronto Dominion Bank, The . . . . . . . . . . . . . . . . . . . . . . . . . . A-1+ . . . . . . . . . . . . . . . . . . . . . . . . . . . 23-Jan-18 . . . . . . . . . . . . . . . . . . . SEK . . . . . . . . . 24,591. . . . . . . . . . . .CAD . . . . . . . . . (3,761). . . . . . . . . 6.5384. . . . . . Bank of New York Mellon Trust Co. N.A. (The) . . . . . . . A-1+ . . . . . . . . . . . . . . . . . . . . . . . . . . . 7
BMO Europe High Dividend Covered Call Hedged to CAD ETF
Schedule of Investment Portfolio (cont’d)
As at December 31, 2017 (All amounts in thousands of Canadian dollars, unless otherwise noted)
Settlement Date
Currency Buy
Position (000s)
Currency Sell
Position (000s)
Contract Rate Counterparty
Credit Rating*
Unrealized Gain
3-Jan-18 . . . . . . . . . . . . . . . . . . . SEK . . . . . . . . . 46,839. . . . . . . . . . . .CAD . . . . . . . . . (7,164). . . . . . . . . 6.5385. . . . . . Royal Bank of Canada . . . . . . . . . . . . . . . . . . . . . . . . . . . . . . . . . . A-1+ . . . . . . . . . . . . . . . . . . . . . . . . . 143-Jan-18 . . . . . . . . . . . . . . . . . . . SEK . . . . . . . . . 60,987. . . . . . . . . . . .CAD . . . . . . . . . (9,328). . . . . . . . . 6.5384. . . . . . Canadian Imperial Bank of Commerce . . . . . . . . . . . . . . . . A-1 . . . . . . . . . . . . . . . . . . . . . . . . . . . 183-Jan-18 . . . . . . . . . . . . . . . . . . . SEK . . . . . . . . . 66,775. . . . . . . . . . . .CAD . . . . . . . (10,213). . . . . . . . . 6.5384. . . . . . Bank of Montreal . . . . . . . . . . . . . . . . . . . . . . . . . . . . . . . . . . . . . . . A-1 . . . . . . . . . . . . . . . . . . . . . . . . . . . 192-Feb-18 . . . . . . . . . . . . . . . . . .CAD . . . . . . . . . 14,375. . . . . . . . . . . GBP . . . . . . . . . (8,463). . . . . . . . . 1.6985. . . . . . Bank of Montreal . . . . . . . . . . . . . . . . . . . . . . . . . . . . . . . . . . . . . . . A-1 . . . . . . . . . . . . . . . . . . . . . . . . . . . . . 12-Feb-18 . . . . . . . . . . . . . . . . . .CAD . . . . . . . . . 15,924. . . . . . . . . . . GBP . . . . . . . . . (9,374). . . . . . . . . 1.6988. . . . . . Toronto Dominion Bank, The . . . . . . . . . . . . . . . . . . . . . . . . . . A-1+ . . . . . . . . . . . . . . . . . . . . . . . . . . . 42-Feb-18 . . . . . . . . . . . . . . . . . .CAD . . . . . . . . . 32,554. . . . . . . . . . . GBP . . . . . . . (19,165). . . . . . . . . 1.6986. . . . . . Bank of Nova Scotia . . . . . . . . . . . . . . . . . . . . . . . . . . . . . . . . . . . . A-1 . . . . . . . . . . . . . . . . . . . . . . . . . . . . . 52-Feb-18 . . . . . . . . . . . . . . . . . .CAD . . . . . . . . . 49,712. . . . . . . . . . . GBP . . . . . . . (29,267). . . . . . . . . 1.6986. . . . . . Royal Bank of Canada . . . . . . . . . . . . . . . . . . . . . . . . . . . . . . . . . . A-1+ . . . . . . . . . . . . . . . . . . . . . . . . . . . 62-Feb-18 . . . . . . . . . . . . . . . . . .CAD . . . . . . . . . 22,752. . . . . . . . . . . GBP . . . . . . . (13,393). . . . . . . . . 1.6988. . . . . . Canadian Imperial Bank of Commerce . . . . . . . . . . . . . . . . A-1 . . . . . . . . . . . . . . . . . . . . . . . . . . . . . 62-Feb-18 . . . . . . . . . . . . . . . . . .CAD . . . . . . . . . 35,774. . . . . . . . . . . GBP . . . . . . . (21,060). . . . . . . . . 1.6987. . . . . . Bank of New York Mellon Trust Co. N.A. (The) . . . . . . . A-1+ . . . . . . . . . . . . . . . . . . . . . . . . . . . 6
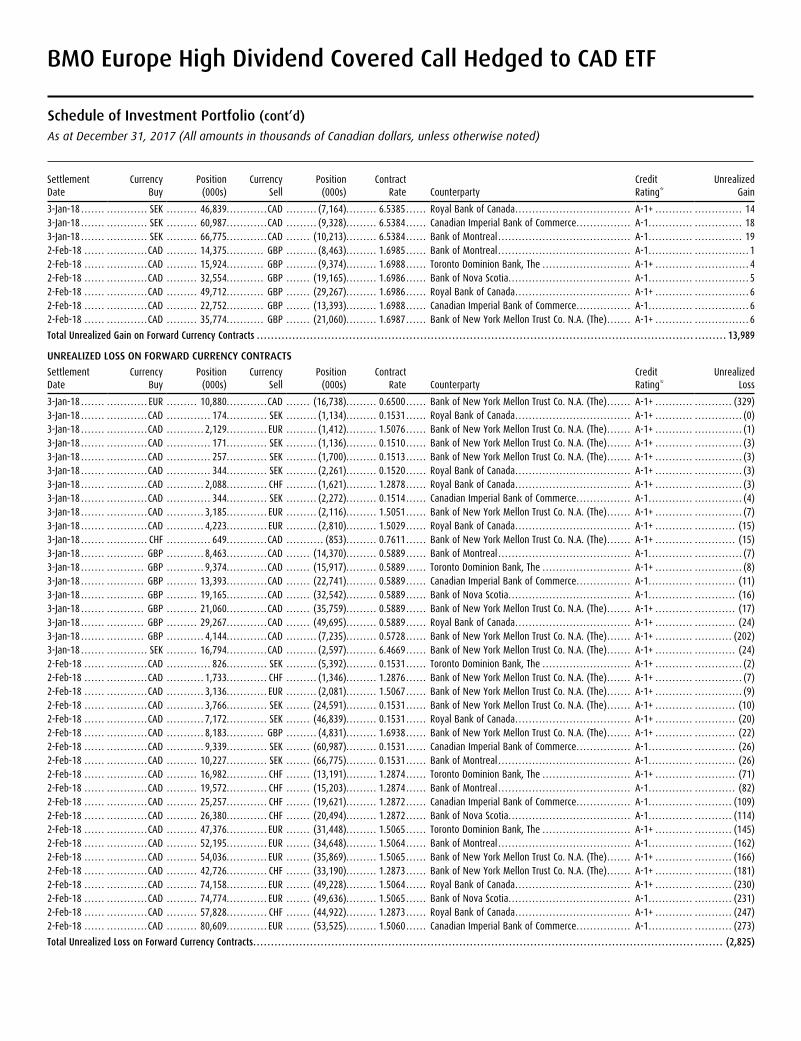
Total Unrealized Gain on Forward Currency Contracts . . . . . . . . . . . . . . . . . . . . . . . . . . . . . . . . . . . . . . . . . . . . . . . . . . . . . . . . . . . . . . . . . . . . . . . . . . . . . . . . . . . . . . . . . . . . . . . . . . . . . . . . . . . . . . . . . . . . . . . . . . . . . . . . . . . . 13,989
UNREALIZED LOSS ON FORWARD CURRENCY CONTRACTS
Settlement Date
Currency Buy
Position (000s)
Currency Sell
Position (000s)
Contract Rate Counterparty
Credit Rating*
Unrealized Loss
3-Jan-18 . . . . . . . . . . . . . . . . . . . EUR . . . . . . . . . 10,880. . . . . . . . . . . .CAD . . . . . . . (16,738). . . . . . . . . 0.6500. . . . . . Bank of New York Mellon Trust Co. N.A. (The) . . . . . . . A-1+ . . . . . . . . . . . . . . . . . . . . . . (329)3-Jan-18 . . . . . . . . . . . . . . . . . . .CAD . . . . . . . . . . . . . 174. . . . . . . . . . . . SEK . . . . . . . . . (1,134). . . . . . . . . 0.1531. . . . . . Royal Bank of Canada . . . . . . . . . . . . . . . . . . . . . . . . . . . . . . . . . . A-1+ . . . . . . . . . . . . . . . . . . . . . . . . . (0)3-Jan-18 . . . . . . . . . . . . . . . . . . .CAD . . . . . . . . . . . 2,129. . . . . . . . . . . . EUR . . . . . . . . . (1,412). . . . . . . . . 1.5076. . . . . . Bank of New York Mellon Trust Co. N.A. (The) . . . . . . . A-1+ . . . . . . . . . . . . . . . . . . . . . . . . . (1)3-Jan-18 . . . . . . . . . . . . . . . . . . .CAD . . . . . . . . . . . . . 171. . . . . . . . . . . . SEK . . . . . . . . . (1,136). . . . . . . . . 0.1510. . . . . . Bank of New York Mellon Trust Co. N.A. (The) . . . . . . . A-1+ . . . . . . . . . . . . . . . . . . . . . . . . . (3)3-Jan-18 . . . . . . . . . . . . . . . . . . .CAD . . . . . . . . . . . . . 257. . . . . . . . . . . . SEK . . . . . . . . . (1,700). . . . . . . . . 0.1513. . . . . . Bank of New York Mellon Trust Co. N.A. (The) . . . . . . . A-1+ . . . . . . . . . . . . . . . . . . . . . . . . . (3)3-Jan-18 . . . . . . . . . . . . . . . . . . .CAD . . . . . . . . . . . . . 344. . . . . . . . . . . . SEK . . . . . . . . . (2,261). . . . . . . . . 0.1520. . . . . . Royal Bank of Canada . . . . . . . . . . . . . . . . . . . . . . . . . . . . . . . . . . A-1+ . . . . . . . . . . . . . . . . . . . . . . . . . (3)3-Jan-18 . . . . . . . . . . . . . . . . . . .CAD . . . . . . . . . . . 2,088. . . . . . . . . . . . CHF . . . . . . . . . (1,621). . . . . . . . . 1.2878. . . . . . Royal Bank of Canada . . . . . . . . . . . . . . . . . . . . . . . . . . . . . . . . . . A-1+ . . . . . . . . . . . . . . . . . . . . . . . . . (3)3-Jan-18 . . . . . . . . . . . . . . . . . . .CAD . . . . . . . . . . . . . 344. . . . . . . . . . . . SEK . . . . . . . . . (2,272). . . . . . . . . 0.1514. . . . . . Canadian Imperial Bank of Commerce . . . . . . . . . . . . . . . . A-1 . . . . . . . . . . . . . . . . . . . . . . . . . . . (4)3-Jan-18 . . . . . . . . . . . . . . . . . . .CAD . . . . . . . . . . . 3,185. . . . . . . . . . . . EUR . . . . . . . . . (2,116). . . . . . . . . 1.5051. . . . . . Bank of New York Mellon Trust Co. N.A. (The) . . . . . . . A-1+ . . . . . . . . . . . . . . . . . . . . . . . . . (7)3-Jan-18 . . . . . . . . . . . . . . . . . . .CAD . . . . . . . . . . . 4,223. . . . . . . . . . . . EUR . . . . . . . . . (2,810). . . . . . . . . 1.5029. . . . . . Royal Bank of Canada . . . . . . . . . . . . . . . . . . . . . . . . . . . . . . . . . . A-1+ . . . . . . . . . . . . . . . . . . . . . . . (15)3-Jan-18 . . . . . . . . . . . . . . . . . . . CHF . . . . . . . . . . . . . 649. . . . . . . . . . . .CAD . . . . . . . . . . . (853). . . . . . . . . 0.7611. . . . . . Bank of New York Mellon Trust Co. N.A. (The) . . . . . . . A-1+ . . . . . . . . . . . . . . . . . . . . . . . (15)3-Jan-18 . . . . . . . . . . . . . . . . . . GBP . . . . . . . . . . . 8,463. . . . . . . . . . . .CAD . . . . . . . (14,370). . . . . . . . . 0.5889. . . . . . Bank of Montreal . . . . . . . . . . . . . . . . . . . . . . . . . . . . . . . . . . . . . . . A-1 . . . . . . . . . . . . . . . . . . . . . . . . . . . (7)3-Jan-18 . . . . . . . . . . . . . . . . . . GBP . . . . . . . . . . . 9,374. . . . . . . . . . . .CAD . . . . . . . (15,917). . . . . . . . . 0.5889. . . . . . Toronto Dominion Bank, The . . . . . . . . . . . . . . . . . . . . . . . . . . A-1+ . . . . . . . . . . . . . . . . . . . . . . . . . (8)3-Jan-18 . . . . . . . . . . . . . . . . . . GBP . . . . . . . . . 13,393. . . . . . . . . . . .CAD . . . . . . . (22,741). . . . . . . . . 0.5889. . . . . . Canadian Imperial Bank of Commerce . . . . . . . . . . . . . . . . A-1 . . . . . . . . . . . . . . . . . . . . . . . . . (11)3-Jan-18 . . . . . . . . . . . . . . . . . . GBP . . . . . . . . . 19,165. . . . . . . . . . . .CAD . . . . . . . (32,542). . . . . . . . . 0.5889. . . . . . Bank of Nova Scotia . . . . . . . . . . . . . . . . . . . . . . . . . . . . . . . . . . . . A-1 . . . . . . . . . . . . . . . . . . . . . . . . . (16)3-Jan-18 . . . . . . . . . . . . . . . . . . GBP . . . . . . . . . 21,060. . . . . . . . . . . .CAD . . . . . . . (35,759). . . . . . . . . 0.5889. . . . . . Bank of New York Mellon Trust Co. N.A. (The) . . . . . . . A-1+ . . . . . . . . . . . . . . . . . . . . . . . (17)3-Jan-18 . . . . . . . . . . . . . . . . . . GBP . . . . . . . . . 29,267. . . . . . . . . . . .CAD . . . . . . . (49,695). . . . . . . . . 0.5889. . . . . . Royal Bank of Canada . . . . . . . . . . . . . . . . . . . . . . . . . . . . . . . . . . A-1+ . . . . . . . . . . . . . . . . . . . . . . . (24)3-Jan-18 . . . . . . . . . . . . . . . . . . GBP . . . . . . . . . . . 4,144. . . . . . . . . . . .CAD . . . . . . . . . (7,235). . . . . . . . . 0.5728. . . . . . Bank of New York Mellon Trust Co. N.A. (The) . . . . . . . A-1+ . . . . . . . . . . . . . . . . . . . . . . (202)3-Jan-18 . . . . . . . . . . . . . . . . . . . SEK . . . . . . . . . 16,794. . . . . . . . . . . .CAD . . . . . . . . . (2,597). . . . . . . . . 6.4669. . . . . . Bank of New York Mellon Trust Co. N.A. (The) . . . . . . . A-1+ . . . . . . . . . . . . . . . . . . . . . . . (24)2-Feb-18 . . . . . . . . . . . . . . . . . .CAD . . . . . . . . . . . . . 826. . . . . . . . . . . . SEK . . . . . . . . . (5,392). . . . . . . . . 0.1531. . . . . . Toronto Dominion Bank, The . . . . . . . . . . . . . . . . . . . . . . . . . . A-1+ . . . . . . . . . . . . . . . . . . . . . . . . . (2)2-Feb-18 . . . . . . . . . . . . . . . . . .CAD . . . . . . . . . . . 1,733. . . . . . . . . . . . CHF . . . . . . . . . (1,346). . . . . . . . . 1.2876. . . . . . Bank of New York Mellon Trust Co. N.A. (The) . . . . . . . A-1+ . . . . . . . . . . . . . . . . . . . . . . . . . (7)2-Feb-18 . . . . . . . . . . . . . . . . . .CAD . . . . . . . . . . . 3,136. . . . . . . . . . . . EUR . . . . . . . . . (2,081). . . . . . . . . 1.5067. . . . . . Bank of New York Mellon Trust Co. N.A. (The) . . . . . . . A-1+ . . . . . . . . . . . . . . . . . . . . . . . . . (9)2-Feb-18 . . . . . . . . . . . . . . . . . .CAD . . . . . . . . . . . 3,766. . . . . . . . . . . . SEK . . . . . . . (24,591). . . . . . . . . 0.1531. . . . . . Bank of New York Mellon Trust Co. N.A. (The) . . . . . . . A-1+ . . . . . . . . . . . . . . . . . . . . . . . (10)2-Feb-18 . . . . . . . . . . . . . . . . . .CAD . . . . . . . . . . . 7,172. . . . . . . . . . . . SEK . . . . . . . (46,839). . . . . . . . . 0.1531. . . . . . Royal Bank of Canada . . . . . . . . . . . . . . . . . . . . . . . . . . . . . . . . . . A-1+ . . . . . . . . . . . . . . . . . . . . . . . (20)2-Feb-18 . . . . . . . . . . . . . . . . . .CAD . . . . . . . . . . . 8,183. . . . . . . . . . . GBP . . . . . . . . . (4,831). . . . . . . . . 1.6938. . . . . . Bank of New York Mellon Trust Co. N.A. (The) . . . . . . . A-1+ . . . . . . . . . . . . . . . . . . . . . . . (22)2-Feb-18 . . . . . . . . . . . . . . . . . .CAD . . . . . . . . . . . 9,339. . . . . . . . . . . . SEK . . . . . . . (60,987). . . . . . . . . 0.1531. . . . . . Canadian Imperial Bank of Commerce . . . . . . . . . . . . . . . . A-1 . . . . . . . . . . . . . . . . . . . . . . . . . (26)2-Feb-18 . . . . . . . . . . . . . . . . . .CAD . . . . . . . . . 10,227. . . . . . . . . . . . SEK . . . . . . . (66,775). . . . . . . . . 0.1531. . . . . . Bank of Montreal . . . . . . . . . . . . . . . . . . . . . . . . . . . . . . . . . . . . . . . A-1 . . . . . . . . . . . . . . . . . . . . . . . . . (26)2-Feb-18 . . . . . . . . . . . . . . . . . .CAD . . . . . . . . . 16,982. . . . . . . . . . . . CHF . . . . . . . (13,191). . . . . . . . . 1.2874. . . . . . Toronto Dominion Bank, The . . . . . . . . . . . . . . . . . . . . . . . . . . A-1+ . . . . . . . . . . . . . . . . . . . . . . . (71)2-Feb-18 . . . . . . . . . . . . . . . . . .CAD . . . . . . . . . 19,572. . . . . . . . . . . . CHF . . . . . . . (15,203). . . . . . . . . 1.2874. . . . . . Bank of Montreal . . . . . . . . . . . . . . . . . . . . . . . . . . . . . . . . . . . . . . . A-1 . . . . . . . . . . . . . . . . . . . . . . . . . (82)2-Feb-18 . . . . . . . . . . . . . . . . . .CAD . . . . . . . . . 25,257. . . . . . . . . . . . CHF . . . . . . . (19,621). . . . . . . . . 1.2872. . . . . . Canadian Imperial Bank of Commerce . . . . . . . . . . . . . . . . A-1 . . . . . . . . . . . . . . . . . . . . . . . . (109)2-Feb-18 . . . . . . . . . . . . . . . . . .CAD . . . . . . . . . 26,380. . . . . . . . . . . . CHF . . . . . . . (20,494). . . . . . . . . 1.2872. . . . . . Bank of Nova Scotia . . . . . . . . . . . . . . . . . . . . . . . . . . . . . . . . . . . . A-1 . . . . . . . . . . . . . . . . . . . . . . . . (114)2-Feb-18 . . . . . . . . . . . . . . . . . .CAD . . . . . . . . . 47,376. . . . . . . . . . . . EUR . . . . . . . (31,448). . . . . . . . . 1.5065. . . . . . Toronto Dominion Bank, The . . . . . . . . . . . . . . . . . . . . . . . . . . A-1+ . . . . . . . . . . . . . . . . . . . . . . (145)2-Feb-18 . . . . . . . . . . . . . . . . . .CAD . . . . . . . . . 52,195. . . . . . . . . . . . EUR . . . . . . . (34,648). . . . . . . . . 1.5064. . . . . . Bank of Montreal . . . . . . . . . . . . . . . . . . . . . . . . . . . . . . . . . . . . . . . A-1 . . . . . . . . . . . . . . . . . . . . . . . . (162)2-Feb-18 . . . . . . . . . . . . . . . . . .CAD . . . . . . . . . 54,036. . . . . . . . . . . . EUR . . . . . . . (35,869). . . . . . . . . 1.5065. . . . . . Bank of New York Mellon Trust Co. N.A. (The) . . . . . . . A-1+ . . . . . . . . . . . . . . . . . . . . . . (166)2-Feb-18 . . . . . . . . . . . . . . . . . .CAD . . . . . . . . . 42,726. . . . . . . . . . . . CHF . . . . . . . (33,190). . . . . . . . . 1.2873. . . . . . Bank of New York Mellon Trust Co. N.A. (The) . . . . . . . A-1+ . . . . . . . . . . . . . . . . . . . . . . (181)2-Feb-18 . . . . . . . . . . . . . . . . . .CAD . . . . . . . . . 74,158. . . . . . . . . . . . EUR . . . . . . . (49,228). . . . . . . . . 1.5064. . . . . . Royal Bank of Canada . . . . . . . . . . . . . . . . . . . . . . . . . . . . . . . . . . A-1+ . . . . . . . . . . . . . . . . . . . . . . (230)2-Feb-18 . . . . . . . . . . . . . . . . . .CAD . . . . . . . . . 74,774. . . . . . . . . . . . EUR . . . . . . . (49,636). . . . . . . . . 1.5065. . . . . . Bank of Nova Scotia . . . . . . . . . . . . . . . . . . . . . . . . . . . . . . . . . . . . A-1 . . . . . . . . . . . . . . . . . . . . . . . . (231)2-Feb-18 . . . . . . . . . . . . . . . . . .CAD . . . . . . . . . 57,828. . . . . . . . . . . . CHF . . . . . . . (44,922). . . . . . . . . 1.2873. . . . . . Royal Bank of Canada . . . . . . . . . . . . . . . . . . . . . . . . . . . . . . . . . . A-1+ . . . . . . . . . . . . . . . . . . . . . . (247)2-Feb-18 . . . . . . . . . . . . . . . . . .CAD . . . . . . . . . 80,609. . . . . . . . . . . . EUR . . . . . . . (53,525). . . . . . . . . 1.5060. . . . . . Canadian Imperial Bank of Commerce . . . . . . . . . . . . . . . . A-1 . . . . . . . . . . . . . . . . . . . . . . . . (273)
Total Unrealized Loss on Forward Currency Contracts . . . . . . . . . . . . . . . . . . . . . . . . . . . . . . . . . . . . . . . . . . . . . . . . . . . . . . . . . . . . . . . . . . . . . . . . . . . . . . . . . . . . . . . . . . . . . . . . . . . . . . . . . . . . . . . . . . . . . . . . . . . . . . . . . . . . (2,825)
BMO Europe High Dividend Covered Call Hedged to CAD ETF
Schedule of Investment Portfolio (cont’d)
As at December 31, 2017 (All amounts in thousands of Canadian dollars, unless otherwise noted)
Underlying Security
Number of
ContractsStrike Price
Expiry Date
Premium Received
Fair Value
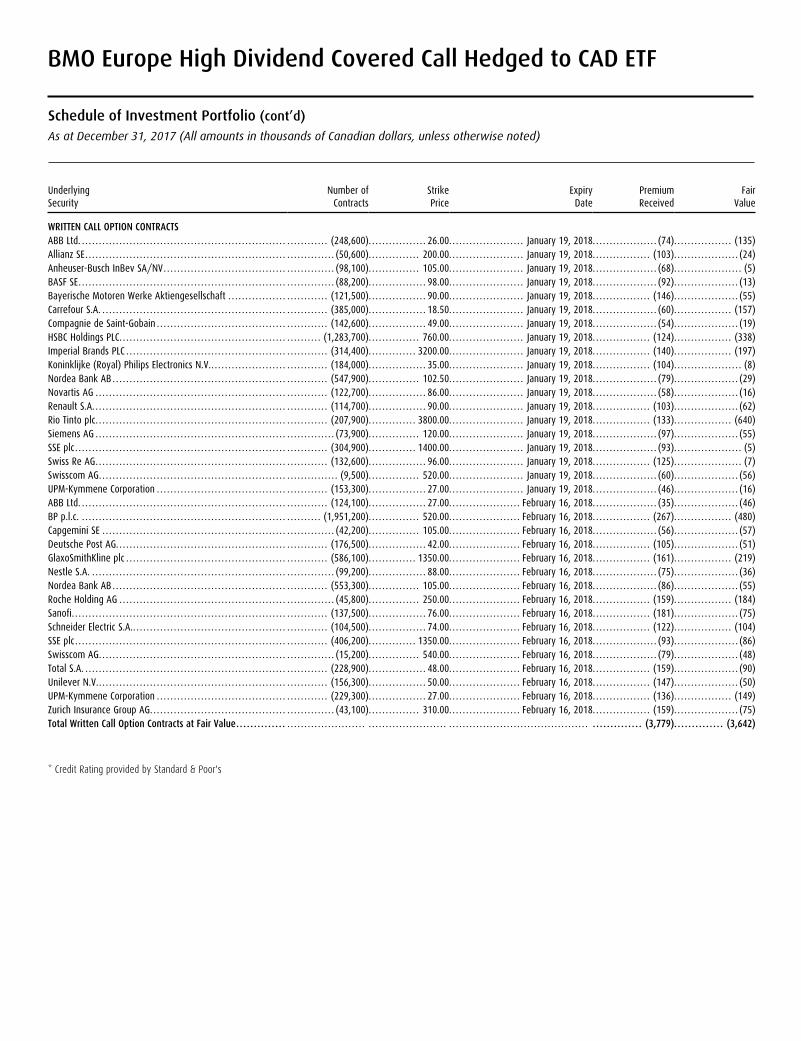
WRITTEN CALL OPTION CONTRACTSABB Ltd. . . . . . . . . . . . . . . . . . . . . . . . . . . . . . . . . . . . . . . . . . . . . . . . . . . . . . . . . . . . . . . . . . . . . . . . . (248,600). . . . . . . . . . . . . . . . . 26.00. . . . . . . . . . . . . . . . . . . . . . January 19, 2018. . . . . . . . . . . . . . . . . . . (74). . . . . . . . . . . . . . . . . (135)Allianz SE . . . . . . . . . . . . . . . . . . . . . . . . . . . . . . . . . . . . . . . . . . . . . . . . . . . . . . . . . . . . . . . . . . . . . . . . . (50,600). . . . . . . . . . . . . . . 200.00. . . . . . . . . . . . . . . . . . . . . . January 19, 2018. . . . . . . . . . . . . . . . . (103). . . . . . . . . . . . . . . . . . . (24)Anheuser-Busch InBev SA/NV . . . . . . . . . . . . . . . . . . . . . . . . . . . . . . . . . . . . . . . . . . . . . . . . . . (98,100). . . . . . . . . . . . . . . 105.00. . . . . . . . . . . . . . . . . . . . . . January 19, 2018. . . . . . . . . . . . . . . . . . . (68). . . . . . . . . . . . . . . . . . . . (5)BASF SE . . . . . . . . . . . . . . . . . . . . . . . . . . . . . . . . . . . . . . . . . . . . . . . . . . . . . . . . . . . . . . . . . . . . . . . . . . . (88,200). . . . . . . . . . . . . . . . . 98.00. . . . . . . . . . . . . . . . . . . . . . January 19, 2018. . . . . . . . . . . . . . . . . . . (92). . . . . . . . . . . . . . . . . . . (13)Bayerische Motoren Werke Aktiengesellschaft . . . . . . . . . . . . . . . . . . . . . . . . . . . . . (121,500). . . . . . . . . . . . . . . . . 90.00. . . . . . . . . . . . . . . . . . . . . . January 19, 2018. . . . . . . . . . . . . . . . . (146). . . . . . . . . . . . . . . . . . . (55)Carrefour S.A. . . . . . . . . . . . . . . . . . . . . . . . . . . . . . . . . . . . . . . . . . . . . . . . . . . . . . . . . . . . . . . . . . . (385,000). . . . . . . . . . . . . . . . . 18.50. . . . . . . . . . . . . . . . . . . . . . January 19, 2018. . . . . . . . . . . . . . . . . . . (60). . . . . . . . . . . . . . . . . (157)Compagnie de Saint-Gobain . . . . . . . . . . . . . . . . . . . . . . . . . . . . . . . . . . . . . . . . . . . . . . . . . . (142,600). . . . . . . . . . . . . . . . . 49.00. . . . . . . . . . . . . . . . . . . . . . January 19, 2018. . . . . . . . . . . . . . . . . . . (54). . . . . . . . . . . . . . . . . . . (19)HSBC Holdings PLC . . . . . . . . . . . . . . . . . . . . . . . . . . . . . . . . . . . . . . . . . . . . . . . . . . . . . . . . . . . (1,283,700). . . . . . . . . . . . . . . 760.00. . . . . . . . . . . . . . . . . . . . . . January 19, 2018. . . . . . . . . . . . . . . . . (124). . . . . . . . . . . . . . . . . (338)Imperial Brands PLC . . . . . . . . . . . . . . . . . . . . . . . . . . . . . . . . . . . . . . . . . . . . . . . . . . . . . . . . . . . (314,400). . . . . . . . . . . . . . 3200.00. . . . . . . . . . . . . . . . . . . . . . January 19, 2018. . . . . . . . . . . . . . . . . (140). . . . . . . . . . . . . . . . . (197)Koninklijke (Royal) Philips Electronics N.V. . . . . . . . . . . . . . . . . . . . . . . . . . . . . . . . . . . (184,000). . . . . . . . . . . . . . . . . 35.00. . . . . . . . . . . . . . . . . . . . . . January 19, 2018. . . . . . . . . . . . . . . . . (104). . . . . . . . . . . . . . . . . . . . (8)Nordea Bank AB . . . . . . . . . . . . . . . . . . . . . . . . . . . . . . . . . . . . . . . . . . . . . . . . . . . . . . . . . . . . . . . (547,900). . . . . . . . . . . . . . . 102.50. . . . . . . . . . . . . . . . . . . . . . January 19, 2018. . . . . . . . . . . . . . . . . . . (79). . . . . . . . . . . . . . . . . . . (29)Novartis AG . . . . . . . . . . . . . . . . . . . . . . . . . . . . . . . . . . . . . . . . . . . . . . . . . . . . . . . . . . . . . . . . . . . . (122,700). . . . . . . . . . . . . . . . . 86.00. . . . . . . . . . . . . . . . . . . . . . January 19, 2018. . . . . . . . . . . . . . . . . . . (58). . . . . . . . . . . . . . . . . . . (16)Renault S.A. . . . . . . . . . . . . . . . . . . . . . . . . . . . . . . . . . . . . . . . . . . . . . . . . . . . . . . . . . . . . . . . . . . . . (114,700). . . . . . . . . . . . . . . . . 90.00. . . . . . . . . . . . . . . . . . . . . . January 19, 2018. . . . . . . . . . . . . . . . . (103). . . . . . . . . . . . . . . . . . . (62)Rio Tinto plc . . . . . . . . . . . . . . . . . . . . . . . . . . . . . . . . . . . . . . . . . . . . . . . . . . . . . . . . . . . . . . . . . . . . (207,900). . . . . . . . . . . . . . 3800.00. . . . . . . . . . . . . . . . . . . . . . January 19, 2018. . . . . . . . . . . . . . . . . (133). . . . . . . . . . . . . . . . . (640)Siemens AG . . . . . . . . . . . . . . . . . . . . . . . . . . . . . . . . . . . . . . . . . . . . . . . . . . . . . . . . . . . . . . . . . . . . . . (73,900). . . . . . . . . . . . . . . 120.00. . . . . . . . . . . . . . . . . . . . . . January 19, 2018. . . . . . . . . . . . . . . . . . . (97). . . . . . . . . . . . . . . . . . . (55)SSE plc . . . . . . . . . . . . . . . . . . . . . . . . . . . . . . . . . . . . . . . . . . . . . . . . . . . . . . . . . . . . . . . . . . . . . . . . . . (304,900). . . . . . . . . . . . . . 1400.00. . . . . . . . . . . . . . . . . . . . . . January 19, 2018. . . . . . . . . . . . . . . . . . . (93). . . . . . . . . . . . . . . . . . . . (5)Swiss Re AG . . . . . . . . . . . . . . . . . . . . . . . . . . . . . . . . . . . . . . . . . . . . . . . . . . . . . . . . . . . . . . . . . . . . (132,600). . . . . . . . . . . . . . . . . 96.00. . . . . . . . . . . . . . . . . . . . . . January 19, 2018. . . . . . . . . . . . . . . . . (125). . . . . . . . . . . . . . . . . . . . (7)Swisscom AG . . . . . . . . . . . . . . . . . . . . . . . . . . . . . . . . . . . . . . . . . . . . . . . . . . . . . . . . . . . . . . . . . . . . . . (9,500). . . . . . . . . . . . . . . 520.00. . . . . . . . . . . . . . . . . . . . . . January 19, 2018. . . . . . . . . . . . . . . . . . . (60). . . . . . . . . . . . . . . . . . . (56)UPM-Kymmene Corporation . . . . . . . . . . . . . . . . . . . . . . . . . . . . . . . . . . . . . . . . . . . . . . . . . . (153,300). . . . . . . . . . . . . . . . . 27.00. . . . . . . . . . . . . . . . . . . . . . January 19, 2018. . . . . . . . . . . . . . . . . . . (46). . . . . . . . . . . . . . . . . . . (16)ABB Ltd. . . . . . . . . . . . . . . . . . . . . . . . . . . . . . . . . . . . . . . . . . . . . . . . . . . . . . . . . . . . . . . . . . . . . . . . . (124,100). . . . . . . . . . . . . . . . . 27.00. . . . . . . . . . . . . . . . . . . . . February 16, 2018. . . . . . . . . . . . . . . . . . . (35). . . . . . . . . . . . . . . . . . . (46)BP p.l.c. . . . . . . . . . . . . . . . . . . . . . . . . . . . . . . . . . . . . . . . . . . . . . . . . . . . . . . . . . . . . . . . . . . . . . . (1,951,200). . . . . . . . . . . . . . . 520.00. . . . . . . . . . . . . . . . . . . . . February 16, 2018. . . . . . . . . . . . . . . . . (267). . . . . . . . . . . . . . . . . (480)Capgemini SE . . . . . . . . . . . . . . . . . . . . . . . . . . . . . . . . . . . . . . . . . . . . . . . . . . . . . . . . . . . . . . . . . . . . (42,200). . . . . . . . . . . . . . . 105.00. . . . . . . . . . . . . . . . . . . . . February 16, 2018. . . . . . . . . . . . . . . . . . . (56). . . . . . . . . . . . . . . . . . . (57)Deutsche Post AG. . . . . . . . . . . . . . . . . . . . . . . . . . . . . . . . . . . . . . . . . . . . . . . . . . . . . . . . . . . . . . (176,500). . . . . . . . . . . . . . . . . 42.00. . . . . . . . . . . . . . . . . . . . . February 16, 2018. . . . . . . . . . . . . . . . . (105). . . . . . . . . . . . . . . . . . . (51)GlaxoSmithKline plc . . . . . . . . . . . . . . . . . . . . . . . . . . . . . . . . . . . . . . . . . . . . . . . . . . . . . . . . . . . (586,100). . . . . . . . . . . . . . 1350.00. . . . . . . . . . . . . . . . . . . . . February 16, 2018. . . . . . . . . . . . . . . . . (161). . . . . . . . . . . . . . . . . (219)Nestle S.A. . . . . . . . . . . . . . . . . . . . . . . . . . . . . . . . . . . . . . . . . . . . . . . . . . . . . . . . . . . . . . . . . . . . . . . . (99,200). . . . . . . . . . . . . . . . . 88.00. . . . . . . . . . . . . . . . . . . . . February 16, 2018. . . . . . . . . . . . . . . . . . . (75). . . . . . . . . . . . . . . . . . . (36)Nordea Bank AB . . . . . . . . . . . . . . . . . . . . . . . . . . . . . . . . . . . . . . . . . . . . . . . . . . . . . . . . . . . . . . . (553,300). . . . . . . . . . . . . . . 105.00. . . . . . . . . . . . . . . . . . . . . February 16, 2018. . . . . . . . . . . . . . . . . . . (86). . . . . . . . . . . . . . . . . . . (55)Roche Holding AG . . . . . . . . . . . . . . . . . . . . . . . . . . . . . . . . . . . . . . . . . . . . . . . . . . . . . . . . . . . . . . . (45,800). . . . . . . . . . . . . . . 250.00. . . . . . . . . . . . . . . . . . . . . February 16, 2018. . . . . . . . . . . . . . . . . (159). . . . . . . . . . . . . . . . . (184)Sanofi . . . . . . . . . . . . . . . . . . . . . . . . . . . . . . . . . . . . . . . . . . . . . . . . . . . . . . . . . . . . . . . . . . . . . . . . . . . (137,500). . . . . . . . . . . . . . . . . 76.00. . . . . . . . . . . . . . . . . . . . . February 16, 2018. . . . . . . . . . . . . . . . . (181). . . . . . . . . . . . . . . . . . . (75)Schneider Electric S.A. . . . . . . . . . . . . . . . . . . . . . . . . . . . . . . . . . . . . . . . . . . . . . . . . . . . . . . . . . (104,500). . . . . . . . . . . . . . . . . 74.00. . . . . . . . . . . . . . . . . . . . . February 16, 2018. . . . . . . . . . . . . . . . . (122). . . . . . . . . . . . . . . . . (104)SSE plc . . . . . . . . . . . . . . . . . . . . . . . . . . . . . . . . . . . . . . . . . . . . . . . . . . . . . . . . . . . . . . . . . . . . . . . . . . (406,200). . . . . . . . . . . . . . 1350.00. . . . . . . . . . . . . . . . . . . . . February 16, 2018. . . . . . . . . . . . . . . . . . . (93). . . . . . . . . . . . . . . . . . . (86)Swisscom AG . . . . . . . . . . . . . . . . . . . . . . . . . . . . . . . . . . . . . . . . . . . . . . . . . . . . . . . . . . . . . . . . . . . . . (15,200). . . . . . . . . . . . . . . 540.00. . . . . . . . . . . . . . . . . . . . . February 16, 2018. . . . . . . . . . . . . . . . . . . (79). . . . . . . . . . . . . . . . . . . (48)Total S.A. . . . . . . . . . . . . . . . . . . . . . . . . . . . . . . . . . . . . . . . . . . . . . . . . . . . . . . . . . . . . . . . . . . . . . . . (228,900). . . . . . . . . . . . . . . . . 48.00. . . . . . . . . . . . . . . . . . . . . February 16, 2018. . . . . . . . . . . . . . . . . (159). . . . . . . . . . . . . . . . . . . (90)Unilever N.V. . . . . . . . . . . . . . . . . . . . . . . . . . . . . . . . . . . . . . . . . . . . . . . . . . . . . . . . . . . . . . . . . . . . (156,300). . . . . . . . . . . . . . . . . 50.00. . . . . . . . . . . . . . . . . . . . . February 16, 2018. . . . . . . . . . . . . . . . . (147). . . . . . . . . . . . . . . . . . . (50)UPM-Kymmene Corporation . . . . . . . . . . . . . . . . . . . . . . . . . . . . . . . . . . . . . . . . . . . . . . . . . . (229,300). . . . . . . . . . . . . . . . . 27.00. . . . . . . . . . . . . . . . . . . . . February 16, 2018. . . . . . . . . . . . . . . . . (136). . . . . . . . . . . . . . . . . (149)Zurich Insurance Group AG . . . . . . . . . . . . . . . . . . . . . . . . . . . . . . . . . . . . . . . . . . . . . . . . . . . . . . (43,100). . . . . . . . . . . . . . . 310.00. . . . . . . . . . . . . . . . . . . . . February 16, 2018. . . . . . . . . . . . . . . . . (159). . . . . . . . . . . . . . . . . . . (75)Total Written Call Option Contracts at Fair Value . . . . . . . . . . . . . . . . . . . . . . . . . . . . . . . . . . . . . . . . . . . . . . . . . . . . . . . . . . . . . . . . . . . . . . . . . . . . . . . . . . . . . . . . . . . . . . . . . . . . . . . . . . . . . . . . . . . (3,779). . . . . . . . . . . . . . (3,642)
* Credit Rating provided by Standard & Poor's
BMO Europe High Dividend Covered Call Hedged to CAD ETF
Notes to the Financial Statements (All amounts in thousands of Canadian dollars, except per unit data)December 31, 2017
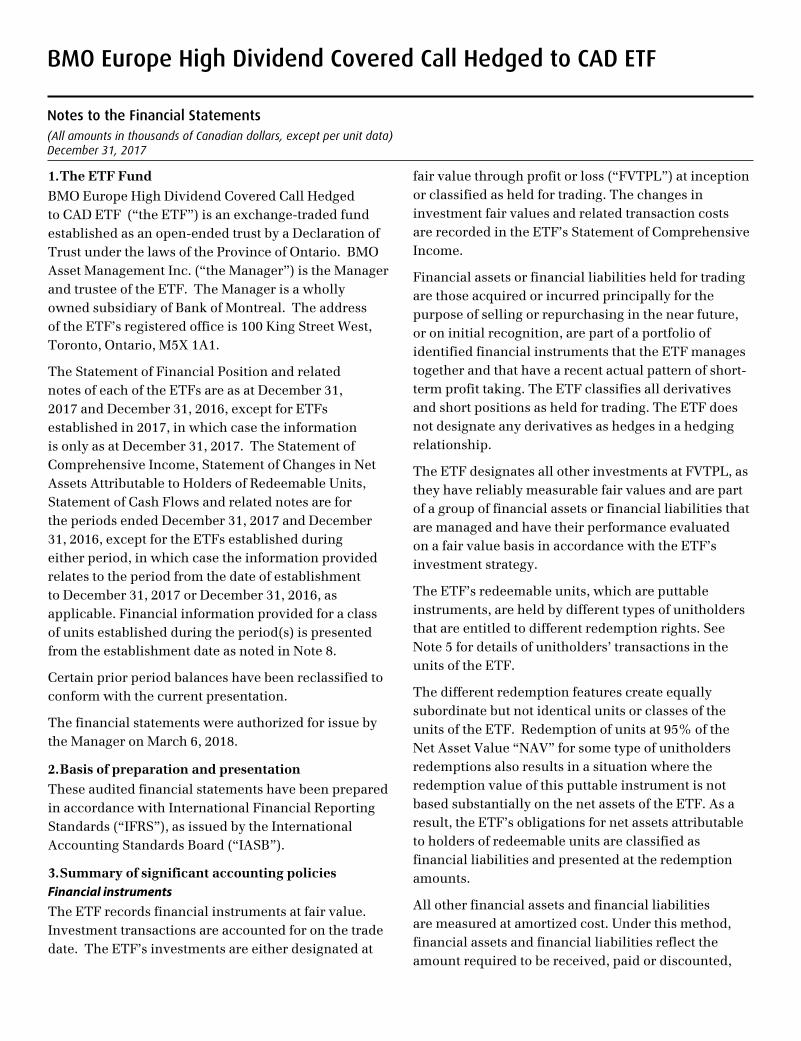
1. The ETF Fund
BMO Europe High Dividend Covered Call Hedged to CAD ETF (“the ETF”) is an exchange-traded fund established as an open-ended trust by a Declaration of Trust under the laws of the Province of Ontario. BMO Asset Management Inc. (“the Manager”) is the Manager and trustee of the ETF. The Manager is a wholly owned subsidiary of Bank of Montreal. The address of the ETF’s registered office is 100 King Street West, Toronto, Ontario, M5X 1A1.
The Statement of Financial Position and related notes of each of the ETFs are as at December 31, 2017 and December 31, 2016, except for ETFs established in 2017, in which case the information is only as at December 31, 2017. The Statement of Comprehensive Income, Statement of Changes in Net Assets Attributable to Holders of Redeemable Units, Statement of Cash Flows and related notes are for the periods ended December 31, 2017 and December 31, 2016, except for the ETFs established during either period, in which case the information provided relates to the period from the date of establishment to December 31, 2017 or December 31, 2016, as applicable. Financial information provided for a class of units established during the period(s) is presented from the establishment date as noted in Note 8.
Certain prior period balances have been reclassified to conform with the current presentation.
The financial statements were authorized for issue by the Manager on March 6, 2018.
2. Basis of preparation and presentation
These audited financial statements have been prepared in accordance with International Financial Reporting Standards (“IFRS”), as issued by the International Accounting Standards Board (“IASB”).
3. Summary of significant accounting policiesFinancial instrumentsThe ETF records financial instruments at fair value. Investment transactions are accounted for on the trade date. The ETF’s investments are either designated at
fair value through profit or loss (“FVTPL”) at inception or classified as held for trading. The changes in investment fair values and related transaction costs are recorded in the ETF’s Statement of Comprehensive Income.
Financial assets or financial liabilities held for trading are those acquired or incurred principally for the purpose of selling or repurchasing in the near future, or on initial recognition, are part of a portfolio of identified financial instruments that the ETF manages together and that have a recent actual pattern of short-term profit taking. The ETF classifies all derivatives and short positions as held for trading. The ETF does not designate any derivatives as hedges in a hedging relationship.
The ETF designates all other investments at FVTPL, as they have reliably measurable fair values and are part of a group of financial assets or financial liabilities that are managed and have their performance evaluated on a fair value basis in accordance with the ETF’s investment strategy.
The ETF’s redeemable units, which are puttable instruments, are held by different types of unitholders that are entitled to different redemption rights. See Note 5 for details of unitholders’ transactions in the units of the ETF.
The different redemption features create equally subordinate but not identical units or classes of the units of the ETF. Redemption of units at 95% of the Net Asset Value “NAV” for some type of unitholders redemptions also results in a situation where the redemption value of this puttable instrument is not based substantially on the net assets of the ETF. As a result, the ETF’s obligations for net assets attributable to holders of redeemable units are classified as financial liabilities and presented at the redemption amounts.
All other financial assets and financial liabilities are measured at amortized cost. Under this method, financial assets and financial liabilities reflect the amount required to be received, paid or discounted,
BMO Europe High Dividend Covered Call Hedged to CAD ETF
Notes to the Financial Statements (cont’d)(All amounts in thousands of Canadian dollars, except per unit data)December 31, 2017
when appropriate, at the contract’s effective interest rate.
The Manager has determined that the ETF meets the definition of “investment entity” and as a result, the ETF measures subsidiaries, if any, at FVTPL.
Cost of investmentsThe cost of investments represents the amount paid for each security and is determined on an average cost basis.
Fair value measurementInvestments are recorded at their fair value with the change between this amount and their average cost being recorded as “Change in unrealized appreciation (depreciation)” in the Statement of Comprehensive Income.
For exchange-traded securities, close prices are considered to be fair value if they fall within the bid-ask spread. In circumstances where the close price is not within the bid-ask spread, the Manager determines the point within the bid-ask spread that is most representative of fair value based on the specific facts and circumstances.
Procedures are in place to fair value securities traded in countries outside of North America daily, to avoid stale prices and to take into account, among other things, any significant events occurring after the close of a foreign market.
For bonds, debentures, asset-backed securities and other debt securities, fair value is represented by mid prices provided by independent security pricing services. Short-term investments, if any, are held at amortized cost which approximates fair value.
For securities where market quotes are not available, unreliable or not considered to reflect the current value, the Manager may determine another value which it considers to be fair and reasonable, or use a valuation technique that, to the extent possible, makes maximum use of inputs and assumptions based on observable market data, including volatility, comparable companies, NAV (for exchange-traded
funds) and other applicable rates or prices. These estimation techniques include discounted cash flows, internal models that utilize observable data or comparisons with other securities that are substantially similar. In limited circumstances, the Manager may use internal models where the inputs are not based on observable market data.
Derivative instrumentsDerivative instruments are financial contracts that derive their value from changes in the underlying interest rates, foreign exchange rates, or other financial or commodity prices or indices.
Derivative instruments are either regulated exchange-traded contracts or negotiated over-the-counter contracts. The ETF may use these instruments for trading purposes, as well as to manage the ETF’s risk exposures.
Derivatives are measured at fair value. Realized gains and losses are included in “Net realized gain (loss) in the Statement of Comprehensive Income and unrealized gains and losses are included in “Change in unrealized appreciation (depreciation)” in the Statement of Comprehensive Income.
Forward currency contracts
A forward currency contract is an agreement between two parties (the ETF and the counterparty) to purchase or sell a currency against another currency at a set price on a future date. The ETF may enter into forward currency contracts for hedging purposes, which can include the economic hedging of all or a portion of the currency exposure of an investment or group of investments, either directly or indirectly. The ETF may also enter into these contracts for non-hedging purposes, which can include increasing the exposure to a foreign currency, or the shifting exposure to foreign currency fluctuations from one country to another. The value of forward currency contracts entered into by the ETF is recorded as the difference between the value of the contract on the Valuation Date (the “Valuation Date” is each day on which the Toronto
BMO Europe High Dividend Covered Call Hedged to CAD ETF
Notes to the Financial Statements (cont’d)(All amounts in thousands of Canadian dollars, except per unit data)December 31, 2017
Stock Exchange is open for trading) and the value on the date the contract originated.
Option contracts
The ETF may engage in option contract transactions by purchasing (long positions) or writing (short positions) call or put option contracts. These contracts have different risk exposures for the ETF, whereas the risk for long positions will be limited to the premium paid to purchase the option contracts, the risk exposure for the short positions is potentially unlimited until closed or expired.
Purchased option contracts
The premium paid for purchasing an option is recorded as an asset in the Statement of Financial Position. The option contract is valued on each Valuation Date at an amount equal to the fair value of the option that would have the effect of closing the position. The change in the difference between the premium and the fair value is shown as “Change in unrealized appreciation (depreciation)” in the Statement of Comprehensive Income.
When a purchased option expires, the ETF will realize a loss equal to the premium paid. When a purchased option is closed, the gain or loss the ETF will realize will be the difference between the proceeds and the premium paid. When a purchased call option is exercised, the premium paid is added to the cost of acquiring the underlying security. When a purchased put option is exercised, the premium paid is subtracted from the proceeds from the sale of the underlying security that had to be sold.
Written option contracts
The premium received from writing a call or put option is recorded as a liability in the Statement of Financial Position.
When a written option expires, the ETF will realize a gain equal to the premium received. When a written option is closed, the ETF will realize a gain or loss equal to the difference between the cost at which the contract was closed and the premium received. When a written call option is exercised, the premium received
is added to the proceeds from the sale of the underlying investments to determine the realized gain or loss. When a written put option is exercised, the premium received is subtracted from the cost of the underlying investment the ETF had purchased.
The gain or loss that the ETF realizes when a purchased or written option is expired or closed is recorded as “Net realized gain (loss)” in the Statement of Comprehensive Income.
Credit default swap contracts
A credit default swap contract is an agreement to transfer credit risk from one party, a buyer of protection, to another party, a seller of protection. The ETF, as a seller of protection, would be required to pay a notional or other agreed upon value to the buyer of protection in the event of a default by a third-party. In return, the ETF would receive from the counterparty a periodic stream of payments over the term of the contract provided that no event of default occurs. If no default occurs, the ETF would keep the stream of payments and would have no payment obligations.
In connection with the agreement, securities or cash may be identified as collateral or margin in accordance with the terms of the agreement to provide assets of value in the event of default or bankruptcy/insolvency.
The ETF, as a buyer of protection, would receive a notional or other agreed upon value from the seller of protection in the event of a default by a third-party. In return, the ETF would be required to pay to the counterparty a periodic stream of payments over the term of the contract provided that no event of default occurs.
Credit default swap contracts are fair valued daily based upon quotations from independent security pricing sources. Premiums paid or received, if any, are included in “Net realized gain (loss)” in the Statement of Comprehensive Income. Net periodic payments are accrued daily and recorded as “Interest income” in the Statement of Comprehensive Income. When credit default swap contracts expire or are closed out, gains
BMO Europe High Dividend Covered Call Hedged to CAD ETF
Notes to the Financial Statements (cont’d)(All amounts in thousands of Canadian dollars, except per unit data)December 31, 2017
or losses are recorded as “Net realized gain (loss)” in the Statement of Comprehensive Income.
Income recognitionDividend income and distribution from investment trusts are recognized on the ex-dividend and ex-distribution date, respectively.
Interest income from interest bearing investments is recognized in the Statement of Comprehensive Income using the effective interest rate method. Interest receivable shown in the Statement of Financial Position is accrued based on the interest bearing investments’ stated rates of interest.
Interest on inflation-indexed bonds is paid based on a principal value, which is adjusted for inflation. The inflation adjustment of the principal value is recognized as part of interest income in the Statement of Comprehensive Income. If held to maturity, the ETF will receive, in addition to a coupon interest payment, a final payment equal to the sum of the par value and the inflation compensation accrued from the original issue date. Interest is accrued on each Valuation Date based on the inflation adjusted par value at that time and is included in “Interest income” in the Statement of Comprehensive Income.
Foreign currency translationThe fair value of investments and other assets and liabilities in foreign currencies are translated into the ETF’s functional currency at the rates of exchange prevailing at the period-end date. Purchases and sales of investments, and income and expenses are translated at the rates of exchange prevailing on the respective dates of such transactions. Foreign exchange gains (losses) on completed transactions are included in “Net realized gain (loss)” in the Statement of Comprehensive Income and unrealized foreign exchange gains (losses) are included in “Change in unrealized appreciation (depreciation)” in the Statement of Comprehensive Income. Foreign exchange gains (losses) relating to cash, receivables and payables are included in "Foreign exchange gain (loss)” in the Statement of Comprehensive Income.
Securities lendingAn ETF may engage in securities lending pursuant to the terms of an agreement with BNY Mellon (the “securities lending agent”). The aggregate market value of all securities on loan by an ETF cannot exceed 50% of the NAV of the ETF. An ETF will receive collateral of at least 102% of the value of the securities on loan. Collateral will generally be comprised of obligations of or guarantee by the Government of Canada or a province thereof, or by the United States government or its agencies, but may include obligations of other governments with appropriate credit ratings. Further, the program entered into provides for 100% indemnification by the securities lending agent and parties related to the ETF’s custodian, to the ETF for any defaults by borrowers.
For those ETFs participating in the program, aggregate values of securities on loan and the collateral held as at December 31, 2017 and December 31, 2016 and information about the security lending income earned by the ETF are disclosed in Note 8.
Income from securities lending, where applicable, is included in the Statement of Comprehensive Income and is recognized when earned. The breakdown of the securities lending income is disclosed in Note 8, where applicable.
CashCash is comprised of cash and deposits with banks which include bankers’ acceptances and overnight demand deposits. Cash is recorded at fair value. The carrying amount of cash approximates its fair value because it is short-term in nature.
Other assets and other liabilitiesReceivable from investments sold, dividends receivable, distribution receivable from investment trusts, and subscriptions receivable, are initially recorded at fair value and subsequently measured at amortized cost. Similarly, payable for investments purchased, redemptions payable, distributions payable and accrued expenses are measured at amortized cost.
BMO Europe High Dividend Covered Call Hedged to CAD ETF
Notes to the Financial Statements (cont’d)(All amounts in thousands of Canadian dollars, except per unit data)December 31, 2017
Other assets and liabilities are short-term in nature, and are carried at cost or amortized cost.
Increase or decrease in net assets attributable to holders of redeemable units“Increase (decrease) in net assets attributable to holders of redeemable units per unit” of a class in the Statement of Comprehensive Income represents the increase (decrease) in net assets attributable to holders of redeemable units (“Net Assets”) of the class divided by the weighted average number of units of the class outstanding during the period.
TaxationThe ETF qualifies as a mutual fund trust under the provisions of the Income Tax Act (Canada). Distributions of all net taxable income and sufficient amounts of net realized capital gains for each taxation year will be paid to unitholders so that the ETF will not be subject to income tax. As a result, the ETF has determined that it is in substance not taxable and therefore does not record income taxes in the Statement of Comprehensive Income nor does it recognize any deferred tax assets or liabilities in the Statement of Financial Position.
The ETF may incur withholding taxes imposed by certain countries on investment income and capital gains. Such income and gains are recorded on a gross basis with the related withholding taxes shown as a separate expense in the Statement of Comprehensive Income.
Investments in subsidiaries, joint ventures and associatesSubsidiaries are entities over which the ETF has control through its exposure or rights to variable returns from its investment and has the ability to affect those returns through its power over the entity. The Manager has determined that the ETF is an investment entity and as such, it accounts for subsidiaries, if any, at fair value. Joint ventures are those where the ETF exercises joint control through an agreement with other shareholders, and associates are investments in which the ETF exerts significant influence over operating, investing, and financing decisions (such as
entities in which the ETF owns 20% - 50% of voting shares), all of which, if any, have been designated at FVTPL.
Unconsolidated structured entitiesDuring the periods, the ETF had no sponsored unconsolidated structured entities. The Manager has determined that the underlying funds in which the ETF may invest are unconsolidated structured entities. This determination is based on the fact that decision making about the underlying funds is not governed by the voting right or other similar right held by the ETF. Similarly, investments in securitizations, asset-backed securities and mortgage-backed securities are determined to be interests in unconsolidated structured entities.
The ETF may invest in underlying funds whose investment objectives range from achieving short-term to long-term income and capital growth potential. Underlying funds may use leverage in a manner consistent with their respective investment objectives and as permitted by Canadian securities regulatory authorities. Underlying funds finance their operations by issuing redeemable units which are puttable at the holders’ option and entitles the holder to a proportionate stake in the respective fund’s Net Assets. The change in fair value of each of the underlying funds during the periods is included in “Change in unrealized appreciation (depreciation)” in the Statement of Comprehensive Income.
Mortgage-related securities are created from pools of residential or commercial mortgage loans, including mortgage loans made by savings and loan institutions, mortgage bankers, commercial banks and others. Asset-backed securities are created from many types of assets, including auto loans, credit card receivables, home equity loans, and student loans.
The ETF does not provide and has not committed to providing any additional significant financial or other support to the unconsolidated structured entities other than its investment in the unconsolidated structured entities.
BMO Europe High Dividend Covered Call Hedged to CAD ETF
Notes to the Financial Statements (cont’d)(All amounts in thousands of Canadian dollars, except per unit data)December 31, 2017
Additional information on the ETF’s interest in unconsolidated structured entities, where applicable, is provided in Note 8.
Offsetting of financial assets and financial liabilities Financial instruments are presented at net or gross amounts on the Statement of Financial Position depending on the existence of intention and legal right to offset opposite positions of such instruments held with the same counterparties. Amounts offset in the Statement of Financial Position are transactions for which the ETF has legally enforceable rights to offset and intends to settle the positions on a net basis. Amounts not offset in the Statement of Financial Position relate to transactions where a master netting arrangement or similar agreement is in place with a right to offset only in the event of default, insolvency or bankruptcy, or where the ETF has no intention of settling on a net basis.
Accounting standards issued but not yet adoptedIn July 2014, the IASB issued the final version of IFRS 9 Financial Instruments, which addresses classification and measurement, impairment and hedge accounting.
The new standard requires assets to be carried at amortized cost, FVTPL or fair value through other comprehensive income based on the entity’s business model for managing financial assets and the contractual cash flow characteristics of the financial asset. The classification and measurement of liabilities remains generally unchanged with the exception of liabilities recorded at FVTPL. For these liabilities, fair value changes attributable to changes in the entity’s own credit risk are to be presented in other comprehensive income unless they affect amounts recorded in income.
The new standard is effective for the ETF for its fiscal year beginning January 1, 2018. The ETF’s financial assets and financial liabilities are managed, and the performance of the ETF is evaluated on a fair value basis. Accordingly, the Manager has reached the preliminary conclusion that Fair Value Through Profit and Loss (FVTPL) in accordance with IFRS 9 provides
the most appropriate measurement and presentation of the ETF’s financial assets and financial liabilities, which aligns with its current measurement and presentation, with little or no modification. Therefore, the Manager does not anticipate changes from the ETF’s current measurement of its financial assets and financial liabilities at FVTPL. There will be no significant impact on the ETF’s financial statements.
The Manager will continue to evaluate any further industry and or regulatory updates with respect to the implementation of this new standard.
4. Critical accounting judgements and estimates
The preparation of financial statements requires the use of judgement in applying the ETF’s accounting policies and to make estimates and assumptions about the future. The following discusses the most significant accounting judgements and estimates that the ETF has made in preparing its financial statements:
Accounting judgements:Functional and presentation currencyThe ETF’s unitholders are mainly Canadian residents, with the subscriptions and redemptions of the redeemable units denominated in Canadian dollars. The ETF invests in Canadian and U.S. dollars and other foreign denominated securities, as applicable. The performance of the ETF is measured and reported to the investors in Canadian dollars. The Manager considers the Canadian dollar as the currency that most faithfully represents the economic effects of the underlying transactions, events and conditions. The financial statements are presented in Canadian dollars, which is the ETF's functional and presentation currency.
Classification and measurement of financial instruments and application of fair value optionIn classifying and measuring financial instruments held by the ETF, the Manager is required to make significant judgements about whether or not the business of the ETF is to invest on a total return basis for the purpose of applying the fair value options for financial assets.
BMO Europe High Dividend Covered Call Hedged to CAD ETF
Notes to the Financial Statements (cont’d)(All amounts in thousands of Canadian dollars, except per unit data)December 31, 2017
Accounting estimates:Fair value measurement of securities not quoted in an active marketThe ETF has established policies and control procedures that are intended to ensure these estimates are well controlled, independently reviewed, and consistently applied from period to period. The estimates of the value of the ETF’s assets and liabilities are believed to be appropriate as at the reporting date.
The ETF may hold financial instruments that are not quoted in active markets. Note 3 discusses the policies used by the ETF for the estimates used in determining fair value.
5. Units and unit transactions
The redeemable units of the ETF are classified as liabilities.
The units have no par value and are entitled to distributions, if any. Upon redemption, a unit is entitled to a proportionate share of the ETF’s NAV. The ETF is required to pay distributions in an amount not less than the amount necessary to ensure the ETF will not be liable for income taxes on realized capital gains, dividends and interest. The ETF has no restrictions or specific capital requirements on the subscriptions and redemptions of units except as disclosed in Note 8. The relevant movements in redeemable units are shown in the Statement of Changes in Net Assets Attributable to Holders of Redeemable Units.
In accordance with its investment objectives and strategies, and the risk management practices outlined in Note 7, the ETF endeavours to invest the subscriptions received in appropriate investments, while maintaining sufficient liquidity to meet redemptions, with such liquidity being augmented by short-term borrowings or disposal of investments where necessary.
The ETF is authorized to issue an unlimited number of units of each class. On any trading day, a designated broker or underwriter may place a subscription or redemption order for an integral multiple of the
prescribed number of units of the ETF. A trading day is each day on which the TSX is opened for business.
If the subscription or redemption order is accepted, the ETF will issue or redeem units to/from the designated broker or underwriter by no later than the second trading day after the date on which the subscription or redemption order is accepted. For each prescribed number of units issued or redeemed, a designated broker or underwriter must deliver or receive payment consisting of:
• A basket of applicable securities and cash in an amount sufficient so that the value of the securities, and the cash received is equal to the NAV of the units redeemed; or
• Cash in the amount equal to the NAV of the units redeemed.
On any trading day, unitholders may redeem units for cash or exchange units for baskets of securities and cash. Units redeemed for cash will be redeemed at a redemption price per unit equal to 95% of the closing price for the units on the TSX on the effective day of the redemption. Units exchanged for baskets of securities will be exchanged at a price equal to the NAV of the units on the effective date of the exchange request, payable by delivery of baskets of securities and cash. The units will be redeemed in the exchange.
Unitholders that redeem units prior to the distribution record date will not be entitled to receive the distribution.
Capital gains redemption in-kind:Capital gains redemption in-kind is the amount allocated to redeeming unitholders from capital gains distributions payable to unitholders at the end of the year. This amount is shown on the Statement of Changes in Net Assets Attributable to Holders of Redeemable Units. For comparative purposes, the related prior year amounts have been revised to conform to current year presentation from “Net realized gains on investments and derivatives” to “Capital gains redemption in-kind” in the Statement of Changes in Net Assets Attributable to Holders of Redeemable Units.
BMO Europe High Dividend Covered Call Hedged to CAD ETF
Notes to the Financial Statements (cont’d)(All amounts in thousands of Canadian dollars, except per unit data)December 31, 2017
The NAV per unit of a class for the purposes of subscription or redemption is computed by dividing the NAV of the ETF (that is, the total fair value of the assets attributable to the class of the ETF less the liabilities attributable to the class) by the total number of units of the class of the ETF outstanding at such time on each Valuation Day, in accordance with Part 14 National Instrument (“NI”) 81-106 Investment Fund Continuous Disclosure for the purpose of processing unitholder transactions. Net Assets are determined in accordance with IFRS and may differ from the ETF’s NAV. Where an ETF’s NAV is not equal to its Net Assets, a reconciliation is shown in Note 8.
6. Related party transactions(a) Management fees
The Manager is responsible for all other costs and expenses of the ETF, including the fees payable to the Custodian, Registrar and Transfer Agent and Plan Agent fees payable to other service providers, including the index providers retained by the Manager.
The ETF will pay the Manager a management fee as disclosed in Note 8 based on the NAV of the class of the ETF. The management fee, plus applicable taxes, will be accrued daily and paid quarterly in arrears. The Manager may, from time to time in its discretion, waive a portion of the management fee charged at any given time.
The Manager may agree to charge a reduced management fee it otherwise would be entitled to receive from the ETF with respect to investments in the ETF by certain unitholders. An amount equal to the difference between the fee otherwise chargeable and the reduced fee of the ETF will be distributed in cash to those unitholders as Management Fee Distributions.
(b) Other related party transactions
All expenses are recognized in the Statement of Comprehensive Income on the accrual basis.
The ETF is responsible for the costs and expenses incurred in complying with National Instruments 81-107 (including any expenses related to the implementation and on-going operation of an Independent Review Committee), brokerage expenses and commissions, income and withholding taxes as well as other applicable taxes, the costs of complying with any new governmental or regulatory requirement introduced after the date the ETF was established and extraordinary expenses.
From time to time, the Manager may on behalf of the ETF enter into transactions or arrangements with or involving subsidiaries and affiliates of Bank of Montreal, or certain other persons or companies that are related or connected to the Manager of the ETF. These transactions or arrangements may include transactions or arrangements with or involving subsidiaries and affiliates of Bank of Montreal, BMO Asset Management Corp., BMO Asset Management Inc., BMO Nesbitt Burns Inc., BMO Private Investment Counsel Inc., BMO InvestorLine Inc., BMO Investments Inc., or other investment funds offered by Bank of Montreal and may involve the purchase or sale of portfolio securities through or from a subsidiary or affiliates of Bank of Montreal, the purchase or sale of securities issued or guaranteed by a subsidiary or affiliates of Bank of Montreal, entering into forward contracts with a subsidiary or affiliates of Bank of Montreal acting as counterparty, the purchase or redemption of units of other Bank of Montreal affiliated investment funds or the provision of services to the Manager.
BMO Nesbitt Burns Inc. is one of the designated brokers that have entered into an underwriting agreement with the Manager. As a Designated Broker, under the underwriting agreement, BMO Nesbitt Burns Inc. may subscribe for and or be issued units of the ETF by the Manager from time to time.
BMO Europe High Dividend Covered Call Hedged to CAD ETF
Notes to the Financial Statements (cont’d)(All amounts in thousands of Canadian dollars, except per unit data)December 31, 2017
7. Financial instruments risks
The ETF’s activities expose it to a variety of risks associated with the financial instruments, as follows: market risk (including currency risk, interest rate risk and other market risk), credit risk and liquidity risk. The concentration table groups securities by asset type, geographic location and/or market segment. The ETF’s risk management practice focuses on processes and strategies to minimize the tracking error between the ETF’s performance and the performance of its relevant index.
(a) Currency risk
Currency risk is the risk that the value of financial instruments denominated in currencies, other than the functional currency of the ETF, will fluctuate due to changes in foreign exchange rates. Investments in foreign markets are exposed to currency risk as the prices denominated in foreign currencies are converted to the ETF’s functional currency in determining fair value. The ETF may enter into forward currency contracts for hedging purposes to reduce foreign currency exposure. The ETF’s exposure to currency risk, if any, is further disclosed in Note 8.
(b) Interest rate risk
Interest rate risk is the risk that the fair value of the ETF's interest bearing investments will fluctuate due to changes in market interest rates. The ETF's exposure to interest rate risk is concentrated in its investment in debt securities (such as bonds, money market investments, short-term investments and debentures) and interest rate derivative instruments, if any. Other assets and liabilities are short-term in nature and/or non-interest bearing. The ETF's exposure to interest rate risk, if any, is further discussed in Note 8.
(c) Other market risk
Other market risk is the risk that the fair value of a financial instrument will fluctuate as a result of changes in market prices (other than those arising from interest rate risk or currency risk), whether those changes are caused by factors specific to the individual financial instrument or its issuer, or factors
affecting all similar financial instruments traded in a market or market segment. The Manager moderates this risk through the use of investment strategies that seek to minimize the ETF’s tracking error versus a market index, within the parameters of the investment strategy. The maximum risk resulting from financial instruments is equivalent to its fair value.
The Manager monitors the ETF’s overall market positions on a daily basis and positions are maintained within established ranges. Other assets and liabilities are monetary items that are short-term in nature, and as such they are not subject to other market risk. The ETF's exposure to other market risk, if any, is further discussed in Note 8.
(d) Credit risk
Credit risk is the risk that a loss could arise from a security issuer or counterparty to a financial instrument not being able to meet its financial obligations. The fair value of debt securities includes consideration of the credit worthiness of the debt issuer. Credit risk exposure for over-the-counter derivative instruments is based on the ETF's unrealized gain of the contractual obligations with the counterparty as at the reporting date. The credit exposure of other assets is represented by its carrying amount. The ETF's exposure to credit risk, if any, is further discussed in Note 8.
The ETF may enter into securities lending transactions with approved counterparties. Credit risk associated with these transactions is considered minimal as all counterparties have a sufficient approved credit rating and the market value of collateral held by the ETF must be at least 102% of the fair value of securities loaned, if any, as disclosed in Note 8.
(e) Liquidity risk
The ETF's exposure to liquidity risk is concentrated in the daily redemptions of units. Since the settlement of redemptions is primarily by delivery of securities, the ETF is not exposed to any significant liquidity risk. The ETF primarily invests in securities that are traded in active markets and can be readily disposed.
BMO Europe High Dividend Covered Call Hedged to CAD ETF
Notes to the Financial Statements (cont’d)(All amounts in thousands of Canadian dollars, except per unit data)December 31, 2017
In addition, the ETF retains sufficient cash and cash equivalent positions to maintain liquidity. The ETF may, from time to time, enter into over-the-counter derivative contracts or invest in unlisted securities, which are not traded in an organized market and may be illiquid. Securities for which market quotation could not be obtained and may be illiquid are identified on the Schedule of Investment Portfolio. The proportion of illiquid securities to the NAV of the ETF is monitored by the Manager to ensure it does not exceed the regulatory limit and does not significantly affect the liquidity required to meet the ETF's financial obligations.
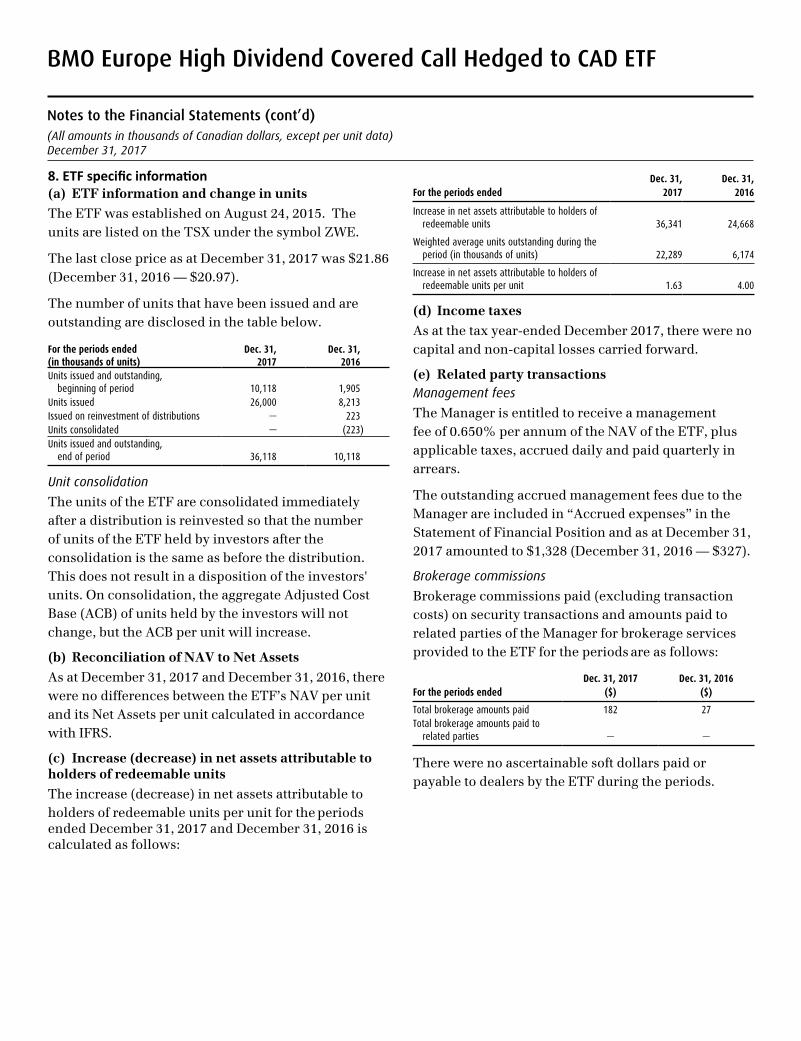
BMO Europe High Dividend Covered Call Hedged to CAD ETF
Notes to the Financial Statements (cont’d)(All amounts in thousands of Canadian dollars, except per unit data)December 31, 2017
8. ETF specific information(a) ETF information and change in units
The ETF was established on August 24, 2015. The units are listed on the TSX under the symbol ZWE.
The last close price as at December 31, 2017 was $21.86 (December 31, 2016 — $20.97).
The number of units that have been issued and are outstanding are disclosed in the table below.
For the periods ended (in thousands of units)
Dec. 31, 2017
Dec. 31, 2016
Units issued and outstanding, beginning of period 10,118 1,905
Units issued 26,000 8,213Issued on reinvestment of distributions — 223Units consolidated — (223)Units issued and outstanding,
end of period 36,118 10,118
Unit consolidation
The units of the ETF are consolidated immediately after a distribution is reinvested so that the number of units of the ETF held by investors after the consolidation is the same as before the distribution. This does not result in a disposition of the investors' units. On consolidation, the aggregate Adjusted Cost Base (ACB) of units held by the investors will not change, but the ACB per unit will increase.
(b) Reconciliation of NAV to Net Assets
As at December 31, 2017 and December 31, 2016, there were no differences between the ETF’s NAV per unit and its Net Assets per unit calculated in accordance with IFRS.
(c) Increase (decrease) in net assets attributable to holders of redeemable units
The increase (decrease) in net assets attributable to holders of redeemable units per unit for the periods ended December 31, 2017 and December 31, 2016 is calculated as follows:
Dec. 31, Dec. 31,For the periods ended 2017 2016
Increase in net assets attributable to holders of redeemable units 36,341 24,668
Weighted average units outstanding during the period (in thousands of units) 22,289 6,174
Increase in net assets attributable to holders of redeemable units per unit 1.63 4.00
(d) Income taxes
As at the tax year-ended December 2017, there were no capital and non-capital losses carried forward.
(e) Related party transactionsManagement fees
The Manager is entitled to receive a management fee of 0.650% per annum of the NAV of the ETF, plus applicable taxes, accrued daily and paid quarterly in arrears.
The outstanding accrued management fees due to the Manager are included in “Accrued expenses” in the Statement of Financial Position and as at December 31, 2017 amounted to $1,328 (December 31, 2016 — $327).
Brokerage commissions
Brokerage commissions paid (excluding transaction costs) on security transactions and amounts paid to related parties of the Manager for brokerage services provided to the ETF for the periods are as follows:
Dec. 31, 2017 Dec. 31, 2016For the periods ended ($) ($)
Total brokerage amounts paid 182 27Total brokerage amounts paid to
related parties — —
There were no ascertainable soft dollars paid or payable to dealers by the ETF during the periods.
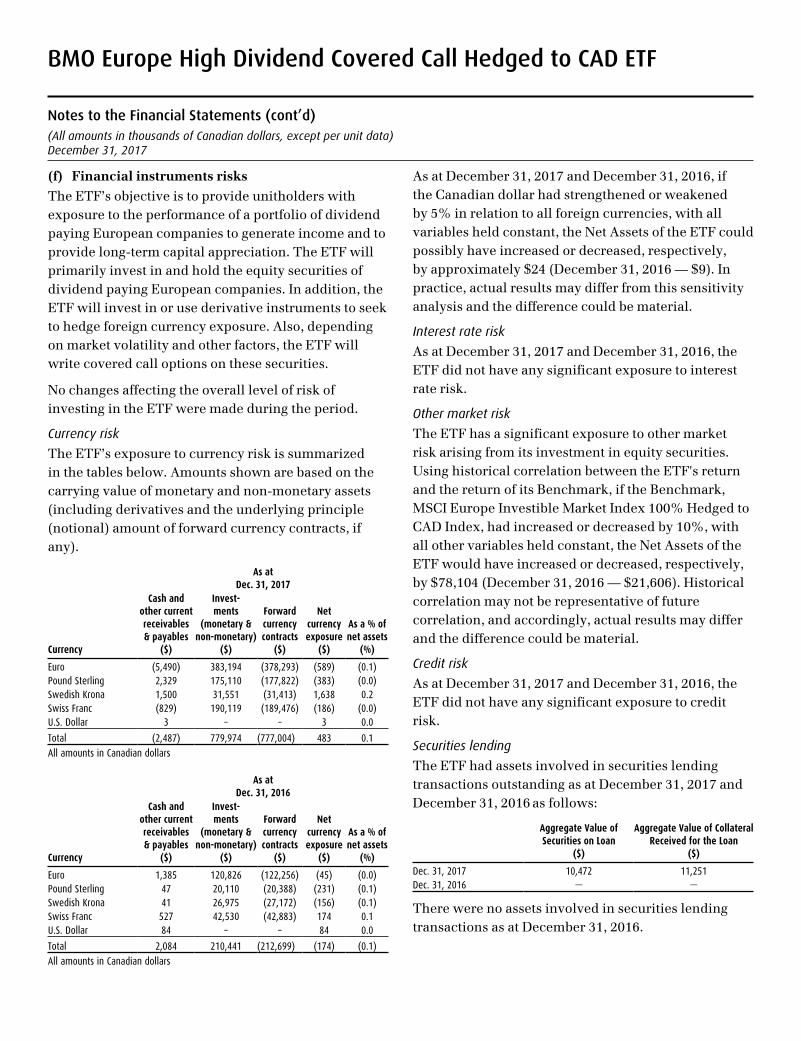
BMO Europe High Dividend Covered Call Hedged to CAD ETF
Notes to the Financial Statements (cont’d)(All amounts in thousands of Canadian dollars, except per unit data)December 31, 2017
(f) Financial instruments risks
The ETF’s objective is to provide unitholders with exposure to the performance of a portfolio of dividend paying European companies to generate income and to provide long-term capital appreciation. The ETF will primarily invest in and hold the equity securities of dividend paying European companies. In addition, the ETF will invest in or use derivative instruments to seek to hedge foreign currency exposure. Also, depending on market volatility and other factors, the ETF will write covered call options on these securities.
No changes affecting the overall level of risk of investing in the ETF were made during the period.
Currency risk
The ETF’s exposure to currency risk is summarized in the tables below. Amounts shown are based on the carrying value of monetary and non-monetary assets (including derivatives and the underlying principle (notional) amount of forward currency contracts, if any).
As at Dec. 31, 2017
Currency
Cash and other current receivables & payables
($)
Invest- ments
(monetary & non-monetary)
($)
Forward currency contracts
($)
Net currency exposure
($)
As a % of net assets
(%)
Euro (5,490) 383,194 (378,293) (589) (0.1)Pound Sterling 2,329 175,110 (177,822) (383) (0.0)Swedish Krona 1,500 31,551 (31,413) 1,638 0.2Swiss Franc (829) 190,119 (189,476) (186) (0.0)U.S. Dollar 3 – – 3 0.0
Total (2,487) 779,974 (777,004) 483 0.1
All amounts in Canadian dollars
As at Dec. 31, 2016
Currency
Cash and other current receivables & payables
($)
Invest- ments
(monetary & non-monetary)
($)
Forward currency contracts
($)
Net currency exposure
($)
As a % of net assets
(%)
Euro 1,385 120,826 (122,256) (45) (0.0)Pound Sterling 47 20,110 (20,388) (231) (0.1)Swedish Krona 41 26,975 (27,172) (156) (0.1)Swiss Franc 527 42,530 (42,883) 174 0.1U.S. Dollar 84 – – 84 0.0
Total 2,084 210,441 (212,699) (174) (0.1)
All amounts in Canadian dollars
As at December 31, 2017 and December 31, 2016, if the Canadian dollar had strengthened or weakened by 5% in relation to all foreign currencies, with all variables held constant, the Net Assets of the ETF could possibly have increased or decreased, respectively, by approximately $24 (December 31, 2016 — $9). In practice, actual results may differ from this sensitivity analysis and the difference could be material.
Interest rate risk
As at December 31, 2017 and December 31, 2016, the ETF did not have any significant exposure to interest rate risk.
Other market risk
The ETF has a significant exposure to other market risk arising from its investment in equity securities. Using historical correlation between the ETF's return and the return of its Benchmark, if the Benchmark, MSCI Europe Investible Market Index 100% Hedged to CAD Index, had increased or decreased by 10%, with all other variables held constant, the Net Assets of the ETF would have increased or decreased, respectively, by $78,104 (December 31, 2016 — $21,606). Historical correlation may not be representative of future correlation, and accordingly, actual results may differ and the difference could be material.
Credit risk
As at December 31, 2017 and December 31, 2016, the ETF did not have any significant exposure to credit risk.
Securities lending
The ETF had assets involved in securities lending transactions outstanding as at December 31, 2017 and December 31, 2016 as follows:
Aggregate Value of Securities on Loan
($)
Aggregate Value of Collateral Received for the Loan
($)
Dec. 31, 2017 10,472 11,251Dec. 31, 2016 — —
There were no assets involved in securities lending transactions as at December 31, 2016.
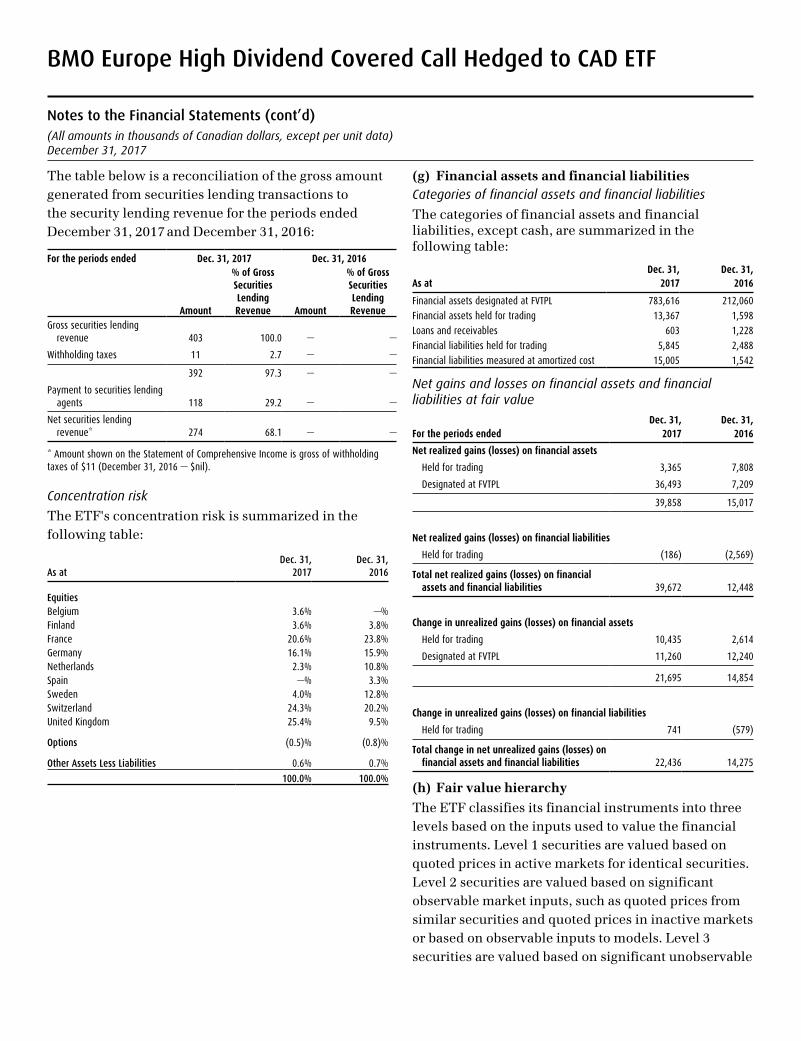
BMO Europe High Dividend Covered Call Hedged to CAD ETF
Notes to the Financial Statements (cont’d)(All amounts in thousands of Canadian dollars, except per unit data)December 31, 2017
The table below is a reconciliation of the gross amount generated from securities lending transactions to the security lending revenue for the periods ended December 31, 2017 and December 31, 2016:
For the periods ended Dec. 31, 2017 Dec. 31, 2016
Amount
% of Gross Securities Lending Revenue Amount
% of Gross Securities Lending Revenue
Gross securities lending revenue 403 100.0 — —
Withholding taxes 11 2.7 — —
392 97.3 — —
Payment to securities lending agents 118 29.2 — —
Net securities lending revenue* 274 68.1 — —
* Amount shown on the Statement of Comprehensive Income is gross of withholding taxes of $11 (December 31, 2016 — $nil).
Concentration risk
The ETF's concentration risk is summarized in the following table:
As atDec. 31,
2017Dec. 31,
2016
EquitiesBelgium 3.6% —%Finland 3.6% 3.8%France 20.6% 23.8%Germany 16.1% 15.9%Netherlands 2.3% 10.8%Spain —% 3.3%Sweden 4.0% 12.8%Switzerland 24.3% 20.2%United Kingdom 25.4% 9.5%
Options (0.5)% (0.8)%
Other Assets Less Liabilities 0.6% 0.7%
100.0% 100.0%
(g) Financial assets and financial liabilitiesCategories of financial assets and financial liabilities
The categories of financial assets and financial liabilities, except cash, are summarized in the following table:
Dec. 31, Dec. 31,As at 2017 2016
Financial assets designated at FVTPL 783,616 212,060
Financial assets held for trading 13,367 1,598
Loans and receivables 603 1,228
Financial liabilities held for trading 5,845 2,488
Financial liabilities measured at amortized cost 15,005 1,542
Net gains and losses on financial assets and financial liabilities at fair value
Dec. 31, Dec. 31,For the periods ended 2017 2016
Net realized gains (losses) on financial assets
Held for trading 3,365 7,808
Designated at FVTPL 36,493 7,209
39,858 15,017
Net realized gains (losses) on financial liabilities
Held for trading (186) (2,569)
Total net realized gains (losses) on financial assets and financial liabilities 39,672 12,448
Change in unrealized gains (losses) on financial assets
Held for trading 10,435 2,614
Designated at FVTPL 11,260 12,240
21,695 14,854
Change in unrealized gains (losses) on financial liabilities
Held for trading 741 (579)
Total change in net unrealized gains (losses) on financial assets and financial liabilities 22,436 14,275
(h) Fair value hierarchy
The ETF classifies its financial instruments into three levels based on the inputs used to value the financial instruments. Level 1 securities are valued based on quoted prices in active markets for identical securities. Level 2 securities are valued based on significant observable market inputs, such as quoted prices from similar securities and quoted prices in inactive markets or based on observable inputs to models. Level 3 securities are valued based on significant unobservable
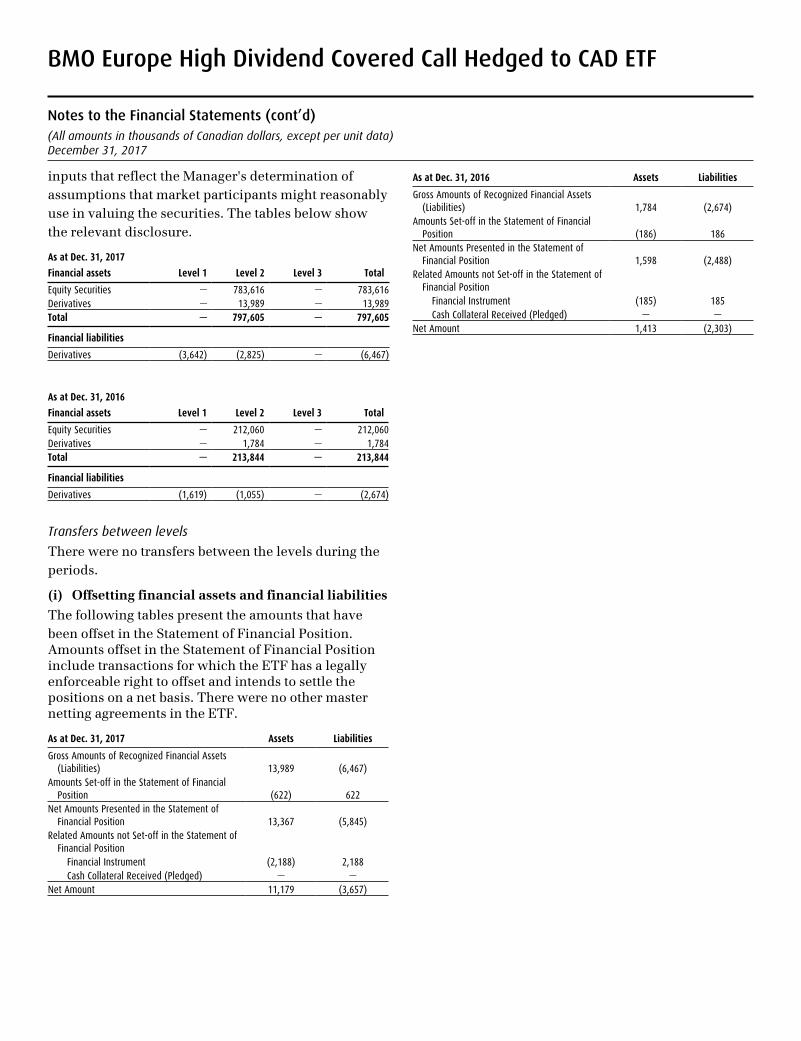
BMO Europe High Dividend Covered Call Hedged to CAD ETF
Notes to the Financial Statements (cont’d)(All amounts in thousands of Canadian dollars, except per unit data)December 31, 2017
inputs that reflect the Manager's determination of assumptions that market participants might reasonably use in valuing the securities. The tables below show the relevant disclosure.
As at Dec. 31, 2017
Financial assets Level 1 Level 2 Level 3 Total
Equity Securities — 783,616 — 783,616Derivatives — 13,989 — 13,989Total — 797,605 — 797,605
Financial liabilities
Derivatives (3,642) (2,825) — (6,467)
As at Dec. 31, 2016
Financial assets Level 1 Level 2 Level 3 Total
Equity Securities — 212,060 — 212,060Derivatives — 1,784 — 1,784Total — 213,844 — 213,844
Financial liabilities
Derivatives (1,619) (1,055) — (2,674)
Transfers between levels
There were no transfers between the levels during the periods.
(i) Offsetting financial assets and financial liabilities
The following tables present the amounts that have been offset in the Statement of Financial Position. Amounts offset in the Statement of Financial Position include transactions for which the ETF has a legally enforceable right to offset and intends to settle the positions on a net basis. There were no other master netting agreements in the ETF.
As at Dec. 31, 2017 Assets Liabilities
Gross Amounts of Recognized Financial Assets (Liabilities) 13,989 (6,467)
Amounts Set-off in the Statement of Financial Position (622) 622
Net Amounts Presented in the Statement of Financial Position 13,367 (5,845)
Related Amounts not Set-off in the Statement of Financial Position
Financial Instrument (2,188) 2,188Cash Collateral Received (Pledged) — —
Net Amount 11,179 (3,657)
As at Dec. 31, 2016 Assets Liabilities
Gross Amounts of Recognized Financial Assets (Liabilities) 1,784 (2,674)
Amounts Set-off in the Statement of Financial Position (186) 186
Net Amounts Presented in the Statement of Financial Position 1,598 (2,488)
Related Amounts not Set-off in the Statement of Financial Position
Financial Instrument (185) 185Cash Collateral Received (Pledged) — —
Net Amount 1,413 (2,303)
Management’s Responsibility for Financial Reporting
The accompanying financial statements have been prepared by management of BMO Asset Management Inc. Management is responsible for the information and representations contained in these financial statements.
BMO Asset Management Inc. has maintained appropriate processes to ensure that relevant and reliable financial information is produced. The financial statements have been prepared in accordance with International Financial Reporting Standards (IFRS) as issued by the International Accounting Standards Board (IASB) and include certain amounts that are based on estimates and judgements. The significant accounting policies which management believes are appropriate for the ETFs are described in note 3 to the financial statements.
The Board of Directors is responsible for reviewing and approving the financial statements and overseeing management’s per-formance of its financial reporting responsibilities.
PricewaterhouseCoopers LLP is the external auditor of the ETFs. The auditor has been appointed by the Board and cannot be changed without the prior approval of the Independent Review Committee and 60 days notice to the unitholders. They have au-dited the financial statements in accordance with generally accepted auditing standards in Canada to enable them to express to the unitholders their opinion on the financial statements. Their report is included as an integral part of the financial statements.
Kevin Gopaul,Head, BMO Global Asset Management CanadaBMO Asset Management Inc.
Robert J. Schauer,Chief Financial Officer BMO Exchange Traded Funds
March 6, 2018
BMO (M-bar roundel symbol) is a registered trademark of Bank of Montreal, used under license.
BMO ETFs are managed and administered by BMO Asset Management Inc., an investment fund manager and portfolio manager and separate legal entity from Bank of Montreal.
www.bmo.com/etflegalFor more information please call 1-800-361-1392
BMO Asset Management Inc.First Canadian Place, 43rd Floor100 King Street West Toronto, Ontario M5X 1A1
Independent AuditorPricewaterhouseCoopers LLPPwC Tower18 York Street, Suite 2600Toronto, Ontario M5J 0B2