Sylvie Matherat Director, Financial Stability Bank of France

NOVEMBER
2015
ANNUAL FINANCIAL STABILITY REPORT
June 2014 – June 2015
National Bank of Rwanda

NATIONAL BANK OF RWANDA
FINANCIAL STABILITY REPORT
JUNE 2015
i
TABLE OF CONTENTS
TABLE OF CONTENTS ............................................................................................................................. i
LIST OF FIGURES .................................................................................................................................. iii
LIST OF TABLES .................................................................................................................................... iv
ACRONYMS ............................................................................................................................................. v
FOREWORD ............................................................................................................................................. i
I. Global Economic and Financial Development .................................................................................. 1
II. Regional Economic and Financial Sector Development: Sub-Saharan Africa (SSA) and East
African Community ........................................................................................................................... 4
2.1. Macroeconomic Performance in SSA ............................................................................................... 4
2.2. Macroeconomic Performance in EAC ............................................................................................... 4
2.3. Financial Sector Performance in the EAC ........................................................................................ 6
III. Domestic Macroeconomic Environment ........................................................................................... 8
IV. Domestic Financial Sector Development ........................................................................................ 10
4.1. Rwanda’s Financial Sector Landscape ........................................................................................... 10
4.2. Performance of the Rwandan Banking System .............................................................................. 11
Capital Position of Banks ................................................................................................................ 12
Banks’ Lending Development ......................................................................................................... 13
Banks’ Sectoral Lending ................................................................................................................. 14
Banking System Asset Quality ........................................................................................................ 16
Development of Asset Quality by Sector ........................................................................................ 17
Banks’ Funding Condition ............................................................................................................... 18
Banks’s Liquidity Condition ............................................................................................................. 19
Exposure to exchange rate risk ...................................................................................................... 19
Earning and profitability .................................................................................................................. 20
How resilient is the Rwandan Banking System? ............................................................................. 21
Stress testing results ...................................................................................................................... 21
4.3. Performance of the Microfinance Sector ......................................................................................... 23
Capital position of MFIs .................................................................................................................. 23

NATIONAL BANK OF RWANDA
FINANCIAL STABILITY REPORT
JUNE 2015
ii
MFIs Asset quality .......................................................................................................................... 24
MFIs Earning and Profitability ......................................................................................................... 24
MFI Funding and liquidity ................................................................................................................ 24
4.4. Performance indicators in Non-Bank Financial institutions ............................................................. 25
Insurance market development ...................................................................................................... 25
Capital position of Insurance Sub-sector ........................................................................................ 26
Asset quality of Insurers ................................................................................................................. 27
Reinsurance and actuarial liabilities ............................................................................................... 28
Earning and profitability of Insurers ................................................................................................ 29
Insurance Industry liquidity ............................................................................................................. 30
Performance indicators in Pension funds ....................................................................................... 30
4.5. Financial System Infrastructure and Development ......................................................................... 31
Payment system ............................................................................................................................. 31
Credit Reference Bureau Usage ..................................................................................................... 34
V. Conclusion ...................................................................................................................................... 35
VI. Appendices ....................................................................................................................................... A

NATIONAL BANK OF RWANDA
FINANCIAL STABILITY REPORT
JUNE 2015
iii
LIST OF FIGURES
Figure 1: Global Economic Growth _______________________________________________________ 2
Figure 2: EAC GDP growth _____________________________________________________________ 4
Figure 3: All EAC currencies depreciated against the US dollar. _________________________________ 5
Figure 4: Growth of Credit to Private Sector in EAC. __________________________________________ 7
Figure 5: Rwanda’s economy growth (2011 to Q1, 2015) Figure 6: Headline Inflation ____________ 8
Figure 7: Depreciation of Rwandan Francs _________________________________________________ 9
Figure 9: Capital Adequacy Ratios ______________________________________________________ 12
Figure 10: Composition of Banks’ Capital _________________________________________________ 13
Figure 11: Developments in Banks’ lending ________________________________________________ 13
Figure 11: Developments in Banks’ lending ________________________________________________ 13
Figure 12: Banks’ Credit and Economic Growth ____________________________________________ 14
Figure 13: Banks’ NPLs _______________________________________________________________ 16
Figure 14: Developments in Different Categories of NPLs ____________________________________ 17
Figure 15: Whole Sale Funding Rates Declined ____________________________________________ 18
Figure 16: CAR for MFIs as at end June 2015 (in percent) ____________________________________ 23
Figure 17: Selected indicators of assets quality _____________________________________________ 24
Figure 18: Selected indicators of profitability _______________________________________________ 24
Figure 19: Selected indicators of capital position (June 2015) __________________________________ 26
Figure 20: Composition of insurers’ shareholders’ funds as at June 2015 ________________________ 26
Figure 21: Retention ratio for insurance sector _____________________________________________ 28
Figure 22: Indicator of Insurance sector liquidity ____________________________________________ 30

NATIONAL BANK OF RWANDA
FINANCIAL STABILITY REPORT
JUNE 2015
iv
LIST OF TABLES
Table 1: Capital Adequacy Ratios in EAC __________________________________________________ 6
Table 2: NPLs Ratio in EAC Countries (Percent)_____________________________________________ 7
Table 3: Market share in the financial system ______________________________________________ 10
Table 4: Developments in Sectoral loans _________________________________________________ 15
Table 5: NPLs Ratio for Selected Sectors (Percent) _________________________________________ 17
Table 6: Indicators of Banking System Liquidity ____________________________________________ 19
Table 7: Indicators of Foreign Exchange Exposure (Percent) __________________________________ 19
Table 8: Indicators of Banking System Profitability __________________________________________ 20
Table 9: MFI Liquidity indicators ________________________________________________________ 24
Table 10: Evolution of Insurance market players (in numbers) _________________________________ 25
Table 11: Asset quality ratios for Insurance sector (in percent) _________________________________ 27
Table 12: Reinsurance performance overview (in billions of FRW unless otherwise indicated) ________ 28
Table 13: Changes in income and expense items (in millions of FRW unless otherwise indicated) _____ 29
Table 14: Selected indicators of earnings and profitability ____________________________________ 29
Table 15: Public pension sector financial indicators (in billions of FRW unless otherwise indicated) ____ 30
Table 16: EAPS Transactions __________________________________________________________ 33

NATIONAL BANK OF RWANDA
FINANCIAL STABILITY REPORT
JUNE 2015
v
ACRONYMS
ATMs : Automated Teller Machines
BNR : National Bank of Rwanda
CAR : Capital Adequacy Ratios
CRB : Credit Reference Bureau
CSD : Central Securities Depository
EAC : East African Community
EAPS : East African Payment System
FOREX : Foreign Exchange
FRW : Rwandan Francs
FSR : Financial Stability Report
GBP : British Pound
GDP : Gross Domestic Products
HHI : Hirschman-Herfindahl Index
IMF : International Monetary Fund
KES : Kenyan Shilling
KRR : Key Repo Rate
MFIs : Microfinance Institutions
MNOs : Mobile Network Operators
NBFIs : Non-Bank Financial Institutions
NPLs : Non-Performing Loans
POS : Point Of Sales
PPE : Property, Plant and Equipment
RIPPS : Rwanda Integrated Payment Processing Systems
ROA : Return On Asset
ROE : Return On Equity
RTGS : Real Time Gross Settlement
SACCOs : Saving Cooperatives
TZS : Tanzanian Shilling
UGS : Ugandan Shilling
USA : United States of America
USD : US Dollar

Foreword
Fostering Financial Stability is a mandate of the National Bank of Rwanda. The bank achieves this objective
through regularly monitoring performance of the financial system (i.e the banking system, insurance sector, the
pension, the micro-finance institutions and; the payment system) and adopting appropriate policy measures.
Financial Stability Reports (FSR) are among key financial sector policy guiding analytical tools. They synthesize
recent developments in Rwanda’s financial system, analyze both exogenous and endogenous risks to the
sector; assess resilience of the sector to adverse shocks, and unveil key constraints to development of the
financial sector.
In this FSR, key risks to Rwanda’s economy and the financial sector in particular is current tepid global
economic growth and generally uncertain global economic outlook. Global economic growth stagnated at 3.4
percent in 2013 and 2014, and the IMF projects it to decelerate to 3.3 percent in 2015. This slowdown of global
economy is likely to cause further decline in commodity prices, and consequently constraining growth in
commodity exporting countries. As experienced in first half of 2015, the strengthening of US dollar also sparked
exchange rate pressures in many emerging and developing countries, Rwanda inclusive. Further strengthening
of the US dollar would offer macroeconomic management challenges. Exposure of Rwandan banks to foreign
exchange pressures is however moderate. Apparently, Rwandan banks hold only 6 percent of their loan
portfolio in foreign currency and foreign currency liabilities makeup only 23 percent of total liabilities of banks.
Despite the global risks mentioned above, similar to previous FSR, we are pleased to observe that Rwandan
financial system remain sound and stable. Banking system lending has been accelerating since third quarter of
2013 (September 2013), mainly benefiting the private sector and contributing to economic growth of the country.
Banks and non-bank financial institutions capital levels remain adequate, above the prudential limit, and enough
to absorb any shock. All financial institutions continue to hold sufficient liquidity levels which are significantly
above prudential limits. The asset quality of banks and MFs continued to improve.
Going forward, financial stability will remain an integral element of BNR’s financial sector development goals.
We are happy to note that the rapid financial innovation and development observed in the last 10 years did not
come at the expense of financial stability. BNR will continue fostering financial stability through both micro-
prudential and macro-prudential tools.

NATIONAL BANK OF RWANDA
FINANCIAL STABILITY REPORT
JUNE 2015
1
I. Global Economic and Financial Development
Global economic growth remains moderate, with uneven growth prospects across main countries
and regions. The IMF projects that after global growth stagnated at 3.4 percent in 2013 and 2014, the
global economy is expected to moderately grow by 3.5 and 3.8 percent in 2015 and 2016 respectively
(Figure 1). A slightly growth rebound in 2015 and 2016 is expected to be attributable to a positive growth
outlook for advanced economies. Growth in emerging market and developing economies is projected to be
low, primarily reflecting weaker growth prospects for large emerging market countries (e.g China) and oil
exporting countries.
According to the IMF, the distribution of global growth is more balanced, but is still titled to the
downside. Two main upside risks to global growth outlook are: (1) a greater boost to demand from lower
and commodity prices and (2) demand boost from expanded monetary accommodation, especially in
emerging economies. The most salient down side risks are: geopolitical tensions, disruptive asset price
shifts in financial markets, and, in advanced economies, stagnation and low inflation.
Disinflationary forces have strengthened in both developed and emerging economies. According to
IMF Financial stability report (April 2015), the number of countries with low or negative rates of headline
inflation, and their share of global output, increased significantly through 2014. Inflation rate in many
advanced economies fell below inflation objectives. In emerging countries falling commodity prices,
particularly oil prices, have amplified this disinflation pressure, of course with the exception of countries
suffering sizable exchange rate depreciations like Russia.
Expansionary monetary policy actions have been taken in both disinflationary pressures and to stimulate
growth. For example, the ECB launched its Quantitative Easing program in March 2015, with monthly asset
purchases of 60 billion euro until at least September 2016, contributing to maintaining favorable financing
conditions globally; and the Bank of Japan has maintained its commitment to aggressive policy easing.
In contrast, the US started its interest rate normalization policy. This divergence in monetary policy stances
across the main advanced economies is expected to continue widening long-term interest rate differentials,
consequently causing exchange rate volatility in emerging and developing countries, especially those with
developed and highly integrated financial system.

NATIONAL BANK OF RWANDA
FINANCIAL STABILITY REPORT
JUNE 2015
2
Figure 1: Global Economic Growth
Source: BNR staff based on IMF data (WEO, 2015)
Although global interest rates are at historical low levels, the divergence in interest rates and
expectations of further divergent monetary policy has already led to significant appreciation of the
US dollar vis-à-vis other major currencies. According to IMF WEO (April 2015), by February 2015, the
U.S. dollar had appreciated by about 10 percent in real effective terms relative to the values used in the
October 2014 WEO, with a particularly marked real appreciation (14 percent) against the currencies of
major advanced economies. Among other major currencies, the euro and the yen had both depreciated by
about 7 percent. With divergent monetary policy, and related widening interest rate differentials, increased
volatility in financial markets is a high risk to emerging and developing economies.
Exchange rate volatility (or depreciation in some countries) is already bearing negative results to
firms in emerging economies. Although it is possible that the stronger dollar can help improve
competitiveness in emerging market economies in general, and lead to higher growth, the dramatic
movements in commodity prices and in the exchange rates of many emerging market economies during the
past six months have already had a significant impact on firms’ market valuations in these economies.
Many companies borrowed heavily in international markets— substituting international borrowings in dollars
for local currency borrowing from banks—potentially leading to balance sheet pressures (IMF Financial
stability Report)
Source: BNR staff based on IMF WEO data

NATIONAL BANK OF RWANDA
FINANCIAL STABILITY REPORT
JUNE 2015
3
Old problems like high debt levels in private sector continue to hinder growth and financial
stability, especially in the euro area. In advanced economies, macroeconomic deleveraging through
accommodative monetary policy has helped scale down private sector debt by supporting inflation and
growth. However, given continued strengthening of deflationary forces and uncertain growth, private sector
debts are likely to remain high in major advanced countries.
Indeed this high debt levels is an indicator that financial crisis legacies are not fully unresolved, and indeed
a great risk to global economic growth and financial stability. The IMF projects gross corporate debt in
France, Italy, Portugal and Spain to remain above 70 percent of GDP by 2020. High debt levels is
problematic in a sense that it raises the sensitivity of borrowers to adverse shocks, and relatedly make
induce higher nonperforming loans and corporate bankruptcies , which increases risks of banks asset
quality.

NATIONAL BANK OF RWANDA
FINANCIAL STABILITY REPORT
JUNE 2015
4
II. Regional Economic and Financial Sector Development: Sub-Saharan Africa (SSA) and East African Community
2.1. Macroeconomic Performance in SSA
In Sub-Saharan Africa (SSA), although economic growth (average) slightly improved in 2014, it remains
below recent performance (2002-2008). Real GDP growth was 4.5 percent in 2014, up from 4.2 percent in
2013, supported by continuing infrastructure investment, increased agricultural production, and buoyant
services. Although the economy picked up in 2014, it remains weak compared to a peak average rate of 6.4
percent during 2002-08, which indicates SSA economy is punching below its weight. Growth was uneven
amongst large Sub-Saharan economies. Stellar growth in Nigeria was offset by sluggish growth in South Africa
and a slowdown in growth in Angola.
Economic activity in SSA is greatly weighed down (compared to stellar growth between 2002 and 2008)
by sharp fall in commodity prices (Figure 2). Between December 2014 and August 2015, all commodities
prices declined by 20 percent, crude oil prices declined by 24 percent, prices of metals declined 19.8 percent,
while that of agricultural raw materials declined by 16.3 percent. As a net exporter of oil and other commodities,
Sub-Saharan Africa is vulnerable to the adverse commodity price shock.
Falling commodity prices have and will continue weighing heavily on exporters of these commodities, putting
pressure on the current account and fiscal balances. Conflicts and civil wars, acts of terrorism threats, especially
in West Africa and the horn of Africa, also constrain growth take off in SSA through halting economic activities,
especially tourism.
2.2. Macroeconomic Performance in EAC Figure 2: EAC GDP growth
Economic growth strengthened in the EAC regional
block in 2014 and is forecasted to strengthen further
in 2015 (Figure 2). Average real GDP growth in the EAC
was 6.3 percent in 2014, up from 5.8 percent in 2013 and
significantly higher than Sub-Saharan growth at 5 percent
(Figure 2). Economic growth strongly rebounded in
Rwanda and Uganda, although Tanzania and Rwanda Source: BNR staff based on IMF data (WEO, 2015)
hold the highest growth rates at 7.2 percent and 7 percent respectively.

NATIONAL BANK OF RWANDA
FINANCIAL STABILITY REPORT
JUNE 2015
5
Figure 3: All EAC currencies depreciated against the US dollar.
EAC currencies significantly depreciated in
2015, in face of strengthening US dollar and
declining commodity prices (Figure 3).
Similar to situations in emerging market
countries, all EAC currencies depreciated in
2015, of course with varied degree of
depreciation from country to country.
Heightened depreciation happened in
countries with sizable short-term portfolio flows
(Uganda, Kenya and Tanzania). Exchange
rate pressures in the region resulted from
strengthening US dollar, reflecting a change in
US policy― away from quantitative easing
policy adopted in 2010.
Source: BNR staff based on IMF data (WEO, 2015)
Generally, EAC countries faced inflationary pressures, especially in the first 7 months of 2015.
Between December 2014 and July 2015, headline inflation (Year-on-Year) increased mainly in 4 EAC
countries: In Kenya from 6 to 6.6 percent; in Tanzania from 4.8 to 6.4 percent; in Uganda from 1.8 to 5.4
percent; in Burundi from 3.7 to 8 percent.
Rwanda experienced moderate inflation increase from 2.1 to 2.3 percent. Inflationary pressures in the EAC
are mainly attributable to higher food prices. Although, generally global prices remain low (and hence this
would mean importing cheaply), heightened depreciation of regional currencies also triggered higher import
prices.
To deal with hiking inflationary pressures and heightened depreciation of local currencies, some
EAC central banks tightened monetary policy. For example, Between December 2014 and August
2015, the Central Bank of Kenya (CBK) increased its policy rate by 300 percent basis point (From 8.5
percent to 11.50 percent). Bank of Uganda tightened as well by increasing its policy rate by 100 percent

NATIONAL BANK OF RWANDA
FINANCIAL STABILITY REPORT
JUNE 2015
6
basis points (From 15 to 16 percent). Although inflation remained moderate in Rwanda, the National Bank
of Rwanda (BNR) maintained its policy rate at 6.5 mainly to manage exchange rate pressures.
Despite a positive outlook for EAC countries, key risks to the region include continued decline in
commodity prices and strengthening US dollar. Continued economic growth slowdown in merging
market trading partners (mainly china) may continue to hamper demand for EAC commodity exports,
widening BOP deficits and weighing on growth. With the interest rate normalization policy in USA taking
effect, the US dollar may strengthen further, causing further exchange pressures on EAC currencies. With
a dollar strengthening further, EAC countries with significant short-term portfolio investment are at risk of
capital reversals, which would further exert more pressure on exchange rate.
2.3. Financial Sector Performance in the EAC
The EAC banking system remains highly capitalized and liquid. In financial year 2014/15, capital
Adequacy Ratio (CAR) remained above the Basel minimum standard of 8 percent in all countries. Rwandan
and Ugandan banks hold highest levels of CAR (24.3 percent, 21.3 percent respectively). Burundian Banks
reported CAR of 19.5 percent, Kenyan (18.9 percent) and Tanzanian (17.7 percent). The solvent status of
Kenyan banks is of particular importance to the regional financial stability, as Kenyan banks have opened
branches in the region. Liquidity ratios in the region averaged around 47.0 percent (liquid assets to total
deposits), way above the prudential limit of 20 percent.
Table 1: Capital Adequacy Ratios in EAC
Jun-14 Sep-14 Dec-14 Mar-15 Jun-15
Tanzania 17.8 18.1 17.7 19.1 17.7
Kenya 17.6 17.8 19.2 19.2 18.9
Uganda 22.8 22.5 22.2 23.2 21.3
Rwanda 23.6 24.0 24.0 25.9 24.3
Burundi 21.3 18.1 17.3 20.5 19.5
Basel standard 8 8 8 8 8
Source: EAC Central Banks and Basel framework

NATIONAL BANK OF RWANDA
FINANCIAL STABILITY REPORT
JUNE 2015
7
Credit growth varied in EAC countries (Figure 4): While credit growth accelerated in Rwanda (growing
by 26.3 percent in March 2015, up from 11.7 percent in June 2014), it decelerated in Kenya―to 19.6
percent in March 2015, down from 22.7 in March 2014. In Tanzania credit growth accelerated to 21.2
percent in March 2015, up from 15.8 percent in the same period in 2014.
Figure 4: Growth of Credit to Private Sector in EAC.
Asset quality of EAC banks improved in financial
year 2014/15 (Table 2). On average, NPLs in EAC
banking system declined to 7.1 percent in June
2015, down from 7.8 percent as at June 2014. NPLs
declined mostly in Uganda (by 1.8 percentage
points), followed by Tanzania (by 1.5 percentage
points), and Rwanda (by 0.7 percentage points),
while in Burundi NPLs increased by 0.6 percentage
points. In the region, Ugandan banks hold the lowest
NPLs (4.0 percent), followed by Kenya (5.7 percent),
Rwanda (5.9 percent) and Tanzania (6.7 percent).
Burundi banks hold the highest NPLs ratio (13.3
percent). Improving asset quality of regional banking
system is indicative of a stable and health regional
financial system.
Source: BNR staff based on EAC central banks data
Table 2: NPLs Ratio in EAC Countries (Percent)
June 2014 September 2014 December 2014 March 2015 June 2015
Tanzania 8.2 8.4 6.8 6.7 6.7
Kenya 5.7 5.4 5.4 5.8 5.7
Uganda 5.8 5.3 4.1 4.3 4.0
Rwanda 6.6 6.3 6.0 6.3 5.9
Burundi 12.7 12.5 11.1 12.4 13.3
EAC Average 7.8 7.6 6.7 7.1 7.1
Source: BNR staff based on EAC Central Banks data

NATIONAL BANK OF RWANDA
FINANCIAL STABILITY REPORT
JUNE 2015
8
III. Domestic Macroeconomic Environment
Rwandan Economy grew strongly in 2014 and in first quarter of 2015. The economy expanded by 7
percent in 2014 and by 7.6 percent in first quarter of 2015. According to the IMF WEO (April), Rwanda was
among the fast 5 growing countries in SSA1. This strong growth is mainly attributable to stellar growth in
services and agriculture sectors. The service sector, an engine of growth in Rwanda, expanded by 8.9
percent in 2014 and by 8 percent in first quarter of 2015 (up from 5.3 percent 2013). Agriculture growth
improved to 5 and 4 percent in 2014 and 2015 Q1 reactively, up from 3 percent in 2013. Improved financing
of the economy also played a significant role for improved growth. Economic growth greatly co-moves with
growth of credit to private sector (Figure 5).
Figure 5: Rwanda’s economy growth (2011 to Q1, 2015) Figure 6: Headline Inflation
Source: BNR, Financial Stability Directorate Source: BNR, Financial Stability Directorate
Rwandan Inflation remained moderate throughout FY2014/15 (Figure 6). Between July 2014 and June
2015, headline inflation averaged at 1.3 percent and was below 3 percent in all months. Low inflation is
mainly attributable to lower food prices due to good agricultural harvests and the impact of lower
international oil prices which affected local prices through lower pump prices.
1 Other fast growing countries are: Côte d'Ivoire; Ethiopia; Mozambique; Tanzania; Democratic Republic of the Congo

NATIONAL BANK OF RWANDA
FINANCIAL STABILITY REPORT
JUNE 2015
9
In FY 2014/15, the Rwandan franc depreciated against the US dollar, although the pace of
depreciation is slowing down. Between June 2014 and June 2015, Rwandan depreciated by 5.4 percent
against the US dollar. In the first half of the year (Between June 2014 and December 2014), the Rwandan
franc depreciated by 1.9 percent. More depreciation happened in the second half of the year (i.e between
December 2014 and June 2015), where depreciation reached 4.3 percent against the U.S. Since June
pressures declined (Depreciation was only 1.1 percent between June 2015 and September 10, 2015).
Exchange rate pressures emanate from strengthening US dollar.
Figure 7: Depreciation of Rwandan Francs
Source: BNR, Financial Stability Directorate

NATIONAL BANK OF RWANDA
FINANCIAL STABILITY REPORT
JUNE 2015
10
IV. Domestic Financial Sector Development
4.1. Rwanda’s Financial Sector Landscape
The Rwanda financial sector is largely dominated by banking sector which hold around 66.9
percent of the total financial sector assets. The pension sub-sector comes second, with 17.1 percent of
the total financial sector assets. Insurance institutions hold 9.7 percent of the total financial sector’s assets.
Microfinance institutions account for 6.3 percent of total financial sector assets. The National Bank of
Rwanda (BNR) is the sole regulator of the above mentioned financial sector sub-sectors. Other integral
components of the financial sector in Rwanda are: forex bureaus; capital market and; payment system.
Table 3: Market share in the financial system
Jun-14 Sep-14 Dec-14 Mar-15 Jun-15
Banking sector 67.6 67.1 66.6 66.4 66.9
Insurance 9.4 9.5 9.8 10.2 9.7
Pension 17.4 17.7 17.8 17.5 17.1
MFIs 5.6 5.8 5.9 5.9 6.3 Source: BNR, Financial Stability Directorate
Between June 2014 and June 2015, the number of banks increased from 14 in June 2014 to 17 in
June 2015. Three banks: AB Bank, Crane Bank and BRD commercial joined the Rwandan banking
industry. In total, the Current Rwandan banking system is composed of 11 commercial banks, 4
microfinance banks, 1 development bank and 1 cooperative bank. Microfinances sub-sector constitutes 13
limited companies, 64 SACCOs and 416 UMURENGE SACCOs. There are also 88 foreign exchange
bureaus. Non-Bank Financial Institutions include: 10 private insurers, 2 public insurers, 8 loss adjusters, 6
brokers, 155 insurance agents and 1 public pension fund and 54 private funds.
Rwandan banking system is more privately and domestically owned. As of June 2015, close to 61
percent of banking assets were domestically owned. Foreign assets were 39 percent. Private ownership
stood at 55 percent of the total banking system assets. Three of the foreign banks are subsidiaries of
Kenyan big banks which were ranked among top 100 banks by return on assets in Africa2.
2 The banker (http://www.thebanker.com)

NATIONAL BANK OF RWANDA
FINANCIAL STABILITY REPORT
JUNE 2015
11
4.2. Performance of the Rwandan Banking System
The banking sector holds around 66.9 percent of the total financial sector assets. During the year ended
June 2015, the system constituted 17 institutions from 14 institutions in June 2014. The current structure
includes 11 commercial banks, 4 microfinance banks, 1 development bank and 1 cooperative bank. In
FY2014/15, the banking system assets continued to grow; capital remained adequate and significantly
above the prudential limit; the asset quality of banks improved as well; exchange rate exposure remained
moderate (net open position remain within prudential limits); and profitability of banks improved.
Banking sector assets continued to expand in FY2014/15: Between June 2014 and June 2015, total
assets of banking system increased by 13.5 percent (from FRW 1,768 billion to FRW 2,000 billion), down
from 27.9 percent growth registered in the previous year.
Growth happened to all major components Figure 8: Growth Rate of Components of Banks’ Assets
of banks assets in FY 2014/15 (Figure 8).
Cash loans and advances, which constitute over
55 percent of total assets, was the main driver
of growth in total banking assets― rising by
22.6 percent (from FRW 904 billion to FRW
1,109 billion). Investment in government
securities also increased by 31.3 percent.
Another contribution to asset growth came from
significant growth of investments in other
securities―assets in this category expanded by
112.8 percent. A strong growth in “investment
and other assets” was due to higher
investments in government treasury bonds Source: BNR, Financial Stability Directorate
NATIONAL BANK OF RWANDA
FINANCIAL STABILITY REPORT
JUNE 2015
12
and equity. As a result of accelerated investment in other securities, the share of banks’ investment in other
securities (bonds &equity) in total banks’ assets increased from 14.2 percent in June 2014 to 26.6 percent
in June 2015.
Capital Position of Banks
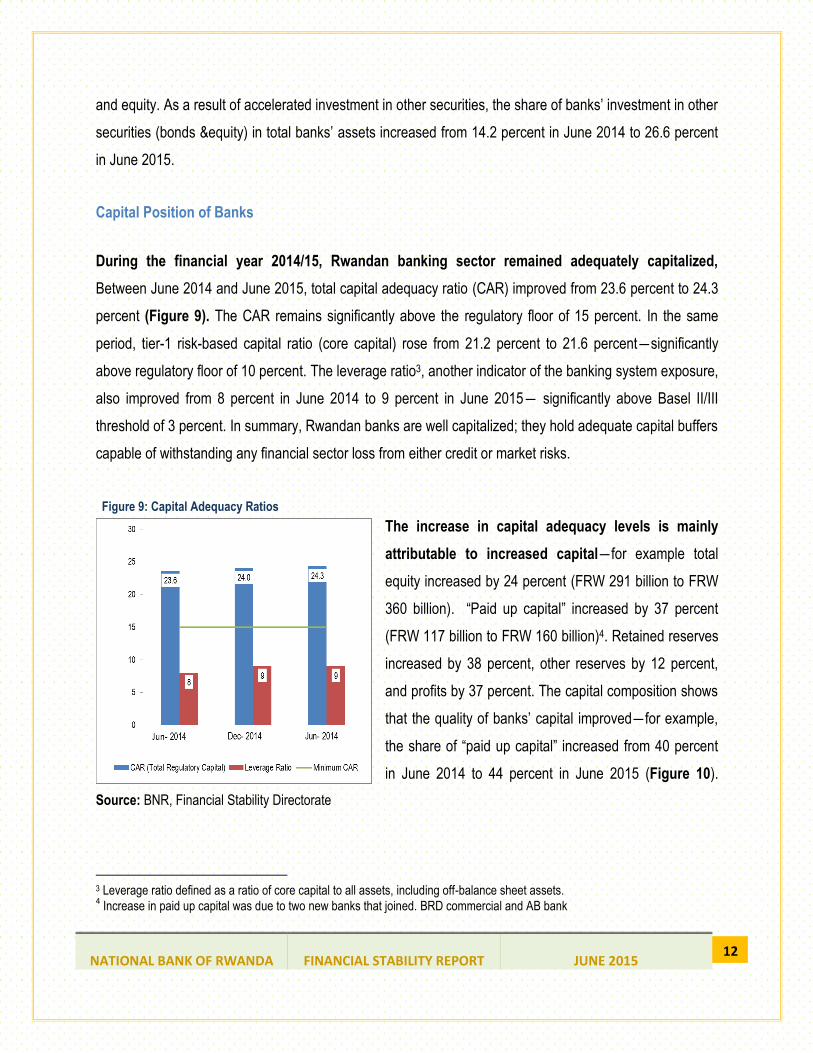
During the financial year 2014/15, Rwandan banking sector remained adequately capitalized,
Between June 2014 and June 2015, total capital adequacy ratio (CAR) improved from 23.6 percent to 24.3
percent (Figure 9). The CAR remains significantly above the regulatory floor of 15 percent. In the same
period, tier-1 risk-based capital ratio (core capital) rose from 21.2 percent to 21.6 percent―significantly
above regulatory floor of 10 percent. The leverage ratio3, another indicator of the banking system exposure,
also improved from 8 percent in June 2014 to 9 percent in June 2015― significantly above Basel II/III
threshold of 3 percent. In summary, Rwandan banks are well capitalized; they hold adequate capital buffers
capable of withstanding any financial sector loss from either credit or market risks.
Figure 9: Capital Adequacy Ratios
The increase in capital adequacy levels is mainly
attributable to increased capital―for example total
equity increased by 24 percent (FRW 291 billion to FRW
360 billion). “Paid up capital” increased by 37 percent
(FRW 117 billion to FRW 160 billion)4. Retained reserves
increased by 38 percent, other reserves by 12 percent,
and profits by 37 percent. The capital composition shows
that the quality of banks’ capital improved―for example,
the share of “paid up capital” increased from 40 percent
in June 2014 to 44 percent in June 2015 (Figure 10).
Source: BNR, Financial Stability Directorate
3 Leverage ratio defined as a ratio of core capital to all assets, including off-balance sheet assets. 4 Increase in paid up capital was due to two new banks that joined. BRD commercial and AB bank

NATIONAL BANK OF RWANDA
FINANCIAL STABILITY REPORT
JUNE 2015
13
Figure 10: Composition of Banks’ Capital
Lending connection to off-the- balance sheet items
increased. Between June 2014 and June 2015, off
balance sheet items increased by 18 percent to FRW
1,129 billion from FRW 957 billion. This lending is
monitored through the leverage ratio, a ratio which
combines both on-the-balance sheet items and off-the-
balance sheet items, in a bid to curb the over
leveraging by Banks (see Figure 9).
Source: BNR, Financial Stability Directorate
Banks’ Lending Development
Bank lending has been accelerating since third quarter of 2013 (September 2013), mainly benefiting
the private sector: In June 2015, total credit by banks increased by 22.3 (Year-on-Year), up from 14.3
percent in the same period in 2014. Most of this credit increase went to private sector― credit to private
sector increased by 27 percent―credit to government (with a share of 9 percent in total bank’s loans)
declined by 12 percent.
Figure 11: Developments in Banks’ lending
The fact that more than 90 percent of total loans
granted were in Rwandan Francs, limits
exposure to foreign exchange risks. Between
June 2014 and June 2015, Rwandan francs loans
increased by 22.2 percent (to FRW 1,263 billion). In
the same period, foreign currency loans significantly
increased by 117 percent. However, despite the
sharp increase in foreign currency loans, its share in
total banks’ loans is only 6 percent. BNR regulation
Source: BNR, Financial Stability Directorate
Figure 12: Developments in Banks’ lending
Source: BNR, Financial Stability Directorate

NATIONAL BANK OF RWANDA
FINANCIAL STABILITY REPORT
JUNE 2015
14
requires banks to make foreign currency loans to only companies or individuals with foreign currency
incomes (revenues). The fact that share of FX loans in total loans is small, makes the Rwandan banking
system better protected against negative impacts from recent depreciation of Rwanda Franc.
Improved growth of credit remains among key drivers of economic growth (Figure 12). Credit growth
stimulates domestic demand―it triggers more private investment and consumption. Although growth of
credit has been strengthening, and supporting economic growth, however, its level as a percentage of GDP
remains small―Banks’ total credit as a percentage of GDP was 20 percent in December 2014, lower than
Kenya (36.8), but slightly higher than in Uganda (19 Percent). Despite being low, Credit (Percent GDP) has
been steadily rising (Figure 12, Panel B) ―from 17 percent in 2012 to 18 percent, and to 20 percent in
2013, and 2014 respectively.
Figure 13: Banks’ Credit and Economic Growth
Source: BNR, Financial Stability Directorate
Banks’ Sectoral Lending
Banks’ concentrated lending is a key concern in the sector. Similar to previous observation, bank’s
lending is concentrated in mortgage and hotels and trade sectors (Table 4). The share of mortgage loans in
total loans was 33 percent in June 2015, up from 29.6 percent in June 2014. This shows that banks
accelerated their lending to mortgage sector. In second place, trade and hotels loans was 31 percent of

NATIONAL BANK OF RWANDA
FINANCIAL STABILITY REPORT
JUNE 2015
15
total loans in June 2015. Together, mortgage and “trade and hotels” held up to 64 percent of banking
system loans in Rwanda.
Concentrated lending to these sectors implicitly means high exposure to these sectors. On a positive note,
however, loans in these sectors are performing. For example, the NPLs ratio in mortgage was only 4
percent in June 2015―which is lower than total NPLs ratio for all sectors and even lower than BNR NPLs
target of 5 percent. NPLs ratio in “trade and hotels” stood at 6 percent in June 2015, almost equal to the
overall NPLs ratio of 5.9 percent (Table 4).
Table 4: Developments in Sectoral loans
Total system Percent Share of Sector Loans in
Total Loans
Annual Growth Rate of
Sector Loans (Percent)
June -14 June-15
Non-classified activities 14 12 -4
Agricultural, fisheries& livestock 3 2 0
Mining activities 0 0 812
Manufacturing activities 9 9 17
Water & energy activities 3 2 2
Mortgage industries 30 33 34
Trade & hotel activities 32
31 14
Transport & warehousing 5 6 32
OFI &Insurance 1 2 120
Service sector 3 3 23
Source: BNR, Bank Supervision Department
Although access to loans has been increasing, the women and youth access levels remain low. In
FY 2014/15, the total number of individuals who accessed loans from the banking sector increased by 10
percent (from 110,482 to 122,005). Despite this increase, women accounted for only 34 percent (41,756) of
total number of people that accessed loans. In terms of total amount (value) of loans distributed, in the first
six months of 2015, the total new authorized loans amounted 147.14 billion― women accounted for 23
percent (33.81 billion Frw), the youth (age below 35 years) accounted for 31 percent (45.0 billion Frw).

NATIONAL BANK OF RWANDA
FINANCIAL STABILITY REPORT
JUNE 2015
16
Risks of falling mineral prices on international markets is moderate on Rwandan banks as mining
loans make up only less than 1 percent of banks’ loan portfolio. Falling commodity prices is currently
causing stress on balance sheet of emerging market mining firms, ultimately affecting banks that lent to
these firms. Observing this, raises questions like: how is the Rwandan banking system impacted/or likely to
be impacted by falling mineral prices? Considering the current low levels of mining loans in Rwandan
banks’ loan portfolio, the impact is expected to be moderate. Loans to mining industry make up less than 1
percent of total loan portfolio of banks (Table 4). Despite the lower share in total loans, however, mining
loans increased by 812 percent (from FRW 38million to FRW 350 million). Mortgage loans increased by 34
percent, while loans to trade and hotels increased by 14 percent.
Banking System Asset Quality
The asset quality of Rwandan banks improved in FY2014/15. Between June 2014 and June 2015, the non-
performing loans ratio5 declined by 0.7 percentage points (i.e from 6.6 to 5.9 percent). In fact, NPLs ratio has
been declining since March 2013 (Figure 13). In nominal terms, non-performing loans was FRW 80 billion in
June 2015. Declining NPLs ratio is a good indicator that credit risk is declining, and a good sign that credit
growth will not compromise financial stability.
Figure 14: Banks’ NPLs
Despite the decline in NLPs ratio, it is worth noting
that watch loans, an indicator of future loan losses
started picking up since December 2014 (Figure
13). Between June 2014 and June 2015, watch
loans increased by 12.7 percent to reach FRW
157.6 billion.
Source: BNR, Financial Stability Directorate
5 NPL ratio is defined as: Total non-performing loans (loss, doubtful and substandard)/gross loans

NATIONAL BANK OF RWANDA
FINANCIAL STABILITY REPORT
JUNE 2015
17
Despite the decline in NLPs ratio, Watch loans (indicator of future losses) is picking up. Watch
loans, an indicator of future loan losses started picking up since December 2014 (Figure 14). Between
June 2014 and June 2015, watch loans increased by 12.7 percent to reach FRW 157.6 billion.
Figure 15: Developments in Different Categories of NPLs
Development of Asset Quality by Sector
Agriculture sector holds the highest level of
NPLs, and mortgage sector, despite holding the
highest level of loans; it has one of the lowest
NPLs (Table 5). The NPLs ratio in agriculture
sector stood at 14 percent in June 2015,
significantly higher than total NPLs ratio for all
sectors (5.9 percent). The risk of high NPLs ratio in
agriculture is however minimized by a small share
of total banks’ loans to this sector―at 2 percent. Manufacturing sector has the lowest NPLs ratio―at
1Percent. This simply means less credit risks in manufacturing, as opposed to agriculture. It is important to note
a positive asset quality of mortgage loans―which stood at 4 percent, lower than the total NPLs ratio (for all
sectors) at 5.9 percent. Risks from high concentration of banks’ loans in mortgage sector are therefore
minimized by the highest level of performing loans in this sector (good asset quality). Nevertheless, exposure to
the mortgage industry remains.
Table 5: NPLs Ratio for Selected Sectors (Percent)
Sector NPLs (NPLs of sector/Sector gross loans)
Jun-14 (A) Jun-15 (B) B-A
Non-classified activities 5% 6% 1%
Agricultural, fisheries& livestock 15% 14% -1%
Mining activities 0% 3% 3%
Manufacturing 2% 1% -1%
Water & energy 0% 3% 3%
Mortgage industries 5% 4% -1%
Trade & hotel 5% 6% 1%
Transport & warehousing 4% 4% 0%
OFI &Insurance 1% 4% 3%
Service sector 6% 6% 0%
Source: BNR, Financial Stability Directorate
Source: BNR, Financial Stability Directorate

NATIONAL BANK OF RWANDA
FINANCIAL STABILITY REPORT
JUNE 2015
18
Banks’ Funding Condition
In financial year 2014/15, deposits remained the main source of funding for Rwandan banking
system. As of June 2015, deposits composed 83 percent of total liabilities of banks. Between June 2014
and June 2015, total deposits increased by 11 percent (to FRW 1, 366 billion), down from 31 percent in
previous period. Rwandan franc deposits increased the most (by 20 percent). Foreign currency deposits
declined by 15 percent.
The high dependency on short-term demand deposits remains a challenge for Rwandan banks.
Demand deposits make up 60 percent of total deposits of banks. Between June 2014 and June 2015,
demand deposits grew by 14 percent. On the contrary, time deposits increased by only 2 percent. Although
Rwandan banks have not faced liquidity problems in recent past, the dependency on short-term funds
remains a liquidity risk and even limits long-term development lending.
Whole sale funds increased in financial year 2014/15. Whole sale funds in Rwanda are composed of:
interbank funds; funds due to financial institutions abroad; and brokered funds from large depositors6.
Between June 2014 and June 2015, total whole sale funds increased by 14 percent. Interbank funds (due to
local banks) increased by 18 percent (to FRW217 billion). Deposits from largest depositors increased by 13
percent.
Figure 16: Whole Sale Funding Rates Declined
Although BNR’s policy rate remained unchanged at 6.5
percent since June 2014, other whole sale funds related
rates declined in FY2014/15, largely indicating that the
cost of whole sale funds for banks dropped (Figure 15).
Interbank rate declined from 5.7 percent in June 2014 to 4
percent in June 2015. In the same period, repo rate declined
from 3.7 percent to 2 percent. The average deposit rate
given to the largest depositor corporation also declined from
11 percent to 10 percent. All these declining rates indicate
that the cost of whole sale funds declined for banks. Source: BNR, Financial Stability Directorate
6 For large depositors, In Rwanda we considered 20 largest depositors.

NATIONAL BANK OF RWANDA
FINANCIAL STABILITY REPORT
JUNE 2015
19
Banks’s Liquidity Condition
Similar to findings in FSR of June 2015, Liquidity risks remain moderate in Rwandan banking
system. The ratio of liquid assets to total deposits (which measures the banks’ ability to meet liquidity
needs) stood at 49.5 percent as at June 2015, far above the regulatory minimum of 20 percent. Gross
loans to total deposits which measure the position of loans which are supported by deposits increased from
76.4 percent to 84.2 percent (Table 6).
Table 6: Indicators of Banking System Liquidity
June-14 Sept-14 Dec-15 Mar- 2015 Jun- 2015
Gross Loans/Total Deposits 76% 80% 85% 87% 84%
Liquid Assets/Total Deposits 54% 54% 49% 46% 50%
Liquid Assets/Total Assets 38% 38% 33% 31% 34%
Source: BNR, Financial Stability Directorate
Exposure to exchange rate risk
Foreign exchange exposure remains within the prudential limits. During the year end June 2015, the
banks’ foreign currency assets as a share of their total assets decreased from 19.6 to 15.6 percent in June
2014 (Table 7). The ratio of foreign currency loans to foreign currency deposits rose from 12.7 percent in
June 2014 to 32.6 percent as at June 2015 implying a high proportion of increase of foreign currency loans
when compared to increase of foreign currency deposit. However, the activities of banks in foreign
currencies do not pose huge risks to Rwandan financial system as prudential limits are complied with and
capital buffers are enough to absorb risks from exchange fluctuation. The net open position ratio (foreign
exposure to core capital) of -7.1 percent remained within the regulatory limits of +/- 20 percent. In addition,
overall exchange rate risk remains low, with the ratio of foreign currency assets to foreign currency
liabilities standing at 82.1 percent in as at end June 2015.
Table 7: Indicators of Foreign Exchange Exposure (Percent)
Jun-14 Sept-14 Dec -14 Mar-15 Jun-15
Forex exposure to core capital -1.5 -4.9 -1.8 -5.5 -7.1
Forex deposits to total deposits 26.3 24.1 26.4 21.4 20.1
Forex loans to total loans 3.8 4.3 8.3 6.0 6.6
Forex assets to total assets 19.6 17.7 20.9 15.9 15.7
Forex loans to Forex deposits 12.7 16.2 29.5 27.1 32.6
Source: BNR, Financial Stability Directorate

NATIONAL BANK OF RWANDA
FINANCIAL STABILITY REPORT
JUNE 2015
20
Earning and profitability
Similar to the previous report, the banking sector continued to register good profitability —net profit after tax
increased by 36.5 percent (from FRW 17.2 billion by end June 2014 to FRW 23.6 billion by end June 2015).
In the same period, the proportional increase of total income of 13.4 percent was higher than the 9.3
percent of total expenses.
Further analysis of the earnings of the bank shows evidence that total income growth was largely driven by
interest income on advances and other incomes which rose by 14.3 percent and 31.4 percent from June
2014 to June 2015 respectively. Also, Interest income on government securities increased by 8.1 percent
signaling increasing interests to investing excess liquidity in government securities.
In relation to the expense side, interest expenses related to deposits increased by 5.8 percent; Provisions
for bad debts increased by 32.1 percent; other interest expenses decreased by 3.2 percent; staff related
costs increased by 7.8 percent and premises transport and depreciations increased by 10.6 percent) and
other expenses increased by 3.4 percent.
Table 8: Indicators of Banking System Profitability
Jun-14 Sept-14 Dec-14 Mar-15 Jun-15 Net Profit after tax (FRW billion) 17.3 24.7 33.8 12.2 23.6
ROA (%) 2.1 1.9 1.9 2.7 2.4
ROE (%) 12.1 10.9 10.5 14.1 13.1
Cost to income (%) 81.5 82.2 82.1 79.4 78.6
Source: BNR, Financial Stability Directorate

NATIONAL BANK OF RWANDA
FINANCIAL STABILITY REPORT
JUNE 2015
21
How resilient is the Rwandan Banking System?
Stress testing results
As at June 2015, stress testing results show that the Rwandan Banking System is resilient with higher
capital buffers, liquidity covers, and highly shielded as regards to foreign exchange operations. In addition,
the concentration risk was proved to be less impactful to the overall system despite signals of individual
institution distress resulting from the test of break even. Therefore, from the history, the shocks that
involved the break-even are less plausible since they have never happened in Rwanda.
With regards to the credit and concentration risks, the stress test as at end of June 2015 shows that a
shock of 30% in performing loans would cause the first bank to become critically undercapitalized in
Rwandan banking system. However, the industry remains well capitalized to withstand the shock as the
capital adequacy ratio would reduce from 24.3 percent to 20.2 percent, well above the minimum
capitalization required of 15%. In addition, the results show that the maximum probability of default (100%)
in mortgage loans would cause the capitalization level to reduce from 24.3 percent to 20.2 percent. The
maximum probability of default in trade and hotels loans would cause the capital adequacy ratio to
decrease from 24.3 percent to 20.6 percent.
The test of liquidity reveals that a drop of 30% in deposits would cause the first bank in banking system to
become illiquid (liquidity ratio <=0) and ten (10) banks would fall below the liquidity requirements level of
20%. The industry liquidity ratio would reduce to 35.7 percent from 49.5 percent and still above the 20
percent required. However, withdraw of 20 largest depositors would cause the decline of liquidity ratio to
18.1 percent from 49.5 percent and one biggest depositor withdraw would reduce the liquidity ratio to 40.3
percent from 49.5 percent.
Further, the foreign exchange risk test found that depreciation of 9% in FX rate would reduce the regulatory
capitalization from 24.6 percent to 24.0 percent, and the NOP would fall outside the bands (-21.4).

NATIONAL BANK OF RWANDA
FINANCIAL STABILITY REPORT
JUNE 2015
22
Box 1: Stress Testing methodology The National Bank of Rwanda (BNR) conducts the stress tests on the banks’ balance sheet against extreme shocks on quarterly basis. The stress testing involves examining the impact of key risks, namely capital adjustment, credit, exchange rate, and the liquidity risk on individual and consolidated banks based on June 2015 data. These tests use a framework based on work by Cihak7, as modified by Rwanda FSAP conducted in 2011, to identify the breaking point for each risk i.e. shocks are applied to selected variables until banks fail to meet a minimum requirement. Note that the full adoption of Cihak model is expected in the near future, as planned in the EAC harmonization process. Credit and concentration risks In the exercise of shocking the credit and concentration risk, three shocks were conducted to assess the effect of a further deterioration in asset quality on bank capital: (i) the breaking point from a haircut on performing loans, (ii) a haircut on performing loans for two main sectors (mortgage sector and trade and hotels sector), and (iii) a 100% large borrowers default. The method used in the credit sensitivity analysis consisted of estimating the additional provisions that would be required to cover the estimated loss and charging it to capital. The provisioning shortfall was deducted from risk weighted assets and net assets as well as capital. The first two shocks tests the level of break-even that would cause the first bank to become critically undercapitalized (<6%). Liquidity risk Liquidity risk test simulated the following shocks and their effect on the minimum regulatory liquidity level of 20 percent: (i) drop in deposit and (ii) the largest depositors withdraw. Under assumption the above assumptions, the first shock involved the break even that would cause the first bank to become illiquid (<0% of liquidity ratio), while the second shock tested the effect of deposits concentration in the banking system. Exchange rate risk The foreign exchange risk tests measured the impact of shocks on net open position (NOP) and capital. The test simulated the effect on the net open position and on capitalization resulting from the depreciation of Rwandan Francs against USD. The test considered higher depreciation that would cause the NOP to drop outside the regulatory bands (+/-20%).
7 Cihak, M., (2007), “Introduction to applied stress testing”, IMF Working Paper No WP/07/59, IMF, Washington DC

NATIONAL BANK OF RWANDA
FINANCIAL STABILITY REPORT
JUNE 2015
23
4.3. Performance of the Microfinance Sector
The microfinance sub- sector is an integral component of Rwanda’s financial system. The sector plays a
critical role in driving financial inclusion (connecting the rural population and lower income groups to
financial services). The size of MFIs relative to Rwanda’s financial system is still small, but increasing. As of
June 2015, its share in total assets was 6.3 percent, up from 5.6 percent in June 2014. Generally, MFIs
financial conditions improved in FY2014/15. Capital adequacy ratio (CAR) remains above the prudential
limit, NPLs declined, although still above the prudential limit, profits of MFIs increased and; liquidity
conditions continued to improve.
The microfinance sector assets continued to grow. Between June 2014 and June 2015, microfinance
assets increased by 27.2 percent (from FRW147.4 billion to FRW 187.5 billion). The Umurenge SACCOs’
assets increased by 32 percent (From FRW 69 billion to 91 billion).
Capital position of MFIs Figure 17: CAR for MFIs as at end June 2015 (in percent)
Microfinance Institutions remain well
capitalized (Figure 16). As at end June 2015,
the capital adequacy ratio of MFIs was 31.4
percent (slightly lower than 31.9 percent of end
June 2014), but significantly higher than
minimum regulatory ratio of 15 percent. With
regard to the composition of capital, Microfinance
capital is largely composed of paid-up capital,
earnings and other equities. The strong capital
position of MFIs provides confidence that MFIs
can withstand unexpected losses from various
shocks/risks. Source: BNR, Microfinance Supervision Department

NATIONAL BANK OF RWANDA
FINANCIAL STABILITY REPORT
JUNE 2015
24
MFIs Asset quality
Figure 18: Selected indicators of assets quality Asset quality of microfinance institutions improved
in FY 2014/15. Between June 2014 and June 2015, The
NPLs ratio (Non-performing loans to gross loans) an
indicator of asset quality, declined from 7.6 percent to 7.4
percent (Figure 17). Despite this decrease, however, this
ratio is still above the prudential target of 5 percent. NPLs
ratio in UMURENGE SACCO are quite higher than
overall NPLs for microfinance sector―Umurenge
SACCOS NPLs ratio was 8.2 percent in June 2015, up
from 7 percent in June 2014. Source: BNR, Microfinance Supervision Department
Figure 19: Selected indicators of profitability
MFIs Earning and Profitability
Profitability of MFI’s improved in FY2014/15. Between
June 2014 and June 2015, the average ROA and ROE
increased from 3.8 percent and 11.6 percent respectively
to 3.9 percent and 11.9 percent. In the same period, net
profit of MFIs increased by 29 percent. Umurenge Sacco
profits increased by 12 percent (which is relatively lower
than overall growth of MFI profits). Source: BNR, Microfinance Supervision Department
MFI Funding and liquidity
Over the year from June 2014 to June 2015, the microfinance sector’s level of funding from customer
deposits increased by 27.7 percent from FRW 82.2 billion end June 2014 to FRW 104.9 billion end June 2015.
As share of total deposits, demand deposits continued to be main source of funds for Microfinance sector at 76
percent while the saving and time deposits account for 24 percent of total deposits. The savings account increased
by 41.0 percent from FRW 14.0 billion in June 2014 to FRW 19.8 billion in June 2015.
Table 9: MFI Liquidity indicators
Indicators Jun-14 Sep-14 Dec-14 Mar-15 Jun-15
Loans/Deposits 98.8 103.0 104.4 102.8 92.6
Quick-Liquidity Ratio 86.2 84.3 87.0 91.7 95.4
Source: BNR, Microfinance Supervision Department

NATIONAL BANK OF RWANDA
FINANCIAL STABILITY REPORT
JUNE 2015
25
4.4. Performance indicators in Non-Bank Financial institutions
The Non-Bank Financial Institutions (NBFIs) sub-sector is viewed as an important financial sector player.
It’s mainly composed of insurance sub-sector and the pension. NBFIs hold up to 26.8 percent of total
financial system assets. It is critical to national development in a sense that it mobilizes long-term savings,
capable of financing long-term investment project. In a separate perspective, the insurance and pension
sub-sector improved in FY2014/15. The insurance system solvency remains above the prudential limit,
assets quality improved through prudent investments, and liquidity conditions improved. Further, the
pension funds performed well, improving in assets and in investment income while received and paid
contributions increased.
Insurance market development
Insurance intermediaries (brokers and agents) increased. Between June 2014 and June 2015, the
number of insurance agents expanded by 16.7 percent (from 276 to 322), and the number of brokers
increased from 10 to 14. As of June 2015, the insurance service providers were as follows: 2 public
insurers; 4 life insurers; 8 non-life insurers 14 insurance brokers and 322 insurance agents (Table 10).
Generally, Rwanda’s insurance industry is dominated by short term insurance businesses (i.e. non-life),
whose share is 83.2 percent of total insurance assets and 89.8 percent of total gross premiums.
Table 10: Evolution of Insurance market players
In numbers Jun 2014 Jun 2015
Public insurers Public insurers 2 2
Private Insurers Life insurers 4 4
Non- life insurers 8 8
Insurance Intermediaries
Brokers 10 14
Agents 276 322
Loss adjusters 11 9
Source: BNR, NBFI Supervision Department

NATIONAL BANK OF RWANDA
FINANCIAL STABILITY REPORT
JUNE 2015
26
Capital position of Insurance Sub-sector
Rwanda’s insurance sector in general remains adequately capitalized and in good position to
mitigate unforeseen risks. As at end June 2015, the consolidated solvency margin ratio stood at 282
percent against the minimum prudential requirement ratio of 100 percent. This implies the sector has more
room to take risks, increase products expansion. The adequate solvency coverage ratio demonstrates
insurers’ capital strength to withstand shocks.
Figure 20: Selected indicators of capital position (June 2015)
The insurance risk ratio (net premiums/ capital)
remained strong. It stood at 20 percent in June 2015,
down from 22 percent in June 2014, and significantly
lower than maximum prudential limit of 300 percent
(Figure 19). Low insurance risk ratio implies that the
capital is sufficient enough to cover all the insurance
risks.
Source: BNR, NBFI Supervision Department
Figure 21: Composition of insurers’ shareholders’ funds as at June 2015
Quantity and quality of Insurance capital
continued to grow. In absolute terms, capital
and reserves grew by 21.4 percent (from FRW
180.5 billion in June 2014 to FRW 219.1 billion
in June 2015) .More than 70.5 percent of
insurance industry is retained earnings (Figure
20). This means that insurance shareholders
are keen to increase capital of their institutions
by retaining their earnings. Therefore, the
sector’s capital build-ups or creation of capital
buffers remains dependent on profitability. Source: BNR, NBFI Supervision Department
NATIONAL BANK OF RWANDA
FINANCIAL STABILITY REPORT
JUNE 2015
27
Asset quality of Insurers
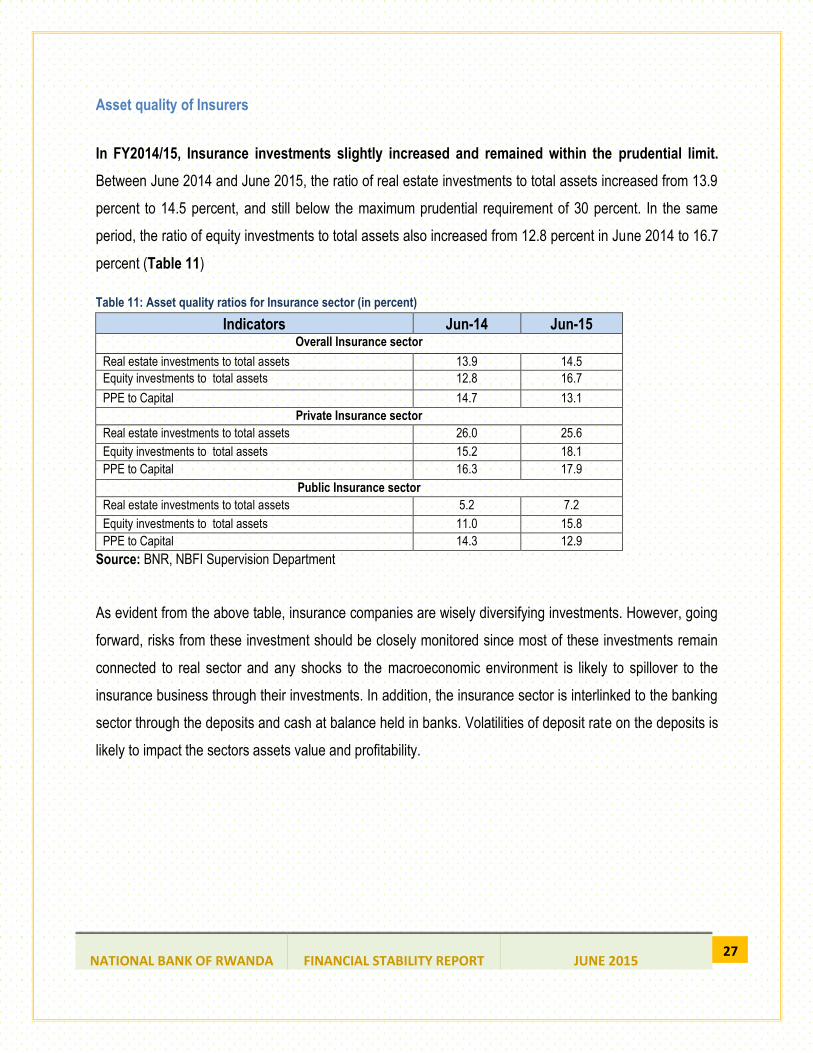
In FY2014/15, Insurance investments slightly increased and remained within the prudential limit.
Between June 2014 and June 2015, the ratio of real estate investments to total assets increased from 13.9
percent to 14.5 percent, and still below the maximum prudential requirement of 30 percent. In the same
period, the ratio of equity investments to total assets also increased from 12.8 percent in June 2014 to 16.7
percent (Table 11)
Table 11: Asset quality ratios for Insurance sector (in percent)
Indicators Jun-14 Jun-15 Overall Insurance sector
Real estate investments to total assets 13.9 14.5
Equity investments to total assets 12.8 16.7
PPE to Capital 14.7 13.1
Private Insurance sector
Real estate investments to total assets 26.0 25.6
Equity investments to total assets 15.2 18.1
PPE to Capital 16.3 17.9
Public Insurance sector
Real estate investments to total assets 5.2 7.2
Equity investments to total assets 11.0 15.8
PPE to Capital 14.3 12.9
Source: BNR, NBFI Supervision Department
As evident from the above table, insurance companies are wisely diversifying investments. However, going
forward, risks from these investment should be closely monitored since most of these investments remain
connected to real sector and any shocks to the macroeconomic environment is likely to spillover to the
insurance business through their investments. In addition, the insurance sector is interlinked to the banking
sector through the deposits and cash at balance held in banks. Volatilities of deposit rate on the deposits is
likely to impact the sectors assets value and profitability.

NATIONAL BANK OF RWANDA
FINANCIAL STABILITY REPORT
JUNE 2015
28
Reinsurance and actuarial liabilities
Rwanda’s insurance sector’s risk retention decreased. Between June 2014 and June 2015, the risk
retention ratio decreased to 91 percent from 93 percent. BNR is committed to bringing the ratio within the
required bands of 70 percent (minimum) and 90 percent (maximum) (Figure 21).
Figure 22: Retention ratio for insurance sector
As mentioned above, Rwandan ceded premiums to
foreign market were reducing, thus limiting risks
connected to foreign markets. The ceded premium to
foreign markets links the Rwanda’s insurance sector to
foreign markets and ultimately to foreign shocks. For
instance, if reinsurance companies’ face challenges, e.g.,
in terms of low profitability, low capital, strategic risks,
etc., it is likely to spill over to local insurers through claim
settlement.
Source: BNR, NBFI Supervision Department
In FY2014/15, reinsurers’ participation or intervention on claim settlement increased by 57.4
percent. Between June 2014 and June 2015, reinsurers claim settlement increased from FRW 2.3 billion to
FRW 2.4 billion. In the period, outstanding claims to be cleared by reinsurers rose by 70.3 percent. On the
other hand, ceded premiums rose by 5.1 percent (Table 12)
Table 12: Reinsurance performance overview (in billions of FRW unless otherwise indicated)
Indicators Jun -14 Jun-15 % change
Ceded Premium to reinsurers (& coinsurers) 4.2 4.4 5.1%
Reinsurance (& coinsurers) intervention on claims paid 2.3 2.4 2.4%
Outstanding reinsurance/ Co-insurance intervention on claims settlement 3.6 6.2 70.3%
Source: BNR, NBFI Supervision Department

NATIONAL BANK OF RWANDA
FINANCIAL STABILITY REPORT
JUNE 2015
29
Earning and profitability of Insurers
In FY 2014/15, profits of insurance companies increased marginally by 0.5 percent. Between June 2014
and June 2015, net profit increased from FRW 14.5 billion in June 2014 to FRW 14.7 billion. Increased costs
(expenses) explain this small increase in profits. For instance, the combined ratio (claims ratio + expenses ratio)
increased from 81 percent in June 2014 to 84 percent in June 2015, though, still within prudential benchmarks
(≥ 50 percent and ≤ 100 percent).
Table 13: Changes in income and expense items (in millions of FRW unless otherwise indicated)
Indicators Jun-14 Jun-15 % change
Net premiums earned 38.2 40.3 5.5%
Claims incurred (18.7) (21.4) 14.1%
Commissions paid to agents(brokers) (1.3) (1.4) 6.3%
Management expenses (11.4) (11.4) 0.3%
Other Expenses (0.5) (0.5) 3.7%
Total Expenses (34.7) (31.9) -8.0%
Net underwriting profit (loss) 6.3 5.6 -10.8%
Investment income 7.0 7.7 9.1%
Other income 1.9 2.0 8.2%
Extraordinary charges/income - (0.1) -
Net income from operations 15.2 15.3 0.5%
Net profit after tax 14.6 14.7 0.5%
Source: BNR, NBFI Supervision Department
The slight increase in net profit for insurance weighed down ROA and ROE. For example, between
June 2014 and June 2015, the return on equity (ROE) decreased from 16 percent to 13 percent. In the
same period, ROA decreased from 12 percent to 10 percent (Table 14)
Table 14: Selected indicators of earnings and profitability
Indicator (%) Jun-14 Jun-15
ROE 16 13
ROA 12 10
Combined ratio
81 84
Source: BNR, NBFI Supervision Department

NATIONAL BANK OF RWANDA
FINANCIAL STABILITY REPORT
JUNE 2015
30
Insurance Industry liquidity
In FY2014/15, the insurance industry remained
well liquid, capable of supporting business
growth and paying-off liabilities.
Between June 2014 and June 2015, overall liquid
assets to current liabilities ―an indicator of
liquidity― declined from 263 percent in June 2014
to 251 percent in June 2015, well above the
minimum requirement of 120 percent (Figure 22). Source: BNR, NBFI Supervision Department
Performance indicators in Pension funds
As mentioned, the pension is largely made-up of the public pension scheme and about 54 informal private fund
managers. In the past, BNR regulated the public pension scheme only. However, in May 2015, the new pension law
was gazette, giving a broader mandate to BNR to regulate and supervise private pension schemes. Like the
insurance sector, the sector remains at its nascent stage of development. The sector is also equally important to
economic development through mobilizing long-term savings, needed for long-term investment projects.
In FY2014/15, the pension sector assets continued to expand (Table 15). Between June 2014 and June 2015,
the pension sector assets8, increased by 13% (from FRW 455.1 billion to FRW 512.1 billion). In this period, total
contributions increased by 8% (from FRW 55.5 billion to FRW 60 billion); total benefits paid increased by 22% (from
FRW 12.1 billion to FRW 14.8 billion); while investment income increased by 7% (from FRW 22.1billion to FRW 23.4
billion).
Table 15: Public pension sector financial indicators (in billions of FRW unless otherwise indicated)
Indicator Jun-2014
Jun-2015 % Change Jun-15/Jun-14
Total assets 455.1 512.1 13%
Contributions Received 55.5 60.0 8%
Benefits paid 12.1 14.8 22%
Investment income 22.1 23.6 7%
Source: BNR, Non-Bank Financial Institutions Supervision Department
8 Data presented here are for public pension scheme.
Figure 23: Indicator of Insurance sector liquidity

NATIONAL BANK OF RWANDA
FINANCIAL STABILITY REPORT
JUNE 2015
31
4.5. Financial System Infrastructure and Development
Financial system infrastructure plays a critical role in ensuring smooth monetary policy implementation,
financial stability and economic efficiency. The Rwanda payment System has improved in the period under
review as witnessed by the operations of Rwanda Integrated Payments Processing System (RIPPS).
Significant progress has been observed in the retail payment system especially Mobile Financial Services
(MFS) and internet banking services. The credit registry also played a critical role to improve reliable
lending database.
Payment system
The RIPPS continued to operate smoothly in the FY 2014/2015. RIPPS is Rwanda’s integrated payment
system comprising of Real Time Gross Settlement System (RTGS), Automated Clearing House (ACH) and
Central Securities Depository (CSD). Comparing the FY 2013/2014 with the FY 2014/2015 customer
transfers have increased by 7% whereas cheque and interbank transfers have reduced by 5% and 16%
respectively in terms of volume of instructions. In terms of values, customer transfers and cheques have
increased by 18% and 0.2% respectively whereas interbank transfers have reduced by 1%.On CSD side,
equities increased by 89% and 18% in terms of number of securities traded and turnover respectively
between 2013/14 and 2014/15.
Card-Based Payment System Development
Between FY 2013/14 and 2014/15 the number of ATMs increased by 5% (from 343 to 361) and 16.9 % in
volume of transactions (from 6,316,274 to 7,385,971) while the number of POS devices increased by 27%
(from 1,057 to 1,339) and the volume of transactions at merchants level increased tremendously by 123.9%
(from 93,056 to 208,357 transactions) The number of debit cards increased by 23% from 532,157 to
654,349 while the number of credit cards increased by 135% from 1,561 to 3,675 between June 2014 and
June 2015.
In line with the development, it is worth to mention that 97% and 100% respectively for Smartcash
cardholders and Visa cardholders can pay at merchants POS in the country. One additional bank started

NATIONAL BANK OF RWANDA
FINANCIAL STABILITY REPORT
JUNE 2015
32
acquiring cards on POS as well. The international cards issuing and acquiring has also been active. Six
banks issue VISA cards and two banks introduced the issuance of MasterCard cards. Rswitch has been
certified by Union Pay International (UPI) for acquiring, issuing and processing e-commerce transactions.
Mobile Financial Services and Internet banking
With regard to mobile financial services, between 2013/14 and 2014/15 Mobile Payment subscribers and
transactions volume increased respectively by 76.7% ( from 3,826,997 to 6,763,467) and 163% (from
79,577,837 to 209,132,834) while number of Mobile Banking subscribers and transactions volume
increased respectively by 37.6% (from 552,027 to 769,497) and 132.6% (from 3,579,084 to 8,326,257).
With regards to the number of agents for mobile payments all over the country, the number was 35,863 at
the end of June 2015 comparing with 13,671 agents at the end of June 2014. It is important to highlight that
mobile network operators (MNOs) have introduced innovative products that promote financial inclusion and
increase the cashless payments. Those products include mobile saving in partnership with banks, whereby
within two months as end June 2015, 16,000 customers opened bank accounts using mobile payment
channel and saved FRW 277 million. Other products include payments of water bills, tax, fuel at petrol
stations, school fees, etc.
Regarding the usage of internet banking, the number of subscribed remained almost the same with an
increase of 4% (from 32,460 to 33,750) while the number of transactions registered a significant increase of
194% (from 222,867 to 656,309) between the years 2013/14 and 2014/15.
Regional Payment system Integration Initiative
Since December 2014, the Rwanda market has joined the East Africa Payment System but the
usage is still low. Today, only 132 transactions were settled on Rwanda side and 3,473 cross border
mobile transactions amounted at 149 million FRW were carried out between January and June 2015.
In this respect, BNR, together with all stakeholders, is planning to carry out a sensitization campaign in
order to promote the usage of electronic payments and EAPS system.

NATIONAL BANK OF RWANDA
FINANCIAL STABILITY REPORT
JUNE 2015
33
Table 16: EAPS Transactions (December 2014 - July 2015)
Currency Inward messages Outward messages Volume Value Volume Value
FRW 12 181,601,612 20 274,524,012 UGX 16 391,849,474 34 322,630,372
KES 14 22,901,888.64 30 21,896,208 TZS 6 4,400,000 0 0
Source: BNR, Payment System Department
Interoperability
The interoperability policy was adopted by BNR Board of Directors in June 2014. The stakeholders in
payment system area are working together to operationalize the interoperability policy and the following are
the developments:
mVisa product allows mobile banking services interoperability and 3 banks are on this platform.
In addition to cash in/cash out, the following services are provided through mVisa:
1. Pay pension to retired/pensioners;
2. Electronic disbursement of fertilizer subsidies;
3. Refugees are receiving food aid digitized cash disbursements directly to their phones.
Bank Account to e-wallet transfers or vice versa have been enabled by all MNOs and some banks;
ATM cash out service is being offered by MNOs through some banks ATMs;
Integration between UOB and TIGO to facilitate Tigo cash subscribers to have mobile saving accounts;
One MNO and one bank are currently integrated to facilitate account-to-mobile and mobile-to-account
transactions between different customers’ accounts. Other MNOs and some financial institutions are in
process of joining as well.
Cheque Truncation system (CTS)
The National Bank of Rwanda has embarked on the implementation of cheque truncation system in October
2014, and the system installation will be finalized by end of 2015.
The system is expected to speed up cheque exchange between banks while also reducing errors.

NATIONAL BANK OF RWANDA
FINANCIAL STABILITY REPORT
JUNE 2015
34
Credit Reference Bureau Usage
The usage of credit information has been increasing. The FY2014/15 saw an upward trend of the usage of
credit information provided by the private credit bureau as the number of data counts (searches of credit
information in credit bureau database) rose by 11.29 percent from 37,054 in June 2014 to 41,236 in June
2015. However, the number of data hits (data found compared to the searches made in credit bureau
database) decreased by 20 percent from 33,078 in June 2014 to 26,460 in June 2015. This reduction was
caused by the change of IT system of the credit information bureau in course of rebranding to TransUnion in
May-June 2015.
The information provided by credit reference bureau is continuously enhanced. The credit reference
bureau has designed and implemented the credit score which is now accessed online by all subscribers. The
credit score maps the credit risk and uses past credit information to scrutinize the repayment position of a
borrower.
The number of individuals and corporates listed in the private credit bureau increased from 1,480,403 in
December 2014 to 1,528,611 in May 2015 and the coverage improved from 22.6 percent in December 2014 to
23.06 percent of adult population in May 2015.

NATIONAL BANK OF RWANDA
FINANCIAL STABILITY REPORT
JUNE 2015
B
V. Conclusion
Rwanda’s macroeconomic environment remains conducive for financial sector growth. The strong
economic growth creates investment opportunities for banks, and increases the ability of households and
companies to service their loans (hence lower NPLs). The low and stable inflation is an incentive for long-
term investment, by households, companies and banks. The pace of exchange rate pressures experienced
since first half of 2015 started slowing down in third quarter of 2015. This generally stable macroeconomic
environment and strong micro prudential supervisory activities of BNR, explains why Rwandan financial
system remains sound and stable. In FY2014/15, Rwanda’s financial sector remained sound, well
capitalized, with adequate liquidity and quality of assets improved. Despite this financial health status, risks
from lackluster global economic growth and related falling commodity prices are worth monitoring. Further
still, long-term structural bottlenecks in Rwandan financial system still remain. These include: concentrated
lending in some sector, Banks’ high dependence on short-term deposits and; high interest rate spreads.
We note that strategies to address some of these structural bottlenecks are implemented under Rwanda’s
broad second financial Sector Development Program (FSDP-2). Based on findings of this FSR, the BNR
commits to address some challenges identified in this report through the following actions:
• Close monitoring of the mortgage sector performance: This will include formulating and monitoring
real estate price index.
• Continue monitoring assets quality of MFIs especially Umurenge SACCOs.
• Close monitoring of private insurers: encouraging them to enhance their pricing mechanisms.
• Continuous engagement & monitoring of large depositors. To avoid systemic liquidity issues: and
price distortions.
• Make specific monitoring of institutional FX exposure.
To advance financial depth, through implementing the second Financial Sector Development Program,
BNR will continue to partner with other institutions to advance financial inclusion, broaden financial literacy
programs to reach more people, strengthen the legal and regulatory environment for financial sector
development.
35
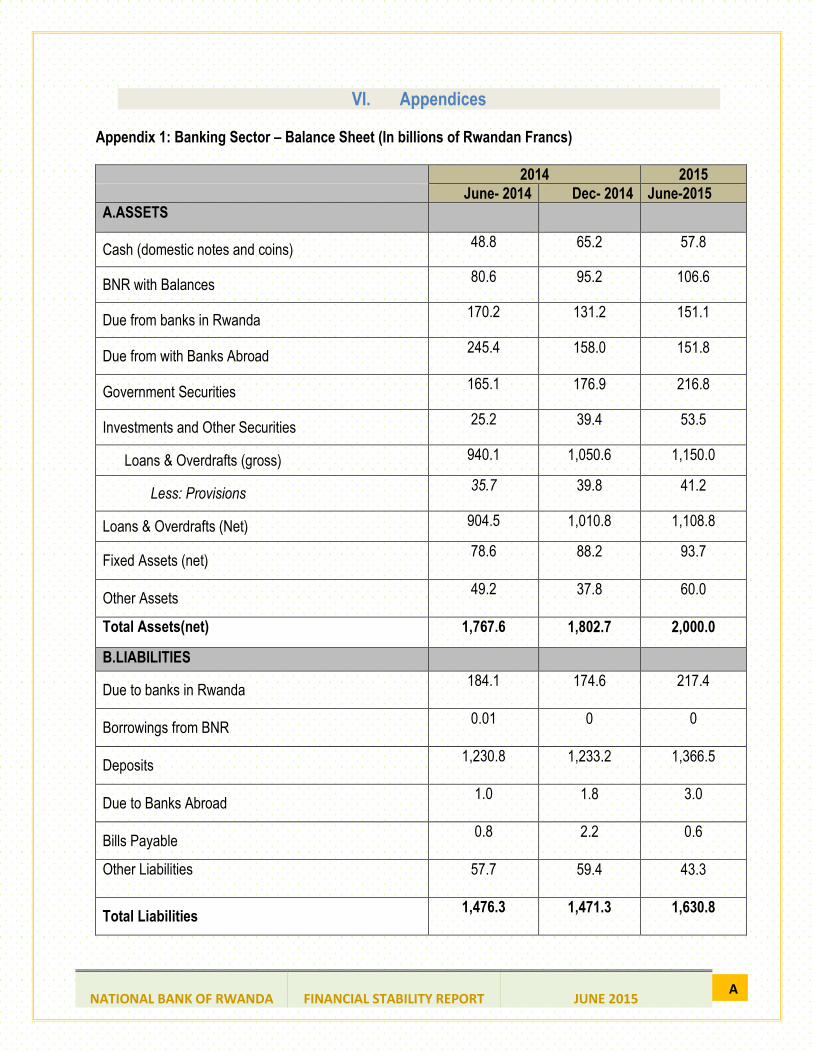
NATIONAL BANK OF RWANDA
FINANCIAL STABILITY REPORT
JUNE 2015
A
VI. Appendices
Appendix 1: Banking Sector – Balance Sheet (In billions of Rwandan Francs)
2014 2015
June- 2014 Dec- 2014 June-2015
A.ASSETS
Cash (domestic notes and coins) 48.8 65.2
57.8
BNR with Balances 80.6 95.2
106.6
Due from banks in Rwanda
170.2 131.2
151.1
Due from with Banks Abroad
245.4 158.0
151.8
Government Securities
165.1 176.9
216.8
Investments and Other Securities 25.2 39.4
53.5
Loans & Overdrafts (gross) 940.1 1,050.6
1,150.0
Less: Provisions 35.7 39.8
41.2
Loans & Overdrafts (Net) 904.5 1,010.8
1,108.8
Fixed Assets (net) 78.6 88.2
93.7
Other Assets
49.2 37.8
60.0
Total Assets(net) 1,767.6 1,802.7
2,000.0
B.LIABILITIES
Due to banks in Rwanda 184.1 174.6
217.4
Borrowings from BNR 0.01 0
0
Deposits 1,230.8 1,233.2
1,366.5
Due to Banks Abroad
1.0 1.8
3.0
Bills Payable
0.8 2.2 0.6
Other Liabilities 57.7 59.4 43.3
Total Liabilities
1,476.3 1,471.3
1,630.8

NATIONAL BANK OF RWANDA
FINANCIAL STABILITY REPORT
JUNE 2015
B
2014 2015
June- 2014 Dec- 2014 June-2015
C. CAPITAL
Paid-up-Capital 116.7 135.8
160.0
Share Premium
33.3 33.5
33.0
Retained Reserves
17.8 23.0
24.4
Other Reserves/Subordinated Debt
106.2 105.4 118.8
Profit/loss
17.3 33.8
23.6
Total Shareholders’ funds
291.3 331.4
359.9
Total equity and liabilities
1,767.6 1,802.7
2,000.0
D. OFF BALANCE SHEET ITEMS
Guarantees and Performance Bonds 680.9
620.3
790.5
Unused Loans/Overdrafts commitment
92.6
93.3
125.0
Other off balance sheet items
183.5
195.9
213.3
Total
957.0
909.5
1,128.8
Source: BNR, Bank Supervision Department

NATIONAL BANK OF RWANDA
FINANCIAL STABILITY REPORT
JUNE 2015
C
Appendix 2: Banking Sector – Income Statement (In billions of Rwandan Francs)
2014 2015
June- 2014 Dec- 2014 June-2015
A.INCOME
Interest Income/ Advances 76.9 160.8
87.9
Interest Income/ Government Securities 5.1
10.9
5.5
Interest Income on placement 4.5
8.7
4.4
Commissions 14.5
28.5
15.3
Foreign Exchange Income 11.4
21.1
10.9
Other Income 15.5
32.7
20.3
Total Income 127.9
262.5
145.0
B.EXPENSES
Interest Expense – Deposits 19.2 40.6
20.3
Other Interest Expenses 8.3
15.0
8.0
Provisions for Bad Debts 14.4
30.3
19.0
Salaries, Wages, staff costs 29.3 61.0
31.6
Premises, Depreciation, Transport 11.3 24.0
12.5
Other Expenses 21.8 44.6 22.5
Total Expenses 104.3 215.6
114.0
Net Profit Before Tax 23.6 46.9
31.0
Corporation Tax 6.3 13.2
7.4
Net Profit After Tax 17.3 33.8
23.6
Source: BNR, Bank Supervision Department

NATIONAL BANK OF RWANDA
FINANCIAL STABILITY REPORT
JUNE 2015
D
Appendix 3: Banking Sector – Financial Soundness Indicators
PERFORMANCE INDICATORS
June- 2014 Dec- 2014 June-2015
GROWTH RATES (Quarter-on-Quarter)
Total Assets 12.4% 0.8%
7.3%
Total loans
3.7% 6.2%
5.0%
Deposits
16.3% -0.8%
8.0%
Due from banks in Rwanda
73.0% -11.3%
13.4%
Due from banks abroad
38.8% -19.6%
8.4%
Government securities
2.7% 2.1%
18.1%
MEASURES OF CAPITAL ADEQUACY/ STANDARD RATES
Core Capital / RWA (MIN 10%) 21.2% 21.3% 21.6%
Total Qualifying Capital / RWA (MIN 15%) 23.6% 24.0% 24.3%
Off Balance Sheet Items / Total Qualifying Capital 379.4% 327.3% 352.5%
Insider Loans / Core Capital (MAX 25%) 4.3% 3.4% 2.8%
NPLs – Provisions / Core Capital 15.7% 12.2% 13.6%
MEASURES OF ASSET QUALITY
NPLs / Gross Loans 6.6% 6.0%
5.9%
NPLs net of interests/Gross loans
5.5% 5.1%
4.9%
Provisions / NPLs
50.0% 56.9%
51.5%
Earning Assets / Total Asset
80.6% 93.1%
81.8%
Fixed Assets / Core Capital
34.6% 35.8%
33.0%
Large Exposures / Gross Loans
15.8% 17.7%
22.5%

NATIONAL BANK OF RWANDA
FINANCIAL STABILITY REPORT
JUNE 2015
E
PERFORMANCE INDICATORS
June- 2014 Dec- 2014 June-2015
MEASURES OF EARNINGS (ANNUALISED)
Return on Average Assets 2.1% 1.9%
2.4%
Return on Average Equity
12.1% 10.5%
13.1%
Net Interest Margin
8.7% 7.9%
8.9%
Yield on Advances
16.6% 15.7%
15.7%
Cost of Deposits
3.4% 3.3%
3.1%
Cost to Income
81.5% 82.1% 78.6%
Overhead to Income 48.8% 49.4% 46.0%
MEASURES OF LIQUIDITY
Short term Gap 11.0% 5.2% 11.6%
Liquid Assets / Total Deposits (MIN 20%) 51.4% 48.7%
49.5%
Interbank Borrowings / Total Deposits 15.0%
14.2%
15.9%
BNR Borrowings / Total Deposits 0.1%
0.0%
0.0%
Gross Loans / Total Deposits 76.4%
85.2% 84.2%
MEASURES OF MARKET SENSITIVITY
Forex Exposure / Core Capital -1.5% -1.8% -7.1%
Forex Loans / Forex Deposits 12.7% 29.5% 32.6%
Forex Assets / Forex Liabilities 84.8% 84.7% 82.1%
Source: BNR, Bank Supervision Department

NATIONAL BANK OF RWANDA
FINANCIAL STABILITY REPORT
JUNE 2015
F
Appendix 4: Banking Sector – EAC Comparison Key Performance Indicators (In %)
Period Indicator Burundi Kenya Rwanda Tanzania Uganda
Jun-15
CAR (Capital adequacy ratio) 19.5 18.9 24.3 17.7 21.3
Total capital to Total Assets 14.5 15.2 18.0 11.2 12.7
Liquid Assets to Total Assets 31.7 32.2 33.8 30.4 31.1
Liquid Assets to Total Deposits 52.7 44.7 49.5 42.1 46.4
Loans to Deposits 87.7 83.5 84.2 76.2 63.8
ROA 8.1 3.3 2.4 2.9 3.8
ROE 1.2 28.3 13.1 15.1 24.6
NPL ratio 13.3 5.7 5.9 6.7 4.0
Earning Asset to Total Assets 68.2 87.5 81.8 78.7 69.5
Dec-14
CAR (Capital adequacy ratio) 17.3 19.2 24.2 17.8 22.2
Total capital to Total Assets 13.4 15.6 18.3 11.3 16.3
Liquid Assets to Total Assets 23 32.7 33.2 30.8 29.7
Liquid Assets to Total Deposits 54.8 45.2 48.7 41.8 44.0
Loans to Deposits 80.5 83.7 85.2 74.3 71.4
ROA 1.2 3.4 1.9 2.7 2.6
ROE 7.8 26.6 10.8 13.9 16.1
NPL ratio 10.9 5.4 6.0 6.6 4.1
Earning Asset to Total Assets 66.5 88.2 93.1 71.5
Jun-14
CAR (Capital adequacy ratio) 21.3 17.6 23.6 17.8 22.8
Total capital to Total Assets 14 14.7 14.3 11.1 15.8
Liquid Assets to Total Assets 34.7 32.3 37.7 31.5 30.9
Liquid Assets to Total Deposits 52.3 44.4 54.2 42.6 46.5
Loans to Deposits 73.1 82.6 76.4 73.5 70.8
ROA 0.1 3.7 2.1 2.9 2.1
ROE 1.1 30.9 12.1 15.5 12.8
NPL ratio 12.7 5.7 6.6 8.2 5.8
Earning Asset to Total Assets 66 88.6 80.6 80 68.9
Source: BNR, Financial Stability Directorate

NATIONAL BANK OF RWANDA
FINANCIAL STABILITY REPORT
JUNE 2015
G
Appendix 5: Insurance Sector – Balance Sheet (In billions of Rwandan Francs)
June- 2014 Dec- 2014 June-2015
A. ASSETS
Cash and deposits in banks 127.0 121.3
132.1
Loans and receivables 19.1 23.0
30.9
Investment in securities/equities 31.6 48.6
49.5
Investments in affiliates - 0.4
-
Investment in property 34.3 39.3
42.9
Property and equipment 26.6 31.4
28.7
Intangible assets 0.4 0.8
0.9
Other assets 8.2 7.3
10.6
Total assets 247.2 272.0
295.7
B. LIABILITIES
Unearned premiums 14.7 13.8
17.0
Unexpired risk provision 0.1 0.1
0.5
Claims reported outstanding 12.8 18.5
15.1
IBNR 2.1 1.9
2.1
Other Provisions (+actuarial / Mathematical) 18.4 23.1
24.3
Technical provisions 51.1 57.4
59.0
Borrowings - 0.0 0.0
Due to parent/affiliates companies 0.1 0.3
0.6
Dividend Payable 0.0 0.0 0.0
Other liabilities 15.5 19.1
17.0
Total liabilities 66.8 74.1
76.6
A. CAPITAL AND RESERVES -
Paid up capital 18.0 18.9
23.1
Share premium 3.1 2.0
2.0
Retained earnings 124.7 111.6
154.5
Other reserves 25.0 41.1
14.7
Profit(loss) for the period 9.8 24.4
24.7
Total capital and reserves 180.5 197.9
219.1
D. TOTAL LIABILITIES AND EQUITY 247.2 272.0
295.7
Source: BNR, Non- Bank Financial Institution Supervision Department

NATIONAL BANK OF RWANDA
FINANCIAL STABILITY REPORT
JUNE 2015
H
Appendix 6: Insurance Sector – Income Statement (In billions of Rwandan Francs)
2014 2015
June- 2014 Dec- 2014 June-2015
INCOME
Gross premium written net of cancelation 44.9 82.8 46.9
Less: premium ceded to reinsurers (& coinsurers) (4.2) (8.6) (4.4)
Net premiums written 40.7 74.2 42.5
Variations in unearned premiums (2.5) (1.1) (2.2)
Net premiums earned 38.2 73.1
40.3
EXPENSES
Claims incurred (18.7) (41.4)
(21.4)
Commissions paid to agents(brokers) (1.3) (6.3)
(1.4)
Management expenses (11.4) (22.6)
(11.4)
Other Expenses (0.5) (1.1)
(0.5)
Total Expenses (31.9) (71.4)
(34.7)
Net underwriting profit(loss) 6.3 1.7 5.6
OTHER REVENUES
Investment income 7.0 34.3
7.7
Other income 1.9 5.7
2.0
Finance costs (0.0) (0.0) -
Extraordinary charges/income - - 0.0
Net income from operations 15.2 41.4
15.3
Provision for tax (income tax expenses) (0.5) (0.3)
(0.5)
NET INCOME AFTER TAXES 14.6 41.1
14.7
Source: BNR, Non- Bank Financial Institution Supervision Department

NATIONAL BANK OF RWANDA
FINANCIAL STABILITY REPORT
JUNE 2015
I
Appendix 7: Insurance Sector – Financial Soundness Indicators (FSIs)
INDICATORS June- 2014 Dec- 2014 June-2015
CAPITAL ADEQUACY
Solvency coverage ratio 215% 312%
282%
Net premium to Capital 23% 38.7%
19.7%
Capital to total assets 73% 75.1%
73.9%
Capital to Technical reserves (MAX 100%) 353% 393%
370%
ASSET QUALITY
(Real estate+ unquoted equities+ debtors) to total assets (MAX 30%)
34% 41%
42%
Loans & Receivables to (Gross premium+ reinsurance recoveries)
43% 26%
65%
Equities to total assets (MAX 30%) 13% 19%
17%
REINSURANCE AND ACTUARIAL ISSUES
Risk retention ratio (MAX 90%-MIN 70%) 93% 89%
91%
Net technical reserves to average of net claims paid in last three years
273% 128%
268%
Net technical reserves to average of net premium (last 3 years) 117% 87%
126%
EARNINGS AND PROFITABILITY
Loss ratio (net claims to net premium) 49% 52%
54%
Expense ratio (Expense to net premium) 33% 39%
32%
Combined ratio=loss ratio+ expense ratio 82% 91%
85%
Investment income to net premium 18% 45%
19%
Investment income to investment assets 4% 17%
3%
Return on equity (ROE) 8% 22%
7%
LIQUIDITY
Liquid assets to current liabilities (MIN 120%) 263% 272%
251%

NATIONAL BANK OF RWANDA
FINANCIAL STABILITY REPORT
JUNE 2015
J
Source: BNR, Non- Bank Financial Institution Supervision Department
Appendix 8: Microfinance Sector – Balance Sheet (In billions of Rwandan Francs)
2014 2015
June- 2014 Dec- 2014 June-2015
A. ASSETS
Cash in Vaults 3.3 2.5
4.4
Cash in Banks 50.0 52.7
71.5
Treasury Bills& Placements 0.1 0.1
0.1
Loan Portfolio (Net of Provisions) 78.0 86.8
93.6
Gross Loans 81.2 90.0
97.2
Non-Performing Loans 6.2 6.3
7.2
Provisions 3.2 3.1
3.6
Other Assets 15.9 17.2
17.8
Total assets 147.4 159.3
187.5
B. LIABILITIES
Total Deposits 82.2 86.1
104.9
Current Accounts 62.0 63.6
79.7
Saving Accounts 14.0 17.6
19.8
Short Term Deposits 2.6 3.4
5.1
Long Term Deposits 3.5 1.5
0.3
Borrowings& Short Term Liabilities 11.7 13.6
14.1
Other Liabilities 6.5 6.8
9.6
Total Liabilities 100.4 106.5
128.7
EQUITY
Earnings 9.1 11.9
13.7
Retained Earnings/Accumulated Losses 6.5 6.9
10.3
Net Profit/Loss of Period +/- (From January) 2.6 5.0
3.4
Paid up Capital 20.7 22.3
23.5
Other Equity 17.1 18.7
21.7
Total Equity 47.0 52.8
58.8
TOTAL LIABILITIES& EQUITY 147.4 159.3
187.5
Source: BNR, Microfinance Institutions Supervision Department

NATIONAL BANK OF RWANDA
FINANCIAL STABILITY REPORT
JUNE 2015
K
Appendix 9: Microfinance Sector – Income Statement (In billions of Rwandan Francs)
2014 2015
June- 2014 Dec- 2014 June -2015
Financial Revenue 13.3 28.7
16.2
Financial Expenses 0.8 2.1
1.3
Net Financial Income before Provisions 12.4 26.6
14.9
Net Provision Expenses/Gains (1.1) (2.2)
(1.0)
Financial Revenue (After Net Provisions) 11.3 24.5
13.9
Operating Expenses 9.1 20.0
10.6
Personnel Expenses 5.2 10.8
6.0
Net Operating Income 2.3 4.6
3.4
Net Non-Operating Income/Expense (0.1) (0.3)
(0.0)
Net Income (Before Taxes& Donations) 2.2 4.3
3.3
Net Income (After Taxes & Before Donations) 2.1 4.1
3.2
Donations 0.6 0.9
0.2
Net Income after Taxes and after Donations 2.6 5.0
3.4
Source: BNR, Microfinance Institutions Supervision Department