Annual Financial Report - Microsoft
33
Annual Financial Report for the year ended 30 June 2013 Committee for Economic Development of Australia ABN 49 008 600 922
Transcript of Annual Financial Report - Microsoft
Annual Financial
Report for the year ended 30 June 2013
Committee for Economic
Development of Australia ABN 49 008 600 922

Page 2
Contents
Directors' Report ........................................................................................... 1
Statement of Profit or Loss and Other Comprehensive Income .................... 5
Statement of Financial Position .................................................................... 6
Statement of Changes in Equity ................................................................... 7
Statement of Cash Flows .............................................................................. 8
Notes to the Financial Statements ................................................................ 9
Directors' Declaration ................................................................................. 27
Auditor's Report .......................................................................................... 28

Committee for Economic Development of Australia
ABN 49 008 600 922
Page 1
Directors’ Report
Your Directors have pleasure in presenting their report on the Company for the financial year ended 30 June 2013.
Directors The names of the Directors in office at any time during, or since the end of, the year are:
G.D. Allen AM Chairman S.P Martin Chief Executive R. Black R.R. Caplan J.K. Edwards I.N. Ferres M. O’Loughlin AM Appointed 20-11-2012 S. Pitkin I.D. Satchwell C. Sinclair Appointed 20-11-2012 I.F Stirling A.J. Tobin G. Withers AO L. Wood A.C. Sherry AO Resigned 23-07-2012 Directors have been in office since the start of the financial year to the date of this report unless otherwise stated.
The names of the main office bearers at the date of this report are: National Chairman, Board of Directors G.D. Allen AM
Company Secretary The following person held the position of company secretary at the date of the report:
D.J. Kelly – Bachelor of Business (Accounting) and Fellow, Certified Practicing Accountant. Mr Kelly has had over 20 years experience in accounting within different organisations such as not for profit, commercial cleaning, import/wholesale, forestry and IT. Mr Kelly was appointed Company Secretary on 12 November 2008.
Principal Activities The company’s principal activity is as an independent, apolitical organisation made up of business leaders, academics and others who have an interest in, and commitment to, Australia’s economic and social development. CEDA undertakes objective research and discussion into issues affecting Australia’s growth. While CEDA emphasises productivity and efficiency issues, which are vital for our future development, it also recognises the need to consider the equity dimensions of government policy.
CEDA’s short and long term objectives remain the achievement of better policy outcomes for the Australian populat ion through a range of economic research and advocacy. To achieve these objectives the entity strives to attract and retain quality staff who can work in partnership with the Directors, Board of Governors and Trustees in support of CEDA’s projects and other initiatives. Staff strive to consistently meet best practice in all that they do and provide clear expectations of professional accountabilities and responsibilities to all stakeholders. KPI’s set aim to ensure goal congruence with the entity’s objectives and are measured against audited results.

Committee for Economic Development of Australia
ABN 49 008 600 922
Page 2
Directors’ Report Information on Directors:
Geoffrey D. Allen AM - National President and Chairman of the Board, CEDA
- Director, ACIL Allen Consulting P/L - Chairman, Australian Centre for Corporate Public Affairs - Director, European Centre for Public Affairs - Chairman, Australian Statistical Advisory Council - Member, Advisory Board, George Washington University Institute for
Corporate Social Responsibility - Asian Regional Editor, Journal of Public Affairs - Board, University of Chester, International Centre for Corporate and Public
Affairs Research.
Stephen P. Martin - Chief Executive, CEDA
- Member, Board of Governors, Global Science and Technology Forum, Singapore
- Visiting Professor, Sydney Business School, University of Wollongong - Patron, Children’s Tumour Foundation
Rufus Black - Master, Ormond College, The University of Melbourne
- Chairman, Teach for Australia - Board Member, Teach for All Inc (The Global Network for Expanding
Educational Opportunity. New York) - Board Member, Corrs Chambers Westgarth Lawyers - Chair, Human Research Ethics Committee, Walter and Eliza Hall Institute - Member, Advisory Board, McDonald Centre for Theology, Ethics and Public
Life in Oxford - Principal Fellow, Melbourne Business School - Principal Fellow in Philosophy, University of Melbourne
Russell R. Caplan - Director, Orica Limited
- Director, Aurizon Limited - Director, St Kilda Football Club - Chairman, Melbourne and Olympic Parks Trust - Chairman, CRC CARE Pty Ltd - Trustee, Australian Cancer Research Foundation
John K. Edwards - Board Member, Reserve Bank of Australia
- Member, National Workforce and Productivity Agency - Visiting Fellow, Lowy Institute for International Policy - Adjunct Professor, University of Sydney Business School - Adjunct Professor, John Curtin Institute of Public Policy, Curtin Business
School, Curtin University Ian N. Ferres - Consultant, TressCox Lawyers
- Chairman, Australian Healthcare Investment Company Ltd - Chairman, Medica Radiology & Nuclear Medicine Pty Ltd - Chairman, TDI Pty Ltd - Director, Australian Unity Limited and Contango MicroCap Limited.
Mary Ann O’Loughlin AM - Executive Councillor and Head of Secretariat, COAG Reform Council
- National Fellow, Institute of Public Administration Australia

Committee for Economic Development of Australia
ABN 49 008 600 922
Page 3
Directors’ Report
Information on Directors (continued): Sally Pitkin - Deputy Chairman, Export Finance and Insurance Corporation
- Director, Super Retail Group Limited - Member, Queensland Competition Authority - Director, Billabong International Limited - Deputy President, Queensland Division, Australian Institute of Company
Directors - Adjunct Professor, University of Queensland Business School
Ian D. Satchwell - Director, International Mining for Development Centre Catherine Sinclair - Director, The Consultancy Bureau Pty Ltd
- Chair, Residential Tenancies Authority (RTA) - Director, and Chair of Audit Committee, Army & Air Force Canteen Service
(AAFCANS) - Councillor, The Royal National Agricultural and Industrial Association of
Queensland
Ian F. Stirling - Chief Executive Officer, ElectraNet Pty Ltd - Chairman, Energy Supply Association of Australia - Deputy Chairman, Business SA (The Chamber of Commerce and Industry in
SA) - Board Member, Botanic Gardens of Adelaide
Anthony J. Tobin - Consultant, Gilbert + Tobin, Lawyers
- Director, TT Line Company Pty Ltd - Member of Council, University of Technology Sydney
Glenn A. Withers AO - Professor of Economics, Australian National University
- Chair, Advisory Board, Blended Learning International - Strategic Adviser, Commonwealth Department of Finance and Deregulation - ANZSOG Fellow
Lynn Wood - Chairman, Financial Reporting Council
- Chairman, Good Beginnings Australia - Director, GPT Funds Management Ltd - Member, External Reporting Board (NZ) - Syndicate Chairman, CEO Institute
Ann C. Sherry AO - Chief Executive Officer, Carnival Australia
- Director, Wilson Investment Group - Director & Chair, Public Service Commission of Queensland - Director, Jawun – Indigenous Corporate Partnerships - Director, Australian Indigenous Education Foundation (AIEF) - Director, Board Member, Council of the Australian National Maritime
Museum - Board Member, Australian Sports Commission - Director, Advocacy Services Australia (ASA) Limited - Director, ING Direct - Deputy Chair, Tourism & Transport Forum Australia Ltd - Member, Visa Senior Client Council - Member, Independent Panel – National Disability Long-term Care and
Support scheme
Committee for Economic Development of Australia
ABN 49 008 600 922
Page 4
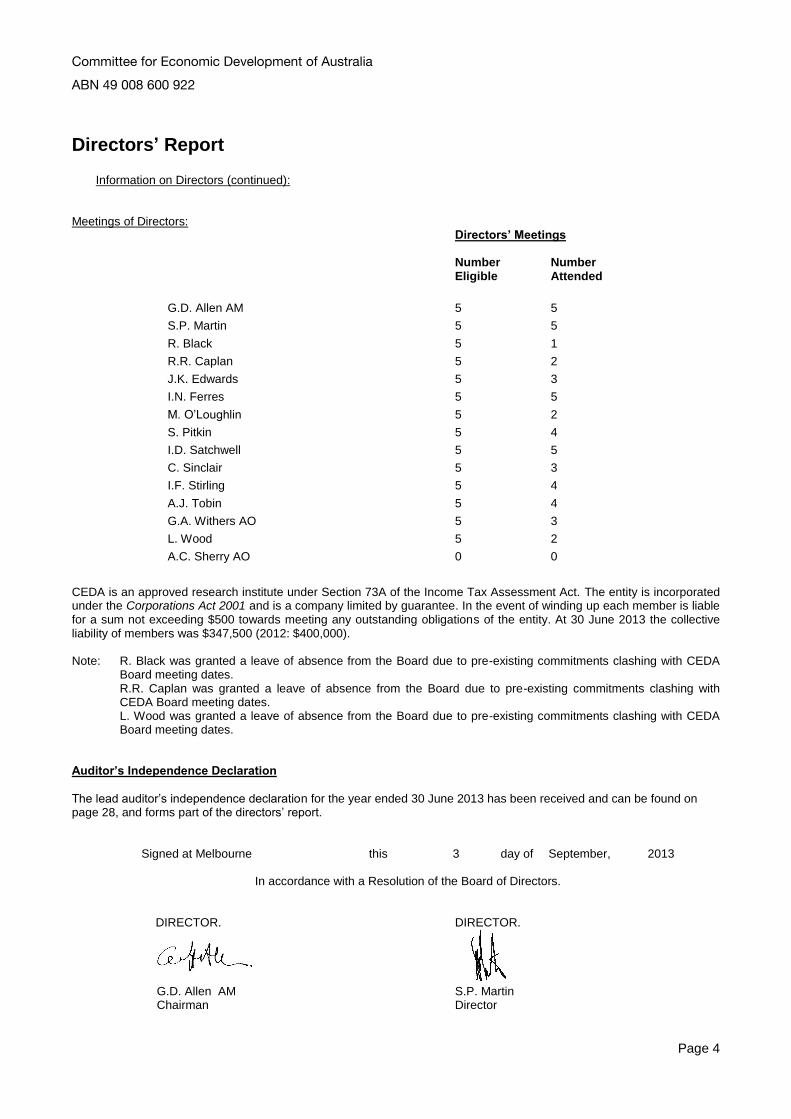
Directors’ Report
Information on Directors (continued): Meetings of Directors:
Directors’ Meetings
Number Number Eligible Attended
G.D. Allen AM 5 5
S.P. Martin 5 5
R. Black 5 1
R.R. Caplan 5 2
J.K. Edwards 5 3
I.N. Ferres 5 5
M. O’Loughlin 5 2
S. Pitkin 5 4
I.D. Satchwell 5 5
C. Sinclair 5 3
I.F. Stirling 5 4
A.J. Tobin 5 4
G.A. Withers AO 5 3
L. Wood 5 2
A.C. Sherry AO 0 0
CEDA is an approved research institute under Section 73A of the Income Tax Assessment Act. The entity is incorporated under the Corporations Act 2001 and is a company limited by guarantee. In the event of winding up each member is liable for a sum not exceeding $500 towards meeting any outstanding obligations of the entity. At 30 June 2013 the collective liability of members was $347,500 (2012: $400,000). Note: R. Black was granted a leave of absence from the Board due to pre-existing commitments clashing with CEDA
Board meeting dates. R.R. Caplan was granted a leave of absence from the Board due to pre-existing commitments clashing with CEDA Board meeting dates. L. Wood was granted a leave of absence from the Board due to pre-existing commitments clashing with CEDA Board meeting dates.
Auditor’s Independence Declaration
The lead auditor’s independence declaration for the year ended 30 June 2013 has been received and can be found on page 28, and forms part of the directors’ report.
Signed at Melbourne this 3 day of September, 2013
In accordance with a Resolution of the Board of Directors.
DIRECTOR. DIRECTOR. G.D. Allen AM S.P. Martin Chairman Director

Committee for Economic Development of Australia
ABN 49 008 600 922
The accompanying notes form part of these Financial Statements. Page 5
Statement of Profit or Loss and Other Comprehensive Income For year ended 30 June 2013
NOTE 2013 2012
$ $
Revenue 2 9,157,731 8,081,729
Depreciation and Amortisation Expense 3 (235,744) (255,210)
Employee Benefits Expense (4,329,988) (3,950,555)
Lease Expense 3 (639,141) (639,494)
Research and Related Conferences
and Briefings Expense (2,326,620) (1,941,785)
Other Operating Expenses (1,202,193) (1,146,594)
Profit / (Loss) Attributable to Entity 424,045 148,091
Other Comprehensive Income - -
Total Comprehensive Income for the Year 424,045 148,091

Committee for Economic Development of Australia
ABN 49 008 600 922
The accompanying notes form part of these Financial Statements. Page 6
Statement of Financial Position As at 30 June 2013
NOTE 2013 2012
$ $
CURRENT ASSETS
Cash and Cash Equivalents 4 3,874,259 3,158,122
Trade and Other Receivables 5 432,074 508,690
Other Current Assets 6 229,126 235,328
TOTAL CURRENT ASSETS 4,535,459 3,902,140
NON CURRENT ASSETS
Plant and Equipment and
Leasehold Improvements 7 550,243 602,970
Intangibles 8 53,409 91,013
TOTAL NON CURRENT ASSETS 603,652 693,983
TOTAL ASSETS 5,139,111 4,596,123
CURRENT LIABILITIES
Trade and Other Payables 9 1,001,206 898,935
Borrowings 12 10,797 36,955
Short - Term Provisions 10 219,666 196,550
Subscriptions and Income in Advance 11 2,137,779 2,132,807
TOTAL CURRENT LIABILITIES 3,369,448 3,265,247
NON CURRENT LIABILITIES
Borrowings 12 - 10,797
Long - Term Provisions 10 300,060 274,521
TOTAL NON CURRENT LIABILITIES 300,060 285,318
TOTAL LIABILITIES 3,669,508 3,550,565
NET ASSETS 1,469,603 1,045,558
EQUITY
Retained Earnings / (Losses) 1,469,603 1,045,558
TOTAL EQUITY 1,469,603 1,045,558

Committee for Economic Development of Australia
ABN 49 008 600 922
The accompanying notes form part of these Financial Statements. Page 7
Statement of Changes in Equity For year ended 30 June 2013
$ $
Retained Total
Earnings Equity
Balance at 1 July 2011 897,467 897,467
Total Comprehensive Income 148,091 148,091
Balance at 30 June 2012 1,045,558 1,045,558
Total Comprehensive Income 424,045 424,045
Balance at 30 June 2013 1,469,603 1,469,603
Committee for Economic Development of Australia
ABN 49 008 600 922
The accompanying notes form part of these Financial Statements. Page 8
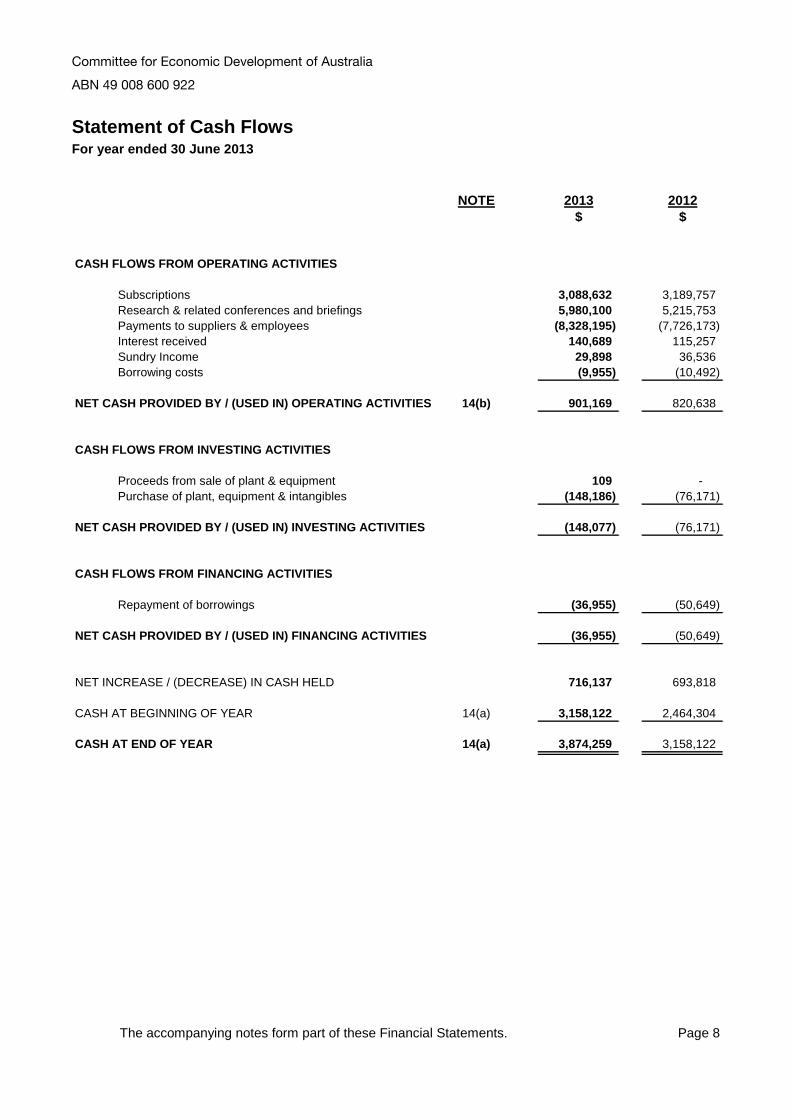
Statement of Cash Flows For year ended 30 June 2013
NOTE 2013 2012
$ $
CASH FLOWS FROM OPERATING ACTIVITIES
Subscriptions 3,088,632 3,189,757
Research & related conferences and briefings 5,980,100 5,215,753
Payments to suppliers & employees (8,328,195) (7,726,173)
Interest received 140,689 115,257
Sundry Income 29,898 36,536
Borrowing costs (9,955) (10,492)
NET CASH PROVIDED BY / (USED IN) OPERATING ACTIVITIES 14(b) 901,169 820,638
CASH FLOWS FROM INVESTING ACTIVITIES
Proceeds from sale of plant & equipment 109 -
Purchase of plant, equipment & intangibles (148,186) (76,171)
NET CASH PROVIDED BY / (USED IN) INVESTING ACTIVITIES (148,077) (76,171)
CASH FLOWS FROM FINANCING ACTIVITIES
Repayment of borrowings (36,955) (50,649)
NET CASH PROVIDED BY / (USED IN) FINANCING ACTIVITIES (36,955) (50,649)
NET INCREASE / (DECREASE) IN CASH HELD 716,137 693,818
CASH AT BEGINNING OF YEAR 14(a) 3,158,122 2,464,304
CASH AT END OF YEAR 14(a) 3,874,259 3,158,122
Committee for Economic Development of Australia
ABN 49 008 600 922
Page 9
Notes to the Financial Statements For year ended 30
June 2013
Note 1 STATEMENT OF SIGNIFICANT ACCOUNTING POLICIES
The financial report is a general purpose financial report that has been prepared in accordance with Australian Accounting Standards, Australian Accounting Interpretations other authoritative pronouncements of the Australian Accounting Standards Board and the Corporations Act 2001. The financial report covers the Committee for Economic Development of Australia as an individual entity. Committee for Economic Development of Australia is a company limited by guarantee, incorporated and domiciled in Australia. A statement of compliance with the International Financial Reporting Standards (IFRS) as issued by the International Accounting Standards Board (IASB) cannot be made due to the entity applying not-for-profit specific requirements contained in the Australian Accounting Standards. The following is a summary of the material accounting policies adopted by the company in the preparation of the financial report.
Basis of Preparation:
The accounting policies set out below have been consistently applied to all years presented. The financial report has been prepared on an accruals basis and is based on historical costs, modified, where applicable, by the measurement at fair value of selected non-current assets, financial assets and financial liabilities.
New, revised or amending Accounting Standards and Interpretations adopted:
The entity has adopted all of the new, revised or amending Accounting Standards and Interpretations issued by the Australian Accounting Standards Board (‘AASB’) that are mandatory for the current reporting period. The adoption of these Accounting Standards and Interpretations did not have any impact on the financial position of the entity. Standards, amendments and interpretations to existing standards that are not yet effective and have not been adopted early by the Group At the date of authorisation of these financial statements, certain new standards, amendments and interpretations to existing standards have been published but are not yet effective, and have not been adopted early by the Company. Management anticipates that all of the relevant pronouncements will be adopted in the Company's accounting policies for the first period beginning after the effective date of the pronouncement. The company is in the process of considering the impact of these new standards, amendments and interpretations.
Accounting Policies: a) Plant and Equipment, Leasehold Improvements Plant and Equipment and Leasehold Improvements are measured on the cost basis less depreciation and impairment losses. The carrying amount of plant and equipment and leasehold improvements is reviewed annually by directors to ensure it is not in excess of the recoverable amount from these assets. The recoverable amount is assessed on the basis of the expected net cash flows that will be received from the assets employment and subsequent disposal. The expected net cash flows have been discounted to their present values in determining recoverable amounts.

Committee for Economic Development of Australia
ABN 49 008 600 922
Page 10
Notes to the Financial Statements For year ended 30
June 2013
a) Plant and Equipment, Leasehold Improvements (Continued)
Depreciation The depreciable amount of all fixed assets including capitalised leased assets, but excluding ordinary plant and equipment, are depreciated on a straight line basis over their useful lives to the company commencing from the time the asset is held ready for use. Any item of less than $1,000 has been allocated into a low value pool. Ordinary plant and equipment is depreciated by the diminishing value method. Leasehold improvements are depreciated over the shorter of either the unexpired period of the lease or the estimated useful lives of the improvements.
The depreciation rates used for each class of depreciable assets are:
Class of Fixed Asset Depreciation Rate Plant and Equipment 20.0% Computer and Associated Equipment 33.3% Leasehold Improvements 20.0% Low Value Pool 37.5% Estimated Make Good Cost 20.0% Software 33.3%
b) Leases
Leases of fixed assets where substantially all the risks and benefits incidental to the ownership of the asset, but not the legal ownership, that are transferred to the company are classified as finance leases. Finance Leases are capitalised by recording an asset and a liability at the lower of the amounts equal to the fair value of the leased property or the present value of the minimum lease payments, including any guaranteed residual values. Lease payments are allocated between the reduction of the lease liability and the lease interest expense for the period. Leased assets are depreciated on a straight line basis over their estimated useful lives where it is likely that the company will obtain ownership of the asset or over the term of the lease. Lease payments for operating leases, where substantially all the risks and benefits remain with the lessor, are charged as expenses in the periods in which they are incurred.
c) Impairment of assets
At each reporting date, the company reviews the carrying value of its tangible and intangible assets to determine whether there is any indication that those assets have been impaired. If such an indication exists, the recoverable amount of the asset, being the higher of the asset’s fair value less costs to sell and value in use, is compared to the asset’s carrying value.
Any excess of the asset’s carrying value over its recoverable amount is expensed to the income statement.
d) Employee Benefits
Provision is made for the company’s liability for employee benefits arising from services rendered by employees to balance date. Employee benefits that are expected to be settled within one year have been measured at the amounts expected to be paid when the liability is settled, plus related on costs. Employee benefits payable later than one year have been measured at the present value of the estimated future cash outflows to be made for those benefits. Those cashflows are discounted using market yields on national government bonds with terms to maturity that match the expected timing of cashflows.

Committee for Economic Development of Australia
ABN 49 008 600 922
Page 11
Notes to the Financial Statements For year ended 30
June 2013
e) Provisions
Provisions are recognized when the company has a legal or constructive obligation, as a result of past events, for which it is probable that an outflow of economic benefits will result and that outflow can be reliably measured.
f) Cash and Cash Equivalents
Cash and cash equivalents includes cash on hand, deposits held at call with banks and other short term highly liquid investments with original maturities of nine months (on average) or less.
g) Revenue
Revenue from the rendering of a service is recognised upon the delivery of the service to members. Revenue from the sale of goods is recognised upon the delivery of goods to customers. Subscription revenue is progressively recognised over the term of the subscription with the unexpired portion treated as Subscriptions Income in Advance.
Interest revenue is recognised using the effective interest rate method, which, for floating rate financial assets, is the rate inherent in the instrument. All revenue is stated net of the amount of goods and services tax (GST).
h) Goods and Services Tax ( GST)
Revenues, expenses and assets are recognized net of the amount of GST, except where the amount of GST incurred is not recoverable from the Australian Tax Office. In these circumstances the GST is recognized as part of the cost of acquisition of the asset or as part of an item of the expense. Receivables and payables in the balance sheet are shown inclusive of GST. Cash flows are presented in the cash flow statement on a gross basis, except for the GST component of investing and financing activities, which are disclosed as operating cash flows.
i) Comparative Figures
Comparative figures have been adjusted to conform to changes in presentation for the current financial year.
j) Financial Instruments Recognition and Initial Measurement Financial instruments, incorporating financial assets and financial liabilities, are recognised when the entity becomes a party to the contractual provisions of the instrument. Financial instruments are initially measured at fair value plus transactions costs where the instrument is not classified as at fair value through profit or loss. Transaction costs related to instruments classified as at fair value through profit or loss are expensed to profit or loss immediately. Financial instruments are classified and measured as set out below.

Committee for Economic Development of Australia
ABN 49 008 600 922
Page 12
Notes to the Financial Statements For year ended 30
June 2013
j) Financial Instruments (Continued) Derecognition Financial assets are derecognised where the contractual rights to receipt of cash flows expires or the asset is transferred to another party whereby the entity is no longer has any significant continuing involvement in the risks and benefits associated with the asset. Financial liabilities are derecognised where the related obligations are either discharged, cancelled or expire. The difference between the carrying value of the financial liability extinguished or transferred to another party and the fair value of consideration paid, including the transfer of non-cash assets or liabilities assumed, is recognised in profit or loss.
Classification and Subsequent Measurement Loans and receivables Loans and receivables are non-derivative financial assets with fixed or determinable payments that are not quoted in an active market and are subsequently measured at amortised cost using the effective interest rate method. Financial Liabilities
Non-derivative financial liabilities (excluding financial guarantees) are subsequently measured at amortised cost using the effective interest rate method.
k) Critical Accounting Estimates and Judgments The directors evaluate estimates and judgments incorporated into the financial report based on historical knowledge and best available current information. Estimates assume a reasonable expectation of future events and are based on current trends and economic data, obtained both externally and within the company. Key Estimates – Impairment
The company assesses impairment at each reporting date by evaluating conditions specific to the company that may lead to impairment of assets. When an impairment trigger exists, the recoverable amount of the asset is determined. Value in use calculations performed in assessing recoverable amounts incorporate a number of key estimates. Key Judgements – Doubtful Debts Provision Based on best available current information and historical knowledge a doubtful debt provision of $20,750 has been made at 30 June 2013.
l) Income Tax The company is exempt from Income Tax. Accordingly no income tax expense, deferred or otherwise, or income tax payable amounts are recorded in the financial statements.
m) Going Concern The Directors have prepared these accounts on a going concern basis for the 2013 financial year.
The financial report was authorised for issue on 3 September 2013 by the Board of Directors.
Committee for Economic Development of Australia
ABN 49 008 600 922
Page 13
Notes to the Financial Statements For year ended 30
June 2013
2013 2012
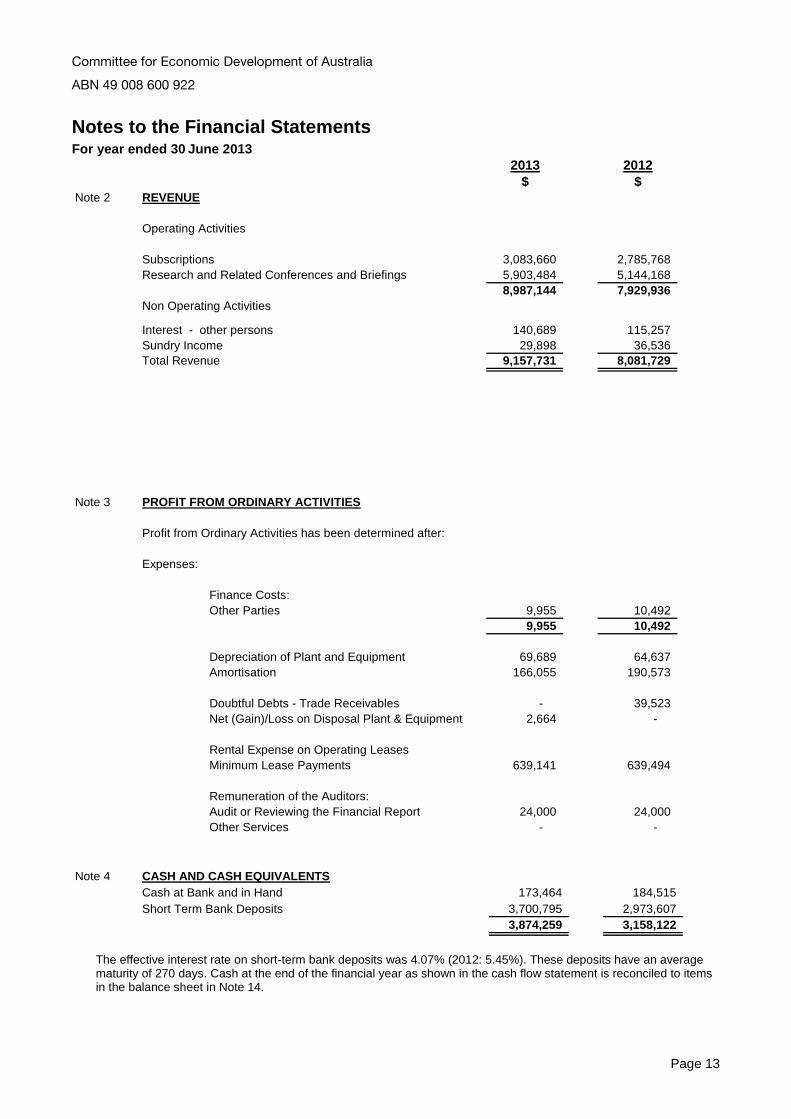
$ $Note 2 REVENUE
Operating Activities
Subscriptions 3,083,660 2,785,768
Research and Related Conferences and Briefings 5,903,484 5,144,168
8,987,144 7,929,936
Non Operating Activities
Interest - other persons 140,689 115,257
Sundry Income 29,898 36,536
Total Revenue 9,157,731 8,081,729
Note 3 PROFIT FROM ORDINARY ACTIVITIES
Profit from Ordinary Activities has been determined after:
Expenses:
Finance Costs:
Other Parties 9,955 10,492
9,955 10,492
Depreciation of Plant and Equipment 69,689 64,637
Amortisation 166,055 190,573
Doubtful Debts - Trade Receivables - 39,523
Net (Gain)/Loss on Disposal Plant & Equipment 2,664 -
Rental Expense on Operating Leases
Minimum Lease Payments 639,141 639,494
Remuneration of the Auditors:
Audit or Reviewing the Financial Report 24,000 24,000
Other Services - -
Note 4 CASH AND CASH EQUIVALENTS
Cash at Bank and in Hand 173,464 184,515
Short Term Bank Deposits 3,700,795 2,973,607
3,874,259 3,158,122
The effective interest rate on short-term bank deposits was 4.07% (2012: 5.45%). These deposits have an average maturity of 270 days. Cash at the end of the financial year as shown in the cash flow statement is reconciled to items in the balance sheet in Note 14.
Committee for Economic Development of Australia
ABN 49 008 600 922
Page 14
Notes to the Financial Statements For year ended 30
June 2013
2013 2012
$ $
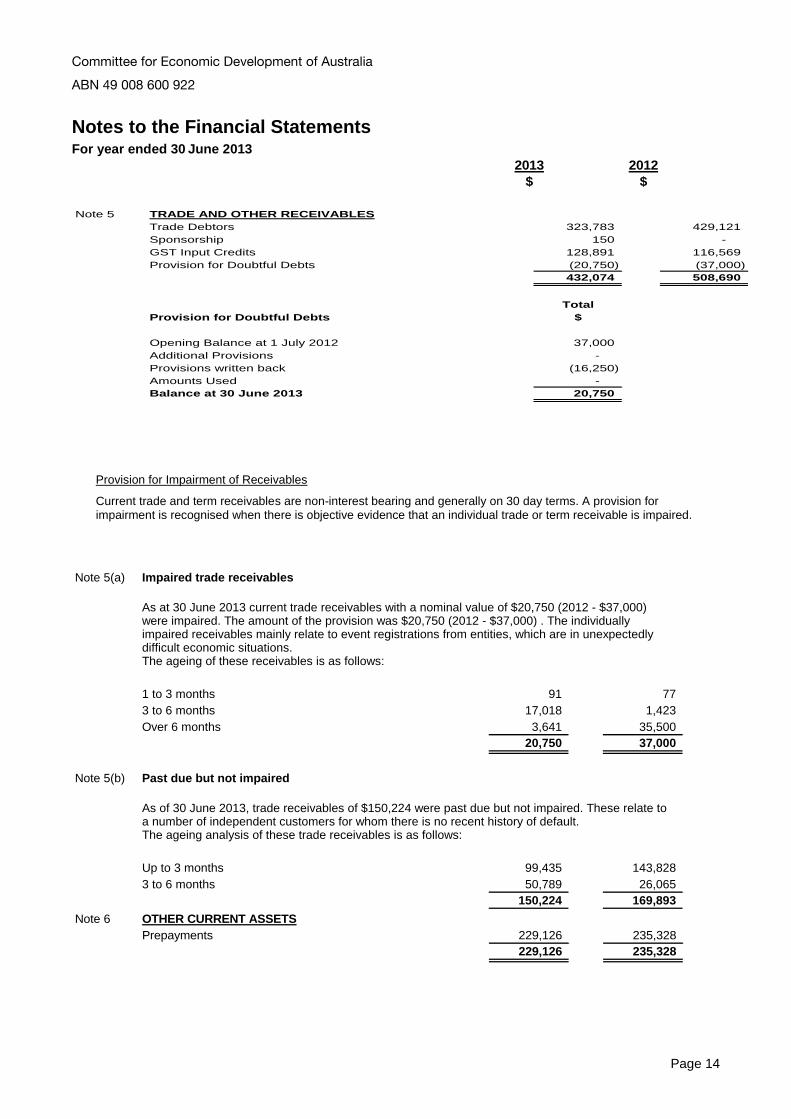
Note 5 TRADE AND OTHER RECEIVABLES
Trade Debtors 323,783 429,121
Sponsorship 150 -
GST Input Credits 128,891 116,569
Provision for Doubtful Debts (20,750) (37,000)
432,074 508,690
Total
Provision for Doubtful Debts $
Opening Balance at 1 July 2012 37,000
Additional Provisions -
Provisions written back (16,250)
Amounts Used -
Balance at 30 June 2013 20,750
Provision for Impairment of Receivables
Current trade and term receivables are non-interest bearing and generally on 30 day terms. A provision for impairment is recognised when there is objective evidence that an individual trade or term receivable is impaired.
Note 5(a) Impaired trade receivables
As at 30 June 2013 current trade receivables with a nominal value of $20,750 (2012 - $37,000) were impaired. The amount of the provision was $20,750 (2012 - $37,000) . The individuallyimpaired receivables mainly relate to event registrations from entities, which are in unexpectedlydifficult economic situations. The ageing of these receivables is as follows:
1 to 3 months 91 77
3 to 6 months 17,018 1,423
Over 6 months 3,641 35,500
20,750 37,000
Note 5(b) Past due but not impaired
As of 30 June 2013, trade receivables of $150,224 were past due but not impaired. These relate toa number of independent customers for whom there is no recent history of default.The ageing analysis of these trade receivables is as follows:
Up to 3 months 99,435 143,828
3 to 6 months 50,789 26,065
150,224 169,893
Note 6 OTHER CURRENT ASSETS
Prepayments 229,126 235,328
229,126 235,328

Committee for Economic Development of Australia
ABN 49 008 600 922
Page 15
Notes to the Financial Statements For year ended 30
June 2013
2013 2012$ $
Note 7 PLANT AND EQUIPMENT, LEASEHOLD IMPROVEMENTS
Plant and Equipment - At Cost 543,704 469,001
Less: Accumulated Depreciation (337,484) (275,912)
TOTAL PLANT & EQUIPMENT 206,220 193,089
Leasehold Improvements & Makegoods 923,460 860,867
Less: Accumulated Depreciation (579,437) (450,986)
TOTAL LEASEHOLD IMPROVEMENTS 344,023 409,881
TOTAL PLANT AND EQUIPMENT,
LEASEHOLD IMPROVEMENT 550,243 602,970
Note 7(a) Movements in Carrying Amounts
Movements in the carrying amounts of each class of non-current asset between the beginning and the end of the
current financial year.
Plant & Leasehold Makegood Makegood Makegood TOTAL
Equipment Improvement Melb Lease Syd Lease Bris Lease
$ $ $ $ $ $
Balance at the beginning of the year 193,089 322,797 47,045 15,539 24,500 602,970 -
Additions 85,593 62,593 - - - 148,186
Assets disposed / scrapped (2,773) - - - - (2,773)
Depreciation and Amortisation Expense (69,689) (90,742) (15,170) (15,539) (7,000) (198,140)
Carrying amount as at 30 June 2013 206,220 294,648 31,875 - 17,500 550,243
The carrying value of assets purchased with Finance Lease is $73,397 ( 2012 carrying value $100,878 )

Committee for Economic Development of Australia
ABN 49 008 600 922
Page 16
Notes to the Financial Statements For year ended 30
June 2013
2013 2012
$ $Note 8 INTANGIBLES
Software 311,441 311,441
Less: Accumulated Amortisation (258,032) (220,428)
53,409 91,013
Note 8(a) Movements in Carrying Amounts
Movements in the carrying amount of intangibles between the beginning and
the end of the current financial year.
TOTAL
$
Balance at the beginning of the year 91,013
Additions -
Amortisation expense (37,604)
Carrying amount as at 30 June 2013 53,409
2013 2012
$ $
Note 9 TRADE AND OTHER PAYABLES
Trade Payables 420,816 366,602
Sundry Payables and Accrued Expenses 310,965 281,639
GST Collected 269,425 250,694
1,001,206 898,935
Note 10 PROVISIONS
Current 219,666 196,550
Non Current 300,060 274,521
519,726 471,071
Employee Make Good Make Good Make Good Total
Benefits Melbourne Sydney Brisbane
Lease Lease Lease
$ $ $ $ $
Opening Balance at 1 July 2012 246,071 100,000 90,000 35,000 471,071
Additional Provisions 300,530 - - - 300,530
Amounts Used (251,875) - - - (251,875)
Balance at 30 June 2013 294,726 100,000 90,000 35,000 519,726

Committee for Economic Development of Australia
ABN 49 008 600 922
Page 17
Notes to the Financial Statements For year ended 30
June 2013
Note 10 PROVISIONS con’t
Make Good Provisions
A provision has been recognised for lease commitments to settle the make good requirement at the conclusion of the lease. The various leases are detailed in Note 12. Provision for Long Term Employee Benefits
A provision has been recognised for non current employee benefits relating to long service leave for employees. In calculating the present value of future cash flows in respect of long service leave, the probability of long service leave being taken is based upon historical data. The measurement and recognition criteria for employee benefits have been included in Note 1 to this report.

Committee for Economic Development of Australia
ABN 49 008 600 922
Page 18
2013 2012
$ $
Note 11 SUBSCRIPTIONS AND INCOME IN ADVANCE
Subscriptions in Advance 1,452,632 1,292,268
Sponsorship & Conference Centre Income in Advance 685,147 840,539
2,137,779 2,132,807
Note 12 CAPITAL AND LEASING COMMITMENTS
a) Finance Lease Commitments
Payable: Minumum Lease Payments
Not later than 12 months 12,845 44,011
Between 12 months and 5 years - 12,845
Greater than 5 years - -
Minimum Lease Payments 12,845 56,856
Less future finance charges (2,048) (9,104)
Present value of minimum lease
payments 10,797 47,752
Leases, of which there is one, is for computer hardware, commencing Nov 2010
and ending Nov 2013. It is a 3 year lease with no residual.
No debt covenants or other such arrangements are in place.
b) Operating Lease and Rental Commitments
Non - cancellable operating leases contracted
for but not capitalised in the Financial Statements.
Payable: Minumum Lease Payments
Not later than 12 months 727,027 501,108
Between 12 months and 5 years 1,880,085 498,015
Greater than 5 years 100,542 -
2,707,654 999,123

Committee for Economic Development of Australia
ABN 49 008 600 922
Page 19
Notes to the Financial Statements For year ended 30
June 2013
Note 12 CAPITAL AND LEASING COMMITMENTS (Continued)
DETAILS OF PROPERTY LEASES i) Melbourne
The lease is a non cancellable lease with a five year term commencing 1 April 2008, with rent payable monthly in advance.
Provision is made within the lease agreement that require the lease payments to be increased at the end of each year by 4%. An option exists to renew the lease at the end of the fifth year for an additional term of three years.
The option to renew for a further 3 years has been exercised. The lease is therefore now extended to 1 April 2016.
ii) Sydney The lease is a non cancellable lease with a six year term commencing 1 January 2013 with rent
payable monthly in advance. Provision is made within the lease agreement that require the lease payments to be increased at
the end of each year by 4%. A new lease was negotiated to enable CEDA to remain in its current Sydney premises. The original
lease commenced in January 2007. iii) Adelaide The lease is a non cancellable lease with a five year term commencing 1
January 2006 with rent
payable monthly in advance. Provision is made within the lease agreement that require the lease payments to be increased at
the end of each year by 4%. An option exists to renew the lease at the end of the five year term for an additional term of five years. The option was exercised in September 2010 and the lease now expires in December 2015.
iv) Brisbane The lease is a non cancellable lease with a five year term commencing 1 January 2011 with rent
payable monthly in advance. Provision is made within the lease agreement that require the lease payments to be increased at the end of each year by 3.75%. There is no option to renew.
v) Perth The lease is a non cancellable lease with a five year term commencing 1
October 2012 with rent
payable monthly in advance. Provision is made within the lease agreement that require the lease payments to be increased at the end of each year by 5%. There is no option to renew.
Note 13 SEGMENT REPORTING
CEDA is an individual entity, Committee for Economic Development of Australia, and operates in one business and geographic segment.

Committee for Economic Development of Australia
ABN 49 008 600 922
Page 20
Notes to the Financial Statements For year ended 30
June 2013
Note 14 CASH FLOW INFORMATION
a) Reconciliation of Cash
Cash at the end of the financial year as shown in the Cash Flow Statement is reconciled to the related items in the Balance Sheet as follows:
2013 2012 $ $
Cash at Bank and in Hand 173,464 184,515 Short term Deposits including accrued interest with Financial Institutions 3,700,795 2,973,607 3,874,259 3,158,122
CEDA has four bank guarantees. The first is for the Sydney office to Permanent Trustee Australia Limited for $172,581 and the second is for the Melbourne office to Enwerd Pty Ltd for $115,907. The third is for the Brisbane office to Charter Hall Property Management for $85,769 and the fourth is for the Perth office to Local Government Superannuation Plan Pty Ltd for $49,863. CEDA has restricted cash totalling the above guarantees secured by the NAB to cover these liabilities.
b) Reconciliation of Cash Flows from Operations to Loss from Ordinary Activities
2013 2012
$ $
Profit / (Loss) from ordinary activities 424,045 148,091
Non - Cash Flows in Profit from Ordinary Activities
Depreciation and amortisation 235,744 255,210
Net Loss on Disposal of Plant & Equipment 2,664 -
Changes in Assets and Liabilities:
Decrease / (Increase) in Trade and Other Receivables 76,616 111,107
Decrease / (Increase) in Prepayments 6,202 (74,742)
Increase / (Decrease) in Trade and Other Payables 102,271 (70,990)
Increase / (Decrease) in Subs and Income in Advance 4,972 403,989
Increase / (Decrease) in Provisions 48,655 47,973
CASH FLOWS FROM OPERATIONS 901,169 820,638
Note 15 FINANCIAL RISK MANAGEMENT
The company’s activities expose it to a variety of financial risks: interest rate risk, credit risk and liquidity risk. The company’s overall risk management program focuses on the unpredictability of financial markets and seeks to minimise the potential adverse effects on the financial performance of the company. The methods used to manage risk include sensitivity analysis for interest rate risk and aging analysis for credit risk. The company prepares forward looking cash flow analyses in relation to its operational, investing and financing activities to manage liquidity risk.
Committee for Economic Development of Australia
ABN 49 008 600 922
Page 21
Notes to the Financial Statements For year ended 30
June 2013
Note 15 FINANCIAL RISK MANAGEMENT (Continued)
a) Interest Rate Risk
At the reporting date the interest rate profile of the Company’s variable interest-bearing financial instruments was:
2013 2012
$ $
Variable rate instruments
Financial Assets 3,874,259 3,158,122
Interest rate risk is managed via fixed rate debt. Fair value sensitivity analysis for fixed rate instruments The Company does not account for any fixed rate financial assets and liabilities at fair value through profit or loss. Therefore a change in interest rates at the reporting date would not affect profit or loss.
Cash flow sensitivity analysis for variable rate instruments A change of 100 basis points in interest rates at the reporting date would have increased equity and profit or loss by the amounts shown in Note 16(b). This analysis assumes that all other variables remain constant. The analysis is performed on the same basis for 2012.
b) Credit Risk
Credit risk is managed at the Board level. Sales are required to be settled in cash or using major credit cards, mitigating credit risk. The maximum exposure to credit risk, excluding the value of any collateral or other security at balance date to recognised financial assets is the carrying amount of those assets as disclosed in the balance sheet position and notes to the financial statements. The company does not have any material credit risk exposure to any single receivable or company of receivables under financial instruments entered into by the company. The credit risk for counterparties included in trade and other receivables at 30 June 2013 is detailed below:
2013
$
2012
$
Trade and other receivables
Counterparties not rated 432,074
508,690
Total 432,074
508,690
Committee for Economic Development of Australia
ABN 49 008 600 922
Page 22
Notes to the Financial Statements For year ended 30
June 2013
Note 16 FINANCIAL INSTRUMENTS
The tables below reflect the undiscounted contractual settlement terms for financial instruments of a fixed period of maturity, as well as management’s expectations of the settlement period for all other financial instruments. As such, the amounts may not reconcile to the balance sheet.
Weighted Average
Effective Interest Rate
Floating Interest Rate
2013
%
2012
%
2013
$
2012
$
Financial Assets:
Cash and cash equivalents 4.07 5.45 3,874,259 3,158,122
Receivables - - - -
Total Financial Assets 4.07 5.45 3,874,259 3,158,122
Financial Liabilities:
Trade and sundry payables - - - -
Total Financial Liabilities - - - -
Fixed Interest Rate
Maturing
Within 1 Year Non Interest Bearing
2013
$
2012
$
2013
$
2012
$
Financial Assets:
Cash and cash equivalents - - - -
Receivables - - 432,074 508,690
Total Financial Assets - - 432,074 508,690
Financial Liabilities:
Trade and sundry payables - - 1,001,206 898,935
Borrowings 10,797 36,955 - -
Total Financial Liabilities 10,797 36,955 1,001,206 898,935
1 to 5 Years Non Interest Bearing
2013
$
2012
$
2013
$
2012
$
Financial Liabilities:
Trade and sundry payables - - - -
Borrowings - 10,797 - -
Total Financial Liabilities - 10,797 - -
Committee for Economic Development of Australia
ABN 49 008 600 922
Page 23
Notes to the Financial Statements For year ended 30
June 2013
Note 16 FINANCIAL INSTRUMENTS (Continued)
Liquidity Risk
Liquidity risk arises from the possibility that the company might encounter difficulty in settling its debts or
otherwise meeting its obligations related to financial liabilities. The company manages the risk through the
following mechanisms:
Preparing forward cash flow analysis in relation to operational, investing and financing activities;
Maintaining a reputable credit profile;
Managing credit risk relating to financial assets;
Investing surplus cash only with major financial institutions; and
Comparing the maturity profile of financial liabilities with the realization profile of financial assets.
Total
2013
$
2012
$
Financial Assets:
Cash and cash equivalents 3,874,259 3,158,122
Receivables 432,074 508,690
Total Financial Assets 4,306,333 3,666,812
Financial Liabilities:
Trade and sundry payables 1,001,206 898,935
Borrowings 10,797 47,752
Total Financial Liabilities 1,012,003 946,687
Financial Liabilities are expected to be paid
as follows:
2013 2012
$ $
Less than 6 months 1,012,003 917,412
6 months to 1 year - 18,478
1 - 5 years - 10,797
Over 5 years - -
1,012,003 946,687

Committee for Economic Development of Australia
ABN 49 008 600 922
Page 24
Notes to the Financial Statements For year ended 30
June 2013
Note 16 FINANCIAL INSTRUMENTS (Continued) a) Net Fair Values
The net fair value of financial assets and financial liabilities approximates their carrying values. Aggregate net fair values and carrying amounts of financial assets and financial liabilities at balance date are presented in the respective financial statement notes.
b) Sensitivity Analysis Interest Rate Risk
The company has performed sensitivity analysis relating to its exposure to interest rate risk at balance date. This sensitivity analysis demonstrates the effect on the current year results and equity which could result from a change in these risks.
Interest Rate Sensitivity Analysis
At 30 June 2013, the effect on profit and equity as a result of changes in the interest rate, with all other variables remaining constant would be as follows:
Amount of impact Result
2013
$
2012
$
2013
$
2012
$
Change in profit
— Increase in interest rate by 1% 38,743 31,581 462,787 179,672
— Decrease in interest rate by 1% (38,743) (31,581) 385,302 116,510
Change in Equity
— Increase in interest rate by 1% 38,743 31,581 1,508,346 1,077,139
— Decrease in interest rate by 1% (38,743) (31,581) 1,430,860 1,013,977

Committee for Economic Development of Australia
ABN 49 008 600 922
Page 25
Notes to the Financial Statements For year ended 30
June 2013
Note 17 CAPITAL MANAGEMENT
Management controls the capital of the entity to ensure that adequate cash flows are
generated to fund its operational programs and that returns from investments are
maximised. The Audit & Risk Committee ensures that the overall risk management
strategy is in line with this objective.
The Audit & Risk Committee operates under policies approved by the Board of Directors.
Risk management policies are approved and reviewed by the Board on a regular basis.
These include credit risk policies and future cash flow requirements.
The entity's capital consists of financial liabilities supported by financial assets.
Management effectively manages the entity's capital by assessing the entity's financial
risks and responding to changes in these risks and in the market. These responses
may include the consideration of debt levels.
There have been no changes to the strategy adopted by management to control the
capital of the entity since the previous year.
Note 2013
2012
$
$
Total Borrowings
12 10,797
47,752
Total Equity (reserves + retained earnings)
1,469,603
1,045,558
Total Capital
1,480,400
1,093,310
Gearing Ratio
0.7%
4.4%

Committee for Economic Development of Australia
ABN 49 008 600 922
Page 26
Notes to the Financial Statements For year ended 30
June 2013
Note 18 KEY MANAGEMENT PERSONNEL COMPENSATION
In addition to the Directors, the names and positions held of the key management personnel in office at any time during the financial year are:
Key Management Person Position
Calder, Hamilton SA - State Director Fitzgerald, Peter VIC - State Director Kelly, Damian CFO & Company Secretary Kelly, Lee NSW - State Director (From 1 April 2013) Martin, Stephen Chief Executive Officer Murphy, Kyl QLD – State Director Rickard, Suzanne NSW - State Director (up to 28 March 2013) Ritchie, Elizabeth WA – State Director
Remuneration policy
The remuneration policy of the company has been designed to align key management personnel objectives with business objectives by providing a fixed remuneration component and offering specific long-term incentives based on key performance areas affecting the company’s financial results. The board of the company believes the remuneration policy to be appropriate and effective in its ability to attract and retain the best key management personnel to run and manage the company, as well as create goal congruence between directors, executives and the business. The board’s policy for determining the nature and amount of remuneration for key management personnel of the company is as follows: - The remuneration policy, setting the terms and conditions for the key management personnel, was
developed by and approved by the board after seeking professional advice from independent external consultants.
- All key management personnel receive a base salary (which is based on factors such as length of service and experience), superannuation, and fringe benefits.
- The board reviews key management personnel packages annually by reference to the company’s performance, executive performance and comparable information from industry sectors.
The key management personnel receive a superannuation guarantee contribution required by the government, which is currently 9%, and do not receive any other retirement benefits. Some individuals, however, have chosen to sacrifice part of their salary to increase payments towards superannuation. All remuneration paid to key management personnel is valued at the cost to the company and expensed. Under the company’s constitution, directors (other than executive directors) are not remunerated. Performance-based remuneration
As part of each of the key management personnel’s remuneration package there is a performance-based component, consisting of key performance indicators (KPIs). The intention of this program is to facilitate goal congruence between key management personnel with that of the business. In determining whether or not a KPI has been achieved, the company bases the assessment on audited figures. Refer below for an outline of key management personnel compensation.
Post- employment
Benefits
Other Total
Cash, salary & Non-cash
commissions benefit
$ $ $ $ $ $
2013 1,216,336 - 179,015 116,658 30,955 1,542,964
2012 1,052,676 - 243,269 116,270 15,001 1,427,216
Long-term
Benefits
Short-term Benefits
Other Superannuation

Committee for Economic Development of Australia
ABN 49 008 600 922
Page 27
Notes to the Financial Statements For year ended 30
June 2013
Note 19 RELATED PARTY TRANSACTIONS
Transactions between related parties are on normal commercial terms and conditions no more favourable than those available to other persons unless otherwise stated.
Note 20 COMPANY DETAILS
The registered office of the company is: Level 5, NICTA Building B 7 London Circuit CANBERRA ACT 2601 The principal place of business is: CEDA Level 13 440 Collins Street MELBOURNE VIC 3000 The company’s principal activities are as shown in the Directors’ report.
Note 21 MEMBERS’ GUARANTEE
The entity is incorporated under the Corporations Act 2001 and is an entity limited by guarantee. If the entity is wound up, the constitution states that each member is required to contribute a maximum of $500 each towards meeting any outstandings and obligations of the entity. At 30 June 2013 the number of members was 695.
Note 22 EVENTS AFTER THE BALANCE DATE
No matters or circumstances have arisen since the end of the financial year which significantly affected or may significantly affect the operations of the Company, the results of those operations, or the state of affairs of the Company in future financial years.

Committee For Economic Development of Australia
ABN 49 008 600 922
Page 28
Directors’ Declaration
1) The directors of the company declare that the financial statements and notes, as set out on pages 5 to 26 are in accordance with the Corporations Act 2001 and present fairly the company’s financial position as at 30 June 2013
and its performance for the year ended on that date in accordance with Accounting Standards and other mandatory professional reporting requirements.
2) In the directors’ opinion, there are reasonable grounds to believe that the company will be able to pay its debts as and
when they become due and payable. This declaration is made in accordance with a Resolution of the Board of Directors and is signed for and on behalf of the Directors by:
Signed at Melbourne this 3 day of September, 2013
In accordance with a Resolution of the Board of Directors. DIRECTOR DIRECTOR
G.D. Allen AM S.P. Martin Chairman Director

Grant Thornton Audit Pty Ltd ACN 130 913 594 The Rialto, Level 30 525 Collins St Melbourne Victoria 3000 GPO Box 4736 Melbourne Victoria 3001 T +61 3 8320 2222 F +61 3 8320 2200 E [email protected] W www.grantthornton.com.au
‘Grant Thornton’ refers to the brand under which the Grant Thornton member firms provide assurance, tax and advisory services to their clients and/or refers to one or more member firms, as the context requires. Grant
Thornton Australia Ltd is a member firm of Grant Thornton International Ltd (GTIL). GTIL and the member firms are not a worldwide partnership. GTIL and each member firm is a separate legal entity. Services are delivered
by the member firms. GTIL does not provide services to clients. GTIL and its member firms are not agents of, and do not obligate one another and are not liable for one another’s acts or omissions. In the Australian context
only, the use of the term ‘Grant Thornton’ may refer to Grant Thornton Australia Limited ABN 41 127 556 389 and its Australian subsidiaries and related entities. GTIL is not an Australian related entity to Grant Thornton
Australia Limited.
Liability limited by a scheme approved under Professional Standards Legislation. Liability is limited in those States where a current scheme applies.
Auditor’s Independence Declaration
To the Directors of Committee for Economic Development of Australia
In accordance with the requirements of section 307C of the Corporations Act 2001, as lead
auditor for the audit of Committee for Economic Development of Australia for the year
ended 30 June 2013, I declare that, to the best of my knowledge and belief, there have been:
a no contraventions of the auditor independence requirements of the Corporations Act
2001 in relation to the audit; and
b no contraventions of any applicable code of professional conduct in relation to the
audit.
GRANT THORNTON AUDIT PTY LTD
Chartered Accountants
Brock Mackenzie
Partner - Audit & Assurance
Melbourne, 3 September 2013

Grant Thornton Audit Pty Ltd ACN 130 913 594 The Rialto, Level 30 525 Collins St Melbourne Victoria 3000 GPO Box 4736 Melbourne Victoria 3001 T +61 3 8320 2222 F +61 3 8320 2200 E [email protected] W www.grantthornton.com.au
‘Grant Thornton’ refers to the brand under which the Grant Thornton member firms provide assurance, tax and advisory services to their clients and/or refers to one or more member firms, as the context requires. Grant
Thornton Australia Ltd is a member firm of Grant Thornton International Ltd (GTIL). GTIL and the member firms are not a worldwide partnership. GTIL and each member firm is a separate legal entity. Services are delivered
by the member firms. GTIL does not provide services to clients. GTIL and its member firms are not agents of, and do not obligate one another and are not liable for one another’s acts or omissions. In the Australian context
only, the use of the term ‘Grant Thornton’ may refer to Grant Thornton Australia Limited ABN 41 127 556 389 and its Australian subsidiaries and related entities. GTIL is not an Australian related entity to Grant Thornton
Australia Limited.
Liability limited by a scheme approved under Professional Standards Legislation. Liability is limited in those States where a current scheme applies.
Independent Auditor’s Report
To the Members of Committee for Economic Development of Australia
We have audited the accompanying financial report of Committee for Economic
Development of Australia (the “Company”), which comprises the statement of financial
position as at 30 June 2013, the statement of profit and loss statement and other
comprehensive income, statement of changes in equity and statement of cash flows for the
year then ended, notes comprising a summary of significant accounting policies and other
explanatory information and the directors’ declaration of the company.
Directors’ responsibility for the financial report
The Directors of the Company are responsible for the preparation of the financial report
that gives a true and fair view in accordance with Australian Accounting Standards and the
Corporations Act 2001. The Directors’ responsibility also includes such internal control as
the Directors determine is necessary to enable the preparation of the financial report that
gives a true and fair view and is free from material misstatement, whether due to fraud or
error.
Auditor’s responsibility
Our responsibility is to express an opinion on the financial report based on our audit. We
conducted our audit in accordance with Australian Auditing Standards. Those standards
require us to comply with relevant ethical requirements relating to audit engagements and
plan and perform the audit to obtain reasonable assurance whether the financial report is
free from material misstatement.
An audit involves performing procedures to obtain audit evidence about the amounts and
disclosures in the financial report. The procedures selected depend on the auditor’s
judgement, including the assessment of the risks of material misstatement of the financial
report, whether due to fraud or error.
In making those risk assessments, the auditor considers internal control relevant to the
Company’s preparation of the financial report that gives a true and fair view in order to
design audit procedures that are appropriate in the circumstances, but not for the purpose
of expressing an opinion on the effectiveness of the Company’s internal control. An audit
also includes evaluating the appropriateness of accounting policies used and the
reasonableness of accounting estimates made by the Directors, as well as evaluating the
overall presentation of the financial report.

We believe that the audit evidence we have obtained is sufficient and appropriate to provide
a basis for our audit opinion.
Electronic presentation of audited financial report
This auditor’s report relates to the financial report of Committee for Economic
Development of Australia and controlled entities for the year ended 30 June 2013 included
on Committee for Economic Development of Australia’s web site. The Company’s
Directors are responsible for the integrity of Committee for Economic Development of
Australia’s web site. We have not been engaged to report on the integrity of Committee for
Economic Development of Australia’s web site. The auditor’s report refers only to the
statements named above. It does not provide an opinion on any other information which
may have been hyperlinked to/from these statements. If users of this report are concerned
with the inherent risks arising from electronic data communications they are advised to refer
to the hard copy of the audited financial report to confirm the information included in the
audited financial report presented on this web site.
Independence
In conducting our audit, we have complied with the independence requirements of the
Corporations Act 2001.
Auditor’s opinion
In our opinion:
a the financial report of Committee for Economic Development of Australia is in
accordance with the Corporations Act 2001, including:
i giving a true and fair view of the Company’s financial position as at 30 June
2013 and of its performance for the year ended on that date; and
b complying with Australian Accounting Standards and the Corporations Regulations
2001
GRANT THORNTON AUDIT PTY LTD
Chartered Accountants
Brock Mackenzie
Partner - Audit & Assurance
Melbourne, 3 September 2013