Indo Mines 2018 Annual Report (Signed) (2) · 2018. 11. 2. · 3djh &(2¶v 5hsruw 7kh )lqdqfldo

A N N U A L F I N A N C I A L R E P O R T
3 0 J U N E 2 0 0 8
ABN 40 009 245 210

INDO MINES LIMITED ANNUAL FINANCIAL REPORT 2008
CONTENTS PAGE
CORPORATE DIRECTORY 2
DIRECTORS' REPORT 3
AUDITOR'S INDEPENDENCE DECLARATION 13
INCOME STATEMENTS 14
BALANCE SHEETS 15
CASH FLOW STATEMENTS 16
STATEMENTS OF CHANGES IN EQUITY 17
NOTES TO AND FORMING PART OF THE FINANCIAL STATEMENTS 19
DIRECTORS' DECLARATION 50
INDEPENDENT AUDIT REPORT 51
Page 1
INDO MINES LIMITED ANNUAL FINANCIAL REPORT 2008
Page 2
CORPORATE DIRECTORY
Directors
Mr Darryl Harris – Chairman
Mr Philip Welten – Managing Director
Mr Ian Middlemas
Mr Keith Brooks
Mr Matthew Rimes
Company Secretary
Mr Mark Pearce
Registered and Principal Office
Level 9, BGC Centre
28 The Esplanade
Perth WA 6000
Telephone: +61 8 9322 6322
Facsimile: +61 8 9322 6558
Share Register
Computershare Investor Services Pty Ltd
Level 2
45 St Georges Terrace
Perth WA 6000
Telephone: 1300 557 010
International: +61 8 9323 2000
Facsimile: +61 8 9323 2033
Stock Exchange Listing
Australian Stock Exchange Limited
Home Branch – Perth
2 The Esplanade
Perth WA 6000
ASX Code
IDO – Fully paid ordinary shares
Solicitors
Hardy Bowen Lawyers – Australia
Hadiputranto, Hadinoto & Partners – Indonesia
Auditor
KPMG
Bankers
Australia and New Zealand Banking Group Ltd

INDO MINES LIMITED ANNUAL FINANCIAL REPORT 2008
DIRECTORS’ REPORT
30 JUNE 2008
The Directors of Indo Mines Limited present their report on the Consolidated Entity consisting of Indo Mines Limited (“the Company” or “Indo Mines” or “Parent”) and the entities it controlled at the end of, or during, the year ended 30 June 2008 (“Consolidated Entity” or “Group”). DIRECTORS The names of Directors in office at any time during the financial year or since the end of the financial year are:
Mr Darryl Harris Non-Executive Chairman Mr Philip Welten Managing Director Mr Ian Middlemas Non-Executive Director Mr Keith Brooks Non-Executive Director Mr Matthew Rimes Non-Executive Director
Unless otherwise disclosed, Directors held their office from 1 July 2007 until the date of this report. CURRENT DIRECTORS AND OFFICERS Darryl Harris – Chairman Qualifications - B.Sc. MAusIMM Darryl Harris is an engineering metallurgist with over 20 years experience in the design and commissioning of mineral processing plants, in particular diamonds. Mr Harris has had a long association with engineering companies including Nedpac and Signet Engineering and was involved in the development of various projects, including project co-ordinator for the An Feng-Kingstream Steel Project and other Australian ferrous projects. Mr Harris is currently Australian Project Development Manager of the large international engineering firm Outotec Australasia Pty Ltd. Mr Harris was appointed a Director of Indo Mines Limited on 16 June 1987. During the three year period to the end of the financial year, Mr Harris did not hold any other directorships of listed companies. Mr Harris was appointed a director of Beacon Minerals Limited in July 2008. Philip Welten – Managing Director Qualifications - B.ASc. (Mining Eng), MAusIMM Philip Welten is a mining engineer with over 28 years experience in a range of commodities including iron ore, gold, copper and uranium. During his extensive career in the resources sector Mr Welten has primarily worked for major mining companies including the Rio Tinto Group, North Limited, WMC, Barrick and Newmont. His background is in Operations Management, Project Feasibility and Resource Development both in Australia and overseas. Mr Welten held the position of Operations Manager at Robe River Mining's Pannawonica Mesa J mine and also worked on the feasibility studies for the Angeles Iron Ore Project. Prior to joining the board of Indo Mines he held a senior management position at the Barrick / Newmont Joint Venture owned Superpit in Kalgoorlie. Mr Welten was appointed a Director of Indo Mines Limited on 22 January 2007. Mr Welten has not held any other directorships of listed companies in the last three years. Keith Brooks – Non-Executive Director Qualifications – FCCA, MCT, MBA Mr Brooks has 30 years international experience spanning the energy, mining and finance sectors. Since 2002 Mr Brooks has been involved in projects and venture capital for start-up companies involved in the North American, European and Asia capital markets that has enabled these companies to grow substantially in value. Prior to 2002, Keith held positions in Accounting, Treasury and Project Management in the UK for Atlantic Richfield Company before moving to ARCO’s Power Group as Chief Financial Officer (CFO) for Great Yarmouth Power Ltd set up by Amoco and ARCO (later taken over by BP). As CFO for Great Yarmouth Power Ltd. Mr Brooks assisted in the negotiation of the £237 million project finance with a banking consortium led by Societe Generale. Mr Brooks was appointed a Director of Indo Mines Limited on 22 March 2006. Mr Brooks has not held any other directorships of listed companies in the last three years.
Page 3
INDO MINES LIMITED ANNUAL FINANCIAL REPORT 2008
DIRECTORS’ REPORT
30 JUNE 2008
Page 4
CURRENT DIRECTORS AND OFFICERS (continued) Ian Middlemas – Non-Executive Director Qualifications - B Com, CA Mr Middlemas is a Chartered Accountant, a member of the Financial Services Institute of Australasia and holds a Bachelor of Commerce degree. He worked for a large international Chartered Accounting firm before joining the Normandy Mining Group where he was a senior group executive for approximately 10 years. He has had extensive corporate and management experience, and is currently a director of a number of publicly listed companies in the resource sector. During the three year period to the end of the financial year, Mr Middlemas has held directorships in Salinas Energy Limited (November 1995 - present), OmegaCorp Ltd (October 2000 – August 2007), QED Occtech Limited (July 2001 – present), GulfX Limited (May 2007 – February 2008), Global Petroleum Limited (April 2007 – present), Mantra Resources Limited (September 2005 – present), Mavuzi Resources Limited (January 2007 – March 2008), Odyssey Energy Limited (September 2005 – present), Pacific Energy Limited (June 2006 – present), Fusion Resources Limited (May 2002 – present), Sierra Mining Limited (January 2006 – present), Sovereign Metals Limited (July 2006 – present), Xenolith Resources Limited (March 2007 – present), Leyshon Resources Limited (November 2001 – April 2006) and Berkeley Resources Limited (July 2003 – November 2006). Mr Middlemas was appointed a director of Indo Mines Limited on 12 December 2006. Matthew Rimes – Non-Executive Director Qualifications - AWASM (Mining Eng), Exec MBA, Grad IEAust, MAusIMM Mr Rimes is a mining engineer with over thirty years experience in a range of commodities including gold, copper, nickel and iron ore. He was with North Ltd from 1989, and then subsequently with the Rio Tinto group since the takeover of North Ltd in 2000. Mr Rimes is also currently the Managing Director of Iron Ore Holdings Ltd. Over the last ten years he has been with Robe River, and has held senior operational positions at both of Robe's operations at Pannawonica and West Angelas. He brings a wide range of experience in operations, feasibility studies and acquisitions to the board, together with a broad knowledge of the iron ore sector. During the three year period to the end of the financial year, Mr Rimes has held directorships in Fusion Resources Ltd (June 2005 – present), Iron Ore Holdings Ltd (April 2007 – present) and Sovereign Metals Ltd (July 2006 – present). Mr Rimes was appointed a director of Indo Mines Limited on 12 December 2006. Mark Pearce – Company Secretary Qualifications - B.Com, CA, ACIS, F Fin Mr Pearce is a Chartered Accountant and is currently a director of several listed companies that operate in the resources sector. He has had considerable experience in the formation and development of listed resource companies and has worked for several large international Chartered Accounting firms. Mr Pearce is also a Fellow of the Institute of Chartered Secretaries and a member of the Financial Services Institute of Australasia. Mr Pearce was appointed Company Secretary of Indo Mines Limited on 12 December 2006. PRINCIPAL ACTIVITIES The principal activities of the Consolidated Entity during the year consisted of mineral exploration and development activities and there has been no change in the nature of those activities. EMPLOYEES 2008 2007 The number of full time equivalent people employed by the Consolidated Entity at balance date
2
2

INDO MINES LIMITED ANNUAL FINANCIAL REPORT 2008
DIRECTORS’ REPORT
30 JUNE 2008
Page 5
DIVIDENDS No dividends have been declared, provided for or paid in respect of the financial year ended 30 June 2008 (2007: nil). EARNINGS PER SHARE 2008
Cents 2007
Cents Basic earnings/(loss) per share 3.6 (1.7) Diluted earnings/(loss) per share 3.2 (1.7) CORPORATE STRUCTURE Indo Mines Limited is a company limited by shares that is incorporated and domiciled in Australia. The Company has prepared a consolidated financial report including the entities it incorporated and controlled during the financial year. CONSOLIDATED RESULTS 2008
$ 2007
$ Profit/(loss) of the Consolidated Entity before income tax expense 3,711,721 (1,023,841) Income tax expense (853,151) - Net profit/(loss) 2,858,570 (1,023,841) REVIEW OF OPERATIONS AND ACTIVITIES The profit after tax of the Consolidated Entity for the year ended 30 June 2008 was $2,858,570 (2007: loss of $1,023,841). The profit for the year arose primarily as a result of the sale of the Company’s 10% clawback right in the Wonarah phosphate project in the Northern Territory. During the year ended 30 June 2008, Indo Mines continued to focus on the development of the Jogjakarta Ironsands Project in Indonesia. Onyx Projects Pty Ltd completed a review of the various hot metal processing technologies available and recommended Outotec’s CircoSmelt® Technology for the Pig Iron Plant design as it is the most viable and cost effective in the present market conditions. This technology may have significant cost benefits over the existing SLRN technology currently in use in New Zealand. The Pilot Plant in Jogjakarta was commissioned and 50 tonnes of concentrate at a grade of 55% Fe was produced and dispatched to Germany for large scale confirmation test work by Outotec. The results of this should be available for inclusion in the Feasibility Study. Gadjah Mada University in Jogjakarta has commenced the Rehabilitation Study Program on the Project Site that will be used to demonstrate in a practical way the environmental and agricultural improvements that are included in the Company’s proposed Mine Plan. URS Australia together with PT Asana Wirasta Setia, an environmental consulting firm based in Jogjakarta, continued with the AMDAL environmental and social impact study. The study is due for completion in mid 2009. GR Engineering Services continued to progress the Bankable Feasibility Study for the Concentrate Plant; this is due for completion in late 2009. The Contract of Works application continues to progress through the various Indonesian Government approvals. The Company commenced discussions with Compass Resources on the exploration opportunities for the Hilorico / Chinguela assets in Northern Peru.

INDO MINES LIMITED ANNUAL FINANCIAL REPORT 2008
DIRECTORS’ REPORT
30 JUNE 2008
Page 6
SIGNIFICANT CHANGES IN THE STATE OF AFFAIRS The following significant changes in the state of affairs of the Consolidated Entity occurred during the year:
(i) On 6 July 2007, following shareholder approval the Company issued 10,000,000 fully paid ordinary shares to Nusantara Energy Ltd in accordance with the Acquisition Agreement for the Jogjakarta Iron Sands Project;
(ii) On 6 July 2007, following shareholder approval the Company granted 1,250,000 incentive options
exercisable at $0.35 each on or before 31 December 2009 and 1,250,000 incentive options exercisable at $0.45 each on or before 30 June 2010 to Mr Philip Welten in accordance with the terms of his employment agreement. These incentive options vest on 22 January 2008 and 22 January 2009 respectively;
(iii) On 6 July 2007, following shareholder approval the Company granted 1,050,000 options exercisable at
$0.90 each on or before 30 November 2009, 1,050,000 options exercisable at $1.20 each on or before 30 November 2010 and 1,000,000 options exercisable at $0.20 each on or before 30 June 2010 to key consultants and employees; and
(iv) On 16 June 2008, the Company disposed of its 10% clawback right in the Wonarah phosphate project in
the Northern Territory to a subsidiary of Minemakers Limited. As part of the transaction, the Company also disposed of its right to a 50% contributing interest in the project area for the exploration and development of deposits for diamonds, gold and base metals. The Company received consideration of $2 million cash and 3 million Minemakers Limited (MAK) shares, which are subject to a holding lock until 16 June 2009.
SIGNIFICANT POST BALANCE DATE EVENTS As at the date of this report there are no matters or circumstances, which have arisen since 30 June 2008 that have significantly affected or may significantly affect:
(a) the operations, in financial years subsequent to 30 June 2008 of the Consolidated Entity; (b) the results of those operations, in financials years subsequent to 30 June 2008 of the
Consolidated Entity; or (c) the state of affairs, in financial years subsequent to 30 June 2008 of the Consolidated Entity.
ENVIRONMENTAL REGULATION AND PERFORMANCE The Consolidated Entity’s operations are subject to various environmental laws and regulations under the relevant government’s legislation. Full compliance with these laws and regulations is regarded as a minimum standard for all operations to achieve. Instances of environmental non-compliance by an operation are identified either by external compliance audits or inspections by relevant government authorities. There have been no significant known breaches by the Consolidated Entity during the financial year. LIKELY DEVELOPMENTS AND EXPECTED RESULTS It is the Board's current intention that the Consolidated Entity will focus on maximising the value of the Company’s Jogjakarta Ironsands Project in Indonesia and is currently undertaking a Feasability Study for the project and continuing to progress the Contract of Works application. The Company will also continue to examine new opportunities in mineral exploration, particularly in the iron sands sector. All of these activities are inherently risky and the Board is unable to provide certainty that any or all of these activities will be able to be achieved. In the opinion of the Directors, any further disclosure of information regarding likely developments in the operations of the Consolidated Entity and the expected results of these operations in subsequent financial years may prejudice the interests of the Company and accordingly, has not been disclosed.

INDO MINES LIMITED ANNUAL FINANCIAL REPORT 2008
DIRECTORS’ REPORT
30 JUNE 2008
Page 7
SHARE OPTIONS At the date of this report the following options have been issued over unissued capital: • 450,000 unlisted options exercisable at $0.20 each on or before 31 July 2009; • 10,000,000 unlisted options exercisable at $0.20 each on or before 30 June 2010; • 1,250,000 incentive options exercisable at $0.35 each on or before 31 December 2009 vesting 22 January
2008; • 1,250,000 incentive options exercisable at $0.45 each on or before 30 June 2010 vesting 22 January 2009; • 1,050,000 unlisted options exercisable at $0.90 each on or before 30 November 2009; and • 1,050,000 unlisted options exercisable at $1.20 each on or before 30 November 2010. Since 30 June 2008, no shares have been issued as a result of the exercise of options. INFORMATION ON DIRECTORS’ INTERESTS IN SECURITIES The following table sets out each Director’s relevant interest in shares and options in shares of the Company as at the date of this report:
Interest in Securities at the date of this Report
Interest in Securities issued/granted during
the year
Shares(1)
$0.20 31 Jul 2009
Options(2)
$0.20 30 Jun 2010
Options(3)
$0.35 Incentive Options(4)
$0.45 Incentive Options(5)
$0.35 Incentive Options(4)
$0.45 Incentive Options(5)
Current Directors Darryl Harris 60,000 150,000 - - - - - Philip Welten - - - 1,250,000 1,250,000 1,250,000 1,250,000 Ian Middlemas 3,700,000 - 3,330,000 - - - - Keith Brooks 3,269,214 150,000 - - - - - Matthew Rimes 300,000 - 270,000 - - - -
INFORMATION ON DIRECTORS’ INTERESTS IN SECURITIES (continued) Notes (1) ”Shares” means fully paid ordinary shares in the capital of the Company. (2) “$0.20 31 Jul 2009 Options” means an option to subscribe for 1 ordinary Share in the capital of the Company at
an exercise price of $0.20 or before 31 July 2009. (3) “$0.20 30 Jun 2010 Options” means an option to subscribe for 1 ordinary Share in the capital of the Company
at an exercise price of $0.20 or before 30 June 2010. (4) “$0.35 Incentive Options” means an option to subscribe for 1 ordinary Share in the capital of the Company at
an exercise price of $0.35 on or before 31 December 2009. The Incentive Options were granted on 6 July 2007, following shareholder approval at a general meeting held on 5 July 2007.
(5) “$0.45 Incentive Options” means an option to subscribe for 1 ordinary Share in the capital of the Company at an exercise price of $0.45 on or before 30 June 2010. The Incentive Options were granted on 6 July 2007, following shareholder approval at a general meeting held on 5 July 2007.
MEETINGS OF DIRECTORS The following table sets out the number of meetings of the Company's Directors held during the year ended 30 June 2008, and the number of meetings attended by each Director.
Board Meetings Number eligible
to attend
Board Meetings Number
Attended Darryl Harris 3 3 Philip Welten 3 3 Ian Middlemas 3 3 Keith Brooks 3 3 Matthew Rimes 3 2

INDO MINES LIMITED ANNUAL FINANCIAL REPORT 2008
DIRECTORS’ REPORT
30 JUNE 2008
Page 8
REMUNERATION REPORT - AUDITED
The remuneration policy for the Group’s Key Management Personnel (including the Managing Director) has been developed by the Board taking into account:
• the size of the Group; • the size of the management team for the Group; • the nature of the Group’s current operations; and • market conditions and comparable salary levels for companies of a similar size and operating in similar sectors.
In considering the above general factors, the Board has also placed emphasis on the following specific issues:
• risks associated with resource companies whilst exploring and developing projects; and • other than profit which may be generated from asset sales (if any), the Company does not expect to be
undertaking profitable operations until some time after the successful commercialisation, production and sales of commodities from one or more of its current projects, or the acquisition of a profitable mining operation.
Remuneration Policy for Executives The Group’s remuneration policy is to provide a fixed remuneration component and a performance based component (options and a cash bonus, see below). The Board believes that this remuneration policy is appropriate given the stage of development of the Company and the activities which it undertakes and is appropriate in aligning Key Management Personnel objectives with shareholder and business objectives. Performance Based Remuneration – Incentive Options The Board has chosen to issue incentive options to Key Management Personnel as a key component of the incentive portion of their remuneration, in order to attract and retain the services of the Key Management Personnel and to provide an incentive linked to the performance of the Company. The Board considers that each Key Management Personnel’s experience in the resources industry will greatly assist the Company in progressing its projects to the next stage of development and the identification of new projects. As such, the Board believes that the number of incentive options granted to Key Management Personnel is commensurate to their value to the Company. The Board has a policy of granting options to Key Management Personnel with exercise prices at and/or above market share price (at time of agreement). As such, incentive options granted to Key Management Personnel will generally only be of benefit if the Key Management Personnel perform to the level whereby the value of the Company increases sufficiently to warrant exercising the incentive options granted. Other than service-based vesting conditions, there are no additional performance criteria on the incentive options granted to Key Management Personnel, as given the speculative nature of the Company’s activities and the small management team responsible for its running, it is considered the performance of the Key Management Personnel and the performance and value of the Company are closely related. Performance Based Remuneration – Cash Bonus In addition, some Key Management Personnel are entitled to an annual cash bonus upon achieving various key performance indicators, as set by the Board. The Board has determined that the key performance indicators will include measures such as successful completion of business development activities (e.g. project acquisitions and capital raisings), exploration activities (e.g. completion of exploration programs within budgeted timeframes and costs) and other corporate activities (e.g. recruitment of key personnel). On an annual basis, after consideration of performance against key performance indicators, the Board determines the amount, if any, of the annual cash bonus to be paid to each Key Management Personnel.

INDO MINES LIMITED ANNUAL FINANCIAL REPORT 2008
DIRECTORS’ REPORT
30 JUNE 2008
Page 9
REMUNERATION REPORT – AUDITED (CONTINUED) Impact of Shareholder Wealth on Key Management Personnel Remuneration The Board does not directly base remuneration levels on the Company’s share price or movement in the share price over the financial year. However, as noted above, a number of Key Management Personnel have received options which generally will only be of value should the value of the Company’s shares increase sufficiently to warrant exercising the incentive options granted. As a result of the Company’s exploration, development and new business activities, the Board anticipates that it will retain future earnings (if any) and other cash resources for the operation and development of its business. Accordingly the Company does not currently have a policy with respect to the payment of dividends, and as a result the remuneration policy does not take into account the level of dividends or other distributions to shareholders (e.g. return of capital). Impact of Earnings on Key Management Personnel Remuneration
As discussed above, the Company is currently undertaking exploration activities, and does not expect to be undertaking profitable operations until some time after the successful commercialisation, production and sales of commodities from one or more of its current projects. Accordingly the Board does not consider current or prior year earnings when assessing remuneration of Key Management Personnel. Remuneration Policy for Non-Executive Directors The Board policy is to remunerate Non-Executive Directors at market rates for comparable companies for time, commitment and responsibilities. Given the current size, nature and risks of the Company, incentive options have been used to attract and retain Non-Executive Directors. The Board determines payments to the Non-Executive Directors and reviews their remuneration annually, based on market practice, duties and accountability. Independent external advice is sought when required. The maximum aggregate amount of fees that can be paid to Non-Executive Directors is subject to approval by shareholders at a General Meeting. Fees for Non-Executive Directors are not linked to the performance of the economic entity. However, to align Directors’ interests with shareholders’ interests, the Directors are encouraged to hold shares in the Company and Non-Executive Directors have in limited circumstances received incentive options in order to secure their services. General Where required, Key Management Personnel receive superannuation contributions, currently equal to 9% of their salary, and do not receive any other retirement benefit. From time to time, some individuals have chosen to sacrifice part of their salary to increase payments towards superannuation. All remuneration paid to Key Management Personnel is valued at cost to the company and expensed. Incentive options are valued using the Black-Scholes option valuation methodology. The value of these incentive options is expensed over the vesting period. Employment Contracts with Key Management Personnel Mr Philip Welten, Managing Director, has a contract of employment with Indo Mines Limited which specifies the duties and obligations to be fulfilled by the Managing Director. The contract has a rolling annual term and may be terminated by the Company by giving 2 months notice. No amount is payable in the event of termination for neglect or incompetence in regards to the performance of duties. Mr Welten receives a fixed remuneration component of $250,000 per annum inclusive of superannuation together with a bonus of up to $50,000 per annum. Following shareholder approval at a general meeting held on 5 July 2007, Mr Welten was granted the following option package in accordance with his employment contract:
i) 1,250,000 unlisted incentive options exercisable at $0.35 each on or before 31 December 2009, vesting after 12 months’ service; and
ii) 1,250,000 unlisted incentive options exercisable at $0.45 each on or before 30 June 2010, vesting after 24 months’ service.

INDO MINES LIMITED ANNUAL FINANCIAL REPORT 2008
DIRECTORS’ REPORT
30 JUNE 2008
Page 10
REMUNERATION REPORT – AUDITED (CONTINUED) Key Management Personnel Remuneration (Company and Consolidated) Details of the nature and amount of each element of the remuneration of each Director of the Company and each of the Company and Group’s executives for the financial year are as follows:
Short-Term Post Employment
Termination Benefits
Share- based
payments
Other Total Proportion of remuneration performance
related
Value of options as proportion of
remuneration
Directors
Salary
$
Directors Fees
$
Super- annuation
$
$
Options
$
Consulting Fees
$
$
%
% Current Directors
Darryl Harris 2008 - 20,000 1,800 - - - 21,800 - - Chairman 2007 - 15,000 1,350 - 12,450 9,800 38,600 - 32.3Philip Welten (i) 2008 279,370 - 25,143 - 2,245,891 - 2,550,404 2.1 88.1
Managing Director 2007 102,220 - 9,200 - - - 111,420 - -Ian Middlemas (ii) 2008 - - - - - 36,000 36,000 - - Non-Executive Director 2007 - - - - - 19,500 19,500 - -Keith Brooks (iii) 2008 - 15,000 - - - - 15,000 - - Non-Executive Director 2007 - 12,500 - - 12,450 - 24,950 - 49.9Matthew Rimes (iv) 2008 - 15,000
1,350 - - - 16,350 - -
Non-Executive Director
2007 - 8,048
724 - - - 8,772 - -
Former Directors
Zlad Sas (v)
2008 - - - - - - - - -2007 - - - - 12,450
81,900 94,350
- 13.2
Mark Stewart (vi)
2008 - - - - - - - - -2007 - 10,416
937 - 12,450
- 23,803
- 52.3
Executives Mark Pearce (vii) 2008 - - - - 232,650
- 232,650
- 100.0 Company Secretary 2007 - - - - - - - - -Shane Cranswick (vii) 2008 - - - - 775,500
- 775,500
- 100.0 Chief Financial Officer
2007 - - - - - - - - -
Total 2008 279,370 50,000 28,293 - 3,254,041 36,000 3,647,804 2007 102,220 45,964 12,211 - 49,800 111,200 321,395

INDO MINES LIMITED ANNUAL FINANCIAL REPORT 2008
DIRECTORS’ REPORT
30 JUNE 2008
REMUNERATION REPORT – AUDITED (CONTINUED) Notes (i) Mr Welten was appointed 22 January 2007. (ii) Mr Middlemas was appointed 12 December 2006. (iii) Mr Brooks was appointed on 22 March 2006. (iv) Mr Rimes was appointed 12 December 2006. (v) Mr Sas resigned 12 December 2006. (vi) Mr Stewart resigned 12 December 2006. (vii) Mr Pearce and Mr Cranswick provide services as the Company’s Company Secretary and Chief Financial
Officer respectively through a services agreement with Apollo Group Pty Ltd. Under the agreement, Apollo Group Pty Ltd provides administrative, company secretarial and accounting services, and the provision of a fully serviced office to the Company for a monthly retainer of $15,000 (2007: $15,000). The monthly retainer has increased to $16,500 from 1 July 2008. Apollo Group Pty Ltd is a company controlled by Mr Pearce. Mr Cranswick is an employee of Apollo Group Pty Ltd.
Value of Options Granted to Key Management Personnel The following table discloses the value of options granted, exercised or lapsed during the year:
Options Granted
Options Exercised
Options Lapsed
Value at Grant
Date (i)
$
Value at Exercise
Date
$
Value at time of Lapse
$
Total Value of Options Granted,
Exercised and Lapsed
$
Value of Options
included in Compensation
for the Year
$
Percentage of Compensation
for the Year that consists
of Options
% 2008 Phil Welten 2,606,250 - - 2,606,250 2,245,891 88.1 Mark Pearce 232,650 - - 232,650 232,650 100.0 Shane Cranswick 775,500 - - 775,500 775,500 100.0
2007 Darryl Harris 12,450 - - 12,450 12,450 32.3 Keith Brooks 12,450 - - 12,450 12,450 49.9 Zlad Sas 12,450 - - 12,450 12,450 13.2 Mark Stewart 12,450 - - 12,450 12,450 52.3 Note (i) For details on the valuation of the options, including models and assumptions used, please refer to Note
18 to the financial statements. (ii) Each option converts into one ordinary share of Indo Mines on exercise. INSURANCE OF OFFICERS AND AUDITORS Under the Constitution the Company is obliged, to the extent permitted by law, to indemnify an officer (including Directors) of the Company against liabilities incurred by the officer in that capacity, against costs and expenses incurred by the officer in successfully defending civil or criminal proceedings, and against any liability which arises out of conduct not involving a lack of good faith. The Company has in respect of any person who is or has been an officer of the Company or a related body corporate paid or agreed to pay a premium of $18,848 (2007: $19,986) in respect of a contract insuring against a liability incurred as an officer for the costs or expenses to defend legal proceedings. The Company has indemnified officers of the Company against a liability incurred as an officer including costs and expenses in successfully defending legal proceedings. The Company has not, during or since the end of the financial year, indemnified or agreed to indemnify an auditor of the Company or of any related body corporate against a liability incurred as such an auditor. NON-AUDIT SERVICES There were no non-audit services provided by the auditor (or by another person or firm on the auditor’s behalf) during the financial year.
Page 11
INDO MINES LIMITED ANNUAL FINANCIAL REPORT 2008
DIRECTORS’ REPORT
30 JUNE 2008
Page 12
AUDITORS INDEPENDENCE DECLARATION The auditor’s independence declaration, which forms part of this Directors’ Report, for the year ended 30 June 2008 is on Page 13. This report is made in accordance with a resolution of the Directors made pursuant to section 298(2) of the Corporations Act 2001. For and on behalf of the Directors
PHILIP WELTEN Managing Director Dated this 26th day of September 2008 Note: The information in this report that relates to Exploration Results and Mineral Resources of the Jogjakarta Ironsands Project is based on information compiled by Mr Philip Welten, who is a member Australian Institute of Mining and Metallurgy. Mr Welten is a full-time employee of Indo Mines Limited. Mr Welten has sufficient experience, which is relevant to the style of iron ore mineralisation and type of deposit under consideration and to the activity which he is undertaking to qualify as a Competent Person as defined in the 2004 Edition of the ‘Australasian Code for Reporting of Exploration Results, Mineral Resources and Ore Reserves’. Mr Welten consents to the inclusion in the report of the matters based on his information in the form and context in which it appears.

INDO MINES LIMITED ANNUAL FINANCIAL REPORT 2008
INCOME STATEMENTS FOR THE FINANCIAL YEAR ENDED 30 JUNE 2008
Consolidated Company Note 2008 2007 2008 2007
$ $ $ $
Continuing Operations
Other Income 2(a) 7,850,000 425,963 7,850,000 425,963
Exploration, evaluation and development expenditure 2(b) (3,037,753) (979,083) (3,022,289) (773,577)Business development expenses 2(b) (16,045) (66,000) (16,045) (66,000)Administration expenses 2(b) (1,821,360) (574,312) (1,811,360) (566,823)Finance costs (4,842) (3,181) (4,636) (3,020)Other expenses 2(b) - - (21,489) (213,730)Results from operating activities 2,970,000 (1,196,613) 2,974,181 (1,197,187) Net financial income 2(c) 741,721 172,772 741,704 172,768 Profit/(loss) before income tax 3,711,721 (1,023,841) 3,715,885 (1,024,419) Income tax expense 3 (853,151) - (857,003) - Profit/(loss) from continuing operations 2,858,570 (1,023,841) 2,858,882 (1,024,419)
Attributable to: Minority interests - - - -Equity holders of Indo Mines Limited 2,858,570 (1,023,841) 2,858,882 (1,024,419) 2,858,570 (1,023,841) 2,858,882 (1,024,419) Basic profit/(loss) per share from continuing operations (cents per share) 23 3.6 (1.7) Diluted profit/(loss) per share from continuing operations (cents per share) 23 3.2 (1.7)
Notes to and forming part of the Income Statements are set out on Pages 19 to 49.
Page 14
INDO MINES LIMITED ANNUAL FINANCIAL REPORT 2008
Page 15
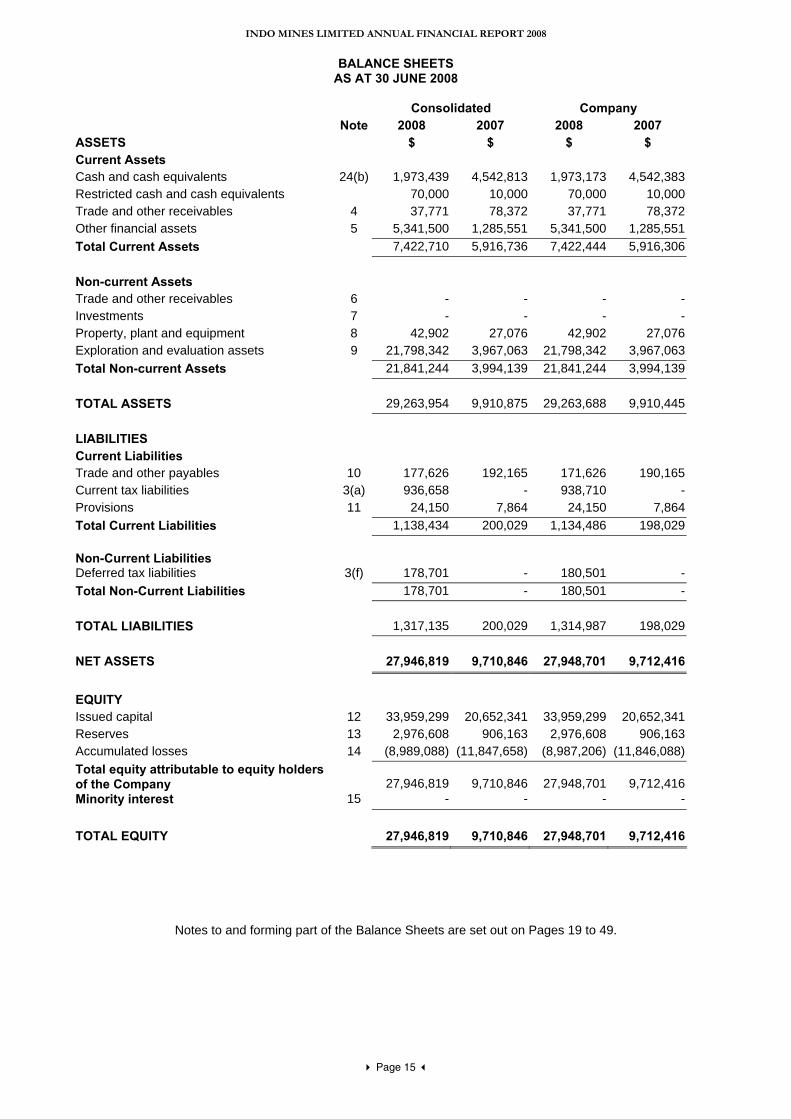
BALANCE SHEETS AS AT 30 JUNE 2008
Consolidated Company
Note 2008 2007 2008 2007 ASSETS $ $ $ $ Current Assets Cash and cash equivalents 24(b) 1,973,439 4,542,813 1,973,173 4,542,383Restricted cash and cash equivalents 70,000 10,000 70,000 10,000Trade and other receivables 4 37,771 78,372 37,771 78,372Other financial assets 5 5,341,500 1,285,551 5,341,500 1,285,551Total Current Assets 7,422,710 5,916,736 7,422,444 5,916,306
Non-current Assets Trade and other receivables 6 - - - -Investments 7 - - - -Property, plant and equipment 8 42,902 27,076 42,902 27,076Exploration and evaluation assets 9 21,798,342 3,967,063 21,798,342 3,967,063Total Non-current Assets 21,841,244 3,994,139 21,841,244 3,994,139
TOTAL ASSETS 29,263,954 9,910,875 29,263,688 9,910,445
LIABILITIES Current Liabilities Trade and other payables 10 177,626 192,165 171,626 190,165Current tax liabilities 3(a) 936,658 - 938,710 -Provisions 11 24,150 7,864 24,150 7,864Total Current Liabilities 1,138,434 200,029 1,134,486 198,029 Non-Current Liabilities
Deferred tax liabilities 3(f) 178,701 - 180,501 -Total Non-Current Liabilities 178,701 - 180,501 -
TOTAL LIABILITIES 1,317,135 200,029 1,314,987 198,029
NET ASSETS 27,946,819 9,710,846 27,948,701 9,712,416
EQUITY Issued capital 12 33,959,299 20,652,341 33,959,299 20,652,341Reserves 13 2,976,608 906,163 2,976,608 906,163Accumulated losses 14 (8,989,088) (11,847,658) (8,987,206) (11,846,088)Total equity attributable to equity holders of the Company 27,946,819 9,710,846
27,948,701 9,712,416
Minority interest 15 - - - - TOTAL EQUITY 27,946,819 9,710,846 27,948,701 9,712,416
Notes to and forming part of the Balance Sheets are set out on Pages 19 to 49.

INDO MINES LIMITED ANNUAL FINANCIAL REPORT 2008
Page 16
CASH FLOW STATEMENTS FOR THE FINANCIAL YEAR ENDED 30 JUNE 2008
Consolidated Company Note 2008 2007 2008 2007
$ $ $ $ Cash flows from operating activities Interest received 144,841 124,772 144,824 124,768Payments to suppliers and employees (980,563) (970,347) (974,357) (970,821) Net cash outflows from operating activities
24(a) (835,722) (845,575)
(829,533) (846,053)
Cash flows from investing activities Proceeds from disposal of property, plant and
equipment - 4,500
- 4,500Purchase of property, plant and equipment (35,370) (28,227) (35,370) (28,227)Payments for exploration, evaluation and
development (4,494,383) (2,143,732)
(4,479,570) (2,143,098)Loans to related entities - - (20,838) (500)Proceeds from sale of tenements - 50,000 - 50,000Acquisition of other financial assets (625) - (625) -Proceeds from sale of other financial assets 858,068 - 858,068 -Proceeds from sale of mining rights 2,000,000 - 2,000,000 - Net cash outflows from investing activities
(1,672,310) (2,117,459)
(1,678,335) (2,117,325)
Cash flows from financing activities Proceeds from issue of shares 20,000 6,530,000 20,000 6,530,000Transaction costs from issue of shares (21,342) (208,327) (21,342) (208,327)Security deposits (60,000) - (60,000) - Net cash inflows/(outflows) from financing activities (61,342) 6,321,673
(61,342) 6,321,673
Net increase/(decrease) in cash and cash equivalents (2,569,374) 3,358,639
(2,569,210) 3,358,295
Cash and cash equivalents at the beginning of the financial year 4,542,813 1,184,174 4,542,383 1,184,088 Cash and cash equivalents at the end of the financial year
24(b) 1,973,439 4,542,813 1,973,173 4,542,383
Notes to and forming part of the Cash Flow Statements are set out on Pages 19 to 49.
INDO MINES LIMITED ANNUAL FINANCIAL REPORT 2008
Page 17
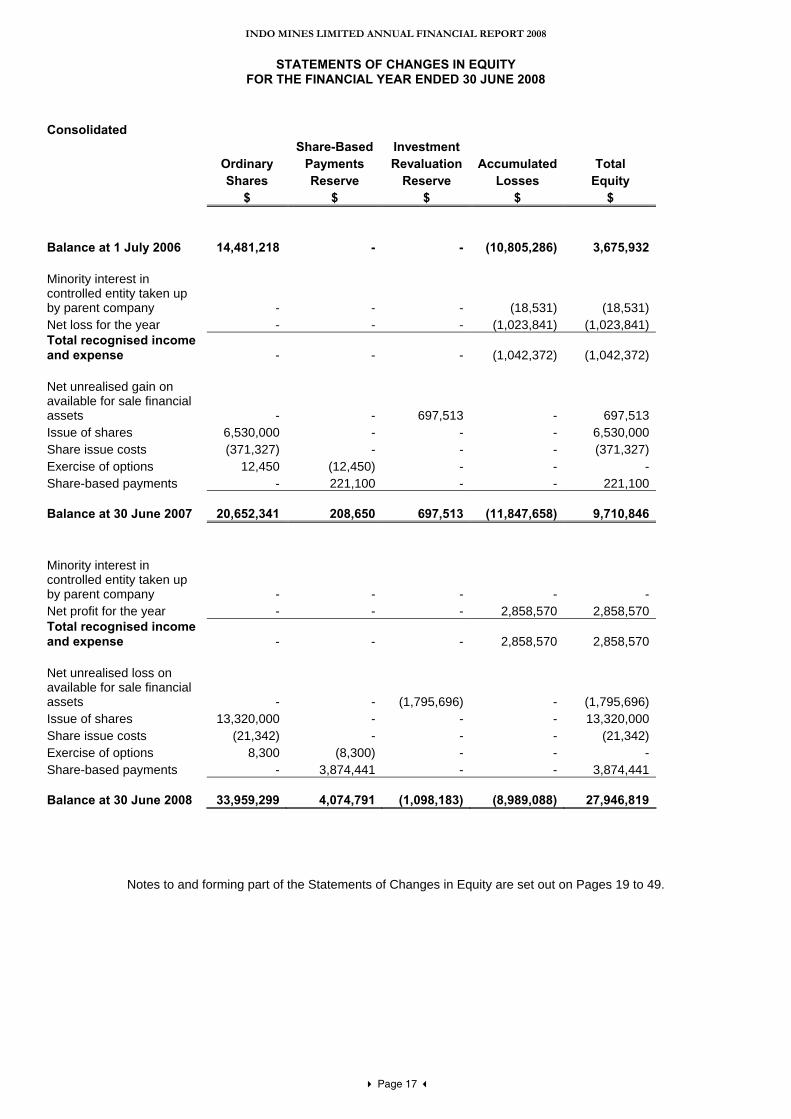
STATEMENTS OF CHANGES IN EQUITY FOR THE FINANCIAL YEAR ENDED 30 JUNE 2008
Consolidated Share-Based Investment
Ordinary Payments Revaluation Accumulated Total Shares Reserve Reserve Losses Equity $ $ $ $ $
Balance at 1 July 2006 14,481,218 - - (10,805,286) 3,675,932 Minority interest in controlled entity taken up by parent company - - - (18,531) (18,531) Net loss for the year - - - (1,023,841) (1,023,841) Total recognised income and expense - - - (1,042,372) (1,042,372) Net unrealised gain on available for sale financial assets - - 697,513 - 697,513 Issue of shares 6,530,000 - - - 6,530,000 Share issue costs (371,327) - - - (371,327) Exercise of options 12,450 (12,450) - - - Share-based payments - 221,100 - - 221,100 Balance at 30 June 2007
20,652,341
208,650
697,513 (11,847,658) 9,710,846
Minority interest in controlled entity taken up by parent company - - - - - Net profit for the year - - - 2,858,570 2,858,570 Total recognised income and expense - - - 2,858,570 2,858,570 Net unrealised loss on available for sale financial assets - - (1,795,696) - (1,795,696) Issue of shares 13,320,000 - - - 13,320,000 Share issue costs (21,342) - - - (21,342) Exercise of options 8,300 (8,300) - - - Share-based payments - 3,874,441 - - 3,874,441 Balance at 30 June 2008 33,959,299 4,074,791 (1,098,183) (8,989,088) 27,946,819
Notes to and forming part of the Statements of Changes in Equity are set out on Pages 19 to 49.

INDO MINES LIMITED ANNUAL FINANCIAL REPORT 2008
Page 18
STATEMENTS OF CHANGES IN EQUITY FOR THE FINANCIAL YEAR ENDED 30 JUNE 2008
Company Share-Based Investment
Ordinary Payments Revaluation Accumulated Total Shares Reserve Reserve Losses Equity $ $ $ $ $
Balance at 1 July 2006 14,481,218 - - (10,821,669) 3,659,549 Net loss for the year - - - (1,024,419) (1,024,419) Total recognised income and expense - - - (1,024,419) (1,024,419) Net unrealised gain on available for sale financial assets - - 697,513 - 697,513 Issue of shares 6,530,000 - - - 6,530,000 Share issue costs (371,327) - - - (371,327) Exercise of options 12,450 (12,450) - - - Share-based payments - 221,100 - - 221,100 Balance at 30 June 2007 20,652,341
208,650
697,513
(11,846,088)
9,712,416
Net profit for the year - - - 2,858,882 2,858,882 Total recognised income and expense - - - 2,858,882 2,858,882 Net unrealised loss on available for sale financial assets - - (1,795,696) - (1,795,696) Issue of shares 13,320,000 - - - 13,320,000 Share issue costs (21,342) - - - (21,342) Exercise of options 8,300 (8,300) - - - Share-based payments - 3,874,441 - - 3,874,441 Balance at 30 June 2008 33,959,299 4,074,791 (1,098,183) (8,987,206) 27,948,701
Notes to and forming part of the Statements of Changes in Equity are set out on Pages 19 to 49.

INDO MINES LIMITED ANNUAL FINANCIAL REPORT 2008
NOTES TO AND FORMING PART OF THE FINANCIAL STATEMENTS
Page 19
1. STATEMENT OF SIGNIFICANT ACCOUNTING POLICIES The principal accounting policies adopted in preparing the financial report of the Company, Indo Mines Limited and its consolidated entities (“Consolidated Entity” or “Group”) for the year ended 30 June 2008 are stated to assist in a general understanding of the financial report. These policies have been consistently applied to all the years presented, except as described below. Indo Mines Limited is a company limited by shares incorporated in Australia whose shares are publicly traded on the Australian Securities Exchange. The financial report of the Company for the year ended 30 June 2008 was authorised for issue in accordance with a resolution of the Directors on 26 September 2008. (a) Basis of Preparation The financial report is a general purpose financial report which has been prepared in accordance with Australian Accounting Standards (“AASBs”) including Australian Accounting Interpretations, other authoritative pronouncements of the Australian Accounting Standards Board and the Corporations Act 2001. The financial report has also been prepared on an accruals basis and is based on historical costs, except for available-for-sale investments, which have been measured at fair value. The financial report is presented in Australian dollars. The preparation of financial statements in conformity with Australian equivalents to International Financial Reporting Standards (AIFRS) requires the use of certain critical accounting estimates. It also requires management to exercise its judgment in the process of applying the Group’s accounting policies. The areas involving a higher degree of judgment or complexity, or areas where assumptions and estimates are significant to the financial statements, are disclosed in Note 21. (b) Statement of Compliance The financial report complies with Australian Accounting Standards, which include AIFRS. The financial report also complies with International Financial Reporting Standards (IFRS). Australian Accounting Standards and Interpretations that have recently been issued or amended but are not yet effective have not been adopted by the Group for the annual reporting period ended 30 June 2008. These are outlined in the table below: Reference Title Summary Application
date of standard
Impact on Group financial report
Application date for Group
AASB 8 Operating Segments
Replaces the presentation requirements of segment reporting in AASB 114 Segment Reporting.
1 January 2009
AASB 8 is a disclosure standard so will have no direct impact on the amounts included in the Group’s financial statements.
1 July 2009
AASB 2007-3
Amendments to Australian Accounting Standards [AASB 5, AASB 6, AASB 102, AASB 107, AASB 119, AASB 127, AASB 134, AASB 136, AASB 1023, & AASB 1038]
Amendments arise from the release of AASB 8 Operating Segments
1 January 2009
As above. 1 July 2009

INDO MINES LIMITED ANNUAL FINANCIAL REPORT 2008
NOTES TO AND FORMING PART OF THE FINANCIAL STATEMENTS
Page 20
1. STATEMENT OF SIGNIFICANT ACCOUNTING POLICIES (continued) (b) Statement of Compliance (continued) Reference Title Summary Application
date of standard
Impact on Group financial report
Application date for Group
AASB I-12 Service Concession Arrangements
This Interpretation gives guidance on the accounting by operators for public-to-private service concession arrangements.
1 January 2008
As the Group is not a party to any service concession arrangements, this interpretation is not expected to have any impact on the Group’s financial report.
1 July 2008
AASB 2007-2
Amendments to Australian Accounting Standards [AASB 1, AASB 117, AASB 118, AASB 120, AASB 121, AASB 127, AASB 131, & AASB 139.]
Amendments arise from the release of AASB Interpretation 11.
1 January 2008
As above. 1 July 2008
AASB 2007-6
Amendments to Australian Accounting Standards arising from AASB 123 [AASB 1, AASB 101, AASB 107, AASB 111, AASB 116 & AASB 138 and Interpretations 1 & 12]
Amending standard issued as a consequence of AASB 123 (revised) Borrowing Costs.
1 January 2009
As the Group does not currently construct or produce any qualifying assets which are financed by borrowings the revised standard will have no impact.
1 July 2009
AASB 123 (revised June 2007)
Borrowing Costs AASB 123 previously permitted entities to choose between expensing all borrowing costs and capitalising those that were attributable to the acquisition, construction or production of a qualifying asset. The revised version of AASB 23 requires borrowing costs to be capitalised if they are directly attributable to the acquisition, construction or production of a qualifying asset.
1 January 2009
Refer to AASB 2007-6 above.
1 July 2009

INDO MINES LIMITED ANNUAL FINANCIAL REPORT 2008
NOTES TO AND FORMING PART OF THE FINANCIAL STATEMENTS
Page 21
1. STATEMENT OF SIGNIFICANT ACCOUNTING POLICIES (continued) (b) Statement of Compliance (continued)
Reference Title Summary Application date of
standard
Impact on Group financial report
Application date for Group
AASB Interpretation 129 (revised June 2007)
Service Concession Arrangements: Disclosures
The revised interpretation was issued as a result of Interpretation 12 and requires specific disclosures about service concession arrangements entered into by an entity, whether as a concession provider or a concession operator.
1 January 2008
Refer to AASB 2007-2 above.
1 July 2008
(c) Principles of Consolidation The consolidated financial statements incorporate the assets and liabilities of all subsidiaries of Indo Mines Limited (“Company” or “Parent Entity”) as at 30 June 2008 and the results of all subsidiaries for the year then ended. Indo Mines Limited and its subsidiaries together are referred to as the Group or the Consolidated Entity. Subsidiaries are all those entities (including special purpose entities) over which the Group has the power to govern the financial and operating policies, generally accompanying a shareholding of more than one-half of the voting rights. The existence and potential effect of potential voting rights that are currently exercisable or convertible are considered when assessing whether the Group controls another entity. Subsidiaries are fully consolidated from the date on which control is transferred to the Group. They are de-consolidated from the date that control ceases. Intercompany transactions and balances, and unrealised gains on transactions between Group companies, are eliminated. Unrealised losses are also eliminated unless the transaction provides evidence of the impairment of the asset transferred. Accounting policies of subsidiaries have been changed where necessary to ensure consistency with the policies adopted by the Group. (d) Exploration and evaluation expenditure Exploration and evaluation expenditure encompasses expenditures incurred by the Group in connection with the exploration for and evaluation of mineral resources before the technical feasibility and commercial viability of extracting a mineral resource are demonstrable. Exploration and evaluation expenditure incurred by the Group is accumulated for each area of interest and recorded as an asset if:
(i) the rights to tenure of the area of interest are current; and (ii) at least one of the following conditions is also met:
(1) the exploration and evaluation expenditures are expected to be recouped through successful development and exploitation of the area of interest, or alternatively, by its sale; and/or
(2) exploration and evaluation activities in the area of interest have not at the reporting date reached a stage which permits a reasonable assessment of the existence or otherwise of economically recoverable reserves, and active and significant operations in, or in relation to, the area of interest are continuing.
For each area of interest, expenditure incurred in the acquisition of rights to explore is capitalised, classified as tangible or intangible, and recognised as an exploration and evaluation asset. Exploration and evaluation assets are measured at cost at recognition. Exploration and evaluation expenditure incurred by the Group subsequent to acquisition of the rights to explore is expensed as incurred, up to costs associated with the preparation of a feasibility study.
INDO MINES LIMITED ANNUAL FINANCIAL REPORT 2008
NOTES TO AND FORMING PART OF THE FINANCIAL STATEMENTS
Page 22
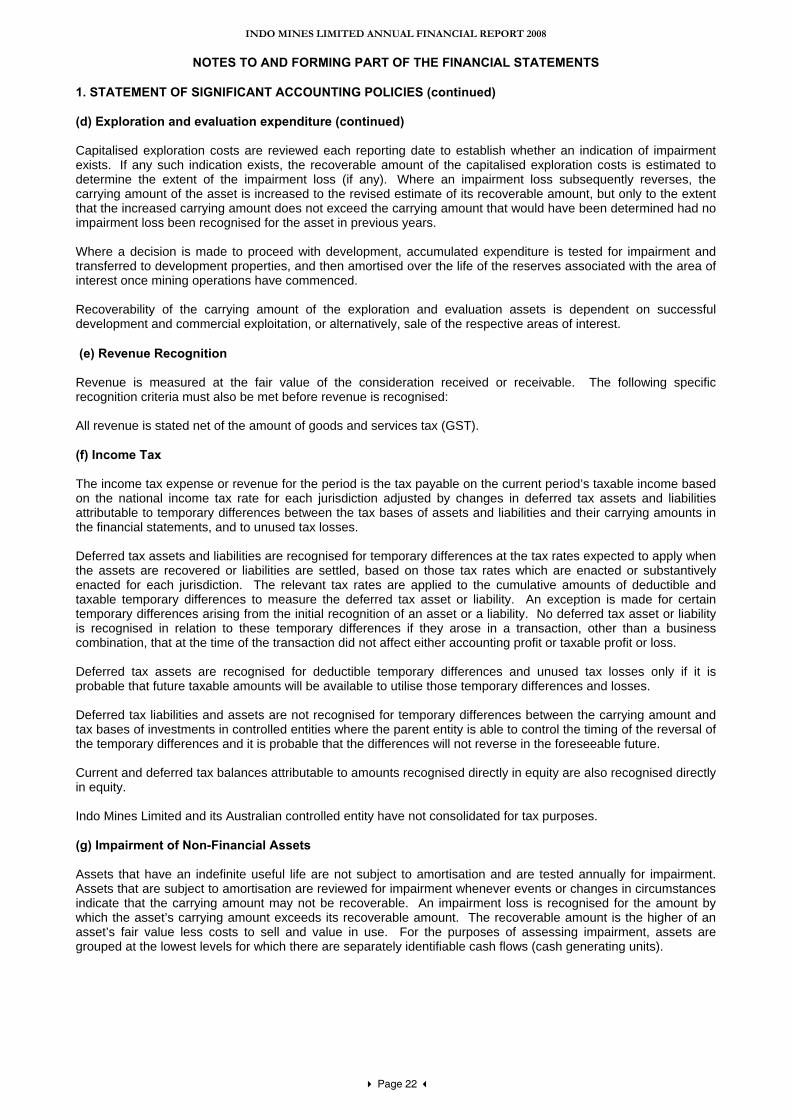
1. STATEMENT OF SIGNIFICANT ACCOUNTING POLICIES (continued) (d) Exploration and evaluation expenditure (continued) Capitalised exploration costs are reviewed each reporting date to establish whether an indication of impairment exists. If any such indication exists, the recoverable amount of the capitalised exploration costs is estimated to determine the extent of the impairment loss (if any). Where an impairment loss subsequently reverses, the carrying amount of the asset is increased to the revised estimate of its recoverable amount, but only to the extent that the increased carrying amount does not exceed the carrying amount that would have been determined had no impairment loss been recognised for the asset in previous years. Where a decision is made to proceed with development, accumulated expenditure is tested for impairment and transferred to development properties, and then amortised over the life of the reserves associated with the area of interest once mining operations have commenced.
Recoverability of the carrying amount of the exploration and evaluation assets is dependent on successful development and commercial exploitation, or alternatively, sale of the respective areas of interest. (e) Revenue Recognition Revenue is measured at the fair value of the consideration received or receivable. The following specific recognition criteria must also be met before revenue is recognised: All revenue is stated net of the amount of goods and services tax (GST). (f) Income Tax The income tax expense or revenue for the period is the tax payable on the current period’s taxable income based on the national income tax rate for each jurisdiction adjusted by changes in deferred tax assets and liabilities attributable to temporary differences between the tax bases of assets and liabilities and their carrying amounts in the financial statements, and to unused tax losses.
Deferred tax assets and liabilities are recognised for temporary differences at the tax rates expected to apply when the assets are recovered or liabilities are settled, based on those tax rates which are enacted or substantively enacted for each jurisdiction. The relevant tax rates are applied to the cumulative amounts of deductible and taxable temporary differences to measure the deferred tax asset or liability. An exception is made for certain temporary differences arising from the initial recognition of an asset or a liability. No deferred tax asset or liability is recognised in relation to these temporary differences if they arose in a transaction, other than a business combination, that at the time of the transaction did not affect either accounting profit or taxable profit or loss. Deferred tax assets are recognised for deductible temporary differences and unused tax losses only if it is probable that future taxable amounts will be available to utilise those temporary differences and losses. Deferred tax liabilities and assets are not recognised for temporary differences between the carrying amount and tax bases of investments in controlled entities where the parent entity is able to control the timing of the reversal of the temporary differences and it is probable that the differences will not reverse in the foreseeable future. Current and deferred tax balances attributable to amounts recognised directly in equity are also recognised directly in equity. Indo Mines Limited and its Australian controlled entity have not consolidated for tax purposes. (g) Impairment of Non-Financial Assets Assets that have an indefinite useful life are not subject to amortisation and are tested annually for impairment. Assets that are subject to amortisation are reviewed for impairment whenever events or changes in circumstances indicate that the carrying amount may not be recoverable. An impairment loss is recognised for the amount by which the asset’s carrying amount exceeds its recoverable amount. The recoverable amount is the higher of an asset’s fair value less costs to sell and value in use. For the purposes of assessing impairment, assets are grouped at the lowest levels for which there are separately identifiable cash flows (cash generating units).
INDO MINES LIMITED ANNUAL FINANCIAL REPORT 2008
NOTES TO AND FORMING PART OF THE FINANCIAL STATEMENTS
Page 23
1. SUMMARY OF SIGNIFICANT ACCOUNTING POLICIES (continued) (h) Cash and Cash Equivalents Cash and cash equivalents includes cash on hand, deposits held at call with financial institutions, other short-term highly liquid investments that are readily convertible to known amounts of cash and which are subject to an insignificant risk of changes in value, and bank overdrafts. Bank overdrafts are shown within borrowings in current liabilities on the balance sheet. (i) Trade Receivables Trade receivables are recognised initially at fair value and subsequently measured at amortised cost less an allowance for doubtful debts. Trade receivables are due for settlement no more than 30 days from the date of recognition. An estimate of doubtful debts is made when collection of the full amount is no longer probable. Bad debts are written off as incurred. (j) Investments and Other Financial Assets The Group classifies its investments in the following categories: financial assets at fair value through profit or loss, loans and receivables, held-to-maturity investments, and available-for-sale financial assets. The classification depends on the purpose for which the investments were acquired. Management determines the classification of its investments at initial recognition and re-evaluates this designation at each reporting date. (i) Financial assets at fair value through profit or loss Financial assets at fair value through profit or loss are financial assets held for trading. A financial asset is classified in this category if acquired principally for the purpose of selling in the short term. Derivatives are also categorised as held for trading unless they are designated as hedges. Assets in this category are classified as current assets. (ii) Loans and receivables Loans and receivables are non-derivative financial assets with fixed or determinable payments that are not quoted in an active market. They arise when the Group provides money, goods or services directly to a debtor with no intention of selling the receivable. They are included in current assets, except for those with maturities greater than twelve months after the balance sheet date which are classified as non-current assets. Loans and receivables are included in other financial assets in the balance sheet. (iii) Held-to-maturity investments Held-to-maturity investments are non-derivative financial assets with fixed or determinable payments and fixed maturities that the Group’s management has the positive intention and ability to hold to maturity. (iv) Available-for-sale financial assets Available-for-sale financial assets, comprising principally marketable equity securities, are non-derivatives that are either designated in this category or not classified in any of the other categories. They are included in non-current assets unless management intends to dispose of the investment within twelve months of the balance sheet date. Purchases and sales of investments are recognised on trade-date – the date on which the Group commits to purchase or sell the asset. Investments are initially recognised at fair value plus transaction costs for all financial assets not carried at fair value through profit or loss. Financial assets are derecognised when the rights to receive cash flows from the financial assets have expired or have been transferred and the Group has transferred substantially all the risks and rewards of ownership. Subsequent to initial recognition, investments in subsidiaries are measured at cost. Subsequent to initial recognition, investments in associates are accounted for under the equity method in the consolidated financial statements and the cost method in the company financial statements. Available-for-sale financial assets and financial assets at fair value through profit or loss are subsequently carried at fair value. Loans and receivables and held-to-maturity investments are carried at amortised cost using the effective interest rate method. Realised and unrealised gains and losses arising from changes in the fair value of the ‘financial assets at fair value through profit or loss’ category are included in the income statement in the period in which they arise. Unrealised gains and losses arising from changes in the fair value of non-monetary securities classified as available-for-sale are recognised in equity in the available-for-sale investments revaluation reserve. When securities classified as available-for-sale are sold or impaired, the accumulated fair value adjustments are included in the income statement as gains and losses from investment securities. The fair values of quoted investments are based on current bid prices. If the market for a financial asset is not active (and for unlisted securities), the Group establishes fair value by using valuation techniques. These include reference to the fair values of recent arm’s length transactions, involving the same instruments or other instruments that are substantially the same, discounted cash flow analysis, and option pricing models.
INDO MINES LIMITED ANNUAL FINANCIAL REPORT 2008
NOTES TO AND FORMING PART OF THE FINANCIAL STATEMENTS
Page 24
1. SUMMARY OF SIGNIFICANT ACCOUNTING POLICIES (continued) (j) Investments and Other Financial Assets (continued) The Group assesses at each balance date whether there is objective evidence that a financial asset or group of financial assets is impaired. In the case of equity securities classified as available-for-sale, a significant or prolonged decline in the fair value of a security below its cost is considered in determining whether the security is impaired. If any such evidence exists for available-for-sale financial assets, the cumulative loss – measured as the difference between the acquisition cost and the current fair value, less any impairment loss on that financial asset previously recognised in profit and loss – is removed from equity and recognised in the income statement. Impairment losses recognised in the income statement on equity instruments are not reversed through the income statement.
(k) Fair value estimation The fair value of financial instruments traded in active markets (such as publicly traded derivatives, and trading and available-for-sale securities) is based on quoted market prices at the balance sheet date. The quoted market price used for financial assets held by the Group is the current bid price; the appropriate quoted market price for financial liabilities is the current ask price. The fair value of financial instruments that are not traded in an active market (for example, over the counter derivatives) is determined using valuation techniques. The Group uses a variety of methods and makes assumptions that are based on market conditions existing at each balance date. Quoted market prices or dealer quotes for similar instruments are used for long-term debt instruments held. Other techniques, such as discounted cash flows, are used to determine fair value for the remaining financial instruments. The fair value of interest-rate swaps is calculated as the present value of the estimated future cash flows. The fair value of forward exchange contracts is determined using forward exchange market rates at the balance sheet date. (l) Property, Plant and Equipment Plant and equipment is stated at historical cost less depreciation. Historical cost includes expenditure that is directly attributable to the acquisition of the items. Subsequent costs are included in the asset’s carrying amount or recognised as a separate asset, as appropriate, only when it is probable that future economic benefits associated with the item will flow to the Group and the cost of the item can be measured reliably. All other repairs and maintenance are charged to the income statement during the financial period in which they are incurred. Plant and equipment are depreciated or amortised on a reducing balance or straight line basis at rates based upon their expected useful lives as follows:
Life
Plant and equipment 2 - 40 years The assets’ residual values and useful lives are reviewed, and adjusted if appropriate, at each balance sheet date. Gains and losses on disposals are determined by comparing proceeds with carrying amount. These are included in the income statement.
(m) Trade and Other Payables
Liabilities for trade creditors and other amounts are carried at cost which is the fair value of the consideration to be paid in the future for goods and services received, whether or not billed to the consolidated entity. The amounts are unsecured and are usually paid within 30 days. Payables to related parties are carried at the principal amount. (n) Employee Benefits Liabilities for wages and salaries, including non-monetary benefits and annual leave expected to be settled within twelve months of the reporting date are recognised in provisions in respect of employees’ services up to the reporting date and are measured at the amounts expected to be paid when the liabilities are settled. Liabilities for non-accumulating sick leave are recognised when the leave is taken and measured at the rates paid or payable. Employee benefits payable later than one year are measured at the present value of the estimated future cash flows to be made for those benefits.

INDO MINES LIMITED ANNUAL FINANCIAL REPORT 2008
NOTES TO AND FORMING PART OF THE FINANCIAL STATEMENTS
Page 25
1. SUMMARY OF SIGNIFICANT ACCOUNTING POLICIES (continued) (o) Issued Capital Ordinary shares are classified as equity. Issued and paid up capital is recognised at the fair value of the consideration received by the Company. Incremental costs directly attributable to the issue of new shares or options are shown in equity as a deduction, net of tax, from the proceeds. (p) Dividends Provision is made for the amount of any dividend declared on or before the end of the year but not distributed at balance date. (q) Earnings per Share Basic earnings per share is calculated by dividing the profit/loss attributable to equity holders of the Company, excluding any costs of servicing equity other than ordinary shares, by the weighted average number of ordinary shares outstanding during the year, adjusted for bonus elements in ordinary shares issued during the year. Diluted earnings per share adjusts the figures used in the determination of basic earnings/loss per share to take into account the after tax effect of interest and other financing costs associated with dilutive potential ordinary shares and the weighted average number of shares assumed to have been issued for no consideration in relation to dilutive potential ordinary shares. (r) Goods and Services Tax
Revenues, expenses and assets are recognised net of the amount of GST except:
• where the GST incurred on a purchase of goods and services is not recoverable from the taxation authority, in which case the GST is recognised as part of the cost of acquisition of the asset or as part of the expense item as applicable; and
• receivables and payables are stated with the amount of GST included. The net amount of GST recoverable from, or payable to, the taxation authority is included as part of receivables or payables in the balance sheet. Cash flows are included in the Cash Flow Statement on a gross basis and the GST component of cash flows arising from investing and financing activities, which is recoverable from, or payable to, the taxation authority are classified as operating cash flows.
(s) Share-Based Payments Share-based payments are provided to Directors, employees, consultants and other advisors. The fair value of options granted (determined using the Black-Scholes option pricing model) is recognised as an expense with a corresponding increase in equity. The fair value is measured at grant date and recognised over the period during which option holders become unconditionally entitled to the options. (t) Segment Reporting A business segment is a group of assets and operations engaged in providing products or services that are subject to risks and returns that are different to those of other business segments. A geographical segment is engaged in providing products or services within a particular economic environment and is subject to risks and returns that are different from those of segments operating in other economic environments. The company operates in a single business segment, being the mining and exploration for diamonds, precious metals and industrial minerals, in three geographical segments, being Australia, Indonesia and Peru.

INDO MINES LIMITED ANNUAL FINANCIAL REPORT 2008
NOTES TO AND FORMING PART OF THE FINANCIAL STATEMENTS
Page 26
1. SUMMARY OF SIGNIFICANT ACCOUNTING POLICIES (continued) (u) Foreign Currency Translation Functional and presentation currency Items included in the financial statements of each of the Group’s entities are measured using the currency of the primary economic environment in which the entity operates (“the functional currency”). The consolidated financial statements are presented in Australian dollars, which is Indo Mines Limited’s functional and presentation currency. Transactions and balances Foreign currency transactions are translated into functional currency using the exchange rates prevailing at the dates of the transactions. Foreign exchange gains and losses resulting from the settlement of such transactions and from the translation at year-end exchange rates of monetary assets and liabilities denominated in foreign currencies are recognised in the income statement, except when deferred in equity as qualifying cash flow hedges and qualifying net investments hedges.
Consolidated Company 2008 2007 2008 2007
2. PROFIT/(LOSS) FROM OPERATIONS
$ $ $ $
(a) Other income Gain on disposal of mineral rights 7,850,000 425,963 7,850,000 425,963 (b) Profit/(loss) before tax Profit/(loss) before income tax has been arrived at after charging the following expenses attributable to continuing operations: Exploration, evaluation and
development expenditure
Impairment losses on exploration and evaluation assets
15,463
729,130
-
523,764
Write back of capitalised exploration and evaluation expenditure
-
(19,450)
-
(19,450)
Share based payments expense 2,711,191 - 2,711,191 - Exploration expenditure 311,099 269,403 311,098 269,263 3,037,753 979,083 3,022,289 773,577 Business development expenses Transaction costs related to project
acquisition
-
66,000
-
66,000 Project evaluation expenses 16,045 - 16,045 - 16,045 66,000 16,045 66,000 Administration expenses Depreciation – plant and equipment 18,410 9,121 18,410 9,121 Impairment losses on plant and equipment - 5,519 - 5,519 Property expenses 75,381 28,103 75,381 28,103 Corporate expenses 277,627 332,621 275,627 331,618 Audit expenses 40,364 26,850 32,364 23,600 Employee benefits expense 134,655 87,323 134,655 86,623 Share based payments expense 1,163,250 58,100 1,163,250 58,100 Other expenses 111,673 26,675 111,673 24,139 1,821,360 574,312 1,811,360 566,823
Other expenses Provision for write-down of intercompany
loan
-
-
21,489
213,730 (c) Financial income Interest revenue 144,841 124,772 144,824 124,768 Gain on disposal of other financial assets 596,880 - 596,880 - Impairment reversal on other financial
assets - 48,000 - 48,000 741,721 172,772 741,704 172,768

INDO MINES LIMITED ANNUAL FINANCIAL REPORT 2008
NOTES TO AND FORMING PART OF THE FINANCIAL STATEMENTS
Page 27
Consolidated Company
2008 2007 2008 2007 $ $ $ $ 3. INCOME TAX (a) Recognised in the income statement
Current income tax 936,658 (125,367) 938,710 (123,343) Deferred income tax: Adjustments in relation to current income tax or previous years (282,176) 59,061 (461,220) 20,689 Origination and reversal of temporary differences 836,117 - 830,871 - Temporary differences not previously brought to account (637,448) (376,516) (455,158) (402,113) Income tax benefit not recognised - 442,822 - 504,767 Income tax expense reported in the income Statement 853,151
- 853,203
-
(b) Recognised directly in equity
Deferred income tax related to items charged or credited directly to equity
Available-for-sale financial assets 262,208 - 262,208 - Income tax expense/(benefit) reported in equity 262,208 - 262,208 -
(c) Reconciliation of income tax expense to prima facie tax payable
Profit/(loss) from continuing operations before income tax 3,711,721 (1,023,841) 3,715,885 (1,024,419)
Tax at the Australian tax rate of 30% (2007: 30%)
1,113,516
(307,152)
1,114,766
(307,326) Tax effect of amounts which are not deductible/(taxable) in calculating taxable income:
Entertainment 414 415 414 415 Income not assessable for income tax purposes (513,000) - (513,000) - Blackhole expenditure 4,814 (23,540) 4,814 (23,540) Provision for dimunition - 209,254 - 209,254 Exploration, evaluation and development expenditure
4,443
(384,265)
-
(407,503)
Sundry items 256 (14,025) 255 (14,186) Share-based payments 1,162,332 17,430 1,162,332 17,430 Temporary differences not previously brought to account
(637,448)
-
(455,158)
-
Adjustments in relation to current income tax of previous years
(282,176)
59,061
(461,220)
20,689
(260,365) (442,822) (261,563) (504,767) Income tax benefit not recognised - 442,822 - 504,767
Income tax expense 853,151 - 853,203 - (d) Tax losses not brought to account
Unused tax losses for which no deferred tax asset has been recognised - 1,545,578 - 752,814 Potential tax benefit @ 30% (2007: 30%) - 463,763 - 225,844

INDO MINES LIMITED ANNUAL FINANCIAL REPORT 2008
NOTES TO AND FORMING PART OF THE FINANCIAL STATEMENTS
Page 28
3. INCOME TAX (continued) (e) Tax Consolidation
The Board has not yet resolved to consolidate eligible entities within the Group for tax purposes. The Board will review this position annually, before lodgement of the year’s tax return.
Consolidated Company 2008 2007 2008 2007
(f) Deferred income tax
$ $ $ $
Deferred income tax relates to the following:
Deferred tax liabilities
Available-for-sale investments 262,208 209,254 262,208 - Deferred tax assets used to offset
deferred tax liabilities
(83,507) (209,254) (81,707) - 178,701 - 180,501 - Deferred tax assets Share issue costs 58,562 - 58,562 - Provisions 7,245 2,359 7,245 2,359 Accrued expenses 17,700 14,287 15,900 13,687 Exploration and evaluation assets - 157,129 - 157,129 Deferred tax assets used to offset
deferred tax liabilities
(83,507)
(209,254) (81,707) - Tax losses available to offset against
future taxable income
- 463,673 - 225,844 Deferred tax assets not brought to
account
- (428,194) - (399,019) - - - - Note The benefit of deferred tax assets not brought to account will only be brought to account if:-
(a) future assessable income is derived of a nature and of an amount sufficient to enable the benefit to be realised;
(b) the conditions for deductibility imposed by tax legislation continue to be complied with; and (c) no changes in tax legislation adversely affect the Company in realising the benefit.
4. CURRENT ASSETS – Trade and other receivables
GST receivable 37,103 78,372 37,103 78,372Sundry debtors 668 - 668 - 37,771 78,372 37,771 78,372 5. CURRENT ASSETS – Other financial assets
Available-for-sale financial assets at fair value: Shares – listed Options – listed Options – unlisted
5,304,50037,000
-
1,012,42555,000
218,126
5,304,500
37,000 -
1,012,42555,000
218,126
5,341,500 1,285,551
5,341,500 1,285,551
Available-for-sale financial assets comprise investments in listed ordinary shares, listed options and unlisted options. For the year ended 30 June 2007, the Directors sought independent advice regarding the fair value of the unlisted available-for-sale financial assets. Based on this advice the Board determined the fair value to be $218,126. There are no unlisted available-for-sale financial assets as at 30 June 2008.

INDO MINES LIMITED ANNUAL FINANCIAL REPORT 2008
NOTES TO AND FORMING PART OF THE FINANCIAL STATEMENTS
Page 29
Consolidated Company
Note 2008 2007 2008 2007 $ $ $ $ 6. NON-CURRENT ASSETS – Trade and other receivables
Loans to controlled entities (unsecured) - - 1,657,785 1,635,596Less impairment provision - - (1,657,785) (1,635,596) - - - - 7. NON-CURRENT ASSETS – Investments (a) Investments comprise: Shares in controlled entities - at cost 19
-
-
100,005
100,005
Less impairment provision for dimunition - - (100,005) (100,005) Net carrying amount - - - - (b) Financial Support of Controlled Entities
By a resolution of directors, the parent entity has committed itself to providing financial support to its controlled entity so that it may meet its debts as and when they fall due. The directors believe that no adjustment is required to the carrying value of the parent entity’s investment in this entity or the loans receivable from this entity, except as disclosed in notes 6 and 7(a). In forming this opinion the directors have relied upon their assessment of the future prospects of this entity. The fair value of the financial guarantee is considered to be $nil (2007: $nil)
(c) Investment in Controlled Entities
The parent entity has an investment at cost of $100,001 (2007: $100,001) and has advanced loan funds of $1,657,785 (2007: $1,635,596) as at 30 June 2008, to a controlled entity, Terrace Gold NL (“Terrace”). The principal asset of Terrace is deferred exploration and evaluation expenditure in respect of its overseas areas of interest. The recoupment of the loan and investment in Terrace is therefore dependent upon the successful development and commercial exploitation, or sale of the respective areas of interest, or alternatively the raising of additional capital by Terrace. The directors are confident of the future prospects of Terrace, but conservatively have made a provision for non-recovery of the loan (refer to Note 6), a full impairment adjustment in relation to the carried value of the exploration, evaluation and development expenditure, and a provision for diminution in the carrying value of the investment (refer to Note 7(a)). During the financial year the Company incorporated a wholly owned subsidiary, Indo Mines (Indonesia) Pty Ltd. The Board has also made a provision for the diminution in the carrying value of the investment of this subsidiary (refer to Note 7(a)). The Company also has an investment at cost of $1 as at 30 June 2008 in Indo Energy Pty Ltd (2007: $1). 8. NON-CURRENT ASSETS – Property, Plant and Equipment (a) Office furniture and equipment Cost
63,596
29,360
63,596
29,360
Accumulated depreciation and impairment (20,694) (2,284) (20,694) (2,284) Net carrying amount
42,902
27,076
42,902
27,076
(b) Reconciliation Carrying amount at beginning of year, net of accumulated depreciation and impairment
27,076
46,468
27,076
46,468 Additions 34,236 29,360 34,236 29,360 Disposals - (34,112) - (34,112) Impairment loss - (5,519) - (5,519) Depreciation charge for the year (18,410) (9,121) (18,410) (9,121) Carrying amount at end of year, net of accumulated depreciation and impairment
42,902
27,076
42,902
27,076

INDO MINES LIMITED ANNUAL FINANCIAL REPORT 2008
NOTES TO AND FORMING PART OF THE FINANCIAL STATEMENTS
Page 30
Consolidated Company
2008 2007 2008 2007 $ $ $ $ 9. NON-CURRENT ASSETS – Exploration and evaluation assets The Company has mineral exploration costs carried forward in respect of the following areas of interest: (a) Areas of interest:
Indonesia
Jogjakarta Ironsands Project 21,798,342 3,967,063 21,798,342 3,967,063 21,798,342 3,967,063 21,798,342 3,967,063
Peru
Chinguela - - - - Nangali - - - - - - - - 21,798,342 3,967,063 21,798,342 3,967,063 (b) Reconciliation Carrying amount at beginning of year 3,967,063 2,629,375 3,967,063 2,501,469 Deferred exploration, evaluation and development expenditure incurred
4,546,742
2,148,443
4,531,279
2,070,983
Expenditure associated with acquisitions 13,300,000 - 13,300,000 - Disposal of interest in mining tenements - (101,075) - (101,075) Amounts written back/(off) during the year - 19,450 - 19,450 Impairment adjustment (15,463) (729,130) - (523,764) Carrying amount at end of year, at cost
21,798,342
3,967,063
21,798,342
3,967,063
The ultimate recoupment of the above deferred exploration, evaluation and development expenditure is dependent upon the successful development and commercial exploitation or, alternatively, sale of the respective areas of interest. All of the above expenditure relates to exploration and evaluation phases. During the year the Company has expended funds totaling $4,531,279 (2007: $2,089,832) through Jogja Magasa Mining, an Indonesian registered company which owns the Jogjakarta Ironsands project. The Company is funding a feasibility study on the project in order to increase its interest in the project to 70%. During the 2007 year the Company became beneficially entitled to a 30% interest following completion of a JORC compliant measured resource at Jogjakarta. 10. CURRENT LIABILITIES – Trade and other payables
Trade creditors 72,287 77,693 66,287 77,693Accrued expenses 85,258 98,314 85,258 96,314Other payables 20,081 16,158 20,081 16,158 177,626 192,165
171,626 190,165
INDO MINES LIMITED ANNUAL FINANCIAL REPORT 2008
NOTES TO AND FORMING PART OF THE FINANCIAL STATEMENTS
Page 31
Consolidated Company
2008 2007 2008 2007 $ $ $ $
11. CURRENT LIABILITIES – Provisions
Employee benefits 24,150 7,864 24,150 7,864 (a) Movement in provisions Opening balance 7,864 40,241 7,864 40,241Amounts paid to employees - (40,241) - (40,241)Additional provisions 16,286 7,864 16,286 7,864Closing balance 24,150 7,864 24,150 7,864
12. ISSUED CAPITAL
(a) Issued and paid up capital: 80,731,745 (2007: 70,631,745) fully paid ordinary shares 33,959,299 20,652,341
33,959,299 20,652,341
33,959,299 20,652,341
33,959,299 20,652,341 (b) Movements in ordinary share capital during the past two years were as follows:-
Date Details Number of Shares
$
1 Jul 2006 Opening Balance 50,481,745 14,481,218 8 Dec 2006 Placement at $0.17 10,000,000 1,700,000 23 Feb 2007 Placement at $0.48 10,000,000 4,800,000 25 May 2007 Exercise of $0.20 Options 150,000 30,000 Transfer from option premium reserve - 12,450 Share issue expenses - (371,327) 30 Jun 2007 Closing Balance 70,631,745 20,652,341 6 Jul 2007 Issue to Iron Sands Vendors 10,000,000 13,300,000 7 May 2008 Exercise of $0.20 Options 100,000 20,000 Transfer from option premium reserve - 8,300 Share issue expenses - (21,342) 30 Jun 2008 Closing Balance 80,731,745 33,959,299
Holders of ordinary shares have the right to receive dividends as declared and in the event of winding up the Company, to participate in the proceeds from the sale of all surplus assets in proportion to the number of shares held and the amount paid up. Shareholders are entitled to one vote per share held either in person or by proxy at a meeting of the company. Effective 1 July 1998, the Company Law Review Act abolished the concept of authorised capital. Accordingly, the Company does not have authorised capital or par value in respect of its issued shares. The Company also has issued share options (see Note 13(a)).

INDO MINES LIMITED ANNUAL FINANCIAL REPORT 2008
NOTES TO AND FORMING PART OF THE FINANCIAL STATEMENTS
Page 32
Consolidated Company
2008 2007 2008 2007 13. RESERVES
$ $ $ $
(a) Reserves:
Share-based payments reserve 450,000 (2007: 550,000) $0.20 Unlisted Options exercisable on or before31 July 2009 37,350 45,650 37,350 45,650 1,250,000 (2007: nil) $0.35 Incentive Options exercisable on or before 31 December 2009 1,327,500 - 1,327,500 - 1,250,000 (2007: nil) $0.45 Incentive Options exercisable on or before 30 June 2010 918,391 - 918,391 - 1,050,000 (2007: nil) $0.90 Unlisted Options exercisable on or before 30 November 2009 815,850 - 815,850 - 1,050,000 (2007: nil) $1.20 Unlisted Options exercisable on or before 30 November 2010 812,700 - 812,700 - 10,000,000 (2007: 10,000,000) $0.20 Unlisted Options exercisable on or before 30 June 2010 163,000 163,000 163,000 163,000 4,074,791 208,650 4,074,791 208,650Available-for-sale investment revaluation reserve Shares – listed Options – listed Options – unlisted Deferred tax liability in respect of unrealised taxable gain
(872,975)37,000
-
(262,208)
559,95044,00093,563
-
(872,975) 37,000
-
(262,208)
559,95044,00093,563
- (1,098,183) 697,513 (1.098,183) 697,513 Total Reserves 2,976,608 906,163 2,976,608 906,163 Share-based payments reserve The share-based payments reserve is used to recognise the fair value of share-based payments made by the Company. Available-for-sale investment revaluation reserve The available-for-sale investment revaluation reserve is used to record fair value changes on available-for-sale investments. (b) Movements in options during the past two years were as follows:
Date Details Number of $0.20
31 Jul 2009
Options
Number of $0.20 30
Jun 2010 Options
Number of $0.35 31
Dec 2009 Options
Number of $0.45 30
Jun 2010 Options
Number of $0.90 30
Nov 2009 Options
Number of $1.20 30
Nov 2010 Options
Cumulative share-based
payment reserve
$ 1 Jul 2006 Opening Balance - - - - - - - 3 Aug 2006 Grant of Options 700,000 - - - - - 58,100 6 Dec 2006 Grant of Options(1) - - - - - - 163,000 11 Dec 2006 Grant of Options - 9,000,000 - - - - - 25 May 2007 Exercise of Options (150,000) - - - - - (12,450) 30 Jun 2007 Closing Balance 550,000 9,000,000 - - - - 208,650 6 Jul 2007 Grant of Options - - 1,250,000 - - - 1,327,500 6 Jul 2007 Grant of Options - - - 1,250,000 - - 918,391 6 Jul 2007 Grant of Options - - - - 1,050,000 - 815,850 6 Jul 2007 Grant of Options - - - - - 1,050,000 812,700 6 Jul 2007 Grant of Options(1) - 1,000,000 - - - - - 7 May 2008 Exercise of Options
(100,000)
-
-
-
-
(8,300) 30 Jun 2008 Closing Balance 450,000 10,000,000 1,250,000 1,250,000 1,050,000 1,050,000 4,074,791

INDO MINES LIMITED ANNUAL FINANCIAL REPORT 2008
NOTES TO AND FORMING PART OF THE FINANCIAL STATEMENTS
Page 33
13. RESERVES (continued) Note (1) On 6 July 2007 the Company granted 1,000,000 options exercisable at $0.20 each on or before 30 June
2010 in consideration for the provision of ongoing corporate and advisory services to the Company, including a capital raising which was completed on 6 December 2006. In accordance with AASB 2 – Share-based Payment, an independent valuation was undertaken (refer Note 18) and an amount of $163,000 was recognised as a share issue expense in the 2007 financial year.
(c) Movements in available-for-sale investment revaluation reserve during the past two years were as follows:
Consolidated Company 2008 2007 2008 2007
$ $ $ $ Opening Balance 697,513 - 697,513 - Net valuation gain/(loss) on available-for-sale investments (1,533,488) 697,513 (1,533,488) 697,513 Deferred tax liability in respect of unrealised taxable gain (262,208) -
(262,208) -
Closing Balance (1,098,183) 697,513 (1,098,183) 697,513
(d) Terms and conditions of Options
The Options are granted based upon the following terms and conditions:
• Each Option entitles the holder to subscribe for one Share upon exercise of each Option. • The Options have exercise prices and expiry dates as follows:
o $0.20 Options expire 31 July 2009. o $0.20 Options expire 30 June 2010. o $0.35 Incentive Options expire on 31 December 2009 and vested on 22 January 2008. o $0.45 Incentive Options expire on 30 June 2010 and vest on 22 January 2009. o $0.90 Options expire on 30 November 2009. o $1.20 Options expire on 30 November 2010.
• The Options are exercisable at any time prior to the Expiry Date. • Shares issued on exercise of the Options rank equally with the then shares of the Company. • Application will be made by the Company to ASX for official quotation of the Shares issued upon
the exercise of the Options. • If there is any reconstruction of the issued share capital of the Company, the rights of the
Optionholders may be varied to comply with the ASX Listing Rules which apply to the reconstruction at the time of the reconstruction.
• No application for quotation of the Options will be made by the Company. 14. ACCUMULATED LOSSES
Balance at the beginning of year (11,847,658) (10,805,286) (11,846,088) (10,821,669)Minority interest in controlled entity taken up by parent company - (18,531) - -Net profit/(loss) 2,858,570 (1,023,841) 2,858,882 (1,024,419) Balance at end of year (8,989,088) (11,847,658) (8,987,206) (11,846,088)
INDO MINES LIMITED ANNUAL FINANCIAL REPORT 2008
NOTES TO AND FORMING PART OF THE FINANCIAL STATEMENTS
Page 34
15. MINORITY INTERESTS IN CONTROLLED ENTITIES 2008 2007 $ $ Interest in: - Share capital 350,000 350,000 - Accumulated losses (350,000) (350,000) - - 16. KEY MANAGEMENT PERSONNEL COMPENSATION (a) Details of Key Management Personnel
Mr Darryl Harris Non-Executive Chairman Mr Philip Welten Managing Director Mr Ian Middlemas Non-Executive Director Mr Keith Brooks Non-Executive Director Mr Matthew Rimes Non-Executive Director Mr Mark Pearce Company Secretary Mr Shane Cranswick Chief Financial Officer
There were no other key management personnel of the Company or the Consolidated Entity. (b) Key Management Personnel Compensation
Company and Consolidated: 2008
$ 2007
$
Short-term employee benefits 329,370 148,184
Post-employment benefits 28,293 12,211
Other – Consulting fees 36,000 111,200
Share-based payments 3,254,041 49,800
Total compensation 3,647,804 321,395 Key management personnel disclosures previously required by AASB 124 Related Party Disclosures paragraphs Aus25.2 to Aus25.6 and Aus25.7.1 and Aus25.7.2 and by Corporations Regulations 2M.3.03 are included the Remuneration Report section of the Directors’ Report. Loans to key management personnel and their related parties There were no loans made to key management personnel or their related parties during the reporting period. Other key management personnel transactions A number of directors, or their related parties, hold positions in other entities that result in them having control or significant influence over the financial or operating policies of those entities. A number of these entities transacted with the Company or its controlled entities in the reporting period. The terms and conditions of these transactions were no more favourable than those available, or which might be available, or which might reasonably be expected to be available, on similar transactions to unrelated entities on an arm’s length basis. Apollo Group Pty Ltd, a company of which Mr Pearce is a Director and beneficial shareholder, was paid $180,000 (2007: $97,500) during the year under a services contract for the provision of serviced office facilities and administration services. The amount is based on a monthly retainer due and payable in arrears, with no fixed term. This item has been recognised as an expense in the Income Statement. There were no liabilities arising from the above transactions at 30 June 2008 (2007: nil).

INDO MINES LIMITED ANNUAL FINANCIAL REPORT 2008
NOTES TO AND FORMING PART OF THE FINANCIAL STATEMENTS
Page 35
16. KEY MANAGEMENT PERSONNEL COMPENSATION (continued) (c) Value of Options Granted to Key Management Personnel The following table discloses the value of options granted, exercised or lapsed during the year:
Options Granted
Options Exercised
Options Lapsed
Value at Grant
Date (i)
$
Value at Exercise
Date $
Value at time of Lapse
$
Total Value of Options Granted,
Exercised and Lapsed
$
Value of Options
included in Compensation
for the Year $
Percentage of Compensation
for the Year that consists
of Options
% 2008 Phil Welten 2,606,250 - - 2,606,250 2,245,891 88.1 Mark Pearce 232,650 - - 232,650 232,650 100.0 Shane Cranswick 775,500 - - 775,500 775,500 100.0
2007 Darryl Harris 12,450 - - 12,450 12,450 32.3 Keith Brooks 12,450 - - 12,450 12,450 49.9 Zlad Sas 12,450 - - 12,450 12,450 13.2 Mark Stewart 12,450 - - 12,450 12,450 52.3 Note (i) For details on the valuation of the options, including models and assumptions used, please refer to Note
18 to the financial statements. (ii) Each option converts into one ordinary share of Indo Mines on exercise. (d) Employment Contracts with Key Management Personnel Mr Philip Welten, Managing Director, has a contract of employment with Indo Mines Limited dated 21 December 2006. The contract specifies the duties and obligations to be fulfilled by the Managing Director. The contract has a rolling annual term and may be terminated by the Company by giving 2 months notice. No amount is payable in the event of termination for neglect or incompetence in regard to the performance of duties. Mr Welten receives a fixed remuneration component of $250,000 per annum inclusive of superannuation together with a bonus of up to $50,000 per annum. Following shareholder approval at a general meeting held on 5 July 2007, Mr Welten was granted the following option package in accordance with his employment contract:
i) 1,250,000 unlisted incentive options exercisable at $0.35 each on or before 31 December 2009, vesting after 12 months service; and
ii) 1,250,000 unlisted incentive options exercisable at $0.45 each on or before 30 June 2010, vesting after 24 months service.
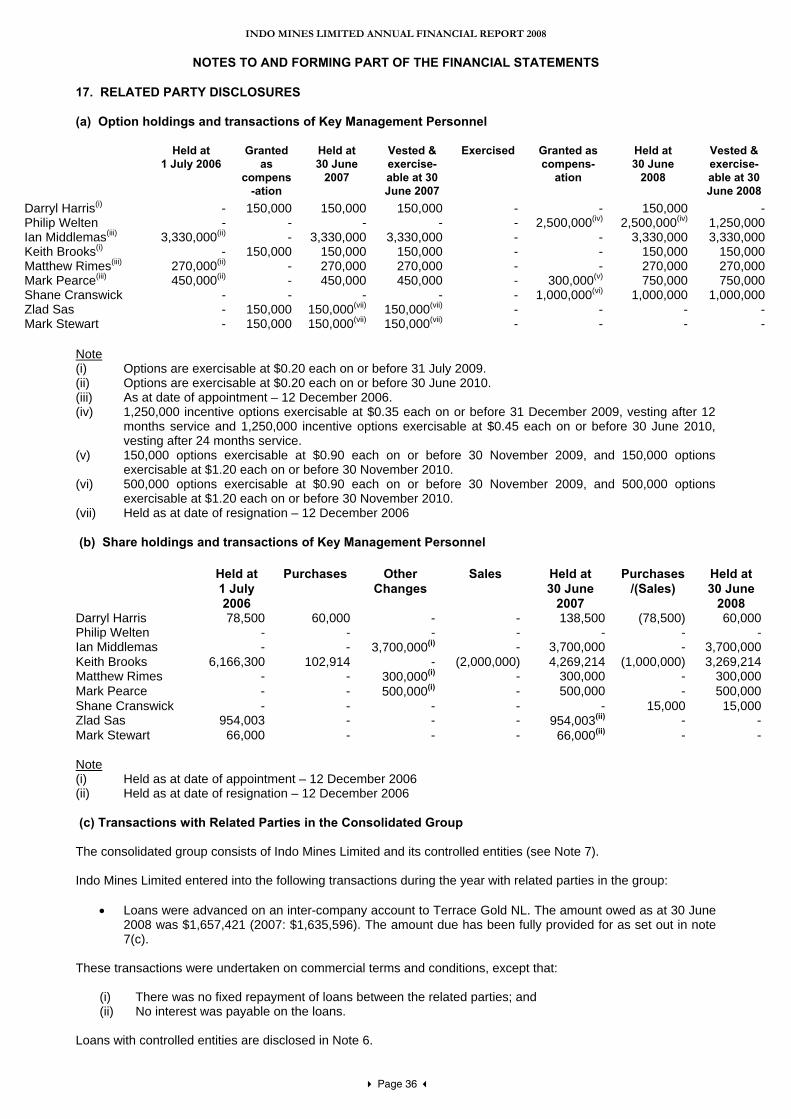
INDO MINES LIMITED ANNUAL FINANCIAL REPORT 2008
NOTES TO AND FORMING PART OF THE FINANCIAL STATEMENTS
Page 36
17. RELATED PARTY DISCLOSURES (a) Option holdings and transactions of Key Management Personnel Held at
1 July 2006
Granted as
compens-ation
Held at 30 June
2007
Vested & exercise- able at 30 June 2007
Exercised
Granted as compens-
ation
Held at 30 June
2008
Vested & exercise- able at 30 June 2008
Darryl Harris(i) - 150,000 150,000 150,000 - - 150,000 - Philip Welten - - - - - 2,500,000(iv) 2,500,000(iv) 1,250,000 Ian Middlemas(iii) 3,330,000(ii) - 3,330,000 3,330,000 - - 3,330,000 3,330,000 Keith Brooks(i) - 150,000 150,000 150,000 - - 150,000 150,000 Matthew Rimes(iii) 270,000(ii) - 270,000 270,000 - - 270,000 270,000 Mark Pearce(iii) 450,000(ii) - 450,000 450,000 - 300,000(v) 750,000 750,000 Shane Cranswick - - - - - 1,000,000(vi) 1,000,000 1,000,000 Zlad Sas - 150,000 150,000(vii) 150,000(vii) - - - - Mark Stewart - 150,000 150,000(vii) 150,000(vii) - - - -
Note (i) Options are exercisable at $0.20 each on or before 31 July 2009. (ii) Options are exercisable at $0.20 each on or before 30 June 2010. (iii) As at date of appointment – 12 December 2006. (iv) 1,250,000 incentive options exercisable at $0.35 each on or before 31 December 2009, vesting after 12
months service and 1,250,000 incentive options exercisable at $0.45 each on or before 30 June 2010, vesting after 24 months service.
(v) 150,000 options exercisable at $0.90 each on or before 30 November 2009, and 150,000 options exercisable at $1.20 each on or before 30 November 2010.
(vi) 500,000 options exercisable at $0.90 each on or before 30 November 2009, and 500,000 options exercisable at $1.20 each on or before 30 November 2010.
(vii) Held as at date of resignation – 12 December 2006 (b) Share holdings and transactions of Key Management Personnel
Held at 1 July 2006
Purchases
Other Changes
Sales
Held at 30 June
2007
Purchases/(Sales)
Held at 30 June
2008 Darryl Harris 78,500 60,000 - - 138,500 (78,500) 60,000 Philip Welten - - - - - - - Ian Middlemas - - 3,700,000(i) - 3,700,000 - 3,700,000 Keith Brooks 6,166,300 102,914 - (2,000,000) 4,269,214 (1,000,000) 3,269,214 Matthew Rimes - - 300,000(i) - 300,000 - 300,000 Mark Pearce - - 500,000(i) - 500,000 - 500,000 Shane Cranswick - - - - - 15,000 15,000 Zlad Sas 954,003 - - - 954,003(ii) - - Mark Stewart 66,000 - - - 66,000(ii) - - Note (i) Held as at date of appointment – 12 December 2006 (ii) Held as at date of resignation – 12 December 2006 (c) Transactions with Related Parties in the Consolidated Group The consolidated group consists of Indo Mines Limited and its controlled entities (see Note 7). Indo Mines Limited entered into the following transactions during the year with related parties in the group:
• Loans were advanced on an inter-company account to Terrace Gold NL. The amount owed as at 30 June 2008 was $1,657,421 (2007: $1,635,596). The amount due has been fully provided for as set out in note 7(c).
These transactions were undertaken on commercial terms and conditions, except that:
(i) There was no fixed repayment of loans between the related parties; and (ii) No interest was payable on the loans.
Loans with controlled entities are disclosed in Note 6.

INDO MINES LIMITED ANNUAL FINANCIAL REPORT 2008
NOTES TO AND FORMING PART OF THE FINANCIAL STATEMENTS
Page 37
No. WAEP No. WAEP Outstanding at beginning of year 9,550,000 $0.20 - - Granted during the year(i) 5,600,000 $0.61 9,700,000 $0.20 Exercised during the year (100,000) $0.20 (150,000) $0.20 Outstanding at end of year 15,050,000 $0.35 9,550,000 $0.20
17. RELATED PARTY DISCLOSURES (continued) (d) Remuneration Report Information relating to remuneration of directors is provided in the Directors Report and Note 16. 18. SHARE-BASED PAYMENTS The following table illustrates the number (No.) and weighted average exercise prices (“WAEP”) of, and movements in, share options issued during the year:
2008 2008 2007 2007
Note (i) Subsequent to 2007 year end, on 6 July 2007 the Company granted 1,000,000 options exercisable at
$0.20 each on or before 30 June 2010 in consideration for the provision of ongoing corporate and advisory services to the Company, including a capital raising which was completed on 6 December 2006. In accordance with AASB 2 – Share-based Payment, an amount of $163,000 was recognised as a share issue expense in equity in the 2007 financial year.
The outstanding balance as at 30 June 2008 is represented by:
• 450,000 (2007: 550,000) unlisted options with an exercise price of $0.20 each that expire on 31 July 2009.
• 10,000,000 (2007: 9,000,000) unlisted options with an exercise price of $0.20 each that expire on 30 June 2010;
• 1,250,000 (2007: nil) incentive options with an exercise price of $0.35 each that vest on 22 January 2008 and expire on 31 December 2009;
• 1,250,000 (2007: nil) incentive options with an exercise price of $0.45 each that vest on 22 January 2009 and expire on 30 June 2010;
• 1,050,000 (2007: nil) unlisted options with an exercise price of $0.90 each that expire on 30 November 2009; and
• 1,050,000 (2007: nil) unlisted options with an exercise price of $1.20 each that expire on 30 November 2010.
The weighted average remaining contractual life for the share options outstanding as at 30 June 2008 is 1.9 years (2007: 2.1 years). The fair value of the equity-settled share options granted is estimated as at the date of grant using the Black Scholes option valuation model taking into account the terms and conditions upon which the options were granted. Where applicable, the fair value is calculated at grant date and recognised over the period during which the incentive option holder becomes unconditionally entitled to the incentive options in accordance with AASB 2 – Share-based Payment. An amount of $2,245,891 (of a total valuation of $2,606,250) was included as a share based payment expense in the current period in relation to the 2,500,000 incentive options issued during the period. A further $360,359 will be expensed in future periods as and when the holder of the incentive options becomes unconditionally entitled to these incentive options.

INDO MINES LIMITED ANNUAL FINANCIAL REPORT 2008
NOTES TO AND FORMING PART OF THE FINANCIAL STATEMENTS
Page 38
18. SHARE-BASED PAYMENTS (continued) The following table lists the inputs to the model used for the period ended 30 June 2008:
$0.35 Options
31Dec 2009
$0.45 Options
30 Jun 2010
$0.90 Options
30 Nov 2009
$1.20 Options
30 Nov 2010
Exercise price $0.35 $0.45 $0.90 $1.20 Share price on date of valuation $1.33 $1.33 $1.33 $1.33
Valuation date 5 Jul 07 5 Jul 07 5 Jul 07 5 Jul 07 Expiry date 31 Dec 09 30 Jun 10 30 Nov 09 30 Nov 10 Expected life of option (years) 2.4 2.9 2.3 3.3 Fair value at grant date $1.062 $1.023 $0.777 $0.774
The following table lists the inputs to the model used for the year ended 30 June 2007:
$0.20 Options
31 Jul 2009
$0.20 Options
30 Jun 2010
Exercise price $0.20 $0.20 Share price on date of valuation $0.19 $0.26 Dividend yield - - Volatility 60% 75% Risk-free interest rate 5.99% 5.52% Valuation date 31 July 2006 6 Dec 2006 Expiry date 31 July 2009 30 Jun 2010 Expected life of option (years) 3 3.6 Fair value at grant date $0.083 $0.163
The dividend yield reflects the assumption that the current dividend payout will remain unchanged. The expected life of the options is based on historical data and is not necessarily indicative of exercise patterns that may occur. The expected volatility reflects the assumption that the historical volatility is indicative of future trends, which may also not necessarily be the actual outcome. The total share based payment expense for both employees and consultants was $3,874,441 (2007: $58,100). 19. CONTROLLED ENTITIES All controlled entities are included in the consolidated financial statements. The financial year-end of the controlled entities is the same as that of the parent entity.
Place of incorporation
% of Shares held(i)
Name of controlled entity 2008 2007 Terrace Gold NL Australia 80 80 Indo Energy Pty Ltd Australia 100 100 Indo Mines (Indonesia) Pty Ltd Australia 100 -
The above named investments in controlled entities have a carrying value at balance date of nil (2007: nil) Notes
Dividend yield - - - - Volatility 75% 75% 75% 75% Risk-free interest rate 6.4% 6.4% 6.4% 6.4%
(i) The percentage of voting power is its proportion to ownership.
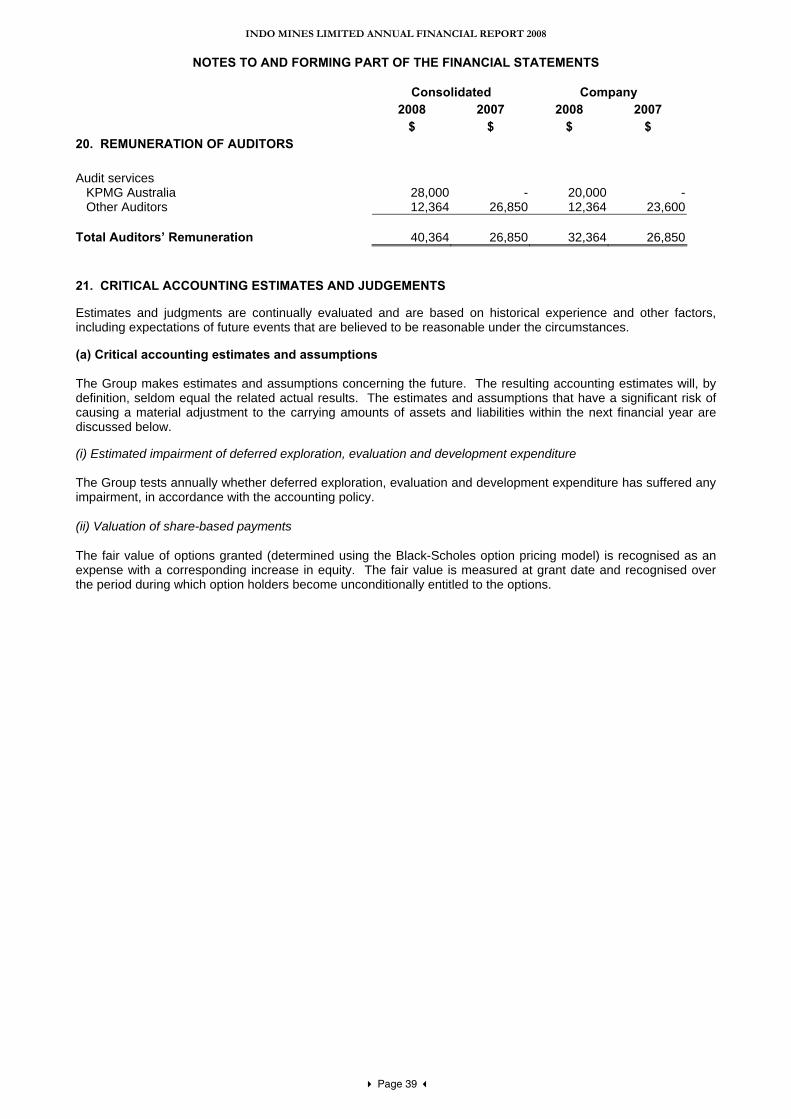
INDO MINES LIMITED ANNUAL FINANCIAL REPORT 2008
NOTES TO AND FORMING PART OF THE FINANCIAL STATEMENTS
Page 39
Consolidated Company
2008 2007 2008 2007 $ $ $ $
20. REMUNERATION OF AUDITORS
Audit services KPMG Australia Other Auditors
28,00012,364
-26,850
20,000 12,364
-23,600
Total Auditors’ Remuneration 40,364 26,850 32,364 26,850 21. CRITICAL ACCOUNTING EST
Estimates and judgments are continually evaluated and are based on historical exincluding ex
(a) Cr The Group makes estimates and assumptions concerning the future. definition, causing a material adjustment to the carrying amounts of assets discussed below
(i) Estim The Group tests annually wimpairment, in accordance w (ii) Valuation of share-based paym The fair value of options granted (determined using the exthe period during w
IMATES AND JUDGEMENTS
perience and other factors, pectations of future events that are believed to be reasonable under the circumstances.
itical accounting estimates and assumptions
The resulting accounting estimates will, by seldom equal the related actual results. The estimates and assumptions that have a significant risk of
and liabilities within the next financial year are .
ated impairment of deferred exploration, evaluation and development expenditure
hether deferred exploration, evaluation and development expenditure has suffered any ith the accounting policy.
ents
Black-Scholes option pricing model) is recognised as an pense with a corresponding increase in equity. The fair value is measured at grant date and recognised over
hich option holders become unconditionally entitled to the options.
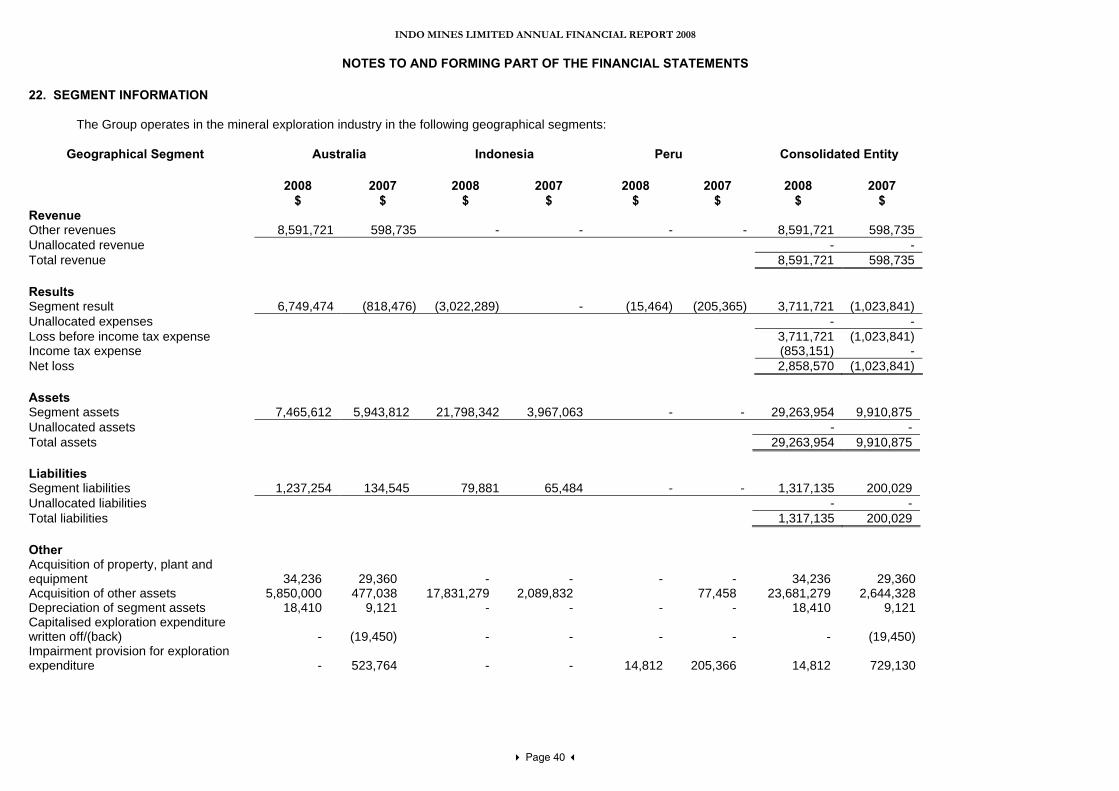
INDO MINES LIMITED ANNUAL FINANCIAL REPORT 2008
NOTES TO AND FORMING PART OF THE FINANCIAL STATEMENTS
Page 40
22. SEGMENT INFORMATION
The Group operates in the mineral exploration industry in the following geographical segments: Geographical Segment Australia Indonesia Peru Consolidated Entity
2008 2007 2008 2007 2008 2007 2008 2007 $ $ $ $ $ $ $ $ Revenue Other revenues 8,591,721 598,735 - - - - 8,591,721 598,735 Unallocated revenue - - Total revenue Results Segment result Unallocated exLoss before income taxIncome taxNet loss Assets Segment Unallocated Total Liabilities Segment Unallocated Total Other Acquisition of property, plant and equipment Acquisition of other assets Depreciation of segment assets Capitalised exwImpairment provision for exex
8,591,721 598,735
6,749,474 (818,476) (3,022,289) - (15,464) (205,365) 3,711,721 (1,023,841) penses - -
expense 3,711,721 (1,023,841) expense (853,151) -
2,858,570 (1,023,841)
assets 7,465,612 5,943,812 21,798,342 3,967,063 - - 29,263,954 9,910,875
assets - - assets 29,263,954 9,910,875
liabilities 1,237,254 134,545 79,881 65,484 - - 1,317,135 200,029 liabilities - -
liabilities 1,317,135 200,029
34,236
29,360
-
-
-
-
34,236
29,360 5,850,000 477,038 17,831,279 2,089,832 77,458 23,681,279 2,644,328
18,410 9,121 - - - - 18,410 9,121 ploration expenditure
ritten off/(back)
-
(19,450)
-
-
-
-
-
(19,450) ploration
penditure
-
523,764
-
-
14,812
205,366
14,812
729,130

INDO MINES LIMITED ANNUAL FINANCIAL REPORT 2008
NOTES TO AND FORMING PART OF THE FINANCIAL STATEMENTS
Page 41
23. EARNINGS PER SHARE Consolidated Consolidated 2008
Cents per Share
2007 Cents per
Share Basic profit/(loss) per share: From continuing operations 3.6 (1.7) Total basic profit/(loss) per share 3.6 (1.7) Diluted profit/(loss) per share: From continuing operations 3.2 (1.7) Total diluted profit/(loss) per share 3.2 (1.7) The following reflects the income and share data used in the calculations of basic and diluted earnings per share: Consolidated Consolidated 2008 2007 $ $ Net profit/(loss) used in calculating basic and diluted earnings per share
2,858,570
(1,023,841)
Number of Number of Shares Shares 2008 2007
Weighted average number of ordinary shares used in calculating basic earnings per share
80,510,160
59,675,033
Effect of dilutive securities* 10,320,042 - Adjusted weighted average number of ordinary shares and potential ordinary shares used in calculating basic and diluted earnings per share
90,830,203
59,675,033
*Dilutive securities At 30 June 2007, these options were not been included in the calculation of diluted EPS as they were not considered dilutive. Accordingly, for the year ended 30 June 2007, diluted loss per share is the same as the basic loss per share. Conversions, calls, subscriptions or issues after 30 June 2008 Since 30 June 2008, nil shares have been issued, nil incentive options and nil options have been granted. No shares have been issued as a result of the exercise of options since 30 June 2008.

INDO MINES LIMITED ANNUAL FINANCIAL REPORT 2008
NOTES TO AND FORMING PART OF THE FINANCIAL STATEMENTS
Page 42
Consolidated Company
2008 2007 2008 2007 $ $ $ $ 24. NOTES TO THE CASH FLOW STATEMENTS
(a) Reconciliation of loss from continuing operations after tax to net cash flows from operating activities Profit/(loss) for the year 2,858,570 (1,023,841) 2,858,882 (1,024,419) Adjustment for non-cash income and expense items Depreciation 18,410 9,121 18,410 9,121Provision for dimunition of investments - (48,000) - (48,000)Gain on sale of mining tenements (7,850,000) (425,963) (7,850,000) (425,963)Impairment/loss on disposal of property, plant and
equipment - 5,519 - 5,519Gain on sale of other financial assets (596,880) - (596,880) -Share-based payments expensed 3,874,441 58,100 3,874,441 58,100Exploration expenditure written off 14,812 709,680 - 504,314Doubtful debts - - 21,489 205,366 Changes in assets and liabilities Decrease/(Increase) in trade and other receivables 40,601 (62,422) 40,601 (62,482)Increase/(Decrease)in trade and other payables (51,422) (35,392) (56,074) (35,232)Increase in current tax liabilities 936,658 - 938,710 -Increase/(Decrease) in deferred tax balances (83,507) - (81,707) -Increase/(Decrease) in provisions 2,595 (32,377) 2,595 (32,377) Net cash outflows from operating activities (835,722) (845,575) (829,533) (846,053) (b) Reconciliation of Cash and Cash Equivalents Cash at bank and on hand 252,384 709,821 252,118 709,391Short term deposits 1,721,055 3,832,992 1,721,055 3,832,992 1,973,439 4,542,813 1,973,173 4,542,383 (c) Credit Standby Arrangements with Banks At balance date, the Company had no used or unused financing facilities.
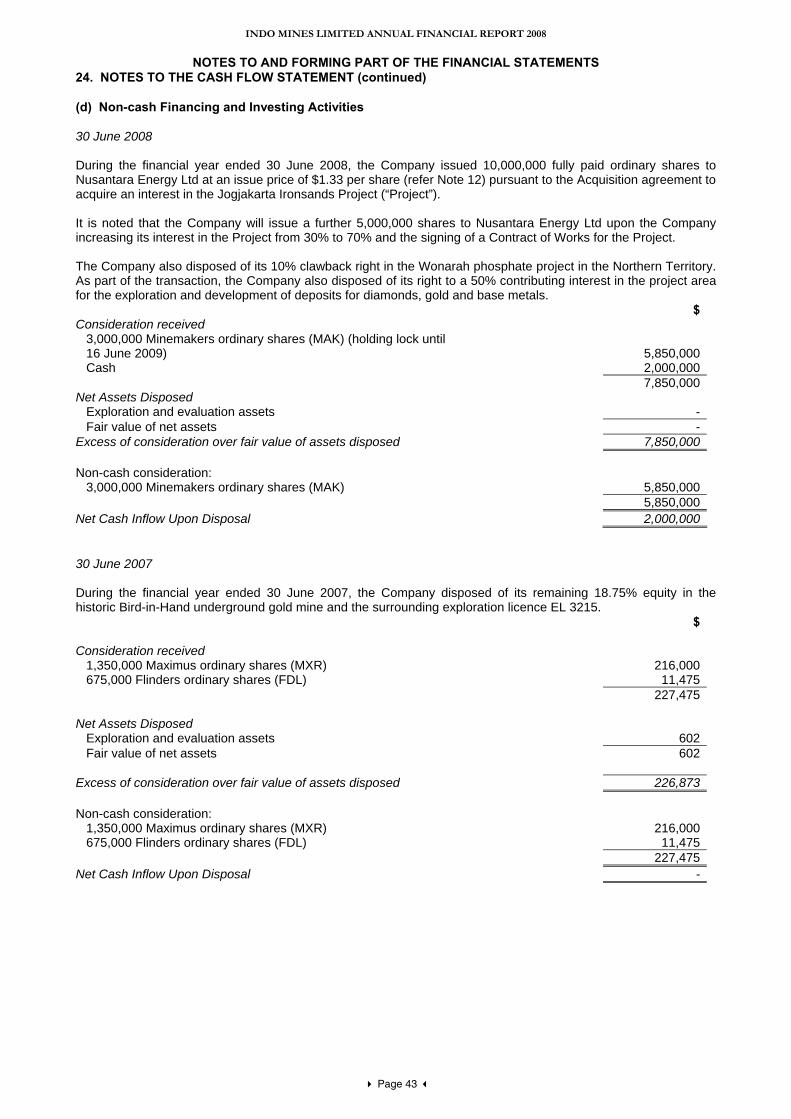
INDO MINES LIMITED ANNUAL FINANCIAL REPORT 2008
NOTES TO AND FORMING PART OF THE FINANCIAL STATEMENTS
Page 43
24. NOTES TO THE CASH FLOW STATEMENT (continued) (d) Non-cash Financing and Investing Activities 30 June 2008 During the financial year ended 30 June 2008, the Company issued 10,000,000 fully paid ordinary shares to Nusantara Energy Ltd at an issue price of $1.33 per share (refer Note 12) pursuant to the Acquisition agreement to acquire an interest in the Jogjakarta Ironsands Project (“Project”). It is noted that the Company will issue a further 5,000,000 shares to Nusantara Energy Ltd upon the Company increasing its interest in the Project from 30% to 70% and the signing of a Contract of Works for the Project. The Company also disposed of its 10% clawback right in the Wonarah phosphate project in the Northern Territory. As part of the transaction, the Company also disposed of its right to a 50% contributing interest in the project area for the exploration and development of deposits for diamonds, gold and base metals. $ Consideration received 3,000,000 Minemakers ordinary shares (MAK) (holding lock until 16 June 2009)
5,850,000
Cash 2,000,000 7,850,000 Net Assets Disposed Exploration and evaluation assets - Fair value of net assets - Excess of consideration over fair value of assets disposed 7,850,000 Non-cash consideration: 3,000,000 Minemakers ordinary shares (MAK)
5,850,000
5,850,000 Net Cash Inflow Upon Disposal 2,000,000 30 June 2007 During the financial year ended 30 June 2007, the Company disposed of its remaining 18.75% equity in the historic Bird-in-Hand underground gold mine and the surrounding exploration licence EL 3215. $ Consideration received 1,350,000 Maximus ordinary shares (MXR) 216,000 675,000 Flinders ordinary shares (FDL) 11,475 227,475 Net Assets Disposed Exploration and evaluation assets 602 Fair value of net assets 602 Excess of consideration over fair value of assets disposed 226,873 Non-cash consideration: 1,350,000 Maximus ordinary shares (MXR) 675,000 Flinders ordinary shares (FDL)
216,000
11,475 227,475 Net Cash Inflow Upon Disposal -

INDO MINES LIMITED ANNUAL FINANCIAL REPORT 2008
NOTES TO AND FORMING PART OF THE FINANCIAL STATEMENTS
Page 44
24. NOTES TO THE CASH FLOW STATEMENT (continued) (d) Non-cash Financing and Investing Activities (continued) The Company also disposed of its 100% interest in the Wonarah phosphate project in the Northern Territory. The Company retains the right to a 50% contributing interest in the project area for the exploration and development of deposits for diamonds, gold and base metals. At the time of the initial sale, Indo Mines also had the right to clawback up to 10% equity in the phosphate rights in the project area by reimbursing Minemakers 20% of their total incurred expenditure on the project (this right was sold in June 2008). $ Consideration received Reimbursement of costs 50,000 625,000 Minemakers ordinary shares (MAK) 125,000 625,000 Minemakers unlisted options exercisable at $0.001 each 124,563 299,563 Net Assets Disposed Exploration and evaluation assets 100,563 Fair value of net assets 100,563 Excess of consideration over fair value of assets disposed 199,000 Non-cash consideration: 625,000 Minemakers ordinary shares (MAK) 625,000 Minemakers unlisted options exercisable at $0.001 each
125,000 124,563
249,563
Net Cash Inflow Upon Disposal 50,000 25. FINANCIAL RISK MANAGEMENT OBJECTIVES AND POLICIES (a) Overview The Company’s and Group’s principal financial instruments comprise trade and other receivables, trade and other payables, available-for-sale investments, cash and short-term deposits. The main risks arising from the Company’s and Group’s financial instruments are interest rate risk, equity price risk, foreign currency risk, credit risk and liquidity risk. This note presents information about the Company’s and Group’s exposure to each of the above risks, its objectives, policies and processes for measuring and managing risk, and the management of capital. Other than as disclosed, there have been no significant changes since the previous financial year to the exposure or management of these risks. The Board of Directors has overall responsibility for the establishment and oversight of the risk management framework. Given the nature and size of the business, no formal risk management committees have been established, however responsibility for control and risk management is delegated to the appropriate level of management with the chairman and chief financial officer (or their equivalent) having ultimate responsibility to the Board for the risk management and control framework. Risk management policies are established to identify and analyse the risks faced by the Company, to set appropriate risk limits and controls, and to monitor risks and adherence to limits. Risk management policies and systems are reviewed regularly to reflect changes in market conditions and the Company’s activities. Arrangements put in place by the Board to monitor risk management include monthly reporting to the Board in respect of the operations and financial position of the Company. The Board also reviews risks that relate to operations and financial instruments as required, but at least every six months. Given the uncertainty as to the timing and amount of cash inflows and outflows, the Company has not implemented any additional strategies to mitigate the financial risks and no hedging has been put in place. As the Company’s operations change, the Directors will review this policy periodically going forward.

INDO MINES LIMITED ANNUAL FINANCIAL REPORT 2008
NOTES TO AND FORMING PART OF THE FINANCIAL STATEMENTS
Page 45
25. FINANCIAL RISK MANAGEMENT OBJECTIVES AND POLICIES (continued) (b) Credit risk Credit risk is the risk of financial loss to the Company or Group if a customer or counterparty to a financial instrument fails to meet its contractual obligations. This arises principally from cash and cash equivalents and trade and other receivables. The carrying amount of the Company’s and Group’s financial assets represents the maximum credit risk exposure, as represented below: Consolidated Company 2008 2007 2008 2007 $ $ $ $ Cash and cash equivalents 1,973,439 4,542,813 1,973,173 4,542,383Restricted cash and cash equivalents 70,000 10,000 70,000 10,000Trade and other receivables 37,771 78,372 37,771 78,372Other financial assets 5,341,500 1,285,551 5,341,500 1,285,551 7,422,710 5,916,736 7,422,444 5,916,306 The Group does not have any significant customers and accordingly does not have any significant exposure to bad or doubtful debts. Trade and other receivables comprise GST and other tax refunds due. Where possible the Group trades only with recognised, creditworthy third parties. It is the Group's policy that all customers who wish to trade on credit terms are subject to credit verification procedures. In addition, receivable balances are monitored on an ongoing basis with the result that the Group’s exposure to bad debts is not significant. At 30 June 2008, none (2007: none) of the Group’s receivables are past due. No impairment losses have been recognised in the Group accounts. Significant concentration of credit risk exists within cash and cash equivalents and other financial assets. Cash and cash equivalents is invested at a counterparty with a good credit rating. Other financial assets consist of mainly listed securities tradable on ASX. The Company’s accounts include receivables from controlled entities for which some provision for non-recovery has been made. Provision is made against loans to entities where the underlying exploration assets have been fully provided for or written off. The provision is reconciled below: Company Receivables from controlled entities impairment provision: 2008 2007 $ $ Opening balance 1,657,785 1,635,596 Provision for non-recovery of receivables from controlled entities (1,657,785) (1,635,596) Closing balance (note 6) - - With respect to credit risk arising from cash and cash equivalents, the Company’s and Group’s exposure to credit risk arises from default of the counter party, with a maximum exposure equal to the carrying amount of these instruments. Cash and cash equivalents are held with the ANZ Bank which is an Australian bank with an AA credit rating (Standard & Poor’s). In relation to credit risk arising from other financial assets, the Group limits its exposure by only investing in liquid securities tradable on the Australian Securities Exchange (ASX).

INDO MINES LIMITED ANNUAL FINANCIAL REPORT 2008
NOTES TO AND FORMING PART OF THE FINANCIAL STATEMENTS
Page 46
25. FINANCIAL RISK MANAGEMENT OBJECTIVES AND POLICIES (continued) (c) Liquidity risk Liquidity risk is the risk that the Group will not be able to meet its financial obligations as they fall due. The Board’s approach to managing liquidity is to ensure, as far as possible, that the Group will always have sufficient liquidity to meet its liabilities when due. At 30 June 2007 and 2008, the Group has sufficient liquid assets to meet its financial obligations. The contractual maturities of financial liabilities, including estimated interest payments, are provided below. There are no netting arrangements in respect of financial liabilities. 2008
≤6 months
6-12 months
1-5 years
≥5 Years
Total
Group $ $ $ $ $ Financial Liabilities Trade and other payables 177,626 - - - 177,626 177,626 - - - 177,626 2008 Company Financial Liabilities Trade and other payables 171,126 - - - 171,626 171,126 - - - 171,126 2007
Group Financial Liabilities Trade and other payables 192,165 - - - 192,165 192,165 - - - 192,165 2007 Company
- -
Financial Liabilities Trade and other payables 190,165 - - 190,165 190,165 - - 190,165 (d) Interest rate risk The Company’s and Group’s exposure to the risk of changes in market interest rates relates primarily to the cash and short-term deposits with a floating interest rate. These financial assets with variable rates expose the Company and Group to cash flow interest rate risk. All other financial assets and liabilities, in the form of receivables, investments and payables are non-interest bearing. All cash balances were interest bearing as disclosed below: Consolidated Company 2008 2007 2008 2007 $ $ $ $ Interest-bearing financial instruments Cash at bank and on hand 252,384 709,821 252,118 709,391Short term deposits 1,721,055 3,832,992 1,721,055 3,832,992Restricted short term deposits 70,000 10,000 70,000 10,000 2,043,439 4,552,813 2,043,173 4,452,383
INDO MINES LIMITED ANNUAL FINANCIAL REPORT 2008
NOTES TO AND FORMING PART OF THE FINANCIAL STATEMENTS
Page 47
(d) Interest rate risk (continued)
The Group currently does not engage in any hedging or derivative transactions to manage interest rate risk.
Profit or loss
(14,794)
Cash and cash equivalents
25. FINANCIAL RISK MANAGEMENT OBJECTIVES AND POLICIES (continued)
The Group’s cash at bank and on hand and short term deposits had a weighted average floating interest rate at year end of 7.41% (2007: 6.21%) and for the Company the weighted average floating interest rate at year end was 7.35% (2007: 6.21%).
Interest rate sensitivity A sensitivity of 10 per cent has been selected as this is considered reasonable given the current level of both short term and long term interest rates. A 10% movement in interest rates at the reporting date would have increased (decreased) equity and profit and loss by the amounts shown below. This analysis assumes that all other variables, in particular foreign currency rates, remain constant. The analysis is performed on the same basis for 2007. This analysis is prepared based on cash balances as at year end and due to significant decreases in the cash balance throughout the year is not considered representative of the risk during the year.
10% increase
10% decrease
2008 Group Cash and cash equivalents 14,794 (14,794) Company Cash and cash equivalents 14,794 2007 Group Cash and cash equivalents 27,758 (27,758) Company
27,758 (27,758) (e) Foreign currency risk As a result of activities overseas, the Group’s balance sheet can be affected by movements in exchange rates. The Group also has transactional currency exposures. Such exposure arises from exploration expenditure denominated in foreign currencies. The Group currently does not engage in any hedging or derivative transactions to manage foreign currency risk. (f) Equity Price risk The Group is exposed to equity price risk arising from its equity investments. Equity investments are held for strategic rather than trading purposes. The Group does not actively trade these investments and no hedging or derivative transactions have been used to manage equity price risk. Equity price sensitivity The sensitivity analyses below have been determined based on the exposure to equity price risks arising from available-for-sale financial assets held at the reporting date. At reporting date, if the equity prices had been 20% higher or lower: • Net profit or loss for the years ended 30 June 2008 and 30 June 2007 would be unaffected by price
movements at balance date as the equity investments are classified as available for sale; and • Equity reserves at 30 June 2008 would increase/decrease by $1,068,300 (2007: increase/decrease by
$257,110) for the Group and the Company as a result of the changes in fair value of available-for-sale investments.
The Group’s sensitivity to equity prices has increased significantly from the prior year following the sale of the Wonarah 10% clawback right (see Note 24(d)) and the receipt of Minemakers shares as part consideration.

INDO MINES LIMITED ANNUAL FINANCIAL REPORT 2008
NOTES TO AND FORMING PART OF THE FINANCIAL STATEMENTS
Page 48
There were no changes in the Group’s approach to capital management during the year.
The company has no obligations to perform minimum exploration work. All other tenements are farmed out whereby the farminee is contracted to meet the minimum expenditure commitment.
Consolidated Consolidated
-
25. FINANCIAL RISK MANAGEMENT OBJECTIVES AND POLICIES (continued) (g) Commodity Price risk The Group is exposed to commodity price risk. These commodity prices can be volatile and are influenced by factors beyond the Group’s control. As the Group is currently engaged in exploration and business development activities, no sales of commodities are forecasted for the next 12 months, and accordingly, no hedging or derivative transactions have been used to manage commodity price risk. (h) Capital management The Board’s policy is to maintain a strong capital base so as to maintain investor, creditor and market confidence and to sustain future development of the business. Given the stage of development of the Group, the Board’s objective is to minimise debt and to raise funds as required through the issue of new shares.
The Group is not subject to externally imposed capital requirements. (i) Fair Value The net fair value of financial assets and financial liabilities approximates their carrying value. The methods for estimating fair value are outlined in the relevant notes to the financial statements.
26. COMMITMENTS Estimated commitments for which no provisions were included in the financial statements are as follows:
(a) Exploration Expenditure Commitments
A controlled entity holds a number of tenements in Peru. There is no minimum exploration work commitment for these tenements.
(b) Operating Lease Commitments 2008 2007
$ $ Non-cancellable operating lease contracted for but not capitalised in the financial statements
Minimum lease payments payable: - not later than one year 129,001 15,463 - later than one year but not later than 5 years 490,493 - - later than 5 years - 619,494 15,463 The non-cancellebale operating lease recognised in the current year expires 19 November 2012. The non-cancellable operating lease recognised in the 2007 year is for the Company’s former office premises which expired on 30 November 2007.
(c) Minera Andes del Norte SAC
Terrace Gold NL (“Terrace”) a controlled entity exercised its option to acquire the issued capital of Minera Andes del Norte SAC in 1997. Terrace issued 5,000,000 ordinary fully paid shares to the vendor as part of the settlement of this acquisition. Further shares in Terrace may need to be issued to the vendor upon the Stock Exchange listing of Terrace in order that the vendor’s holding will equate to the greater of 5,000,000 shares or 10% of the issued capital of Terrace at the time of such listing.
(d) Financial Support of Controlled Entity
The parent entity has committed itself to provide financial support to its controlled entity, Terrace Gold NL. Refer Note 7(c).

INDO MINES LIMITED ANNUAL FINANCIAL REPORT 2008
NOTES TO AND FORMING PART OF THE FINANCIAL STATEMENTS
Page 49
27. CONTINGENT LIABILITIES
(iv) On 30 June 2004 the economic entity sold AKD Brasil Limitada (“AKDB”) to Trans Pacific Gold Pty Ltd. The parent entity provided warranties concerning the status of AKDB to the purchaser. The warranties provided were industry standard for such a sale.
26. COMMITMENTS (continued) (e) Acquisition of Nangali
Terrace and Compass Resources NL signed a letter of intent with Compania LJB Normandy Peru SA to acquire the Nangali Gold Project in 2004. Pursuant to the Letter of Intent, the parties paid US$30,000 upon signing with a further US$200,000 due when full title has been transferred to Terrace and Compass. In June 2006 the parties agreed to expedite the purchase and varied the terms of this Letter of Intent such that the balance of the purchase price was reduced to US$150,000 payable immediately. Terrace’s share of the balance outstanding is US$45,000, which was paid on 14 July 2006. A supreme decree is now being sought so that full title can be transferred to Terrace and Compass.
(i) In accordance with normal industry practice the economic entity has entered into joint venture operations
and farm-in agreements with other parties for the purpose of exploring and developing its mineral interests. If a party to a joint venture defaults and does not contribute its share of joint venture obligations, then the other joint venturers are liable to meet those obligations. In this event the interest in the tenements held by the defaulting party may be redistributed to the remaining joint venturers. A contingent liability exists in respect of contributions due to be paid by farm-in partners of the economic entity to some of its joint ventures.
(ii) At the end of the financial year there existed claims against the Company totalling $38,791 (excluding
interest) currently in dispute. In the opinion of the directors no liability exists for these amounts and any action taken by the relevant parties to retrieve these amounts will be defended.
(iii) On 30 April 2004 the economic entity sold Minera Andes del Norte SAC (“Mansa”) to Lumina Copper
Corporation. The parent entity provided warranties concerning the status of Mansa and its project to the purchaser. The warranties provided were industry standard for such a sale.
In relation to point (ii) above, the company has sought legal advice and based on this advice, the directors are confident of successfully defending all claims. Accordingly, no provision has been made elsewhere in the financial statements for these amounts. 28. SUBSEQUENT EVENTS As at the date of this report there are no matters or circumstances which have arisen since 30 June 2008 that have significantly affected or may significantly affect:
(a) the operations, in financial years subsequent to 30 June 2008, of the Company or Group; (b) the results of those operations, in financials years subsequent to 30 June 2008, of the Company
or Group; or
(c) the state of affairs, in financial years subsequent to 30 June 2008, of the Companyor Group.
INDO MINES LIMITED ANNUAL FINANCIAL REPORT 2008
Page 50
DIRECTORS' DECLARATION
(ii) complying with accounting standards (including the Australian Accounting Interpretations) and the Corporations Act 2001;
(b) there are reasonable grounds to believe that the Company will be able to pay its debts as and
when they become due and payable; (c) the financial statements also comply with international Financial Reporting Standards as
disclosed in note 1(b);
(d) the remuneration disclosures contained in the Remuneration Report in the Directors’ report comply with Australian Accounting Standard AASB 124, Related party Disclosures, the Corporations Act 2001 and the Corporations Regulations 2001; and
(2) This declaration has been made after receiving the declarations required to be made to the Directors in
accordance with section 295A of the Corporations Act 2001 for the financial year ending 30 June 2008.
In accordance with a resolution of the Directors of Indo Mines Limited, I state that: (1) In the opinion of the Directors:
(a) the financial statements, notes and the additional remuneration disclosures included in the remuneration report included in the directors’ report designated as audited of the Company and of the Consolidated Entity are in accordance with the Corporations Act 2001 including:
(i) giving a true and fair view of the Company’s and Consolidated Entity’s financial position
as at 30 June 2008 and of their performance for the year ended on that date; and
On behalf of the Board.
PHILIP WELTEN Managing Director
ated this 26th day of September 2008
D