ANNUAL FINANCIAL REPORT 2015 - exelcomposites.com...Page 3 Exel Composites Annual Financial Report...
49
ANNUAL FINANCIAL REPORT 2015
Transcript of ANNUAL FINANCIAL REPORT 2015 - exelcomposites.com...Page 3 Exel Composites Annual Financial Report...
ANNUAL FINANCIAL REPORT 2015
Exel Composites Annual Financial Report 2015 | Key figuresPage 2
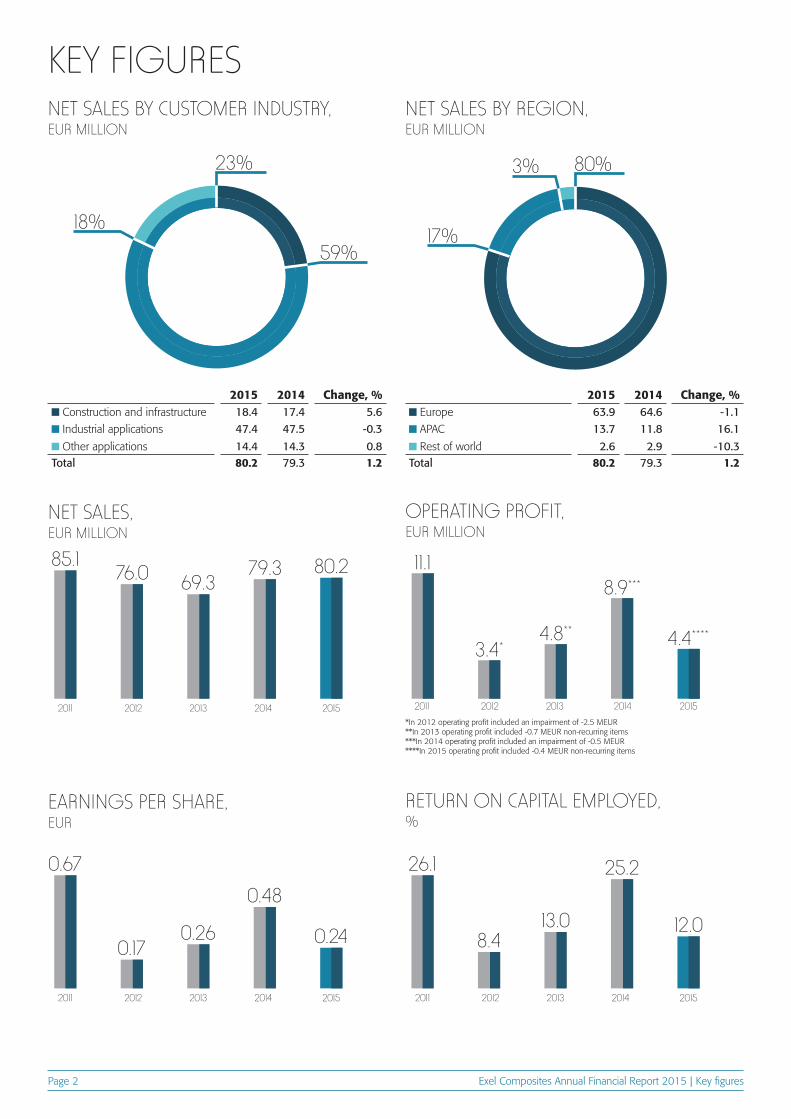
KEY FIGURESNET SALES BY CUSTOMER INDUSTRY, EUR MILLION
NET SALES BY REGION, EUR MILLION
2015 2014 Change, % Construction and infrastructure 18.4 17.4 5.6 Industrial applications 47.4 47.5 -0.3
Other applications 14.4 14.3 0.8Total 80.2 79.3 1.2
2015 2014 Change, % Europe 63.9 64.6 -1.1 APAC 13.7 11.8 16.1
Rest of world 2.6 2.9 -10.3Total 80.2 79.3 1.2
2011
2011 2011
20112012
2012 2012
20122013
2013 2013
20132014
2014 2014
20142015
2015 2015
2015
NET SALES, EUR MILLION
EARNINGS PER SHARE, EUR
69.3
0.2613.0
79.3
0.4825.2
76.0
0.17 8.4
85.1
0.67 26.1
OPERATING PROFIT, EUR MILLION
RETURN ON CAPITAL EMPLOYED, %
*In 2012 operating profit included an impairment of -2.5 MEUR **In 2013 operating profit included -0.7 MEUR non-recurring items***In 2014 operating profit included an impairment of -0.5 MEUR ****In 2015 operating profit included -0.4 MEUR non-recurring items
4.4****
11.18.9***
4.8**
3.4*
80.2
0.24 12.0
59%
18%
23%
17%
3% 80%
Exel Composites Annual Financial Report 2015 | CEO reviewPage 3
In 2015 we continued the exciting journey started at the beginning of 2014 when I commenced at the helm of Exel Composites. We contin-ued on the new course chosen two years ago heading for performance improvement and bringing the company to the next level. Trimming a ship to be a world-class performer is hard work and requires some patience and at the same time keeping the destination clear. I feel fortunate to say that the Exel Composites crew has the target clear in their minds and we have taken several steps during 2015 in the path towards becoming a truly global composites company.
In 2015 Exel Composites started fully implementing the new strategy that was launched in late 2014. The cornerstones of the new strategy to generate next level growth are: 1) Accelerate growth in China, 2) Penetrate new applications, 3) Create true local footprint, and 4) Grow in new technologies. We want to differentiate from our competitors by providing with clear value propositions, local presence globally, top-quality service and world-class operations. During 2015 we have advanced these strategic initiatives by strengthening the organiza-tion, developing competencies, improving processes, adding flexibility and increasing production capacity in order to be ready for organic and in-organic growth.
The ongoing expansion projects in China and Austria are currently in permitting and design phase and the completion of both projects have been postponed to 2017. M&A screening activities were high on management agenda throughout the year. We extended our sales cov-erage further and put extra efforts into new and growing segments such as the automotive industry. Operations were improved in many fronts, including supply chain management, health & safety, on-time-delivery (OTD) promptness to clients and step-by-step implementation of the new global ERP.
Profitability of the Company was not satisfactory and was impacted in 2015 by higher operating costs mainly attributable to the addition-al resources required to build the organization to the next level. In addition, business volume of the Group, with net sales increasing only by 1.2 per cent to EUR 80.2 (79.3) million, was lower than planned, which in itself decreased profitability through low utilization of certain factories. In the second and third quarter we saw postponements of some key customer orders and end-customer projects. Further actions were taken to control costs and to drive sales. In the fourth quarter order intake was recovering and increased from the low level of the third quarter.
We have driven operational excellence throughout the Group in 2015. A whole new safety culture was introduced in all our sites. Lean manufacturing methods, such as 5S and visual management, are being implemented in all our factories. Actions continued to improve general orderliness in the factories in order to ensure more efficient operations and a safe and pleasant work environment. The Group’s On Time De-livery (OTD) improved from year 2014. Lost time injuries were halved from previous year.
In 2016 the Company continues to implement its new strategy with focus to operational efficiency and optimizing the global manufacturing footprint. The company estimates that operating profit excluding any non-recurring items will increase in 2016 compared to 2015.
I am confident that by implementing our growth strategy we will suc-ceed in becoming the flagship of the composites industry. Our expertise in composites combined with attractive long-term market fundamentals will position us well for profitable long-term growth.
I would like to express my sincere thanks to all our employees for your commitment and hard work in 2015. Let’s continue our efforts keeping our heads cold, hearts warm and hands clean! Also I want to thank our customers, business partners and shareholders for your excellent collaboration and support.
February 2016
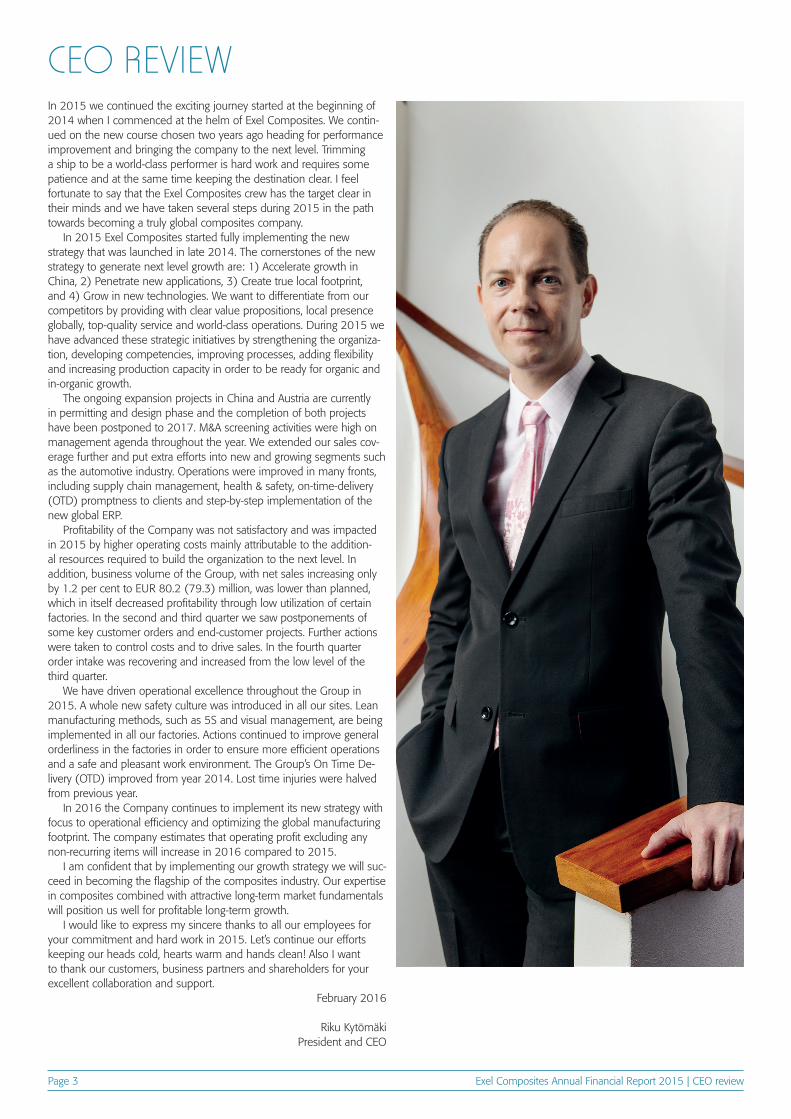
Riku KytömäkiPresident and CEO
CEO REVIEW
EXEL COMPOSITES GROUPFINANCIAL STATEMENTS
Exel Composites Annual Financial Report 2015 | ContentsPage 5
CONTENTSBOARD OF DIRECTORS’ REPORT 6
CONSOLIDATED COMPREHENSIVE INCOME STATEMENT 10
CONSOLIDATED STATEMENT OF FINANCIAL POSITION 11
CONSOLIDATED STATEMENT OF CHANGES IN SHAREHOLDERS’ EQUITY 12
CONSOLIDATED STATEMENT OF CASH FLOWS 13
NOTES TO THE CONSOLIDATED FINANCIAL STATEMENTS 14
NOTE 1 Corporate information 14
NOTE 2 Basis of preparation 14
NOTE 3 Changes in accounting policies and disclosures 14
NOTE 4 Significant accounting judgements, estimates and assumptions 15
NOTE 5 Summary of significant accounting policies 15
NOTE 6 Segment information 20
NOTE 7 Business combinations 20
NOTE 8 Exchange rates 20
NOTE 9 Other operating income 21
NOTE 10 Other operating expenses 21
NOTE 11 Employee benefit expenses 21
NOTE 12 Research and development expenditure 21
NOTE 13 Depreciation, amortization and impairment 21
NOTE 14 Financial income 22
NOTE 15 Financial expenses 22
NOTE 16 Income taxes 22
NOTE 17 Deferred tax assets and deferred tax liabilities 23
NOTE 18 Earnings per share 23
NOTE 19 Dividends per share 23
NOTE 20 Intangible assets 24
NOTE 21 Property, plant and equipment 25
NOTE 22 Other non-current assets 26
NOTE 23 Inventories 26
NOTE 24 Trade and other receivables 26
NOTE 25 Cash and cash equivalents 27
NOTE 26 Trade and other non-interest-bearing liabilities 27
NOTE 27 Interest-bearing loans and borrowings 27
NOTE 28 Impairment testing of goodwill and intangibles with indefinite lives 27
NOTE 29 Financial Risk Management 28
NOTE 30 Pension and other post-employment obligations 29
NOTE 31 Fair values of financial assets and liabilities 30
NOTE 32 Contingent liabilities 30
NOTE 33 Share capital 31
NOTE 34 Long-term compensation 31
NOTE 35 Distributable funds, 31 December 2015 32
NOTE 36 Cash flow from business operations 32
NOTE 37 Related party transactions 32
NOTE 38 Events after the reporting period 33
PARENT COMPANY INCOME STATEMENT 34
PARENT COMPANY BALANCE SHEET 35
PARENT COMPANY CASH FLOW STATEMENT 37
NOTES TO THE PARENT COMPANY FINANCIAL STATEMENTS 38
NOTE 1 Net sales by market area 38
NOTE 2 Personnel expenses 38
NOTE 3 Depreciation 38
NOTE 4 Other operating expenses 38
NOTE 5 Finance income and expenses 39
NOTE 6 Extraordinary items 39
NOTE 7 Direct taxes 39
NOTE 8 Intangible and tangible rights 39
NOTE 9 Companies owned by parent company 41
NOTE 10 Receivables 41
NOTE 11 Equity 41
NOTE 12 Non-current liabilities 42
NOTE 13 Current liabilities 42
NOTE 14 Contingent liabilities 42
NOTE 15 Leasing, rental and other liabilities 43
NOTE 16 Share ownership 43
NOTE 17 Shareholders 43
NOTE 18 Management interests 43
NOTE 19 Share issue and option programs 44
NOTE 20 Share price and trading 44
NOTE 21 Key indicators 45
COMPUTATION FORMULAE 46
PROPOSAL FOR DISTRIBUTION OF PROFIT 47
AUDITOR’S REPORT 48
Exel Composites Annual Financial Report 2015 | Board of Directors’ reportPage 6
BOARD OF DIRECTORS’ REPORTExel Composites is a leading composite technology company that de-signs, manufactures and markets composite products and solutions for demanding applications. Exel Composites provides superior customer experience through continuous innovation, world-class operations and long-term partnerships. Exel Composites share is listed on Nasdaq Helsinki Ltd.
Market environmentThe market environment in 2015 was mixed. On one hand the overall economic situation in Exel Composites’ main market area, Europe, was quite depressed with challenges from many fronts, such as declining exports from EU area to Russia then affecting the building and infra-structure demand. On the other hand the general value proposition and advantages of composite structures over other materials remained the same as before; giving superior combination of durability, light-ness, rigidity and non-corrosiveness, added with many other product attributes, such as superior surface quality, electrical conductivity or insulation properties. However, in more challenging market conditions a short-term capital expenditure driven buying behavior tends to over-run a longer term total life cycle cost driven approach, especially during the times when metal prices are low and then making the competition more difficult. At the same time in Asia demand was still good in many market segments providing with good possibilities for composites’ market penetration and growth, however the general growth being slower than in previous years. In North America the low oil price kept the investments in chemical, oil and gas segment low, affecting the demand in that segment directly and many other segments, such as transportation, indirectly. All in all, the global market environment for Exel Composites’ key market segments was relatively stable in 2015.
Looking forward to 2016, industrial investments are gradually expected to pick up in Europe. Low demand in the Russian market continues to impact also the European building and construction indus-try. Some infrastructure projects are also awaiting local governments’ funding. Consequently, the Company does not expect any changes in the European market as a whole. In North America low oil price con-tinues to impact the chemical, oil and gas market directly and several other market segments indirectly. In Asia-Pacific megatrends, includ-ing urbanization and energy efficiency, continue to drive growth. The markets benefiting from energy efficiency, especially the transportation industry, continue to grow. The renewable energy markets, such as solar panels and wind turbines show some positive signs for improvement, increasing the demand of composites.
Order intake and order backlog January – December 2015Order intake increased in 2015 by 1.3 per cent compared to the previ-ous year to EUR 83.4 million (EUR 82.3 million in 2014).
The Group’s order backlog increased to EUR 15.3 (12.8) million on 31 December 2015.
Sales review January – December 2015Group net sales for the financial year 2015 increased by 1.2 per cent to EUR 80.2 (79.3) million. Postponements of orders and end-customer projects from some key customers were recorded in the second and third quarter of 2015. However, in the fourth quarter, order intake was recover-ing and increased from the low level of the third quarter.
Net sales decreased in the largest region, Europe, by 1.1 per cent to EUR 63.9 (64.6) million compared to 2014. Net sales in the APAC region increased by 16.1 per cent to EUR 13.7 (11.8) million. Net sales decreased by 10.3 per cent in the region Rest of the world to EUR 2.6 (2.9) million compared to the previous year.
Net sales of industrial applications decreased by 0.3 per cent to EUR 47.4 (47.5) million. Net sales of Construction and Infrastructure applica-tions were up by 5.6 per cent to EUR 18.4 (17.4) million. Net sales of Other applications increased by 0.8 per cent to EUR 14.4 (14.3) million.
Financial performance The Group’s oeprating profit was not satisfactory in January – December 2015 and it decreased to EUR 4.4 million including EUR -0.4 million non-recurring items (EUR 8.9 million after impairment of EUR -0.5 million) and was 5.5 (11.2) per cent of net sales. Non-recurring items amounted to EUR -0.4 million relating to M&A screening costs.
Operating profit of 2015 was impacted by higher operational costs due to increased resources relating to the implementation of the long-term growth strategy. In addition, business volume of the Group, with net sales increasing only 1.2 per cent, was lower than planned, which in itself decreased profitability through low utilization of certain factories. Furthermore, the costs of production of the 2015 deliveries increased from those of 2014.
The profitability of the Australian unit continued to be unsatisfactory in 2015. Corrective actions were undertaken and further actions will be taken to resolve the situation.
The Group’s net financial expenses in 2015 were EUR 0.2 (0.4) million. The Group’s profit before taxes was EUR 4.3 (8.5) million and profit after taxes EUR 2.8 (5.7) million.
Financial positionNet cash flow from operating activities was positive at EUR +3.4 (+10.7) million. Cash flow before financing, but after capital expend-iture, amounted to EUR -1.0 (6.3) million. The capital expenditure amounted to EUR 4.3 (4.4) million. Capital expenditure was financed with cash flow from business operations. At the end of the financial year, the Group’s liquid assets stood at EUR 7.9 (8.2) million. Total de-preciation of non-current assets during the year under review amounted to EUR 2.9 (2.6) million.
The Group’s consolidated total assets at the end of the financial year were EUR 54.0 (52.4) million. Interest-bearing liabilities amounted to EUR 8.5 (5.6) million. Net interest-bearing liabilities were EUR 0.6 (-2.6) million.
Equity at the end of the financial year was EUR 30.7 (29.7) million and equity ratio 57.1 (56.9) per cent. The net gearing ratio was 2.0 (-8.7) per cent.
Fully diluted total earnings per share were EUR 0.24 (0.48). Return on capital employed in 2015 was 12.0 (25.2) per cent. Return on equity was 9.4 (21.7) per cent.
The Company paid total dividends during the financial year of EUR 2.4 (0.0) million. Dividend per share was EUR 0.20 (0.00).
Business development and strategy implementation In 2015 Exel Composites started fully implementing the new strategy that was launched in late 2014. The cornerstones of the new strate-gy to generate next level growth are: 1) Accelerate growth in China, 2) Penetrate new applications, 3) Create true local footprint, and 4) Grow in new technologies. The Company wants to differentiate from its competitors by providing clear value propositions, local presence globally, top-quality service and world-class operations. During 2015 the Company has advanced these strategic initiatives by strengthening the organization, developing competencies, improving processes, adding flexibility and increasing production capacity in order to pursue organic and in-organic growth. M&A screening activities continued througout the year. Operations were improved in many fronts, including supply chain management, health & safety, on-time-delivery (OTD) promptness to clients and continued implementation of the new global ERP.
Exel Composites has driven operational excellence throughout the Group in 2015. A whole new safety culture was introduced in all the sites. Lean manufacturing methods, such as 5S and visual manage-ment, are being implemented in all the factories. Actions continued to improve general orderliness in order to ensure more efficient opera-tions and a safe and pleasant work environment. The Group’s On Time Delivery (OTD) improved from year 2014. Lost time injuries were halved from previous year.
Exel Composites Annual Financial Report 2015 | Board of Directors’ reportPage 7
In accordance with the new growth strategy adopted in November 2014, a decision was made in December 2014 to expand operations in Nanjing, China to meet the increased demand. The target is to dou-ble the production capacity of the Nanjing unit. It was initially estimated that the project would be completed during the first half of 2016. Permitting and design of the expansion are ongoing, but the Company no longer foresees that building will be completed during 2016.
In February 2015 a decision was made to expand the operations in Austria. By this investment Exel Composites will be in a better position to serve its Central and Southern European customers. The completion of the project is postponed to 2017 due to weaker than estimated mar-ket situation in our main market area Central Europe. Land reservation and permitting of the expansion are ongoing.
Implementation of the new Group-wide ERP-system continued. The roll out to all business units will take place during 2016 and 2017 step-by-step.
Research and developmentResearch and development costs totaled EUR 1.9 (1.8) million, representing 2.3 (2.3) per cent of net sales. The main projects were connected with the development of new products and customer appli-cations.
Risk managementAt Exel Composites risk management is a continuous process, which is integrated with the daily decision making and continuous monitoring of operations as well as with preparation of quarterly and annual financial statements.
The Board of Directors governs the risk management of the Compa-ny through a risk management policy. In addition, the Board of Directors makes a risk assessment as part of the review and approval process of each set of quarterly and annual financial statements. Risk factors are also considered by the Board in connection with any future guidance disclosed by the Company.
The operative risk management, including risk monitoring, is part of the key duties of the operative management. Whereas risks are considered in conjunction with each business decision, they are also monitored by the managing director and other group management on a monthly basis when the team reviews the business development and any near and long-terms risks upon presentation of the business unit heads and controllers.
Risks and uncertainties related to Exel Composites can be catego-rized as strategic, operational, finance and hazard risks.
With respect to strategic risks, a significant portion of Exel Com-posites’ revenues is generated from certain key clients and market segments. Whereas production capacity and cost structure of the Com-pany is planned for growing business volume, negative development of such key clients or market segments could lead to deterioration of Exel Composites’ profitability. This risk is mitigated by a close cooperation with key clients. The development of key markets and consequently business volumes are actively followed and forecasted in order to be able to adjust our business and cost structures to the forecasts. New products and applications are continuously developed in order to limit the dependency of any individual clients or market segments.
Strategic risks also include risks related to acquisitions where the re-alized level of benefits and synergies may differ from the planned. Fur-thermore, continuing low demand in the Australian market may require such further corrective actions that could result in non-recurring items.
The most significant operational risks relate to product development and sales as well as production. Exel Composites’ product range is very broad and often customer customized, which adds complexity to the product development and production. Designing, producing and selling a product that does not meet the requirements agreed with a client could potentially lead to substantial losses and damages. In addition, availability of skilled employees, protection of self-developed proprietary technology, fraud, availability and pricing of key raw materials and health problems due to long-term exposure to chemicals belong to the most significant operational risks. Pre-emptive management of operative risks
through careful contracting as well as appropriate business processes and working instructions are in key roles to prevent possible damages.
Financial risks consist of currency, interest rate, liquidity and funding risks, and credit and other counter party risks. Currency and interest rate risks are managed primarily by natural hedging or by using derivative instruments. Credit insurance is in place to cover risks related to trade receivables.
Hazard risks, such as damages caused to property because of fire or chemical spill, as well as losses resulting from related business inter-ruptions, are mainly covered by insurance policies. This type of risks are also regularly audited by third parties that provide recommendations for improvement to reduce risk probability.
Shares and share performanceExel Composites’ share is listed on Nasdaq Helsinki Ltd in the Industri-als sector.
At the end of December 2015, Exel Composites’ share capital was EUR 2,141,431.74 and the number of shares was 11,896,843 each having the counter-book value of EUR 0.18. There were no changes in the share capital during the financial year. There is only one class of shares and all shares are freely assignable under Finnish law.
Exel Composites did not hold any of its own shares during the period under review.
During the financial year the highest share price quoted was EUR 9.85 (8.80) and the lowest EUR 6.32 (5.56). At the end of the year, the share price was EUR 6.53 (8.39). The average share price during the financial year was EUR 8.65 (6.42).
Total shareholder return (TSR) in 2015 was -21 (46) per cent.A total of 2,445,252 (5,836,969) shares were traded during the
year, which represents 20.6 (49.1) per cent of the average number of shares. On 31 December 2015, Exel Composites’ market capitalization was EUR 77.7 (99.8) million.
Shareholders and disclosuresExel Composites had a total of 2,987 (2,686) shareholders on 31 December 2015. Information on Exel Composites’ shareholders is avail-able on the Company website at www.exelcomposites.com.
On 31 December 2015, 0.26 per cent of the shares and votes of Exel Composites were owned or controlled, directly or indirectly by the President and CEO and the members of the Board.
The Company’s largest shareholder was Skandinaviska Enskilda Banken AB (nominee register), which owned 19.5 per cent of shares at the end of 2015. Other major shareholders included Nordea Bank Finland Plc 15.0 per cent (nominee register), Nordea Fennia Fund 5.1 per cent, Försäkringsaktiebolaget Pensions-Alandia 4.0 per cent and OP-Finland Small Firms Fund 3.9 per cent.
Exel Composites received two flagging announcements during the financial year.
On 13 March 2015 Exel Composites received a flagging announce-ment according to which the holding of Swedbank Robur Fonder AB had exceeded 5 per cent of the voting rights and share capital in Exel Composites Plc. Through share transactions concluded on 12 March 2015, the holding of Swedbank Robur Fonder AB rose to 703,054 shares, representing 5.9 per cent of the shares and voting rights of the Company.
On 20 May 2015 Exel Composites received a flagging announce-ment according to which the indirect holding of Evli Bank Plc had fallen under 5 per cent of the voting rights and share capital in Exel Com-posites Plc. Through share transactions concluded on 19 May 2015, the total holding of the investment funds owned by Evli Bank Plc and administered by Evli Fund Management Company Ltd fell to 504,786 shares, representing 4.2 per cent of the shares and voting rights of the Company.
Exel Composites Annual Financial Report 2015 | Board of Directors’ reportPage 8
Significant related-party transactionsExel Composites’ permanent public insiders include Exel Composites’ Board members, the President and CEO, the members of the Group Management Team and the audit firm’s auditor with principal responsi-bility for Exel Composites. No significant related-party transactions were conducted by the Group or the permanent insiders during the financial year 2015.
PersonnelThe number of employees on 31 December 2015 was 494 (456), of whom 213 (205) worked in Finland and 281 (251) in other countries. The average number of personnel during the financial year was 498 (433).
The building and strengthening of global functions continued in 2015. The company reinforced its organization in sales resources, prod-uct development and operations.
Environment, health and safetyExel Composites continues to remain alert to ensure our site operations are compliant with all national and international rules and regulations. A safe environment for our employees and neighbors is a priority at Exel Composites. Exel Composites’ environmental issues are managed using ISO 14001 standard as a guideline in all the units of the Group. The Group plays a leading role in industry associations such as EuCIA (European Composites Industry Association). This helps the Company stay at the leading edge of awareness of the latest developments in environmental matters including advances in environmental technology and new regulatory measures.
Special attention was paid to occupational health and safety also in 2015. The amount and quality of preventative reporting and follow-up has been improved significantly. The results of these actions are visible in the number of accidents (lost time incidents), which halved compared to 2014. The Occupational Health and Safety Management System OHSAS 18001 was implemented in most factories in 2015 and 100 per cent coverage is targeted for 2016.
Incentive programsExel Composites’ performance-based incentive program covers all employees. Office employees receive a monthly salary and an annual bonus tied to the achievement of annually established goals empha-sizing growth and profitability. Production employees are also eligible for incentive compensation. Their annual bonus is mainly based on productivity.
The Group has long-term incentive programs for the President and CEO and the Group Management Team and selected key employees of the Company. The aim of the programs is to combine the objectives of the shareholders and the executives in order to increase the value of the Company, to commit the executives to the Company and to offer the executives a competitive reward program. The Board of Directors makes the decision on the programs annually.
In February 2015 Exel Composites’ Board of Directors approved a new program for selected key employees of the Company. The pro-gram is based on long-term monetary incentive program and is targeted at approximately 25 executives for the earning period 2015 – 2017. The President and CEO and the members of the Group Management Team are included in the target group of the new incentive program.
The potential long-term monetary performance reward from the program is based on the Group’s cumulative Economic Profit and on the Group’s Total Shareholder Return (TSR). The potential reward will be paid in 2018. The maximum reward to be paid will be EUR 1.5 million excluding employer’s social costs.
The cost of the programs will be accounted for as operating expens-es during the duration of the programs.
Corporate GovernanceExel Composites issues a Corporate Governance Statement for the financial year 2015. Exel Composites complies with the Finnish Corporate Governance Code (“the code”) issued by the Securities
Market Association and which came into effect on 1 October 2010. The Corporate Governance Statement is issued separately from the Board of Directors’ report. Further information concerning the corporate govern-ance matters is available at Exel Composites’ website at www.exelcomposites.com.
Decisions of the AGM 2015The Annual General Meeting of Exel Composites Plc held on 26 March 2015 approved the Board’s proposal to distribute a dividend of EUR 0.20 per share for the financial year 2014.
The Annual General Meeting authorized the Board of Directors to repurchase the Company’s own shares by using unrestricted equity. The maximum amount to be acquired is 600,000 shares. The authorization is valid until 30 June 2016.
Board of Directors and AuditorsOn 26 March 2015, the Annual General Meeting appointed Heikki Hiltunen, Peter Hofvenstam, Reima Kerttula and Kerstin Lindell to continue on the Board of Directors. Matti Hyytiäinen was appointed as a new member of the Board as Göran Jönsson was no longer available for re-election. The AGM re-elected Peter Hofvenstam as Chairman of the Board of Directors.
The Board of Directors convened nine times in 2015 and the aver-age attendance rate at these meetings was 96.3 per cent. The fees paid to the Board of Directors totaled EUR 156 (141) thousand in 2015.
The Board of Directors reviewed the independence of Board members in accordance with Recommendation 15 of the Corporate Governance Code in its March 2015 meeting. All the members of the Board are independent Board members. The Board was considered to comply with the Corporate Governance independency rules.
The Annual General Meeting of Exel Composites has elected a Shareholders’ Nomination Board, which nominates candidates to the Annual General Meeting for election as Board members and proposes the fees to be paid to the Board members. The Nomination Board included the Chairman and persons nominated by the four largest shareholders as of 30 September 2015. In 2015 the Nomination Board comprised Ted Roberts (Nordea) as chairman, Tuomas Virtala (Danske Capital Finland), Henrik Viktorsson (Alandia Insurance), Kalle Saariaho (OP Financial Group), and Peter Hofvenstam, the Chairman of the Board of Directors, as an expert member. The Nomination Board met five times.
Ernst & Young, Authorized Public Accountants, with Juha Hilmola, APA, as principal auditor, were elected to serve as company auditor in the AGM in 2015.
The fees paid to the auditors for audit services totaled EUR 190 (163) thousand and for non-audit services EUR 123 (51) thousand in 2015.
Changes in Group ManagementMr. Mikko Kettunen was appointed SVP, CFO and member of the Group Management Team on 13 January 2015 and assumed his position on 7 April 2015. Mr. Kettunen succeeded Mr. Ilkka Silvanto, who was ap-pointed with the same date as SVP, Strategic Projects, effective as of 7 April 2015. Mr. Silvanto continues reporting to CEO and being member of Group Management Team.
Adoption of International Financial Reporting Standards (IRFS)All IFRS’s in force on 31 December 2015 that are applicable to Exel Composites’ business operations, including all SIC- and IFRIC-interpreta-tions thereon, have been complied with when preparing year 2015 and comparable year 2014 figures. International financial reporting stand-ards, referred to in the Finnish Accounting Act and in ordinances issued based on the provisions of this Act, refer to the standards and their interpretations adopted in accordance with the procedure laid down in regulation (EC) No 1606/2002 of the EU. The notes to the consolidat-ed financial statements conform also with the Finnish accounting and company legislation.
Exel Composites Annual Financial Report 2015 | Board of Directors’ reportPage 9
Events after the review periodThe Board of Directors of Exel Composites Plc has on 18 February 2016 approved a new incentive program for the executives of the Company. The program is based on long-term monetary incentive program and is targeted at approximately 20 executives for the earning period 2016 – 2018. The President and CEO and the members of the Group Management Team are included in the target group of the new incentive program.
The 2016 program includes one earning period, the calendar years 2016 – 2018. The potential long-term monetary performance reward from the program is based on the Group’s cumulative Economic Profit and on the Group’s Total Shareholder Return (TSR). The potential reward will be paid in 2019. The maximum reward to be paid will be EUR 1.0 million excluding employer’s social costs.
The Board of Directors of Exel Composites Plc has on 18 Febru-ary 2016 taken a decision to change the Group’s financial reporting practices as of 19 February 2016 as a result of the amended Securities Market Act, which was entered into force on 26 November 2015. Con-trary to what was disclosed on 17 December 2015 regarding financial reporting in 2016, Exel Composites will disclose certain key figures and information on business performance for the three and nine months periods in a stock exchange release instead of interim reports.
Outlook for 2016The Company continues to implement its new strategy with focus to operational efficiency and optimizing the global manufacturing footprint. The Company estimates that operating profit excluding any non-recur-ring items will increase in 2016 compared to 2015.
Board proposal for dividend distributionThe Board of Directors of Exel Composites Plc has on 18 February 2016 amended the Company’s dividend policy. Exel Composites’ finan-cial goals include distributing dividends mimimum (prior: “some”) 40 per cent of the profit for the financial year as permitted by the financial structure and growth opportunities.
On 31 December 2015 Exel Composites Plc’s distributable funds totaled EUR 13,795 thousand, of which profit for the financial period accounted for EUR 2,624 thousand.
The Board has decided to propose to the Annual General Meeting that a dividend of EUR 0.22 (EUR 0.20) per share, a payout ratio of 92.0 per cent, be paid for the 2015 financial year.
As a basis for its proposal, the Board of Directors has made an assessment of the Group’s financial position and ability to meet its commitments, as well as the Group’s outlook and investment require-ments. The Board considers the proposed dividend well-balanced given the prospects, the capital requirements and the risks of the Group’s business activities.
The proposed record date for dividends is 21 March 2016. If the Annual General Meeting approves the Board’s proposal, it is estimated that the dividend will be paid on 30 March 2016.
Exel Composites Annual Financial Report 2015 | Consolidated financial statementsPage 10
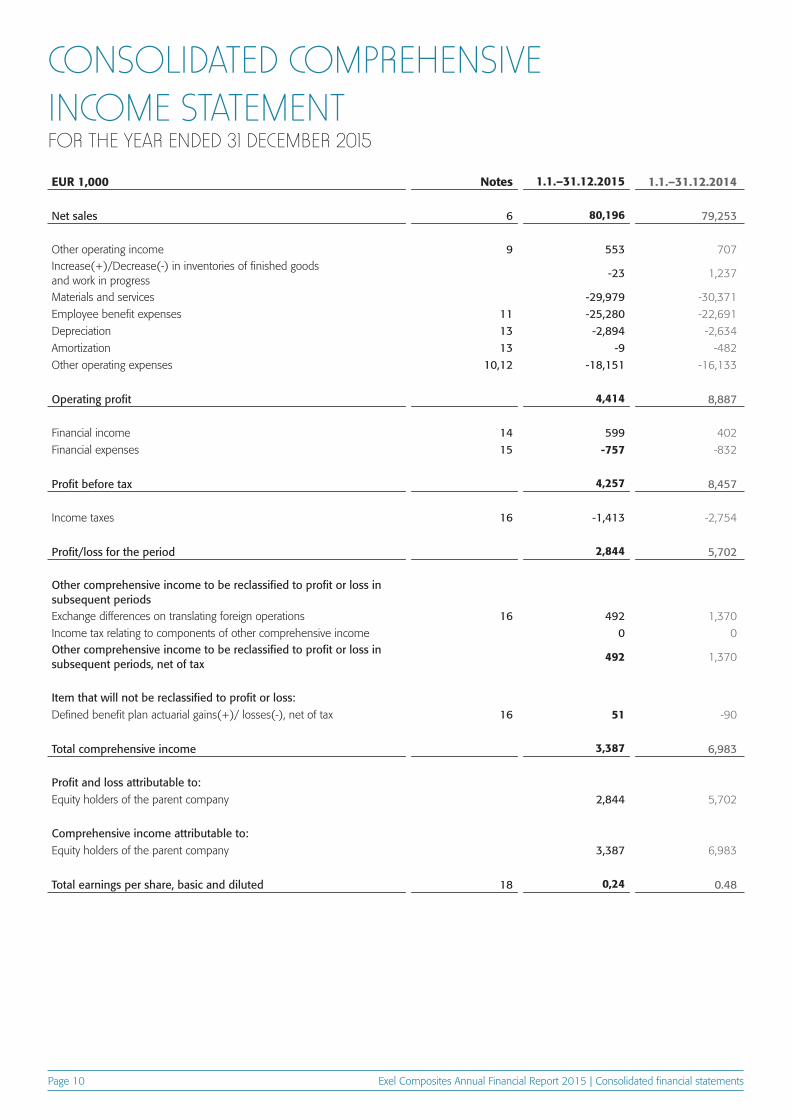
CONSOLIDATED COMPREHENSIVE INCOME STATEMENTFOR THE YEAR ENDED 31 DECEMBER 2015
EUR 1,000 Notes 1.1.–31.12.2015 1.1.–31.12.2014
Net sales 6 80,196 79,253
Other operating income 9 553 707Increase(+)/Decrease(-) in inventories of finished goods and work in progress
-23 1,237
Materials and services -29,979 -30,371
Employee benefit expenses 11 -25,280 -22,691
Depreciation 13 -2,894 -2,634
Amortization 13 -9 -482
Other operating expenses 10,12 -18,151 -16,133
Operating profit 4,414 8,887
Financial income 14 599 402
Financial expenses 15 -757 -832
Profit before tax 4,257 8,457
Income taxes 16 -1,413 -2,754
Profit/loss for the period 2,844 5,702
Other comprehensive income to be reclassified to profit or loss in subsequent periodsExchange differences on translating foreign operations 16 492 1,370
Income tax relating to components of other comprehensive income 0 0Other comprehensive income to be reclassified to profit or loss in subsequent periods, net of tax
492 1,370
Item that will not be reclassified to profit or loss:Defined benefit plan actuarial gains(+)/ losses(-), net of tax 16 51 -90
Total comprehensive income 3,387 6,983
Profit and loss attributable to:Equity holders of the parent company 2,844 5,702
Comprehensive income attributable to:Equity holders of the parent company 3,387 6,983
Total earnings per share, basic and diluted 18 0,24 0.48
Exel Composites Annual Financial Report 2015 | Consolidated financial statementsPage 11
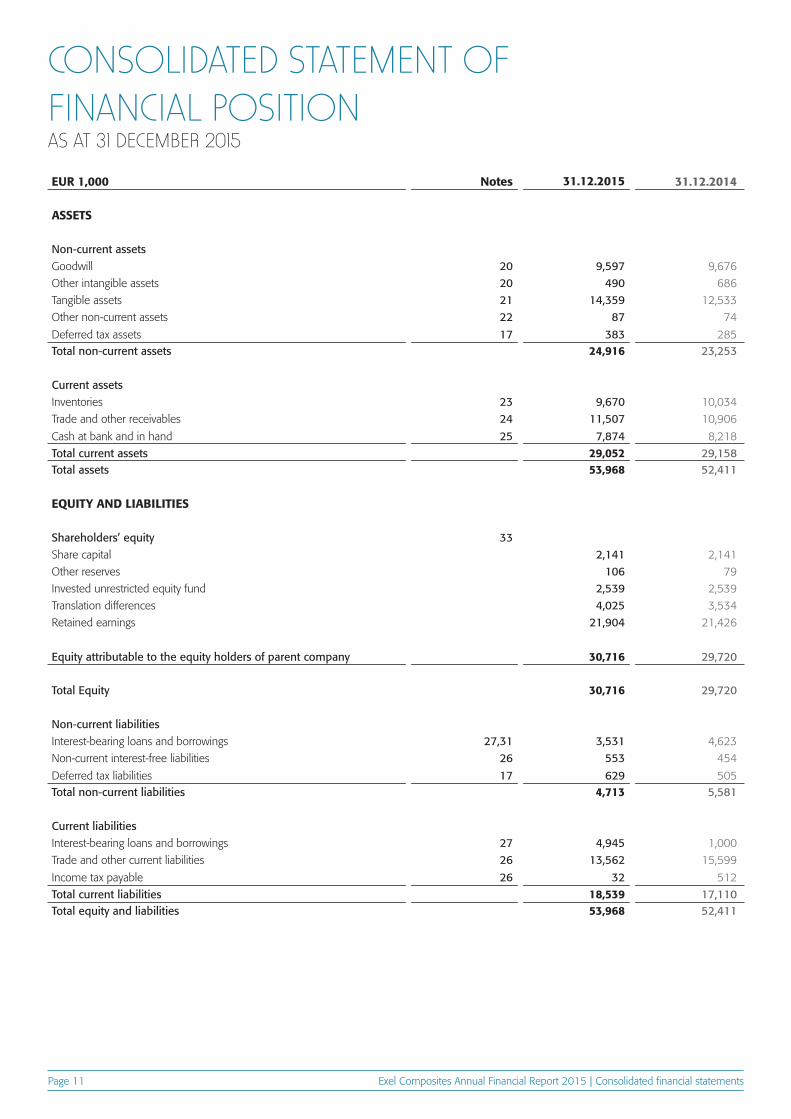
CONSOLIDATED STATEMENT OF FINANCIAL POSITIONAS AT 31 DECEMBER 2015
EUR 1,000 Notes 31.12.2015 31.12.2014
ASSETS
Non-current assetsGoodwill 20 9,597 9,676
Other intangible assets 20 490 686
Tangible assets 21 14,359 12,533
Other non-current assets 22 87 74
Deferred tax assets 17 383 285Total non-current assets 24,916 23,253
Current assetsInventories 23 9,670 10,034
Trade and other receivables 24 11,507 10,906
Cash at bank and in hand 25 7,874 8,218
Total current assets 29,052 29,158Total assets 53,968 52,411
EQUITY AND LIABILITIES
Shareholders’ equity 33Share capital 2,141 2,141
Other reserves 106 79
Invested unrestricted equity fund 2,539 2,539
Translation differences 4,025 3,534
Retained earnings 21,904 21,426
Equity attributable to the equity holders of parent company 30,716 29,720
Total Equity 30,716 29,720
Non-current liabilitiesInterest-bearing loans and borrowings 27,31 3,531 4,623
Non-current interest-free liabilities 26 553 454
Deferred tax liabilities 17 629 505Total non-current liabilities 4,713 5,581
Current liabilitiesInterest-bearing loans and borrowings 27 4,945 1,000
Trade and other current liabilities 26 13,562 15,599
Income tax payable 26 32 512
Total current liabilities 18,539 17,110Total equity and liabilities 53,968 52,411
Exel Composites Annual Financial Report 2015 | Consolidated financial statementsPage 12
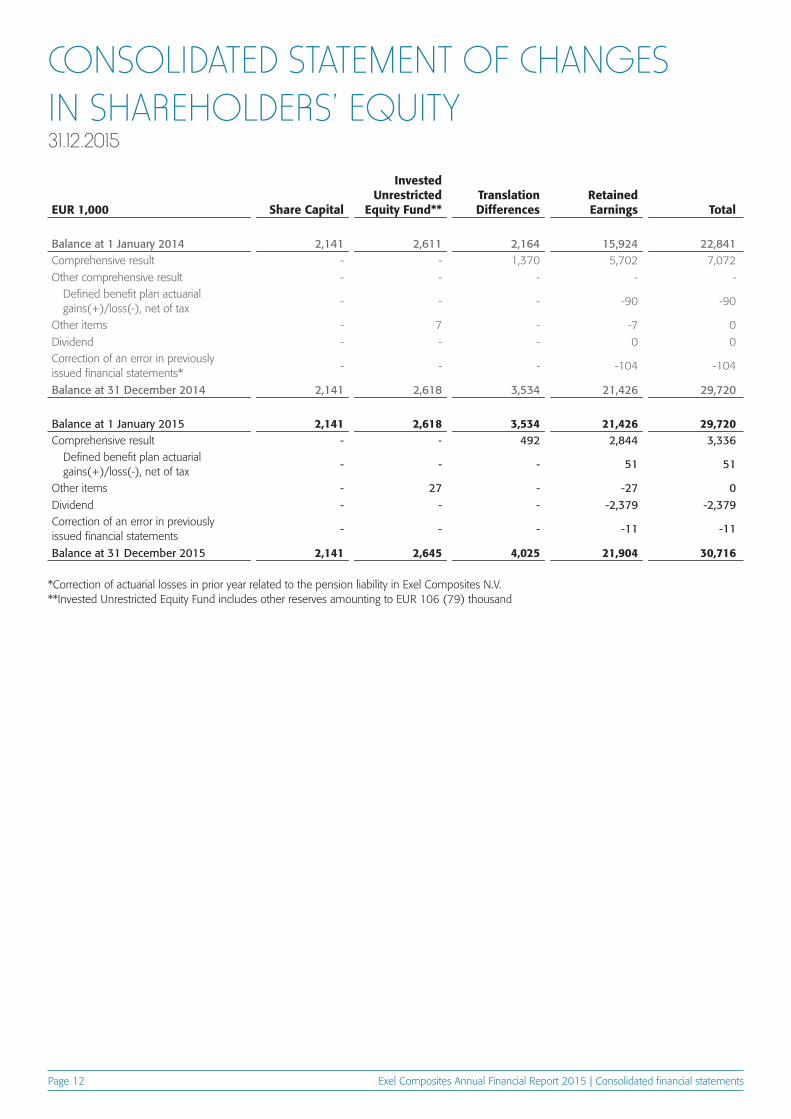
EUR 1,000 Share Capital
Invested Unrestricted
Equity Fund**Translation Differences
Retained Earnings Total
Balance at 1 January 2014 2,141 2,611 2,164 15,924 22,841Comprehensive result - - 1,370 5,702 7,072
Other comprehensive result - - - - -Defined benefit plan actuarial gains(+)/loss(-), net of tax
- - - -90 -90
Other items - 7 - -7 0
Dividend - - - 0 0Correction of an error in previously issued financial statements*
- - - -104 -104
Balance at 31 December 2014 2,141 2,618 3,534 21,426 29,720
Balance at 1 January 2015 2,141 2,618 3,534 21,426 29,720Comprehensive result - - 492 2,844 3,336
Defined benefit plan actuarial gains(+)/loss(-), net of tax
- - - 51 51
Other items - 27 - -27 0Dividend - - - -2,379 -2,379Correction of an error in previously issued financial statements
- - - -11 -11
Balance at 31 December 2015 2,141 2,645 4,025 21,904 30,716
CONSOLIDATED STATEMENT OF CHANGES IN SHAREHOLDERS’ EQUITY31.12.2015
*Correction of actuarial losses in prior year related to the pension liability in Exel Composites N.V.**Invested Unrestricted Equity Fund includes other reserves amounting to EUR 106 (79) thousand
Exel Composites Annual Financial Report 2015 | Consolidated financial statementsPage 13
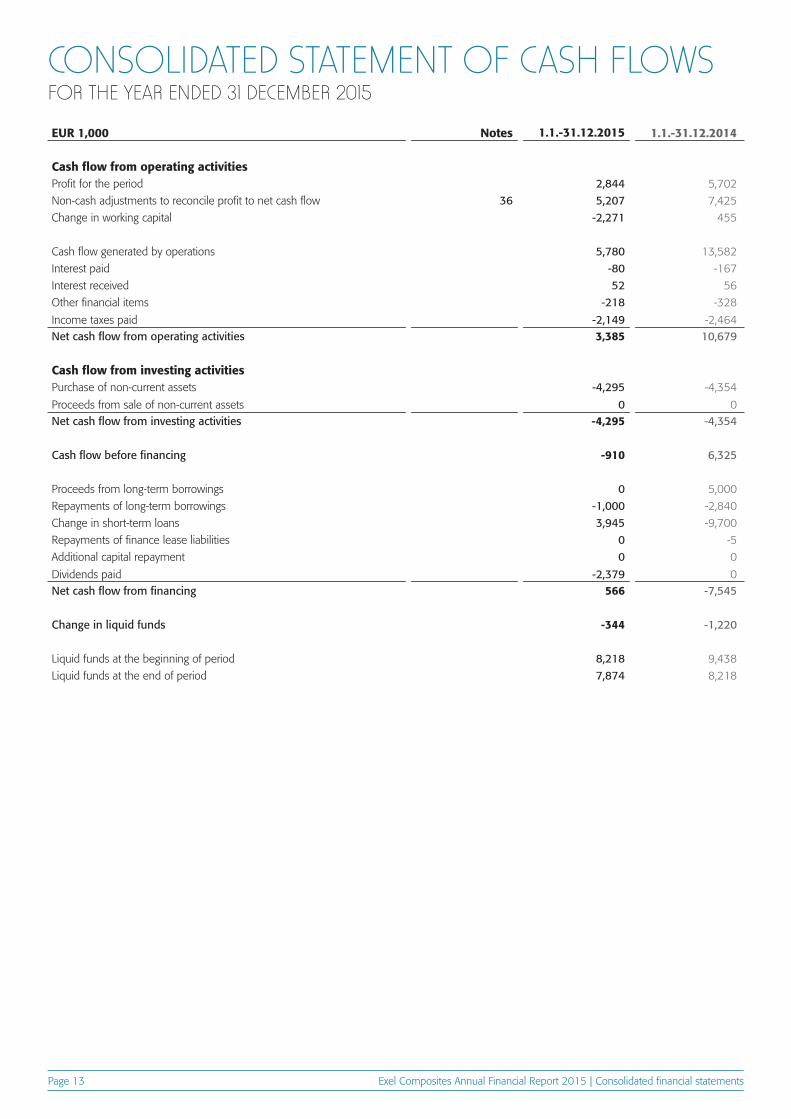
CONSOLIDATED STATEMENT OF CASH FLOWSFOR THE YEAR ENDED 31 DECEMBER 2015
EUR 1,000 Notes 1.1.-31.12.2015 1.1.-31.12.2014
Cash flow from operating activitiesProfit for the period 2,844 5,702
Non-cash adjustments to reconcile profit to net cash flow 36 5,207 7,425
Change in working capital -2,271 455
Cash flow generated by operations 5,780 13,582
Interest paid -80 -167
Interest received 52 56
Other financial items -218 -328
Income taxes paid -2,149 -2,464Net cash flow from operating activities 3,385 10,679
Cash flow from investing activitiesPurchase of non-current assets -4,295 -4,354
Proceeds from sale of non-current assets 0 0Net cash flow from investing activities -4,295 -4,354
Cash flow before financing -910 6,325
Proceeds from long-term borrowings 0 5,000
Repayments of long-term borrowings -1,000 -2,840
Change in short-term loans 3,945 -9,700
Repayments of finance lease liabilities 0 -5
Additional capital repayment 0 0
Dividends paid -2,379 0Net cash flow from financing 566 -7,545
Change in liquid funds -344 -1,220
Liquid funds at the beginning of period 8,218 9,438
Liquid funds at the end of period 7,874 8,218
Exel Composites Annual Financial Report 2015 | Notes to the consolidated financial statementsPage 14
NOTES TO THE CONSOLIDATED FINANCIAL STATEMENTS(All figures in EUR thousands unless otherwise stated)
The consolidated financial statements of Exel Composites Plc for the year ended 31 December 2015 were authorized for issue in accord-ance with a resolution of the Board of Directors on 18 February 2016.
Final decision to adopt or reject the financial statements is made by shareholders in Annual General Meeting on 17 March 2016.
Exel Composites is a leading composite technology company that de-signs, manufactures and markets composite products and solutions for demanding applications. Exel Composites provides superior customer experience through continuous innovation, world-class operations and long-term partnerships.
The core of the operations is based on proprietary, internally devel-oped composite technology, product range based on it and a strong market position in selected segments with a strong quality and brand image. Profitable growth is pursued by a relentless search for new
applications and development in co-operation with customers. The personnel’s expertise and high level of technology play a major role in Exel Composites’ operations.
The Group’s factories are located in Australia, Austria, Belgium, China, Finland, Germany and the United Kingdom. Exel Composites share is listed in the Small Cap segment of the Nasdaq Helsinki Ltd. in the Industrials sector. Exel Composites Plc is domiciled in Mäntyharju, Finland and its registered address is Uutelantie 24 B, 52700 Mäntyhar-ju, Finland.
The accounting policies adopted are consistent with those of the previ-ous financial year.
The standards and standard amendments that are issued, but not effective, up to the date of issuance of the Group’s financial statements
are listed below. The Group intends to adopt these standards and amendments, if applicable, when they become effective. Based on preliminary analysis, the standards are not expected to materially impact on the Group’s financial statements.
The consolidated financial statements have been prepared on a historical cost basis, with the exception of available-for-sale investment securities and certain other financial assets and financial liabilities that have been measured at fair value.
The consolidated financial statements are presented in euros and all values are rounded to the nearest thousand except where otherwise indicated.
Statement of ComplianceThe consolidated financial statements of Exel Composites have been prepared in compliance with International Financial Reporting Standards (IFRS), applying IAS and IFRS standards, as well as SIC and IFRIC inter-pretations, valid on 31 December 2015. The notes to the consolidated financial statements are also in compliance with the Finnish Accounting and Companies Acts.
Basis of ConsolidationExel Composites’ consolidated financial statements include the ac-counts of the parent company Exel Composites Plc and its subsidiaries as at 31 December each year. Subsidiaries are viewed as companies in which it owns, directly or indirectly, over 50 per cent of the voting rights or in which it is in a position to govern the financial and operating policies of the entity. Subsidiaries are fully consolidated from the date that Exel Composites acquired control and are no longer consolidated from the date that control ceases. Where necessary, the accounting principles of subsidiaries have been changed to ensure consistency with the accounting principles of the Group. The financial statements of the subsidiaries are prepared for the same reporting period as the parent company, using consistent accounting policies.
Acquisitions of companies are accounted for using the purchase method. The cost of an acquisition is measured at fair value over the assets given up, shares issued or liabilities incurred or assumed at the
date of acquisition. The excess acquisition cost over the fair value of net assets acquired is recognized as goodwill.
All intra-group balances, income and expenses, unrealized gains and losses and dividends resulting from intra-group transactions are eliminated in full.
If the Group loses control over a subsidiary, it:
• Derecognizes the assets and liabilities of the subsidiary;• Derecognizes the carrying amount of non-controlling interest;• Derecognizes the cumulative translation differences, recorded in
equity;• Recognizes the fair value of the consideration received;• Recognizes the fair value of any investment retained;• Recognizes any surplus or deficit in profit or loss: and• Reclassifies the parent’s share of components previously recognized
in other comprehensive income to profit or loss.
When compiling the opening IFRS balance sheet, Exel Composites has applied the exemption provided by IFRS 1 related to business combi-nations. This means that the assets and liabilities of subsidiaries have not been assessed retroactively at their market value. Instead, they have been included in the balance sheet on the transition date in an amount in accordance with earlier financial accounting practice. The Group has no affiliated companies or joint ventures.
Non-controlling interest is deducted from shareholders’ equity and presented as a separate item in the balance sheet. Similarly, it is pre-sented as a separate item in the consolidated financial statements. The share of losses attributable to the holders of non-controlling interest was debited to non-controlling interest in the consolidated balance sheet up to the full value of the non-controlling interest prior to 1 January 2010. The Group had no non-controlling interests in 2015 and 2014.
NOTE 1 CORPORATE INFORMATION
NOTE 3 CHANGES IN ACCOUNTING POLICIES ANS DISCLOSURES
NOTE 2 BASIS OF PREPARATION
Exel Composites Annual Financial Report 2015 | Notes to the consolidated financial statementsPage 15
New standards• IFRS 9 Financial Instruments• IFRS 15 Revenue from Contracts with Customers• IFRS 16 Leases
Amendments to standards• IFRS 5 Non-current Assets Held for Sale and Discontinued Operations• IFRS 7 Financial Instruments: Disclosures• IFRS 10, 12 and IAS 28 Investment Entities: Applying the Consolida-
tion Expenses
• IFRS 10 and IAS 28 Sale or Contribution of Assets between an Inves-tor and its Associate or Joint Venture
• IFRS 11 Accounting for Acquisitions of Interests in Joint Operations• IAS 1 Disclosure Initiative• IAS 16 and 38 Clarification of Acceptable Methods of Depreciation
and Amortization• IAS 16 and 41 Agriculture: Bearer Plants• IAS 19 Defined Benefit Plans: Employee Contributions• IAS 27 Equity Method in Separate Financial Statement• IAS 34 Interim Financial Reporting
The preparation of the Group’s consolidated financial statements may require the use of judgments, estimates and assumptions that affect the reported amounts of assets and liabilities and the disclosure of contin-gent assets and liabilities at the end of the reported period and the re-ported amounts of revenues and expenses during the reporting period. Although these estimates are based on management’s best knowledge of current events and actions, actual results may ultimately differ from those estimates. The preparation of impairment tests requires the use of estimates.
JudgmentsThe Group has entered into commercial property leases. The Group has determined, based on an evaluation of the terms and conditions of the arrangements, that it retains all the significant risks and rewards of ownership of these properties and so accounts for the contracts as financial leases.
Estimates and assumptionsThe key assumptions concerning the future and other key sources of estimation uncertainty at the balance sheet date, that have a significant risk of causing a material adjustment to the carrying amounts of assets and liabilities within the next financial year are discussed below.
Impairment of non-financial assetsThe Group assesses whether there are any indicators of impairment for all non-financial assets at each reporting date. Goodwill and other in-definite life intangibles are tested for impairment annually and at other times when such indicators exist. Other non-financial assets are tested for impairment when there are indicators that the carrying amounts may not be recoverable.
When value-in-use calculations are undertaken, management must estimate the expected future cash flows from the asset or cash-gener-
ating unit and choose a suitable discount rate in order to calculate the present value of those cash flows. Further details, including sensitivity analysis of key assumptions, are given in Note 28.
Deferred tax assetsDeferred tax assets are recognized for all unused tax losses to the ex-tent that it is probable that taxable profit will be available against which the losses can be utilized. Significant management judgment is required to determine the amount of deferred tax assets that can be recognized, based on the likely timing and level of future taxable profits together with the future tax planning strategies. Further details are given in Note 17.
Pension and other post-employment benefitsThe cost of defined benefit pension plans is determined using actu-arial valuations. The actuarial valuation involves making assumptions about discount rates, expected rates of return on assets, future salary increases, mortality rates and future pension increases. Due to the long-term nature of these plans, such estimates are subject to significant uncertainty.
Determining the fair value of assets in business combinationsIn major corporate mergers the Group has employed the services of an outside advisor in assessing the fair value of tangible assets. For tangible assets comparisons have been made with the market prices of similar assets and an estimate made about impairment caused by the acquired asset’s age, wear and other related factors. The determination of the fair value of tangible assets is based on estimates of cash flows related to the asset.
NOTE 4 SIGNIFICANT ACCOUNTING JUDGEMENTS, ESTIMATES AND ASSUMPTIONS
Business combinations and goodwill
Business combinations from 1 January 2009Business combinations are accounted for using the acquisition method. The cost of an acquisition is measured as the aggregate of the consideration transferred, measured at acquisition date fair value and the amount of any non-controlling interest in the acquiree. For each business combination, the acquirer measures the non-controlling interest in the acquiree either at fair value or at the proportionate share of the acquiree’s identifiable net assets. Acquisitions costs incurred are expensed.
When the Group acquires a business, it assesses the financial assets and liabilities assumed for appropriate classification and designation in accordance with the contractual terms, economic circumstances and pertinent conditions at the acquisition date.
Goodwill is initially measured at cost being the excess of the consid-eration transferred over the Group’s net identifiable assets acquired and
liabilities assumed. If the consideration is lower than the fair value of the net assets of the subsidiary acquired, the difference is recognized in profit or loss.
After initial recognition, goodwill is measured at cost less any ac-cumulated impairment losses. For the purpose of impairment testing, goodwill acquired is allocated to each of the Group’s cash generating units.
Business combinations prior to 31 December 2008In comparison to the above mentioned requirements, the following differences applied:
Business combinations were accounted for using the purchase method. Transaction costs directly attributable to the acquisition formed part of the acquisition costs. The non-controlling interest (formerly known as minority interest) was measured at the proportionate share of the acquiree’s identifiable assets.
The Group does not have any associates or joint ventures.
NOTE 5 SUMMARY OF SIGNIFICANT ACCOUNTING POLICIES
Exel Composites Annual Financial Report 2015 | Notes to the consolidated financial statementsPage 16
Non-current assets held for sale and discontinued operationsNon-current assets and disposal groups classified as held for sale are measured at the lower of carrying amount and fair value less costs to sell. Non-current assets and disposal groups are classified as held for sale if their carrying amounts will be recovered through a sale transac-tion rather than through continuing use. This condition is regarded as met only when the sale is highly probable and the asset or disposal group is available for immediate sale in its present condition. Manage-ment must be committed to the sale, which should be expected to qualify for recognition as a completed sale within one year from the date of classification.
Property, plant and equipment and intangible assets once classified as held for sale are not depreciated or amortized.
Revenue recognitionRevenue is recognized to the extent that it is probable that the eco-nomic benefits will flow to the Group and the revenue can be reliably measured. Sales of products are recognized as income once the risk and benefits related to ownership of the sold products have been trans-ferred to the buyer and the Group no longer has the possession of, or control over, the products. Sales of services are recognized as income once the service has been rendered. Revenue arising from projects lasting over 12 months and having a material impact on the Group’s financial position and performance is recognized in accordance with IAS standard 11.
Net sales comprise the invoiced value for the sale of goods and services net of indirect taxes, sales adjustment and exchange rate differences. Distribution costs for products to be sold are included in the income statement as other operating expenses. Interest income is recognized using the effective interest rate method and dividend income when the right to the dividend has been created.
Foreign currency translationThe Group’s consolidated financial statements are presented in euros, which is also the parent company’s functional currency. Each entity in the Group determines its own functional currency and items included in the financial statements of each entity are measured using that func-tional currency. The Group has elected to recycle the gain or loss that arises from the direct method of consolidation, which is the method the Group uses to complete its consolidation.
The income statements of independent foreign subsidiaries are translated into euros at the average exchange rates for the financial year and the assets and liabilities are translated at the exchange rate of the balance sheet date. Exchange differences arising on the translation are recognized in other comprehensive income. When a foreign operation is sold, the component of other comprehensive income relating to that particular foreign operation is recognized in the income statement.
Any goodwill arising from the acquisition of a foreign entity subse-quent to 1 January 2005 and any fair value adjustments to the carrying amounts of assets and liabilities are treated as assets and liabilities of the foreign entity and translated at the closing rate.
Transactions in foreign currencies are initially recorded by the Group entities at their respective functional currency rates prevailing at the date of the transaction.
Monetary assets and liabilities denominated in foreign currencies are retranslated at the functional currency spot rate of exchange ruling at the reporting date.
Non-monetary items measured at fair value in a foreign currency are translated using the exchange rates at the date when the fair value is determined. Other non-monetary items that are measured in the terms of historical cost in the foreign currency are translated using the exchange rates at the dates of the initial transaction.
Foreign currency exchange gains and losses related to business operations and translating monetary items have been entered in the income statement. Foreign exchange differences from business operations are included in other items above profit for the year. Foreign exchange differences from foreign currency loans and cash at bank are included in financial items.
Intangible assetsIntangible assets acquired separately are measured on initial recognition at cost. The cost of intangible assets acquired in a business combination is its fair value at the date of acquisition. Following initial recognition, intangible assets are carried at cost less any accumulated amortization and any accumulated impairment losses. Internally generated intangible assets, excluding capitalized development costs, are not capitalized and expenditure is reflected in the income statement in the year in which the expenditure is incurred.
The useful life of intangible assets is either finite or indefinite. Intangible assets with finite lives are amortized over the useful life
and assessed for impairment whenever there is indication that the intangible asset may be impaired.
Intangible assets are amortized on a straight-line basis over their esti-mated useful lives as follows:
Development costs 3 – 5 yearsOther long-term costs 3 – 8 yearsOther intangible assets 3 – 8 yearsCustomer relationships 10 years
Intangible assets with indefinite useful lives are not amortized but are tested for impairment annually, either individually or at the cash gener-ating unit level.
Research and developmentResearch costs are expensed as incurred. Costs incurred from develop-ment projects, which are often connected with the design and testing of new or advanced products, are recorded in the balance sheet as intan-gible assets from the time that the product can be technically achieved, it can be utilized commercially, and the product is expected to create a comparable financial benefit. Other development costs are recorded as expenses. Capitalized development costs are amortized on a straight-line basis beginning from the commercial production of the product during the period they are effective, yet no longer than five years. There were no capitalized development costs during 2015 and 2014.
Computer softwareCosts associated with the development and maintenance of comput-er software are generally recorded as expenses. Costs that improve or expand the performance of computer software to the extent that the performance is higher than originally is considered as a property item improvement and is added to the original acquisition cost of the software. Activated computer software development costs are expensed and amortized on a straight-line basis during the period they are finan-cially effective.
Other intangible assetsThe acquisition costs of patents, trademarks and licenses are capitalized in intangible assets and depreciated on a straight-line basis during their useful lives.
Property, plant and equipmentProperty, plant and equipment is stated in the balance sheet at histor-ical cost less accumulated straight-line depreciation according to the expected useful life, benefits received, and any impairment losses.
Planned depreciation is calculated on a straight-line basis to write off the acquisition cost of each fixed asset up to its residual value over the asset’s expected useful life. Land areas are not depreciated. For other tangible fixed assets, depreciation is calculated according to the following expected useful lives:
Buildings 5 – 20 yearsMachinery 5 – 15 yearsEquipment 3 – 5 years
If the book value of an asset item exceeds the estimated amount recoverable in the future, its book value is adjusted immediately to correspond with the amount recoverable in the future.
Exel Composites Annual Financial Report 2015 | Notes to the consolidated financial statementsPage 17
Routine maintenance and repair expenditure is recognized as an expense. Expenditure on significant modernization and improvement projects are recognized in the balance sheet if they are likely to increase the future economic benefits embodied in the specific asset to which they relate. Modernization and improvement projects are depreciated on a straight-line basis over their expected useful lives.
Depreciation on tangible fixed assets is discontinued when a tangi-ble fixed asset meets the criteria of “held-for-sale” according to IFRS 5 ”Non-current Assets Held for Sale and Discontinued Operations”.
Gains or losses on disposal or decommissioning of tangible fixed assets are calculated as the difference of the net proceeds obtained and the balance sheet value. Capital gains and losses are included in the income statement in the item operating profit.
Government grantsGovernment grants are recognized where there is reasonable assur-ance that the grant will be received and all attaching conditions will be complied with. When the grant relates to an expense item, it is recog-nized as an income over the period necessary to match the grant on a systematic basis to the costs that it is intended to compensate. Where the grant relates to an asset, it is recognized as deferred income and released to the income statement over the expected useful life of the relevant asset by equal annual installments.
Borrowing costsBorrowing costs directly attributable to the acquisition, construction or production of an asset that necessarily takes a substantial period of time to get ready for its intended use or sale are capitalized as part of the cost of the respective assets. All other borrowing costs are expensed in the period they occur. Borrowing costs consist of interest and other costs that an entity occurs in connection with the borrowing of funds. For the years ending 31 December 2015 and 2014, the Group had no assets where the borrowing costs would have been capitalized.
Financial assetsFinancial assets are classified within the scope of IAS 39 as finan-cial assets at fair value through profit or loss, loans and receivables, held-to-maturity investments, available-for-sale investments, or as derivatives designated as hedging instruments in an effective hedge, as appropriate. The Group determines the classification of its financial assets at initial recognition.
All financial assets are recognized initially at fair value plus, in the case of investments not at fair value through profit or loss, directly attributable transaction costs.
The Group’s financial assets include cash and short-term deposits, trade and other receivables, quoted and unquoted financial instru-ments, and derivative financial instruments.
“Financial assets at fair value through profit or loss” is divided into two subcategories: held-for-trading assets and designated items. The latter includes any financial asset that is designated on initial recognition as one to be measured at fair value with fair value changes in profit or loss. Held-for-trading financial assets have primarily been acquired for the purpose of generating profits from changes in market prices over the short term. Derivatives that do not meet the criteria for hedge ac-counting have been classified as being held for trading. Held-for-trading financial assets and those maturing within 12 months are included in current assets. The items in this group are measured at fair value. The fair value of all the investments in this group has been determined on the basis of price quotations in well-functioning markets. Both real-ized and unrealized gains and losses due to changes in fair value are recorded in the income statement in the financial period in which they were incurred.
Loans and receivables are non-derivative financial assets with fixed or determinable payments, originated or acquired, that are not quoted in an active market, not held for trading, and not designated on initial recognition as assets at fair value through profit or loss or as held-for-sale. Loans and receivables are measured at amortized cost. They are included in the statement of financial position under trade receivables and other receivables as either current or non-current assets according
to their nature; they are considered non-current assets if they mature after more than 12 months. The losses arising from impairment are recognized in the income statement in finance costs.
“Held-to-maturity financial assets” include non-derivative financial assets with fixed or determinable payments and fixed maturities when the Group has the positive intention and ability to hold them to maturi-ty. After initial measurement held-to-maturity investments are measured at amortized cost using the effective interest method, less impairment. The Group did not have any held-to-maturity investments during the years ended 31 December 2015 and 2014.
“Available-for-sale investments” include equity and debt securities. Equity investments classified as available-for-sale are those, which are neither classified as held for trading nor designated at fair value through profit or loss. Debt securities in this category are those which are intended to be held for an indefinite period of time and which may be sold in response to needs for liquidity or in response to changes in the market conditions. After initial measurement, available-for-sale investments are subsequently measured at fair value with unrealized gains or losses recognized as other comprehensive income in the avail-able-for-sale reserve until the investment is derecognized, at which time the cumulative gain or loss is recognized in other operating income, or determined to be impaired, at which time the cumulative loss Is recog-nized in the income statement in finance costs and removed from the available-for-sale reserve.
A financial asset is derecognized when:
• The rights to receive cash flows from the asset have expired• The Group has transferred its rights to receive cash flows from the
asset or has assumed an obligation to pay received cash flows in full without material delay to a third party under a pass-through arrange-ment.
Cash and short-term depositsCash and short-term deposits in the statement of financial position comprise cash at banks and in hand and short-term deposits with an original maturity of three months and less. Credit accounts connected with Group accounts are included in current interest-bearing liabilities and are presented as net amounts, as the Group has a legal contractual right of set-off to make payment or otherwise eliminate the amount owed to creditors either in whole or in part.
Cash and cash equivalents are recorded at the original amount in the statement of financial position.
Financial liabilitiesFinancial liabilities within the scope of IAS 39 are classified as financial liabilities at fair value through profit or loss, loans and borrowings, or as derivatives designated as hedging instruments in an effective hedge, as appropriate. The Group determines the classification of its financial liabilities at initial recognition. All financial liabilities are initially recog-nized at fair value and in the case of loans and borrowings, plus directly attributable transaction costs. The Group’s financial liabilities include trade and other payables, bank overdrafts, loans and borrowings and derivative financial instruments.
Finance lease liabilities are initially recognized at fair value. All financial liabilities are later valued at amortized cost using the effective interest rate method. Financial liabilities are included in non-current and current liabilities, and they may be either interest-bearing or non-inter-est-bearing.
Derivative financial instruments and hedgingDerivative contracts are recorded initially as an acquisition cost equal to their fair value. Following their acquisition derivative contracts are valued according to their fair value.
Profits and losses that are generated from the valuation of fair value are recorded according to the intended use of the derivative contract. The Group does not apply hedge accounting as described by IAS 39. As a result, all value changes are recognized in profit or loss. The Group has entered into interest rate swap agreements to convert non-current floating rate financial liabilities to fixed interest rates and forward foreign
Exel Composites Annual Financial Report 2015 | Notes to the consolidated financial statementsPage 18
exchange contracts. Derivative financial instruments are presented in Section 31 of the Notes. Derivatives are recorded in the balance sheet as accrued expenses and deferred income.
Hedges for net investments in foreign units are recorded in the same way as cash-flow hedges. A hedge on a foreign subsidiary’s equity is recorded in shareholders’ equity in the same way as the exchange rate difference in shareholders’ equity. The Group did not hedge its net foreign investments exposure during 2015 or 2014.
Impairment of non-financial assetsAt each reporting date, the Group evaluates whether there are indica-tions of impairment in any asset item. If impairment is indicated, the recoverable amount of the asset is estimated. An asset’s recoverable amount is the higher of an asset’s or cash-generating unit’s (CGU) fair value less costs to sell and its value in use and is determined for an individual asset, unless asset does not generate cash inflows that are largely independent of those from other assets or group of assets. Where the carrying amount of an asset or CGU exceeds its recoverable amount, the asset is considered impaired and is written down to its recoverable amount.
In addition, the recoverable amount is assessed annually for the fol-lowing items regardless of whether there are indications of impairment: goodwill; intangible assets that have an unlimited economic lifespan; and assets under construction.
Impairment losses of continuing operations are recognized immedi-ately in the income statement in those expense categories consistent with the function of the impaired asset.
Impairment of financial assetsThe Group assesses on each reporting date whether there is any ob-jective evidence that a financial asset or group of financial assets is im-paired. A financial asset is deemed to be impaired if, and only if, there is objective evidence of impairment as a result of one or more events that has occurred after the initial recognition of the asset and that loss event has an impact on the estimated future cash flows of the financial asset that can be reliably estimated.
Lease agreementsLease agreements concerning tangible assets in which the Group holds a material share of the risks and benefits of ownership are classified as financial lease agreements. A financial lease agreement is entered in the balance sheet at either the fair value of the leased asset on the starting date of the lease agreement or the current value of the mini-mum rents, whichever is lower. Lease payments are divided into financ-ing costs and installment payment of the liability so that the interest rate of the remaining liability remains unchanged. The corresponding rental obligations, net of finance charges, are included in interest-bearing liabilities. The financing cost calculated with the effective interest rate is recorded in the income statement as a financial expense. Tangible fixed assets acquired under financial lease agreements are depreciated over their economic lifetime or the period of lease, whichever is shorter.
Lease agreements in which the risks and benefits of ownership are retained by the lessor are treated as other lease agreements (operation-al leasing). Rents paid on other lease agreements are expensed in even installments in the income statement over the duration of the rental period.
Assets leased by the Group in which the risks and benefits of owner-ship are transferred to the lessee are treated as financial leasing and re-corded in the balance sheet as a receivable according to present value. Financial income from financial lease agreements is determined so that the remaining net investment provides the same income percentage over the duration of the rental period.
Assets leased by the Group other than through financial leasing are included in the balance sheet as tangible fixed assets and are depreci-ated according to their estimated useful economic life in the same way as tangible fixed assets used by the Group. Leasing income is recorded in the income statement in even installments over the duration of the rental period.
InventoriesInventories are valued in the balance sheet either at the acquisition cost or at the net realizable value, whichever is lower. The acquisition cost is determined using the weighted average price method. The acquisition cost of finished and incomplete products comprises raw materials, direct costs of labor, other direct costs and the appropriate portion of the variable general costs of manufacture and fixed overhead at the ordinary rate of operations, but it does not include borrowing costs. The net realizable value is the estimated selling price in ordinary business operations less the estimated expenditure on product completion and sales.
Trade receivablesTrade receivables are recorded in the balance sheet at their original invoice amount.
An impairment of trade receivables is recognized when there is justified evidence that the Group will not receive all of benefits on the original terms. Indications of the impairment of trade receivables include the significant financial difficulties of the debtor, the likelihood of bankruptcy, failure to make payments, or a major delay in receiving the paying. The current cash flow of all trade receivables, which are more than 90 days overdue are considered as zero. The amount of the impairment recorded in the income statement is determined according to the difference between the carrying value of the receivable and the estimated current cash flow discounted by the effective interest rate. If the amount of the impairment loss decreases in any later financial pe-riod, and the decrease can be objectively seen to be related to events subsequent to the recognition of the impairment, the recognized loss is cancelled through profit or loss.
Share capitalOrdinary shares are included in shareholders’ equity. Expenses incurred directly from new share issues, but not including expenses incurred from company mergers, are recorded in shareholders’ equity as a reduction of received payments.
TaxesGroup taxes consist of taxes based on Group companies’ results for the financial year, adjustments to taxes related to previous years and the change in deferred income taxes.
The tax expenses on the income statement are formed from the tax based on the taxable income for the financial year and deferred taxes. The tax expenses are recorded in the income statement except for the items recorded directly into shareholders’ equity, when the tax impact is recorded also as an equivalent part of shareholders’ equity. The taxes for the financial year are calculated from the taxable income according to the valid tax rate in each country. Taxes are adjusted by the possible taxes related to previous financial years.
Deferred taxes are calculated for all temporary differences between accounting and taxation using the tax rates valid at the closing date. The largest temporary differences arise from the depreciation of tangible assets, valuations in the fair value in the balance sheets of acquired companies at the time of acquisition, revaluations of certain non-current reserves, reservations for pension schemes and post-retirement bene-fits, unused tax losses, and differences in net wealth between fair value and taxable value in connection with acquisitions.
Deferred tax assets have been recorded to the extent that it is prob-able that taxable profit will be available against which the temporary difference can be utilized will materialize in the future. Deferred income tax is determined using tax rates that have been enacted or substantial-ly enacted by the balance sheet date.
Revenues, expenses and assets are recognized net of the amount of sales tax except:
• Where the sales tax incurred on a purchase of assets or services is not recoverable from the taxation authority
• Receivables and payables that are stated with the amount of sales tax included.
Exel Composites Annual Financial Report 2015 | Notes to the consolidated financial statementsPage 19
Pensions and other post-employment benefitsThe Group’s pension schemes comply with each country’s local regula-tions and practices. Some of the pension schemes in the Group apply defined benefit pension schemes where the pension benefits, disability benefits and employment termination benefits are defined. Pension benefits are based generally on the period of employment and salary over a fixed period for each employee. Pension contributions are fund-ed through payments to insurance companies. In addition, the Group has defined-contribution plans.
In defined benefit pension plans, the present value of future pension payments on the closing date is presented less the fair value of the plan-related assets on the closing date. Pension liabilities are calculated by independent actuaries. The pension liability is determined according to the projected unit credit method: the pension liability is discounted to the present value of estimated future cash flows using the interest rate which is equal to the interest rate of government or corporate bonds with maturities corresponding to the maturity of the pension liability. Pension costs are recorded in the income statement as an ex-pense with costs periodised over the employees’ time of service based on actuarial calculations carried out annually. Actuarial gains and losses are recognized in full as a component of other comprehensive income.
In defined-contribution schemes, pension contributions are paid to insurance companies, after which the Group no longer has other payment obligations. The Group’s contributions to defined-contribution schemes are entered in the financial period to which the payments relate.
Long-term compensationThe Group has long-term incentive programs for the President and CEO and the Group Management Team and selected key employees of the Company. The aim of the programs is to combine the objectives of the shareholders and the executives in order to increase the value of the Company, to commit the executives to the Company and to offer the executives a competitive reward program based on holding the Company’s shares. The Board of Directors makes the decision on the program annually.
The earning period for the long-term incentive program of 2012 ended in 2014. Based on the program a gross amount of 20,048 matching shares were acquired for the participants in 2015. There is a retention period of two years before the title of the shares is transferred to the participants. No monetary performance reward was earned and therefore no monetary performance reward was paid.
On 31 December 2015 the Group had three long-term incentive programs:
The 2013 program is based on a long-term monetary incentive program and is targeted at 20 executives for the earning period 2013 – 2015. The President and CEO and the members of the Group Manage-ment Team are included in the target group of the 2013 program. The potential long-term monetary performance reward from the program is based on the Group’s cumulative Economic Profit and on the Group’s Total Shareholder Return (TSR). The potential reward will be paid in 2016. The maximum reward to be paid on the basis of the earning period 2013 – 2015 will be EUR 1 million.
The 2014 program is based on a long-term monetary incentive program and is targeted at 20 executives for the earning period 2014 – 2016. The President and CEO and the members of the Group Man-agement Team are included in the target group of the 2014 program. The potential long-term monetary performance reward is based on the Group’s cumulative Economic Profit and on the Group’s Total Share-holder Return (TSR). The potential reward will be paid in 2017. The maximum reward to be paid will be EUR 1 million.
The 2015 program is based on a long-term monetary incentive program and is targeted at 25 executives for the earning period 2015 – 2017. The President and CEO and the members of the Group Man-agement Team are included in the target group of the 2015 incentive program. The potential long-term monetary performance reward is
based on the Group’s cumulative Economic Profit and on the Group’s Total Shareholder Return (TSR). The potential reward will be paid in 2018. The maximum reward to be paid will be EUR 1.5 million.
No reward will be paid to an executive based on the 2013, 2014 and 2015 programs described above, if his or her employment or service with the Company ends before the reward payment unless the executive is leaving the Company due to retirement or unless the Board decides otherwise.
The cost of the programs will be accounted for as operating expens-es during the duration of the programs.
ProvisionsA provision is recognized in the balance sheet when the Group has a legal or actual obligation on the basis of a prior event, the materializa-tion of the payment obligation is probable and the size of the obligation can be reliably estimated and requires a financial payment or causes a financial loss. If compensation for a share of the obligation can be received from a third party, the compensation is recorded as a separate asset item, but only when it is practically certain that said compensation will be received.
The right of personnel to annual leave and leave based on a long period of service are recognized when the right is created. The recorded provision corresponds to the obligations regarding the annual leave and leave based on a long period of service based on work performed by the reporting date.
The Group recognizes a provision against loss-making agreements if the benefits of an agreement are expected to be smaller than the unavoidable costs required to fulfill the obligations of the agreement.
The Group recognizes a provision for significant projects covering the repair or replacement costs during the guarantee period.
A provision for restructuring is recognized when the Group has prepared a detailed and formal restructuring plan and restructuring has either commenced or the plan has been announced publicly. The provisions are valued at their present value of costs required to cover the obligation.
DividendsDividends paid by the Group are recognized for the financial year in which the shareholders have approved payment of the dividend.
Earnings per shareThe undiluted earnings per share is calculated by dividing the profit for the period belonging to the shareholders of the parent company by the weighted average of shares in issue, not including shares purchased by the Company itself and that are presented as own shares. The weighted average number of shares used to calculate the diluted earnings per share takes into account the diluting effect of outstanding stock options during the period. This effect is calculated by the number of shares that could have been acquired at market price with the value of the subscription rights to usable stock options, which defines the ”free ele-ment”; ”free shares” are added to the number of released shares, but the result for the financial year is not adjusted.
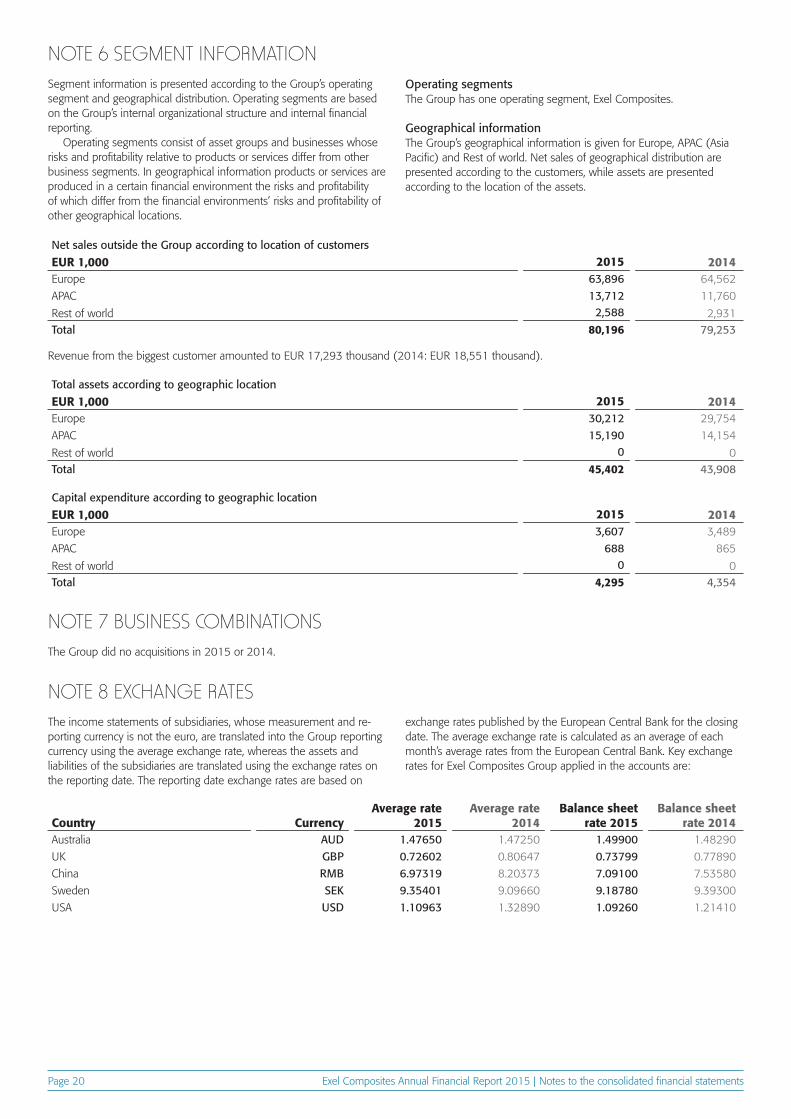
Exel Composites Annual Financial Report 2015 | Notes to the consolidated financial statementsPage 20
Segment information is presented according to the Group’s operating segment and geographical distribution. Operating segments are based on the Group’s internal organizational structure and internal financial reporting.
Operating segments consist of asset groups and businesses whose risks and profitability relative to products or services differ from other business segments. In geographical information products or services are produced in a certain financial environment the risks and profitability of which differ from the financial environments’ risks and profitability of other geographical locations.
Operating segmentsThe Group has one operating segment, Exel Composites.
Geographical informationThe Group’s geographical information is given for Europe, APAC (Asia Pacific) and Rest of world. Net sales of geographical distribution are presented according to the customers, while assets are presented according to the location of the assets.
The income statements of subsidiaries, whose measurement and re-porting currency is not the euro, are translated into the Group reporting currency using the average exchange rate, whereas the assets and liabilities of the subsidiaries are translated using the exchange rates on the reporting date. The reporting date exchange rates are based on
exchange rates published by the European Central Bank for the closing date. The average exchange rate is calculated as an average of each month’s average rates from the European Central Bank. Key exchange rates for Exel Composites Group applied in the accounts are:
The Group did no acquisitions in 2015 or 2014.
Revenue from the biggest customer amounted to EUR 17,293 thousand (2014: EUR 18,551 thousand).
NOTE 6 SEGMENT INFORMATION
NOTE 8 EXCHANGE RATES
NOTE 7 BUSINESS COMBINATIONS
Net sales outside the Group according to location of customers
EUR 1,000 2015 2014Europe 63,896 64,562
APAC 13,712 11,760
Rest of world 2,588 2,931Total 80,196 79,253
Total assets according to geographic location
EUR 1,000 2015 2014Europe 30,212 29,754
APAC 15,190 14,154
Rest of world 0 0Total 45,402 43,908
Capital expenditure according to geographic location
EUR 1,000 2015 2014Europe 3,607 3,489
APAC 688 865
Rest of world 0 0Total 4,295 4,354
Country CurrencyAverage rate
2015Average rate
2014Balance sheet
rate 2015Balance sheet
rate 2014Australia AUD 1.47650 1.47250 1.49900 1.48290
UK GBP 0.72602 0.80647 0.73799 0.77890
China RMB 6.97319 8.20373 7.09100 7.53580
Sweden SEK 9.35401 9.09660 9.18780 9.39300
USA USD 1.10963 1.32890 1.09260 1.21410
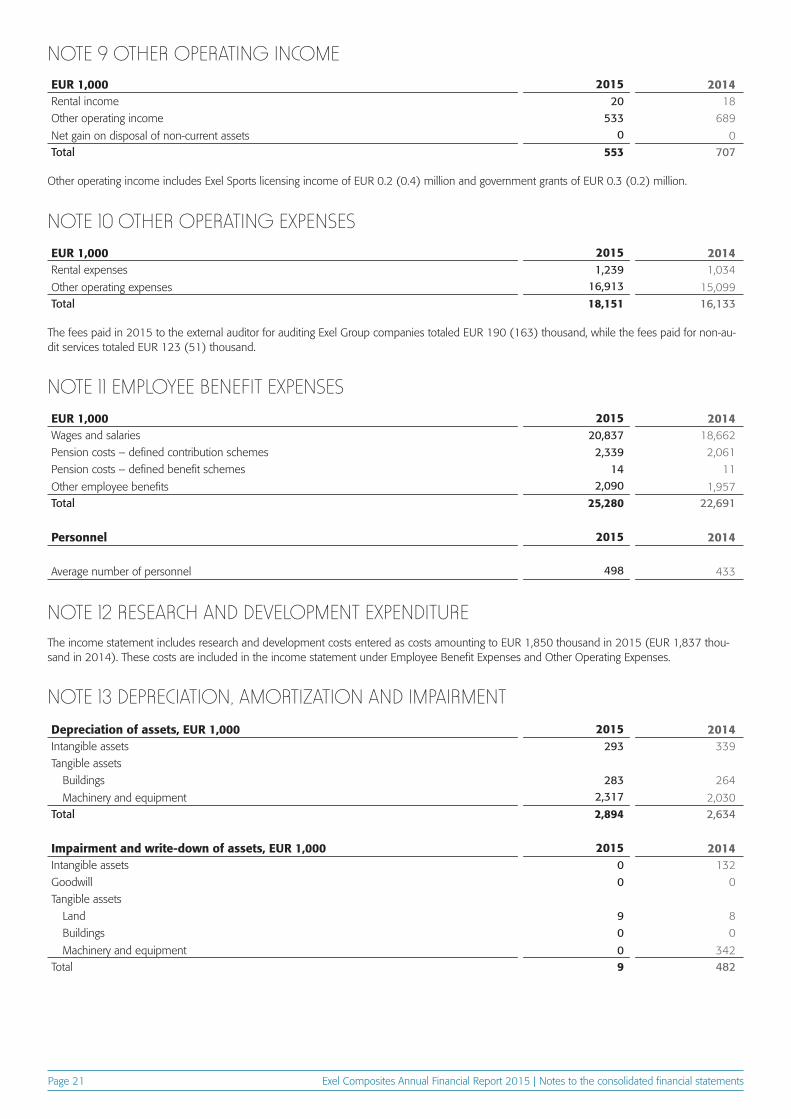
Exel Composites Annual Financial Report 2015 | Notes to the consolidated financial statementsPage 21
NOTE 9 OTHER OPERATING INCOME
NOTE 10 OTHER OPERATING EXPENSES
NOTE 11 EMPLOYEE BENEFIT EXPENSES
NOTE 12 RESEARCH AND DEVELOPMENT EXPENDITURE
NOTE 13 DEPRECIATION, AMORTIZATION AND IMPAIRMENT
EUR 1,000 2015 2014Rental income 20 18
Other operating income 533 689
Net gain on disposal of non-current assets 0 0Total 553 707
EUR 1,000 2015 2014Rental expenses 1,239 1,034
Other operating expenses 16,913 15,099Total 18,151 16,133
EUR 1,000 2015 2014Wages and salaries 20,837 18,662
Pension costs – defined contribution schemes 2,339 2,061
Pension costs – defined benefit schemes 14 11
Other employee benefits 2,090 1,957Total 25,280 22,691
Personnel 2015 2014
Average number of personnel 498 433
Depreciation of assets, EUR 1,000 2015 2014Intangible assets 293 339
Tangible assets
Buildings 283 264
Machinery and equipment 2,317 2,030Total 2,894 2,634
Impairment and write-down of assets, EUR 1,000 2015 2014Intangible assets 0 132
Goodwill 0 0
Tangible assets
Land 9 8
Buildings 0 0
Machinery and equipment 0 342Total 9 482
Other operating income includes Exel Sports licensing income of EUR 0.2 (0.4) million and government grants of EUR 0.3 (0.2) million.
The fees paid in 2015 to the external auditor for auditing Exel Group companies totaled EUR 190 (163) thousand, while the fees paid for non-au-dit services totaled EUR 123 (51) thousand.
The income statement includes research and development costs entered as costs amounting to EUR 1,850 thousand in 2015 (EUR 1,837 thou-sand in 2014). These costs are included in the income statement under Employee Benefit Expenses and Other Operating Expenses.
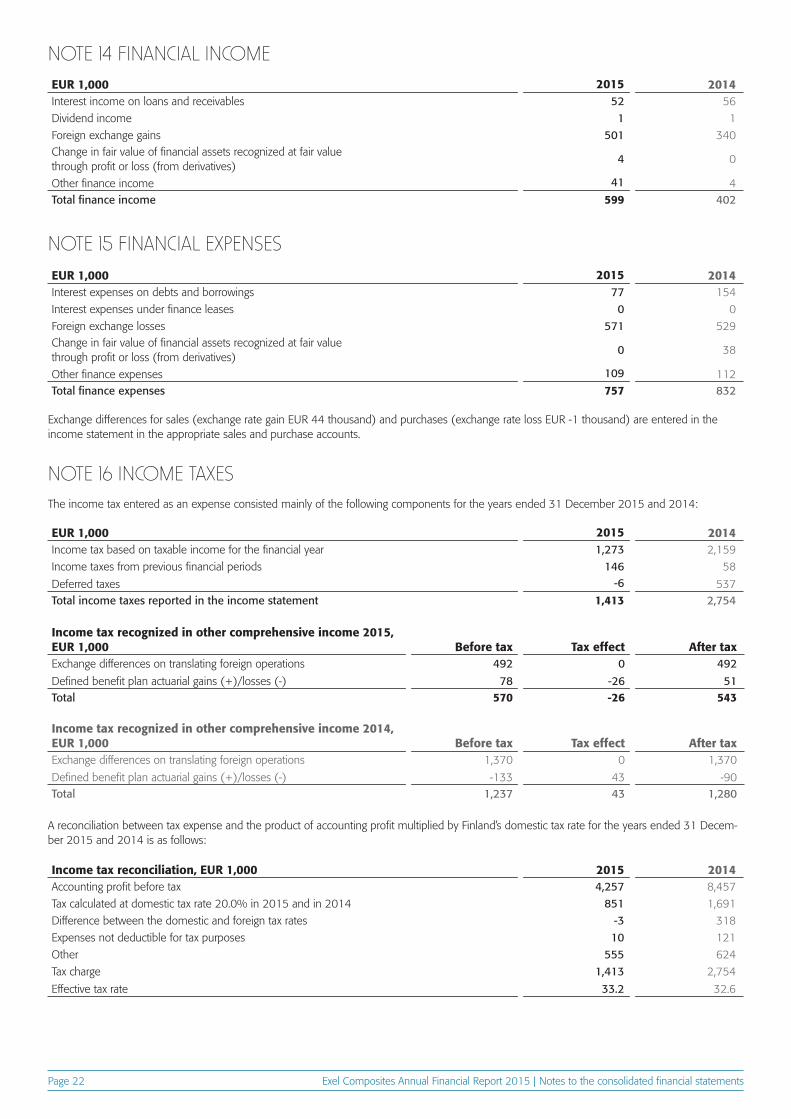
Exel Composites Annual Financial Report 2015 | Notes to the consolidated financial statementsPage 22
NOTE 14 FINANCIAL INCOME
NOTE 15 FINANCIAL EXPENSES
NOTE 16 INCOME TAXES
EUR 1,000 2015 2014Interest income on loans and receivables 52 56
Dividend income 1 1
Foreign exchange gains 501 340Change in fair value of financial assets recognized at fair value through profit or loss (from derivatives)
4 0
Other finance income 41 4Total finance income 599 402
EUR 1,000 2015 2014Interest expenses on debts and borrowings 77 154
Interest expenses under finance leases 0 0
Foreign exchange losses 571 529Change in fair value of financial assets recognized at fair value through profit or loss (from derivatives)
0 38
Other finance expenses 109 112Total finance expenses 757 832
EUR 1,000 2015 2014Income tax based on taxable income for the financial year 1,273 2,159
Income taxes from previous financial periods 146 58
Deferred taxes -6 537Total income taxes reported in the income statement 1,413 2,754
Exchange differences for sales (exchange rate gain EUR 44 thousand) and purchases (exchange rate loss EUR -1 thousand) are entered in the income statement in the appropriate sales and purchase accounts.
A reconciliation between tax expense and the product of accounting profit multiplied by Finland’s domestic tax rate for the years ended 31 Decem-ber 2015 and 2014 is as follows:
The income tax entered as an expense consisted mainly of the following components for the years ended 31 December 2015 and 2014:
Income tax recognized in other comprehensive income 2015, EUR 1,000 Before tax Tax effect After taxExchange differences on translating foreign operations 492 0 492
Defined benefit plan actuarial gains (+)/losses (-) 78 -26 51Total 570 -26 543
Income tax reconciliation, EUR 1,000 2015 2014Accounting profit before tax 4,257 8,457
Tax calculated at domestic tax rate 20.0% in 2015 and in 2014 851 1,691
Difference between the domestic and foreign tax rates -3 318
Expenses not deductible for tax purposes 10 121
Other 555 624
Tax charge 1,413 2,754
Effective tax rate 33.2 32.6
Income tax recognized in other comprehensive income 2014, EUR 1,000 Before tax Tax effect After taxExchange differences on translating foreign operations 1,370 0 1,370
Defined benefit plan actuarial gains (+)/losses (-) -133 43 -90Total 1,237 43 1,280
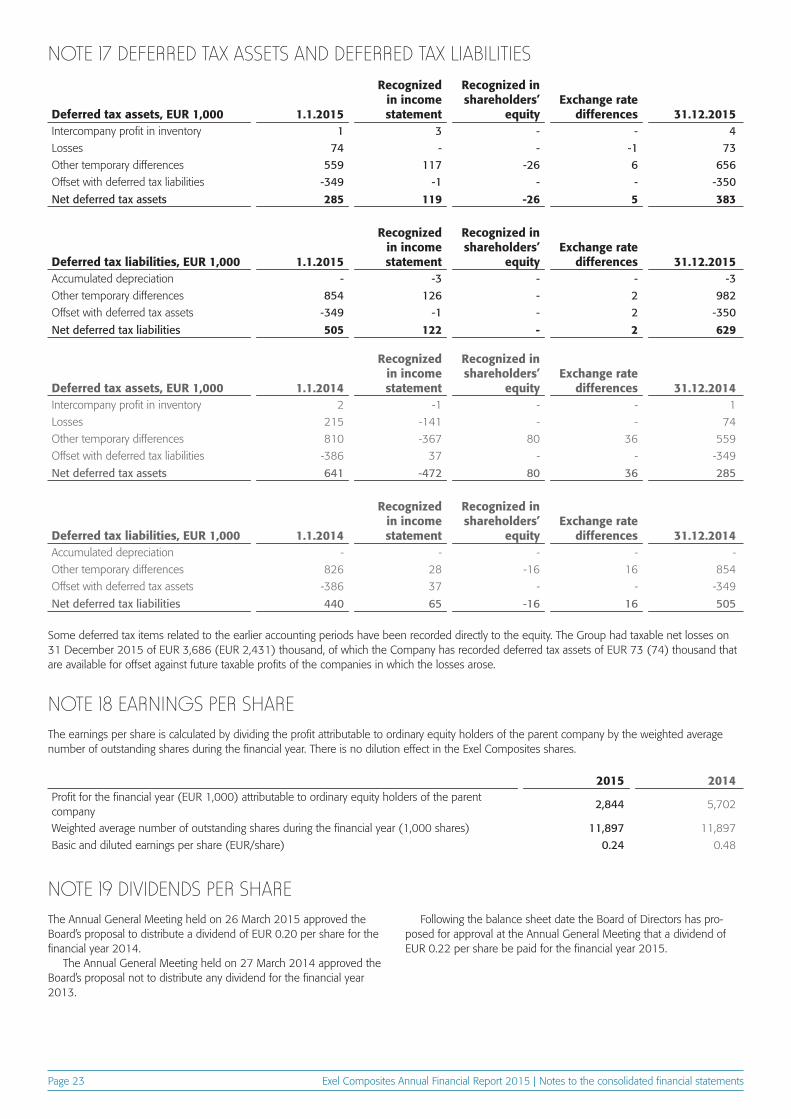
Exel Composites Annual Financial Report 2015 | Notes to the consolidated financial statementsPage 23
Deferred tax assets, EUR 1,000 1.1.2015
Recognized in income statement
Recognized in shareholders’
equityExchange rate
differences 31.12.2015Intercompany profit in inventory 1 3 - - 4Losses 74 - - -1 73Other temporary differences 559 117 -26 6 656Offset with deferred tax liabilities -349 -1 - - -350
Net deferred tax assets 285 119 -26 5 383
Deferred tax liabilities, EUR 1,000 1.1.2015
Recognized in income statement
Recognized in shareholders’
equityExchange rate
differences 31.12.2015Accumulated depreciation - -3 - - -3Other temporary differences 854 126 - 2 982Offset with deferred tax assets -349 -1 - 2 -350
Net deferred tax liabilities 505 122 - 2 629
Deferred tax assets, EUR 1,000 1.1.2014
Recognized in income statement
Recognized in shareholders’
equityExchange rate
differences 31.12.2014Intercompany profit in inventory 2 -1 - - 1
Losses 215 -141 - - 74
Other temporary differences 810 -367 80 36 559
Offset with deferred tax liabilities -386 37 - - -349
Net deferred tax assets 641 -472 80 36 285
Deferred tax liabilities, EUR 1,000 1.1.2014
Recognized in income statement
Recognized in shareholders’
equityExchange rate
differences 31.12.2014Accumulated depreciation - - - - -
Other temporary differences 826 28 -16 16 854
Offset with deferred tax assets -386 37 - - -349
Net deferred tax liabilities 440 65 -16 16 505
NOTE 17 DEFERRED TAX ASSETS AND DEFERRED TAX LIABILITIES
Some deferred tax items related to the earlier accounting periods have been recorded directly to the equity. The Group had taxable net losses on 31 December 2015 of EUR 3,686 (EUR 2,431) thousand, of which the Company has recorded deferred tax assets of EUR 73 (74) thousand that are available for offset against future taxable profits of the companies in which the losses arose.
NOTE 18 EARNINGS PER SHARE
NOTE 19 DIVIDENDS PER SHARE
The earnings per share is calculated by dividing the profit attributable to ordinary equity holders of the parent company by the weighted average number of outstanding shares during the financial year. There is no dilution effect in the Exel Composites shares.
The Annual General Meeting held on 26 March 2015 approved the Board’s proposal to distribute a dividend of EUR 0.20 per share for the financial year 2014.
The Annual General Meeting held on 27 March 2014 approved the Board’s proposal not to distribute any dividend for the financial year 2013.
Following the balance sheet date the Board of Directors has pro-posed for approval at the Annual General Meeting that a dividend of EUR 0.22 per share be paid for the financial year 2015.
2015 2014Profit for the financial year (EUR 1,000) attributable to ordinary equity holders of the parent company
2,844 5,702
Weighted average number of outstanding shares during the financial year (1,000 shares) 11,897 11,897
Basic and diluted earnings per share (EUR/share) 0.24 0.48
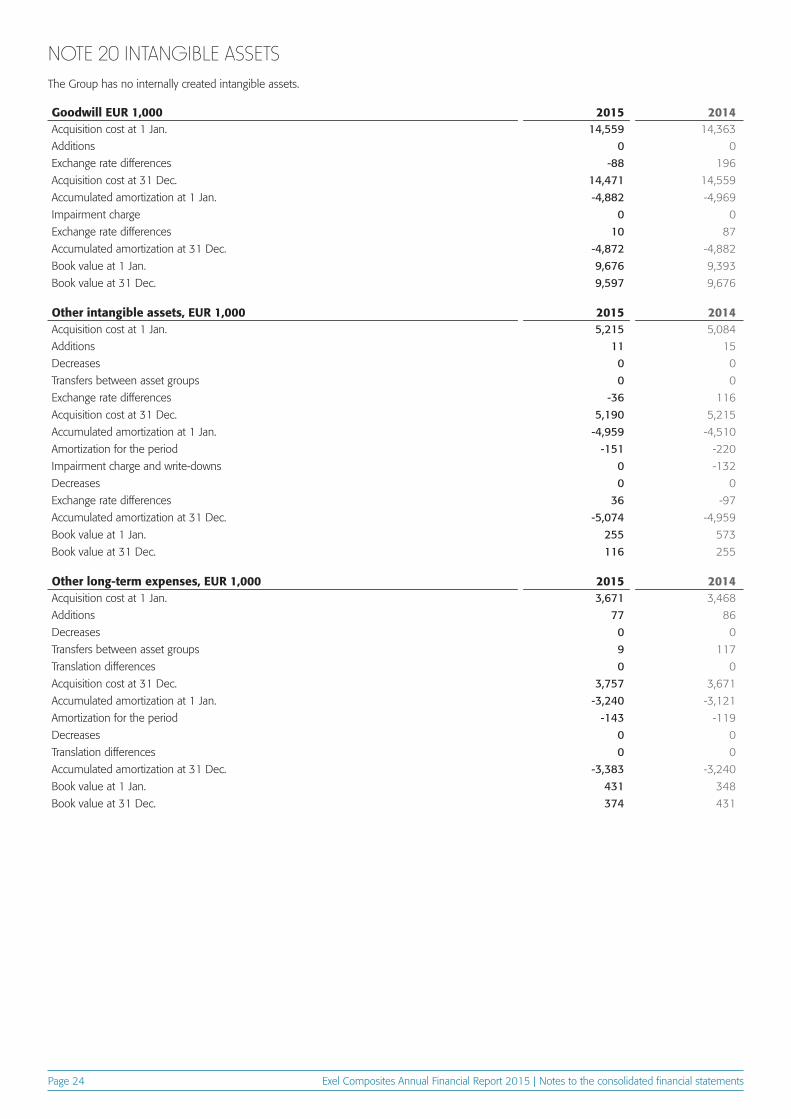
Exel Composites Annual Financial Report 2015 | Notes to the consolidated financial statementsPage 24
NOTE 20 INTANGIBLE ASSETSThe Group has no internally created intangible assets.
Goodwill EUR 1,000 2015 2014Acquisition cost at 1 Jan. 14,559 14,363
Additions 0 0
Exchange rate differences -88 196
Acquisition cost at 31 Dec. 14,471 14,559
Accumulated amortization at 1 Jan. -4,882 -4,969
Impairment charge 0 0
Exchange rate differences 10 87
Accumulated amortization at 31 Dec. -4,872 -4,882
Book value at 1 Jan. 9,676 9,393
Book value at 31 Dec. 9,597 9,676
Other intangible assets, EUR 1,000 2015 2014Acquisition cost at 1 Jan. 5,215 5,084
Additions 11 15
Decreases 0 0
Transfers between asset groups 0 0
Exchange rate differences -36 116
Acquisition cost at 31 Dec. 5,190 5,215
Accumulated amortization at 1 Jan. -4,959 -4,510
Amortization for the period -151 -220
Impairment charge and write-downs 0 -132
Decreases 0 0
Exchange rate differences 36 -97
Accumulated amortization at 31 Dec. -5,074 -4,959
Book value at 1 Jan. 255 573
Book value at 31 Dec. 116 255
Other long-term expenses, EUR 1,000 2015 2014Acquisition cost at 1 Jan. 3,671 3,468
Additions 77 86
Decreases 0 0
Transfers between asset groups 9 117
Translation differences 0 0
Acquisition cost at 31 Dec. 3,757 3,671
Accumulated amortization at 1 Jan. -3,240 -3,121
Amortization for the period -143 -119
Decreases 0 0
Translation differences 0 0
Accumulated amortization at 31 Dec. -3,383 -3,240
Book value at 1 Jan. 431 348
Book value at 31 Dec. 374 431
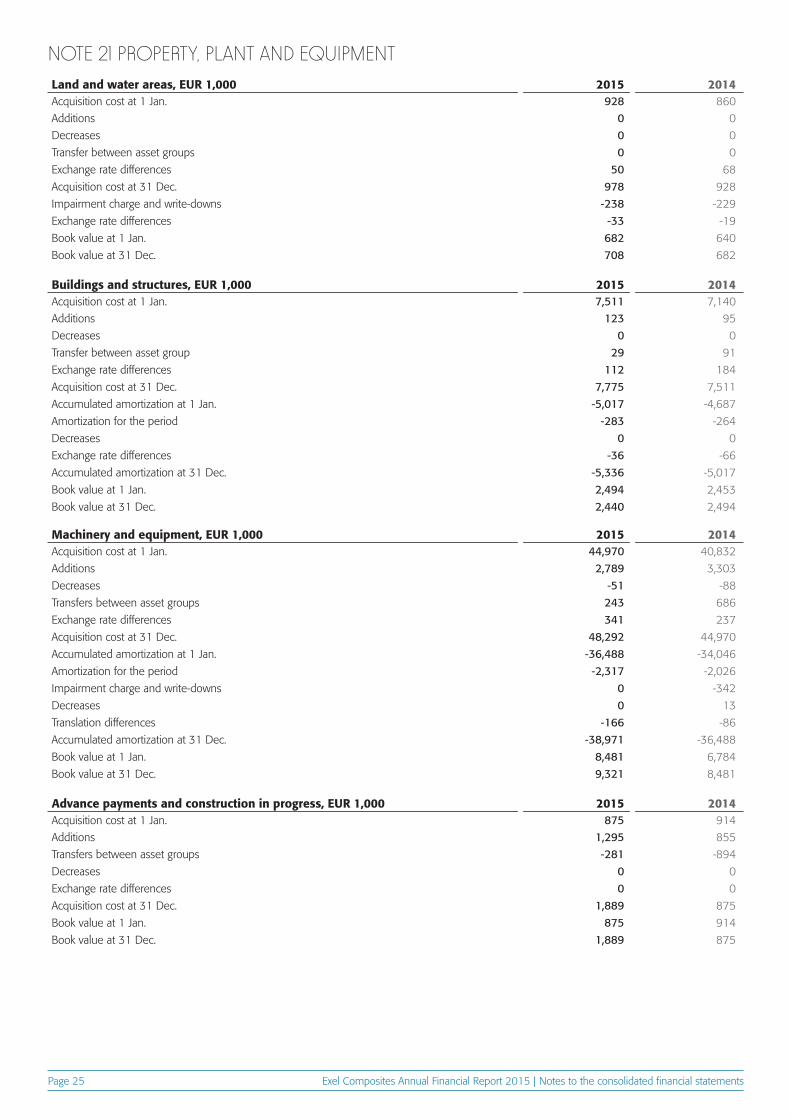
Exel Composites Annual Financial Report 2015 | Notes to the consolidated financial statementsPage 25
NOTE 21 PROPERTY, PLANT AND EQUIPMENTLand and water areas, EUR 1,000 2015 2014Acquisition cost at 1 Jan. 928 860
Additions 0 0
Decreases 0 0
Transfer between asset groups 0 0
Exchange rate differences 50 68
Acquisition cost at 31 Dec. 978 928
Impairment charge and write-downs -238 -229
Exchange rate differences -33 -19
Book value at 1 Jan. 682 640
Book value at 31 Dec. 708 682
Buildings and structures, EUR 1,000 2015 2014Acquisition cost at 1 Jan. 7,511 7,140
Additions 123 95
Decreases 0 0
Transfer between asset group 29 91
Exchange rate differences 112 184
Acquisition cost at 31 Dec. 7,775 7,511
Accumulated amortization at 1 Jan. -5,017 -4,687
Amortization for the period -283 -264
Decreases 0 0
Exchange rate differences -36 -66
Accumulated amortization at 31 Dec. -5,336 -5,017
Book value at 1 Jan. 2,494 2,453
Book value at 31 Dec. 2,440 2,494
Machinery and equipment, EUR 1,000 2015 2014Acquisition cost at 1 Jan. 44,970 40,832
Additions 2,789 3,303
Decreases -51 -88
Transfers between asset groups 243 686
Exchange rate differences 341 237
Acquisition cost at 31 Dec. 48,292 44,970
Accumulated amortization at 1 Jan. -36,488 -34,046
Amortization for the period -2,317 -2,026
Impairment charge and write-downs 0 -342
Decreases 0 13
Translation differences -166 -86
Accumulated amortization at 31 Dec. -38,971 -36,488
Book value at 1 Jan. 8,481 6,784
Book value at 31 Dec. 9,321 8,481
Advance payments and construction in progress, EUR 1,000 2015 2014Acquisition cost at 1 Jan. 875 914
Additions 1,295 855
Transfers between asset groups -281 -894
Decreases 0 0
Exchange rate differences 0 0
Acquisition cost at 31 Dec. 1,889 875
Book value at 1 Jan. 875 914
Book value at 31 Dec. 1,889 875
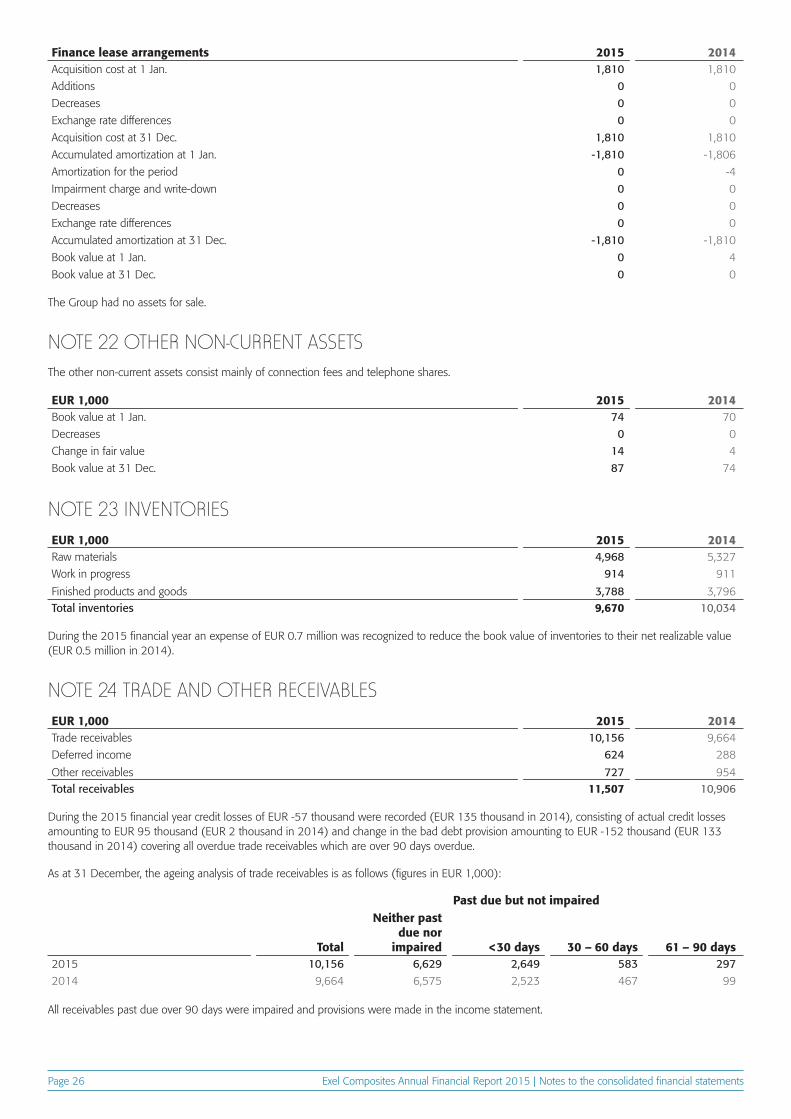
Exel Composites Annual Financial Report 2015 | Notes to the consolidated financial statementsPage 26
Finance lease arrangements 2015 2014Acquisition cost at 1 Jan. 1,810 1,810
Additions 0 0
Decreases 0 0
Exchange rate differences 0 0
Acquisition cost at 31 Dec. 1,810 1,810
Accumulated amortization at 1 Jan. -1,810 -1,806
Amortization for the period 0 -4
Impairment charge and write-down 0 0
Decreases 0 0
Exchange rate differences 0 0
Accumulated amortization at 31 Dec. -1,810 -1,810
Book value at 1 Jan. 0 4
Book value at 31 Dec. 0 0
EUR 1,000 2015 2014Book value at 1 Jan. 74 70
Decreases 0 0
Change in fair value 14 4
Book value at 31 Dec. 87 74
EUR 1,000 2015 2014Raw materials 4,968 5,327
Work in progress 914 911
Finished products and goods 3,788 3,796Total inventories 9,670 10,034
EUR 1,000 2015 2014Trade receivables 10,156 9,664
Deferred income 624 288
Other receivables 727 954Total receivables 11,507 10,906
The Group had no assets for sale.
NOTE 22 OTHER NON-CURRENT ASSETS
NOTE 23 INVENTORIES
NOTE 24 TRADE AND OTHER RECEIVABLES
The other non-current assets consist mainly of connection fees and telephone shares.
During the 2015 financial year an expense of EUR 0.7 million was recognized to reduce the book value of inventories to their net realizable value (EUR 0.5 million in 2014).
During the 2015 financial year credit losses of EUR -57 thousand were recorded (EUR 135 thousand in 2014), consisting of actual credit losses amounting to EUR 95 thousand (EUR 2 thousand in 2014) and change in the bad debt provision amounting to EUR -152 thousand (EUR 133 thousand in 2014) covering all overdue trade receivables which are over 90 days overdue.
As at 31 December, the ageing analysis of trade receivables is as follows (figures in EUR 1,000):
All receivables past due over 90 days were impaired and provisions were made in the income statement.
Total
Neither past due nor
impaired <30 days 30 – 60 days 61 – 90 days2015 10,156 6,629 2,649 583 2972014 9,664 6,575 2,523 467 99
Past due but not impaired
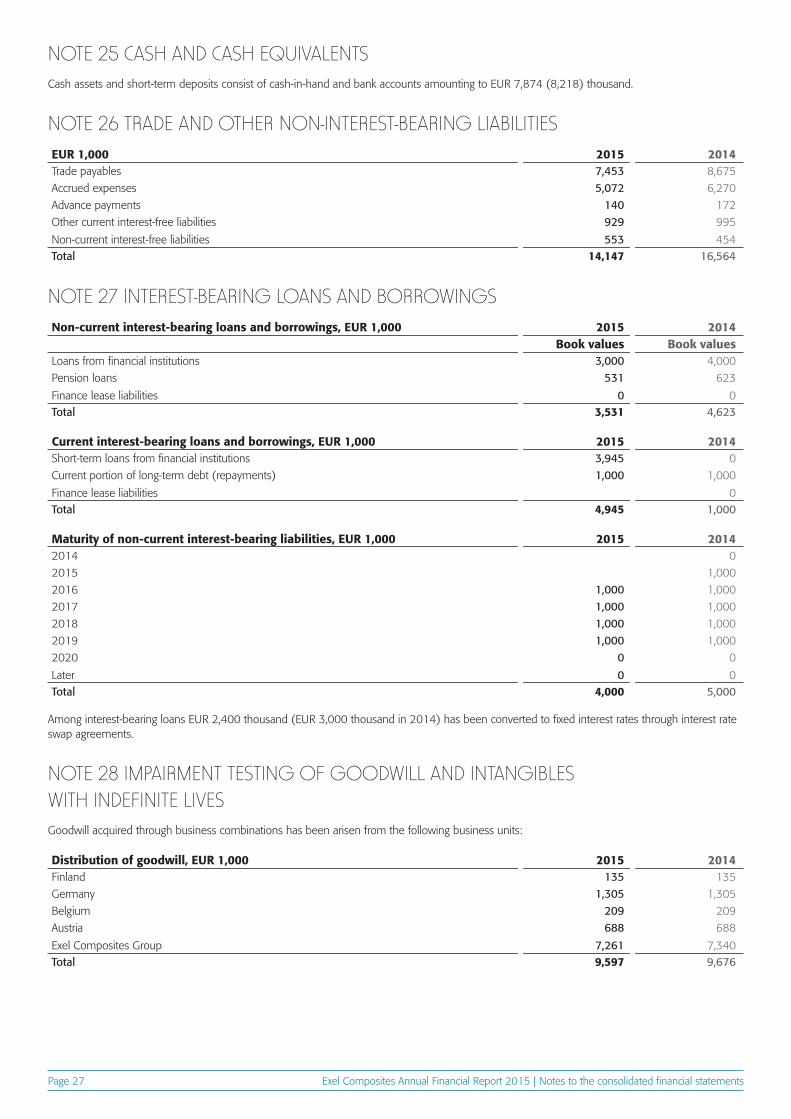
Exel Composites Annual Financial Report 2015 | Notes to the consolidated financial statementsPage 27
NOTE 25 CASH AND CASH EQUIVALENTS Cash assets and short-term deposits consist of cash-in-hand and bank accounts amounting to EUR 7,874 (8,218) thousand.
Among interest-bearing loans EUR 2,400 thousand (EUR 3,000 thousand in 2014) has been converted to fixed interest rates through interest rate swap agreements.
Goodwill acquired through business combinations has been arisen from the following business units:
EUR 1,000 2015 2014Trade payables 7,453 8,675
Accrued expenses 5,072 6,270
Advance payments 140 172
Other current interest-free liabilities 929 995
Non-current interest-free liabilities 553 454Total 14,147 16,564
Non-current interest-bearing loans and borrowings, EUR 1,000 2015 2014Book values Book values
Loans from financial institutions 3,000 4,000
Pension loans 531 623
Finance lease liabilities 0 0Total 3,531 4,623
Distribution of goodwill, EUR 1,000 2015 2014Finland 135 135
Germany 1,305 1,305
Belgium 209 209
Austria 688 688
Exel Composites Group 7,261 7,340Total 9,597 9,676
Current interest-bearing loans and borrowings, EUR 1,000 2015 2014Short-term loans from financial institutions 3,945 0
Current portion of long-term debt (repayments) 1,000 1,000
Finance lease liabilities 0Total 4,945 1,000
Maturity of non-current interest-bearing liabilities, EUR 1,000 2015 20142014 0
2015 1,000
2016 1,000 1,000
2017 1,000 1,000
2018 1,000 1,000
2019 1,000 1,000
2020 0 0
Later 0 0Total 4,000 5,000
NOTE 26 TRADE AND OTHER NON-INTEREST-BEARING LIABILITIES
NOTE 27 INTEREST-BEARING LOANS AND BORROWINGS
NOTE 28 IMPAIRMENT TESTING OF GOODWILL AND INTANGIBLES WITH INDEFINITE LIVES
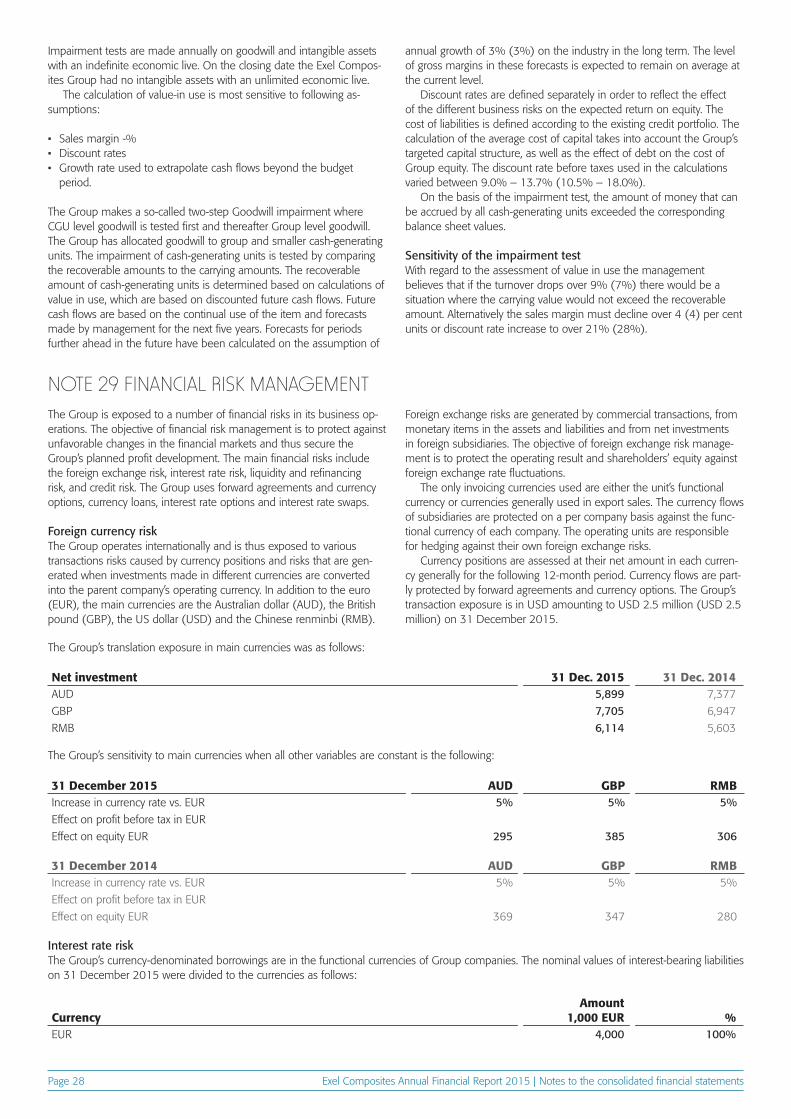
Exel Composites Annual Financial Report 2015 | Notes to the consolidated financial statementsPage 28
Impairment tests are made annually on goodwill and intangible assets with an indefinite economic live. On the closing date the Exel Compos-ites Group had no intangible assets with an unlimited economic live.
The calculation of value-in use is most sensitive to following as-sumptions:
• Sales margin -%• Discount rates• Growth rate used to extrapolate cash flows beyond the budget
period.
The Group makes a so-called two-step Goodwill impairment where CGU level goodwill is tested first and thereafter Group level goodwill. The Group has allocated goodwill to group and smaller cash-generating units. The impairment of cash-generating units is tested by comparing the recoverable amounts to the carrying amounts. The recoverable amount of cash-generating units is determined based on calculations of value in use, which are based on discounted future cash flows. Future cash flows are based on the continual use of the item and forecasts made by management for the next five years. Forecasts for periods further ahead in the future have been calculated on the assumption of
annual growth of 3% (3%) on the industry in the long term. The level of gross margins in these forecasts is expected to remain on average at the current level.
Discount rates are defined separately in order to reflect the effect of the different business risks on the expected return on equity. The cost of liabilities is defined according to the existing credit portfolio. The calculation of the average cost of capital takes into account the Group’s targeted capital structure, as well as the effect of debt on the cost of Group equity. The discount rate before taxes used in the calculations varied between 9.0% – 13.7% (10.5% – 18.0%).
On the basis of the impairment test, the amount of money that can be accrued by all cash-generating units exceeded the corresponding balance sheet values.
Sensitivity of the impairment testWith regard to the assessment of value in use the management believes that if the turnover drops over 9% (7%) there would be a situation where the carrying value would not exceed the recoverable amount. Alternatively the sales margin must decline over 4 (4) per cent units or discount rate increase to over 21% (28%).
The Group is exposed to a number of financial risks in its business op-erations. The objective of financial risk management is to protect against unfavorable changes in the financial markets and thus secure the Group’s planned profit development. The main financial risks include the foreign exchange risk, interest rate risk, liquidity and refinancing risk, and credit risk. The Group uses forward agreements and currency options, currency loans, interest rate options and interest rate swaps.
Foreign currency riskThe Group operates internationally and is thus exposed to various transactions risks caused by currency positions and risks that are gen-erated when investments made in different currencies are converted into the parent company’s operating currency. In addition to the euro (EUR), the main currencies are the Australian dollar (AUD), the British pound (GBP), the US dollar (USD) and the Chinese renminbi (RMB).
Foreign exchange risks are generated by commercial transactions, from monetary items in the assets and liabilities and from net investments in foreign subsidiaries. The objective of foreign exchange risk manage-ment is to protect the operating result and shareholders’ equity against foreign exchange rate fluctuations.
The only invoicing currencies used are either the unit’s functional currency or currencies generally used in export sales. The currency flows of subsidiaries are protected on a per company basis against the func-tional currency of each company. The operating units are responsible for hedging against their own foreign exchange risks.
Currency positions are assessed at their net amount in each curren-cy generally for the following 12-month period. Currency flows are part-ly protected by forward agreements and currency options. The Group’s transaction exposure is in USD amounting to USD 2.5 million (USD 2.5 million) on 31 December 2015.
Interest rate riskThe Group’s currency-denominated borrowings are in the functional currencies of Group companies. The nominal values of interest-bearing liabilities on 31 December 2015 were divided to the currencies as follows:
NOTE 29 FINANCIAL RISK MANAGEMENT
The Group’s translation exposure in main currencies was as follows:
The Group’s sensitivity to main currencies when all other variables are constant is the following:
Net investment 31 Dec. 2015 31 Dec. 2014AUD 5,899 7,377
GBP 7,705 6,947
RMB 6,114 5,603
CurrencyAmount
1,000 EUR %EUR 4,000 100%
31 December 2015 AUD GBP RMBIncrease in currency rate vs. EUR 5% 5% 5%Effect on profit before tax in EUR
Effect on equity EUR 295 385 306
31 December 2014 AUD GBP RMBIncrease in currency rate vs. EUR 5% 5% 5%
Effect on profit before tax in EUR
Effect on equity EUR 369 347 280
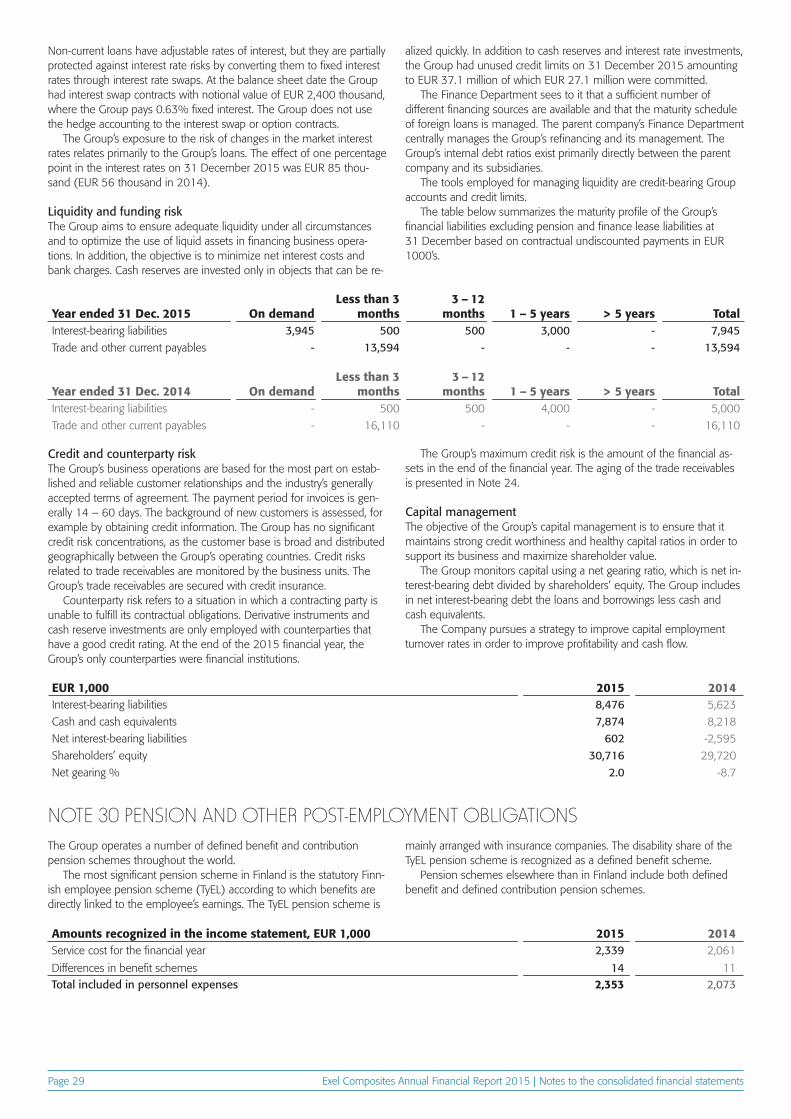
Exel Composites Annual Financial Report 2015 | Notes to the consolidated financial statementsPage 29
Non-current loans have adjustable rates of interest, but they are partially protected against interest rate risks by converting them to fixed interest rates through interest rate swaps. At the balance sheet date the Group had interest swap contracts with notional value of EUR 2,400 thousand, where the Group pays 0.63% fixed interest. The Group does not use the hedge accounting to the interest swap or option contracts.
The Group’s exposure to the risk of changes in the market interest rates relates primarily to the Group’s loans. The effect of one percentage point in the interest rates on 31 December 2015 was EUR 85 thou-sand (EUR 56 thousand in 2014).
Liquidity and funding riskThe Group aims to ensure adequate liquidity under all circumstances and to optimize the use of liquid assets in financing business opera-tions. In addition, the objective is to minimize net interest costs and bank charges. Cash reserves are invested only in objects that can be re-
alized quickly. In addition to cash reserves and interest rate investments, the Group had unused credit limits on 31 December 2015 amounting to EUR 37.1 million of which EUR 27.1 million were committed.
The Finance Department sees to it that a sufficient number of different financing sources are available and that the maturity schedule of foreign loans is managed. The parent company’s Finance Department centrally manages the Group’s refinancing and its management. The Group’s internal debt ratios exist primarily directly between the parent company and its subsidiaries.
The tools employed for managing liquidity are credit-bearing Group accounts and credit limits.
The table below summarizes the maturity profile of the Group’s financial liabilities excluding pension and finance lease liabilities at 31 December based on contractual undiscounted payments in EUR 1000’s.
Credit and counterparty riskThe Group’s business operations are based for the most part on estab-lished and reliable customer relationships and the industry’s generally accepted terms of agreement. The payment period for invoices is gen-erally 14 – 60 days. The background of new customers is assessed, for example by obtaining credit information. The Group has no significant credit risk concentrations, as the customer base is broad and distributed geographically between the Group’s operating countries. Credit risks related to trade receivables are monitored by the business units. The Group’s trade receivables are secured with credit insurance.
Counterparty risk refers to a situation in which a contracting party is unable to fulfill its contractual obligations. Derivative instruments and cash reserve investments are only employed with counterparties that have a good credit rating. At the end of the 2015 financial year, the Group’s only counterparties were financial institutions.
The Group’s maximum credit risk is the amount of the financial as-sets in the end of the financial year. The aging of the trade receivables is presented in Note 24.
Capital managementThe objective of the Group’s capital management is to ensure that it maintains strong credit worthiness and healthy capital ratios in order to support its business and maximize shareholder value.
The Group monitors capital using a net gearing ratio, which is net in-terest-bearing debt divided by shareholders’ equity. The Group includes in net interest-bearing debt the loans and borrowings less cash and cash equivalents.
The Company pursues a strategy to improve capital employment turnover rates in order to improve profitability and cash flow.
Year ended 31 Dec. 2015 On demandLess than 3
months3 – 12
months 1 – 5 years > 5 years TotalInterest-bearing liabilities 3,945 500 500 3,000 - 7,945Trade and other current payables - 13,594 - - - 13,594
Year ended 31 Dec. 2014 On demandLess than 3
months3 – 12
months 1 – 5 years > 5 years TotalInterest-bearing liabilities - 500 500 4,000 - 5,000
Trade and other current payables - 16,110 - - - 16,110
EUR 1,000 2015 2014Interest-bearing liabilities 8,476 5,623
Cash and cash equivalents 7,874 8,218
Net interest-bearing liabilities 602 -2,595
Shareholders’ equity 30,716 29,720
Net gearing % 2.0 -8.7
The Group operates a number of defined benefit and contribution pension schemes throughout the world.
The most significant pension scheme in Finland is the statutory Finn-ish employee pension scheme (TyEL) according to which benefits are directly linked to the employee’s earnings. The TyEL pension scheme is
mainly arranged with insurance companies. The disability share of the TyEL pension scheme is recognized as a defined benefit scheme.
Pension schemes elsewhere than in Finland include both defined benefit and defined contribution pension schemes.
NOTE 30 PENSION AND OTHER POST-EMPLOYMENT OBLIGATIONS
Amounts recognized in the income statement, EUR 1,000 2015 2014Service cost for the financial year 2,339 2,061
Differences in benefit schemes 14 11Total included in personnel expenses 2,353 2,073
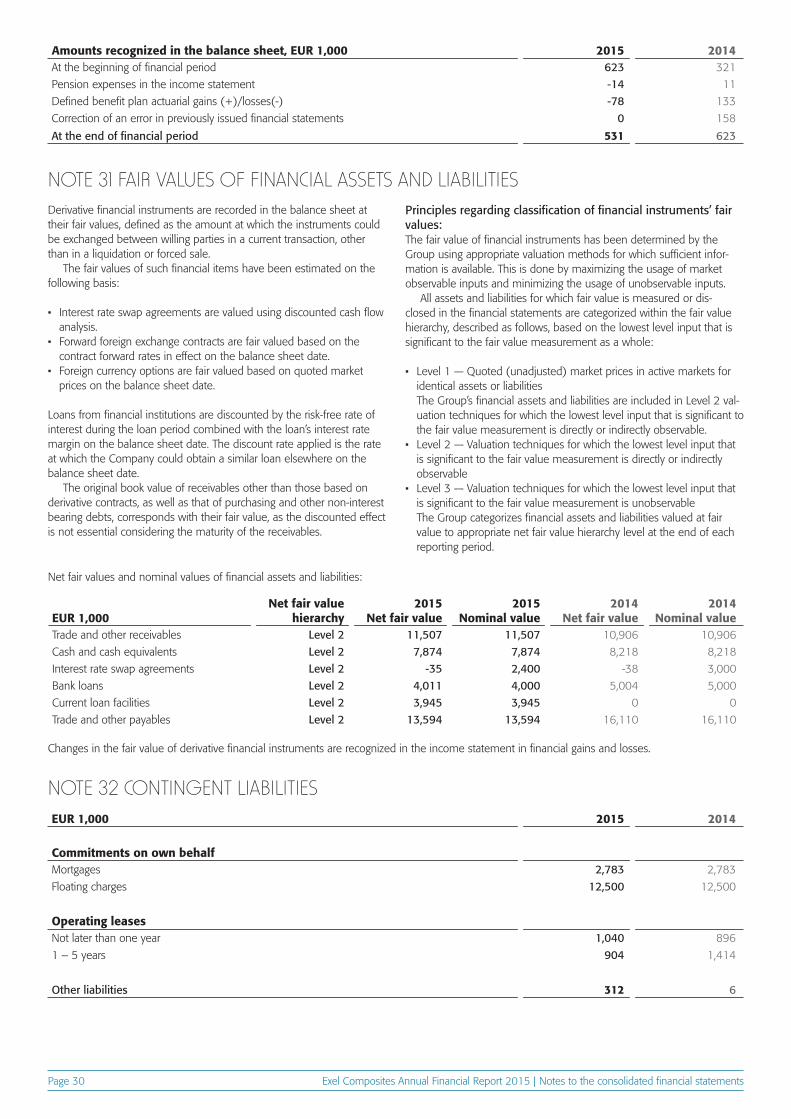
Exel Composites Annual Financial Report 2015 | Notes to the consolidated financial statementsPage 30
Amounts recognized in the balance sheet, EUR 1,000 2015 2014At the beginning of financial period 623 321
Pension expenses in the income statement -14 11
Defined benefit plan actuarial gains (+)/losses(-) -78 133
Correction of an error in previously issued financial statements 0 158
At the end of financial period 531 623
Derivative financial instruments are recorded in the balance sheet at their fair values, defined as the amount at which the instruments could be exchanged between willing parties in a current transaction, other than in a liquidation or forced sale.
The fair values of such financial items have been estimated on the following basis:
• Interest rate swap agreements are valued using discounted cash flow analysis.
• Forward foreign exchange contracts are fair valued based on the contract forward rates in effect on the balance sheet date.
• Foreign currency options are fair valued based on quoted market prices on the balance sheet date.
Loans from financial institutions are discounted by the risk-free rate of interest during the loan period combined with the loan’s interest rate margin on the balance sheet date. The discount rate applied is the rate at which the Company could obtain a similar loan elsewhere on the balance sheet date.
The original book value of receivables other than those based on derivative contracts, as well as that of purchasing and other non-interest bearing debts, corresponds with their fair value, as the discounted effect is not essential considering the maturity of the receivables.
Principles regarding classification of financial instruments’ fair values:The fair value of financial instruments has been determined by the Group using appropriate valuation methods for which sufficient infor-mation is available. This is done by maximizing the usage of market observable inputs and minimizing the usage of unobservable inputs.
All assets and liabilities for which fair value is measured or dis-closed in the financial statements are categorized within the fair value hierarchy, described as follows, based on the lowest level input that is significant to the fair value measurement as a whole:
• Level 1 — Quoted (unadjusted) market prices in active markets for identical assets or liabilities The Group’s financial assets and liabilities are included in Level 2 val-uation techniques for which the lowest level input that is significant to the fair value measurement is directly or indirectly observable.
• Level 2 — Valuation techniques for which the lowest level input that is significant to the fair value measurement is directly or indirectly observable
• Level 3 — Valuation techniques for which the lowest level input that is significant to the fair value measurement is unobservable The Group categorizes financial assets and liabilities valued at fair value to appropriate net fair value hierarchy level at the end of each reporting period.
Changes in the fair value of derivative financial instruments are recognized in the income statement in financial gains and losses.
Net fair values and nominal values of financial assets and liabilities:
NOTE 31 FAIR VALUES OF FINANCIAL ASSETS AND LIABILITIES
NOTE 32 CONTINGENT LIABILITIES
EUR 1,000Net fair value
hierarchy2015
Net fair value2015
Nominal value2014
Net fair value2014
Nominal valueTrade and other receivables Level 2 11,507 11,507 10,906 10,906
Cash and cash equivalents Level 2 7,874 7,874 8,218 8,218
Interest rate swap agreements Level 2 -35 2,400 -38 3,000
Bank loans Level 2 4,011 4,000 5,004 5,000
Current loan facilities Level 2 3,945 3,945 0 0
Trade and other payables Level 2 13,594 13,594 16,110 16,110
EUR 1,000 2015 2014
Commitments on own behalf Mortgages 2,783 2,783
Floating charges 12,500 12,500
Operating leasesNot later than one year 1,040 896
1 – 5 years 904 1,414
Other liabilities 312 6
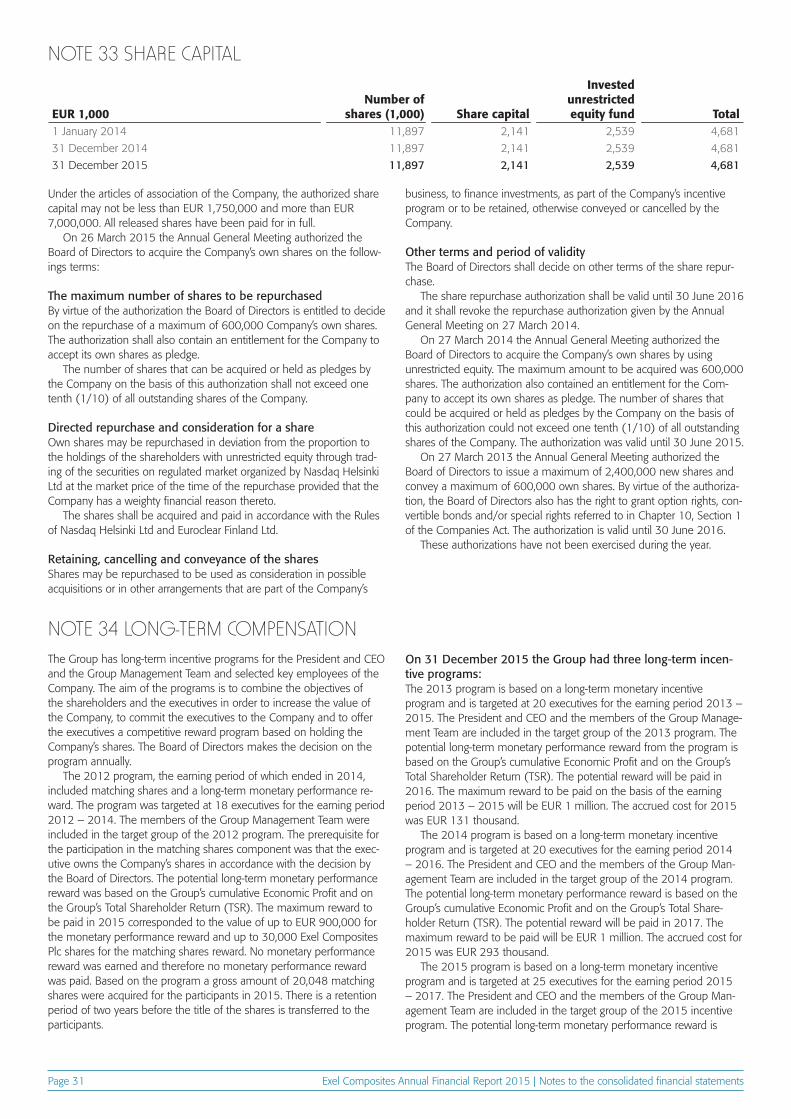
Exel Composites Annual Financial Report 2015 | Notes to the consolidated financial statementsPage 31
NOTE 33 SHARE CAPITAL
NOTE 34 LONG-TERM COMPENSATION
EUR 1,000Number of
shares (1,000) Share capital
Invested unrestricted equity fund Total
1 January 2014 11,897 2,141 2,539 4,681
31 December 2014 11,897 2,141 2,539 4,681
31 December 2015 11,897 2,141 2,539 4,681
Under the articles of association of the Company, the authorized share capital may not be less than EUR 1,750,000 and more than EUR 7,000,000. All released shares have been paid for in full.
On 26 March 2015 the Annual General Meeting authorized the Board of Directors to acquire the Company’s own shares on the follow-ings terms:
The maximum number of shares to be repurchasedBy virtue of the authorization the Board of Directors is entitled to decide on the repurchase of a maximum of 600,000 Company’s own shares. The authorization shall also contain an entitlement for the Company to accept its own shares as pledge.
The number of shares that can be acquired or held as pledges by the Company on the basis of this authorization shall not exceed one tenth (1/10) of all outstanding shares of the Company.
Directed repurchase and consideration for a shareOwn shares may be repurchased in deviation from the proportion to the holdings of the shareholders with unrestricted equity through trad-ing of the securities on regulated market organized by Nasdaq Helsinki Ltd at the market price of the time of the repurchase provided that the Company has a weighty financial reason thereto.
The shares shall be acquired and paid in accordance with the Rules of Nasdaq Helsinki Ltd and Euroclear Finland Ltd.
Retaining, cancelling and conveyance of the sharesShares may be repurchased to be used as consideration in possible acquisitions or in other arrangements that are part of the Company’s
business, to finance investments, as part of the Company’s incentive program or to be retained, otherwise conveyed or cancelled by the Company.
Other terms and period of validityThe Board of Directors shall decide on other terms of the share repur-chase.
The share repurchase authorization shall be valid until 30 June 2016 and it shall revoke the repurchase authorization given by the Annual General Meeting on 27 March 2014.
On 27 March 2014 the Annual General Meeting authorized the Board of Directors to acquire the Company’s own shares by using unrestricted equity. The maximum amount to be acquired was 600,000 shares. The authorization also contained an entitlement for the Com-pany to accept its own shares as pledge. The number of shares that could be acquired or held as pledges by the Company on the basis of this authorization could not exceed one tenth (1/10) of all outstanding shares of the Company. The authorization was valid until 30 June 2015.
On 27 March 2013 the Annual General Meeting authorized the Board of Directors to issue a maximum of 2,400,000 new shares and convey a maximum of 600,000 own shares. By virtue of the authoriza-tion, the Board of Directors also has the right to grant option rights, con-vertible bonds and/or special rights referred to in Chapter 10, Section 1 of the Companies Act. The authorization is valid until 30 June 2016.
These authorizations have not been exercised during the year.
The Group has long-term incentive programs for the President and CEO and the Group Management Team and selected key employees of the Company. The aim of the programs is to combine the objectives of the shareholders and the executives in order to increase the value of the Company, to commit the executives to the Company and to offer the executives a competitive reward program based on holding the Company’s shares. The Board of Directors makes the decision on the program annually.
The 2012 program, the earning period of which ended in 2014, included matching shares and a long-term monetary performance re-ward. The program was targeted at 18 executives for the earning period 2012 – 2014. The members of the Group Management Team were included in the target group of the 2012 program. The prerequisite for the participation in the matching shares component was that the exec-utive owns the Company’s shares in accordance with the decision by the Board of Directors. The potential long-term monetary performance reward was based on the Group’s cumulative Economic Profit and on the Group’s Total Shareholder Return (TSR). The maximum reward to be paid in 2015 corresponded to the value of up to EUR 900,000 for the monetary performance reward and up to 30,000 Exel Composites Plc shares for the matching shares reward. No monetary performance reward was earned and therefore no monetary performance reward was paid. Based on the program a gross amount of 20,048 matching shares were acquired for the participants in 2015. There is a retention period of two years before the title of the shares is transferred to the participants.
On 31 December 2015 the Group had three long-term incen-tive programs: The 2013 program is based on a long-term monetary incentive program and is targeted at 20 executives for the earning period 2013 – 2015. The President and CEO and the members of the Group Manage-ment Team are included in the target group of the 2013 program. The potential long-term monetary performance reward from the program is based on the Group’s cumulative Economic Profit and on the Group’s Total Shareholder Return (TSR). The potential reward will be paid in 2016. The maximum reward to be paid on the basis of the earning period 2013 – 2015 will be EUR 1 million. The accrued cost for 2015 was EUR 131 thousand.
The 2014 program is based on a long-term monetary incentive program and is targeted at 20 executives for the earning period 2014 – 2016. The President and CEO and the members of the Group Man-agement Team are included in the target group of the 2014 program. The potential long-term monetary performance reward is based on the Group’s cumulative Economic Profit and on the Group’s Total Share-holder Return (TSR). The potential reward will be paid in 2017. The maximum reward to be paid will be EUR 1 million. The accrued cost for 2015 was EUR 293 thousand.
The 2015 program is based on a long-term monetary incentive program and is targeted at 25 executives for the earning period 2015 – 2017. The President and CEO and the members of the Group Man-agement Team are included in the target group of the 2015 incentive program. The potential long-term monetary performance reward is
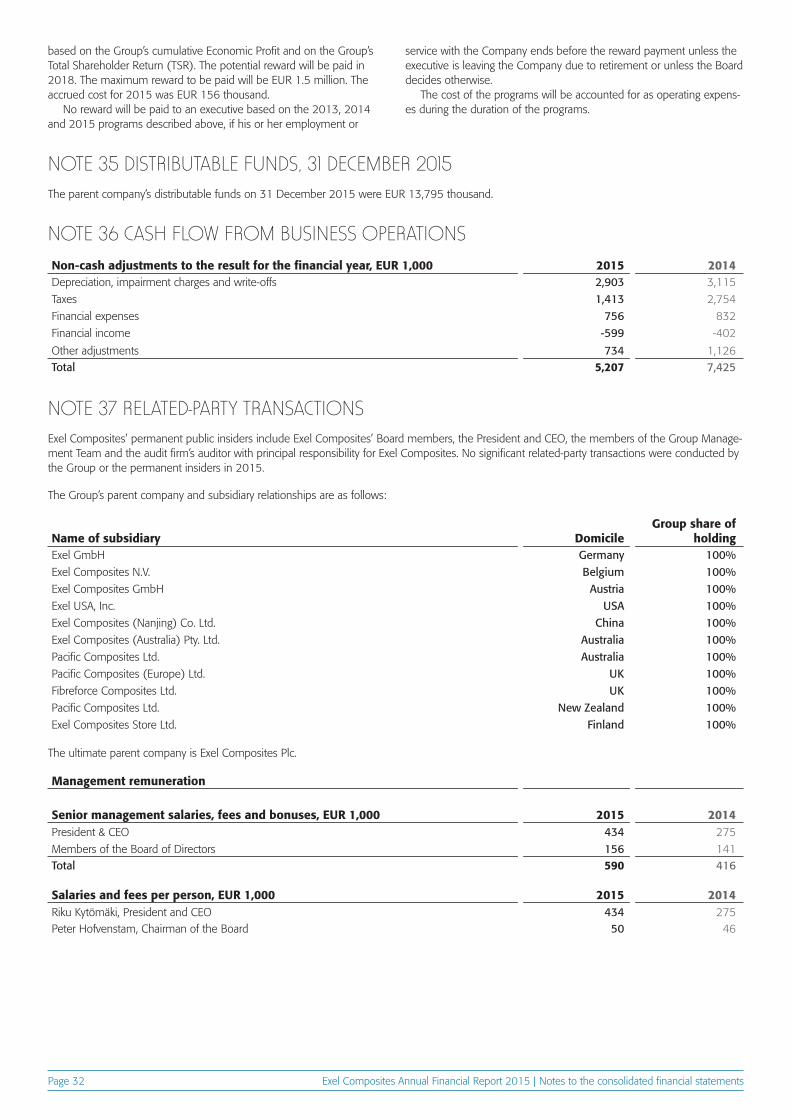
Exel Composites Annual Financial Report 2015 | Notes to the consolidated financial statementsPage 32
based on the Group’s cumulative Economic Profit and on the Group’s Total Shareholder Return (TSR). The potential reward will be paid in 2018. The maximum reward to be paid will be EUR 1.5 million. The accrued cost for 2015 was EUR 156 thousand.
No reward will be paid to an executive based on the 2013, 2014 and 2015 programs described above, if his or her employment or
service with the Company ends before the reward payment unless the executive is leaving the Company due to retirement or unless the Board decides otherwise.
The cost of the programs will be accounted for as operating expens-es during the duration of the programs.
NOTE 35 DISTRIBUTABLE FUNDS, 31 DECEMBER 2015
NOTE 37 RELATED-PARTY TRANSACTIONS
NOTE 36 CASH FLOW FROM BUSINESS OPERATIONS
The parent company’s distributable funds on 31 December 2015 were EUR 13,795 thousand.
Exel Composites’ permanent public insiders include Exel Composites’ Board members, the President and CEO, the members of the Group Manage-ment Team and the audit firm’s auditor with principal responsibility for Exel Composites. No significant related-party transactions were conducted by the Group or the permanent insiders in 2015.
The Group’s parent company and subsidiary relationships are as follows:
The ultimate parent company is Exel Composites Plc.
Non-cash adjustments to the result for the financial year, EUR 1,000 2015 2014Depreciation, impairment charges and write-offs 2,903 3,115
Taxes 1,413 2,754
Financial expenses 756 832
Financial income -599 -402
Other adjustments 734 1,126Total 5,207 7,425
Name of subsidiary DomicileGroup share of
holdingExel GmbH Germany 100%Exel Composites N.V. Belgium 100%Exel Composites GmbH Austria 100%Exel USA, Inc. USA 100%Exel Composites (Nanjing) Co. Ltd. China 100%Exel Composites (Australia) Pty. Ltd. Australia 100%Pacific Composites Ltd. Australia 100%Pacific Composites (Europe) Ltd. UK 100%Fibreforce Composites Ltd. UK 100%Pacific Composites Ltd. New Zealand 100%Exel Composites Store Ltd. Finland 100%
Management remuneration
Senior management salaries, fees and bonuses, EUR 1,000 2015 2014President & CEO 434 275
Members of the Board of Directors 156 141Total 590 416
Salaries and fees per person, EUR 1,000 2015 2014Riku Kytömäki, President and CEO 434 275Peter Hofvenstam, Chairman of the Board 50 46
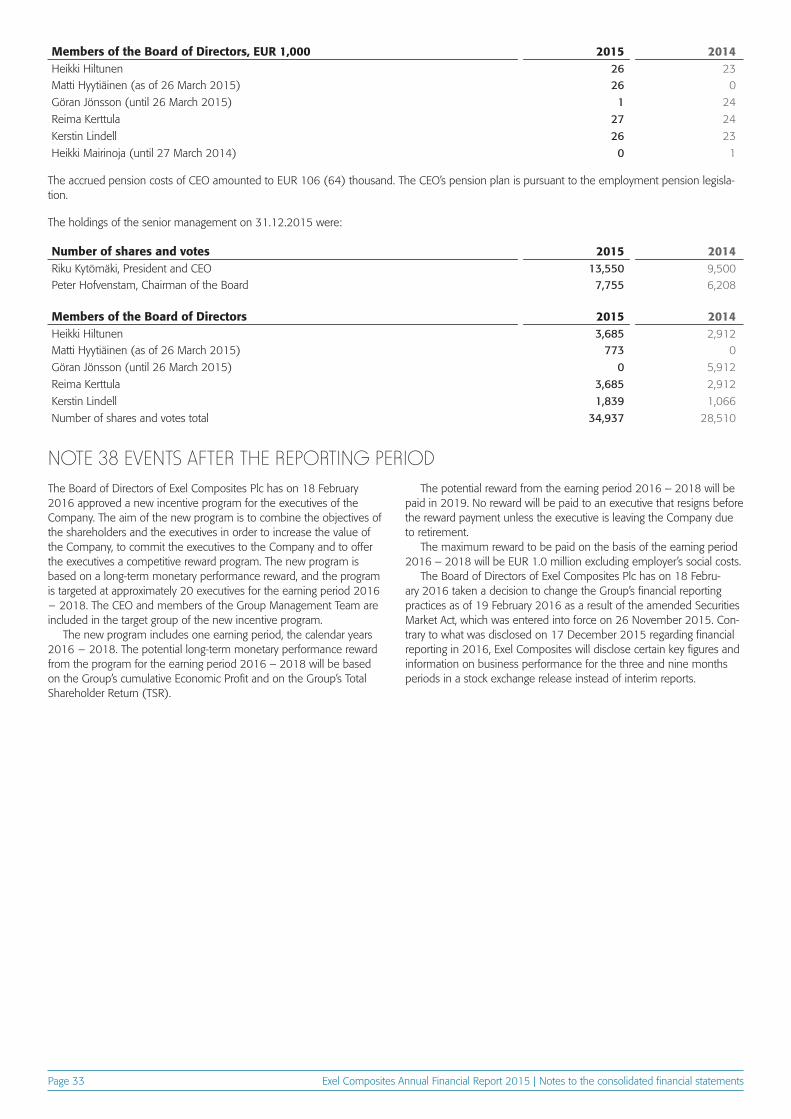
Exel Composites Annual Financial Report 2015 | Notes to the consolidated financial statementsPage 33
Members of the Board of Directors, EUR 1,000 2015 2014Heikki Hiltunen 26 23Matti Hyytiäinen (as of 26 March 2015) 26 0
Göran Jönsson (until 26 March 2015) 1 24
Reima Kerttula 27 24
Kerstin Lindell 26 23
Heikki Mairinoja (until 27 March 2014) 0 1
Number of shares and votes 2015 2014Riku Kytömäki, President and CEO 13,550 9,500Peter Hofvenstam, Chairman of the Board 7,755 6,208
Members of the Board of Directors 2015 2014Heikki Hiltunen 3,685 2,912Matti Hyytiäinen (as of 26 March 2015) 773 0
Göran Jönsson (until 26 March 2015) 0 5,912
Reima Kerttula 3,685 2,912
Kerstin Lindell 1,839 1,066
Number of shares and votes total 34,937 28,510
The accrued pension costs of CEO amounted to EUR 106 (64) thousand. The CEO’s pension plan is pursuant to the employment pension legisla-tion.
The holdings of the senior management on 31.12.2015 were:
NOTE 38 EVENTS AFTER THE REPORTING PERIODThe Board of Directors of Exel Composites Plc has on 18 February 2016 approved a new incentive program for the executives of the Company. The aim of the new program is to combine the objectives of the shareholders and the executives in order to increase the value of the Company, to commit the executives to the Company and to offer the executives a competitive reward program. The new program is based on a long-term monetary performance reward, and the program is targeted at approximately 20 executives for the earning period 2016 − 2018. The CEO and members of the Group Management Team are included in the target group of the new incentive program.
The new program includes one earning period, the calendar years 2016 − 2018. The potential long-term monetary performance reward from the program for the earning period 2016 – 2018 will be based on the Group’s cumulative Economic Profit and on the Group’s Total Shareholder Return (TSR).
The potential reward from the earning period 2016 – 2018 will be paid in 2019. No reward will be paid to an executive that resigns before the reward payment unless the executive is leaving the Company due to retirement.
The maximum reward to be paid on the basis of the earning period 2016 – 2018 will be EUR 1.0 million excluding employer’s social costs.
The Board of Directors of Exel Composites Plc has on 18 Febru-ary 2016 taken a decision to change the Group’s financial reporting practices as of 19 February 2016 as a result of the amended Securities Market Act, which was entered into force on 26 November 2015. Con-trary to what was disclosed on 17 December 2015 regarding financial reporting in 2016, Exel Composites will disclose certain key figures and information on business performance for the three and nine months periods in a stock exchange release instead of interim reports.
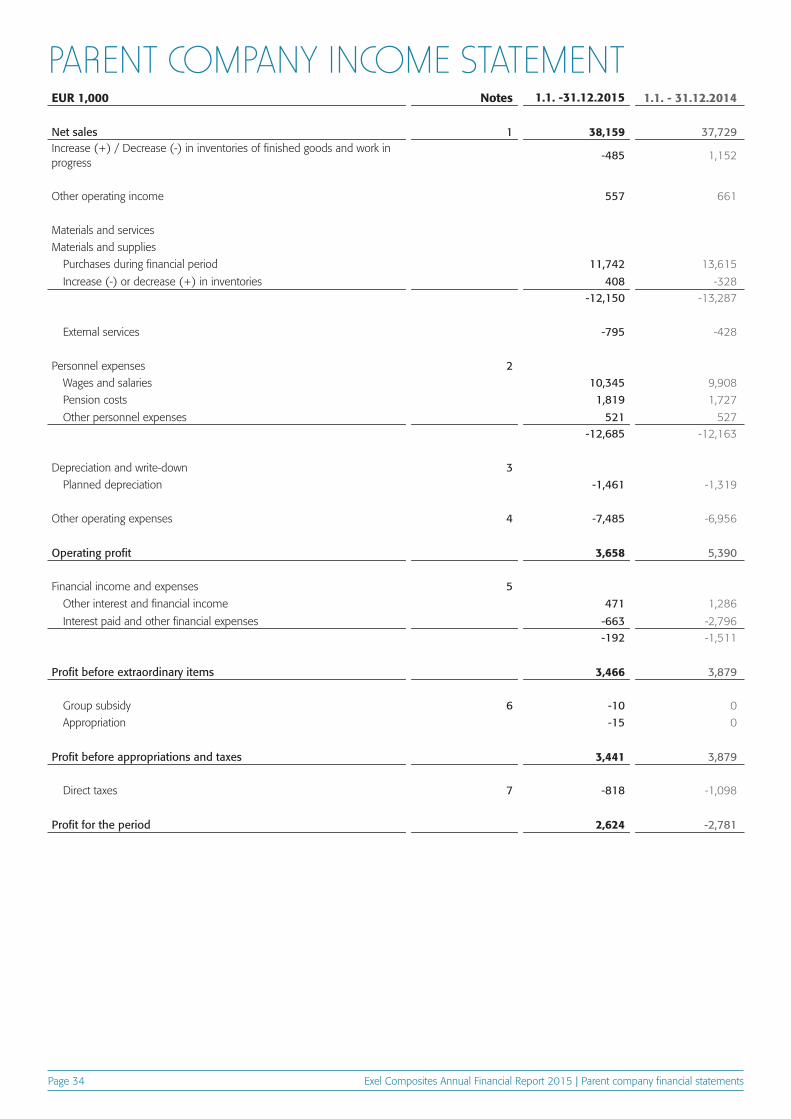
Exel Composites Annual Financial Report 2015 | Parent company financial statementsPage 34
PARENT COMPANY INCOME STATEMENTEUR 1,000 Notes 1.1. -31.12.2015 1.1. - 31.12.2014
Net sales 1 38,159 37,729Increase (+) / Decrease (-) in inventories of finished goods and work in progress
-485 1,152
Other operating income 557 661
Materials and services
Materials and supplies
Purchases during financial period 11,742 13,615
Increase (-) or decrease (+) in inventories 408 -328-12,150 -13,287
External services -795 -428
Personnel expenses 2Wages and salaries 10,345 9,908
Pension costs 1,819 1,727
Other personnel expenses 521 527-12,685 -12,163
Depreciation and write-down 3Planned depreciation -1,461 -1,319
Other operating expenses 4 -7,485 -6,956
Operating profit 3,658 5,390
Financial income and expenses 5
Other interest and financial income 471 1,286
Interest paid and other financial expenses -663 -2,796-192 -1,511
Profit before extraordinary items 3,466 3,879
Group subsidy 6 -10 0
Appropriation -15 0
Profit before appropriations and taxes 3,441 3,879
Direct taxes 7 -818 -1,098
Profit for the period 2,624 -2,781
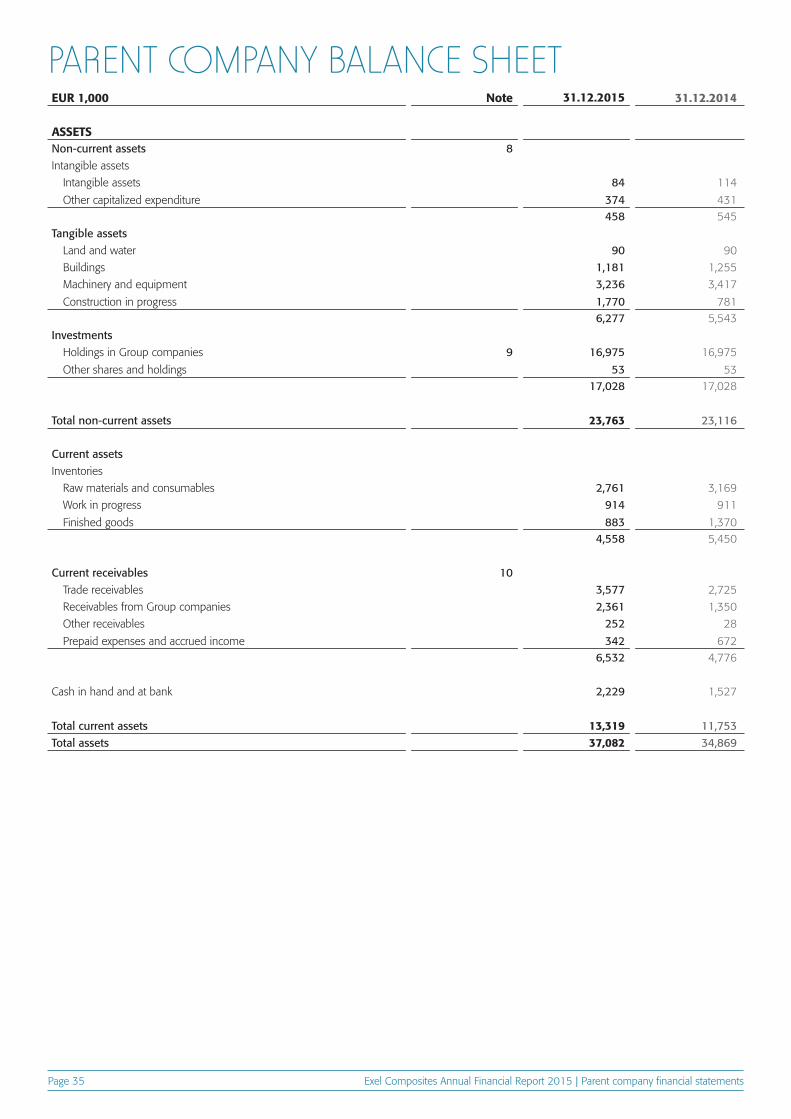
Exel Composites Annual Financial Report 2015 | Parent company financial statementsPage 35
PARENT COMPANY BALANCE SHEETEUR 1,000 Note 31.12.2015 31.12.2014
ASSETSNon-current assets 8Intangible assets
Intangible assets 84 114
Other capitalized expenditure 374 431458 545
Tangible assetsLand and water 90 90
Buildings 1,181 1,255
Machinery and equipment 3,236 3,417
Construction in progress 1,770 7816,277 5,543
InvestmentsHoldings in Group companies 9 16,975 16,975
Other shares and holdings 53 5317,028 17,028
Total non-current assets 23,763 23,116
Current assetsInventories
Raw materials and consumables 2,761 3,169
Work in progress 914 911
Finished goods 883 1,3704,558 5,450
Current receivables 10Trade receivables 3,577 2,725
Receivables from Group companies 2,361 1,350
Other receivables 252 28
Prepaid expenses and accrued income 342 6726,532 4,776
Cash in hand and at bank 2,229 1,527
Total current assets 13,319 11,753Total assets 37,082 34,869
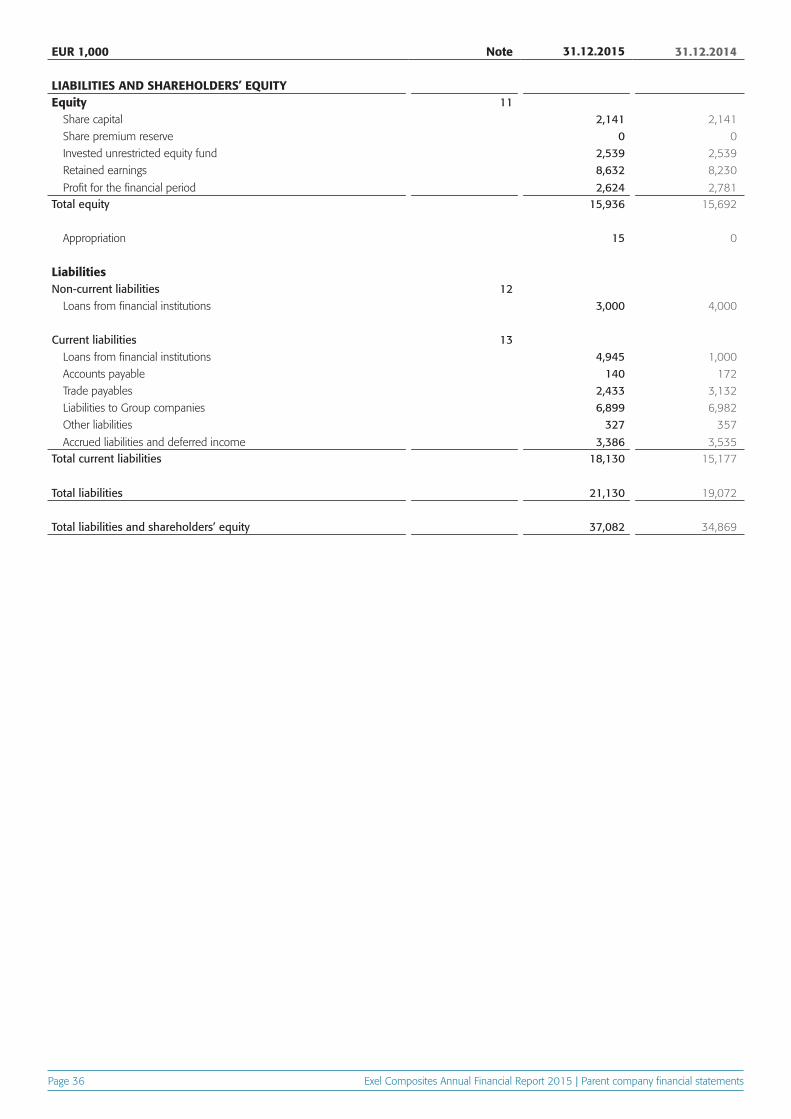
Exel Composites Annual Financial Report 2015 | Parent company financial statementsPage 36
EUR 1,000 Note 31.12.2015 31.12.2014
LIABILITIES AND SHAREHOLDERS’ EQUITYEquity 11
Share capital 2,141 2,141
Share premium reserve 0 0
Invested unrestricted equity fund 2,539 2,539
Retained earnings 8,632 8,230
Profit for the financial period 2,624 2,781Total equity 15,936 15,692
Appropriation 15 0
LiabilitiesNon-current liabilities 12
Loans from financial institutions 3,000 4,000
Current liabilities 13Loans from financial institutions 4,945 1,000
Accounts payable 140 172
Trade payables 2,433 3,132
Liabilities to Group companies 6,899 6,982
Other liabilities 327 357
Accrued liabilities and deferred income 3,386 3,535Total current liabilities 18,130 15,177
Total liabilities 21,130 19,072
Total liabilities and shareholders’ equity 37,082 34,869

Exel Composites Annual Financial Report 2015 | Parent company financial statementsPage 37
PARENT COMPANY CASH FLOW STATEMENTEUR 1,000 2015 2014Cash flow from business operationsProfit for the year 2,624 2,781
Profit for the year adjustments 2,551 4,039
Change in net working capital -1,833 328
Interest paid and other financial expenses -319 -575
Dividend received 1 1,001
Interest received 47 34
Income taxes paid -828 -1,299Net cash flow from operating activities 2,243 6,309
Cash flow from investing activitiesCapital expenditure -2,107 -1,916
Installments in subsidiaries’ shares 0 0
Proceeds from sale of fixed assets 0 3,343Net cash flow from investing activities 2,107 1,427
Cash flow before financing 136 7,736
Cash flowProceeds from long-term borrowings 0 5,000
Repayments of long-term borrowings -1,000 -2,840
Change of current loans -3,945 -9,700
Group subsidies 0 0
Additional capital repayment 0 0
Dividend paid -2,379 0Net cash flow from financing 566 -7,540
Change in liquid funds 702 196Liquid funds Jan. 1 1,527 1,331Liquid assets from merger 0 0
Liquid funds Dec. 31 2,229 1,527
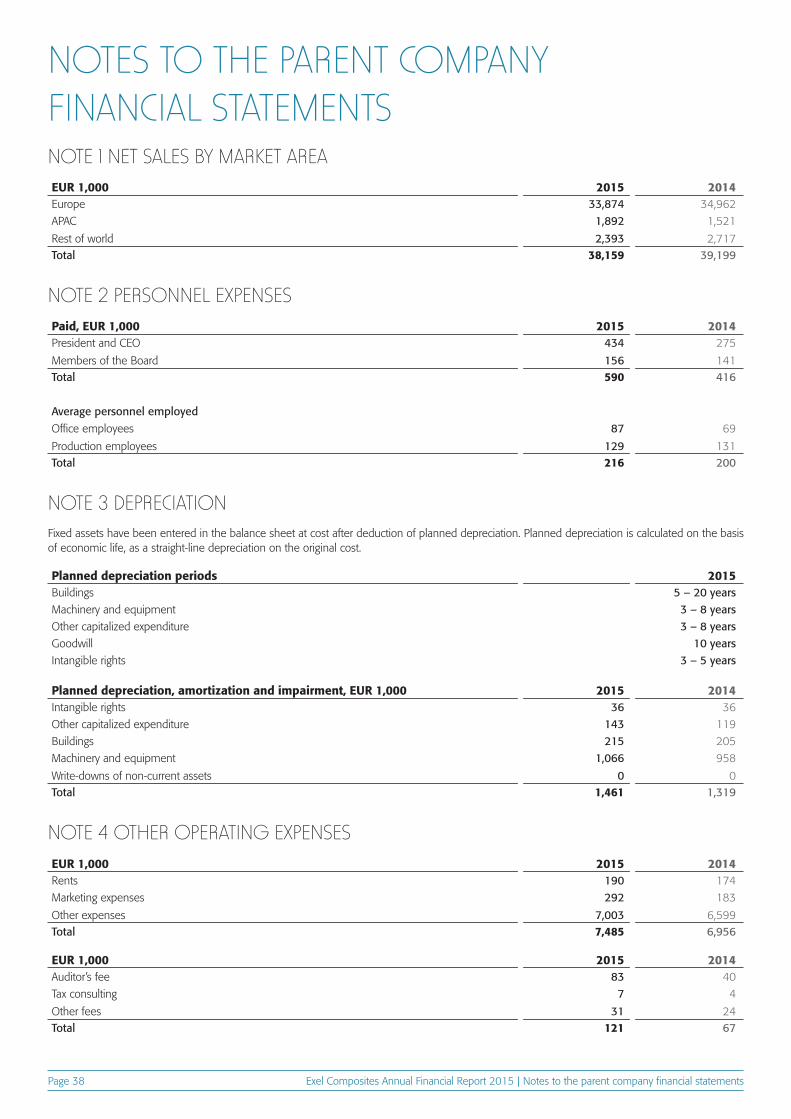
Exel Composites Annual Financial Report 2015 | Notes to the parent company financial statementsPage 38
NOTES TO THE PARENT COMPANY FINANCIAL STATEMENTSNOTE 1 NET SALES BY MARKET AREA
NOTE 2 PERSONNEL EXPENSES
NOTE 3 DEPRECIATION
NOTE 4 OTHER OPERATING EXPENSES
Fixed assets have been entered in the balance sheet at cost after deduction of planned depreciation. Planned depreciation is calculated on the basis of economic life, as a straight-line depreciation on the original cost.
EUR 1,000 2015 2014Europe 33,874 34,962
APAC 1,892 1,521
Rest of world 2,393 2,717Total 38,159 39,199
Planned depreciation, amortization and impairment, EUR 1,000 2015 2014Intangible rights 36 36
Other capitalized expenditure 143 119
Buildings 215 205
Machinery and equipment 1,066 958
Write-downs of non-current assets 0 0Total 1,461 1,319
EUR 1,000 2015 2014Rents 190 174
Marketing expenses 292 183
Other expenses 7,003 6,599Total 7,485 6,956
EUR 1,000 2015 2014Auditor’s fee 83 40
Tax consulting 7 4
Other fees 31 24Total 121 67
Paid, EUR 1,000 2015 2014President and CEO 434 275
Members of the Board 156 141Total 590 416
Average personnel employed
Office employees 87 69
Production employees 129 131Total 216 200
Planned depreciation periods 2015Buildings 5 – 20 yearsMachinery and equipment 3 – 8 yearsOther capitalized expenditure 3 – 8 yearsGoodwill 10 yearsIntangible rights 3 – 5 years
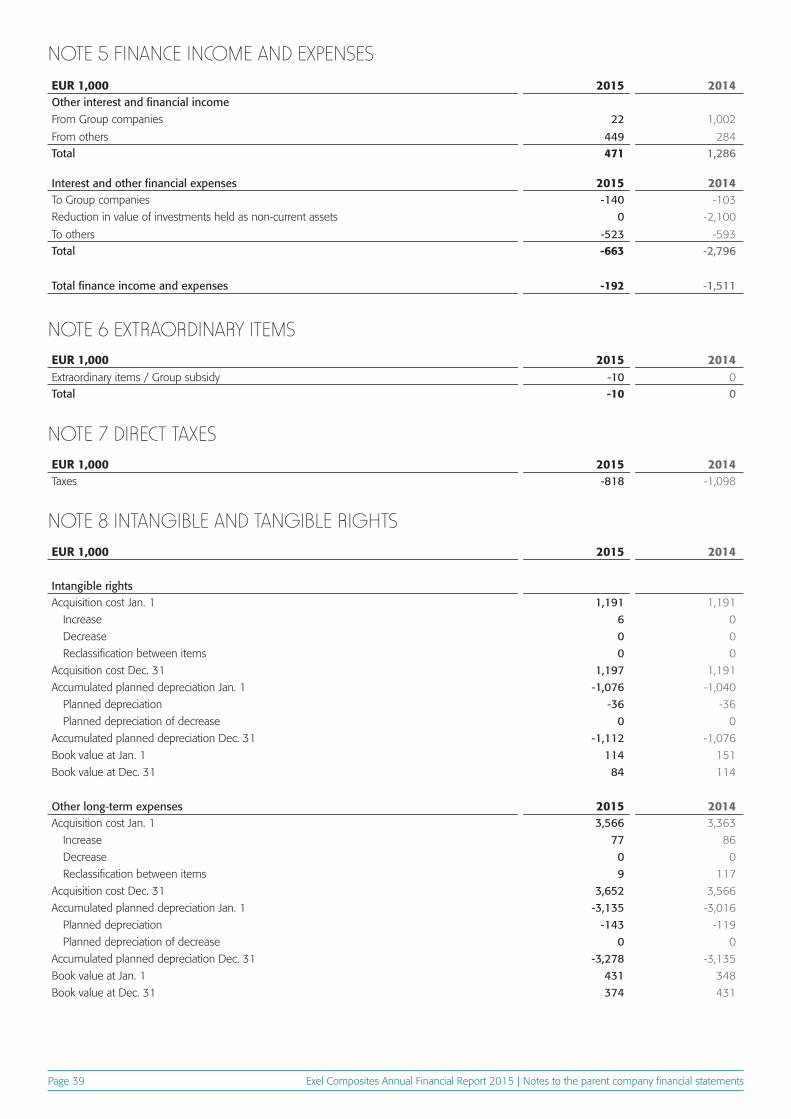
Exel Composites Annual Financial Report 2015 | Notes to the parent company financial statementsPage 39
NOTE 5 FINANCE INCOME AND EXPENSES
NOTE 6 EXTRAORDINARY ITEMS
NOTE 7 DIRECT TAXES
NOTE 8 INTANGIBLE AND TANGIBLE RIGHTS
EUR 1,000 2015 2014Other interest and financial incomeFrom Group companies 22 1,002
From others 449 284Total 471 1,286
EUR 1,000 2015 2014Extraordinary items / Group subsidy -10 0Total -10 0
EUR 1,000 2015 2014Taxes -818 -1,098
Interest and other financial expenses 2015 2014To Group companies -140 -103
Reduction in value of investments held as non-current assets 0 -2,100
To others -523 -593Total -663 -2,796
Total finance income and expenses -192 -1,511
EUR 1,000 2015 2014
Intangible rightsAcquisition cost Jan. 1 1,191 1,191
Increase 6 0
Decrease 0 0
Reclassification between items 0 0
Acquisition cost Dec. 31 1,197 1,191
Accumulated planned depreciation Jan. 1 -1,076 -1,040
Planned depreciation -36 -36
Planned depreciation of decrease 0 0
Accumulated planned depreciation Dec. 31 -1,112 -1,076
Book value at Jan. 1 114 151
Book value at Dec. 31 84 114
Other long-term expenses 2015 2014Acquisition cost Jan. 1 3,566 3,363
Increase 77 86
Decrease 0 0
Reclassification between items 9 117
Acquisition cost Dec. 31 3,652 3,566
Accumulated planned depreciation Jan. 1 -3,135 -3,016
Planned depreciation -143 -119
Planned depreciation of decrease 0 0
Accumulated planned depreciation Dec. 31 -3,278 -3,135
Book value at Jan. 1 431 348
Book value at Dec. 31 374 431
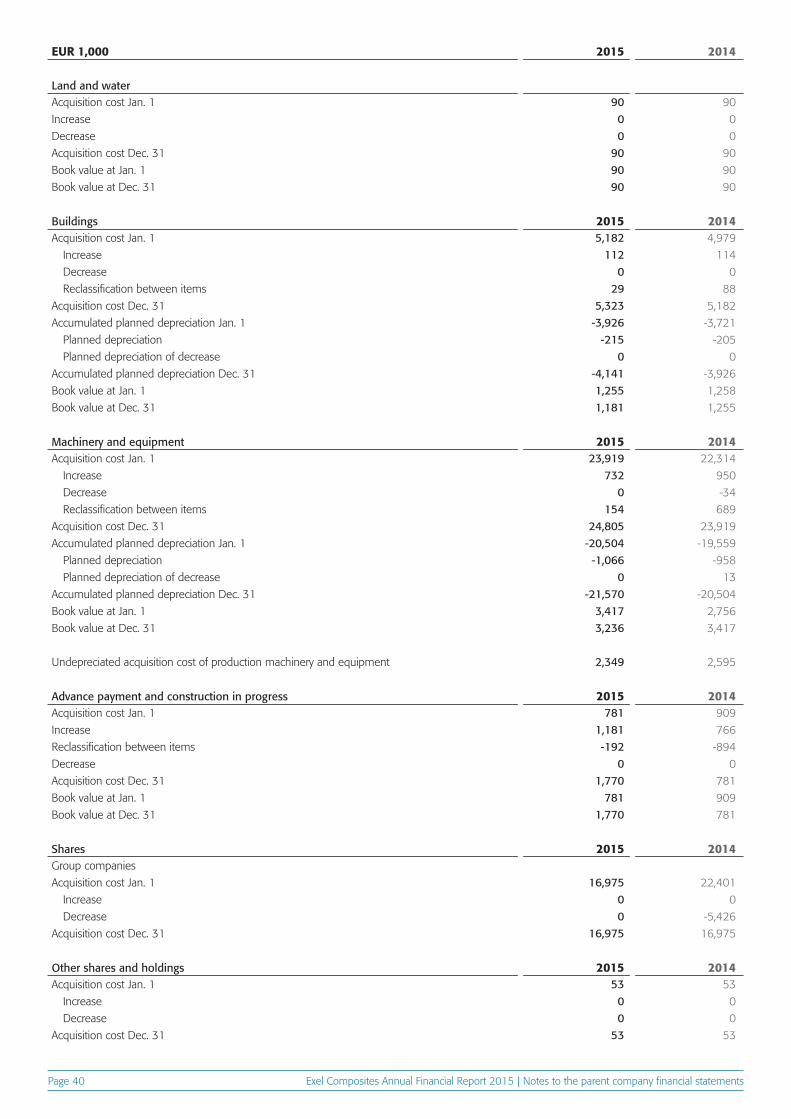
Exel Composites Annual Financial Report 2015 | Notes to the parent company financial statementsPage 40
EUR 1,000 2015 2014
Land and waterAcquisition cost Jan. 1 90 90
Increase 0 0
Decrease 0 0
Acquisition cost Dec. 31 90 90
Book value at Jan. 1 90 90
Book value at Dec. 31 90 90
Buildings 2015 2014Acquisition cost Jan. 1 5,182 4,979
Increase 112 114
Decrease 0 0
Reclassification between items 29 88
Acquisition cost Dec. 31 5,323 5,182
Accumulated planned depreciation Jan. 1 -3,926 -3,721
Planned depreciation -215 -205
Planned depreciation of decrease 0 0
Accumulated planned depreciation Dec. 31 -4,141 -3,926
Book value at Jan. 1 1,255 1,258
Book value at Dec. 31 1,181 1,255
Machinery and equipment 2015 2014Acquisition cost Jan. 1 23,919 22,314
Increase 732 950
Decrease 0 -34
Reclassification between items 154 689
Acquisition cost Dec. 31 24,805 23,919
Accumulated planned depreciation Jan. 1 -20,504 -19,559
Planned depreciation -1,066 -958
Planned depreciation of decrease 0 13
Accumulated planned depreciation Dec. 31 -21,570 -20,504
Book value at Jan. 1 3,417 2,756
Book value at Dec. 31 3,236 3,417
Undepreciated acquisition cost of production machinery and equipment 2,349 2,595
Advance payment and construction in progress 2015 2014Acquisition cost Jan. 1 781 909
Increase 1,181 766
Reclassification between items -192 -894
Decrease 0 0
Acquisition cost Dec. 31 1,770 781
Book value at Jan. 1 781 909
Book value at Dec. 31 1,770 781
Shares 2015 2014Group companies
Acquisition cost Jan. 1 16,975 22,401
Increase 0 0
Decrease 0 -5,426
Acquisition cost Dec. 31 16,975 16,975
Other shares and holdings 2015 2014Acquisition cost Jan. 1 53 53
Increase 0 0
Decrease 0 0
Acquisition cost Dec. 31 53 53
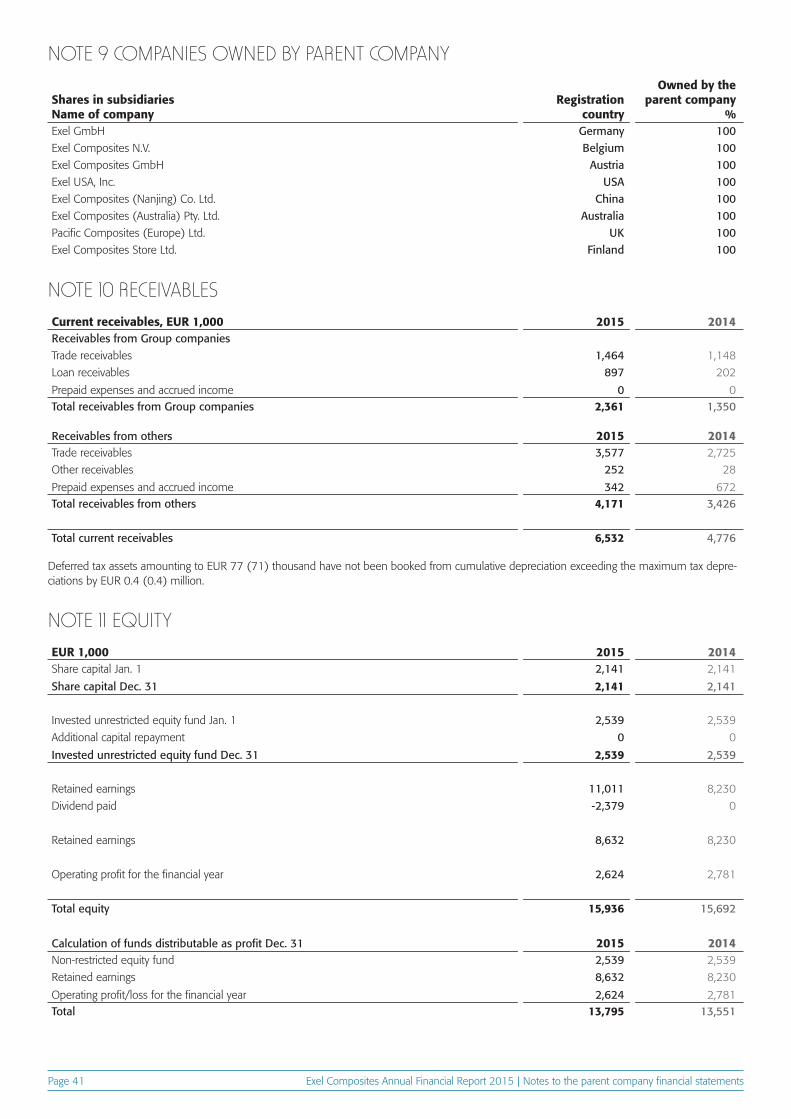
Exel Composites Annual Financial Report 2015 | Notes to the parent company financial statementsPage 41
NOTE 9 COMPANIES OWNED BY PARENT COMPANY
Shares in subsidiariesName of company
Registration country
Owned by the parent company
%Exel GmbH Germany 100Exel Composites N.V. Belgium 100Exel Composites GmbH Austria 100Exel USA, Inc. USA 100Exel Composites (Nanjing) Co. Ltd. China 100Exel Composites (Australia) Pty. Ltd. Australia 100Pacific Composites (Europe) Ltd. UK 100Exel Composites Store Ltd. Finland 100
NOTE 10 RECEIVABLES
NOTE 11 EQUITY
Current receivables, EUR 1,000 2015 2014Receivables from Group companiesTrade receivables 1,464 1,148
Loan receivables 897 202
Prepaid expenses and accrued income 0 0Total receivables from Group companies 2,361 1,350
EUR 1,000 2015 2014Share capital Jan. 1 2,141 2,141
Share capital Dec. 31 2,141 2,141
Invested unrestricted equity fund Jan. 1 2,539 2,539
Additional capital repayment 0 0
Invested unrestricted equity fund Dec. 31 2,539 2,539
Retained earnings 11,011 8,230
Dividend paid -2,379 0
Retained earnings 8,632 8,230
Operating profit for the financial year 2,624 2,781
Total equity 15,936 15,692
Calculation of funds distributable as profit Dec. 31 2015 2014Non-restricted equity fund 2,539 2,539
Retained earnings 8,632 8,230
Operating profit/loss for the financial year 2,624 2,781Total 13,795 13,551
Receivables from others 2015 2014Trade receivables 3,577 2,725
Other receivables 252 28
Prepaid expenses and accrued income 342 672Total receivables from others 4,171 3,426
Total current receivables 6,532 4,776
Deferred tax assets amounting to EUR 77 (71) thousand have not been booked from cumulative depreciation exceeding the maximum tax depre-ciations by EUR 0.4 (0.4) million.
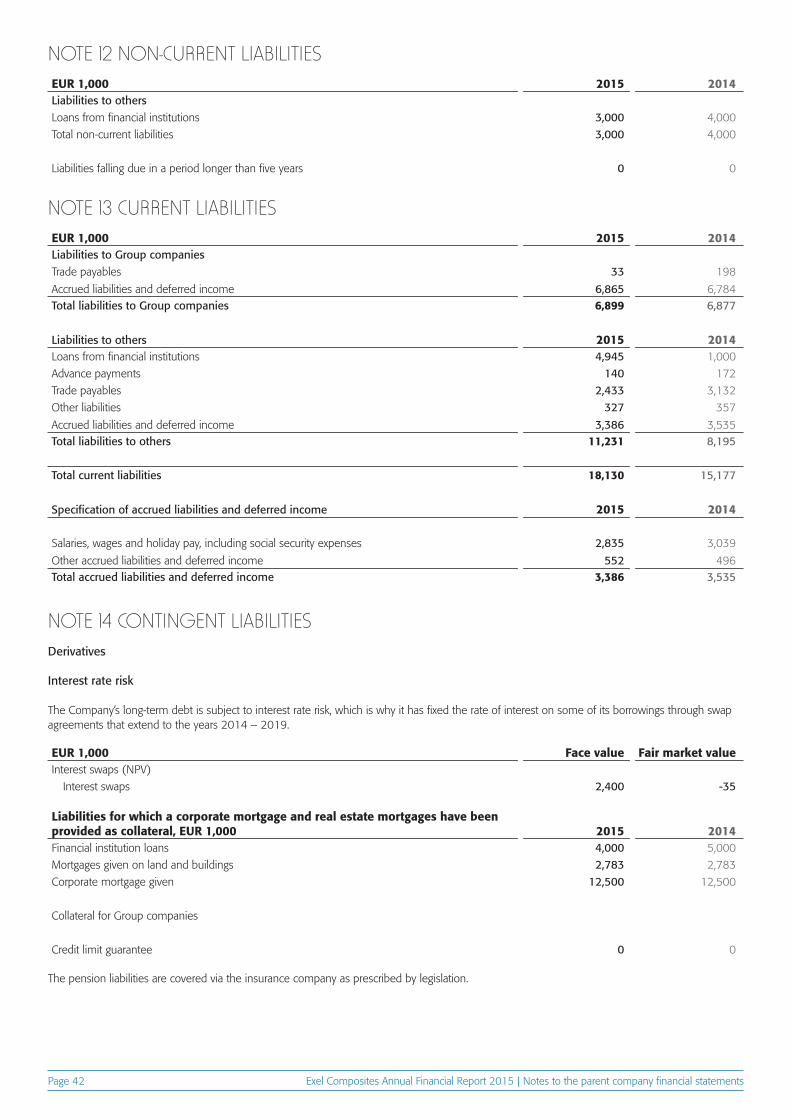
Exel Composites Annual Financial Report 2015 | Notes to the parent company financial statementsPage 42
EUR 1,000 2015 2014Liabilities to othersLoans from financial institutions 3,000 4,000
Total non-current liabilities 3,000 4,000
Liabilities falling due in a period longer than five years 0 0
EUR 1,000 2015 2014Liabilities to Group companiesTrade payables 33 198
Accrued liabilities and deferred income 6,865 6,784Total liabilities to Group companies 6,899 6,877
Liabilities to others 2015 2014Loans from financial institutions 4,945 1,000
Advance payments 140 172
Trade payables 2,433 3,132
Other liabilities 327 357
Accrued liabilities and deferred income 3,386 3,535Total liabilities to others 11,231 8,195
Total current liabilities 18,130 15,177
Specification of accrued liabilities and deferred income 2015 2014
Salaries, wages and holiday pay, including social security expenses 2,835 3,039
Other accrued liabilities and deferred income 552 496Total accrued liabilities and deferred income 3,386 3,535
EUR 1,000 Face value Fair market value Interest swaps (NPV)
Interest swaps 2,400 -35
NOTE 12 NON-CURRENT LIABILITIES
NOTE 13 CURRENT LIABILITIES
NOTE 14 CONTINGENT LIABILITIESDerivatives
Interest rate risk
The Company’s long-term debt is subject to interest rate risk, which is why it has fixed the rate of interest on some of its borrowings through swap agreements that extend to the years 2014 – 2019.
The pension liabilities are covered via the insurance company as prescribed by legislation.
Liabilities for which a corporate mortgage and real estate mortgages have been provided as collateral, EUR 1,000 2015 2014Financial institution loans 4,000 5,000
Mortgages given on land and buildings 2,783 2,783
Corporate mortgage given 12,500 12,500
Collateral for Group companies
Credit limit guarantee 0 0
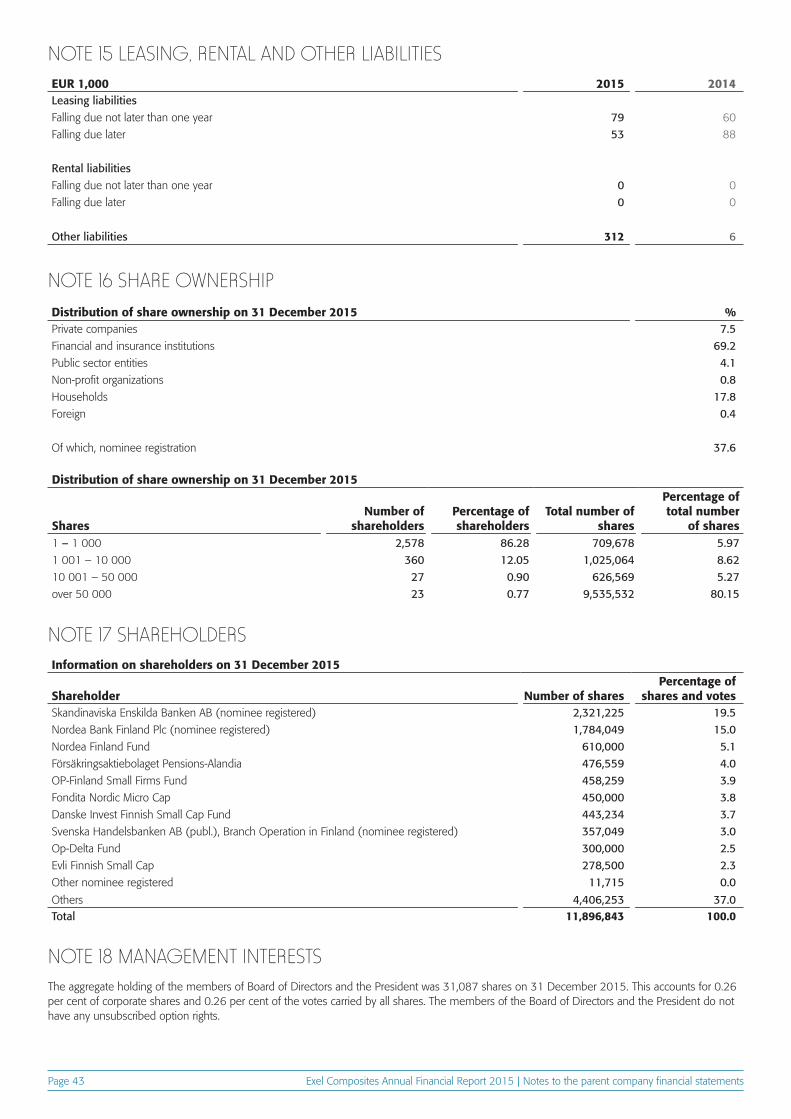
Exel Composites Annual Financial Report 2015 | Notes to the parent company financial statementsPage 43
EUR 1,000 2015 2014Leasing liabilitiesFalling due not later than one year 79 60
Falling due later 53 88
Rental liabilitiesFalling due not later than one year 0 0
Falling due later 0 0
Other liabilities 312 6
Information on shareholders on 31 December 2015
Shareholder Number of sharesPercentage of
shares and votesSkandinaviska Enskilda Banken AB (nominee registered) 2,321,225 19.5Nordea Bank Finland Plc (nominee registered) 1,784,049 15.0Nordea Finland Fund 610,000 5.1Försäkringsaktiebolaget Pensions-Alandia 476,559 4.0OP-Finland Small Firms Fund 458,259 3.9Fondita Nordic Micro Cap 450,000 3.8Danske Invest Finnish Small Cap Fund 443,234 3.7Svenska Handelsbanken AB (publ.), Branch Operation in Finland (nominee registered) 357,049 3.0Op-Delta Fund 300,000 2.5Evli Finnish Small Cap 278,500 2.3Other nominee registered 11,715 0.0
Others 4,406,253 37.0Total 11,896,843 100.0
NOTE 15 LEASING, RENTAL AND OTHER LIABILITIES
NOTE 17 SHAREHOLDERS
NOTE 16 SHARE OWNERSHIPDistribution of share ownership on 31 December 2015 %Private companies 7.5Financial and insurance institutions 69.2Public sector entities 4.1Non-profit organizations 0.8Households 17.8Foreign 0.4
Of which, nominee registration 37.6
Distribution of share ownership on 31 December 2015
SharesNumber of
shareholdersPercentage of shareholders
Total number of shares
Percentage of total number
of shares1 – 1 000 2,578 86.28 709,678 5.971 001 – 10 000 360 12.05 1,025,064 8.6210 001 – 50 000 27 0.90 626,569 5.27over 50 000 23 0.77 9,535,532 80.15
NOTE 18 MANAGEMENT INTERESTSThe aggregate holding of the members of Board of Directors and the President was 31,087 shares on 31 December 2015. This accounts for 0.26 per cent of corporate shares and 0.26 per cent of the votes carried by all shares. The members of the Board of Directors and the President do not have any unsubscribed option rights.
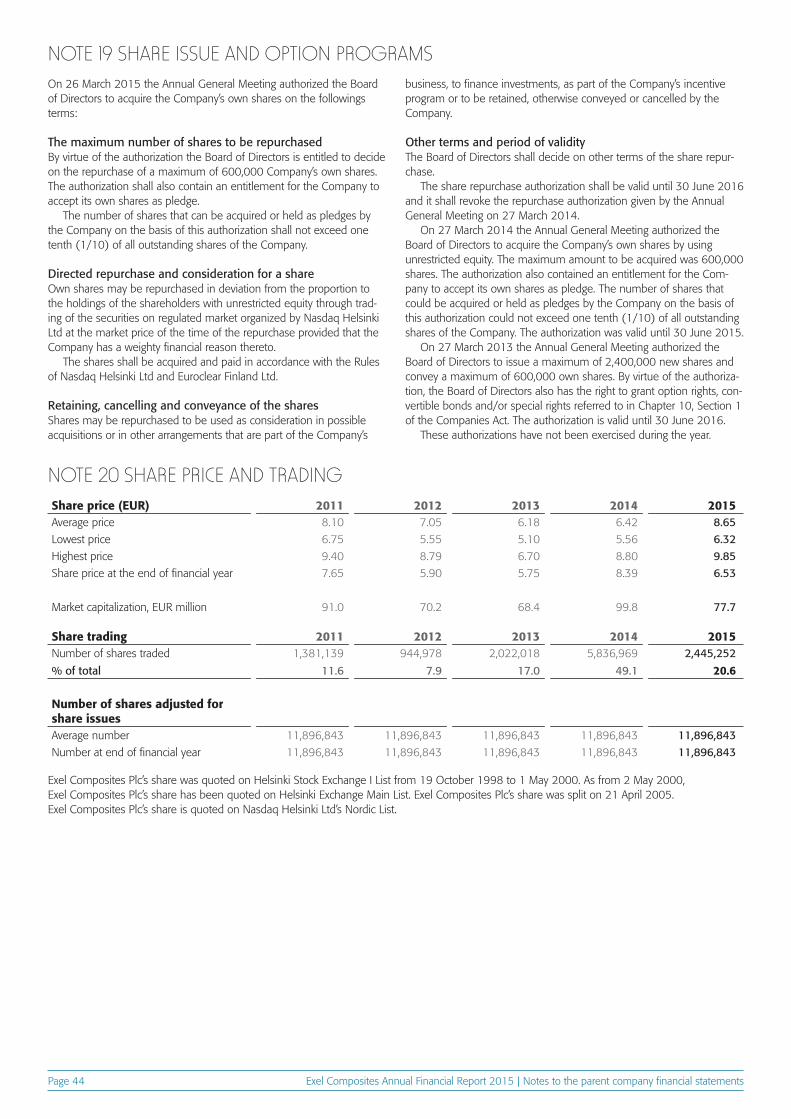
Exel Composites Annual Financial Report 2015 | Notes to the parent company financial statementsPage 44
NOTE 19 SHARE ISSUE AND OPTION PROGRAMS
NOTE 20 SHARE PRICE AND TRADING
On 26 March 2015 the Annual General Meeting authorized the Board of Directors to acquire the Company’s own shares on the followings terms:
The maximum number of shares to be repurchasedBy virtue of the authorization the Board of Directors is entitled to decide on the repurchase of a maximum of 600,000 Company’s own shares. The authorization shall also contain an entitlement for the Company to accept its own shares as pledge.
The number of shares that can be acquired or held as pledges by the Company on the basis of this authorization shall not exceed one tenth (1/10) of all outstanding shares of the Company.
Directed repurchase and consideration for a shareOwn shares may be repurchased in deviation from the proportion to the holdings of the shareholders with unrestricted equity through trad-ing of the securities on regulated market organized by Nasdaq Helsinki Ltd at the market price of the time of the repurchase provided that the Company has a weighty financial reason thereto.
The shares shall be acquired and paid in accordance with the Rules of Nasdaq Helsinki Ltd and Euroclear Finland Ltd.
Retaining, cancelling and conveyance of the sharesShares may be repurchased to be used as consideration in possible acquisitions or in other arrangements that are part of the Company’s
business, to finance investments, as part of the Company’s incentive program or to be retained, otherwise conveyed or cancelled by the Company.
Other terms and period of validityThe Board of Directors shall decide on other terms of the share repur-chase.
The share repurchase authorization shall be valid until 30 June 2016 and it shall revoke the repurchase authorization given by the Annual General Meeting on 27 March 2014.
On 27 March 2014 the Annual General Meeting authorized the Board of Directors to acquire the Company’s own shares by using unrestricted equity. The maximum amount to be acquired was 600,000 shares. The authorization also contained an entitlement for the Com-pany to accept its own shares as pledge. The number of shares that could be acquired or held as pledges by the Company on the basis of this authorization could not exceed one tenth (1/10) of all outstanding shares of the Company. The authorization was valid until 30 June 2015.
On 27 March 2013 the Annual General Meeting authorized the Board of Directors to issue a maximum of 2,400,000 new shares and convey a maximum of 600,000 own shares. By virtue of the authoriza-tion, the Board of Directors also has the right to grant option rights, con-vertible bonds and/or special rights referred to in Chapter 10, Section 1 of the Companies Act. The authorization is valid until 30 June 2016.
These authorizations have not been exercised during the year.
Exel Composites Plc’s share was quoted on Helsinki Stock Exchange I List from 19 October 1998 to 1 May 2000. As from 2 May 2000, Exel Composites Plc’s share has been quoted on Helsinki Exchange Main List. Exel Composites Plc’s share was split on 21 April 2005. Exel Composites Plc’s share is quoted on Nasdaq Helsinki Ltd’s Nordic List.
Share price (EUR) 2011 2012 2013 2014 2015Average price 8.10 7.05 6.18 6.42 8.65Lowest price 6.75 5.55 5.10 5.56 6.32Highest price 9.40 8.79 6.70 8.80 9.85Share price at the end of financial year 7.65 5.90 5.75 8.39 6.53
Market capitalization, EUR million 91.0 70.2 68.4 99.8 77.7
Share trading 2011 2012 2013 2014 2015Number of shares traded 1,381,139 944,978 2,022,018 5,836,969 2,445,252
% of total 11.6 7.9 17.0 49.1 20.6
Number of shares adjusted for share issuesAverage number 11,896,843 11,896,843 11,896,843 11,896,843 11,896,843Number at end of financial year 11,896,843 11,896,843 11,896,843 11,896,843 11,896,843
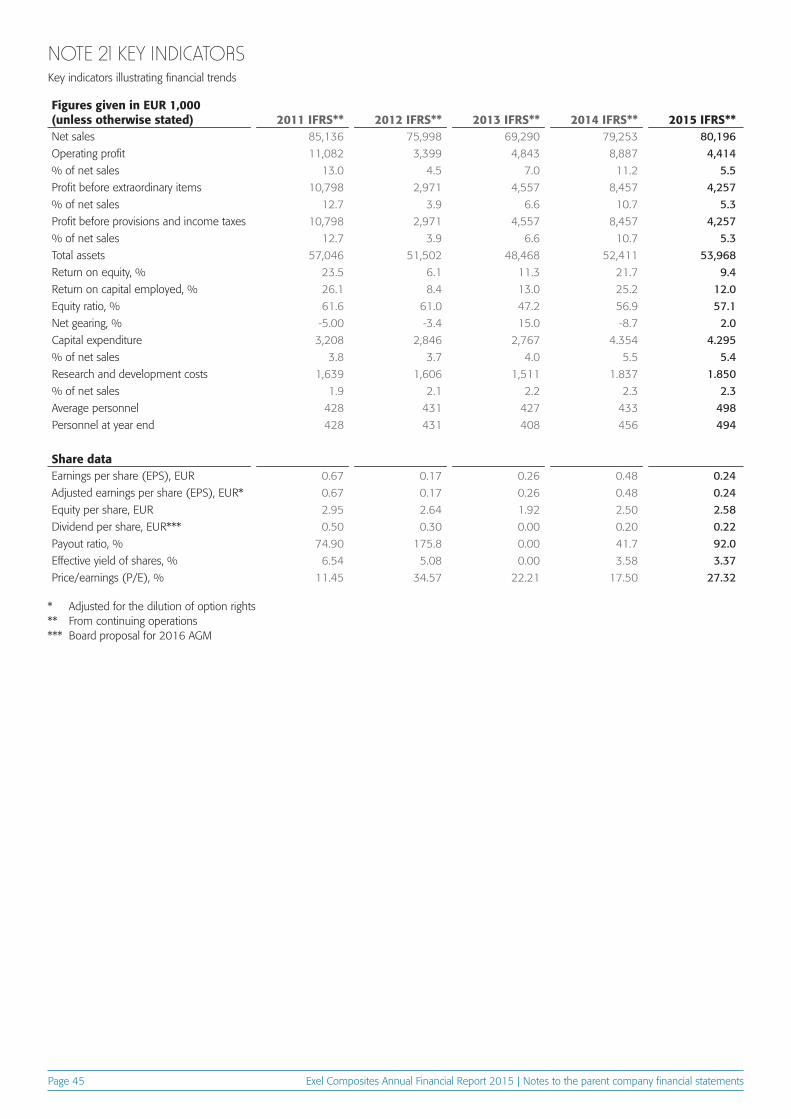
Exel Composites Annual Financial Report 2015 | Notes to the parent company financial statementsPage 45
Figures given in EUR 1,000 (unless otherwise stated) 2011 IFRS** 2012 IFRS** 2013 IFRS** 2014 IFRS** 2015 IFRS**Net sales 85,136 75,998 69,290 79,253 80,196Operating profit 11,082 3,399 4,843 8,887 4,414% of net sales 13.0 4.5 7.0 11.2 5.5Profit before extraordinary items 10,798 2,971 4,557 8,457 4,257% of net sales 12.7 3.9 6.6 10.7 5.3Profit before provisions and income taxes 10,798 2,971 4,557 8,457 4,257% of net sales 12.7 3.9 6.6 10.7 5.3Total assets 57,046 51,502 48,468 52,411 53,968Return on equity, % 23.5 6.1 11.3 21.7 9.4Return on capital employed, % 26.1 8.4 13.0 25.2 12.0Equity ratio, % 61.6 61.0 47.2 56.9 57.1Net gearing, % -5.00 -3.4 15.0 -8.7 2.0Capital expenditure 3,208 2,846 2,767 4.354 4.295% of net sales 3.8 3.7 4.0 5.5 5.4Research and development costs 1,639 1,606 1,511 1.837 1.850% of net sales 1.9 2.1 2.2 2.3 2.3Average personnel 428 431 427 433 498Personnel at year end 428 431 408 456 494
Share dataEarnings per share (EPS), EUR 0.67 0.17 0.26 0.48 0.24Adjusted earnings per share (EPS), EUR* 0.67 0.17 0.26 0.48 0.24Equity per share, EUR 2.95 2.64 1.92 2.50 2.58Dividend per share, EUR*** 0.50 0.30 0.00 0.20 0.22Payout ratio, % 74.90 175.8 0.00 41.7 92.0Effective yield of shares, % 6.54 5.08 0.00 3.58 3.37Price/earnings (P/E), % 11.45 34.57 22.21 17.50 27.32
NOTE 21 KEY INDICATORSKey indicators illustrating financial trends
* Adjusted for the dilution of option rights** From continuing operations*** Board proposal for 2016 AGM
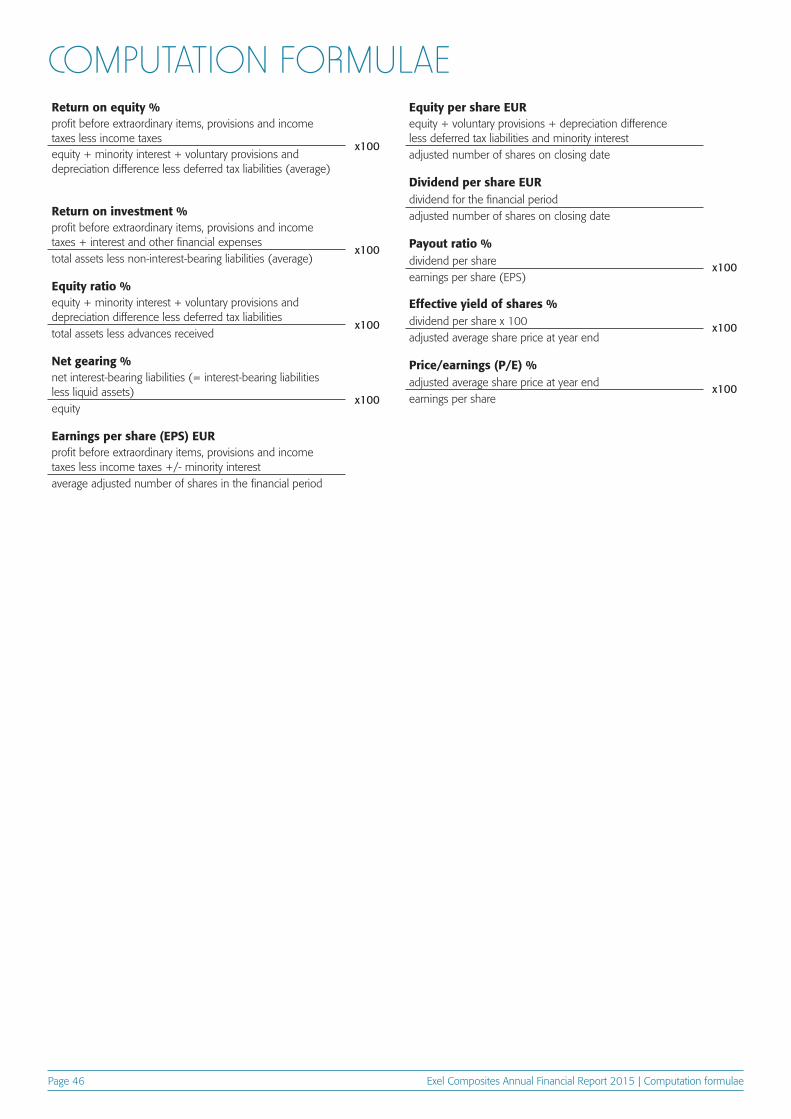
Exel Composites Annual Financial Report 2015 | Computation formulaePage 46
Return on equity %profit before extraordinary items, provisions and income taxes less income taxes
x100equity + minority interest + voluntary provisions and depreciation difference less deferred tax liabilities (average)
Return on investment %profit before extraordinary items, provisions and income taxes + interest and other financial expenses
x100total assets less non-interest-bearing liabilities (average)
Equity ratio %equity + minority interest + voluntary provisions and depreciation difference less deferred tax liabilities
x100total assets less advances received
Net gearing %net interest-bearing liabilities (= interest-bearing liabilities less liquid assets)
x100equity
Earnings per share (EPS) EURprofit before extraordinary items, provisions and income taxes less income taxes +/- minority interestaverage adjusted number of shares in the financial period
Payout ratio %dividend per share x100earnings per share (EPS)
Effective yield of shares %dividend per share x 100 x100adjusted average share price at year end
Price/earnings (P/E) %adjusted average share price at year end x100earnings per share
Equity per share EURequity + voluntary provisions + depreciation difference less deferred tax liabilities and minority interestadjusted number of shares on closing date
Dividend per share EURdividend for the financial periodadjusted number of shares on closing date
COMPUTATION FORMULAE
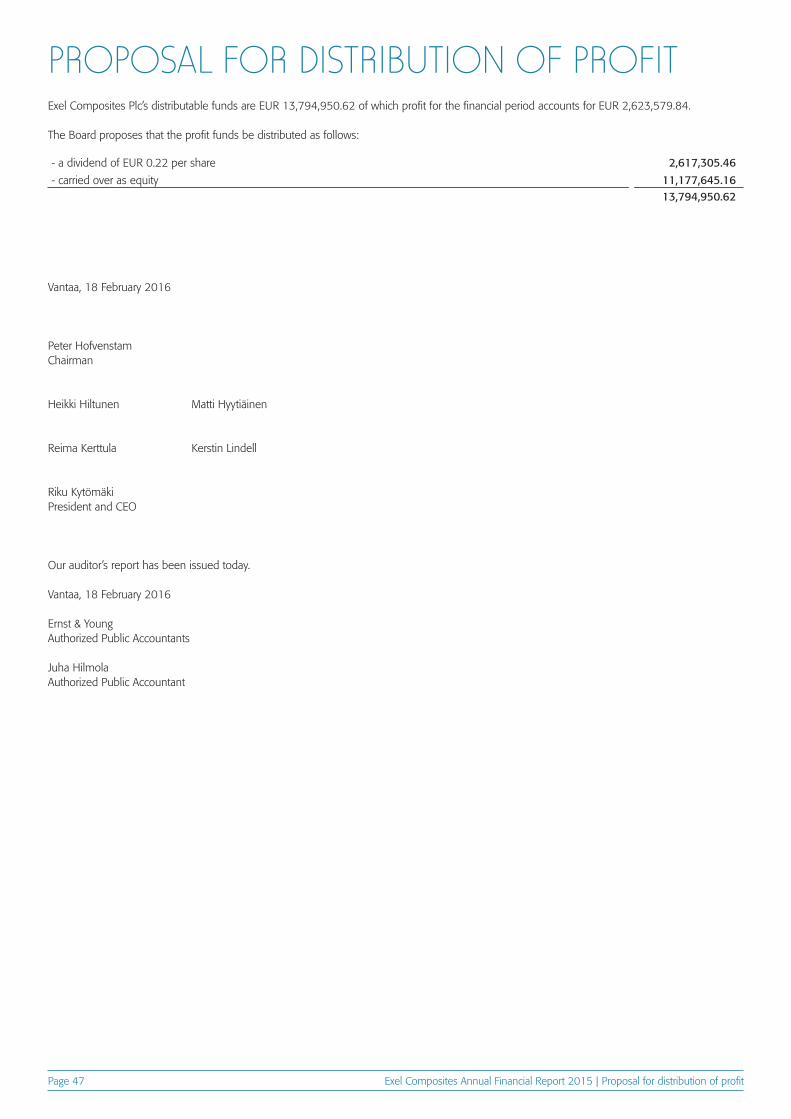
Exel Composites Annual Financial Report 2015 | Proposal for distribution of profitPage 47
Exel Composites Plc’s distributable funds are EUR 13,794,950.62 of which profit for the financial period accounts for EUR 2,623,579.84.
The Board proposes that the profit funds be distributed as follows:
PROPOSAL FOR DISTRIBUTION OF PROFIT
- a dividend of EUR 0.22 per share 2,617,305.46
- carried over as equity 11,177,645.1613,794,950.62
Vantaa, 18 February 2016
Peter HofvenstamChairman
Heikki Hiltunen Matti Hyytiäinen
Reima Kerttula Kerstin Lindell
Riku KytömäkiPresident and CEO
Our auditor’s report has been issued today.
Vantaa, 18 February 2016
Ernst & YoungAuthorized Public Accountants
Juha HilmolaAuthorized Public Accountant
Exel Composites Annual Financial Report 2015 | Auditor's reportPage 48
AUDITOR’S REPORT TRANSLATION
To the Annual General Meeting of Exel Composites Plc We have audited the accounting records, the financial statements, the report of the Board of Directors, and the administration of Exel Composites Plc for the financial period 1.1. - 31.12.2015. The financial statements comprise the consolidated statement of financial position, statement of com-prehensive income, statement of changes in equity and statement of cash flows, and notes to the consolidated financial statements, as well as the parent company’s balance sheet, income statement, cash flow statement and notes to the financial statements.
Responsibility of the Board of Directors and the Managing Director The Board of Directors and the Managing Director are responsible for the preparation of onsolidated financial statements that give a true and fair view in accordance with International Financial Reporting Standards (IFRS) as adopted by the EU, as well as for the preparation of financial statements and the report of the Board of Directors that give a true and fair view in accordance with the laws and regulations governing the preparation of the financial statements and the report of the Board of Directors in Finland. The Board of Directors is responsible for the appropriate arrangement of the control of the company’s accounts and finances, and the Managing Director shall see to it that the accounts of the company are in compliance with the law and that its financial affairs have been arranged in a reliable manner.
Auditor’s ResponsibilityOur responsibility is to express an opinion on the financial statements, on the consolidated financial statements and on the report of the Board of Directors based on our audit. The Auditing Act requires that we comply with the requirements of professional ethics. We conducted our audit in accordance with good auditing practice in Finland. Good auditing practice requires that we plan and perform the audit to obtain reasonable assurance about whether the financial statements and the report of the Board of Directors are free from material misstatement, and whether the members of the Board of Directors of the parent company or the Managing Director are guilty of an act or negligence which may result in liability in damages towards the company or have violated the Limited Liability Companies Act or the articles of association of the company.
An audit involves performing procedures to obtain audit evidence about the amounts and disclosures in the financial statements and the report of the Board of Directors. The procedures selected depend on the auditor’s judgment, including the assessment of the risks of material misstatement, whether due to fraud or error. In making those risk assessments, the auditor considers internal control relevant to the entity’s preparation of financial statements and report of the Board of Directors that give a true and fair view in order to design audit proce-dures that are appropriate in the circumstances, but not for the purpose
of expressing an opinion on the effectiveness of the company’s internal control. An audit also includes evaluating the appropriateness of ac-counting policies used and the reasonableness of accounting estimates made by management, as well as evaluating the overall presentation of the financial statements and the report of the Board of Directors.
We believe that the audit evidence we have obtained is sufficient and appropriate to provide a basis for our audit opinion.
Opinion on the consolidated financial statementsIn our opinion, the consolidated financial statements give a true and fair view of the financial position, financial performance, and cash flows of the group in accordance with International Financial Reporting Stand-ards (IFRS) as adopted by the EU.
Opinion on the company’s financial statements and the report of the Board of DirectorsIn our opinion, the financial statements and the report of the Board of Directors give a true and fair view of both the consolidated and the parent company’s financial performance and financial position in ac-cordance with the laws and regulations governing the preparation of the financial statements and the report of the Board of Directors in Finland. The information in the report of the Board of Directors is consistent with the information in the financial statements.
Opinions based on the decision of the Board of DirectorsWe support that the financial statements should be adopted. The pro-posal by the Board of Directors regarding the use of the profit shown in the balance sheet is in compliance with the Limited Liability Companies Act. We support that the members of the Board of Directors of the parent company and the Managing Director should be discharged from liability for the financial period audited by us.
Vantaa, February 18, 2016
Ernst & Young OyAuthorized Public Accountant Firm
Juha HilmolaAuthorized Public Accountant
ANNUAL FINANCIAL REPORT 2015 Content design and text production: Exel Composites Plc Visual design and production: Suunnittelutoimisto grass business Oy Photograph: Risto Vauras Disclaimer: All forward-looking statements in this Annual Financial Report are based on current expectations and currently known facts. Therefore, they involve risks and uncertainties that may cause actual results to differ materially from results currently expected by the Company.