Birmingham City Council Equality in Employment Monitoring ...

1
Annual Equality Monitoring Report
2017/18

2
Trinity College does not regard Diversity as an end in itself, but as a fact of what we are,
as a core value, and as shaping force of what we do. Diversity is not an ‘initiative’ or a
‘project’; it is an ongoing core process.
Diversity Statement
Trinity is proud to be a university working for the public good […]
Trinity Strategic Plan, 2014-2019
Trinity College Dublin is committed to promoting equality in all aspects of its activity:
employment, education and service provision.
Trinity is committed to non-discrimination for students, staff and service users in relation
to all of the nine grounds specified in equality legislation.
Trinity will seek to identify any barriers to full participation in University life as a student,
staff member or service user, and take action to redress these as appropriate.
Equality Policy
Trinity College’s commitment to Diversity and Inclusion, is at the heart of our
institutional Mission - to provide a liberal environment where independence of thought
is highly valued and where all are encouraged to achieve their full potential, and Vision –
to be known for realising student potential and for research and scholarship that
benefits Ireland and the world.
Strategy for Diversity and Inclusion
3
Scope
This report constitutes a snapshot of the diversity profile of staff and students in Trinity in
the academic year 2017-2018, with particular focus on the nine grounds for discrimination
in Irish equality law1, but also examining other diversity aspects such as socio-economic
background.
The purpose of the Equality Monitoring Report is to provide a basis for targeted action by
the university and its constituent offices to promote equality, diversity and inclusion.
Readers are encouraged to consider actions that may be appropriate to take in their own
area of responsibility, in light of the evidence presented.
1 The grounds for discrimination are age, civil status, disability, ethnicity / nationality, family status, gender, membership of the travelling community, religion, and sexual orientation. This report does not deal with the tenth ground of “housing assistance”, which was introduced to the Equal Status Act in December 2015 and applies to the provision of accommodation only
Trinity seeks to mainstream (i.e. embed) equality in its planning processes so as to
ensure that an equality perspective is incorporated into all University activities and
policies. This will mean taking into account the impact of business, academic or
development strategies on staff, students and service users from across the nine equality
grounds as part of the usual decision-making process.
Equality Policy
We will achieve this objective [C8.2 Equality, Diversity and the Irish Language] by:
embedding the commitment to equality and diversity in all policies and practices […]
Strategic Plan 2014-2019

4
The Relationship with Trinity’s Strategic Goals
Trinity has set specific objectives for equality and diversity in Section C8.2 of the Strategic
Plan 2014-2019, in which the university’s general commitment is also clearly articulated.
Furthermore, Trinity exemplifies its commitment to equality through its Equality Policy and
supporting policies and initiatives, as well as through the Diversity and Inclusion Strategy,
Athena SWAN institutional Gender Action Plan, and HEA Gender Equality Review
Implementation Plan.
The fundamental purpose of this report is to provide an evidence base for strategic action.
Therefore, where a data set is particularly relevant to an existing strategic goal, policy
commitment or statutory obligation, this will be highlighted within the report. This does not
negate the importance of any other theme covered within the report, all of which are
equally protected by our general commitments to equality and diversity.
Commitments to equality and diversity are values on which Trinity’s excellence relies. To
this end we are committed to creating an inclusive, diverse and pluralist college
community and a positive environment in which all can participate, and all are
recognized fully for their contributions. We are committed on all equality grounds to
protecting staff and students from discrimination and to ensuring that diversity is
promoted and celebrated.
Trinity Strategic Plan 2014-2019
5
New Features of the Report
Equality Monitoring Reports have been published by Trinity on an annual basis since
2006/07 and all previous reports are available online2.
The content of the Annual Equality Monitoring Report is amended each year, taking account
of feedback and new information requirements. New features in this year’s report include:
More national comparative data (including Census 2016 results and AHEAD figures
on students with disabilities)
Gender of Students’ Union leaders
Gender of Entrance Exhibition Award recipients
More detailed breakdown of Medical Academic grades
Gender representation on academic recruitment panels
Gender representation on promotion and progression committees
Senior academic promotion application rates by gender, based on eligible cohort
Gender of USSHER Assistant Professor intake
Gender of PI and student recipients of Provost’s PhD Project Awards
Appendix on the relative speed of career progression of male and female academics
(detailed report by HR Workforce Planning)
Ongoing efforts are being made to expand the Student Report to a comparable level of
detail as is presented in the Staff Report. To this end, Academic Registry are now
represented in the Equality Monitoring Advisory Group.
2 See http://www.tcd.ie/equality/equality-in-trinity/reports.php

6
Acknowledgements
Membership of the Monitoring Advisory Group 2017/18
Clodagh Byrne (Mature Students’ Officer)
Aoife Crawford (Equality Officer)
Luke Fitzgerald (Activity Lead, Academic Registry)
Paula Kennedy-Hogan (Deputy Director, Human Resources)
Claire Marshall (Programme Manager, TCGEL)
Tony McMahon (Director of Diversity & Inclusion)
Caroline Morgan (Office Manager, Disability Service)
Authors of Gender Career Path appendix
Grace Bosonnet (Workforce Planning Officer)
Gwen Turner (Workforce Planning Manager)
Other Acknowledgements
The assistance of the following in preparing this report is greatly appreciated:
Academic Registry
Dean of Research’s Office
Disability Service
Equality Committee
Human Resources
Higher Education Authority
Mature Students’ Office
Provost’s Office
Secretary’s Office & Committee Secretaries
Trinity Access Programmes
Trinity Centre for Gender Equality and Leadership (TCGEL)
Vice-Provost’s Office
7
Contents
Scope .......................................................................................................................................... 3
The Relationship with Trinity’s Strategic Goals ..................................................................... 4
New Features of the Report .................................................................................................. 5
Acknowledgements .................................................................................................................... 6
Membership of the Monitoring Advisory Group 2017/18 .................................................... 6
Authors of Gender Career Path appendix ............................................................................. 6
Other Acknowledgements ..................................................................................................... 6
Key Findings ............................................................................................................................. 13
Age ....................................................................................................................................... 14
Civil Status ............................................................................................................................ 14
Disability ............................................................................................................................... 14
Ethnicity ............................................................................................................................... 15
Family Status ........................................................................................................................ 15
Gender ................................................................................................................................. 16
Students ........................................................................................................................... 16
Staff: Representation ....................................................................................................... 16
Staff: Employment Conditions ......................................................................................... 16
Academic Staff ................................................................................................................. 17
Research and Professional Staff ...................................................................................... 17
Competitive Processes ..................................................................................................... 18
Nationality / Country of Domicile ........................................................................................ 19
Religion................................................................................................................................. 19
Sexual Orientation ............................................................................................................... 20
Socio-economic Background ................................................................................................ 20
8
Data Notes ............................................................................................................................... 21
Diversity Detail ..................................................................................................................... 21
Student Report ........................................................................................................................ 22
Overview .............................................................................................................................. 22
Age ....................................................................................................................................... 23
Undergraduate ................................................................................................................. 23
Postgraduate .................................................................................................................... 23
Country of Domicile ............................................................................................................. 25
Countries .......................................................................................................................... 25
Continents ........................................................................................................................ 26
Disability ............................................................................................................................... 28
Total Registration ............................................................................................................. 28
Level of Study ................................................................................................................... 29
Gender ............................................................................................................................. 29
Faculty .............................................................................................................................. 30
Type of Disability .............................................................................................................. 30
Ethnicity ............................................................................................................................... 31
National Comparison ....................................................................................................... 32
Gender ..................................................................................................................................... 33
Overview .......................................................................................................................... 33
Level of Study ................................................................................................................... 33
Faculty .............................................................................................................................. 34
Attainment ....................................................................................................................... 35
Leadership Roles .............................................................................................................. 36
Mature Students .................................................................................................................. 38

9
Overview .......................................................................................................................... 38
Applicants & Entrants ...................................................................................................... 38
Faculty .............................................................................................................................. 40
Gender ............................................................................................................................. 40
Age ................................................................................................................................... 41
Socio-economic Background ................................................................................................ 42
Trinity Access Programmes .................................................................................................. 43
Overview .......................................................................................................................... 43
Gender ............................................................................................................................. 44
Age ................................................................................................................................... 44
Faculty .............................................................................................................................. 44
Attainment ....................................................................................................................... 45
Staff Report ............................................................................................................................. 46
Overview .............................................................................................................................. 46
Age ....................................................................................................................................... 47
Academic Staff ................................................................................................................. 48
Schools ............................................................................................................................. 48
Civil Status ............................................................................................................................ 50
Disability ............................................................................................................................... 51
Ethnicity ............................................................................................................................... 53
Diversity Detail ................................................................................................................. 53
National Comparison ....................................................................................................... 54
Gender ................................................................................................................................. 55
Overview .......................................................................................................................... 55
Decision-making Bodies ................................................................................................... 56
10
Contract Types ................................................................................................................. 62
Leave ................................................................................................................................ 63
Research ........................................................................................................................... 65
Library .............................................................................................................................. 66
Administration ................................................................................................................. 67
Technical .......................................................................................................................... 69
Support............................................................................................................................. 70
Academic .......................................................................................................................... 71
Fellows ............................................................................................................................. 77
Recruitment ..................................................................................................................... 79
Promotions ....................................................................................................................... 87
Research Grants ............................................................................................................... 94
Provost’s PhD Project Awards.......................................................................................... 94
Nationality ............................................................................................................................ 95
Academic Staff ................................................................................................................. 95
Professional & Research Staff .......................................................................................... 98
Religion............................................................................................................................... 100
Diversity Detail ............................................................................................................... 100
National Comparison ..................................................................................................... 100
Sexual Orientation ............................................................................................................. 102
Recruitment Equality Monitoring ...................................................................................... 103
Age ................................................................................................................................. 103
Civil Status ...................................................................................................................... 105
Country of Origin............................................................................................................ 106
Disability ......................................................................................................................... 107

11
Ethnic Origin ................................................................................................................... 108
Family Status .................................................................................................................. 109
Religion........................................................................................................................... 110
Sexual Orientation ......................................................................................................... 111
Appendix: Examining the Academic Career Path .................................................................. 112
Section 1: Overview ........................................................................................................... 113
1.1 Introduction ............................................................................................................. 113
1.2 Evaluation ................................................................................................................ 113
1.3 Findings .................................................................................................................... 113
1.4 Conclusions .............................................................................................................. 114
Section 2: Current Position and Trend ............................................................................... 114
2.1 Academic Career Path .............................................................................................. 114
2.2 Current Gender Distribution per Grade ................................................................... 115
2.3 Trend - Gender Distribution per Grade 2012-2018 ................................................. 116
Section 3: Examining the Causes ....................................................................................... 117
3.1 Glass Ceiling ............................................................................................................. 117
3.2 Career Progress ........................................................................................................ 117
3.3 Pace of Progress along Academic Career Path ........................................................ 118
3.4 Promotion rates ....................................................................................................... 119
3.5 Reaching a career plateau ....................................................................................... 120
3.6. Cultural Legacy ........................................................................................................ 121
Section 4: Dataset Caveats................................................................................................. 123
4.1 Caveats on the Appendix Dataset ............................................................................ 123
Bibliography ........................................................................................................................... 124
Definitions .............................................................................................................................. 126

12
Acronyms ............................................................................................................................... 129
List of Figures ..................................................................................................................... 130
List of Tables ...................................................................................................................... 135
13
Key Findings3
[…] While we celebrate our inclusive ethos and tradition, we recognise also that we always
have room for improvement and that our future success will depend on its ongoing renewal
through our people and our actions.
Trinity Diversity Statement
This report shows the great diversity that exists in Trinity College Dublin, examining a wide
range of data about staff and students, through which progress towards equality can be
measured. It is the considered opinion of the authors that this progress must be measured
not only against the existing proportions in the Irish university sector, but also against
Trinity’s own strategic goals and policy commitments. A diverse community in which all have
equal opportunity to achieve their full potential is core to the success of the university’s
mission.
The data show that progress is being made towards more equal and diverse representation
in many areas, and the whole university community is to be commended for this. Change is
slow or stalled in some areas, however, so further work is still required. While several
offices exist within Trinity which work specifically to promote equality, diversity and
inclusion, true equality can only be achieved when all members of the Trinity community
uphold it by their actions. It is therefore hoped that this monitoring report will be used
above all as an evidence base on which concrete steps will be taken - in central offices,
university governance, local departments and Schools, and student bodies.
Comments or queries relating to the Annual Equality Monitoring Report are welcome at
3 All findings are expressed in present tense for the sake of readability; full detail is given in the body of the report

14
Age
5.6% of Trinity students are mature students4
In terms of Faculty, mature students5 most commonly take AHSS courses (219
students) and are less likely to take EMS courses (65 students)
30% (1,202) of Trinity staff are in their thirties, and 9% (325) are in their sixties
Academic staff are older than other staff, on average. For example, 12% (129) of
academic staff are in their sixties
Just 2% of recruitment applicants are over 606
Recruitment applicants aged 36-40 are the most successful, representing 16% of
total applicants and 21% of successful applicants
Civil Status
The civil status of students is not recorded
48% (1889) of staff are single, and 44% (1730) are married. Other categories have
very small representation and it is likely that some selecting “single” could equally
choose another category; in the Equality Monitoring Form on e-Recruitment, where
an “other” option is available, 31% of applicants selected it
Disability
8.6% (1551) of students are registered with the Disability Service; undergraduates
(1352) and men (685) are over-represented among this total
The most common type of disability among students is Specific Learning Difficulty
(including dyslexia) (23%, 362 students), followed very closely by mental health
conditions (23%, 361 students)
4 i.e. they have entered Trinity via the Mature Student Dispensation Scheme or other entrance routes to Nursing and Midwifery courses 5 Not including mature students in Nursing and Midwifery 6 This figure is based on voluntary completion of the Equality Monitoring Form on e-Recruitment

15
Students with disabilities are most likely to take courses in AHSS (42%, 646 students)
2.9% of Trinity staff have declared a disability; the true figure may be higher
Ethnicity
79% of new entrant students are White Irish7; 12% of another White ethnicity (plus 3
Irish Travellers); and 9% of other ethnicities (5% Asian / Chinese, 2% Black / African,
and 2% Other)
No reliable data on staff ethnicity are available. Diversity Details8 suggest that 68% of
staff are White Irish, 24% of other White ethnicity and 8% of other ethnicities
White Irish applicants are the most successful in recruitment competitions,
representing 57% of total applicants and 80% of successful applicants. Other White
applicants are relatively unsuccessful, representing 29% of total applicants and 13%
of successful applicants
Family Status
The family status of students and of staff is not recorded
65% of recruitment applicants have no caring responsibilities, 25% are the parent of
a person under 18, 0.1% are the resident primary carer of a person with a disability
and 10% are “other”9
There is no significant difference in recruitment success rates based on family status
7 These data come from voluntary completion of the HEA Equal Access Survey by new entrants at registration 8 Diversity Detail is an optional module in CorePortal (11% completion rate for the ethnicity section) 9 This figure is based on voluntary completion of the Equality Monitoring Form on e-Recruitment

16
Gender
Students
59% (10,688) of students are female, broken down to 59% (7,624) female at
undergraduate level, and 61% (3,022) at postgraduate level
HS is 76% (3,230) female, AHSS is 62% (4,529) female and EMS is 61% (2,902) male
Entrance Exhibition Award recipients are 58% (259) female, new Scholars are 53%
(29) female, and Gold Medallists are 58% (80) male
62% (77) of Society Chairs are male, the GSU Executive is 53% male, and the SU
Union Forum is 52% male. The CSC Chair and (G)SU Presidents are male
Staff: Representation
55% (2,161) of staff are female
Women make up 48% (13) of Board, 52% (17) of Council, and 40% (6) of EOG. Each
of these bodies is trending towards greater female representation, although female
representation on EOG has reduced from 46% in 2016
The overall membership of all Committees of Board and Council is 55% male, 45%
female, and the 14 Chairs are perfectly gender-balanced. One committee is more
than 60% female, and six committees are more than 60% male
Faculty Executive Committees reflect the gender of their academic staff, with HS
being 59% (10) female, AHSS 50% (10) of each, and EMS 79% (11) male
Staff: Employment Conditions
76% (534) of part-time staff are female
56% (1,233) of permanent staff, and 54% (890) of temporary staff, are female

17
Academic Staff
55% (592) of academic staff are male
48% (270) of Assistant Professors, but 28% (27) of Chair Professors, are women
Female representation at Chair Professor level has risen from 12% in 2008
Academic staff are 53% (195) male in AHSS, 66% (140) female in HS and 76% (243)
male in EMS; female representation declines towards more senior academic grades
in AHSS and HS, but not EMS
Two Schools are over 60% female (in terms of academic staff), 9 Schools are over
60% male and the remaining 13 are within a 60/40 split
33% (84) of Fellows are women; female representation has risen from 21% in 2010
Research and Professional Staff
Research staff are well gender-balanced (52% / 461 male), although there are more
men (306 / 54%) among Research Fellows than Research Assistants (155 / 48%)
Library staff are 68% (100) female, and all grades are majority female
Administrative staff are 72% (778) female, but female representation decreases from
84% (253) female at Executive Officer to 47% female (7) at Senior Admin 1
Technical staff are 64% (96) male, and all grades are majority male
Support staff are 51% (276) female overall, with significant gender imbalance in
different areas. The male-dominated areas are Grounds (92% / 12), Premises (90% /
64), Stores (83% / 5), and Security and Attendants (78% / 124). The female-
dominated areas are Nursery (100% / 16), Housekeeping (81% / 181), and Catering
(67% / 34)
Of 20 administrative / service departments, 14 are over 60% female, 4 are within a
60/40 split and 2 are over 60% male

18
Competitive Processes
68% of applicants for appointment to academic roles are male, but female applicants
have a significantly higher success rate (5%) than male applicants (2%), leading to
very nearly equal academic appointments overall (51% female, 49% male)
Male and female success rates are very similar (3.7% and 4% respectively) in
professional recruitment overall, but the female success rate is significantly higher
than the male in AHSS (8% versus 3%) and HS (15% versus 7%)
34% of research grant applications from Trinity staff are made by women, and male
and female applicants have equal success rates (34%)
Applicants for Senior Academic Promotion are 60% (47) male, and those promoted
are 63% (22) male. The female success rate (42%) is a little lower than the male
(47%)
Promotions to Chair Professor are precisely gender-balanced (2 men and 2 women),
and promotions to Professor are nearly so (4 men and 5 women)
Promotions to Associate Professor, however, are 73% male (16) despite the eligible
cohort being 54% male (163). The female application rate (8%) to this grade is about
half that of the male application rate (15%)
Success rates are very similar for male applicants (56%) and female applicants (53%)
in Junior Academic Progression
Women are 76% of applicants and 82% of those promoted in Administrative and
Library promotions; the female success rate (36%) is higher than the male (25%)
Women predominate throughout Secretarial and Executive promotion applicants
(87% female) and promoted (84% female), but male applicants have a somewhat
higher success rate (75%) than female applicants (58%)
The majority of applicants (79%) and those promoted (81%) in Technical promotions
are male; the male success rate (65%) is higher than the female (57%).
Library promotion applicants are 54% female and those promoted are 64% female.
There were small numbers in this cohort and just two applicants (both male) were
unsuccessful, by reason that their applications were not in scope.
19
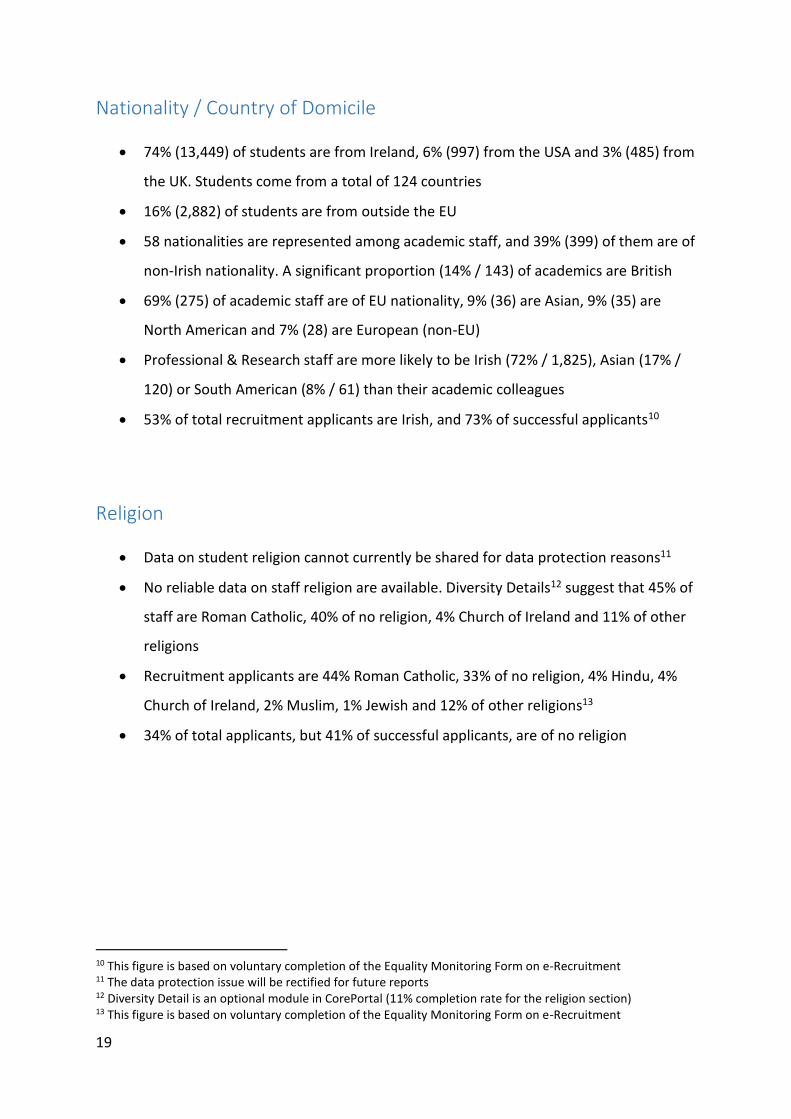
Nationality / Country of Domicile
74% (13,449) of students are from Ireland, 6% (997) from the USA and 3% (485) from
the UK. Students come from a total of 124 countries
16% (2,882) of students are from outside the EU
58 nationalities are represented among academic staff, and 39% (399) of them are of
non-Irish nationality. A significant proportion (14% / 143) of academics are British
69% (275) of academic staff are of EU nationality, 9% (36) are Asian, 9% (35) are
North American and 7% (28) are European (non-EU)
Professional & Research staff are more likely to be Irish (72% / 1,825), Asian (17% /
120) or South American (8% / 61) than their academic colleagues
53% of total recruitment applicants are Irish, and 73% of successful applicants10
Religion
Data on student religion cannot currently be shared for data protection reasons11
No reliable data on staff religion are available. Diversity Details12 suggest that 45% of
staff are Roman Catholic, 40% of no religion, 4% Church of Ireland and 11% of other
religions
Recruitment applicants are 44% Roman Catholic, 33% of no religion, 4% Hindu, 4%
Church of Ireland, 2% Muslim, 1% Jewish and 12% of other religions13
34% of total applicants, but 41% of successful applicants, are of no religion
10 This figure is based on voluntary completion of the Equality Monitoring Form on e-Recruitment 11 The data protection issue will be rectified for future reports 12 Diversity Detail is an optional module in CorePortal (11% completion rate for the religion section) 13 This figure is based on voluntary completion of the Equality Monitoring Form on e-Recruitment
20
Sexual Orientation
Sexual orientation of students is not recorded
No reliable data on staff sexual orientation are available. Diversity Details14 suggest
that 89% of staff are heterosexual, 9% gay or lesbian, 1% bisexual and 1% other
Recruitment applicants are 90% heterosexual, 4% gay or lesbian, 3% bisexual and 3%
other15. Successful recruitment applicants are 94% heterosexual and 1% other
Socio-economic Background
Socio-economic background of staff is not recorded
The most common socio-economic background of new entrants is “Employers and
Managers” (24% of new entrants), followed closely by “Higher Professional” (22% of
new entrants)
8% (1,016) of undergraduates are TAP students. There were 273 entrants to Trinity
via TAP in 2017, the highest number to date
TAP students are most likely to enter AHSS courses (45% / 452 TAP students)
The progression rate from Foundation to Undergraduate programmes is 97%
The degree completion rate of TAP students is 87%
The most common degree grade awarded to TAP students is 2:1 (52% / 93 of TAP
graduates)
14 Diversity Detail is an optional module in CorePortal (10% completion rate for the sexual orientation section) 15 This figure is based on voluntary completion of the Equality Monitoring Form on e-Recruitment
21
Data Notes
The following data are derived from many stakeholders throughout Trinity, who use diverse
systems of data management and who each process data for their own purposes as well as
equality monitoring. While staff in many offices work hard to provide the necessary
statistics for this report, some limitations are inevitably present.
For example, where data sets are so small that they may foreseeably identify an individual,
they may be omitted. Other small data sets are provided but should be analysed with
caution as their percentage weightings may not be representative. There are also some
limits inherent in categorisation, such as the fact that all staff and students are recorded as
either male or female, which does not satisfactorily describe all gender identities. Data
provided from different sources, at different times, may not be directly comparable. Some
data sources come from outside organisations with different collection methods; some of
the data sources are voluntary and therefore cannot definitively report on the entire
population concerned. These broad points should be borne in mind when considering the
data in this report.
Further specific data details are provided in the footnotes throughout the report. Original
data tables can be provided by the Equality Office on request. Unless otherwise specified:
Staff data are from CoreHR reports, downloaded on 31 May 2018
Student data are from Academic Registry, from March 2018 return to the HEA
2016 Census data are from the Central Statistics Office website
Trend graphs are compiled using previous Annual Equality Monitoring Reports
Diversity Detail
Staff may voluntarily complete the “Diversity Detail” section of their personnel profile on
Core Portal. Completion rates are currently low but the results are provided within the
report as a preliminary indication of the type of findings which are possible using this
information, once a reliable completion rate is achieved. Managers are invited to encourage
their staff to complete the profile to inform future reports. Further information is available
at http://www.tcd.ie/equality/reports/annual-equality-monitoring-reports/#detail

22
Student Report
Overview
There are 18,081 students in Trinity. Almost 3 in 4 (72%) of Trinity students are
undergraduates, and the vast majority (89%) are enrolled full-time. Part-time students make
up 9% of the student population, and just 0.5% of students are online16.
Figure 1: Level of Study and Mode of Attendance - All Students (2018)
Across Irish universities, 13% of enrolments in 2016/17 were part-time17, and 3% were
remote (online) learning, so Trinity’s proportion of part-time and online students is below
the (university) sectoral average.
Trinity Universities Difference
Full-time 90% 84% +6%
Part-time 10% 13% -4%
Remote 1% 3% -2% Table 1: Mode of Attendance, Comparison of Trinity Students (2018) and University Enrolments (2016/17)
16 Alternative attendance options such as part-time and distance learning allow greater access to higher
education by people with disabilities, older people, people with caring responsibilities and people who are socio-economically disadvantaged
17 Source: Higher Education Key Facts and Figures 2016/17, HEA, p6
72%(13025)
28% (4994)
0.3%(62)
Level of Study
Undergraduate
Postgraduate
Foundation
89%(16082)
9%(1705)
0.8%(149) 0.5%
(99) 0.3%(46)
Mode of Attendance
Full-Time
Part-Time
Validated forAnotherInstitution
On-line

23
Age
Undergraduate
The vast majority (85%) of undergraduate students are younger than 20 at the point of entry
to Trinity. A significant percentage (10%) are aged 21 – 25 (inclusive). Only 5% are over the
age of 25, and percentage representation drops with each older age bracket.
The oldest undergraduate student was 72 at point of entry.
Across the entire higher education sector, in 2016/17, 5% of undergraduate new entrants
were aged 30 and over18. This compares with 3.2% of undergraduate new entrants being 31
or over in Trinity in 2017/18.
Figure 2: Age of Undergraduate Students at Point of Entry (2018)
Postgraduate
Postgraduate students are much less likely to be under 21 (1% of postgrads), for obvious
reasons, and a large percentage (43%) of them are aged 21 – 25, presumably enrolling soon
after completing their undergraduate studies.
18 Source: Higher Education Key Facts and Figures 2016/17, HEA, p3
85% (11075)
10% (1242)
2% (247)
1% (164)
0.7% (97)
0.6% (82)
0.3% (43)
0.2% (30)
0.2% (25)
0.1% (10)
0.1% (9)
0 2000 4000 6000 8000 10000 12000
16-20
21-25
26-30
31-35
36-40
41-45
46-50
51-55
56-60
61-65
>65
Number of Undergraduate Students
Age
on
En
try
Age of Undergraduate Entrants
24
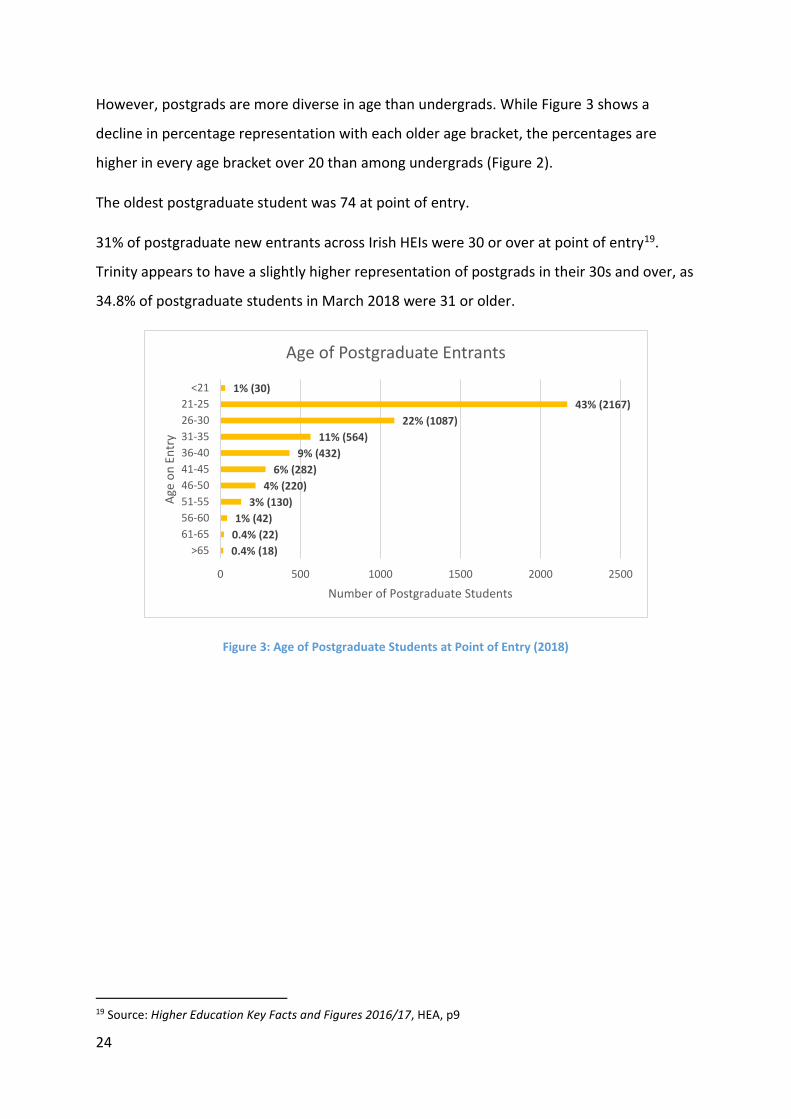
However, postgrads are more diverse in age than undergrads. While Figure 3 shows a
decline in percentage representation with each older age bracket, the percentages are
higher in every age bracket over 20 than among undergrads (Figure 2).
The oldest postgraduate student was 74 at point of entry.
31% of postgraduate new entrants across Irish HEIs were 30 or over at point of entry19.
Trinity appears to have a slightly higher representation of postgrads in their 30s and over, as
34.8% of postgraduate students in March 2018 were 31 or older.
Figure 3: Age of Postgraduate Students at Point of Entry (2018)
19 Source: Higher Education Key Facts and Figures 2016/17, HEA, p9
1% (30)
43% (2167)
22% (1087)
11% (564)
9% (432)
6% (282)
4% (220)
3% (130)
1% (42)
0.4% (22)
0.4% (18)
0 500 1000 1500 2000 2500
<21
21-25
26-30
31-35
36-40
41-45
46-50
51-55
56-60
61-65
>65
Number of Postgraduate Students
Age
on
En
try
Age of Postgraduate Entrants

25
Country of Domicile
Countries
74% of students are from Ireland20, and 26% are international21. Students come from a total
of 124 countries (including Ireland).
The USA continues to be the most common country of domicile after Ireland, and more than
twice as many students are arriving from the USA than from Great Britain.
Figure 4: Ten Most Common Student Countries of Domicile excluding Ireland (2018)
Table 2 (overleaf) shows these countries of domicile first as a percentage of the total
student population, and then as a percentage of international students. Over one in five
international students are from the USA, or 6% of all students.
20 “Ireland” is here defined as the whole island of Ireland; so students from Northern Ireland are counted in the Ireland figures, and students from all other parts of the UK are counted under Great Britain (GB) 21 i.e. from a country of domicile other than Ireland
997
485404
341268 253 239 199 163
122
0
200
400
600
800
1000
1200
Nu
mb
er o
f St
ud
ents
Student Country of Domicile

26
Number of students % of all students
% of international students
USA 997 6% 22%
GB 485 3% 10%
India 404 2% 9%
France 341 2% 7%
China 268 1% 6%
Germany 253 1% 5%
Singapore 239 1% 5%
Canada 199 1% 4%
Italy 163 0.9% 4%
Malaysia 122 0.7% 3% Table 2: Ten Most Common Student Countries of Domicile excluding Ireland, with Percentages (2018)
Continents
Eighty-four% of students are from the EU. Significant proportions of students come from
Asia (7%) and North America (7%). Just 2% of students (total) come from other continents.
Figure 5: Student Country of Domicile by Continent (2018)
1519984%
12897%
12197%
1410.8%
970.5%
760.4%
600.3% Student Country of Domicile
Europe EU
Asia
America North
Europe non EU
Africa
America South
Oceania

27
The data in table 322 are not directly comparable as the Trinity data relates to all registered
students in March 2018, while the sectoral data relates to new entrants across the sector in
2016/17.
However, the differences are significant enough to suggest that Trinity does indeed have a
more international student population than the sectoral average, with 16% of its students
coming from outside the EU as compared with 4% of new entrants across HEIs.
Trinity All HEIs Difference
Europe EU 84% 96% -12%
Asia 7% 2% +5%
America North 7% 1% +6%
Europe non-EU 0.8% 0.1% +0.7%
Africa 0.5% 0.3% +0.2%
America South 0.4% 0.04% +0.4%
Oceania 0.3% 0.05% +0.3% Table 3: Country of Domicile, Comparison of Trinity Students (2017/18) with all HEI New Entrants (2016/17)
22 Source: Higher Education Key Facts and Figures 2016/17, HEA, p5

28
Disability23
Trinity College, the University of Dublin is committed to ensuring that
students with a disability have as complete and equitable access to all
facets of Trinity life as can reasonably be provided […]
Trinity Code of Practice for Students with Disabilities
Total Registration
The number and percentage of students registered
with the Disability Service (DS) continues to rise. In
April 2018, 8.6% of the total student population –
over 1,500 students - were registered with the DS.
This suggests that Trinity is meeting the national
target (8%) for new entrants. Trinity’s representation of students with disabilities is above
average; students with disabilities make up 5.7% of the total student population in Irish
higher education, and 5.2% of the total student population in Irish universities24.
23 Source for data in this section: Disability Service, received May 2018 24 Source: Number of Students with Disabilities Studying in Higher Education in Ireland 2016/17, Association for Higher Education Access and Disability (AHEAD), p12
3.6%(585)
4.2%(685)
4.9%(818)
5.4%(911)
6.4%(1058)
7.1%(1186)
7.7%(1313)
7.6%(1299)
7.7%(1364)
8.6%(1551)
0%
2%
4%
6%
8%
10%
12%
08/09 09/10 10/11 11/12 12/13 13/14 14/15 15/16 16/17 17/18
% o
f A
ll St
ud
ents
Trend in % of Students Registeredwith the Disability Service
National Access Plan target
8% of new entrants across all HEIs
to be people with disabilities

29
Figure 6: Trend in Percentage of Students Registered with the Disability Service (2008/09 - 2017/18)
Level of Study
While 10% of undergraduates are registered with the DS, just 4% of postgraduates are. A
similar pattern is observed at the sectoral level; 6.4% of undergraduate students but just
2.6% of postgraduate students in higher education in Ireland have a disability25.
Figure 7: Percentage of Undergraduate and Postgraduate Students Registered with the DS (2018)
Gender
44% of students registered with the DS are
male. While this is a minority of students
registered with the DS, it indicates that male
students are more likely to be registered with
the DS as men make up just 41% of the total
student population (see Figure 12).
Figure 8: Gender Representation in Students Registered with the Disability Service (2018)
25 Source: Number of Students with Disabilities Studying in Higher Education in Ireland 2016/17, Association for Higher Education Access and Disability (AHEAD), p13
10% (1352) 4% (199)
90%(11673)
96%(4795)
0%
10%
20%
30%
40%
50%
60%
70%
80%
90%
100%
Undergraduate Postgraduate
% o
f St
ud
ents
at
Leve
l of
Stu
dy
Students Registered with the DSby Level of Study
Non-DS
DS
56%(866)
44%(685)
Gender Representation in DS-Registered Students
Female
Male

30
Faculty
DS-Registered students are more likely to be
enrolled on a course in AHSS (42% of DS-
registered students) than in EMS (24%), HS
(22%) or multi-Faculty courses (13%).
Figure 9: Students Registered with the Disability Service by Faculty (2018)
Type of Disability
Specific Learning Difficulty (SLD)26 remains the most common primary disability cited by DS-
registered students, although Mental Health conditions are now an extremely close second.
Nationally, SLD is also the most common disability (41.4% of students with disabilities have
an SLD) and Mental Health conditions are the second most common (making up 13.9% of
students with disabilities)27. However it will be noted that Trinity has a much lower relative
representation of SLD, and higher representation of Mental Health conditions.
Figure 10: Representation of Disabilities among Students Registered with the Disability Service (2018)
26 Specific Learning Difficulty includes dyslexia, dyscalculia and dysgraphia. 27 Source: Number of Students with Disabilities Studying in Higher Education in Ireland 2016/17, Association for Higher Education Access and Disability (AHEAD), p21
23% (362)
23% (361)
16% (245)
8% (119)
7% (107)
7% (104)
6% (94)
5% (71)
3% (40)
2% (31)
0.6% (10)
0.5% (7)
0% 5% 10% 15% 20% 25% 30%
Specific Learning Difficulty
Mental Health
Significant Ongoing Illness
ADHD or ADD
DCD / Dyspraxia
Physical Disability
Autistic Spectrum
Neurological
Deaf / Hard of Hearing
Blind / Visual Disability
Intellectual Disability
Speech Language & Communication Disorders
Disability Type of DS-Registered Students
42%(646)
24%(365)
22%(339)
13%(201)
0%
10%
20%
30%
40%
50%
AHSS EMS HS Multi
Faculty of DS-Registered Students

31
Ethnicity
Four out of five undergraduate
new entrants are White Irish.
The next most common
ethnicity is Other White Background (12% of new entrants), followed by Asian (5% of new
entrants). Black and Other new entrants make up 2% of the total each.
Three new entrants were Irish Travellers in 2016/17, i.e. roughly 1 in 1,000 new entrants28.
As there are 26 HEIs in Ireland, 3 is almost exactly the number of Traveller students one
would expect to find among Trinity undergraduate entrants if the National Access Plan
target were to be reached by each HEI having equal numbers of students from the Traveller
community. However, Trinity is one of the largest HEIs in the country and Travellers may
therefore be under-represented among our students, relative to other HEIs.
Figure 11: Ethnicity of Undergraduate New Entrants (HEA Equal Access Survey) 2016/17
28 Source: HEA Equal Access Survey 2016/17. This is a voluntary survey offered to undergraduate new entrants at initial registration. 96% (2,631) of undergraduate new entrants in Trinity completed the ethnicity question
2,06579%
30412%
1405%
602%
592%
30.001%
Ethnicity of Undergraduate Entrants
Irish
White (not Irish)
Asian (incl. Chinese)
Other
Black (incl. African)
Irish Traveller
National Access Plan target
80 Irish Traveller new entrants across all HEIs

32
National Comparison
In relation to the population of Ireland, Trinity has fewer White Irish and Traveller students
than might be expected, but more Asian (including Chinese) students and more students of
other White background. Representation of Black (including African) and other ethnicities is
broadly in line with the national census.
Census Trinity Students Difference
White (Irish) 84% 79% -5%
White Any Other Background 10% 12% +2%
Asian/Asian Irish Any Other Background 2% 3% +1%
Other Including Mixed Background 2% 2% 0%
Black/Black Irish (African) 1% 2% +1%
White Irish Traveller 0.7% 0.001% -0.7%
Asian/Asian Irish (Chinese) 0.4% 2% +2%
Black/Black Irish Any Other Background 0.1% 0.2% -0.8% Table 4: Ethnicity of Students from HEA Equal Access Survey (2016/17), Comparison with Census 2016

33
Gender29
Overview
The gender representation of students in 2017/18 is 59% female (10,688), 41% male (7,393).
This has been highly consistent for several years, as illustrated in Figure 12. Female
representation among undergraduate entrants to Irish universities in 2016/17 was 57%30.
Figure 12: Trend in Gender Representation among Total Students (2007/08-2017/18)
Level of Study
Female students outnumber male
students at every level of study. The
female majority increases slightly
from Foundation to Undergraduate,
and from Undergraduate to
Postgraduate – 61 % of postgraduate
students are female.
Figure 13: Gender of Students at each Level of Study (2018)
29 Please see the Staff Report (p93) for gender of PhD students funded by Provost’s PhD Project Awards 30 Source: Higher Education Key Facts and Figures 2016/17, HEA, p3
56%61% 60% 59% 58% 58% 58% 58% 59% 59%
44%39% 40% 41% 42% 42% 42% 42% 41% 41%
0%
20%
40%
60%
80%
100%
% o
f A
ll St
ud
ents
Gender of Students
Female
Male
57% 59% 61%
43% 41% 39%
0%
20%
40%
60%
80%
100%
% o
f St
ud
ents
at
the
Leve
l
Gender of Students by Level of Study
Male
Female

34
Faculty
All of the 3 Faculties are outside a 60:40 gender ratio, although AHSS and EMS are close with
62% female students and 61% male students respectively. Multi-Faculty programmes also
have 62% female students. Health Sciences is the most gender-imbalanced Faculty, as over
three-quarters (76%) of its students are female.
Figure 14: Gender Representation among All Students in each Faculty (2018)
Female representation increases by 3 percentage points in each of AHSS and EMS at
postgraduate level, and decreases by 1 percentage point in HS.
Figure 15: Representation of Female Students at Undergraduate / Postgraduate Level in each Faculty (2018)
76%(3230) 62%
(4529)62%
(1083) 39%(1846)
24%(1046) 38%
(2778)38%(667) 61%
(2902)
0%
20%
40%
60%
80%
100%
HS AHSS MF EMS
% o
f St
ud
ents
in t
he
Facu
lty
Student Gender by Faculty
Male
Female
76%
61%
38%
75%
64%
41%
0%
20%
40%
60%
80%
100%
HS AHSS EMS
% o
f St
ud
ents
wh
o a
re F
emal
e
Female Representation in Level of Study by Faculty
UG
PG

35
Attainment31
Of those receiving Entrance
Exhibition Awards in 2016/17, 58%
were female. This is very similar to
the proportion of women among
students overall (see Figure 12).
Figure 16: Gender of Students receiving Entrance Exhibition Awards (2016/17)
Of those awarded Foundation or non-
Foundation Scholarship in 2017, 53%
were female and 47% were male.
Figure 17: Gender of Students who were Awarded Scholarship (2017)
58% of graduands awarded a Gold
Medal at Commencements were
male in 2016/17 (despite 58% of
students being female, as shown in
Figure 12).
Figure 18: Gender of Graduands who were Awarded Gold Medals (2016/17)
31 Source: Academic Registry Annual Report 2016/17
Female25958%
Male18842%
Entrance Exhibitions by Gender
Female29
53%
Male26
47%
New Scholars by Gender
Female59
42%Male
8058%
Gold Medals by Gender
36
Leadership Roles32
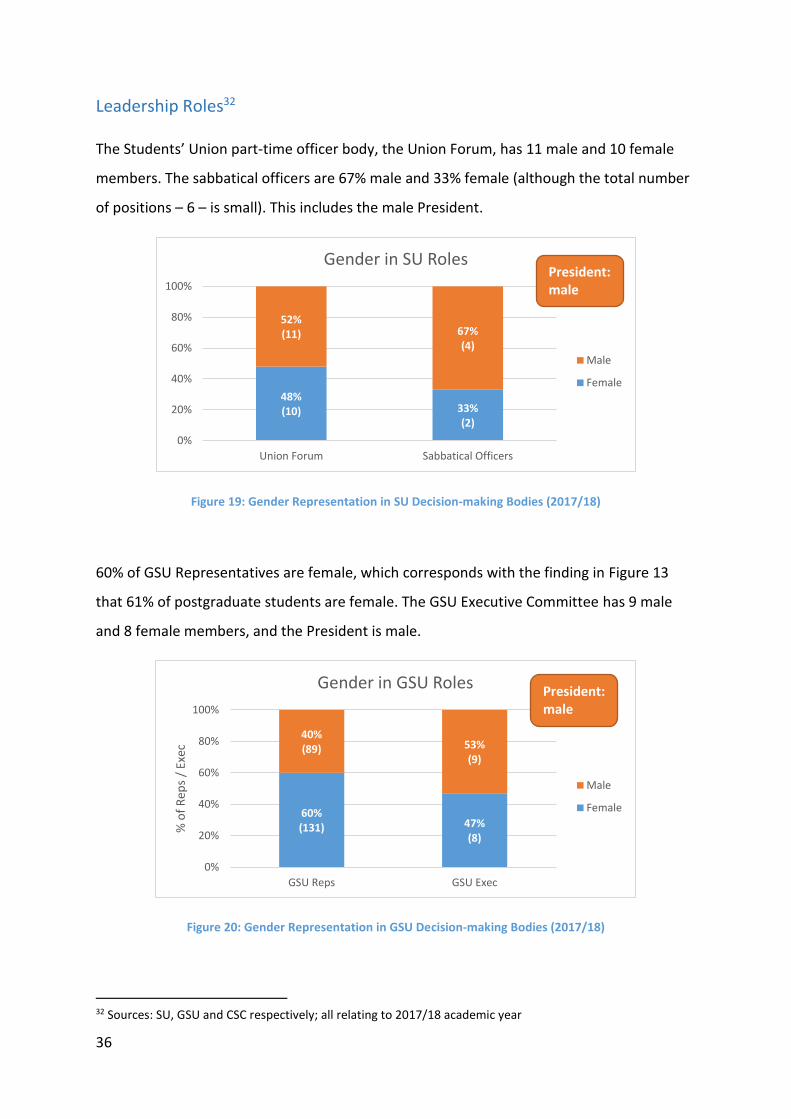
The Students’ Union part-time officer body, the Union Forum, has 11 male and 10 female
members. The sabbatical officers are 67% male and 33% female (although the total number
of positions – 6 – is small). This includes the male President.
Figure 19: Gender Representation in SU Decision-making Bodies (2017/18)
60% of GSU Representatives are female, which corresponds with the finding in Figure 13
that 61% of postgraduate students are female. The GSU Executive Committee has 9 male
and 8 female members, and the President is male.
Figure 20: Gender Representation in GSU Decision-making Bodies (2017/18)
32 Sources: SU, GSU and CSC respectively; all relating to 2017/18 academic year
48%(10) 33%
(2)
52%(11) 67%
(4)
0%
20%
40%
60%
80%
100%
Union Forum Sabbatical Officers
Gender in SU Roles
Male
Female
President:male
60%(131) 47%
(8)
40%(89) 53%
(9)
0%
20%
40%
60%
80%
100%
GSU Reps GSU Exec
% o
f R
eps
/ Ex
ec
Gender in GSU Roles
Male
Female
President:male

37
The majority (62%) of Chairs of student Societies were male in 2017/18. This is a greater
majority than was found in 2016/17 (in which 54% of Chairs were male). Only two years’
figures are available at this point, but the Equality Monitoring Advisory Group will continue
to present these figures annually to establish the long-term average and/or trend.
Figure 21: Gender Representation among Chairs of Student Societies (2017/18)
Female47
38%
Male 77
62%
Gender of Society Chairs
Female
Male
CSC Chair:male

38
Mature Students33
Overview
A mature student is an undergraduate student aged 23 or over who applies via the Mature
Students Dispensation Scheme (MSDS) or via the Nursing Career Centre34.
5.6% (723) of undergraduate
students were mature students in
2017/18. 450 were MSDS students
and 273 were mature
Nursing/Midwifery students.
This is half the average of the Irish
higher education sector, in which
11% of full-time undergraduate new
entrants were mature in 2016/1735.
Figure 22: Mature Students (MSDS & Nursing/Midwifery) as % of Total Undergraduate Students (2017/18)
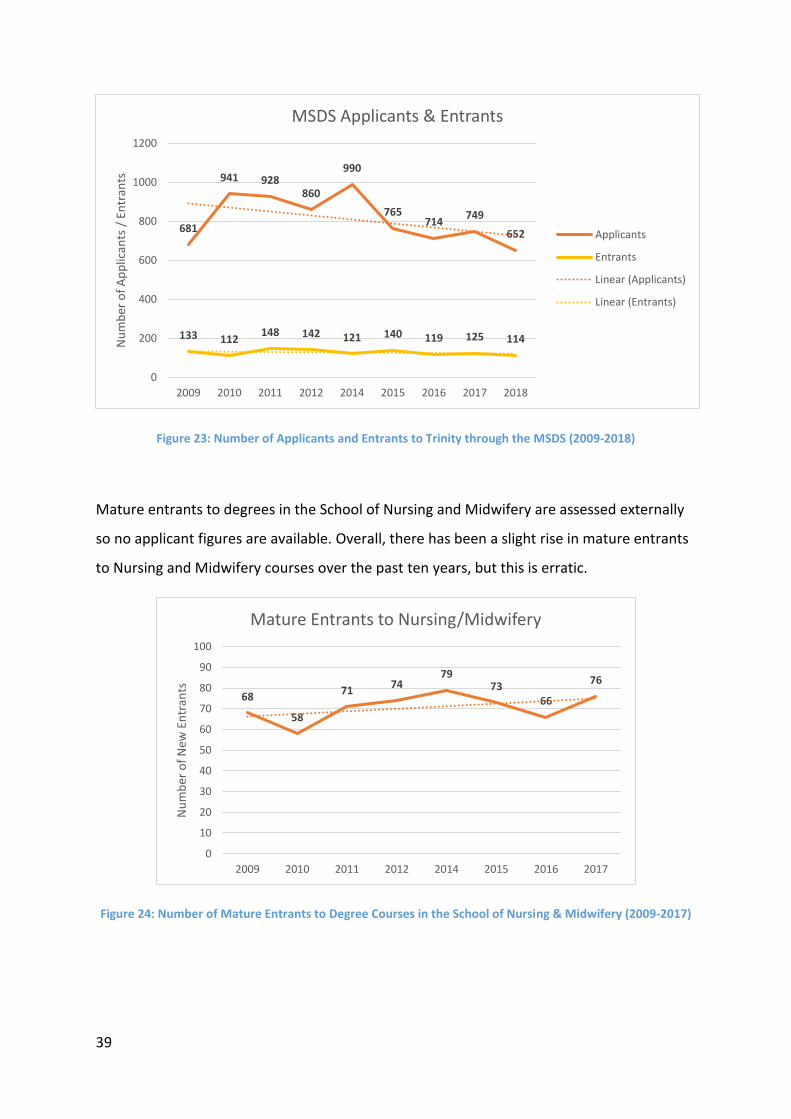
Applicants & Entrants
The number of applicants to the MSDS peaked during the economic recession, and has
declined since 2014. This is to be expected as the country returns to high levels of
employment.
The number of students entering Trinity under the MSDS has been steady over the past ten
years and does not closely relate to the number of applicants (see Figure 23 overleaf).
33 Source for all data in this section: Mature Students Office 34 An external body which assesses applicants for degree programmes in Nursing and Midwifery 35 Source: Higher Education Key Facts and Figures 2016/17, Higher Education Authority (HEA), p3
94.4%(12,302)
3.5%(450)
2.1%(273)
Mature Students as % of Undergraduates
Other Entry
MSDS
Nursing/Midwifery
National Access Plan target
16% of new entrants to be full-time
mature students
39
Figure 23: Number of Applicants and Entrants to Trinity through the MSDS (2009-2018)
Mature entrants to degrees in the School of Nursing and Midwifery are assessed externally
so no applicant figures are available. Overall, there has been a slight rise in mature entrants
to Nursing and Midwifery courses over the past ten years, but this is erratic.
Figure 24: Number of Mature Entrants to Degree Courses in the School of Nursing & Midwifery (2009-2017)
681
941 928860
990
765714
749
652
133 112148 142 121 140 119 125 114
0
200
400
600
800
1000
1200
2009 2010 2011 2012 2014 2015 2016 2017 2018
Nu
mb
er o
f A
pp
lican
ts /
En
tran
tsMSDS Applicants & Entrants
Applicants
Entrants
Linear (Applicants)
Linear (Entrants)
68
58
7174
7973
66
76
0
10
20
30
40
50
60
70
80
90
100
2009 2010 2011 2012 2014 2015 2016 2017
Nu
mb
er o
f N
ew E
ntr
ants
Mature Entrants to Nursing/Midwifery

40
Faculty
Almost half (49%) of MSDS students are enrolled on courses in AHSS, whereas just 14% of
MSDS students are in the EMS Faculty.
Figure 25: Number and Percentage of MSDS Students in Each Faculty (2018)
Gender
MSDS students are more gender-balanced than the overall undergraduate student
population (see Figure 12), ranging from 47.5% to 54% female between 2012/13 and
2017/18.
Figure 26: Gender Representation among Total MSDS Students (2012/13 - 2017/18)
21949%
9020%
7617%
6514%
MSDS Students by Faculty
AHSS HS Multi EMS
50.5%54% 52.5%
47.5%51.0%
49.5%46% 47.5%
52.5%49.0%
0%
10%
20%
30%
40%
50%
60%
70%
80%
90%
100%
2012/13 2014/15 2015/16 2016/17 2017/18
% o
f M
SDS
Stu
den
ts
Gender of MSDS Students
Female
Male

41
Age
Since 2010/11, between 39% and 52% of MSDS students have been in their twenties;
consistently the most common age bracket for MSDS students. Those in their 30s are the
second most common group every year, making up 22% – 32% of MSDS students. The 41-50
and over 50 age brackets occasionally overlap, but generally MSDS students over 50 are the
least common.
That being said, a significant minority (12%) of MSDS students were over 50 in 2017/18.
Figure 27: Percentage Representation of MSDS Students in each Age Bracket (2010/11 - 2017/18)
41% 41%
50%
40% 39%
51%49% 49%
27%25%
22%
30%32%
23% 24%26%
18%
16%14%
12%
15%16%
14%13%14%
18%
14%
18%
14%
10%
13% 12%
0%
10%
20%
30%
40%
50%
60%
2010/11 2011/12 2012/13 2013/14 2014/15 2015/16 2016/17 2017/18
% o
f M
SDS
stu
den
ts
Trend in Age of MSDS Students
23-30
31-40
41-50
Over 50

42
Socio-economic Background36
The “Employers and Managers” and
“Higher Professional” socio-economic
backgrounds are highly represented in
Trinity, at 24% and 22% respectively of
undergraduate new entrants.
The National Access Plan targets are not being met in Trinity, as just 8% of new entrants are
from the Non-Manual Worker group, and 5% total from the Semi-skilled and Unskilled
Worker groups.
Figure 28: Socio-economic Background of Undergraduate New Entrants (2016/17)
36 HEA Equal Access Survey 2016/17. This is a voluntary survey offered to undergraduate new entrants at initial registration. 87.9% (2,560) of undergraduate new entrants in Trinity completed the socio-economic question
24% (610)
22% (553)
17% (440)
13% (338)
8% (197)
5% (121)
4% (105)
3% (80)
3% (66)
2%(47)
0.1% (3)
0% 5% 10% 15% 20% 25% 30%
Employers and Managers
Higher Professional
Other / Unknown
Lower Professional
Non-manual
Manual Skilled
Own Account Workers
Farmers
Semi-skilled
Unskilled
Agricultural Workers
% of New Entrants
Socio-Economic Background of New Entrants
National Access Plan targets
New entrants to all HEIs:
30% from non-manual worker group
35% from semi/unskilled worker group

43
Trinity Access Programmes37
Overview
TAP students, i.e. students entering Trinity
via a Trinity Access Programmes Foundation
Course, make up 8% (1,016) of the total
undergraduate student population (13,025).
Figure 29: TAP Students as % of Total Undergraduate Students (2017/18)
Almost all (97% of) students undertaking a TAP Foundation Year progressed to an
undergraduate programme in 2017/18, and the vast majority (87%) of students who had
entered their undergraduate degree programme via TAP completed their degree.
Progression rate from Foundation to UG programmes 2017/18 UG entry 97%
Completion rate of TAP students 2017/18 commencements 87% Table 5: Key Facts on TAP Student Admission and Completion Rates
Over the past twenty years, the number of students entering undergraduate degree
programmes via TAP has significantly increased, from 10 in 1998 to 273 in 2017.
37 Source for data in this section: Trinity Access Programmes, data received June 2018
10 1443
57 67 7795 101 110 118
138114
157185
234259 252 258 268 273
0
50
100
150
200
250
300
Nu
mb
er o
f U
G E
ntr
ants
fro
m
TAP
Fo
un
dat
ion
Co
urs
es
Entrants to Trinity via TAP
1302593%
10167%
TAP Students as % of Undergraduates
Other Entry
TAP

44
Figure 30: Total Entrants to Trinity via the Trinity Access Programmes (1998-2017)
Gender
TAP students are 61% female, 39%; very similar
to the general undergraduate population (see
Figure 12).
Figure 31: Gender Representation among TAP Students (2017/18)
Age
90% of TAP Students are on the Foundation
Course for Young Adults; 10% are on the
Foundation Course for Mature Students38. This
is a slightly higher representation of mature
students than is found in the general
undergraduate population (see Figure 22).
Figure 32: Representation of Mature Students among TAP Students (2017/18)
Faculty
38 i.e. Students over 23 at point of entry to the Foundation Course
61961%
39739%
Gender of TAP Students
Female
Male
89490%
9710%
Age of TAP Students
Young Adults
MatureStudents

45
Students who have entered undergraduate
degrees via TAP (across all years) are more
often taking courses in AHSS (45%) than EMS
(29%) or HS (26%).
Figure 33: Faculty Distribution of TAP Students (2017/18)
Attainment
The most common degree outcome for a graduate who entered their course via TAP is a 2:1
(52% of TAP graduates), and 10% achieve a First Class or Distinction grade.
Figure 34: Degree Grades of Graduates who Entered Trinity via TAP (Final Assessment in 2016/17)
0.6%(1)
9%(16)
52%(93)
28%(49)
6%(10)
3%(6)
2%(3) 0
0
20
40
60
80
100
120
% o
f TA
P G
rad
uat
es
TAP Graduate Outcomes
45245%
29829%
26626%
Faculty of TAP Students
AHSS
EMS
HS

46
Staff Report
Overview
There are 3,945 staff in Trinity39 (3,885 of which fit into the six main employment areas).
The biggest employment area is academia, comprising 28% of staff, closely followed by
administration at 27% of staff.
Figure 35: Total Staff by Area of Employment (2018)
39 Please note that the total number of staff in specific categories such as Age, Civil Status, Gender etc. may be slightly less than 3,945 as those who are “unknown” in any category are removed for the purposes of analysis
108228%
107427%
89323%
54014%
1494%
1474%
Staff Employment Area
Academic
Administrative
Research
Support
Technical
Library

47
Age
The most common age of Trinity staff members is 36-40 (16% of staff). Around 19% of staff
are “older adults” (aged 55 or above). Just 1.6% of staff are over 65.
Figure 36: Age Representation among Total Staff (2018)
Trinity’s staff age breakdown is largely similar to the UK higher education sector (data for
Ireland is not available)40.
Trinity UK HEIs Difference
25 or under 4% 6% -2%
26-30 10% 11% -1%
31-35 14% 14% 0%
36-40 16% 14% +2%
41-45 14% 13% +1%
46-50 13% 13% 0%
51-55 11% 12% -1%
56-60 10% 10% 0%
61-65 7% 5% +2%
66 or over 2% 2% 0%
Table 6: Age of All Staff, Trinity and UK HE Sector Comparative (2018)
40 Source: Equality and Higher Education: Staff Statistical Report 2018, AdvanceHE, p49
0.3% (11)
4% (154)
10% (386)
14% (564)
16% (638)
14% (531)
13% (508)
11% (427)
10% (381)
7% (263)
0.8% (32)
0.8% (30)
0% 2% 4% 6% 8% 10% 12% 14% 16% 18%
< 20
20-25
26-30
31-35
36-40
41-45
46-50
51-55
56-60
61-65
66-70
> 70
Age of Staff

48
Academic Staff
Academic staff tend to have an older profile than the overall staff population; while the
most common age is still 36-40 (17% of academic staff), every age bracket above 40 has a
higher representation among academic than overall staff, and there are fewer academics
than the overall average in the ages of 20-35.
Figure 37: Age Representation among Academic Staff (2018)
Schools
Table 7 provides the age breakdown of academic staff in every School. The total number of
academic staff in the School is provided in brackets after the School’s title. The highlighted
cells show the most common age range within each School. The majority of Schools’ most
common age range (“mode”) is somewhere between 36 and 55.
The sparklines in the far-right column are a visual representation of the age of academic
staff across the School. Modes are marked with a darker colour. A sparkline with high
columns to the left indicates the School has relatively young academic staff (e.g. School of
Law); a sparkline with higher columns to the right denotes an older academic team (e.g.
School of Linguistic, Speech and Communication Sciences).
0.2% (2)
3% (34)
10% (110)
17% (179)
15% (159)
16% (171)
16% (170)
12% (124)
8% (84)
2% (22)
2% (23)
0% 2% 4% 6% 8% 10% 12% 14% 16% 18%
20-25
26-30
31-35
36-40
41-45
46-50
51-55
56-60
61-65
66-70
> 70
Age of Academic Staff

Table 7: Age Representation (%) among Academic Staff by School (2018)
20-25 26-30 31-35 36-40 41-45 46-50 51-55 56-60 61-65 66-70 > 70
Biochemistry & Immunology (24) 0% 0% 8% 8% 29% 25% 21% 4% 4% 0% 0%
Business (42) 2% 7% 14% 14% 10% 10% 14% 7% 14% 0% 7%
Chemistry (23) 0% 9% 17% 13% 13% 13% 13% 17% 4% 0% 0%
Computer Science & Statistics (82) 0% 1% 2% 16% 12% 18% 23% 7% 7% 5% 7%
Creative Arts (16) 0% 0% 0% 19% 19% 13% 19% 13% 19% 0% 0%
Education (27) 0% 0% 19% 11% 11% 26% 15% 4% 11% 4% 0%
Engineering (68) 0% 1% 12% 21% 16% 15% 13% 10% 6% 3% 3%
English (30) 0% 0% 13% 20% 23% 10% 13% 10% 7% 0% 3%
Genetics & Microbiology (24) 0% 0% 4% 25% 13% 17% 13% 13% 8% 0% 8%
Histories & Humanities (44) 0% 0% 14% 14% 16% 16% 11% 18% 11% 0% 0%
Languages, Literatures & Cultural Studies (56) 2% 4% 11% 13% 9% 16% 16% 14% 13% 0% 4%
Law (48) 0% 8% 19% 27% 15% 10% 15% 2% 2% 0% 2%
Linguistic, Speech & Communication Sciences (26) 0% 0% 12% 12% 4% 12% 15% 27% 15% 4% 0%
Mathematics (25) 0% 0% 8% 28% 12% 16% 12% 8% 4% 4% 8%
Medicine (188) 0% 6% 12% 18% 16% 14% 13% 12% 6% 2% 1%
Natural Sciences (45) 0% 0% 7% 18% 24% 16% 13% 16% 7% 0% 0%
Nursing & Midwifery (89) 0% 1% 0% 6% 16% 19% 26% 20% 10% 1% 1%
Pharmacy & Pharmaceutical Sciences (26) 0% 0% 8% 15% 19% 31% 8% 8% 12% 0% 0%
Physics (30) 0% 0% 17% 17% 17% 13% 13% 10% 10% 0% 3%
Psychology (34) 0% 3% 6% 12% 21% 18% 18% 21% 0% 3% 0%
Religions, Peace Studies & Theology (22) 0% 5% 9% 9% 14% 14% 36% 0% 9% 5% 0%
Social Sciences & Philosophy (69) 0% 9% 19% 28% 10% 14% 9% 6% 1% 4% 0%
Social Work & Social Policy (21) 0% 0% 10% 14% 5% 29% 14% 5% 19% 5% 0%
Age RangeSchool (and total academic staff) Sparkline

50
Civil Status
Almost half (48%) of Trinity staff are single41, and a further 44% are married. Just 2% of staff
are divorced, and 2% cohabiting. Further categories, including those relating to civil
partnership and to bereavement, each represent 1% or less than 1% of staff.
Figure 38: Civil Status Representation among Total Staff (2018)
41 It is likely that many staff members who are actually, for example, cohabiting, describe themselves as “single” for official purposes, in its sense as an umbrella term for all statuses other than “married”.
48%
44%
2%
2%1%
1%
0.6% 0.3%
0.3%
0.1% 0.03%
Civil Status of Staff
Single (1889)
Married (1730)
Divorced (87)
Cohabiting (77)
Separated (53)
Undefined (41)
Widowed (25)
In A Civil Partnership (13)
Other (10)
A Former Civil Partner (2)
A Surviving Civil Partner (1)

51
Disability
“We will achieve this objective [C8.2 Equality, Diversity and the Irish
Language] by: […] promoting the employment of people with disabilities,
improving their retention and recognizing their contributions”
Trinity Strategic Plan 2014-2019
For the first time since 2012, in 2018
Trinity recorded less than 3% of its staff
having a disability, missing the statutory
target42.
Data collection methods have changed in
the past two years, with a greater
emphasis now placed on data protection. A key issue is encouraging disclosure, which must
remain voluntary. Managers have a role to play in ensuring staff with disabilities are
confident that disclosing their disability will benefit rather than disadvantage them.
42 Source: Trinity Statutory Report to National Disability Authority (via HEA), April 2018
2.1%2.4% 2.3% 2.3%
3.7%
3.2% 3.2%
4.1%
3.5%
2.9%
0.0%
0.5%
1.0%
1.5%
2.0%
2.5%
3.0%
3.5%
4.0%
4.5%
5.0%
2009 2010 2011 2012 2013 2014 2015 2016 2017 2018
% o
f To
tal S
taff
wh
o D
ecla
red
a
Dis
abilt
y
Staff with Disabilities
Disability Act 2005 target
At least 3% of a public body’s
employees to be people with disabilities

52
Figure 39: Percentage of Total Staff who have Declared a Disability (2009-2018)
In UK HEIs, 4.7% of staff have declared a disability43. This is higher than Trinity’s current
figure, and lower than the Irish government’s proposed new target of 6% of public
employees to be people with disabilities44.
43 Equality and Higher Education: Staff Statistical Report 2018, AdvanceHE, p101 44 Ref: Comprehensive Employment Strategy for People with Disabilities 2015-2024, Government of Ireland, p3

53
Ethnicity
Diversity Detail
The response rate to this question was 11% of total staff.
68% of staff who completed the Diversity Detail are White Irish, and 24% are of another
White background, so a total of 92% of respondents are White.
5% of respondents are Asian (including Chinese and other backgrounds), less than 1% are
Black (including African and other backgrounds), and 3% are of other backgrounds (including
mixed background).
No staff member indicated on their Diversity Detail that they are a member of the Traveller
community.
Figure 40: Ethnic Origin of Total Staff from Diversity Detail (2018)
68%(295)
24%(105)
3%(14)
3%(11)
2%(9)
0.5%(2)
0.2%(1)
Ethnic Origin of Staff
White (Irish)
White Any Other Background
Other Including Mixed Background
Asian/Asian Irish Any OtherBackground
Asian/Asian Irish (Chinese)
Black/Black Irish (African)
Black/Black Irish Any OtherBackground
Response rate = 11%
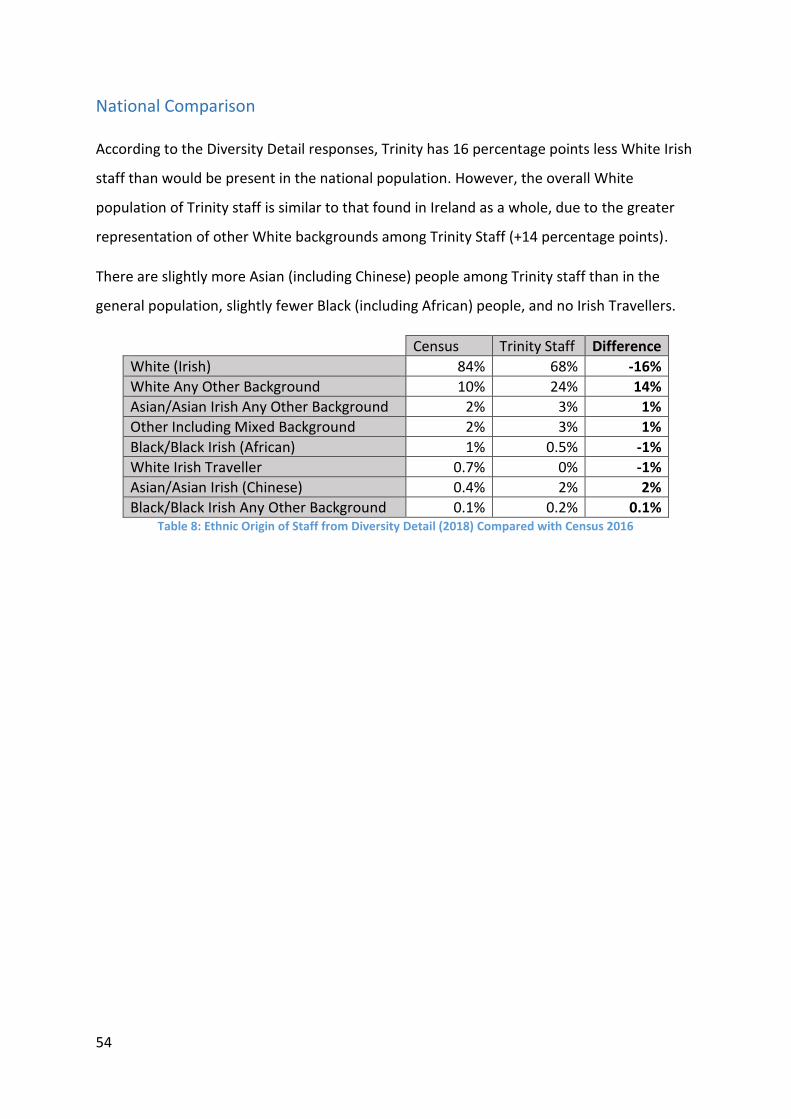
54
National Comparison
According to the Diversity Detail responses, Trinity has 16 percentage points less White Irish
staff than would be present in the national population. However, the overall White
population of Trinity staff is similar to that found in Ireland as a whole, due to the greater
representation of other White backgrounds among Trinity Staff (+14 percentage points).
There are slightly more Asian (including Chinese) people among Trinity staff than in the
general population, slightly fewer Black (including African) people, and no Irish Travellers.
Census Trinity Staff Difference
White (Irish) 84% 68% -16%
White Any Other Background 10% 24% 14%
Asian/Asian Irish Any Other Background 2% 3% 1%
Other Including Mixed Background 2% 3% 1%
Black/Black Irish (African) 1% 0.5% -1%
White Irish Traveller 0.7% 0% -1%
Asian/Asian Irish (Chinese) 0.4% 2% 2%
Black/Black Irish Any Other Background 0.1% 0.2% 0.1% Table 8: Ethnic Origin of Staff from Diversity Detail (2018) Compared with Census 2016

55
Gender
Overview
The majority (55% or 2,161/3,941) of Trinity staff are women. This gender representation
has been highly consistent over the past ten years.
Figure 41: Gender Representation Trend among Total Staff (2008-2018)
This is very similar to the representation of women among core-funded staff across Irish
universities, which is 54%45.
45 Source: Higher Education Institutional Staff Profiles by Gender, HEA, 2018, p5. Figures refer to Dec 2017.
53% 53% 53% 55% 55% 54% 53% 55% 54% 55%
47% 47% 47% 45% 45% 46% 47% 45% 46% 45%
0%
10%
20%
30%
40%
50%
60%
70%
80%
90%
100%
2008 2010 2011 2012 2013 2014 2015 2016 2017 2018
Gender of Total Staff
Female Male

56
Decision-making Bodies
“We will achieve this objective [C8.2 Equality, Diversity and the Irish
Language] by: […] advancing a structural change process to incorporate
gender-balanced representation at all stages and levels, thereby
enhancing the quality of Trinity’s institutional decision-making”
Trinity Strategic Plan 2014-2019
Board and Council46
Board and Council are both as gender-
balanced as possible, with 52% male
representation on Board and 52% female
representation on Council.
Figure 42: Gender Representation on Board and Council (2017/18)
46 Source: Committee Papers website www.tcd.ie/committeepapers
Gender Action Plan target
No more than 60% of any one gender
to be on any key decision-making body
Female13
48%
Male14
52%
Board(Male Chair: Provost)
Female17
52%
Male16
48%
Council (Male Chair: Provost)

57
Both Board and Council have been very well gender-balanced for the past 3 years, following
a period of increasing female representation.
Figure 43: Gender Representation Trend on Board and Council (2008-2018)
Five Irish universities (including Trinity) have achieved at least a 40/60 gender ratio on their
governing authority, and three (including Trinity) have achieved this on their academic
council47.
Committees48
The overall gender representation on Principal, Academic and Compliance Committees of
Board and Council is 55% male, 45% female. The Committee Chairs are perfectly gender-
balanced: 7 female, 7 male. Half of Committees (7) are within a 60/40 gender ratio, one
(Human Resources) is more than 60% female and six are more than 60% male (Student Life,
Undergraduate Studies, Safety, Graduate Studies, Audit and Finance).
47 Source: Higher Education Institutional Staff Profiles by Gender, HEA, 2018, p5. Figures refer to Dec 2017. 48 Source: Committee secretaries
32%28%
40%45%
38%34%
47% 48.5% 48% 48%
42%
32%
45%48% 49% 49%
59%52.5% 52% 52%
0%
10%
20%
30%
40%
50%
60%
70%
80%
90%
100%
2008 2010 2011 2012 2013 2014 2015 2016 2017 2018
% F
emal
e R
epre
sen
tati
on
Board and Council:Gender Representation Trend
Board
Council

58
The Undergraduate Studies and Graduate Studies Committees in particular are affected by
the gender representation among academic staff in leadership positions within Schools, e.g.
Directors of Undergraduate / Postgraduate Teaching and Learning.
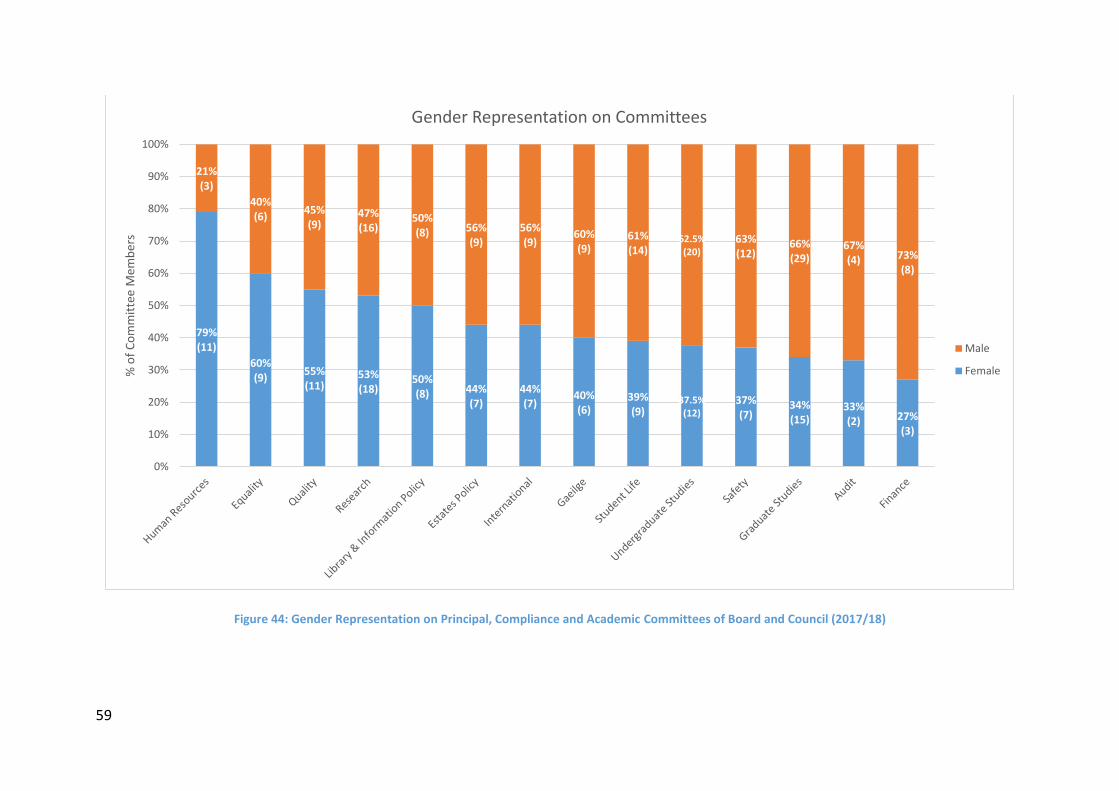
59
Figure 44: Gender Representation on Principal, Compliance and Academic Committees of Board and Council (2017/18)
79%(11)
60%(9)
55%(11)
53%(18)
50%(8) 44%
(7)44%(7)
40%(6)
39%(9)
37.5%(12)
37%(7)
34%(15)
33%(2) 27%
(3)
21%(3)
40%(6)
45%(9)
47%(16)
50%(8) 56%
(9)56%(9)
60%(9)
61%(14)
62.5%(20)
63%(12)
66%(29)
67%(4) 73%
(8)
0%
10%
20%
30%
40%
50%
60%
70%
80%
90%
100%%
of
Co
mm
itte
e M
emb
ers
Gender Representation on Committees
Male
Female
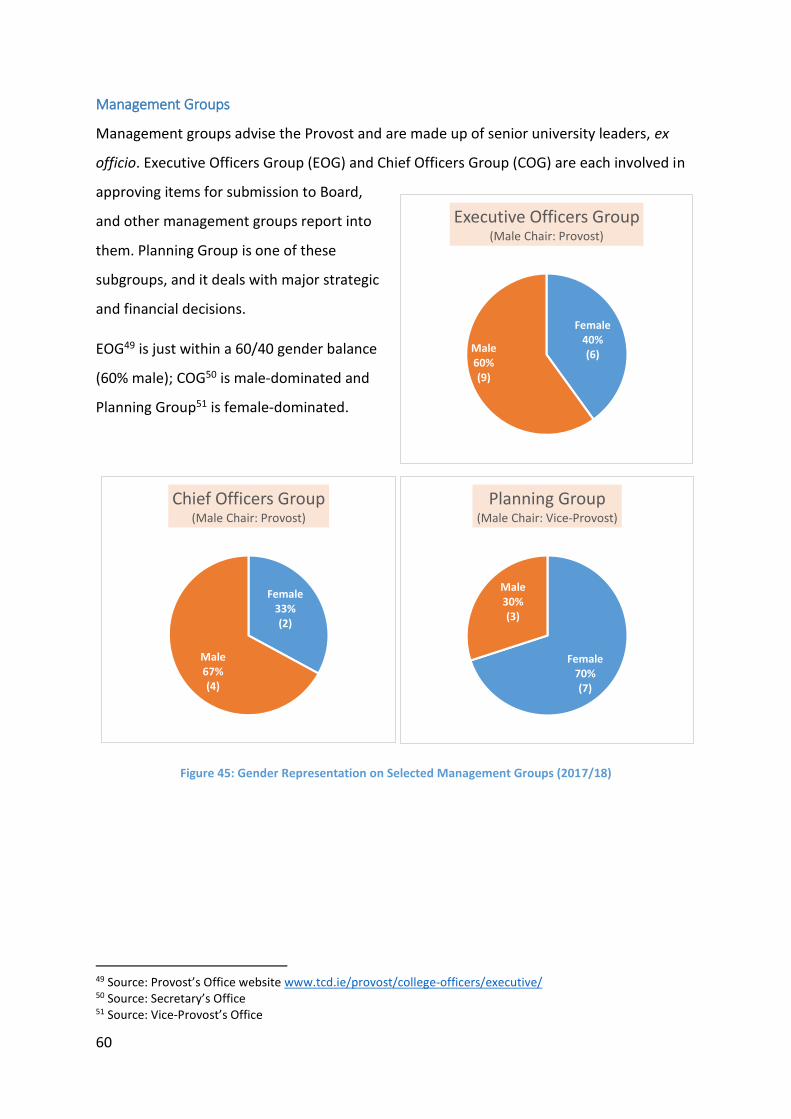
60
Management Groups
Management groups advise the Provost and are made up of senior university leaders, ex
officio. Executive Officers Group (EOG) and Chief Officers Group (COG) are each involved in
approving items for submission to Board,
and other management groups report into
them. Planning Group is one of these
subgroups, and it deals with major strategic
and financial decisions.
EOG49 is just within a 60/40 gender balance
(60% male); COG50 is male-dominated and
Planning Group51 is female-dominated.
Figure 45: Gender Representation on Selected Management Groups (2017/18)
49 Source: Provost’s Office website www.tcd.ie/provost/college-officers/executive/ 50 Source: Secretary’s Office 51 Source: Vice-Provost’s Office
Female33%(2)
Male67%(4)
Chief Officers Group(Male Chair: Provost)
Female70%(7)
Male30%(3)
Planning Group(Male Chair: Vice-Provost)
Female40%(6)
Male60%(9)
Executive Officers Group(Male Chair: Provost)

61
EOG is more gender-balanced in 2017/18 than it was in 2016/17. Although it has not
regained its best gender balance to date, i.e. 54% male in 2016, the overall trend is towards
more equal representation of men and women on EOG.
Figure 46: Gender Representation Trend on Executive Officers Group (2010-2018)
Faculty Executives52
Faculty Executive Committees (Execs) roughly reflect the gender breakdown of academic
staff in the Faculty, although the HS Exec, unlike its overall staff, is within a 60/40 gender
split. The EMS Exec, on the other hand, has an over-representation of men (79%).
Each Exec is Chaired by its Faculty Dean so HS has a female Chair, and AHSS and EMS have
male Chairs.
Figure 47: Gender Representation on Faculty Executive Committees (2017/18)
52 Source: Faculty Executive secretaries
18% 18%
36%31% 29% 31%
46%
33%40%
82% 82%
64%69% 71% 69%
54%
67%60%
0%
20%
40%
60%
80%
100%
2010 2011 2012 2013 2014 2015 2016 2017 2018
% o
f EO
G m
emb
ers
EOG: Gender Representation Trend
Female
Male
Linear (Female)
Linear (Male)
59%(10)
50%(10) 21%
(3)
41%(7)
50%(10) 79%
(11)
0%
20%
40%
60%
80%
100%
HS AHSS EMS
Gender of Faculty Executive Committees
Male
Female

62
Contract Types
Part-time / Full-time
18% of Trinity staff are part-time. Women are significantly over-represented (76%) among
part-time staff.
Figure 48: Gender Representation among Part-time and Full-time Staff (2018)
Female over-representation among part-time staff has been consistent over the past ten
years.
Figure 49: Gender Representation Trend among Part-time and Full-time Staff (2008-2018)
Female53476%
Male16824%
Gender of Part-time Staff
Female158950%
Male157950%
Gender of Full-time Staff
74% 73% 75% 77% 78% 76% 77% 77% 76% 76%
26% 27% 25% 23% 22% 24% 23% 23% 24% 24%
0%
10%
20%
30%
40%
50%
60%
70%
80%
90%
100%
2008 2010 2011 2012 2013 2014 2015 2016 2017 2018
% o
f A
ll P
art-
tim
e St
aff
Gender of Part-time Staff
Female
Male

63
Temporary / Permanent
43% of Trinity staff are on temporary contracts. There is no discernible gender difference
between holders of temporary and permanent contracts; both are very similar to the 55%
female overall workforce (see Figure 41).
Figure 50: Gender Representation among Permanent and Temporary Staff (2018)
Of the 28 academic staff on buy-back contracts, 19 (68%) are male and 9 (32%) are female.
This reflects the higher representation of men among academic staff of retirement age, than
among the overall academic staff.
Leave
Figures provided for the 2018 institutional Athena SWAN bronze application show that 26
research staff and 13 Assistant Professors took maternity leave in 2017/18. Also, 6 female
research staff and 4 female Assistant Professors took parental leave; as compared with 3
male research staff. Available evidence indicates that no male academic or research staff
took official paternity leave in 2017/18, although some may be accommodated unofficially.
Female123356%
Male97544%
Gender of Permanent Staff
Female89054%
Male77246%
Gender of Temporary Staff
“We commit to addressing the negative consequences of using short-term contracts
for the retention and progression of staff in academia, particularly women”
Athena SWAN Charter
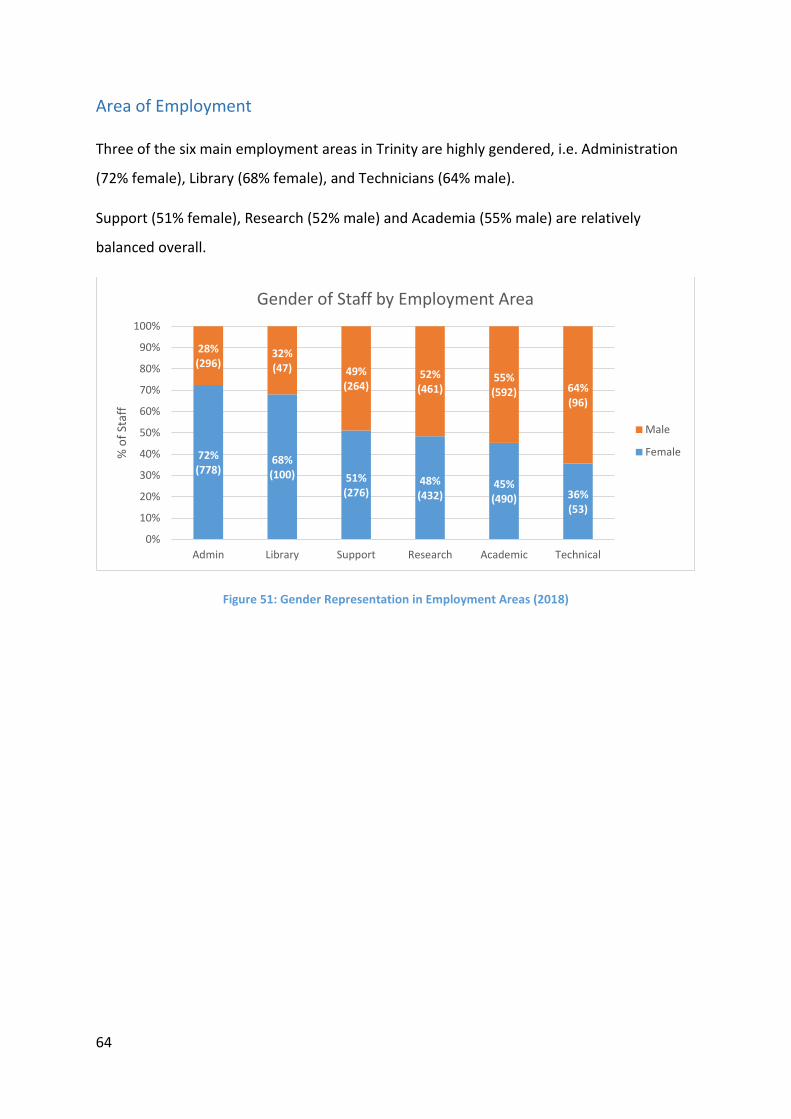
64
Area of Employment
Three of the six main employment areas in Trinity are highly gendered, i.e. Administration
(72% female), Library (68% female), and Technicians (64% male).
Support (51% female), Research (52% male) and Academia (55% male) are relatively
balanced overall.
Figure 51: Gender Representation in Employment Areas (2018)
72%(778)
68%(100) 51%
(276)48%(432)
45%(490) 36%
(53)
28%(296)
32%(47) 49%
(264)52%(461)
55%(592) 64%
(96)
0%
10%
20%
30%
40%
50%
60%
70%
80%
90%
100%
Admin Library Support Research Academic Technical
% o
f St
aff
Gender of Staff by Employment Area
Male
Female

65
Research
A slight majority of Research Assistants (52%) are female, and this reverses among Research
Fellows, who are 54% male.
Figure 52: Gender Representation among Research Assistants and Research Fellows (2018)
The gender representation among Research staff in each Faculty is broadly aligned with the
gender of academic staff in the Faculty (see Figure 61): i.e., HS is female-dominated (71% of
research staff are female), AHSS is gender-balanced (52% of research staff are female) and
EMS is male-dominated (63% of research staff are male).
Figure 53: Gender Representation among Research Staff in each Faculty (2018)
Female52%(167)
Male48%(155)
Gender of Research Assistants
Female46%(265)Male
54%(306)
Gender of Research Fellows
71%(175)
52%(45)
37%(200)29%
(70)
48%(41)
63%(338)
0%
10%
20%
30%
40%
50%
60%
70%
80%
90%
100%
HS AHSS EMS
% o
f R
esea
rch
Sta
ff in
th
e Fa
cult
y
Gender of Research Staff by Faculty
Female
Male

66
Library
A significant majority of Library staff are female at all grades. There is an erratic trend
towards higher female representation at more senior grades (78% female at Library Keeper
/ Sub Librarian grades).
Figure 54: Gender Representation among Library Grades (2018)
64%(18)
68%(27)
69%(11)
58%(7)
83%(10)
67%(20)
78%(7)
36%(10)
33%(13)
31%(5)
42%(5)
17%(2)
33%(10)
22%(2)
0%
10%
20%
30%
40%
50%
60%
70%
80%
90%
100%
Library /LibraryShop
Assistant
HigherLibrary
Assistant 3
HigherLibrary
Assistant 2
HigherLibrary
Assistant 1
AssistantLibrarian 2
AssistantLibrarian 1
LibraryKeeper /
SubLibrarian
% o
f St
aff
at t
he
Gra
de
Gender of Library Staff
Female
Male
Linear (Female)
Linear (Male)

67
Administration
The vast majority of staff at Executive Officer and Senior Executive Officer grades are
female. The female majority then declines steadily between Senior Executive Officer (95%
female) and Senior Administrative 2 (36%) grades. Senior Administrative 1 is more gender-
balanced, at 47% female.
Figure 55 does not include the Provost (male), Vice-Provost (male), Treasurer (male) and
Chief Operating Officer (female) who are on individual pay scales.
Figure 55: Gender Representation among Administrative Grades (2018)
84%(253)
95%(86)
80%(76)
65%(162)
64%(156)
59%(29)
36%(8)
47%(7)
16%(49) 5%
(5)
20%(19)
35%(89)
36%(88)
41%(20)
64%(14) 53%
(8)
0%
10%
20%
30%
40%
50%
60%
70%
80%
90%
100%
% o
f St
aff
at t
he
Gra
de
Gender of Admin Staff
Female
Male

68
Table 9 presents 20 administrative and service departments in descending order of female
representation (among their administrative staff).
14 have more than 60% female administrative staff; 4 are within a 60/40 split; and just two
small departments have more than 60% male administrative staff.
Female Male Women Men Total
Health Centre 92% 8% 12 1 13
Teaching & Learning 88% 12% 37 5 42
Science Gallery 85% 15% 11 2 13
Provost's Office 80% 20% 8 2 10
Student Counselling 80% 20% 20 5 25
VP/CAO's Office 79% 21% 11 3 14
Secretary's Office 79% 21% 11 3 14
Commercial Revenue 77% 23% 24 7 31
Human Resources 77% 23% 44 13 57
Academic Registry 72% 28% 39 15 54
Global Relations 72% 28% 23 9 32
Research & Innovation 72% 28% 38 15 53
Financial Services 64% 36% 52 29 81
COO's Office 63% 38% 5 3 8
Communications 57% 43% 8 6 14
Estates & Facilities 47% 53% 24 27 51
Sport & Recreation 45% 55% 5 6 11
IT Services 41% 59% 38 55 93
Disability Service 38% 63% 3 5 8
Programme Management 33% 67% 2 4 6
Table 9: Gender of Staff in Professional Departments (2018)

69
Technical
The majority of technical officers at every grade are male. There is only a very slight, uneven
trend towards greater male representation at the higher grades.
Figure 56: Gender Representation in Technical Officers (2018)
Experimental Officers have a higher male majority at both grades than is found among any
technical officer grade.
Figure 57: Gender Representation in Experimental Officers (2018)
30%(6)
47%(22)
31%(9)
38%(3) 31%
(5)
70%(14)
53%(25)
69%(20) 63%
(5)
69%(11)
0%
10%
20%
30%
40%
50%
60%
70%
80%
90%
100%
TechnicalOfficer
SeniorTechnical
Officer
Chief TechnicalOfficer
(Specialist)
Chief TechnicalOfficer 2
Chief TechnicalOfficer 1
% o
f St
aff
at t
he
Gra
de
Gender of Technical Officers
Female
Male
Linear (Female)
Linear (Male)
18%(2)
13%(1)
82%(9)
88%(7)
0% 20% 40% 60% 80% 100% 120%
Experimental Officer
Senior Experimental Officer
% of Staff at the Grade
Gender of Experimental Officers
Female
Male

70
Support
Significant gender imbalances exist within different support areas, and these conform to
traditional gender roles; there are for example 100% female staff in the Nursery, and 92%
male staff in Grounds.
Figure 58: Gender Representation among Support Areas (2018)
100%(16) 81%
(181) 67%(34)
22.5%(36)
17%(1)
10%(7)
8%(1)
19%(42) 33%
(17)
77.5%(124)
83%(5)
90%(64)
92%(12)
0%
10%
20%
30%
40%
50%
60%
70%
80%
90%
100%
% o
f St
aff
in t
he
Are
a
Gender of Support Staff by Area
Male
Female

71
Academic
Gender representation at the Assistant
Professor grade is now almost exactly equal
(48% female). The Professor grade is also within
a 60/40 split (44% female). However, Chair
Professors remain significantly imbalanced (28% female) and the overall trend is for decline
in female representation towards the more senior grades.
Figure 59: Gender Representation in Academic Grades (2018)
Among Irish universities, it appears53 that Trinity has a slightly lower than average
representation of women at the Associate Professor and Assistant Professor grades, but a
higher representation of women at the Chair Professor and Professor grades.
Trinity Universities Difference
Chair Professor 27% 24% +3%
Professor 43% 34% +9%
Associate Professor 39% 41% -2%
Assistant Professor 48% 51% -3% Table 10: Gender Representation in Academic Grades, Comparison with Irish Universities Average (2017)
53 Source: Higher Education Institutional Staff Profiles by Gender, HEA (2018), p5. These figures refer to core-funded staff only and are based on figures from December 2017 – so they are not directly comparable to the data presented in Figure 59
28%(27)
44%(36)38%
(79)
48%(270)
72%(68)
56%(45)
62%(127)52%
(298)
0%
10%
20%
30%
40%
50%
60%
70%
80%
90%
100%
Chair ProfessorProfessorAssociateProfessor
AssistantProfessor
Gender of Academic Staff by Grade
Female
Male
Linear (Female)
Linear (Male)
Trinity Gender Action Plan target
26% of Chair Professors to be
women by 2020

72
Female representation has increased at every (non-medical) academic grade over the past
ten years. The percentage increase has been relatively small at Assistant Professor (46%
49%) and Associate Professor (33% 38%) grades, but more significant at the more senior
grades, i.e. Professor (31% 44%) and Chair Professor (12% 28%).
Figure 60: Female Representation Trend in Academic Grades (2008-2018)
Faculties
The AHSS Faculty is well gender-balanced, with 53% male staff, while HS is female-
dominated (66% female) and EMS is male-dominated (76% male).
Figure 61: Gender Representation among Academic Staff: Faculty Comparison (2018)
46%49%
33% 38%
31%
44%
12%
28%
0%
10%
20%
30%
40%
50%
60%
70%
80%
90%
100%
2008 2010 2011 2012 2013 2014 2015 2016 2017 2018
% o
f St
aff
at t
he
Gra
de
wh
o a
re F
emal
e
Female Representation in Academic Grades
Assistant
Associate
Professor
Chair
66%(140) 47%
(195) 24%(75)
34%(72) 53%
(223) 76%(243)
0%
20%
40%
60%
80%
100%
HS AHSS EMS
% o
f A
cad
emic
Sta
ffin
th
e Fa
cult
y
Gender of Academic Staff by Faculty
Male
Female
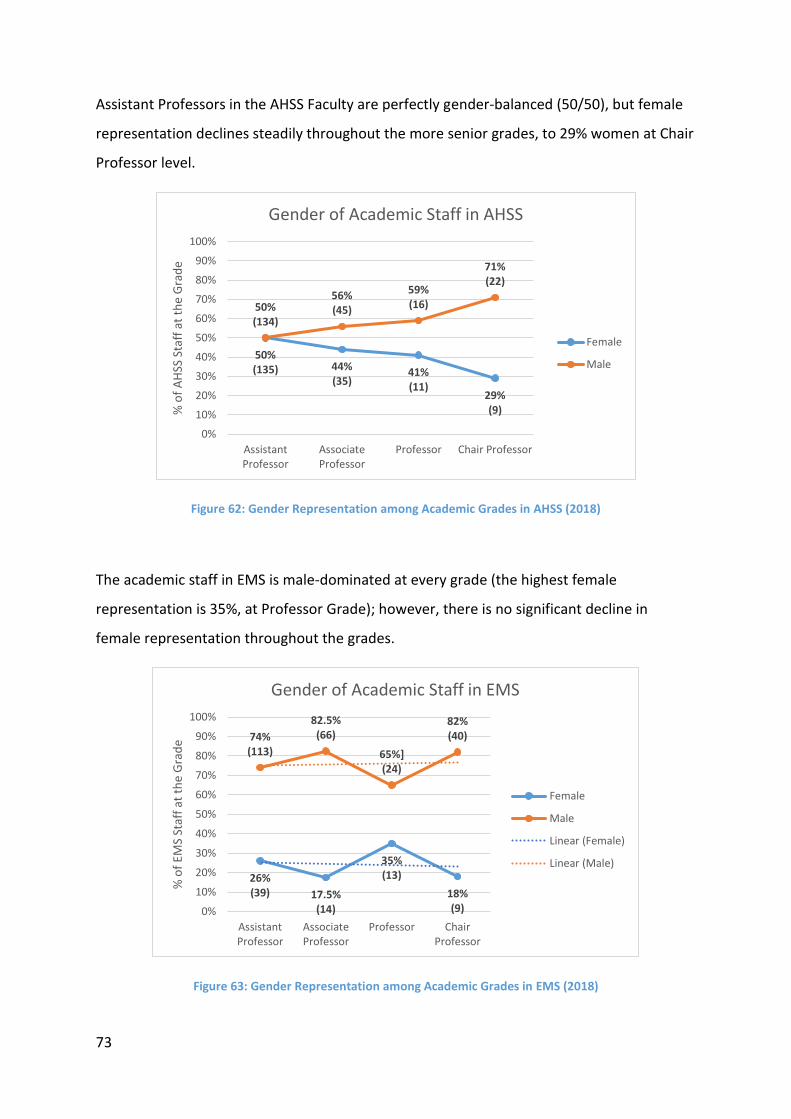
73
Assistant Professors in the AHSS Faculty are perfectly gender-balanced (50/50), but female
representation declines steadily throughout the more senior grades, to 29% women at Chair
Professor level.
Figure 62: Gender Representation among Academic Grades in AHSS (2018)
The academic staff in EMS is male-dominated at every grade (the highest female
representation is 35%, at Professor Grade); however, there is no significant decline in
female representation throughout the grades.
Figure 63: Gender Representation among Academic Grades in EMS (2018)
29%(9)
41%(11)
44%(35)
50%(135)
71%(22)
59%(16)
56%(45)50%
(134)
0%
10%
20%
30%
40%
50%
60%
70%
80%
90%
100%
Chair ProfessorProfessorAssociateProfessor
AssistantProfessor
% o
f A
HSS
Sta
ff a
t th
e G
rad
e
Gender of Academic Staff in AHSS
Female
Male
18%(9)
35%(13)
17.5%(14)
26%(39)
82%(40)
65%](24)
82.5%(66)74%
(113)
0%
10%
20%
30%
40%
50%
60%
70%
80%
90%
100%
ChairProfessor
ProfessorAssociateProfessor
AssistantProfessor
% o
f EM
S St
aff
at t
he
Gra
de
Gender of Academic Staff in EMS
Female
Male
Linear (Female)
Linear (Male)

74
Every grade of (non-medical) academic staff in HS is female-dominated. The first three
grades (Assistant Professor to Professor) are very similar in their gender breakdown (65% -
69% female), but the genders are closer at Chair Professor grade (57% female, 43% male).
Figure 64: Gender Representation among Academic Grades in HS (2018)
Medical academic grades do not follow a clear linear career path to the same extent as the
four non-medical academic grades. It is notable however that Physiotherapy, Occupational
Therapy and Nursing are heavily female-dominated (82%), while the more senior Consultant
grades are significantly male-dominated (71% - 75%).
Figure 65: Gender Representation among Medical Academic Grades in (2018)
57%(8)
69%(11)
65%(30)
67%(91)
43%(6)31%
(5)
35%(16)
33%(45)
0%
10%
20%
30%
40%
50%
60%
70%
80%
90%
100%
Chair ProfessorProfessorAssociateProfessor
AssistantProfessor
% o
f H
S St
aff
at t
he
Gra
de
Gender of Academic Staff in HS
Female
Male
82%(9)
82%(14)
56%(9)
53%(9)
50%(6) 29%
(5)25%(1)
18%(2)
18%(3)
44%(7)
47%(8)
50%(6) 71%
(12)75%(3)
0%
10%
20%
30%
40%
50%
60%
70%
80%
90%
100%
SeniorPhysio /
Senior OT
NurseTutor
AssistantProf /
LecturerRegistrar
Senior /SpecialistRegistrar
AssociateConsultant
ChairConsultant
ProfConsultant
% o
f St
aff
at t
he
Gra
de
Gender of Medical Academic Staff
Male
Female

75
Schools
Table 11 presents all Schools in descending order of female representation.
Just over half (13) of Schools are within a 60/40 gender ratio. Nine Schools have more than
60% male staff and two Schools have more than 60% female staff.
The most gender-imbalanced School is Physics, with 87% male staff.
Head School Women Female (%) Men Male (%) Total
F Nursing & Midwifery 69 78% 20 22% 89
F Linguistic, Speech & Communication Sciences 20 77% 6 23% 26
M Medicine 110 59% 78 41% 188
M Social Work & Social Policy 12 57% 9 43% 21
M Languages, Literatures & Cultural Studies 30 54% 26 46% 56
F Pharmacy & Pharmaceutical Sciences 13 50% 13 50% 26
M Dental Sciences 2 50% 2 50% 4
F Histories & Humanities 22 50% 22 50% 44
M Law 24 50% 24 50% 48
M Psychology 16 47% 18 53% 34
F English 14 47% 16 53% 30
F Religions, Peace Studies & Theology 10 45% 12 55% 22
M Education 12 44% 15 56% 27
M Creative Arts 7 44% 9 56% 16
M Business 18 43% 24 57% 42
F Social Sciences & Philosophy 23 33% 46 67% 69
M Natural Sciences 15 33% 30 67% 45
M Biochemistry & Immunology 7 29% 17 71% 24
M Genetics & Microbiology 7 29% 17 71% 24
F Computer Science & Statistics 22 27% 60 73% 82
M Chemistry 6 26% 17 74% 23
M Mathematics 5 20% 20 80% 25
M Engineering 13 19% 55 81% 68
M Physics 4 13% 26 87% 30 Table 11: Gender Representation among Academic Staff, by School (2018)

76
There are currently 16 male and 8 female Heads of School. An apparent trend towards more
equal gender representation among Heads of School, from 2010 – 2013, has stagnated.
Figure 66: Trend in Gender Representation among Heads of School (2010-2018)
56
89 9 9
78 8
1918
1615 15 15
1716 16
0
5
10
15
20
25
2010 2011 2012 2013 2014 2015 2016 2017 2018
Nu
mb
er o
f H
ead
s o
f Sc
ho
ol
Gender Trend in Heads of School
Female
Male
Linear (Female)
Linear (Male)
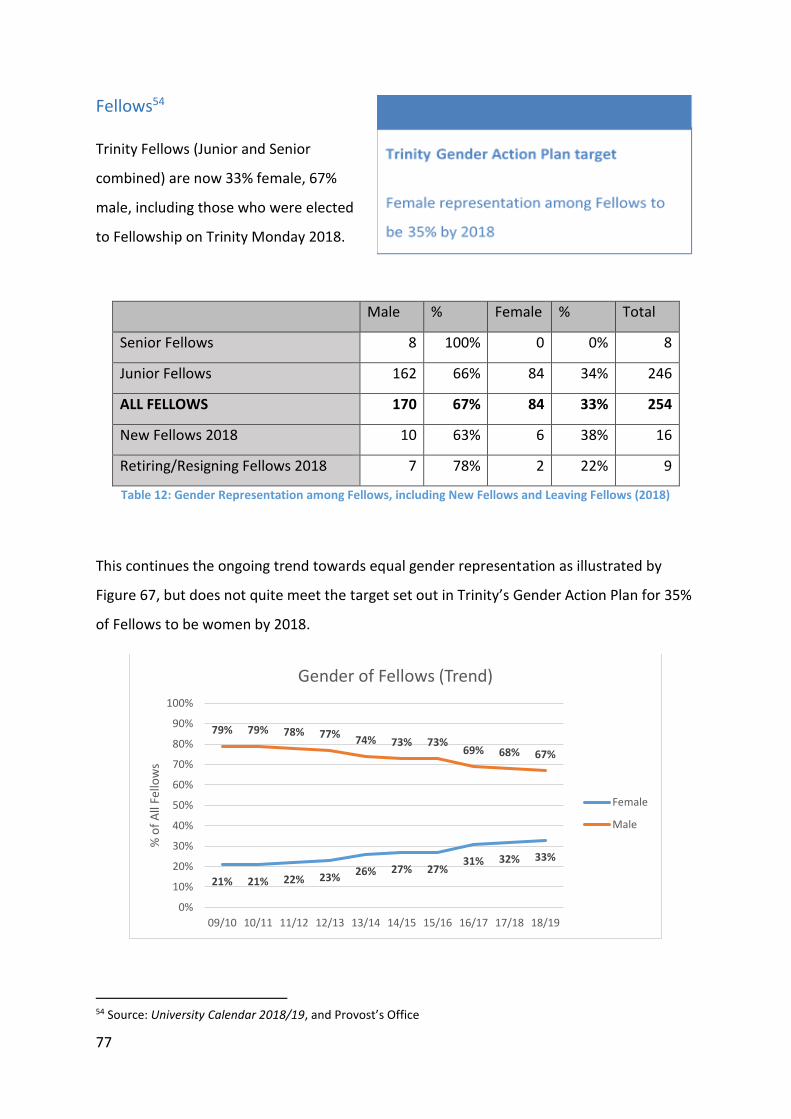
77
Fellows54
Trinity Fellows (Junior and Senior
combined) are now 33% female, 67%
male, including those who were elected
to Fellowship on Trinity Monday 2018.
Male % Female % Total
Senior Fellows 8 100% 0 0% 8
Junior Fellows 162 66% 84 34% 246
ALL FELLOWS 170 67% 84 33% 254
New Fellows 2018 10 63% 6 38% 16
Retiring/Resigning Fellows 2018 7 78% 2 22% 9
Table 12: Gender Representation among Fellows, including New Fellows and Leaving Fellows (2018)
This continues the ongoing trend towards equal gender representation as illustrated by
Figure 67, but does not quite meet the target set out in Trinity’s Gender Action Plan for 35%
of Fellows to be women by 2018.
54 Source: University Calendar 2018/19, and Provost’s Office
21% 21% 22% 23%26% 27% 27%
31% 32% 33%
79% 79% 78% 77%74% 73% 73%
69% 68% 67%
0%
10%
20%
30%
40%
50%
60%
70%
80%
90%
100%
09/10 10/11 11/12 12/13 13/14 14/15 15/16 16/17 17/18 18/19
% o
f A
ll Fe
llow
s
Gender of Fellows (Trend)
Female
Male

78
Figure 67: Gender Representation among All Fellows, 2009/10-2018/19
Table 12 shows that new Fellows elected in 2018 were 63% male, while Fellows who are
retiring or have resigned in 2018 are 78% male. This suggests that the primary cause of the
1% increase in female representation among Fellows in 2018/19 is the predominance of
men among the retiring generation of Fellows, rather than gender balance among new
Fellows.
2018 was the first year in which part-time staff were eligible to be elected to Fellowship.
This is a welcome and important change in terms of equality of opportunity for part-time
academic staff, however, it has not had a noticeable impact on the number of women
becoming Fellows in 2018.
Honorary Fellows
Two men were elected to Honorary Fellowship of Trinity College Dublin in 2018. The total
gender representation among Honorary Fellows remains exactly the same as it was in
2017/18 (83% male, 17% female) as two male Honorary Fellows have passed away.
Table 13: Gender Representation among Honorary Fellows (2017 and 2018)
Women Female (%) Men Male (%) TOTAL
Honorary Fellows 2017 8 17% 40 83% 48
Honorary Fellows 2018 8 17% 40 83% 48

79
Recruitment
Academic Recruitment5556
The majority (69%) of applicants to Assistant Professor positions in 2016/17 were male, but
appointees were gender-balanced (52% male), as female applicants were twice as successful
(4% success rate) as male applicants (2% success rate).
Figure 68: Gender of Applicants, Shortlisted and Appointed to Assistant Professor (2016/17)
Applicants to Associate Professor positions were more gender-balanced (53% female) than
applicants to Assistant Professor positions. Again, the female success rate (10%) was twice
as high as the male (5%), so women were the majority of those appointed (4 to 2).
Figure 69: Gender of Applicants, Shortlisted and Appointed to Associate Professor (2016/17)
55 Source for this section: HR Department, Recruitment section 56 Recruitment statistics are presented by academic year in this report, and will be going forward, to align with the Athena SWAN data collection process
31%(685)
36%(74)
48%(27)
69%(1546)
64%(130)
52%(29)
0%
20%
40%
60%
80%
100%
Applied Shortlisted Appointed
Recruitment to Assistant Professor
Male (2% success rate)
Female (4% success rate)
53%(42)
53%(9)
67%(4)
47%(37)
47%(8)
33%(2)
0%
20%
40%
60%
80%
100%
Applied Shortlisted Appointed
Recruitment to Associate Professor
Male (5% success rate)
Female (10% success rate)
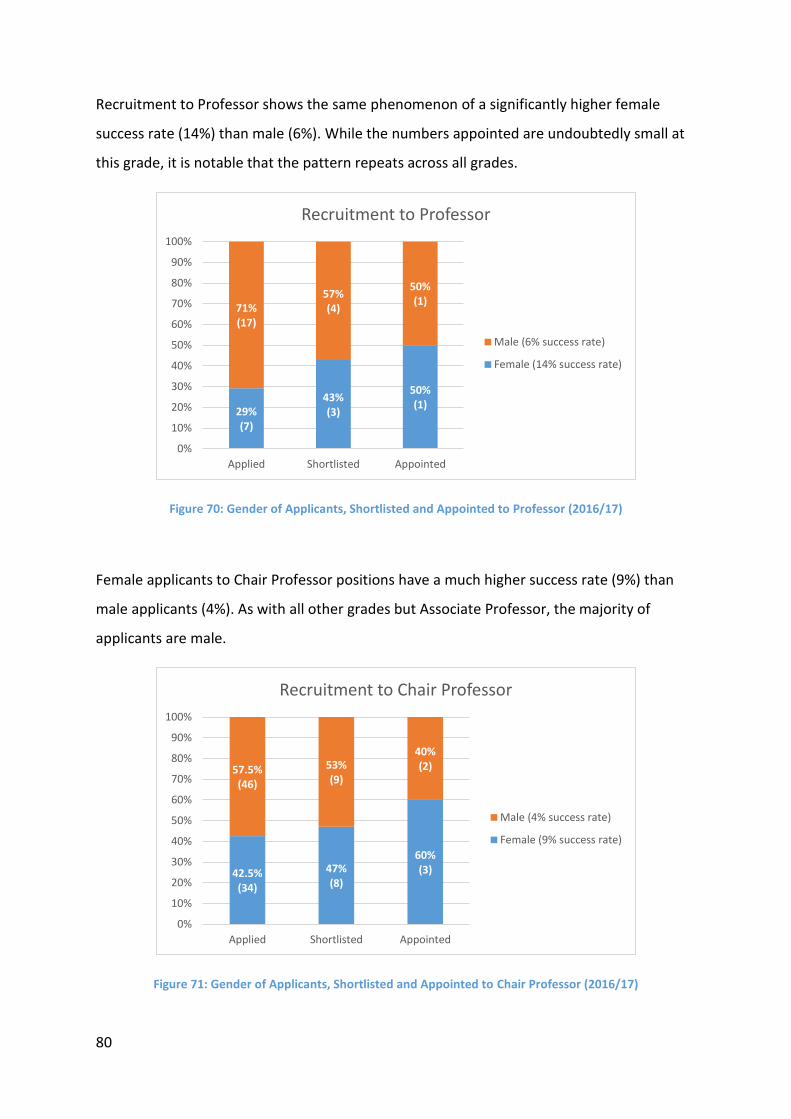
80
Recruitment to Professor shows the same phenomenon of a significantly higher female
success rate (14%) than male (6%). While the numbers appointed are undoubtedly small at
this grade, it is notable that the pattern repeats across all grades.
Figure 70: Gender of Applicants, Shortlisted and Appointed to Professor (2016/17)
Female applicants to Chair Professor positions have a much higher success rate (9%) than
male applicants (4%). As with all other grades but Associate Professor, the majority of
applicants are male.
Figure 71: Gender of Applicants, Shortlisted and Appointed to Chair Professor (2016/17)
29%(7)
43%(3)
50%(1)
71%(17)
57%(4)
50%(1)
0%
10%
20%
30%
40%
50%
60%
70%
80%
90%
100%
Applied Shortlisted Appointed
Recruitment to Professor
Male (6% success rate)
Female (14% success rate)
42.5%(34)
47%(8)
60%(3)
57.5%(46)
53%(9)
40%(2)
0%
10%
20%
30%
40%
50%
60%
70%
80%
90%
100%
Applied Shortlisted Appointed
Recruitment to Chair Professor
Male (4% success rate)
Female (9% success rate)
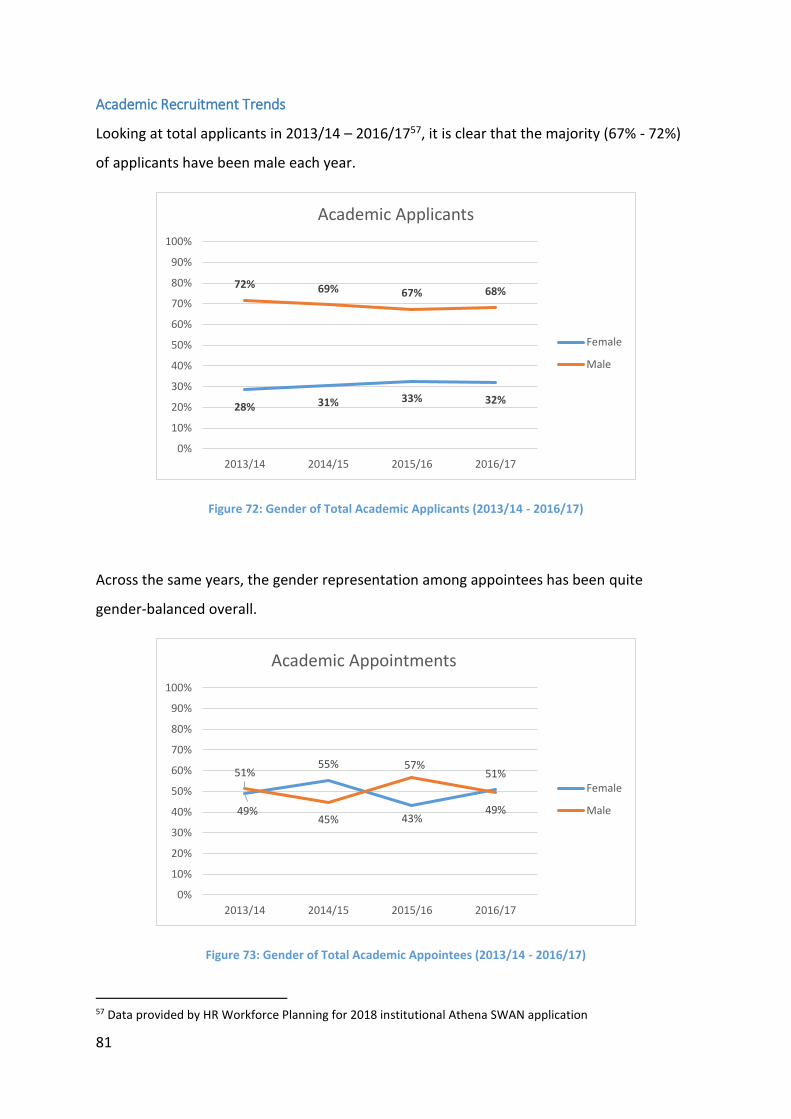
81
Academic Recruitment Trends
Looking at total applicants in 2013/14 – 2016/1757, it is clear that the majority (67% - 72%)
of applicants have been male each year.
Figure 72: Gender of Total Academic Applicants (2013/14 - 2016/17)
Across the same years, the gender representation among appointees has been quite
gender-balanced overall.
Figure 73: Gender of Total Academic Appointees (2013/14 - 2016/17)
57 Data provided by HR Workforce Planning for 2018 institutional Athena SWAN application
28% 31% 33% 32%
72% 69% 67% 68%
0%
10%
20%
30%
40%
50%
60%
70%
80%
90%
100%
2013/14 2014/15 2015/16 2016/17
Academic Applicants
Female
Male
49%
55%
43%
51%51%
45%
57%
49%
0%
10%
20%
30%
40%
50%
60%
70%
80%
90%
100%
2013/14 2014/15 2015/16 2016/17
Academic Appointments
Female
Male

82
Success rates of female applicants have been higher each year; the biggest difference was in
2014/15 in which 7% of female applicants, but 2% of male applicants, were successful.
Figure 74: Success Rates of Total Academic Applicants, by Gender (2013/14 - 2016/17)
Academic Selection Panels58
There were 40 academic recruitment competitions for which selection panels were noted to
Board in 2017. All of these panels were in compliance with the provision in the Recruitment
Procedures to ensure a gender mix, i.e., there were no single-gender selection panels.
Overall, the average gender balance across all panels was 46% female / 54% male (i.e.
within the 60:40 ratio to which the university has committed). However, the majority (60%)
of selection panels were not gender-balanced. 35% of panels were over 60% male, and 25%
of panels were over 60% female.
The average number of panellists was 4.9 and naturally, with small numbers some amount
of imbalanced panels will occur. However, one would expect the majority of panels to be
gender-balanced.
58 Source for this section: HR (memos to Board)
7%7%
3%
5%
3%2% 2% 2%
0%
1%
2%
3%
4%
5%
6%
7%
8%
9%
10%
2013/14 2014/15 2015/16 2016/17
Academic Recruitment Success Rates
Female
Male

83
Figure 75: Gender Balance / Imbalance of Academic Recruitment Selection Panels (2017)
Female representation differs across the Faculties; highest in HS (58% on average) and
lowest in EMS (30% on average). Both AHSS and EMS are outside a 60:40 gender balance on
average, with women under-represented on panels.
Figure 76: Average Female Representation on Academic Recruitment Selection Panels in each Faculty (2017)
40%(16) 35%
(14)
25%(10)
0%
5%
10%
15%
20%
25%
30%
35%
40%
45%
50%
Balanced Male-Dominated Female-Dominated
% o
f A
cad
emic
Rec
ruit
men
t P
anel
s
Gender Balance on Academic Recruitment Panels
58%
39%
30%
0%
10%
20%
30%
40%
50%
60%
70%
80%
90%
100%
HS AHSS EMS
Ave
rage
Fem
ale
Rep
rese
nta
tio
n o
n
Pan
els
Female Representation on Academic Recruitment Panels by Faculty

84
USSHER Programme59
The USSHER II Assistant Professor Programme runs from 2016-2021; the USSHER I
Programme ran from 2011-2016. In each Programme, 38 Assistant Professors were
appointed.
The USSHER I intake was 19 women and 19 men, i.e. precisely gender-balanced.
The USSHER II intake is 74% male, 26% female. This reflects the gender of applicants and
indeed male and female applicants had very similar success rates (3.6% and 3.4%
respectively).
The predominance of men among applicants may relate to the Faculty spread of USSHER II
posts; 9 in HS, 12 in AHSS and 17 in EMS.
Figure 77: Gender of Applicants, Shortlisted and Appointed in USSHER II Programme (2016)
59 Source for this section: HR Workforce Planning
73%(788)
70%(114)
74%(28)
27%(292)
30%(48)
26%(10)
0%
10%
20%
30%
40%
50%
60%
70%
80%
90%
100%
Applicants Shortlisted Appointed
Gender of USSHER II Assistant Professors
Female
Male

85
Professional Recruitment6061
The majority of applicants (58%), shortlisted (60%), and appointed (60%) were female.
Female applicants had a slightly higher success rate (4%) than male applicants (3.7%).
Figure 78: Gender of Applicants, Shortlisted and Appointed in Total Professional Recruitment (2017)
The male success rate was slightly higher than the female across the Divisions, except in
Financial Services (FSD) where the female success rate (8%) was twice as high as the male
(4%). It is worth bearing in mind the small total number of appointments (8) in FSD.
Figure 79: Gender of Applicants and Appointed in Professional Recruitment, by Division (2017)
60 Source for this section: HR Department, Recruitment section 61 From 1 January 2017 to 31 December 2017, 245 professional appointments were made. Five of these have
been discounted from the figures below as gender figures were not recorded at shortlisting stage; so a total of 240 professional appointments are presented. It is not mandatory to disclose gender at application stage, and 157 applicants were of “unknown” gender. These have been removed from the figures to facilitate gender analysis.
58%(3578)
60%(558)
60%(142)
42%(2627)
40%(379)
40%(96)
0%
20%
40%
60%
80%
100%
Applied Shortlisted Appointed
Professional Recruitment
Male (3.7% success rate)
Female (4.0% success rate)
62%(515)
57%(21)
38%(315)
43%(16)
0%
50%
100%
Applied Appointed
ASD
Male (5% success rate)
Female (4% success rate)
54%(2328)
46%(52)
46%(1948)
54%(60)
0%
50%
100%
Applied Appointed
CSD
Male (3% success rate)
Female (2% success rate)
45%(61)
62.5%(5)
55%(76)
37.5%(3)
0%
50%
100%
Applied Appointed
FSD
Male (4% success rate)
Female (8% success rate)

86
The male success rate was also slightly higher in the EMS Faculty; but the female success
rate was significantly higher in both the AHSS and the HS Faculty. These are likely to be the
areas pushing the female success rate up above the male overall; they are also the areas
with the highest proportion of female applicants.
Figure 80: Gender of Applicants and Appointed in Professional Recruitment, by Faculty (2017)
73%(294)
89%(24)
27%(110)
11%(3)
0%
50%
100%
Applied Appointed
AHSS
Male (3% success rate)
Female (8% success rate)
65%(241)
61%(19)
35%(130)
39%(12)
0%
50%
100%
Applied Appointed
EMS
Male (9% success rate)
Female (8% success rate)
76%(134)
87%(24)
24%(43)
13%(3)
0%
50%
100%
Applied Appointed
HS
Male (7% success rate)
Female (15% success rate)

87
Promotions62
Trinity will […] ensure that all staff enjoy equal access to progression and
promotional opportunities regardless of any of the nine equality grounds
Equality Policy
Senior Academic Promotions
63% of staff promoted in the 2017 Senior Academic Promotions round were male. This is a
slightly higher male representation than is found in the eligible cohort for promotion (57%
male).
Figure 81: Gender of Eligible Cohort, Applicants and Promoted in Senior Academic Promotions (2017)
Women had slightly lower application rates and success rates (having applied).
Female Male
Application Rate 13% 15%
Success Rate 42% 47%
62 Source for this section: HR Performance and Review
43%(243)
40%(31)
37%(13)
57%(323)
60%(47)
63%(22)
0%
10%
20%
30%
40%
50%
60%
70%
80%
90%
100%
Eligible Applied Promoted
Total Senior Academic Promotions
Male
Female
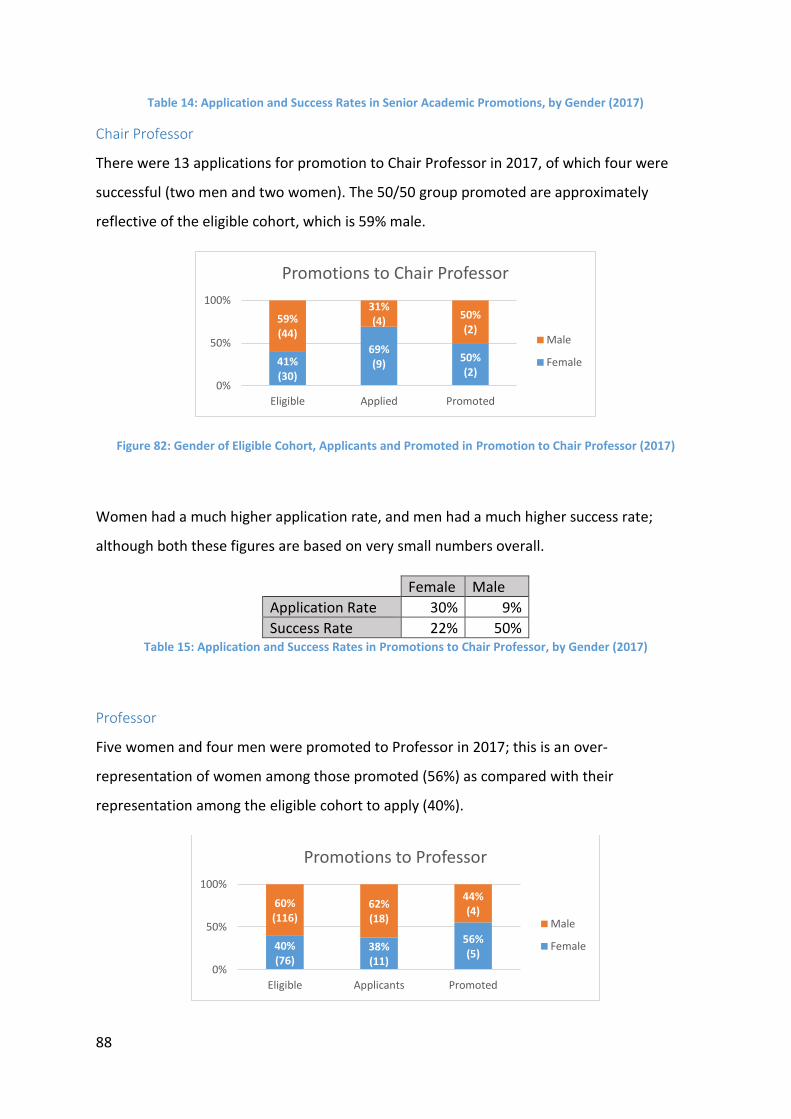
88
Table 14: Application and Success Rates in Senior Academic Promotions, by Gender (2017)
Chair Professor
There were 13 applications for promotion to Chair Professor in 2017, of which four were
successful (two men and two women). The 50/50 group promoted are approximately
reflective of the eligible cohort, which is 59% male.
Figure 82: Gender of Eligible Cohort, Applicants and Promoted in Promotion to Chair Professor (2017)
Women had a much higher application rate, and men had a much higher success rate;
although both these figures are based on very small numbers overall.
Female Male
Application Rate 30% 9%
Success Rate 22% 50% Table 15: Application and Success Rates in Promotions to Chair Professor, by Gender (2017)
Professor
Five women and four men were promoted to Professor in 2017; this is an over-
representation of women among those promoted (56%) as compared with their
representation among the eligible cohort to apply (40%).
41%(30)
69%(9)
50%(2)
59%(44)
31%(4)
50%(2)
0%
50%
100%
Eligible Applied Promoted
Promotions to Chair Professor
Male
Female
40%(76)
38%(11)
56%(5)
60%(116)
62%(18)
44%(4)
0%
50%
100%
Eligible Applicants Promoted
Promotions to Professor
Male
Female

89
Figure 83: Gender of Eligible Cohort, Applicants and Promoted in Promotion to Professor (2017)
The male and female application rates for promotion to Professor were quite similar, but
the female success rate was much higher.
Female Male
Application Rate 14% 16%
Success Rate 45% 22% Table 16: Application and Success Rates in Promotions to Professor, by Gender (2017)
Associate Professor
73% of staff promoted to Associate Professor in 2017 were male. Even though the eligible
cohort is nearly gender-balanced (54% male), women did not apply in proportion to their
representation, so 69% of applications were male.
Figure 84: Gender of Eligible Cohort, Applicants and Promoted in Promotion to Associate Professor (2017)
Women applied for promotion to Associate Professor at roughly half the rate of their male
colleagues, and men had a somewhat higher success rate.
Female Male
Application Rate 8% 15%
Success Rate 55% 64% Table 17: Application and Success Rates in Promotions to Associate Professor, by Gender (2017)
46%(137)
31%(11)
27%(6)
54%(163)
69%(25)
73%(16)
0%
50%
100%
Eligible Applicants Promoted
Promotions to Associate Professor
Male
Female

90
Junior Academic Progression
Male and female success rates were very similar (56% and 53% respectively) in Junior
Academic Progression in 2017, and the cohort who progressed were well gender-balanced
(47% male, 53% female).
Figure 85: Gender of Total Applicants and Progressed in Junior Academic Progression (2017)
It should be noted that the majority of applicants (50/55) for junior academic progression
were assessed by the Junior Academic Progression Committee. However, five were assessed
by a subcommittee of the Senior Academic Promotions Committee. This subcommittee
assessed the applications of Junior Academics who were over the Merit Bar, had completed
3 years’ service in Trinity and wished to apply for accelerated advancement. The figures for
both cohorts are presented below for full transparency.
F+M Female Male
Senior Academic Promotions Sub-
Committee
Total applicants 5 4 1
Successful 0 0 0
Unsuccessful 5 4 1
Junior Academic Progressions Committee
Total applicants 50 26 24
Successful 30 16 14
Unsuccessful 20 10 10 Table 18: Gender Breakdown of Progressions by SAPC Subcommittee and JAPC
55%(30)
53%(16)
45%(25)
47%(14)
0%
10%
20%
30%
40%
50%
60%
70%
80%
90%
100%
Applied Promoted
Junior Academic Progression
Male
Femalesuccess rate: 53%
success rate: 56%

91
Professional Promotions
The Administrative and Library promotion call saw women having a higher success rate
(36%) than men (25%), and women making up the vast majority of those applying (76%) and
promoted (82%). 3 candidates (2 female, 1 male) are pending decision at time of
publication. They are included in the “Applied” figures but not “Promoted”.
Figure 86: Gender of Total Applicants and Promoted in Administrative & Library Promotions (2017)
The opposite occurred in Secretarial & Executive Promotions, where men had a higher
success rate (75%) than women (58%). Women predominate throughout applicants (87%
female) and successful applicants (84% female).
Figure 87: Gender of Total Applicants and Promoted in Secretarial & Executive Promotions (2017)
76%(113)
82%(41)
24%(36)
18%(9)
0%
20%
40%
60%
80%
100%
Applied Promoted
Administrative & Library Promotions
Male
Female
success rate: 25%
success rate: 36%
87%(106)
84%(62)
13% (16) 16% (12)
0%
20%
40%
60%
80%
100%
Applied Promoted
Secretarial & Executive Promotions
Male
Femalesuccess rate: 58%
success rate: 75%
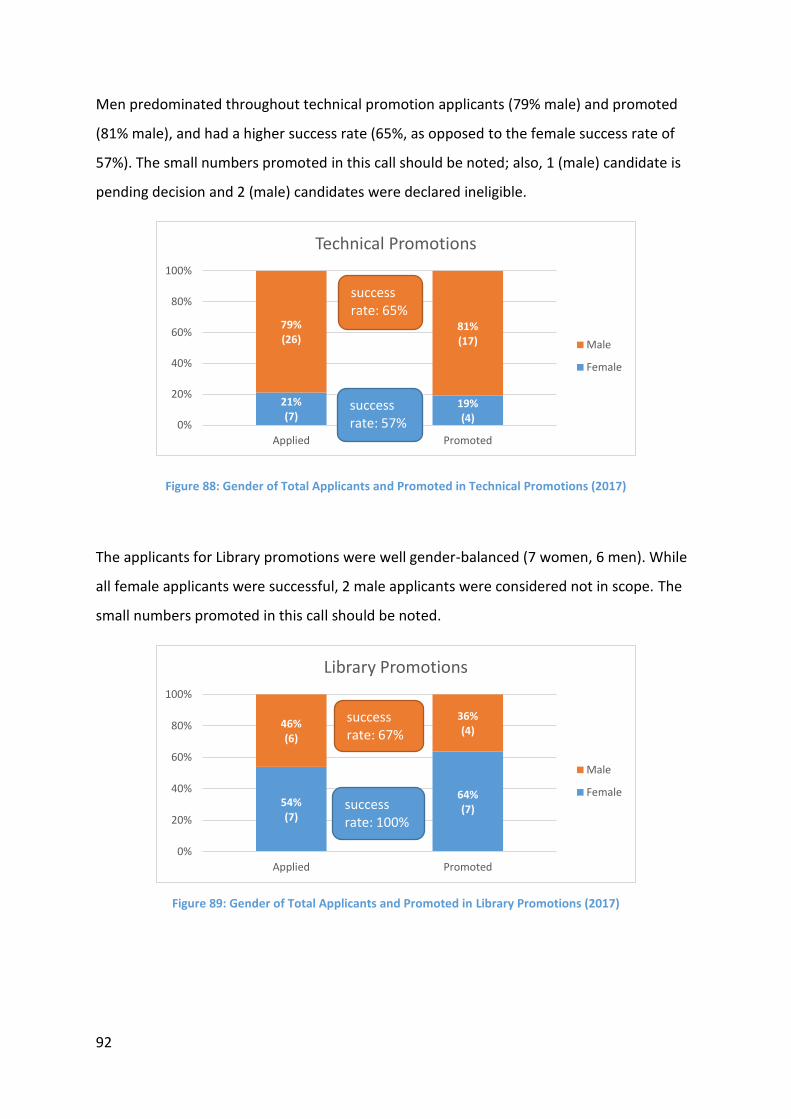
92
Men predominated throughout technical promotion applicants (79% male) and promoted
(81% male), and had a higher success rate (65%, as opposed to the female success rate of
57%). The small numbers promoted in this call should be noted; also, 1 (male) candidate is
pending decision and 2 (male) candidates were declared ineligible.
Figure 88: Gender of Total Applicants and Promoted in Technical Promotions (2017)
The applicants for Library promotions were well gender-balanced (7 women, 6 men). While
all female applicants were successful, 2 male applicants were considered not in scope. The
small numbers promoted in this call should be noted.
Figure 89: Gender of Total Applicants and Promoted in Library Promotions (2017)
21%(7)
19%(4)
79%(26)
81%(17)
0%
20%
40%
60%
80%
100%
Applied Promoted
Technical Promotions
Male
Female
success rate: 65%
success rate: 57%
54%(7)
64%(7)
46%(6)
36%(4)
0%
20%
40%
60%
80%
100%
Applied Promoted
Library Promotions
Male
Femalesuccess rate: 100%
success rate: 67%

93
Promotion and Progression Committees
Of the six bodies which evaluated staff promotion and progression applications in 2017/18,
four were within a 60:40 gender ratio. The Administrative and Library Review Committee
was 63% female and the Technical Review Committee was 64% male. On average, the six
bodies were 46% female and 54% male.
Figure 90: Gender Representation on Promotion and Progression Committees (2017/18)
62.5%(5) 50%
(3)44%(4)
43%(3)
43%(3)
36%(4)
37.5%(3) 50%
(3)56%(5)
57%(4)
57%(4)
64%(7)
0%
10%
20%
30%
40%
50%
60%
70%
80%
90%
100%
Admin &Library
Sec & Exec JuniorAcademic
SAPCSubcommittee
SeniorAcademic
Technical
Gender of Promotion & Progression Committees
Male
Female
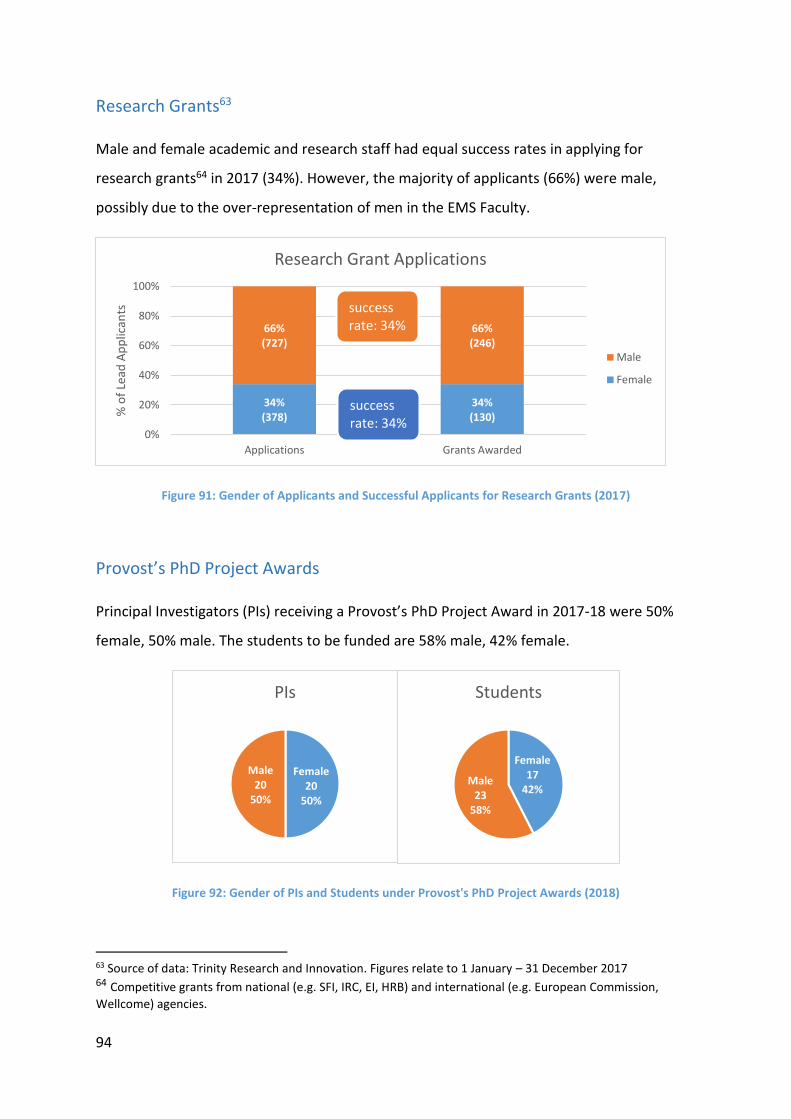
94
Research Grants63
Male and female academic and research staff had equal success rates in applying for
research grants64 in 2017 (34%). However, the majority of applicants (66%) were male,
possibly due to the over-representation of men in the EMS Faculty.
Figure 91: Gender of Applicants and Successful Applicants for Research Grants (2017)
Provost’s PhD Project Awards
Principal Investigators (PIs) receiving a Provost’s PhD Project Award in 2017-18 were 50%
female, 50% male. The students to be funded are 58% male, 42% female.
Figure 92: Gender of PIs and Students under Provost's PhD Project Awards (2018)
63 Source of data: Trinity Research and Innovation. Figures relate to 1 January – 31 December 2017 64 Competitive grants from national (e.g. SFI, IRC, EI, HRB) and international (e.g. European Commission,
Wellcome) agencies.
34%(378)
34%(130)
66%(727)
66%(246)
0%
20%
40%
60%
80%
100%
Applications Grants Awarded
% o
f Le
ad A
pp
lican
ts
Research Grant Applications
Male
Female
success rate: 34%
success rate: 34%
Female20
50%
Male20
50%
PIs
Female17
42%Male
2358%
Students

95
Nationality
Academic Staff
61% of academic staff are Irish, and 39% are “international”, comprising 58 different
nationalities.
AdvanceHE figures65 show that 30.1% of academic staff in the UK are not UK nationals66.
Trinity is therefore more international in terms of its academic staff, than the UK higher
education sector average.
By far the most common nationality of international staff in Trinity is British (14% of all
staff), followed by other Western European, North American and Asian countries.
Figure 93: Ten Most Common Nationalities of Academic Staff after Irish (2018)
This is quite different to the national picture, which has a higher representation of Eastern
European nationalities, and lower representation of Western European and Northern
American nationalities than in Trinity.
65 Comparative data in the Irish HE sector is not available for country of domicile / nationality 66 Equality and Higher Education: Staff Statistical Report 2018, AdvanceHE, p31
14%(143)
3%(36) 3%
(27)3%(26)
2%(19)
1%(14)
1%(12)
1%(11)
1%(8)
1%(6)
1%(6)
0%
2%
4%
6%
8%
10%
12%
14%
16%
% o
f A
ll A
cad
emic
Sta
ff
Nationality of Academic Staff

96
Trinity appears to have seven times as many UK nationals among its staff than are resident
in Ireland overall. However, Trinity staff records include Northern Ireland in “Irish”, so
“British” in Figure 93 does not comprise the whole UK. It is highly likely therefore that Trinity
has an even larger proportion of UK nationals among its staff.
Nationality % of population resident in Ireland
% of Trinity academic staff
Difference
Polish 3% 0.5% -2.5%
UK 2% 14% +12%
Lithuanian 0.8% 0% -0.8%
Romanian 0.6% 0.2% -0.4%
Latvian 0.4% 0% -0.4%
Brazilian 0.3% 0.5% +0.2%
Spanish 0.3% 2% +2%
Italian 0.3% 3% +3%
French 0.2% 1% +0.8%
German 0.2% 3% +3% Table 19: Nationality of Academic Staff (2018) Compared with Census 2016
Approximately two thirds (69%) of the international academic staff are of an EU nationality.
Significant proportions are Asian (9%), North American (9%) and other European (7%).
Smaller proportions are South American, African, or Oceanian (2% each).
Figure 94: Nationality of Academic Staff - excluding Irish - grouped by Continent (2018)
69%(275)
9%(36)
9%(35)
7%(28)
2%(9)
2%(8)
2%(8)
International Academic Staff by Continent
Europe EU
Asia
America North
Europe non-EU
America South
Africa
Oceania

Schools
Proportions of Irish / international staff vary greatly between Schools, and 7 Schools have more international than Irish staff. The “most
international” School is the School of Mathematics, which has 80% international academic staff. There appears to be less international
representation in the more vocational disciplines, such as Health Sciences, Social Work, Engineering, Law and Education67.
Figure 95: Percentage of Academic Staff in each School who are of a Nationality other than Irish (2018)
67 These figures exclude those academic staff whose nationality is not recorded
80%73% 73%
60% 59% 55% 52% 50% 50% 48%42% 41% 38% 35% 33% 32% 29% 27% 27% 26% 25% 24%
14%
20%27% 27%
40% 41% 45% 48% 50% 50% 52%58% 59% 62% 65% 67% 68% 71% 73% 73% 74% 75% 76%
86%
0%
10%
20%
30%
40%
50%
60%
70%
80%
90%
100%
% o
f Sc
ho
ol S
taff
International Academic Staff by School
Irish
International
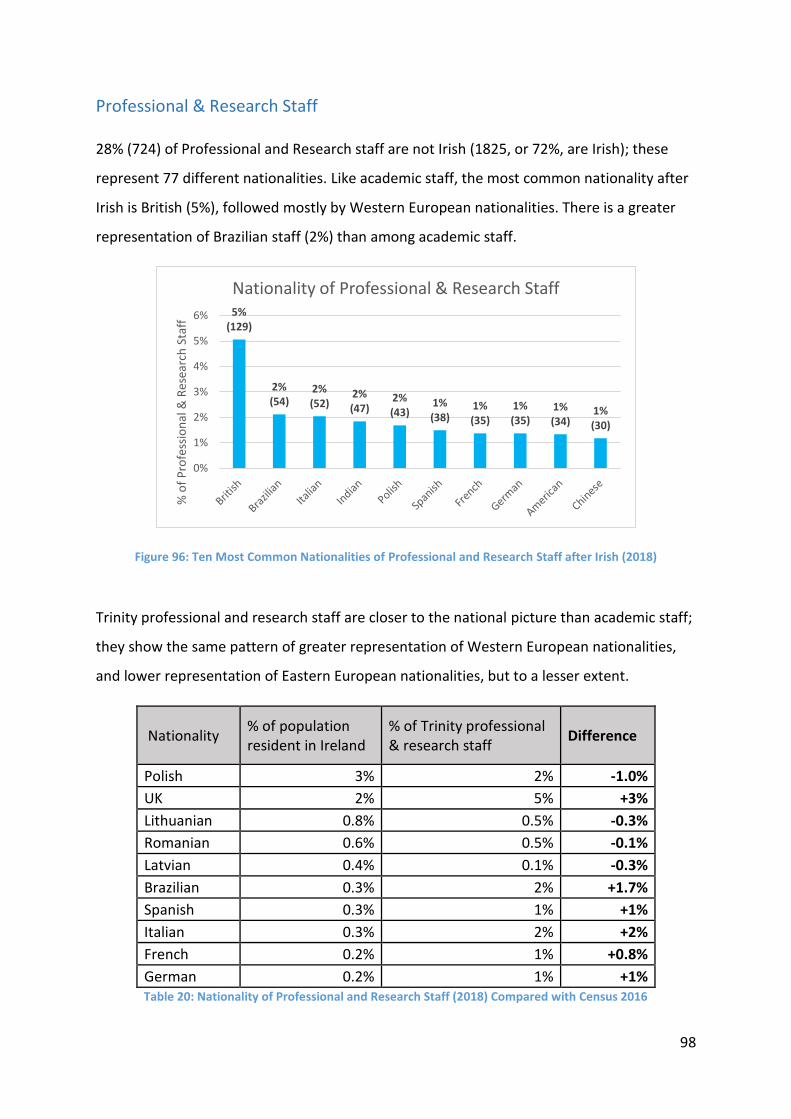
98
Professional & Research Staff
28% (724) of Professional and Research staff are not Irish (1825, or 72%, are Irish); these
represent 77 different nationalities. Like academic staff, the most common nationality after
Irish is British (5%), followed mostly by Western European nationalities. There is a greater
representation of Brazilian staff (2%) than among academic staff.
Figure 96: Ten Most Common Nationalities of Professional and Research Staff after Irish (2018)
Trinity professional and research staff are closer to the national picture than academic staff;
they show the same pattern of greater representation of Western European nationalities,
and lower representation of Eastern European nationalities, but to a lesser extent.
Nationality % of population resident in Ireland
% of Trinity professional & research staff
Difference
Polish 3% 2% -1.0%
UK 2% 5% +3%
Lithuanian 0.8% 0.5% -0.3%
Romanian 0.6% 0.5% -0.1%
Latvian 0.4% 0.1% -0.3%
Brazilian 0.3% 2% +1.7%
Spanish 0.3% 1% +1%
Italian 0.3% 2% +2%
French 0.2% 1% +0.8%
German 0.2% 1% +1% Table 20: Nationality of Professional and Research Staff (2018) Compared with Census 2016
5%(129)
2%(54)
2%(52)
2%(47)
2%(43)
1%(38)
1%(35)
1%(35)
1%(34)
1%(30)
0%
1%
2%
3%
4%
5%
6%
% o
f P
rofe
ssio
nal
& R
esea
rch
Sta
ff
Nationality of Professional & Research Staff

99
41% of international professional and research staff are from outside the EU. Asia (17%),
South America (8%), Europe non-EU (5%) and Africa (4%) all have higher representation
among international professional and research staff, than among international academic
staff.
Figure 97: Nationality of Professional and Research Staff - excluding Irish - grouped by Continent (2018)
42859%
12017%
618%
456%
365%
274%
71%
International Professional & Research Staff by Continent
Europe EU
Asia
America South
America North
Europe non-EU
Africa
Oceania

100
Religion
Diversity Detail
The most common religion among staff, according to the Diversity Detail (response rate is
11% to this question), is Roman Catholic (45% of staff). Almost as many (40% of) staff have
no religion. Just over 5% of staff are Church of Ireland, Presbyterian or Methodist; 3% are
Muslim; 1% are Hindu and just under 1% are Jewish.
Figure 98: Religion of Total Staff from Diversity Detail (2018)
National Comparison
In terms of religion, Trinity Diversity Detail categories do not all map directly onto Census
categories but some useful comparisons can be made.
Trinity staff are significantly (35 percentage points) less likely to be Roman Catholic than the
general population, and correspondingly (30 percentage points) more likely to have no
religion.
45%(196)
40%(171)
5%(20)
4%(19) 3%
(12)
1%(5) 0.9%
(4)0.7%(3)
0.2%(1)
Religion of Staff
Roman Catholic
No Religion
Other
Church Of Ireland
Muslim
Hindu
Presbyterian
Jewish
Methodist
Response rate = 11%
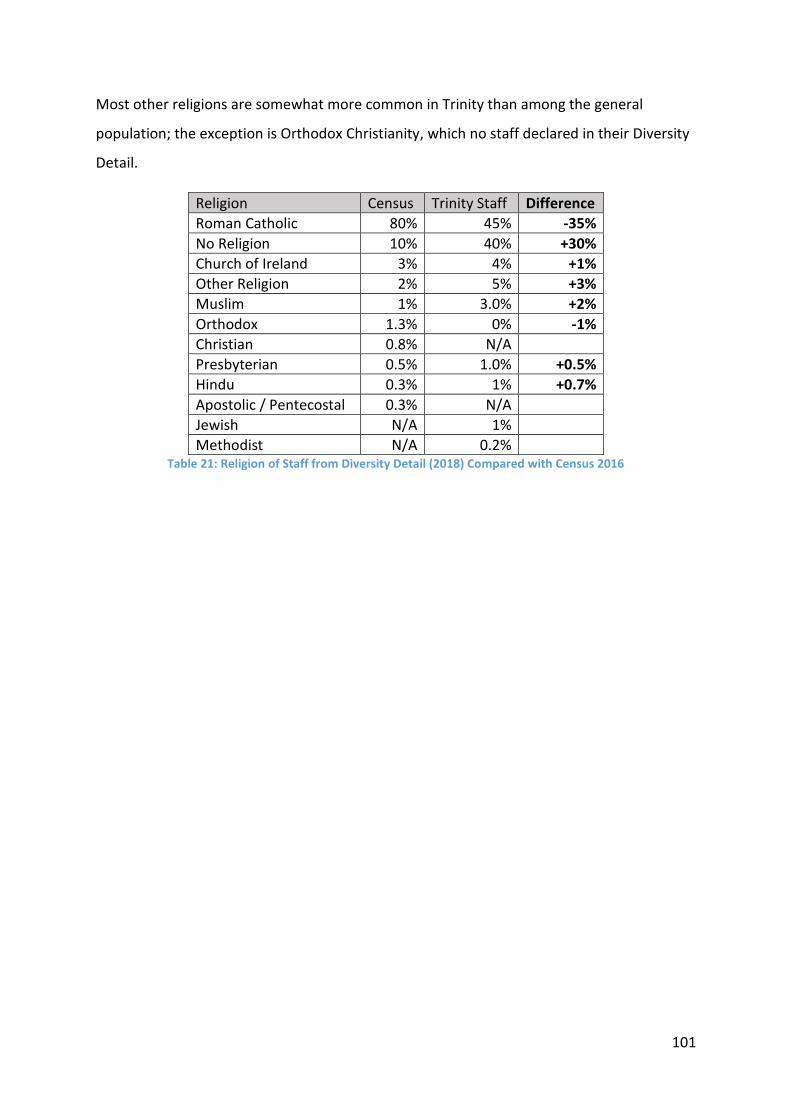
101
Most other religions are somewhat more common in Trinity than among the general
population; the exception is Orthodox Christianity, which no staff declared in their Diversity
Detail.
Religion Census Trinity Staff Difference
Roman Catholic 80% 45% -35%
No Religion 10% 40% +30%
Church of Ireland 3% 4% +1%
Other Religion 2% 5% +3%
Muslim 1% 3.0% +2%
Orthodox 1.3% 0% -1%
Christian 0.8% N/A
Presbyterian 0.5% 1.0% +0.5%
Hindu 0.3% 1% +0.7%
Apostolic / Pentecostal 0.3% N/A
Jewish N/A 1%
Methodist N/A 0.2% Table 21: Religion of Staff from Diversity Detail (2018) Compared with Census 2016

102
Sexual Orientation
According to the Diversity Detail (response rate is 10% to this question), almost 9 in 10
(89%) of Trinity staff are heterosexual. A further 9% are gay or lesbian, 1% bisexual and 1.5%
other.
Figure 99: Sexual Orientation of Total Staff from Diversity Detail (2018)
89%(352)
9%(34)
1.5%(6)
1%(4)
Sexual Orientation of Staff
Heterosexual
Gay / Lesbian
Other
Bisexual
Responserate = 10%

103
Recruitment Equality Monitoring68
Age
Recruitment applicants are stratified by age, with 22% of applicants being 31-35 but less
than 1% total being from the under 20 or over 65 groups.
Figure 100: Age Representation among Recruitment Applicants (2017)
Most age groups were roughly equally successful, except the 36-40 group who were over-
represented by 5 percentage points among appointees (see Table 22 overleaf).
68 The Recruitment Equality Monitoring form is an optional form on e-recruitment, for all applicants
0.7%9%
19%22%
16%11%
9%7%
4%1.4%
0.2%0.02%
0% 5% 10% 15% 20% 25%
< 2020-2526-3031-3536-4041-4546-5051-5556-6061-6566-70
>70
% of Total Applicants
Age of Recruitment Applicants Response rate: 46%
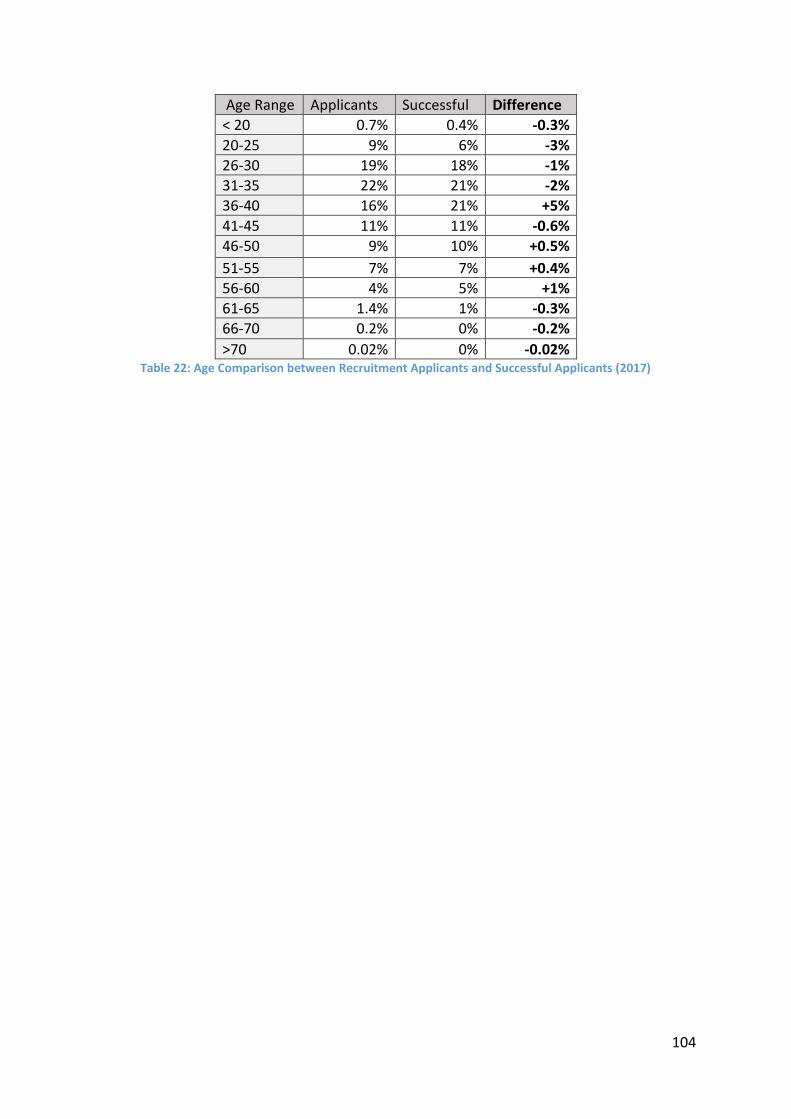
104
Age Range Applicants Successful Difference
< 20 0.7% 0.4% -0.3%
20-25 9% 6% -3%
26-30 19% 18% -1%
31-35 22% 21% -2%
36-40 16% 21% +5%
41-45 11% 11% -0.6%
46-50 9% 10% +0.5%
51-55 7% 7% +0.4%
56-60 4% 5% +1%
61-65 1.4% 1% -0.3%
66-70 0.2% 0% -0.2%
>70 0.02% 0% -0.02% Table 22: Age Comparison between Recruitment Applicants and Successful Applicants (2017)

105
Civil Status
36% of recruitment applicants are single, 23% married, 6% cohabiting, and smaller numbers
selected another civil status. A further 31% described their civil status as “other”.
Figure 101: Civil Status Representation among Recruitment Applicants (2017)
There is little difference in success rates by civil status group. One exception may be that the
“other” group made up 31% of applicants, but just 23% of successful applicants.
Civil Status Applicants Successful Difference
Single 36% 39% +3%
Other 31% 23% -8%
Married 23% 25% +2%
Cohabiting 6% 7% +1%
Undefined 1% 2% +1%
Divorced 1% 1% -0.1%
In A Civil Partnership 0.9% 0.5% -0.4%
Separated 0.8% 2% +1%
Widowed 0.1% 0.3% +0.2%
A Former Civil Partner 0.1% 0% -0.1%
A Surviving Civil Partner
0.01% 0% -0.01%
Table 23: Civil Status Comparison between Recruitment Applicants and Successful Applicants (2017)
36%(3265)
31%(2782)
23%(2043)
6%(512)
1%(108)
1%(99) 0.9%
(81)
0.8%(73)
0.1%(13)
0.1%(7)
0.01%(1)
Civil Status of Recruitment Applicants
Single
Other
Married
Cohabiting
Undefined
Divorced
In A Civil Partnership
Separated
Widowed
A Former Civil Partner
A Surviving Civil Partner
Response rate = 69%
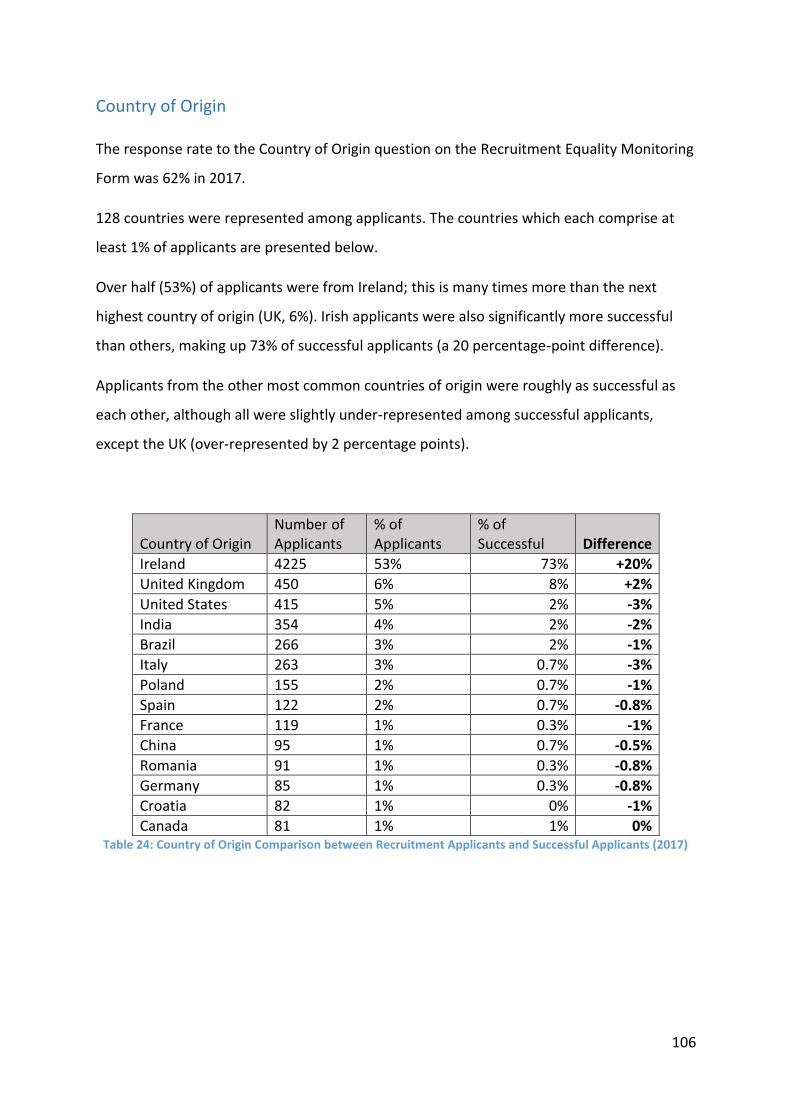
106
Country of Origin
The response rate to the Country of Origin question on the Recruitment Equality Monitoring
Form was 62% in 2017.
128 countries were represented among applicants. The countries which each comprise at
least 1% of applicants are presented below.
Over half (53%) of applicants were from Ireland; this is many times more than the next
highest country of origin (UK, 6%). Irish applicants were also significantly more successful
than others, making up 73% of successful applicants (a 20 percentage-point difference).
Applicants from the other most common countries of origin were roughly as successful as
each other, although all were slightly under-represented among successful applicants,
except the UK (over-represented by 2 percentage points).
Country of Origin Number of Applicants
% of Applicants
% of Successful Difference
Ireland 4225 53% 73% +20%
United Kingdom 450 6% 8% +2%
United States 415 5% 2% -3%
India 354 4% 2% -2%
Brazil 266 3% 2% -1%
Italy 263 3% 0.7% -3%
Poland 155 2% 0.7% -1%
Spain 122 2% 0.7% -0.8%
France 119 1% 0.3% -1%
China 95 1% 0.7% -0.5%
Romania 91 1% 0.3% -0.8%
Germany 85 1% 0.3% -0.8%
Croatia 82 1% 0% -1%
Canada 81 1% 1% 0% Table 24: Country of Origin Comparison between Recruitment Applicants and Successful Applicants (2017)
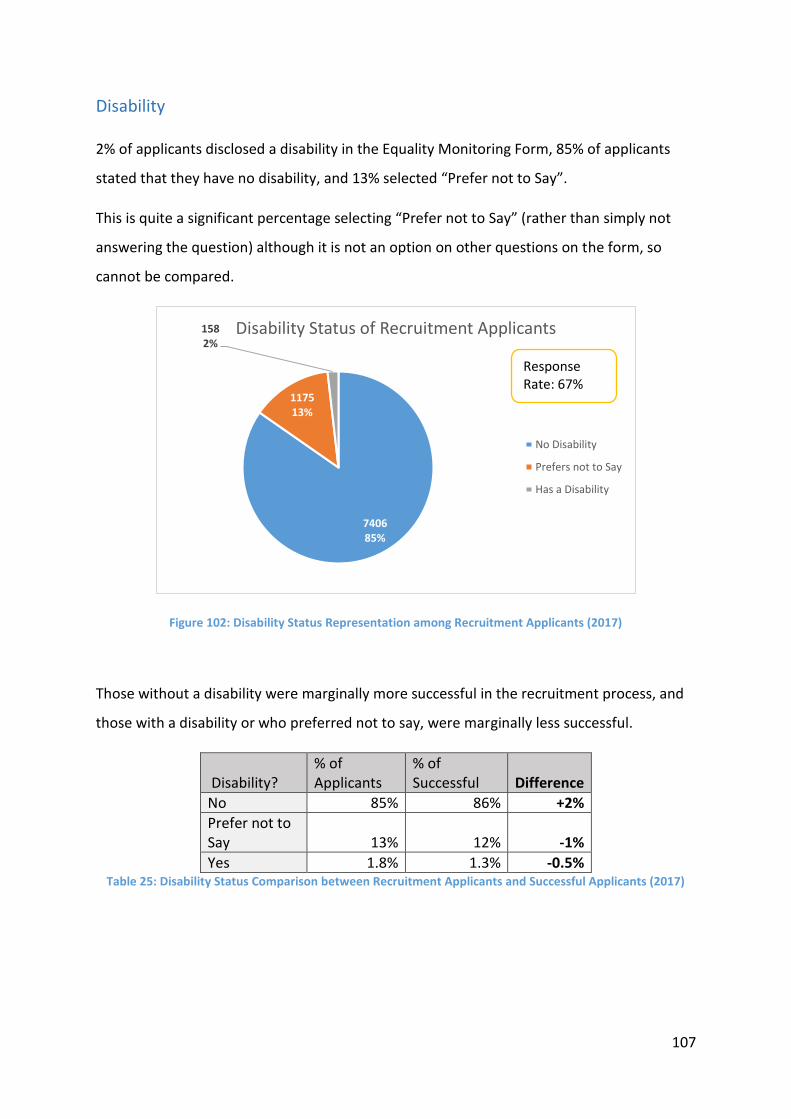
107
Disability
2% of applicants disclosed a disability in the Equality Monitoring Form, 85% of applicants
stated that they have no disability, and 13% selected “Prefer not to Say”.
This is quite a significant percentage selecting “Prefer not to Say” (rather than simply not
answering the question) although it is not an option on other questions on the form, so
cannot be compared.
Figure 102: Disability Status Representation among Recruitment Applicants (2017)
Those without a disability were marginally more successful in the recruitment process, and
those with a disability or who preferred not to say, were marginally less successful.
Disability? % of Applicants
% of Successful Difference
No 85% 86% +2%
Prefer not to Say 13% 12% -1%
Yes 1.8% 1.3% -0.5% Table 25: Disability Status Comparison between Recruitment Applicants and Successful Applicants (2017)
740685%
117513%
1582%
Disability Status of Recruitment Applicants
No Disability
Prefers not to Say
Has a Disability
Response Rate: 67%

108
Ethnic Origin
A majority (57%) of recruitment applicants in 2017 were Irish, almost one in three (29%)
were of another White background, and 0.3% (22 applicants) were Irish Traveller - a total of
86% White applicants. Other recruitment applicants were 7% Asian, 2% Black and 5% Other.
Figure 103: Ethnic Origin Representation among Recruitment Applicants (2017)
White Irish applicants are by far the most successful, improving their representation by 23
percentage points among successful applicants. On the other hand, Other White applicants
drop 16 percentage points. This corresponds with the findings in Table 24.
Ethnic Origin % of Applicants
% of Successful Difference
White (Irish) 57% 80% +23%
White (Other) 29% 13% -16%
Asian (Other) 5% 2% -3%
Other / Mixed Background 5% 3% -2%
Asian (Chinese) 2% 1% -1%
Black (African) 1.5% 1% -0.5%
Black (Other) 0.5% 0.4% -0.1%
White (Irish Traveller) 0.3% 0% -0.3% Table 26: Ethnic Origin Comparison between Recruitment Applicants and Successful Applicants (2017)
427857%
216329%
3585% 349
5%
1842%
1091%
361%
220.3%
Ethnic Origin of Recruitment Applicants
White (Irish)
White (Other)
Asian (Other)
Other / Mixed Background
Asian (Chinese)
Black (African)
Black (Other)
White (Irish Traveller)
Response Rate: 58%

109
Family Status
Almost two-thirds (65%) of applicants had no parenting or other caring responsibilities,
while a quarter were a parent of a person under 18. Very few (7) applicants were the
resident primary carer of a person with a disability. 10% selected “other”, suggesting that
the legal categories69 reflected in the form do not cover all family situations.
Figure 104: Family Status Representation among Recruitment Applicants (2017)
Parents are slightly over-represented among successful applicants, and those with “other”
family status are under-represented to the same degree (4 percentage points).
No resident primary carer of a person with a disability was successful, but given that only 7
applied no reliable conclusions can be drawn from this fact.
Family Status % of Applicants
% of Successful Difference
No Caring / Parenting Responsibilities 65% 65% 0%
Parent Of A Person Under 18 25% 29% +4%
Other 10% 6% -4%
Resident Primary Carer (Disability) 0.1% 0% -0.1% Table 27: Family Status Comparison between Recruitment Applicants and Successful Applicants (2017)
69 Based on the definition of “family status” in the Employment Equality Acts 1998-2015 and Equal Status Acts 2000-2015
491865%
185325%
77410%
70.1%
Family Status of Recruitment Applicants
No Caring / ParentingResponsibilities
Parent Of A Person Under 18
Other
Resident Primary Carer(Disability)
Response Rate: 58%

110
Religion
The most common religion of recruitment applicants was Roman Catholic (44%), while other
religions have smaller representation. 4% of applicants were Hindu, 2% were Muslim and
0.5% were Jewish. Christian denominations other than Catholic make up 6% of the total.
The second most common response to the religion question was “none” (33% of applicants).
Figure 105: Religion Representation among Recruitment Applicants (2017)
Applicants of no religion are over-represented among successful applicants (by 7 percentage
points); applicants of “other” and Hindu religion are under-represented (by 4 and 3
percentage points respectively).
Religion % of Applicants % of Successful Difference
Roman Catholic 44% 45% +1%
None 34% 41% +7%
Other 11% 7% -4%
Hindu 4% 0.4% -3%
Church Of Ireland 4% 4% +0.4%
Muslim 3% 2% -0.6%
Presbyterian 1% 0.7% -0.2%
Methodist 1% 0.4% -0.3%
Jewish 0% 0% 0% Table 28: Religion Comparison between Recruitment Applicants and Successful Applicants (2017)
321444%
245833%
77711%
2684%
2644%
1902%
690.9%
490.7%
360.5%
Religion of Recruitment Applicants
Roman Catholic
None
Other
Hindu
Church Of Ireland
Muslim
Presbyterian
Methodist
Jewish
Response Rate: 56%

111
Sexual Orientation
90% of recruitment applicants were heterosexual, 4% gay or lesbian, 3% bisexual and 4%
other.
Figure 106: Sexual Orientation Representation among Recruitment Applicants (2017)
Heterosexual applicants were somewhat (4 percentage points) over-represented among
successful applicants; applicants of “Other” sexual orientation were under-represented to a
similar degree (3 percentage points), while gay, lesbian and bisexual applicants were
successful in proportion to their applicant numbers.
Sexual Orientation
% of Applicants % of Successful Difference
Heterosexual 90% 94% +4%
Gay / Lesbian 4% 4% 0%
Other 4% 1% -3%
Bisexual 3% 2% -0.6% Table 29: Sexual Orientation Comparison between Recruitment Applicants and Successful Applicants (2017)
638690%
2724%
2543%
1873%
Sexual Orientation of Recruitment Applicants
Heterosexual
Gay / Lesbian
Other
Bisexual
Response rate: 55%

112
Appendix: Examining the Academic Career Path
Gender Analysis of the Career History of Current Academic Staff in Trinity
HR Workforce Planning & Management Reporting
Gwen Turner, Grace Bosonnet, 2018

113
Section 1: Overview
1.1 Introduction
The purpose of this exercise is to examine the academic career path in Trinity to ascertain if
there are differences at any stage of the path for male and female academics.
1.2 Evaluation
The number of female academics decreases at the top three levels of the career ladder. This
report examines possible reasons under three strands:
A. Glass Ceiling: do women generally go so far but no further?
B. Career Progress: do women progress but at a slower rate, possibly running out of
time before reaching the higher levels?
C. Cultural Legacy: are we experiencing a lack of women at higher grades now, because
of under-representation of female academics in the university sector in the 1980s or
1990s?
1.3 Findings
The examination of data provides the following information:
A. Glass Ceiling
There is no evidence of a glass ceiling, however there is evidence of women not applying for
promotion at same rate as men, particularly to Associate Professor. Where women do
apply, their chances of success are the same as male academics.
B. Career Progress
There is no evidence that women take longer to move through the career path. In fact, the
women who progress up the career path do so more quickly than men.

114
C. Cultural legacy
It could be concluded that women are reaching the senior grades in greater proportion now
than 10 or 20 years ago, but there is still an imbalance at the Professor Of (Chair Professor)
grade.
1.4 Conclusions
On average it takes approximately 25 years to progress to the top of the academic career
path. Many of those who are now at Professor Of (Chair Professor) started their careers in
the 1970s or 1980s. The women who started their careers from 2000 onwards should
achieve senior posts at broadly the same rate as their male colleagues, given the current
trend, provided that women apply for promotion to the grade of Associate Professor at the
same rate as men.
Section 2: Current Position and Trend
2.1 Academic Career Path
There are five levels on the academic career path in Trinity70:
1. Assistant Professor below bar (entry grade)71
2. Assistant Professor above bar
3. Associate Professor
4. Professor In / Professor
5. Professor Of / Chair Professor
70 Academic medical grades such as professor consultant are not included in this report. The path to consultant grade is normally achieved through an academic and medical career path. 71 Tenure track positions commenced in 2016 are not subject to review at the merit bar through JAPC but
through a tenure track review. The dataset used in this report includes Assistant Professors engaged prior to tenure track, so the distinction of the merit bar applies.
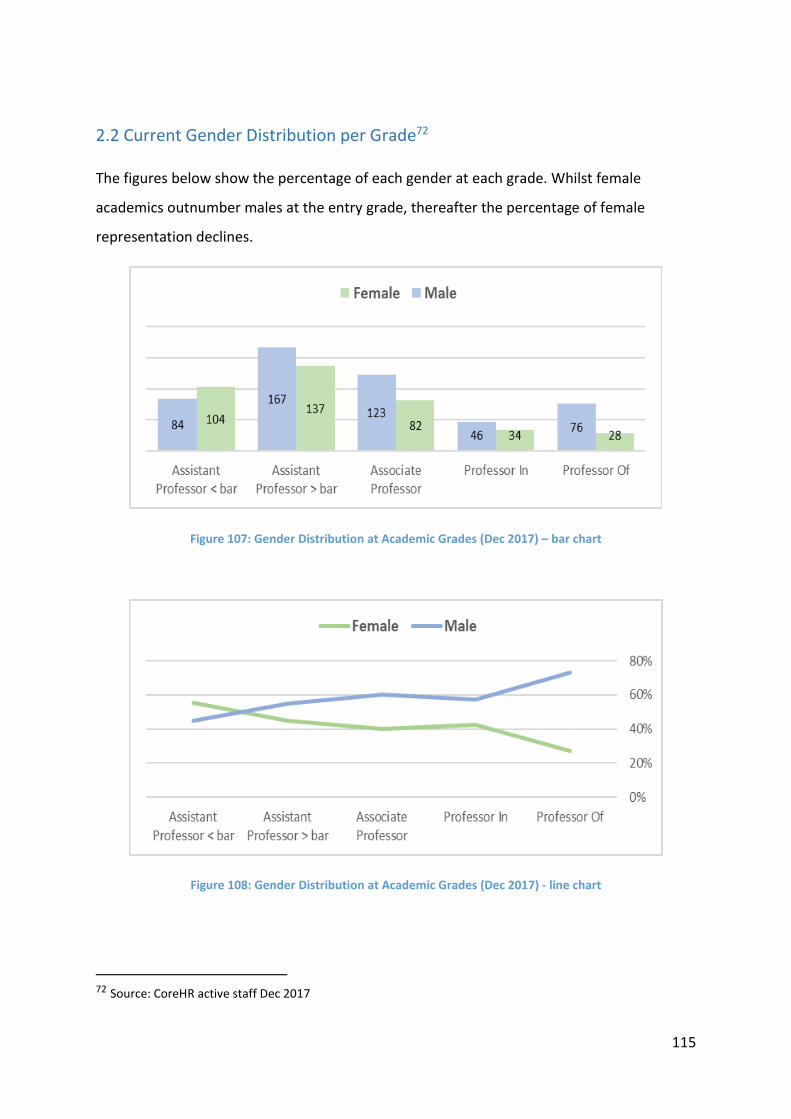
115
2.2 Current Gender Distribution per Grade72
The figures below show the percentage of each gender at each grade. Whilst female
academics outnumber males at the entry grade, thereafter the percentage of female
representation declines.
Figure 107: Gender Distribution at Academic Grades (Dec 2017) – bar chart
Figure 108: Gender Distribution at Academic Grades (Dec 2017) - line chart
72 Source: CoreHR active staff Dec 2017
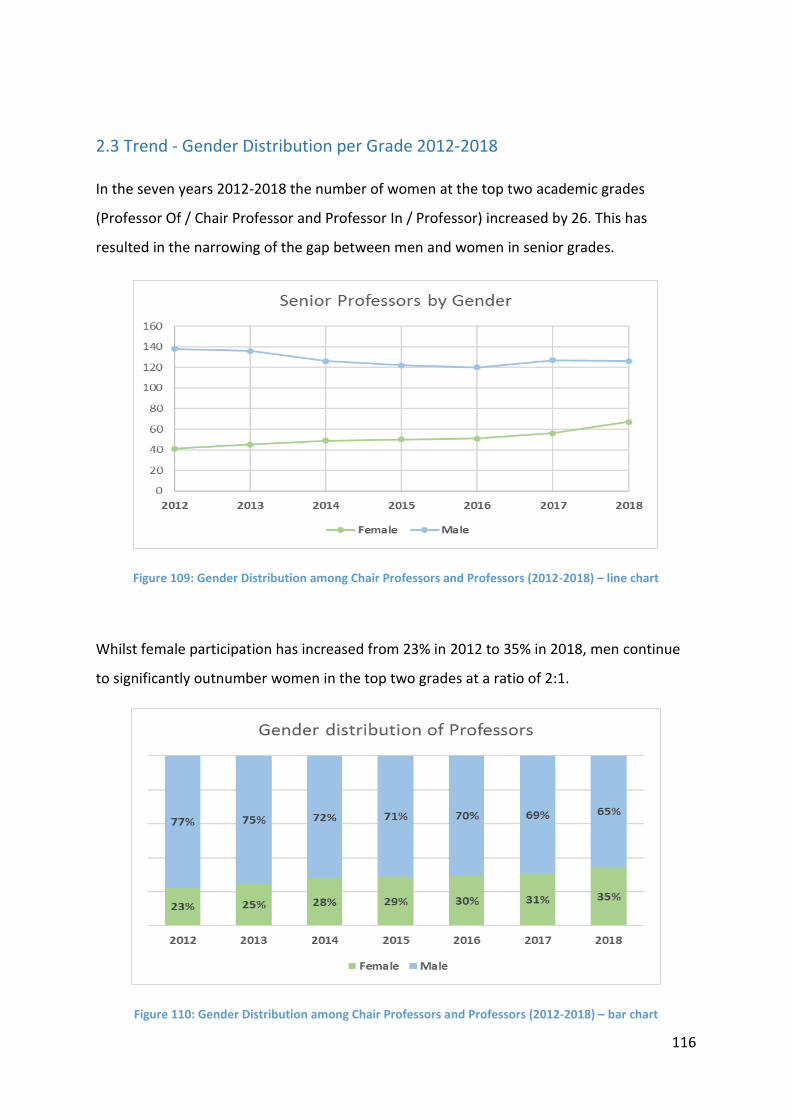
116
2.3 Trend - Gender Distribution per Grade 2012-2018
In the seven years 2012-2018 the number of women at the top two academic grades
(Professor Of / Chair Professor and Professor In / Professor) increased by 26. This has
resulted in the narrowing of the gap between men and women in senior grades.
Figure 109: Gender Distribution among Chair Professors and Professors (2012-2018) – line chart
Whilst female participation has increased from 23% in 2012 to 35% in 2018, men continue
to significantly outnumber women in the top two grades at a ratio of 2:1.
Figure 110: Gender Distribution among Chair Professors and Professors (2012-2018) – bar chart

117
Section 3: Examining the Causes
3.1 Glass Ceiling
It is evident from the seven-year data (2012-2018) that women have reached the two higher
professorial grades, and that the gap is closing between men and women at senior level.
This indicates that there is not a glass ceiling for all women, but an under-representation of
women at senior grades.
3.2 Career Progress
The data were examined to check if there are any differences of pattern between men and
women moving up through the academic grades. Specifically, to explore if women and men
were progressing up the career path at equal rates.
Given that there are marginally more women than men (55%:45%) at entry grade, we
looked for trends indicating decline of female representation thereafter.
We analysed the proportion of academics who moved through each grade, up to the next
grade. Using the current academic staffing cohort as the population, we found:
Of the current academic staff who ever held the grade of:
Assistant Professor below
bar,
62% of
women
71% of
men
progressed to Assistant Professor
above bar
Assistant Professor above
bar,
36% of
women
45% of
men
progressed to Associate Professor
Associate Professor, 27% of
women
30% of
men
progressed to Professor In /
Professor
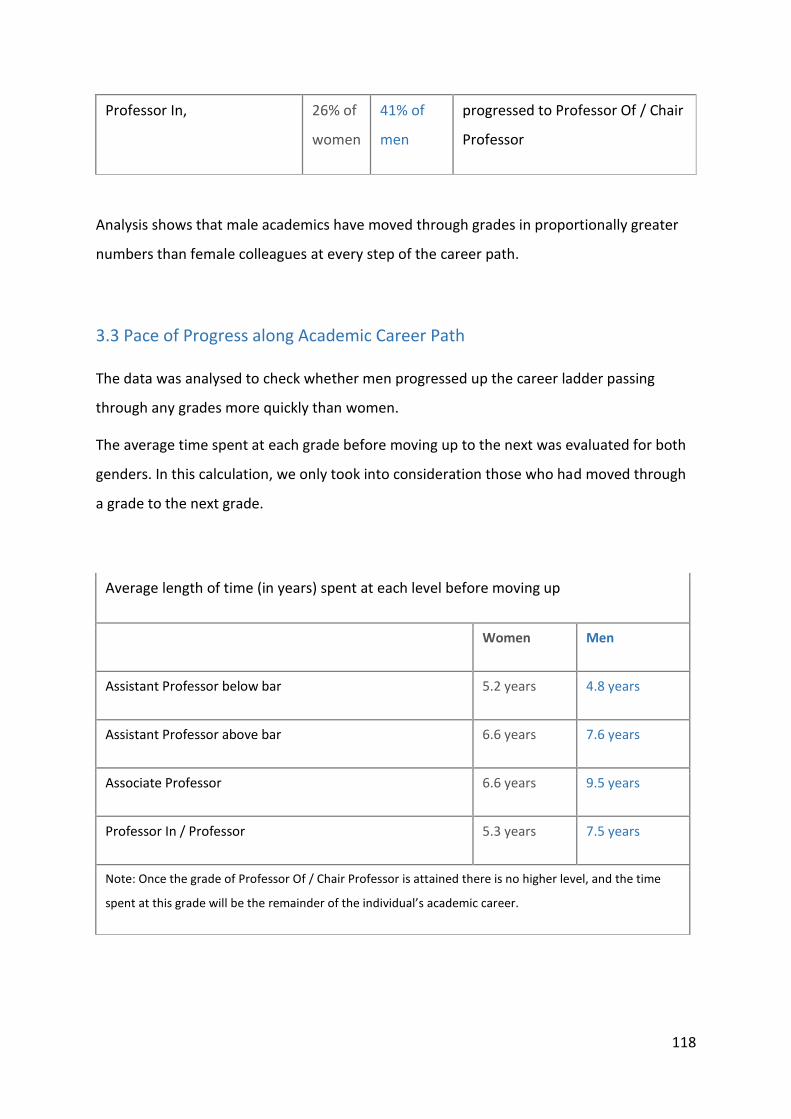
118
Professor In, 26% of
women
41% of
men
progressed to Professor Of / Chair
Professor
Analysis shows that male academics have moved through grades in proportionally greater
numbers than female colleagues at every step of the career path.
3.3 Pace of Progress along Academic Career Path
The data was analysed to check whether men progressed up the career ladder passing
through any grades more quickly than women.
The average time spent at each grade before moving up to the next was evaluated for both
genders. In this calculation, we only took into consideration those who had moved through
a grade to the next grade.
Average length of time (in years) spent at each level before moving up
Women Men
Assistant Professor below bar 5.2 years 4.8 years
Assistant Professor above bar 6.6 years 7.6 years
Associate Professor 6.6 years 9.5 years
Professor In / Professor 5.3 years 7.5 years
Note: Once the grade of Professor Of / Chair Professor is attained there is no higher level, and the time
spent at this grade will be the remainder of the individual’s academic career.
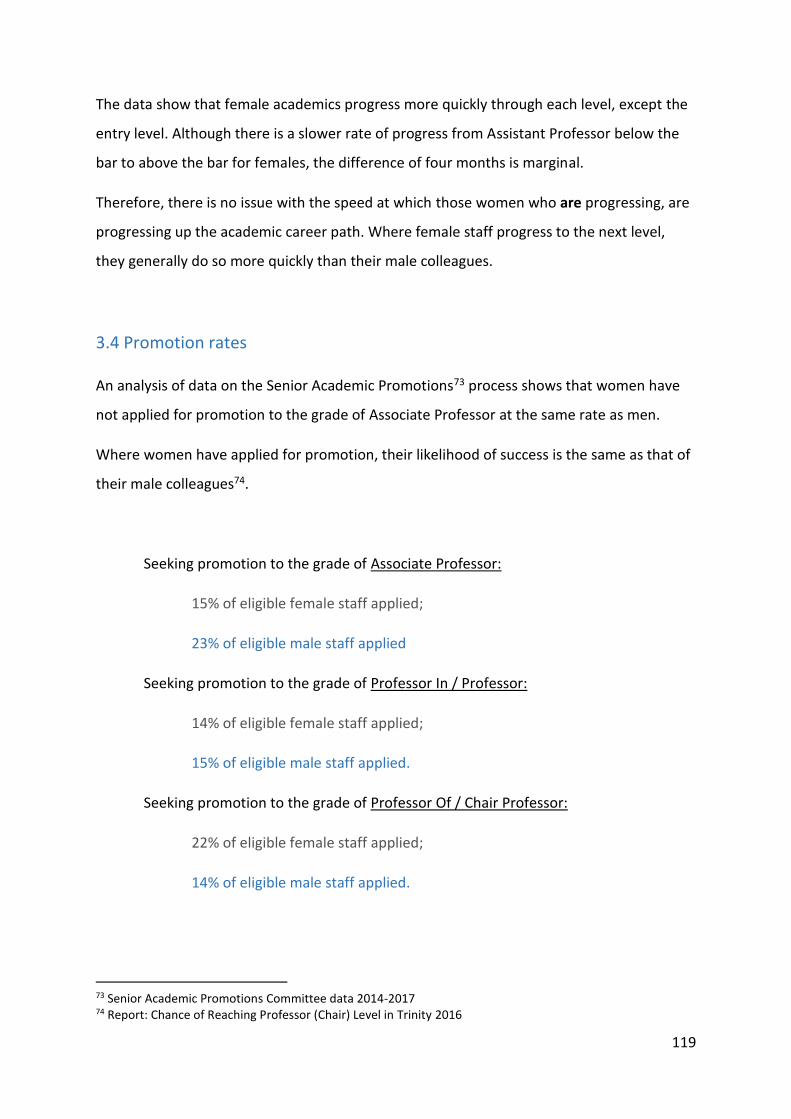
119
The data show that female academics progress more quickly through each level, except the
entry level. Although there is a slower rate of progress from Assistant Professor below the
bar to above the bar for females, the difference of four months is marginal.
Therefore, there is no issue with the speed at which those women who are progressing, are
progressing up the academic career path. Where female staff progress to the next level,
they generally do so more quickly than their male colleagues.
3.4 Promotion rates
An analysis of data on the Senior Academic Promotions73 process shows that women have
not applied for promotion to the grade of Associate Professor at the same rate as men.
Where women have applied for promotion, their likelihood of success is the same as that of
their male colleagues74.
Seeking promotion to the grade of Associate Professor:
15% of eligible female staff applied;
23% of eligible male staff applied
Seeking promotion to the grade of Professor In / Professor:
14% of eligible female staff applied;
15% of eligible male staff applied.
Seeking promotion to the grade of Professor Of / Chair Professor:
22% of eligible female staff applied;
14% of eligible male staff applied.
73 Senior Academic Promotions Committee data 2014-2017 74 Report: Chance of Reaching Professor (Chair) Level in Trinity 2016

120
Fewer women applying to Associate Professor means fewer successful, thus fewer available
to apply to the next two levels of the academic career path.
Whilst the proportion of women and men applying for Professor In / Professor level is
similar, there are more male applicants than female in the eligible cohort. So even with
similar rates of application and similar rates of success, the number of women reaching
Professor In grade through the senior academic promotions process will be lower than men.
At Professor Of / Chair Professor level the percentage of female applicants is greater than
male applicants, but as above, this is a percentage of the eligible staff, which is a smaller
pool of women than men.
3.5 Reaching a career plateau
Not everyone will reach the top level of Professor Of (Chair). Each academic will at some
point reach a plateau at the grade at which they will retire or leave.
We reviewed those who have not moved to the next grade and have spent longer than the
average time period75 in their current grade.
It is not to say that these individuals will not progress any further, but that their time spent
at a particular grade is longer than the time spent by their counterparts who moved
upwards to the next grade.
Of those current staff at grade of:
Assistant Professor below
bar,
34% of
women
23% of
men
are ‘stalled’ at this grade
75 the average time refers to the number of years spent at this grade by those academics who successfully
moved to the next grade.
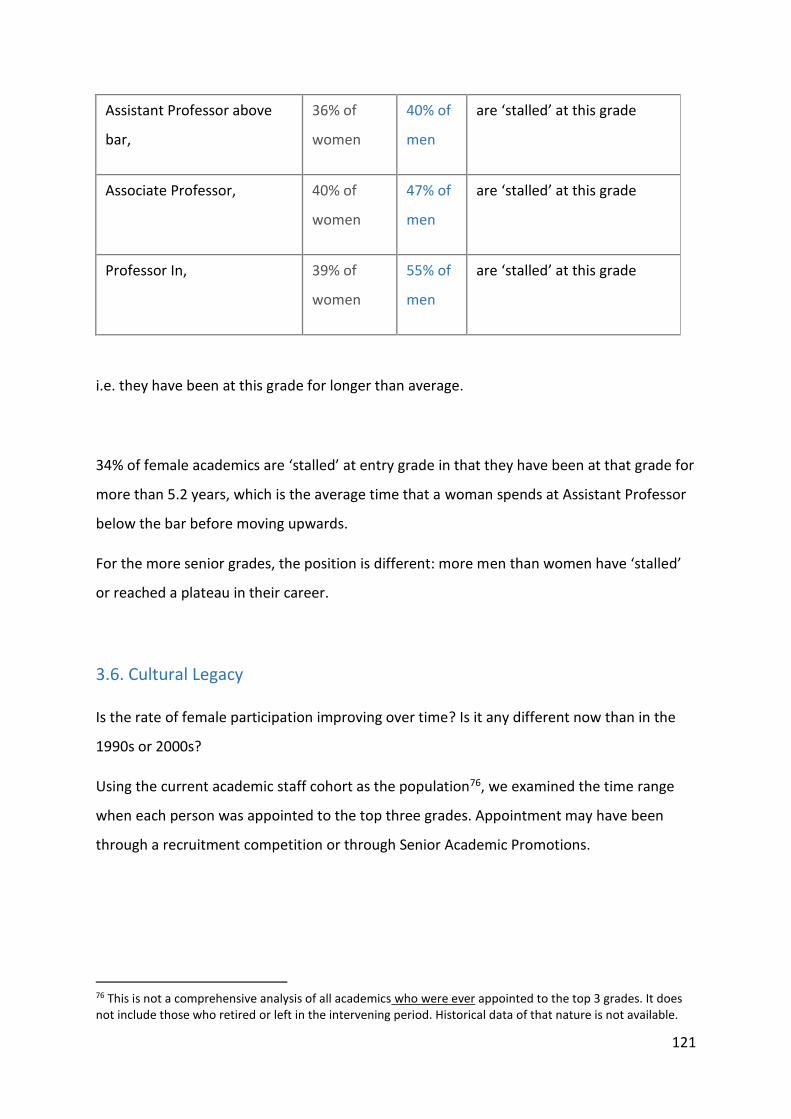
121
Assistant Professor above
bar,
36% of
women
40% of
men
are ‘stalled’ at this grade
Associate Professor, 40% of
women
47% of
men
are ‘stalled’ at this grade
Professor In, 39% of
women
55% of
men
are ‘stalled’ at this grade
i.e. they have been at this grade for longer than average.
34% of female academics are ‘stalled’ at entry grade in that they have been at that grade for
more than 5.2 years, which is the average time that a woman spends at Assistant Professor
below the bar before moving upwards.
For the more senior grades, the position is different: more men than women have ‘stalled’
or reached a plateau in their career.
3.6. Cultural Legacy
Is the rate of female participation improving over time? Is it any different now than in the
1990s or 2000s?
Using the current academic staff cohort as the population76, we examined the time range
when each person was appointed to the top three grades. Appointment may have been
through a recruitment competition or through Senior Academic Promotions.
76 This is not a comprehensive analysis of all academics who were ever appointed to the top 3 grades. It does not include those who retired or left in the intervening period. Historical data of that nature is not available.
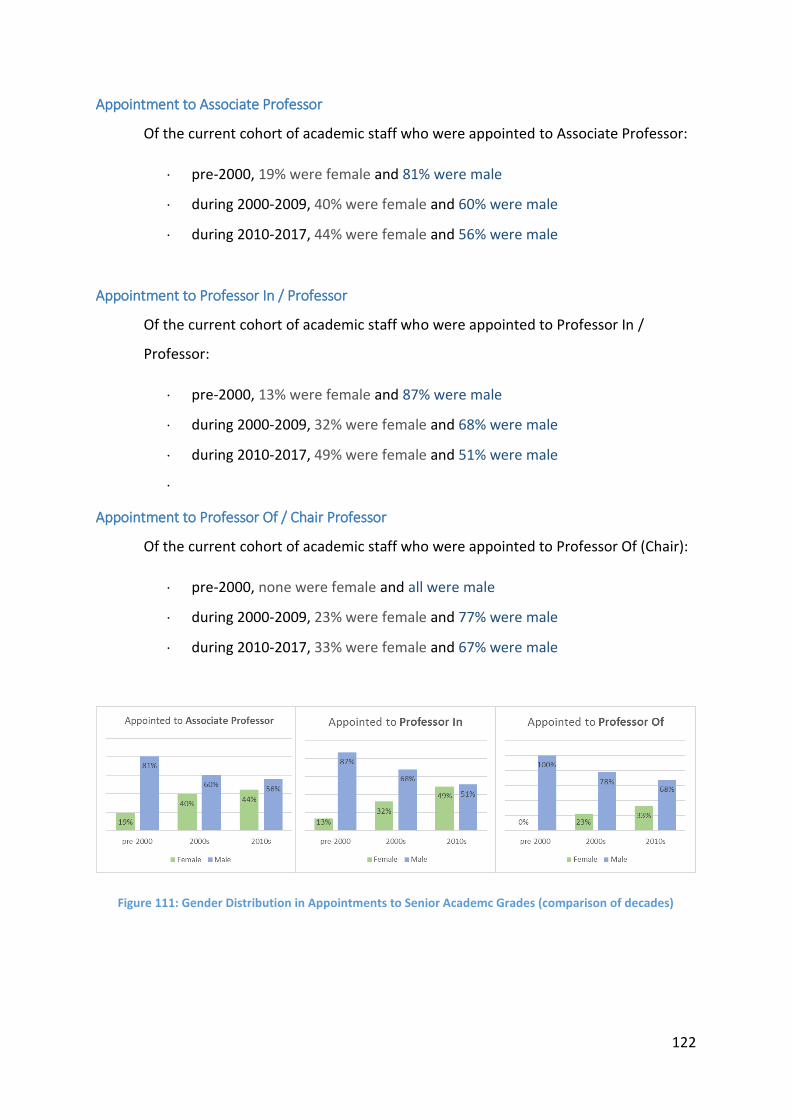
122
Appointment to Associate Professor
Of the current cohort of academic staff who were appointed to Associate Professor:
pre-2000, 19% were female and 81% were male
during 2000-2009, 40% were female and 60% were male
during 2010-2017, 44% were female and 56% were male
Appointment to Professor In / Professor
Of the current cohort of academic staff who were appointed to Professor In /
Professor:
pre-2000, 13% were female and 87% were male
during 2000-2009, 32% were female and 68% were male
during 2010-2017, 49% were female and 51% were male
Appointment to Professor Of / Chair Professor
Of the current cohort of academic staff who were appointed to Professor Of (Chair):
pre-2000, none were female and all were male
during 2000-2009, 23% were female and 77% were male
during 2010-2017, 33% were female and 67% were male
Figure 111: Gender Distribution in Appointments to Senior Academc Grades (comparison of decades)

123
It is evident from the data above that gender balance is improving with each decade in
terms of appointments to senior posts.
• In the 3 senior academic grades, women are now reaching these grades in greater
number, closing the gap with their male colleagues.
• At Associate Professor and Professor In / Professor, female and male appointments
to these grades are now almost even.
• At Professor Of, the ratio of male to female is 2:1, although this has improved.
Section 4: Dataset Caveats
4.1 Caveats on the Appendix Dataset
Data extracted from CoreHR on Academic staff as at December 2017
• Only Academics working here in Dec 2017 are included. Historical data are not reliable
• Academic medical staff are not included. The career path for academic medical staff
involves appointments made outside Trinity, with detail not available
• Dataset has 1540 records / instances
• Each person may have more than one record – we are measuring person per grade. If a
person has held all 5 grades, they will appear 5 times in the dataset
• We make no distinction on how an academic was appointed to a senior grade, whether
through promotion or through recruitment competition

124
Bibliography
AdvanceHE, 2018. Equality and Higher Education: Staff Statistical Report 2018. [Online]
Available at https://www.ecu.ac.uk/publications/equality-higher-education-
statistical-report-2018/
Association for Higher Education Access and Disability, 2018. Numbers of Students with
Disabilities Studying in Higher Education in Ireland 2016/17. [Online] Available at
https://www.ahead.ie/userfiles/files/shop/free/Rates%202016-17%20-
%20ONLINE.pdf
Drew et al., 2015. Athena SWAN Bronze institution award application – Ireland: Trinity
College Dublin77. [Online] Available at: https://www.tcd.ie/diversity-
inclusion/assets/pdfs/TCD%20Institutional%20Bronze%20Final.pdf
Equality Committee, 2017. Plan for Implementation of the HEA’s recommendations in its
National Review of Gender Equality in Irish Higher Education Institutions. [Online]
Available at:
http://www.tcd.ie/equality/assets/docs/SpecificReports/HEA%20Review%20Implem
entation%20Plan_APPROVED.pdf
Equality Office, 2007-2017. Annual Equality Monitoring Reports. [Online] Available at:
http://www.tcd.ie/equality/equality-in-trinity/reports.php
Government of Ireland, 2015. Comprehensive Employment Strategy for People with
Disabilities 2015-2024. [Online] Available at:
http://www.justice.ie/en/JELR/Comprehensive%20Employment%20Strategy%20for
%20People%20with%20Disabilities%20-
%20FINAL.pdf/Files/Comprehensive%20Employment%20Strategy%20for%20People
%20with%20Disabilities%20-%20FINAL.pdf
77 This contains Trinity’s Gender Action Plan which is referred to in the report
125
Higher Education Authority, 2018. Higher Education Institutional Staff Profiles by Gender.
Available from Equality Office on request.
Higher Education Authority. Key Facts and Figures 2016/17. [Online] Available at:
http://hea.ie/assets/uploads/2018/02/HEA-Key-Facts-And-Figures-2016-17-
FINAL.pdf
Trinity College Dublin. Code of Practice Applying to the Employment of People with
Disabilities. [Online] Available at:
https://www.tcd.ie/about/policies/employment_of_people_with_disabilities.php
Trinity College Dublin, 2015. Diversity Statement. [Online] Available at:
https://www.tcd.ie/diversity-inclusion/diversity-statement/
Trinity College Dublin, revised 2016. Equality Policy. [Online] Available at:
https://www.tcd.ie/equality/assets/pdf/EqualityPolicy2016Accessible.pdf
Trinity College Dublin, 2014. Strategic Plan 2014-2019. [Online] Available at:
https://www.tcd.ie/strategy/strategic-plan-201419.pdf
Trinity College Dublin, 2017. Strategy for Diversity and Inclusion. [Online] Available at:
http://www.tcd.ie/diversity-
inclusion/assets/pdfs/strategyfordiversityandinclusion.pdf
126
Definitions
For the purposes of this report the following definitions apply:
Academic staff = those staff on academic grades (Assistant Professor, Associate Professor,
Professor, and Chair Professor) and medical academic grades (see “Medical academic staff”)
Administrative staff = those staff on Administrative grades (Administrative 3 to 1 and Senior
Administrative 3 to 1), Secretarial grades and (Senior) Executive Officer grades.
Administrative and Library promotions = Administrative and Library Promotions concern
the more senior Library grades not covered in Library Promotions, as well as the
Administrative and Senior Administrative grades.
Casual staff = those staff on the casual pay register. They may work for a few hours, or more
occasionally, throughout the year, in academic or administrative roles.
Chair Professor = the highest academic grade, also known as “Professor Of”.
Core HR = the Human Resources information system.
Core Portal = the online programme through which staff manage their personal information
on CoreHR
Gender balance = ideal gender balance, from the perspective of the authors, is 50/50
male/female (as other gender identities are not currently covered by the report). However,
cohorts may be described as “gender-balanced” if the male/female representation is within
a 60:40 ratio, depending on context. For example, a 5-person interview panel could never
be 50/50 but would be considered gender-balanced if it has 3 men and 2 women.
HEA Equal Access Survey = an optional survey that new entrants are invited to complete
during registration. The survey responses go to the HEA, who can provide statistical results
back to HEIs
Headcount data = Unless otherwise stated, the staff data presented in this report use the
“headcount” system, in which two individual staff members (whether working part-time or
full-time) are counted as “2” staff members in the figures.

127
Junior Academic Progression = The Junior Academic Progression Committee manages
progression within the Assistant Professor Grade.
In the context of this report, “progression” refers both to applications to pass the Merit Bar,
and accelerated advancement within the Assistant Professor grade.
Library Promotions = The “Library” promotions system deals with a specific range of Library
grades, namely Library Assistant; Library Executive 3, 2 and 1; Library Shop Assistant; Library
Laboratory Attendant; and Library Technical Officer.
Mature students = first time new entrants who were aged 23 years on, or before, the 1st
January in their year of admission into an undergraduate programme. The “Mature
Students” section of this report (p37) concerns only those mature students who have
applied via the Mature Student Dispensation Scheme (MSDS) or a similar scheme for entry
to the School of Nursing and Midwifery; it does not include students who have applied via
the CAO and happen to meet the mature student age criterion.
Medical academic staff = staff who are employed jointly by Trinity and partner hospitals,
and are remunerated on the academic clinical scales as determined by the Department of
Health.
New entrant = a first-time undergraduate student registering with a higher education
institution at the beginning of their first academic year
Professor = where capitalised, i.e. “Professor”, this refers to the second-highest academic
grade, also known as “Professor In”
Professional staff = staff employed in administrative, library, support or technical grades
Research staff = staff employed as Research Fellows or Research Assistants.
Research Fellow: the grade reserved for those holding a PhD qualification or other
equivalent experience. This is the official Trinity title for research staff who may also
be called “postdoctoral researchers” or “research scientists” – it includes Research
Fellows and Senior Research Fellows.
Research Assistant refers to research staff holding a Bachelors or Master’s degree.

128
Secretarial and Executive Promotions = The Secretarial and Executive Promotions facilitate
promotion to Executive Officer and Senior Executive Officer grades (which are
administrative in nature).
Senior Academic Promotions = The Senior Academic Promotions process facilitates
promotion to the Associate Professor, Professor and Chair Professor grades.
Staff/Total Staff = all monthly- and weekly-paid staff who work full-time or part-time on
permanent, indefinite, fixed term and temporary contracts. This does not include casual
staff.
Students/Total Students = all full-time or part-time students at undergraduate,
postgraduate and foundation levels who are registered in Trinity. The data include research
students on postgraduate programmes who may also fulfil some teaching assistant roles.
Whole-time equivalent (WTE) data = Some staff data in the report refer to “whole-time
equivalents” (WTE) in which two or more part-time staff members completing full-time
hours per week between them would be counted as “1”. Footnotes indicate where the WTE
system is in use.
Trinity Centre for Gender Equality and Leadership (TCGEL) = originally established as the
Centre for Women in Science and Engineering Research (WiSER) in 2006 to promote the
recruitment, retention and advancement of women working in science, technology,
engineering, mathematics and medical (STEMM) disciplines, TCGEL now works to advance
gender equality across the University as a whole, and among all its populations.

129
Acronyms
AHEAD – Association for Higher Education Access and Disability
AHSS – Faculty of Arts, Humanities and Social Sciences
CAO – Central Applications Office
DARE – Disability Access Route to Education
DS – Disability Service
EMS – Faculty of Engineering, Maths and Science
EOG – Executive Officers’ Group
EU – European Union
FT – Full-time
GB – Great Britain
HEI – Higher Education Institution
HEA – Higher Education Authority (Ireland)
HEAR – Higher Education Access Route
HR – Human Resources
HS – Faculty of Health Sciences
IUA – Irish Universities Association
MF – Multi-faculty
MSDS – Mature Students Dispensation Scheme
MSO – Mature Students’ Office
PG - Postgraduate
PT – Part-time
TAP – Trinity Access Programmes
TCD – Trinity College Dublin
TCGEL – Trinity Centre for Gender Equality and Leadership
TSM – Two-subject Moderatorship
UG – Undergraduate
UK – United Kingdom
USA – United States of America

130
List of Figures
Figure 1: Level of Study and Mode of Attendance - All Students (2018) ................................ 22
Figure 2: Age of Undergraduate Students at Point of Entry (2018) ........................................ 23
Figure 3: Age of Postgraduate Students at Point of Entry (2018) ........................................... 24
Figure 4: Ten Most Common Student Countries of Domicile excluding Ireland (2018) .......... 25
Figure 5: Student Country of Domicile by Continent (2018) ................................................... 26
Figure 6: Trend in Percentage of Students Registered with the Disability Service (2008/09 -
2017/18) ................................................................................................................................... 29
Figure 7: Percentage of Undergraduate and Postgraduate Students Registered with the DS
(2018) ....................................................................................................................................... 29
Figure 8: Gender Representation in Students Registered with the Disability Service (2018) . 29
Figure 9: Students Registered with the Disability Service by Faculty (2018) .......................... 30
Figure 10: Representation of Disabilities among Students Registered with the Disability
Service (2018) .......................................................................................................................... 30
Figure 11: Ethnicity of Undergraduate New Entrants (HEA Equal Access Survey) 2016/17 ... 31
Figure 12: Trend in Gender Representation among Total Students (2007/08-2017/18)........ 33
Figure 13: Gender of Students at each Level of Study (2018) ................................................. 33
Figure 14: Gender Representation among All Students in each Faculty (2018) ..................... 34
Figure 15: Representation of Female Students at Undergraduate / Postgraduate Level in
each Faculty (2018) .................................................................................................................. 34
Figure 16: Gender of Students receiving Entrance Exhibition Awards (2016/17) ................... 35
Figure 17: Gender of Students who were Awarded Scholarship (2017) ................................. 35
Figure 18: Gender of Graduands who were Awarded Gold Medals (2016/17) ...................... 35
Figure 19: Gender Representation in SU Decision-making Bodies (2017/18) ......................... 36
Figure 20: Gender Representation in GSU Decision-making Bodies (2017/18) ...................... 36
Figure 21: Gender Representation among Chairs of Student Societies (2017/18) ................. 37
Figure 22: Mature Students (MSDS & Nursing/Midwifery) as % of Total Undergraduate
Students (2017/18) .................................................................................................................. 38
Figure 23: Number of Applicants and Entrants to Trinity through the MSDS (2009-2018) .... 39
Figure 24: Number of Mature Entrants to Degree Courses in the School of Nursing &
Midwifery (2009-2017) ............................................................................................................ 39

131
Figure 25: Number and Percentage of MSDS Students in Each Faculty (2018) ...................... 40
Figure 26: Gender Representation among Total MSDS Students (2012/13 - 2017/18) .......... 40
Figure 27: Percentage Representation of MSDS Students in each Age Bracket (2010/11 -
2017/18) ................................................................................................................................... 41
Figure 28: Socio-economic Background of Undergraduate New Entrants (2016/17) ............. 42
Figure 29: TAP Students as % of Total Undergraduate Students (2017/18) ........................... 43
Figure 30: Total Entrants to Trinity via the Trinity Access Programmes (1998-2017) ............. 44
Figure 31: Gender Representation among TAP Students (2017/18) ....................................... 44
Figure 32: Representation of Mature Students among TAP Students (2017/18) ................... 44
Figure 33: Faculty Distribution of TAP Students (2017/18) ..................................................... 45
Figure 34: Degree Grades of Graduates who Entered Trinity via TAP (Final Assessment in
2016/17) ................................................................................................................................... 45
Figure 35: Total Staff by Area of Employment (2018) ............................................................. 46
Figure 36: Age Representation among Total Staff (2018) ....................................................... 47
Figure 37: Age Representation among Academic Staff (2018) ................................................ 48
Figure 38: Civil Status Representation among Total Staff (2018) ............................................ 50
Figure 39: Percentage of Total Staff who have Declared a Disability (2009-2018) ................. 52
Figure 40: Ethnic Origin of Total Staff from Diversity Detail (2018) ........................................ 53
Figure 41: Gender Representation Trend among Total Staff (2008-2018).............................. 55
Figure 42: Gender Representation on Board and Council (2017/18) ...................................... 56
Figure 43: Gender Representation Trend on Board and Council (2008-2018) ........................ 57
Figure 44: Gender Representation on Principal, Compliance and Academic Committees of
Board and Council (2017/18) ................................................................................................... 59
Figure 45: Gender Representation on Selected Management Groups (2017/18) .................. 60
Figure 46: Gender Representation Trend on Executive Officers Group (2010-2018) ............. 61
Figure 47: Gender Representation on Faculty Executive Committees (2017/18) ................... 61
Figure 48: Gender Representation among Part-time and Full-time Staff (2018) .................... 62
Figure 49: Gender Representation Trend among Part-time and Full-time Staff (2008-2018) 62
Figure 50: Gender Representation among Permanent and Temporary Staff (2018) .............. 63
Figure 51: Gender Representation in Employment Areas (2018) ........................................... 64
Figure 52: Gender Representation among Research Assistants and Research Fellows (2018)
.................................................................................................................................................. 65
132
Figure 53: Gender Representation among Research Staff in each Faculty (2018) .................. 65
Figure 54: Gender Representation among Library Grades (2018) .......................................... 66
Figure 55: Gender Representation among Administrative Grades (2018) .............................. 67
Figure 56: Gender Representation in Technical Officers (2018) ............................................. 69
Figure 57: Gender Representation in Experimental Officers (2018) ....................................... 69
Figure 58: Gender Representation among Support Areas (2018) ........................................... 70
Figure 59: Gender Representation in Academic Grades (2018) .............................................. 71
Figure 60: Female Representation Trend in Academic Grades (2008-2018) .......................... 72
Figure 61: Gender Representation among Academic Staff: Faculty Comparison (2018) ........ 72
Figure 62: Gender Representation among Academic Grades in AHSS (2018) ........................ 73
Figure 63: Gender Representation among Academic Grades in EMS (2018) .......................... 73
Figure 64: Gender Representation among Academic Grades in HS (2018) ............................. 74
Figure 65: Gender Representation among Medical Academic Grades in (2018) .................... 74
Figure 66: Trend in Gender Representation among Heads of School (2010-2018) ................ 76
Figure 67: Gender Representation among All Fellows, 2009/10-2018/19 .............................. 78
Figure 68: Gender of Applicants, Shortlisted and Appointed to Assistant Professor (2016/17)
.................................................................................................................................................. 79
Figure 69: Gender of Applicants, Shortlisted and Appointed to Associate Professor (2016/17)
.................................................................................................................................................. 79
Figure 70: Gender of Applicants, Shortlisted and Appointed to Professor (2016/17) ............ 80
Figure 71: Gender of Applicants, Shortlisted and Appointed to Chair Professor (2016/17) ... 80
Figure 72: Gender of Total Academic Applicants (2013/14 - 2016/17) ................................... 81
Figure 73: Gender of Total Academic Appointees (2013/14 - 2016/17) ................................. 81
Figure 74: Success Rates of Total Academic Applicants, by Gender (2013/14 - 2016/17)...... 82
Figure 75: Gender Balance / Imbalance of Academic Recruitment Selection Panels (2017) .. 83
Figure 76: Average Female Representation on Academic Recruitment Selection Panels in
each Faculty (2017) .................................................................................................................. 83
Figure 77: Gender of Applicants, Shortlisted and Appointed in USSHER II Programme (2016)
.................................................................................................................................................. 84
Figure 78: Gender of Applicants, Shortlisted and Appointed in Total Professional
Recruitment (2017) .................................................................................................................. 85

133
Figure 79: Gender of Applicants and Appointed in Professional Recruitment, by Division
(2017) ....................................................................................................................................... 85
Figure 80: Gender of Applicants and Appointed in Professional Recruitment, by Faculty
(2017) ....................................................................................................................................... 86
Figure 81: Gender of Eligible Cohort, Applicants and Promoted in Senior Academic
Promotions (2017) ................................................................................................................... 87
Figure 82: Gender of Eligible Cohort, Applicants and Promoted in Promotion to Chair
Professor (2017) ....................................................................................................................... 88
Figure 83: Gender of Eligible Cohort, Applicants and Promoted in Promotion to Professor
(2017) ....................................................................................................................................... 89
Figure 84: Gender of Eligible Cohort, Applicants and Promoted in Promotion to Associate
Professor (2017) ....................................................................................................................... 89
Figure 85: Gender of Total Applicants and Progressed in Junior Academic Progression (2017)
.................................................................................................................................................. 90
Figure 86: Gender of Total Applicants and Promoted in Administrative & Library Promotions
(2017) ....................................................................................................................................... 91
Figure 87: Gender of Total Applicants and Promoted in Secretarial & Executive Promotions
(2017) ....................................................................................................................................... 91
Figure 88: Gender of Total Applicants and Promoted in Technical Promotions (2017) ......... 92
Figure 89: Gender of Total Applicants and Promoted in Library Promotions (2017) .............. 92
Figure 90: Gender Representation on Promotion and Progression Committees (2017/18) .. 93
Figure 91: Gender of Applicants and Successful Applicants for Research Grants (2017) ....... 94
Figure 92: Gender of PIs and Students under Provost's PhD Project Awards (2018) ............. 94
Figure 93: Ten Most Common Nationalities of Academic Staff after Irish (2018) .................. 95
Figure 94: Nationality of Academic Staff - excluding Irish - grouped by Continent (2018) ..... 96
Figure 95: Percentage of Academic Staff in each School who are of a Nationality other than
Irish (2018) ............................................................................................................................... 97
Figure 96: Ten Most Common Nationalities of Professional and Research Staff after Irish
(2018) ....................................................................................................................................... 98
Figure 97: Nationality of Professional and Research Staff - excluding Irish - grouped by
Continent (2018) ...................................................................................................................... 99
Figure 98: Religion of Total Staff from Diversity Detail (2018) .............................................. 100

134
Figure 99: Sexual Orientation of Total Staff from Diversity Detail (2018) ............................. 102
Figure 100: Age Representation among Recruitment Applicants (2017) .............................. 103
Figure 101: Civil Status Representation among Recruitment Applicants (2017) .................. 105
Figure 102: Disability Status Representation among Recruitment Applicants (2017) .......... 107
Figure 103: Ethnic Origin Representation among Recruitment Applicants (2017) ............... 108
Figure 104: Family Status Representation among Recruitment Applicants (2017) .............. 109
Figure 105: Religion Representation among Recruitment Applicants (2017) ....................... 110
Figure 106: Sexual Orientation Representation among Recruitment Applicants (2017) ...... 111
Figure 107: Gender Distribution at Academic Grades (Dec 2017) – bar chart ...................... 115
Figure 108: Gender Distribution at Academic Grades (Dec 2017) - line chart ...................... 115
Figure 109: Gender Distribution among Chair Professors and Professors (2012-2018) – line
chart ....................................................................................................................................... 116
Figure 110: Gender Distribution among Chair Professors and Professors (2012-2018) – bar
chart ....................................................................................................................................... 116
Figure 111: Gender Distribution in Appointments to Senior Academc Grades (comparison of
decades) ................................................................................................................................. 122
135
List of Tables
Table 1: Mode of Attendance, Comparison of Trinity Students (2018) and University
Enrolments (2016/17) .............................................................................................................. 22
Table 2: Ten Most Common Student Countries of Domicile excluding Ireland, with
Percentages (2018) .................................................................................................................. 26
Table 3: Country of Domicile, Comparison of Trinity Students (2017/18) with all HEI New
Entrants (2016/17) ................................................................................................................... 27
Table 4: Ethnicity of Students from HEA Equal Access Survey (2016/17), Comparison with
Census 2016 ............................................................................................................................. 32
Table 5: Key Facts on TAP Student Admission and Completion Rates .................................... 43
Table 6: Age of All Staff, Trinity and UK HE Sector Comparative (2018) ................................. 47
Table 7: Age Representation (%) among Academic Staff by School (2018) ........................... 49
Table 8: Ethnic Origin of Staff from Diversity Detail (2018) Compared with Census 2016 ..... 54
Table 9: Gender of Staff in Professional Departments (2018)................................................. 68
Table 10: Gender Representation in Academic Grades, Comparison with Irish Universities
Average (2017) ......................................................................................................................... 71
Table 11: Gender Representation among Academic Staff, by School (2018) ......................... 75
Table 12: Gender Representation among Fellows, including New Fellows and Leaving
Fellows (2018) .......................................................................................................................... 77
Table 13: Gender Representation among Honorary Fellows (2017 and 2018) ....................... 78
Table 14: Application and Success Rates in Senior Academic Promotions, by Gender (2017)
.................................................................................................................................................. 88
Table 15: Application and Success Rates in Promotions to Chair Professor, by Gender (2017)
.................................................................................................................................................. 88
Table 16: Application and Success Rates in Promotions to Professor, by Gender (2017) ...... 89
Table 17: Application and Success Rates in Promotions to Associate Professor, by Gender
(2017) ....................................................................................................................................... 89
Table 18: Gender Breakdown of Progressions by SAPC Subcommittee and JAPC .................. 90
Table 19: Nationality of Academic Staff (2018) Compared with Census 2016 ........................ 96
Table 20: Nationality of Professional and Research Staff (2018) Compared with Census 2016
.................................................................................................................................................. 98

136
Table 21: Religion of Staff from Diversity Detail (2018) Compared with Census 2016 ......... 101
Table 22: Age Comparison between Recruitment Applicants and Successful Applicants
(2017) ..................................................................................................................................... 104
Table 23: Civil Status Comparison between Recruitment Applicants and Successful
Applicants (2017) ................................................................................................................... 105
Table 24: Country of Origin Comparison between Recruitment Applicants and Successful
Applicants (2017) ................................................................................................................... 106
Table 25: Disability Status Comparison between Recruitment Applicants and Successful
Applicants (2017) ................................................................................................................... 107
Table 26: Ethnic Origin Comparison between Recruitment Applicants and Successful
Applicants (2017) ................................................................................................................... 108
Table 27: Family Status Comparison between Recruitment Applicants and Successful
Applicants (2017) ................................................................................................................... 109
Table 28: Religion Comparison between Recruitment Applicants and Successful Applicants
(2017) ..................................................................................................................................... 110
Table 29: Sexual Orientation Comparison between Recruitment Applicants and Successful
Applicants (2017) ................................................................................................................... 111