Annual Energy Outlook 2011 - U.S. Energy Information ... · Annual Energy Outlook 2011 ... Richard...
41
Annual Energy Outlook 2011 and an update on EIA activities NGA Center for Best Practices State Energy Working Group February 8, 2011 Richard Newell, Administrator
Transcript of Annual Energy Outlook 2011 - U.S. Energy Information ... · Annual Energy Outlook 2011 ... Richard...

Annual Energy Outlook 2011and an update on EIA activities
NGA Center for Best PracticesState Energy Working Group
February 8, 2011
Richard Newell, Administrator

• Increased estimates for U.S. shale gas resources drive increased U.S. production, lower prices, and lower imports of natural gas
• Industrial natural gas demand recovers, reversing recent trend
• Non-hydro renewables and natural gas are the fastest growing electricity generation sources, but coal remains the dominant fuel because of the large amount of existing capacity
• Oil imports fall due to increased domestic production—including biofuels—and greater fuel efficiency
• U.S. carbon dioxide emissions rise slowly, but do not pass 2005 levels again until 2027
Key results from the AEO2011 Reference case,which assumes current laws remain unchanged
Richard Newell, February 8, 2011 2

What is included (and excluded) in developing EIA’s “Reference Case” projections?
• Generally assumes current laws and regulations– excludes potential future laws and regulations (e.g., proposed
greenhouse gas legislation and proposed fuel economy standards are not included)
– provisions sunset as specified in law (e.g., renewable tax credits expire)
• Includes technologies that are commercial or reasonably expected to become commercial over next decade or so– includes projected cost and efficiency improvements due to
technology improvements, as well as cost reductions linked to cumulative deployment levels.
– does not assume revolutionary or breakthrough technologies
3Richard Newell, February 8, 2011

• Natural gas and oil supply– More than doubled the technically recoverable U.S. shale gas resources assumed
in AEO2010 and added new shale oil resources– Updated offshore data and assumptions, pushing out start dates for several
projects as a result of the drilling moratoria and delaying Atlantic and Pacific offshore leasing beyond 2017
• Electricity– Updated costs for new power plants– Expanded number of electricity regions to 22 from 13, allowing better regional
representation of market structure and power flow
• Transport– Increased limit for ethanol blending into gasoline from E10 to E15 for approved
vehicles, as a result of the EPA waiver granted in October 2010– Includes California’s Low Carbon Fuel Standard, which reduces the carbon
intensity of gasoline and diesel fuels in that state by 10% from 2012 through 2020 – Revised light duty vehicle miles travelled downward– Updated electric and plug-in hybrid electric battery cost and size
Key updates included in the AEO2011 Reference case
Richard Newell, February 8, 2011 4

Richard Newell, February 8, 2011
U.S. Energy Consumption
5

Current U.S. energy supply is 83% fossil fuels;demand is broadly distributed among the major sectors
Energy supply Energy demand
Source: EIA Annual Energy Review 2009
Nuclear9%
Renewable8%
Coal21%
Natural Gas25%
Petroleum37%
Transportation29%
Electricity –Residential
15%
Industrial(non-electric)
20%
Electricity –Industrial
10%
Electricity –Commercial
15% Residential &Commercial
(non-electric)11%
Residential & Commercial42%
Industrial30%
2009 total U.S. energy use = 94.6 quadrillion Btu
Richard Newell, February 8, 2011 6
0
25
50
75
100
125
1980 1985 1990 1995 2000 2005 2010 2015 2020 2025 2030 2035
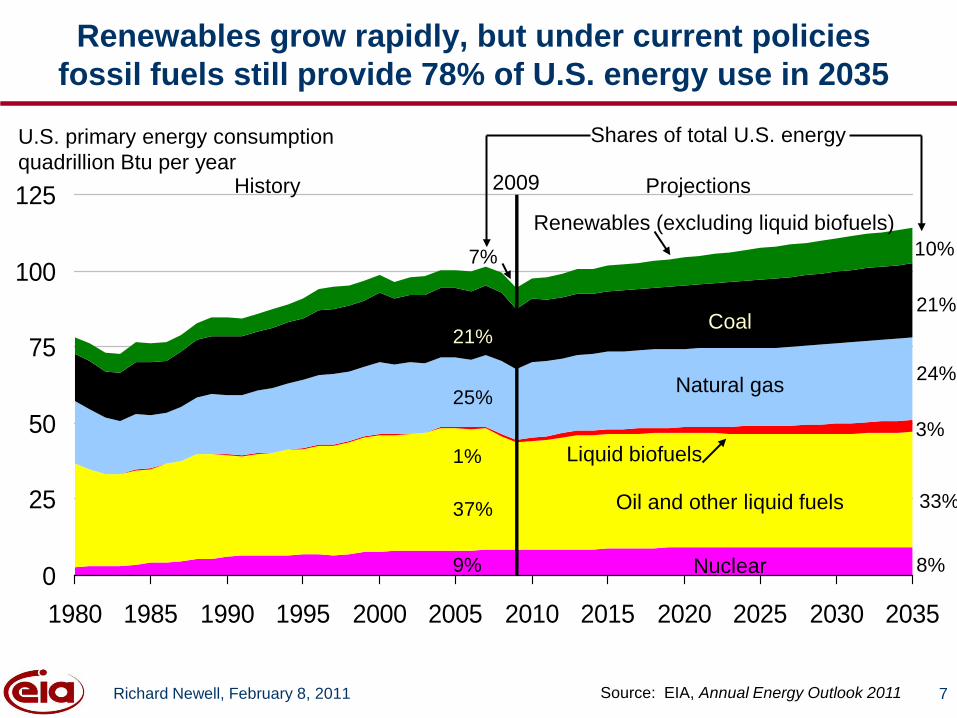
Renewables grow rapidly, but under current policies fossil fuels still provide 78% of U.S. energy use in 2035
U.S. primary energy consumptionquadrillion Btu per year
Coal
Oil and other liquid fuels
Natural gas
ProjectionsHistory
Nuclear
Liquid biofuels
Renewables (excluding liquid biofuels)
Source: EIA, Annual Energy Outlook 2011
37%
25%
21%
9%
7%
1%
33%
24%
21%
10%
8%
3%
Shares of total U.S. energy
2009
Richard Newell, February 8, 2011 7
0
50
100
150
200
2005 2010 2015 2020 2025 2030 2035
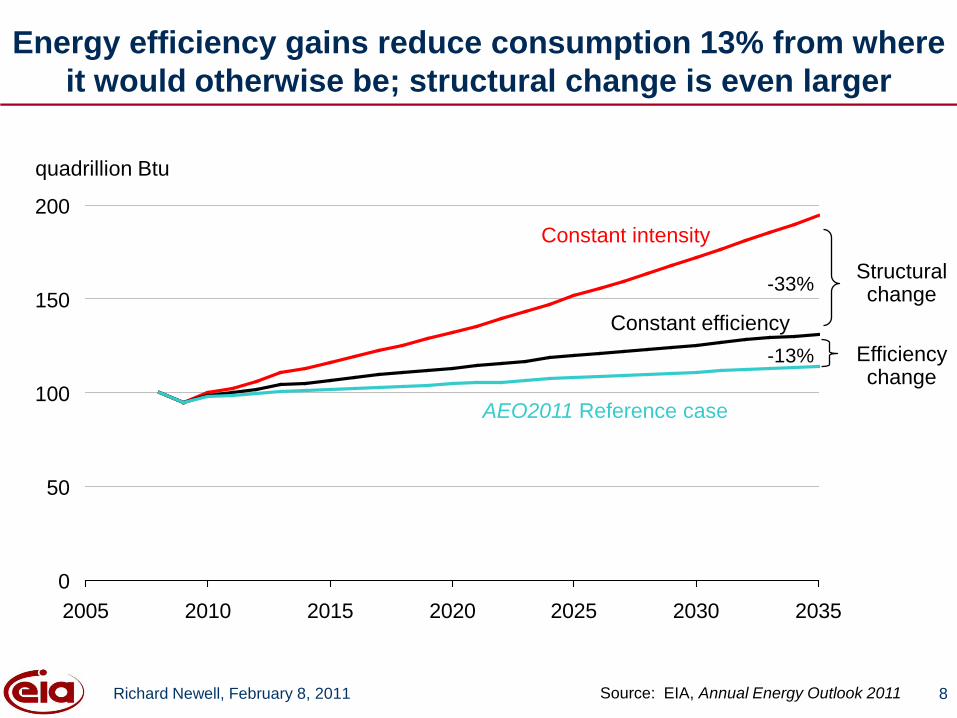
Energy efficiency gains reduce consumption 13% from where it would otherwise be; structural change is even larger
quadrillion Btu
Source: EIA, Annual Energy Outlook 2011
Constant efficiency
Constant intensity
Efficiency change
Structural change
AEO2011 Reference case
-33%
-13%
Richard Newell, February 8, 2011 8

0.00
0.25
0.50
0.75
1.00
1.25
1.50
1.75
1980 1985 1990 1995 2000 2005 2010 2015 2020 2025 2030 2035
Energy and CO2 per dollar of GDP continue to decline;per-capita energy use also declines
index, 2005=1ProjectionsHistory
Source: EIA, Annual Energy Outlook 2011
2009
Energy per capitaEnergy per dollar GDP
CO2 per dollar GDP
Richard Newell, February 8, 2011 9

0
1
2
3
4
5
6
7
1990 1995 2000 2005 2010 2015 2020 2025 2030 2035
In the AEO2011 Reference case, energy-related CO2emissions grow almost 6% over 2005 levels by 2035
billion metric tons carbon dioxide
Energy-related CO2 emissions
ProjectionsHistory
Source: EIA, Annual Energy Outlook 2011Richard Newell, February 8, 2011
2009
2005 2020 2035Energy-related CO2emissions 5.98 5.77 6.31% change from 2005 - - -3.4% 5.6%
2005
10

Richard Newell, February 8, 2011
Electricity
11

In 2009, electricity generation was 70% fossil fuels, 20% nuclear, and 10% renewable
Nuclear20.2%
Natural gas23.3%
2009 Total net generation:3,953 billion kWh
Coal44.6%
2009 Non-hydro renewablenet generation:141 billion kWh
Geothermal: 0.4%
Other biomass: 0.5%
Wood and wood-derived fuels: 0.9%
Other renewable
3.6%
Conventionalhydroelectric
6.9%
Other0.3%
Wind: 1.8%
Solar thermal and PV: <0.1%
Petroleum1.0%
Other gases0.3%
Source: EIA Electric Power Monthly, October 2010Richard Newell, February 8, 2011 12

Richard Newell, February 8, 2011
-2
0
2
4
6
8
10
12
14
1950 1960 1970 1980 1990 2000 2015 2025 2035
While projected electricity consumption grows by 30%, the rate of growth has slowed
percent growth (3-year rolling average)
Projections
HistoryPeriod Annual Growth1950s 9.81960s 7.31970s 4.71980s 2.91990s 2.42000-2009 0.52009-2035 1.0
Source: EIA, Annual Energy Outlook 2011
2009
13

0
1
2
3
4
5
6
1990 1995 2000 2005 2010 2015 2020 2025 2030 2035
electricity net generationtrillion kilowatthours per year
Natural gas
Renewable
ProjectionsHistory
Nuclear
Oil and other
Coal
20%
23%
25%
1% 1%
45%
43%
14%10%
17%
The projected electricity mix gradually shifts to lower-carbon options, with generation from natural gas rising 37% and renewables rising 73%
Source: EIA, Annual Energy Outlook 2011
2009
Richard Newell, February 8, 2011 14

Richard Newell, February 8, 2011
0
50
100
150
200
250
300
350
400
450
1990 1995 2000 2005 2010 2015 2020 2025 2030 2035
Non-hydro renewable sources grow nearly three-fold, meeting 23% of projected electricity generation growth
non-hydropower renewable generationbillion kilowatthours per year
Wind
ProjectionsHistory
Solar
Biomass
Geothermal
Waste
Source: EIA, Annual Energy Outlook 2011
2009
15

Natural gas, wind and other renewables account for the vast majority of capacity additions from 2009 to 2035
Coal313 (30%)
Natural gas351 (34%)
Hydropower*99 (10%)
Nuclear101 (10%)
Other renewables
15 (1%)
Other fossil118 (11%) * Includes pumped storage
Coal14 (6%)
Natural gas135 (62%)
Hydropower*3 (1%)
Nuclear6 (3%)
Other renewables27 (12%)
Other fossil
1 (0.4%)
2009 capacity Capacity additions 2009 to 2035
1,033gigawatts
220gigawatts
Source: EIA, Annual Energy Outlook 2011Richard Newell, February 8, 2011
Wind27 (12%)
Wind32 (3%)
16
End-use coal4 (0.3%)
End-use coal7 (3%)

Richard Newell, February 8, 2011
Natural gas
17

Success in the Barnett prompted companies to look at other shale formations in the United States
18Richard Newell, February 8, 2011

U.S. shale gas production increased 14-fold over the last decade; reserves tripled over the last few years
0
1
2
3
4
5
2000 2001 2002 2003 2004 2005 2006 2007 2008 2009 2010
Eagle Ford (TX)Marcellus (PA and other Eastern states)Haynesville (LA and TX)Woodford (OK)Fayetteville (AR)Barnett (TX)Antrim (MI, IN, and OH)
Source: Lippman Consulting (2010 estimated)
annual shale gas production trillion cubic feet per year
Richard Newell, February 8, 2011 19

20
Shale gas has been the primary source of recent growth in U.S. technically recoverable natural gas resources
0
500
1,000
1,500
2,000
2,500
3,000
2000 2005 2006 2007 2008 2009 2010 2011
AEO edition
U.S. dry gas resourcestrillion cubic feet
Unproved shale gas
Unproved other gas(including Alaska* and offshore)
Proved reserves(all types & locations)
* Alaska resource estimates prior to AEO2009 reflect resources from the North Slope that were not included in previously published documentation.
Source: EIA, Annual Energy Outlook 2011
827
1,481
2,552
245
Richard Newell, February 8, 2011

0
5
10
15
20
25
30
1990 1995 2000 2005 2010 2015 2020 2025 2030 2035
Four-fold increase in shale gas production offsets declines in other U.S. supply, meeting consumption growth and lowering import needs
U.S. dry gastrillion cubic feet per year
Alaska
Non-associated offshore
ProjectionsHistory
Associated with oilCoalbed methane
Net imports
Non-associated onshore
Shale gas
Source: EIA, Annual Energy Outlook 2011
2009
11%
1%
9% 7%
9% 8%
20%
14%
8%2%
8%
7%
46%
1%
Tight gas28% 22%
21Richard Newell, February 8, 2011

Source: EIA, Annual Energy Outlook 2011
Natural gas consumption is quite dispersed; a number of key economic and market drivers underpin natural gas consumption growth
SectorTCF gas
consumption Growth(2009-2035) Key drivers
2009 2035
Industrial, including combined heat-and-power
7.3 9.3 26% +187% combined heat-and-power generation; +30% output of gas-intensive industry; lower natural gas prices
Central electric power
6.9 7.8 13% +30% electricity consumption; lower natural gas prices; offset by +72% renewable generation and +24% coal generation
Commercial 3.1 3.8 22% +37% commercial floorspace; -3% energy intensity
Residential 4.7 4.8 <1% +30% number of households; +19% total square footage; -16% energy intensity
Richard Newell, February 8, 2011 22

23
Natural gas price projections are significantly lower than past years due to an expanded shale gas resource base
natural gas spot price (Henry Hub)2009 dollars per million Btu
ProjectionsHistory
Source: EIA, Annual Energy Outlook 2011
2009
0
2
4
6
8
10
1990 1995 2000 2005 2010 2015 2020 2025 2030 2035
AEO2010
Updated AEO2009
AEO2011
Richard Newell, February 8, 2011

Richard Newell, February 8, 2011
Oil and other liquid fuels
24

0
5
10
15
20
25
1970 1975 1980 1985 1990 1995 2000 2005 2010 2015 2020 2025 2030 2035
U.S. liquid fuels consumptionmillion barrels per day
ProjectionsHistory
Natural gas plant liquids
Biofuels including imports
Petroleum supply
Net petroleum imports
U.S. imports of liquid fuels fall due to increased domestic production—including biofuels—and greater fuel efficiency
2009
Source: EIA, Annual Energy Outlook 2011
13%12%
42%
31%
10%
4%
52%
34% Liquids from coal2%
Richard Newell, February 8, 2011 25

0 2 4 6 8 10 12 14 16 18 20 22
20092035
U.S. liquid fuelsmillion barrels per day
Net product imports
Net crude oil imports
Natural gas plant liquids
Liquids from coal
Biofuels, natural gas liquids, and crude oil production are key sources of increased domestic liquids supply
Source: EIA, Annual Energy Outlook 2011
Gulf of Mexico
Crude oil production
Biofuels (including net imports)
Refinery processing gain
Total consumption
Richard Newell, February 8, 2011 26

billions ethanol-equivalent gallons
0
5
10
15
20
25
30
35
40
45
2009 2022 2035
Biofuels fall short of the goal in 2022, but exceed the 36 billion gallon RFS target by 2030
Legislated RFS in 2022
RFS with adjustments under CAA Sec.211(o)(7)
Biodiesel
Other Advanced
Net imports
Cellulosic biofuels
Corn ethanol
Source: EIA, Annual Energy Outlook 2011Richard Newell, February 8, 2011 27
Source: EIA, Annual Energy Outlook 2011
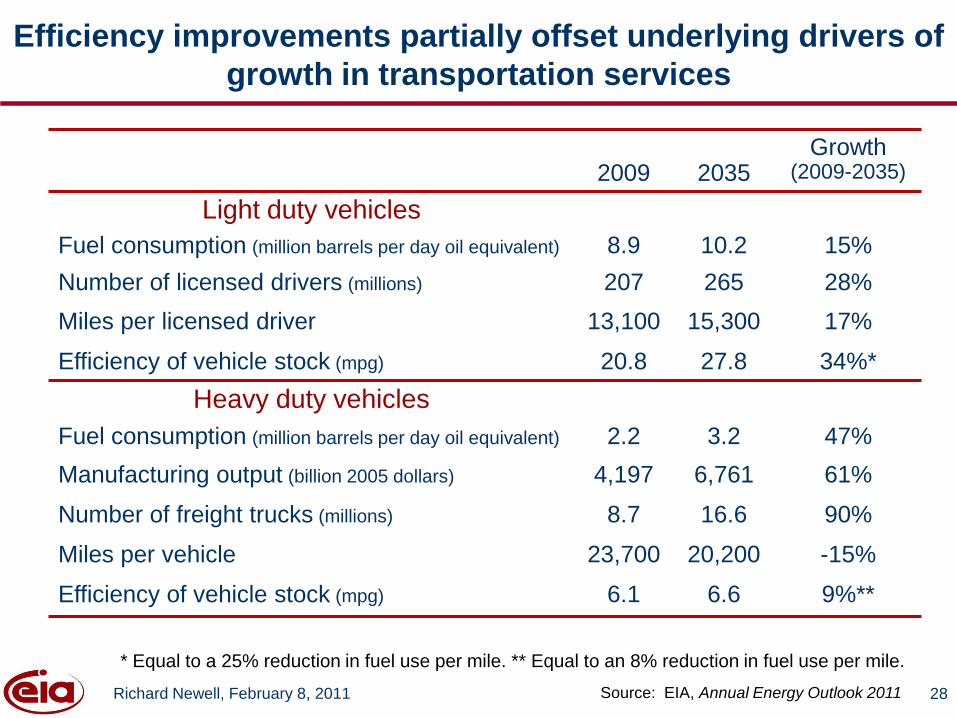
Efficiency improvements partially offset underlying drivers of growth in transportation services
2009 2035Growth
(2009-2035)
Light duty vehiclesFuel consumption (million barrels per day oil equivalent) 8.9 10.2 15%Number of licensed drivers (millions) 207 265 28%Miles per licensed driver 13,100 15,300 17%
Efficiency of vehicle stock (mpg) 20.8 27.8 34%*Heavy duty vehicles
Fuel consumption (million barrels per day oil equivalent) 2.2 3.2 47%Manufacturing output (billion 2005 dollars) 4,197 6,761 61%
Number of freight trucks (millions) 8.7 16.6 90%
Miles per vehicle 23,700 20,200 -15%
Efficiency of vehicle stock (mpg) 6.1 6.6 9%**
Richard Newell, February 8, 2011
* Equal to a 25% reduction in fuel use per mile. ** Equal to an 8% reduction in fuel use per mile.
28

Unconventional vehicles meet over 40% of U.S. light-duty vehicle sales in 2035
0
5
10
15
20
2000 2009 2015 2020 2025 2030 2035
Conventional gasolineDieselGaseous and fuel cellMild hybrid electricHybrid electricPlug-in hybrid and all-electricE85 flex fuel
U.S. light car and truck salesmillions
Source: EIA, Annual Energy Outlook 2011
ProjectionsHistory
Richard Newell, February 8, 2011 29

Richard Newell, February 8, 2011
0
25
50
75
100
125
150
175
200
225
1980 1985 1990 1995 2000 2005 2010 2015 2020 2025 2030 2035
Oil prices in the Reference case rise steadily;the full AEO2011 will include a wide range of oil prices
ProjectionsHistory
Source: EIA, Annual Energy Outlook 2011
2009
High oil price
Low oil price
AEO2011 Reference
annual average price of low sulfur crude oilreal 2009 dollars per barrel
30

Richard Newell, February 8, 2011
Other EIA activities
31

EIA’s Energy and Financial Markets Initiative• Collection of critical energy information to improve
market transparency– improved petroleum storage capacity data
– other improvements to data quality and coverage
• Analysis of energy and financial market dynamics to improve understanding of what drives energy prices– internal analysis and sponsorship of external research
• Outreach with other Federal agencies, experts, and the public– expert workshops
– public sessions at EIA’s energy conferences
– solicitation of public comment on EIA’s data collections
32Richard Newell, February 8, 2011

On Dec. 1, 2010, EIA started publishing much-improved data on petroleum products storage capacity
• Analysis of inventory levels in the context of storage capacity is important for understanding petroleum market activity and price movements, especially at key market centers such as Cushing, OK
• EIA’s new storage capacity data will be a major improvement over previous data– greater coverage: EIA is collecting the new data from terminals and
pipelines, in addition to refineries
– more frequent: unlike prior annual refinery-only data collection, the new data will be semi-annual, which is particularly important given opportunities to shift storage capacity across products to meet seasonal needs that vary across products
– market center information: in addition to standard PADD-level reporting, the new data will break out storage capacity at Cushing
33Richard Newell, February 8, 2011

Many factors influence the formation of oil pricesand other energy prices
Richard Newell, February 8, 2011 34
Supply
Affected by current conditions and future expectations for:
• energy prices• OPEC supply capacity• usable spare capacity• non-OPEC capacity• geopolitics• weather • E&P costs • E&P investments• E&P innovations
Physical balancing
• Inventories
Markets & market behavior
• Energy prices‐ spot‐ futures‐ options‐ spreads‐ swaps
• Other financial markets‐ other commodity prices‐ commodity investment‐ currency exchange rates‐ stocks and other assets ‐ interest rates
Demand
Affected by current conditions and future expectations for:
• energy prices• economic growth• industrial production• goods transport• personal transport• weather• innovation in energy-
using equipment

Quick Facts to provide the most important State energy information
Overviews and maps to explain each State’s energy markets
Data tables to provide the most current State-level statistics from EIA surveys
State Energy Profiles feature…
Comprehensive data for analysis Analytical tool Common units All fuels, all sectors
State Energy Data System (SEDS)
EIA portals provide State energy data in one convenient place
35Richard Newell, February 8, 2011

New this year for State Energy Profilesand State Energy Data System
• State Energy Profiles– New maps of selected energy-intensive areas (June 2010)
– New dynamic graphs on State profile pages (in development)
– Website redesign (launching soon)
• State Energy Data System– Improved estimation methodology (June 2010)
– New tables for total end-use consumption (publishing soon)
– Website redesign (launching soon)
36Richard Newell, February 8, 2011

• Only comprehensive source of energy-related characteristics and consumption across U.S. households
• Only EIA survey that collects household data; conducted every 4 years
Residential Energy Consumption Survey (RECS)
0.00
0.20
0.40
0.60
0.80
1.00
1.20
1.40
NewEngland
MiddleAtlantic
East NorthCentral
West NorthCentral
SouthAtlantic
East SouthCentral
WestSouth
Central
Mountain Pacific
Census Division
Qua
drill
ion
Btu
(qua
ds) Electricity
Natural GasFuel OilOther
0.00
0.10
0.20
0.30
0.40
0.50
0.60
SpaceHeating
Air-Conditioning
WaterHeating
Refrigerators Other
Energy End Use
Qua
drill
ion
Btu
(qua
ds)
New YorkFloridaTexasCalifornia
37Richard Newell, February 8, 2011
Fuel use varies by region… …due in part to different end-use needs

Expanded 2009 RECS
RECS 2005 4,382 completed interviews
Low sampling precision for all areas (census regions, divisions, States)
National, census region and division estimates, but state-level estimates for only four states
Sample too small to support complex analyses
RECS 2009 12,083 completed interviews
Greater precision assured for key geographies and statistics
End use statistics for 16 states, with more precision (MA, NY, PA, NJ, VA, GA, FL, TN, MI, IL, WI, MO, TX, CO, AZ, CA)
Greater statistical power for multivariate analyses
First release of 2009 RECS Home Energy Characteristics in March 2011
38Richard Newell, February 8, 2011

A new EIA.gov goes live this week
• New homepage and improved navigation
• Updated logo and new visual identity
• A new “Today in Energy” education product that: – Publishes a daily release of
timely and topical bites of our information, on the EIA homepage, in plain language.
– Allows us to highlight current issues, topics, and trends.
39Richard Newell, February 8, 2011

40
For more information
U.S. Energy Information Administration home page www.eia.gov
Short-Term Energy Outlook www.eia.gov/emeu/steo/pub/contents.html
Annual Energy Outlook www.eia.gov/oiaf/aeo/index.html
International Energy Outlook www.eia.gov/oiaf/ieo/index.html
Monthly Energy Review www.eia.gov/emeu/mer/contents.html
EIA Information Center (202) 586-8800Live expert from 9:00 AM – 5:00 p.m. EST
Monday – Friday (excluding Federal holidays)email: [email protected]
Richard Newell, February 8, 2011

Richard Newell, February 8, 2011
Some supply sources and demand sectors are strongly linked, while others are more dispersed
Source: EIA Annual Energy Review 2009 41
2009