ANNUAL COLLECTIVE BARGAINING SURVEY 2003 · ANNUAL COLLECTIVE BARGAINING SURVEY 2003 ... This...
32
DEPARTMENT OF HUMAN RESOURCE MANAGEMENT UNI-EUROPA GRAPHICAL ANNUAL COLLECTIVE BARGAINING SURVEY 2003 An analysis by: Professor John Gennard Strathclyde Business School University of Strathclyde GLASGOW United Kingdom February 2004
Transcript of ANNUAL COLLECTIVE BARGAINING SURVEY 2003 · ANNUAL COLLECTIVE BARGAINING SURVEY 2003 ... This...
DEPARTMENT OF HUMAN RESOURCE MANAGEMENT
UNI-EUROPA GRAPHICAL
ANNUAL
COLLECTIVE BARGAINING
SURVEY
2003
An analysis by:
Professor John Gennard
Strathclyde Business School
University of Strathclyde
GLASGOW
United Kingdom
February 2004

H:\My Documents\Projects\UNI-Europa Graphical\2009 web redesign\documents\Annual Collective
Bargaining Survey - 2003.doc
1
Contents
PAGE
Executive Summary
Introduction
The Purpose of the Survey
2003 Guidelines on Co-ordination of Collective Bargaining
The Questionnaire/Interviews
Economic and Political Environment Surrounding the 2003 Collective
Bargaining Round
Dates and Duration of Agreements
Bargained Changes in 2003 : Quantitative Aspects
Meeting the Quantitative Aspects of the 2003 Guidelines
Bargained Changes in 2003: Qualitative Aspects
Progress to Meeting the Guidelines for Bargaining Claims (2000-2003
inclusive)
Conclusions
2
5
5
7
7
10
11
13
18
19
26
29
Figures:
Tables:
1.
2.
3.
1. 2.
3.
4.
5.
6.
Guidelines on Common Collective Bargaining Objectives Agreed at
2003 Collective Bargaining Conference
Qualitative Aspects Changes to Agreements : 2003
Further Vocational Training Arrangements
Elements in the Questionnaire/Interviews Dates of Agreements
Quantitative Aspects of the 2003 Guidelines: Bargained Wage Rises
Progress on Achieving Guidelines (2000-2003 inclusive)
Achieving the Guideline Target: Number of Countries
Meeting the Guidelines (2000-2003 inclusive)
6
21
25
9 12
13
27
28
28

H:\My Documents\Projects\UNI-Europa Graphical\2009 web redesign\documents\Annual Collective
Bargaining Survey - 2003.doc
2
Executive Summary
In the 2003 collective bargaining round with national graphical employers’ organisations:
The economic and political environment was difficult. In almost all the countries,
prices for graphical work fell, plants closed, unemployment increased and union
membership fell.
Six affiliates achieved improvements to employment conditions under collective
agreements negotiated before the start of 2003.
Fourteen affiliates negotiated revisions to their existing collective agreements. Five
affiliates were party to one year agreements, seven to two year agreements and two to
three year agreements.
The majority of revised agreements became effective in either January of April.
The average annual bargained wage increase for graphical workers was +2.9%
compared with +3.1% in 2002, +3.3% in 2001 and +4.1% in 2000.
In six countries (Belgium, Denmark, Finland, Iceland, Norway and Sweden) graphical
workers received bargained pay increases in excess of the annual rate of inflation.
This compares with nine in 2002, 11 in 2001 and eight in 2000.
H:\My Documents\Projects\UNI-Europa Graphical\2009 web redesign\documents\Annual Collective
Bargaining Survey - 2003.doc
3
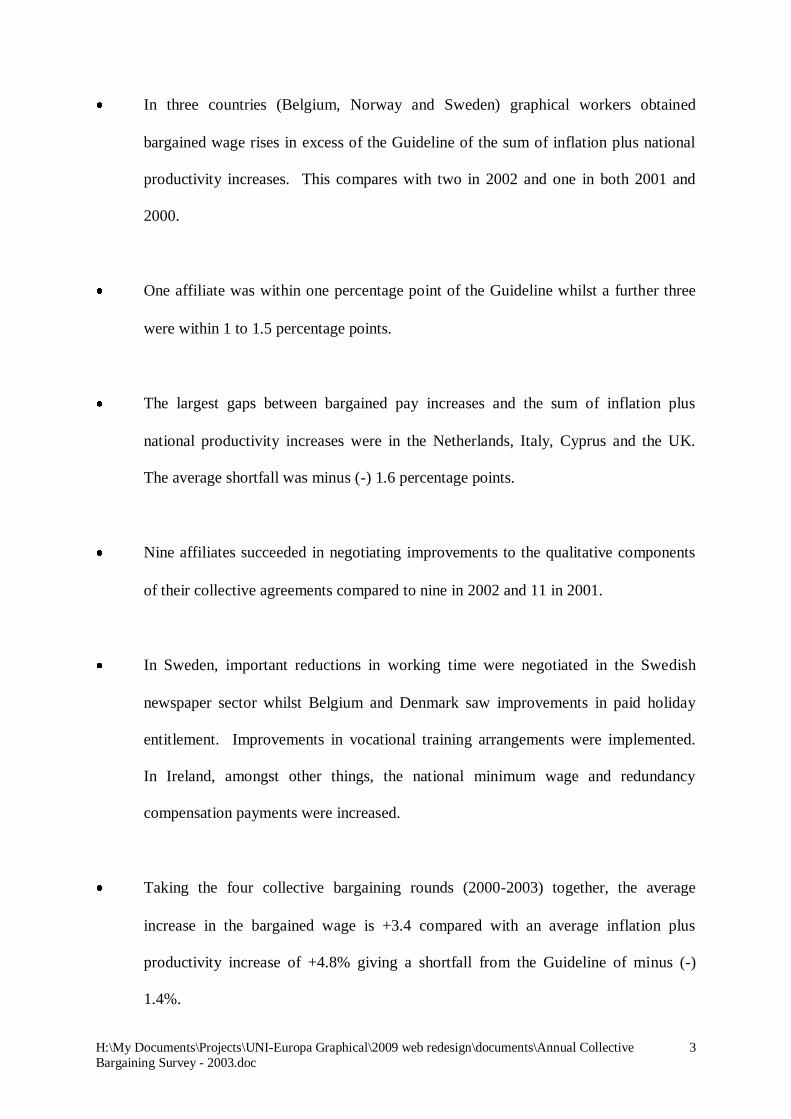
In three countries (Belgium, Norway and Sweden) graphical workers obtained
bargained wage rises in excess of the Guideline of the sum of inflation plus national
productivity increases. This compares with two in 2002 and one in both 2001 and
2000.
One affiliate was within one percentage point of the Guideline whilst a further three
were within 1 to 1.5 percentage points.
The largest gaps between bargained pay increases and the sum of inflation plus
national productivity increases were in the Netherlands, Italy, Cyprus and the UK.
The average shortfall was minus (-) 1.6 percentage points.
Nine affiliates succeeded in negotiating improvements to the qualitative components
of their collective agreements compared to nine in 2002 and 11 in 2001.
In Sweden, important reductions in working time were negotiated in the Swedish
newspaper sector whilst Belgium and Denmark saw improvements in paid holiday
entitlement. Improvements in vocational training arrangements were implemented.
In Ireland, amongst other things, the national minimum wage and redundancy
compensation payments were increased.
Taking the four collective bargaining rounds (2000-2003) together, the average
increase in the bargained wage is +3.4 compared with an average inflation plus
productivity increase of +4.8% giving a shortfall from the Guideline of minus (-)
1.4%.

H:\My Documents\Projects\UNI-Europa Graphical\2009 web redesign\documents\Annual Collective
Bargaining Survey - 2003.doc
4
The four year averaged bargained wage increase for graphical workers in general,
exceeds the four year average annual rate of increase in inflation. The real purchasing
power of graphical workers has thus, over the four year period, improved.
H:\My Documents\Projects\UNI-Europa Graphical\2009 web redesign\documents\Annual Collective
Bargaining Survey - 2003.doc
5
Introduction
This report analyses the outcome of the 2003 collective bargaining round with national
graphical employers’ organisations against the common bargaining agenda agreed at the
Annual Conference on Collective Bargaining held in Elsinor, Denmark on 29 and 30 march
2003. It also evaluates, over the period 2000-2003 inclusive, the progress made by affiliates
in meeting the Guidelines for Common Collective Bargaining Objectives.
The Purpose of the Survey
The main aims of the Annual Collective Bargaining Survey are fourfold. First, it provides an
overview of collective bargaining developments in the year. Second, it monitors progress on
meeting the collective bargaining agenda objectives for the year as established by the Annual
Conference on Collective Bargaining. Third, it helps the Conference to identify, and to
establish, the key priorities for the next collective bargaining round with national graphical
employers’ organisations. Finally, it improves the exchange of information on national
bargaining rounds amongst affiliates and assists UNI-Europa Graphical (UNI-EG) to
influence discussions at the ETUC level about defining and co-ordinating a common
bargaining agenda.

H:\My Documents\Projects\UNI-Europa Graphical\2009 web redesign\documents\Annual Collective
Bargaining Survey - 2003.doc
6
FIGURE 1:
Guidelines on Common Collective Bargaining Objectives
Agreed at the 2003 Collective Bargaining Conference
1.
Provision of Information a.
b. c. d. e.
Update regularly the Collective Bargaining Survey Reporting of national agreements concluded to UNI-EG Assessment of the bargaining results Continuous monitoring All affiliates are required to participate in the Annual Collective Bargaining Conference
2. On-Line Network a.
b. All affiliates should participate in the on-line information network established in the dialog-on project The network will aim to further improve co-ordination and co-operation between affiliates
3. Social Dialogue All affiliates are required to exert pressure on national employer organisations to engage in European Social
Dialogue/Collective bargaining.
4. Regional Collective Bargaining Support for regional/sub regional collective bargaining committees
5. Guidelines for Bargaining Claim Wages plus qualitative aspects (+) should be at least equal to inflation plus national productivity
(+) Cost Effective Qualitative Aspects
a. Working Hours
Standard working time should not exceed 1,750 hour per year for a full-time worker. The maximum amount of paid overtime should not exceed 100 hours per year after which compensatory time off (at bonus rates) arrangements should be encouraged as an alternative to paid overtime and maximise employment opportunities.
b. Further Vocational Training (FVT)
- - - - - - -
-
Link between FVT, improvement of qualifications and wage increases Establishment of an annual plan for FVT Obligation on employers to inform each employee of the FVT plan Individual right of each employee to FVT Full union involvement in FVT Cost free for employees (except with union consent or by collective agreement) All time spent on FVT is working time – normally it should take place during normal working hours (specifications could be made by collective agreement)
Establishment of monitoring committees in companies
c. Equality -
- - -
Preparation of negotiating aims/guidelines with equality officers Equal pay audits to establish existing situations regarding pay Concrete steps to achieve equality of wages between men and women as stipulated in the European Union Treaty Family friendly policies for good work/life balance
(+) Non Cost Effective Qualitative Aspects
a.
b. c.
Vocational training Equality – including race, disability and gender Health, safety and working environment
6. Transnational Companies
CBC will be asked to look at transnational company level co-ordination
7. Transnational Solidarity

H:\My Documents\Projects\UNI-Europa Graphical\2009 web redesign\documents\Annual Collective
Bargaining Survey - 2003.doc
7
2003 Guidelines on Co-ordination of Collective Bargaining
These were agreed at the Annual Conference on Collective Bargaining held in March 2003.
The Guidelines are shown in Figure 1. This conference made, relative to the 2002 bargaining
round, two major changes to the Guidelines. First, it was agreed to add a new clause on on-
line network to read:
a. All affiliates should participate in the on-line information network established in
the dialog-on project.
b. The network will aim to further improve co-ordination and co-operation between
affiliates.
Second, the Conference agreed minimum standards to be established with respect to equality
issues. In the establishment of bargaining aims/guidelines, affiliates are to involve equality
officers. Before entering into bargaining, affiliates are to undertake equal pay audits to
establish that existing differences between the pay of men and women are based on objective
factors. Affiliates are also to take concrete steps to achieve equality of wages between men
and women as stipulated in European Union Treaties. It was also agreed that affiliates should
seek to changes existing agreements so that they contain family friendly policies which
provide for good work/life balance.
The Questionnaire/Interviews
The data upon which this report is based was collected by a questionnaire sent in May 2003
to UNI-EG affiliates. The 2003 Survey contained four new questions relative to that used for
the 2002 Survey. A question was included on the number of workers covered by the

H:\My Documents\Projects\UNI-Europa Graphical\2009 web redesign\documents\Annual Collective
Bargaining Survey - 2003.doc
8
agreement. The three other new questions related to the involvement of equality officers in
the determination of bargaining aims, the use of equal pay audits to establish the objectivity
of existing differences between the pay of men and women and the steps taken by affiliates to
achieve equal pay between men and women.
Useable returns were received from 18 affiliates. Of these, 14 related to new agreements
bargained in 2003 and four to changes becoming effective under agreements signed prior to
2003. Useable information was collected from one further affiliate by face-to-face interviews
with the appropriate unions’ key negotiators. The face-to-face interview was conducted at
the UNI-EG Annual Meeting held in Madrid, Spain in November 2003. Interviews were also
conducted at the same venue with five affiliates to obtain clarification of information
provided in the returned questionnaires.
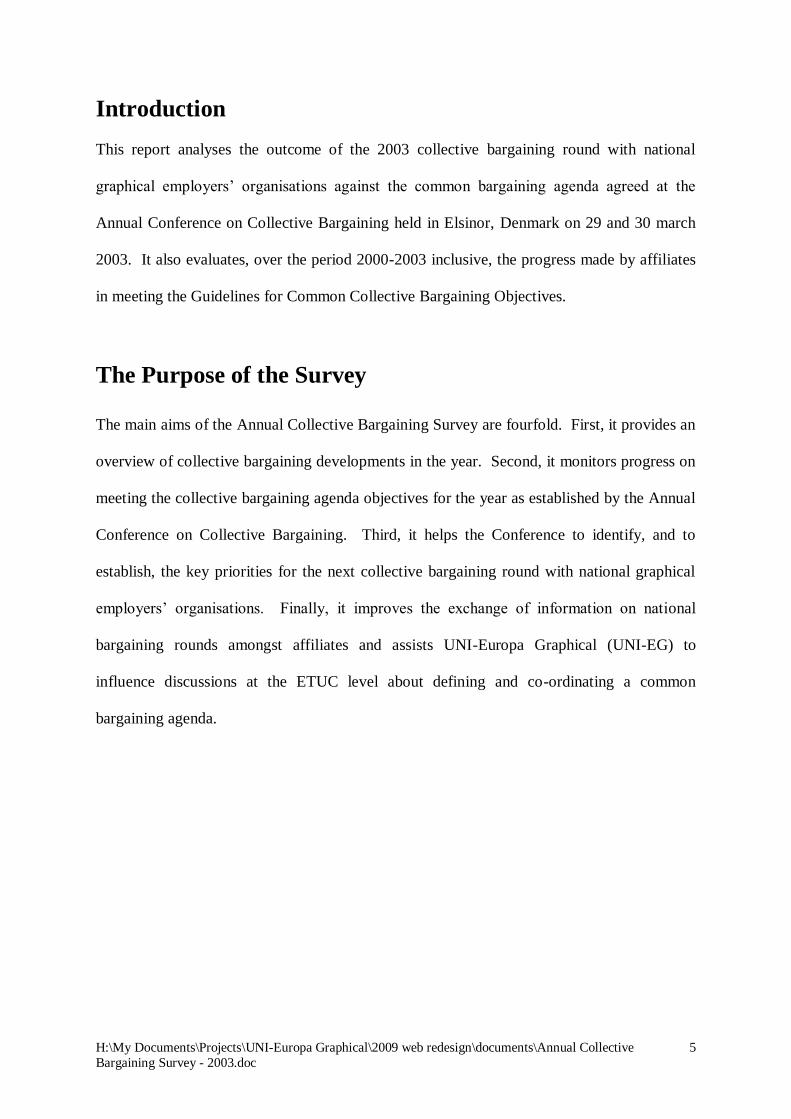
Table 1 shows the different bargaining issues covered in the questionnaire, and raised in the
face-to-face interview. A tick () denotes useable information showing a change in 2003 in
that bargaining issue. An (X) denotes there were, in 2003, no changes bargained to the
existing collective agreement on that issue. In 2003, for 7 affiliates there were no changes to
the qualitative elements of existing collective agreements.
TABLE 1
Elements in the Questionnaire/Interviews
Country
Start and
Finish Date
of
Agreement
Number of
Workers
Covered
(000s)
Quantitative
Elements
Qualitative Elements
Bargained
Wage Increase
Working
Time
Holidays Vocational
Training
Equality
Issues
Health
&
Safety
Others
Austria X X X X X X
Belgium X X X X
Bulgaria No national agreement negotiated in 2003
Croatia X X X X X X
Cyprus X X X X X X
Czech Republic No national agreement negotiated in 2003
Denmark X X X X X
Finland X X
France X X X X X
Germany X X X X X
Iceland X X X X X X
Ireland X X X X X
Italy X X X X
Netherlands X X X X X
Norway X X X X X X
Portugal X X X X X X
Spain X X X X X X
Sweden X X X X X
United Kingdom X X
H:\My Documents\Projects\UNI-Europa Graphical\2009 web redesign\documents\Annual Collective
Bargaining Survey - 2003.doc
10
Economic and Political Environment to the 2003
Bargaining Round
The economic and political environment surrounding the 2003 bargaining rounds was, from a
trade union perspective, difficult. In Austria, the graphical industry witnessed rising
unemployment, falling prices, plant closures and redundancies and over capacity. In France,
the economic situation in the industry was no better with many plant closures and/or re-
structuring giving rise to redundancies. In addition, a right wing government was attempting
to undermine worker rights.
In Germany, the graphical employers reported a 5% reduction in turnover relative to 2002
and a 6% fall in staffing levels. They also demonstrated an increasing tendency of complying
less and less with collective agreements and adopting anti-union positions. In addition, the
German government introduced legislation making it easier for employers to declare
employees redundant.
The Italian graphical sector also went through a difficult period whilst in the Netherlands
some 40% of graphical employers claimed to be operating with financial losses. The Dutch
employers organisation also complained that 2003 saw of the loss of significant amounts of
work to the lower cost areas in Europe.
In Portugal, 2003 was a difficult year for the graphical industry. The government introduced
a New Labour Code in which it refused to address trade union concerns over a clause which
permits small companies the right to refuse to re-instate or re-engage workers found to be
wrongfully dismissed.

H:\My Documents\Projects\UNI-Europa Graphical\2009 web redesign\documents\Annual Collective
Bargaining Survey - 2003.doc
11
In the UK, the economic situation of the graphical industry was also problematic. Many
companies closed down or declared significant numbers of redundancies. This situation, in
part, was attributable to a loss of confidence due to instability in the world economy which,
amongst other things, caused spending on advertising to collapse.
The economic slowdown in the graphical sectors of the different countries of Europe has
meant a decline in jobs and a further decline in the level of trade union membership.
Dates and Duration of Agreements
1. Longer Term Agreements Signed Before 2003
In 2003, in seven countries, affiliates were working under collective agreements negotiated
before the start of the year and which were over one year in duration (see Table 2). In
Denmark and Iceland, four year agreements, both due to terminate at the end of February
2004, were in operation. In Cyprus, a three year agreement, terminating on 31 December
2003 was in operation. This was also the case with the general print sector of Spain. The
paper carton sector of Spain and the general print and the packaging sectors of Sweden
continued to operate under agreements signed in 2002.
2. Agreements Made in 2002
In 2003 collective bargaining round, affiliates in five countries (Austria, Croatia, France
[newspaper sector], Sweden [newspaper sector] and the UK) concluded one year agreements.
Agreements to operate for three years were concluded in the Republic of Ireland and in the
newspaper and press agencies sector of Italy. Two year agreements were concluded in
Belgium, Finland, Germany, Italy (one agreement in the graphical sector and one agreement
in paper and packaging sector), the Netherlands and Norway. In the Czech Republic,

H:\My Documents\Projects\UNI-Europa Graphical\2009 web redesign\documents\Annual Collective
Bargaining Survey - 2003.doc
12
however in 2003, no national agreement for pay in the graphical industry was concluded (see
below).
TABLE 2
Dates of Agreements
Country Dates and Duration of Agreements No. of Workers
Covered (000s)
Austria Five year agreement. General overall agreement (2001-2006)
One year agreement (1/4/03-31/3/04)
16
Belgium Two year agreement (1/1/03-31/12/04) – General Print
Two year agreement (1/1/03-31/12/04) - Newspapers
15
2
Croatia One year agreement (1/11/02-1/12/03) 1.5
Cyprus Three year agreement (01/1/01-31/12/03) na
Czech Republic No national agreement reached na
Denmark Four year overall agreement (01/3/00-29/2/04) na
Finland Two year agreement (1/2/03-15/2/05) 14
France One year agreement (1/1/03-31/12/03) – Regional Newspapers na
Germany Two year agreement (1/4/03-31/3/05) 100
Iceland Four year agreement (1/3/00-28/2/04) 1
Ireland Three year agreement (1/1/03-31/12/05) na
Italy Two year agreement (1/1/03-31/12/04) – General Print
Two year agreement (1/7/03-30/6/05) – Paper/Packaging
Four year agreement (1/1/03-31/12/06) – Newspapers
35
85
8
Netherlands Two year agreement (1/2/03-31/1/05) 40
Norway Two year agreement (1/4/03-31/3/04) 6
Portugal No national agreement in General Print and Daily Newspapers na
Russia Two year 6 months agreement (19/3/01-31/12/03) na
Spain Two year agreement (1/1/01-31/12/03) – Paper/Carton
Three year agreement (4/5/01-3/5/04) – General Print
140
20
Sweden One year agreement (1/4/03-31/5/04) – Newspapers
Two year agreement (1/4/02-30/4/04) – General Print
Two year agreement (1/4/02-30/4/04) - Packaging
3
8
5
Switzerland No national agreement – trying for new agreement since 2000 na
United Kingdom One year agreement (24/4/03-23/4/04) – General Print 60
Of the 23 collective bargaining agreements listed in Table 2, in eight a wage increase became
effective in January, in two in February, in three in March, in seven in April, and one in May,
in July and in November. As in previous surveys, this indicates the co-ordination of the
anniversary dates of agreements is a feasible option as for most agreements this occurs
in the first five months of the calendar year with peaks in January and April.
H:\My Documents\Projects\UNI-Europa Graphical\2009 web redesign\documents\Annual Collective
Bargaining Survey - 2003.doc
13
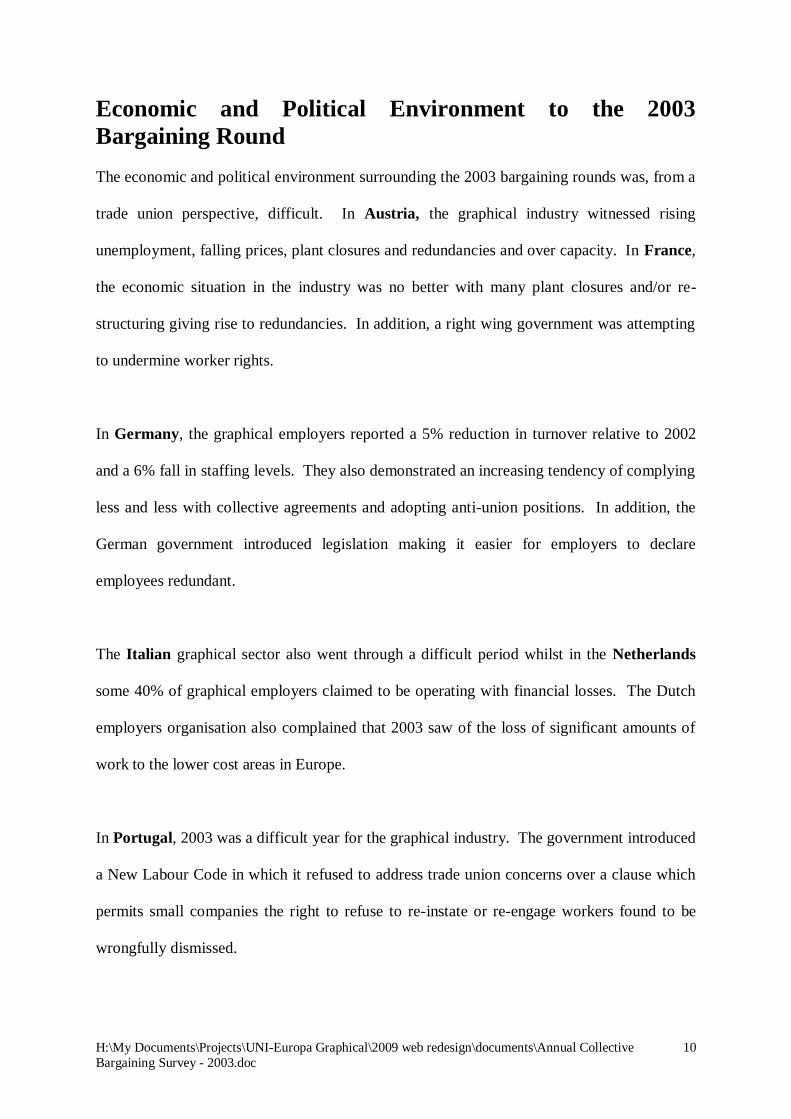
Bargained Changes in 2003 : Quantitative Aspects
Column four of Table 3 shows the percentage bargained increase in pay achieved at the
national level for graphical workers in 15 European countries. The range of percentage
increases in wages varies from a low of +1.5% in France to a high of +5.1% in Norway. The
average annual bargained wage increase for graphical workers in 2003 was +2.9% compared
with +3.1% in 2002, +3.3% in 2001 and +4.1% in 2000. In six countries – Belgium,
Denmark, Finland, Iceland, Norway and Sweden – graphical workers received bargained pay
increases in excess of the annual rate of inflation. This compares with eight countries in
2002.
TABLE 3
Quantitative Aspects of the 2003 Guidelines : Bargained Wage Rises
Country
1 2 3 4
Difference
Column 4
Minus
Column 3
Qualitative
Aspect
Improvement
Guideline Determinants
Increase
in
Inflation
(%)
Increase in
National
Productivity
(%)
Inflation
+
Productivity
(%)
Bargained
Wage
Increase
(%)
Austria
Belgium
Cyprus
Denmark
Finland
France
Germany
Iceland
Ireland
Italy
Netherlands
Norway
Spain
Sweden
United Kingdom
+1.8
+2.0
+4.5
+2.8
+2.1
+1.9
+1.6
+1.8
+4.9
+3.7
+3.2
+3.0
+4.0
+1.5
+2.9
+0.6
+1.0
+1.5
+2.6
+2.0
+1.1
+1.7
+3.3
n/a
+2.0
+2.0
+1.8
+1.2
+0.5
+2.3
+2.4
+3.0
+6.0
+5.4
+4.1
+3.0
+3.3
+5.1
n/a
+5.7
+5.2
+4.8
+5.2
+2.0
+5.2
+1.8
+4.0
+3.2
+3.2
+2.9
+1.5
+1.5
+3.4
+3.1
+2.8
+2.0
+5.1
+3.9
+2.5
+2.8
-0.6
+1.0
-2.8
-2.2
-1.2
-1.5
-1.8
-1.7
n/a
-2.9
-3.2
+0.3
-1.3
+0.5
-2.4
No
Yes
No
Yes
Yes
No
Yes
No
Yes
Yes
Yes
No
No
Yes
Yes
Average +2.8 +1.7 +4.5 +2.9 -1.6
In Austria, a 1.8% increase in wages for graphical workers was negotiated. There is also an
overall agreement dealing with issues other than pay. This was initially concluded in 1979

H:\My Documents\Projects\UNI-Europa Graphical\2009 web redesign\documents\Annual Collective
Bargaining Survey - 2003.doc
14
and was last revised in 2000 and is due for review again in 2004. In Belgium, under two year
deals, both to terminate at the end of 2004, general print and newspaper workers both
received wage increases. The former received 4% plus a bonus of 100 euros whilst the latter
received 4% plus a bonus of 1%.
In Cyprus, graphical workers receive each January and July an automatic increase in pay
equal to the annual rate of increase in inflation at those times. It is paid as a bonus and is not
consolidated into the basic rate. In addition, a further annual increase arises from collective
bargaining. In 2003, the annual increase in pay from these two sources for graphical workers
was 3.2%.
In Finland, graphical workers received a pay increase of 2.9%. This was granted under a
new national incomes policy Accord signed in December 2002 by the central Finnish social
partner organisations. This agreement, concluded after some weeks of negotiations, runs
from 1 February 2003 to 15 February 2005. In order to facilitate the new national incomes
policy Accord, the Finnish government announced, across the board, income tax cuts of 0.2%
and some reduction in employee unemployment insurance contributions.
In France, a revised wage agreement for regional daily newspaper workers which provided
for a 1.5% annual increase payable in three instalments – 1% from April, 0.3% from August
and 0.2% from October – was implemented. In the general print sector, as in 2002, increases
in pay were negotiated at company level and the average pay increase achieved was 1.9%.
In Germany, a revised pay agreement was agreed after a series of very difficult negotiations
and the imposition by Verdi (Medien), of industrial sanctions. Under the agreement, there

H:\My Documents\Projects\UNI-Europa Graphical\2009 web redesign\documents\Annual Collective
Bargaining Survey - 2003.doc
15
was a pay pause for three months followed by an increase of 1.5% from 1 July 2003. Eleven
months later, on 1 June 2004, graphical workers will receive a further increase of 1.7%. The
agreement, which will expire on 31 March 2005, also extends, until 31 July 2007, the partial
early retirement agreement concluded in 2000.
In Ireland, following government intervention, a new National Pay Accord was agreed.
Talks had broken down in December 2002 over the issue of pay and the right to union
representation. Government intervention led, in January 2003, to agreement between the
Irish Congress of Trade Unions and the Irish Business and Employers’ Confederation. The
new agreement entitled Sustaining Progress runs for three years from 1 March 2003. It
provides for an increase in pay in the private sector of 7% over 18 months payable in three
phases. 3% is payable for the first nine months, a further 2% for the next six months and a
further 2% for the final three months. In addition, the agreement provides for improvements
in statutory redundancy pay, an increase in the statutory minimum wage from 1 January 2004
to 7 euros per hour (previously 6.35 euros) and for improvements in the procedures by which
trade unions can seek to represent their members. While the overall agreement is to last for
three years, the proposed pay improvements only cover an interim period of 18 months.
Negotiations on the pay increases to apply in the second 18 month period are to begin in
March 2004.
In Italy, the successful negotiation of wage increases was achieved in three sectors. In
January, in the graphical sector, a two year agreement providing for an increase of 5.7% over
the period came into effect. In the same month, the same terms also became operative in the
paper and packaging industry. In April 2003, a new collective agreement for the newspaper
and press agencies sector was signed. As well as a 4.6% wage increase over two years the
H:\My Documents\Projects\UNI-Europa Graphical\2009 web redesign\documents\Annual Collective
Bargaining Survey - 2003.doc
16
deal provides for an increase in employers’ occupation and social security contributions,
examination of a new job classification system and the creation of various new joint
committees. The 4.6% increase in wages is payable in three instalments – 1 May 2003, 1
January 2004 and 1 July 2004. In May 2003, the employees received a lump-sum payment of
60 euros to compensate for the delay between the expiry of the previous collective agreement
and the commencement of the new agreement.
In the Netherlands, graphical workers received a 2% pay increase payable in two stages.
One percent became available on 1 February 2003 and a further 1% increase payable on 1
November 2003. In January 2004, the parties will review whether additional increases
should become payable in 2004. The agreement is to operate for two years from 1 February
2003 to 31 January 2005.
In Norway, the Norsk Grafisk Forbund negotiated a 5% wage increase with effect from 1
April. The agreement is to run for one year.
In Spain, under a three year agreement signed in January 2001, employees in the paper and
carton sector received a pay increase of 3.9%. This was roughly in line with the agreement,
made at the end of January 2003, between the four central social partner organisations to
accept for one year a commitment to moderate pay increases. Although an exact figure for
pay growth was not laid down, the agreement stated pay growth should be in line with the
2003 forecast for inflation plus productivity giving a target of 3%.
H:\My Documents\Projects\UNI-Europa Graphical\2009 web redesign\documents\Annual Collective
Bargaining Survey - 2003.doc
17
In Sweden the newspaper sector saw a revised collective agreement providing for a 3.2%
increase over a 14 month period beginning on 1 April 2003. On an annual basis, the increase
is estimated to be 2.5%.
In the United Kingdom, changes to the national agreement in the English and Welsh
graphical industry saw a wage increase of 2.8%. The agreement also committed the GPMU
and the employers organisation to establish a joint review body under an independent
chairperson, to address the key employment relations issues facing the graphical industry in
the medium to long term. Such issues are to include existing and proposed employment
legislation and the scope, context and format of the national agreement.
Central and Eastern Europe Group
Returns were received from three affiliates assigned to this group. In the Czech Republic
negotiations to replace the three years agreement that terminated on 31 December 2002 broke
down without agreement. The negotiators had agreed that the country’s national minimum
wage should be introduced into the agreement as the basic minimum monthly rate of pay.
The agreement, however, could not be signed, and implemented, because one member firm of
the employers organisation objected. The constitution of the employers’ organisation permits
any member firm the right to veto any decisions. Majority rule does not prevail and decisions
can only be implemented if they have the unanimous support of all members. At the time of
writing, however, the union and the employers organisation are trying to persuade the
employer concerned to end their objection.
H:\My Documents\Projects\UNI-Europa Graphical\2009 web redesign\documents\Annual Collective
Bargaining Survey - 2003.doc
18
In Croatia, employees in the graphical industry received no increase in wage. They are
operating under a long term agreement that began on 14 June 1997 and which is due to expire
on 1 December 2003.
In Slovakia, graphical workers received a bargained wage increase of 7% but the annual rate
of increase in inflation was 9%.
Meeting the Quantitative Aspects of the 2003 Guidelines
Table 3 shows the 2003 pay bargaining outcomes against the agreed guidelines of achieving
bargained wage improvements at least equal to the sum of increases in the annual rate of
inflation plus the annual rate of increase in national productivity. In three countries
(Belgium, Norway and Sweden) the guideline target was exceeded. For Norway, this was for
the second successive year. Austria was within one percentage point of achieving the
guideline target whilst three other countries (Finland, Spain and France) were within 1.5
percentage points of the target. In seven other countries (Denmark, Germany, Iceland, Italy,
the Netherlands, UK and Cyprus) the bargained wage increases achieved in 2003 were over
1.5 percentage points below the guideline. As already mentioned above, in six countries the
bargained pay increase exceed that of the annual increase in the rate of inflation. Real wages
(ie the purchasing power) of graphical workers in these countries thus improved in 2003.
Table 3 shows an average shortfall of minus (-) 1.6 percentage points between bargained pay
increases and the sum of inflation plus productivity increases. The largest shortfalls were
found in the Netherlands (-3.2), Italy (-2.9), Cyprus (-2.8), the UK (-2.4) and Denmark (-2.2).
However, of the 15 countries in Table 3 below, the 2003 Guidelines, six negotiated
improvements to the qualitative aspects of their collective agreements. The costs to

H:\My Documents\Projects\UNI-Europa Graphical\2009 web redesign\documents\Annual Collective
Bargaining Survey - 2003.doc
19
employers of these improvements are not easy to calculate but if an estimate is made then in
the case of Finland, the value of the qualitative changes probably more than offsets the gap
between the achieved bargained wage increase and the sum of inflation plus productivity
increases.
Bargained Changes in 2003 : Qualitative Aspects
Figure 2 shows the qualitative changes to collective agreements coming into effect in 2003.
The number of countries in which such changes were negotiated was nine compared with the
same number in 2002 and 11 in 2001.
Reduced Working Time
France saw the implementation of a new law making it, amongst other things, easier for
companies to implement the legislation governing the 35 hour week. This legislation does
not abandon the principle of a 35 hour week but creates more flexibility for the social
partners to negotiate the conditions under which working time reductions are implemented at
individual company level. The flexibility is to be achieved in that henceforth overtime
worked will attract financial payment, unless a sectoral or company agreement, allows for
compensation in the form of time off. This replaces the former system, under which the first
four hours of weekly overtime were compensated by time off and the following four hours
attracted a payment.
A new agreement signed in the newspaper industry of Sweden provided, from 1 April 2003,
for a reduction in weekly working time of 12 minutes. This figure, when annualised, is the
equivalent to one day less work per year. It also brings the newspaper sector into line with
the general printing and packaging sectors (see Collective Bargaining Survey, 2002).
H:\My Documents\Projects\UNI-Europa Graphical\2009 web redesign\documents\Annual Collective
Bargaining Survey - 2003.doc
20
In Germany the provision negotiated in 2000 whereby employees aged 55 and over are
entitled to work part-time on the basis of a voluntary contract was extended for a further three
years to 31 July 2007.
Increase in holiday Entitlement
In Belgium, agreements in the newspaper and general printing sectors provided for increased
paid holiday entitlement based on length of service with the company,
In Denmark, from 1 May 2003, graphical workers became entitled to one additional day of
paid holiday. This now gives an annual figure of six weeks paid holiday entitlement plus
bank holidays.
Improvements in Vocational Training Arrangements
In Italy, the new collective agreement for graphical workers established a specific joint
training agency responsible for workers’ vocational training and re-qualification within the
sector’s existing national vocational training arrangements to deal with the continuous
technological change in the sector. Job classifications will also be adjusted to technological
development.
In Finland, the social partners agreed to measures to safeguard the career development and
professional knowledge of shop stewards and of health and safety representatives. In
addition, they will have access to computers, internet and e-mail connections to assist them in
their role as trade union representatives.
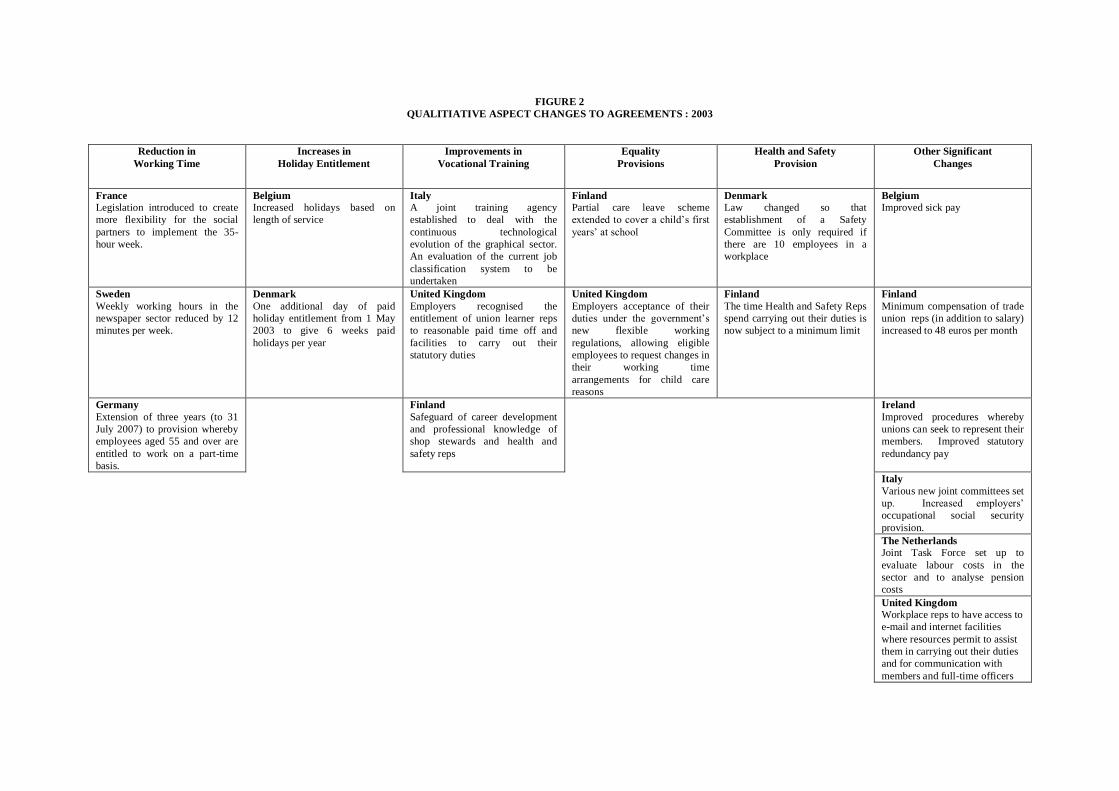
FIGURE 2
QUALITIATIVE ASPECT CHANGES TO AGREEMENTS : 2003
Reduction in
Working Time
Increases in
Holiday Entitlement
Improvements in
Vocational Training
Equality
Provisions
Health and Safety
Provision
Other Significant
Changes
France
Legislation introduced to create
more flexibility for the social
partners to implement the 35-
hour week.
Belgium Increased holidays based on
length of service
Italy A joint training agency
established to deal with the
continuous technological
evolution of the graphical sector.
An evaluation of the current job
classification system to be
undertaken
Finland
Partial care leave scheme
extended to cover a child’s first
years’ at school
Denmark
Law changed so that
establishment of a Safety
Committee is only required if
there are 10 employees in a
workplace
Belgium
Improved sick pay
Sweden
Weekly working hours in the
newspaper sector reduced by 12
minutes per week.
Denmark
One additional day of paid
holiday entitlement from 1 May
2003 to give 6 weeks paid
holidays per year
United Kingdom
Employers recognised the
entitlement of union learner reps
to reasonable paid time off and
facilities to carry out their
statutory duties
United Kingdom
Employers acceptance of their
duties under the government’s
new flexible working
regulations, allowing eligible
employees to request changes in
their working time
arrangements for child care
reasons
Finland
The time Health and Safety Reps
spend carrying out their duties is
now subject to a minimum limit
Finland
Minimum compensation of trade
union reps (in addition to salary)
increased to 48 euros per month
Germany
Extension of three years (to 31
July 2007) to provision whereby
employees aged 55 and over are
entitled to work on a part-time
basis.
Finland
Safeguard of career development
and professional knowledge of
shop stewards and health and
safety reps
Ireland
Improved procedures whereby
unions can seek to represent their
members. Improved statutory
redundancy pay
Italy
Various new joint committees set
up. Increased employers’
occupational social security
provision.
The Netherlands
Joint Task Force set up to
evaluate labour costs in the
sector and to analyse pension
costs
United Kingdom Workplace reps to have access to
e-mail and internet facilities
where resources permit to assist
them in carrying out their duties
and for communication with
members and full-time officers

H:\My Documents\Projects\UNI-Europa Graphical\2009 web redesign\documents\Annual Collective
Bargaining Survey - 2003.doc
22
In the United Kingdom, the graphical employers have agreed that workplace Union Learner
Representatives be given reasonable time off and access to facilities to carry out their
statutory duties.
Equality Provision
Finland, witnessed a reform of the existing system of partial care leave, under which the
parents of young children may reduce their working hours on an unpaid basis during the year
in which the child first starts school. This right applied to only one parent. From 1 January
2003, the leave was extended upto a child’s second year at school. Furthermore, both parents
are now eligible for partial care leave and are entitled to an allowance of 50% of the current
parental allowance.
In the United Kingdom, the graphical employers recognised their obligations under the
Government’s Flexible Working Regulations, which permit eligible workers to request
changes in childcare reasons in their working time arrangements.
Health and Safety Provision
In Denmark, with effect from 1 January 2003, the law (not the collective agreement)
changed so that establishing a Safety Committee only becoming an obligation on an
employer if they employ 10 employees or more. Previously, the limit was the employment of
five or more workers.
In Finland, the National Incomes Policy Accord agreement provided that the full-time health
and safety representatives spend carrying out their duties would be subject to a minimum
limit.
H:\My Documents\Projects\UNI-Europa Graphical\2009 web redesign\documents\Annual Collective
Bargaining Survey - 2003.doc
23
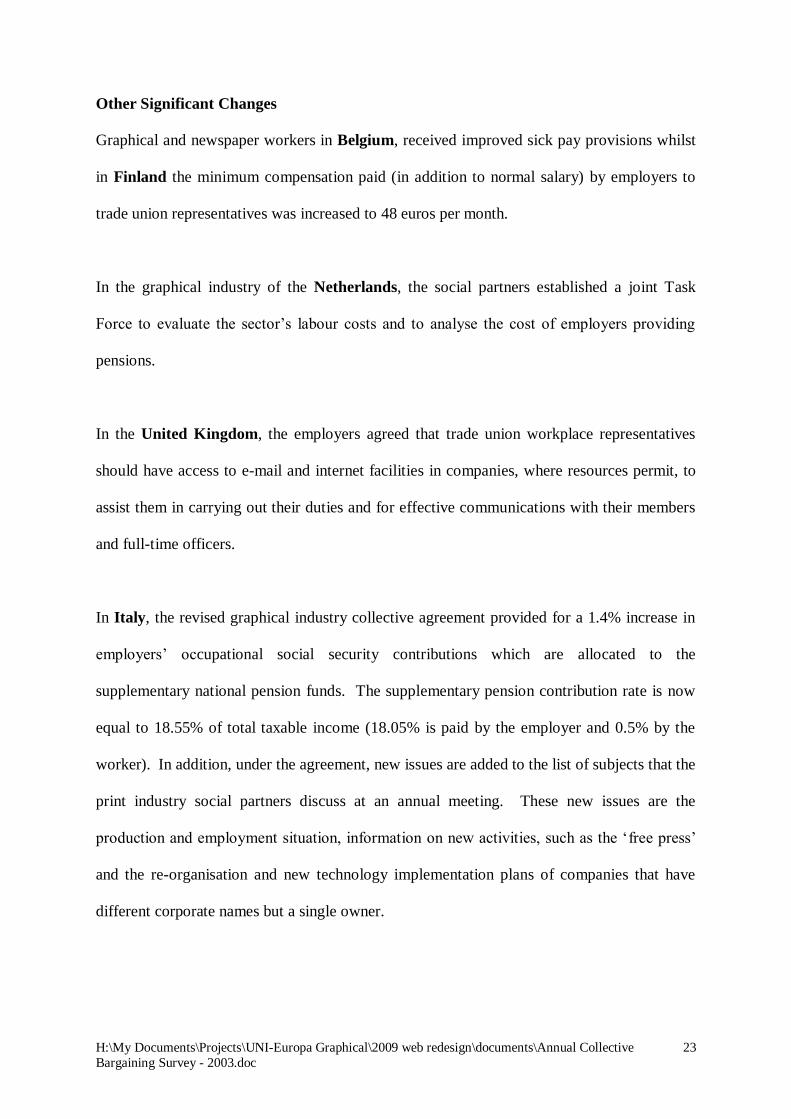
Other Significant Changes
Graphical and newspaper workers in Belgium, received improved sick pay provisions whilst
in Finland the minimum compensation paid (in addition to normal salary) by employers to
trade union representatives was increased to 48 euros per month.
In the graphical industry of the Netherlands, the social partners established a joint Task
Force to evaluate the sector’s labour costs and to analyse the cost of employers providing
pensions.
In the United Kingdom, the employers agreed that trade union workplace representatives
should have access to e-mail and internet facilities in companies, where resources permit, to
assist them in carrying out their duties and for effective communications with their members
and full-time officers.
In Italy, the revised graphical industry collective agreement provided for a 1.4% increase in
employers’ occupational social security contributions which are allocated to the
supplementary national pension funds. The supplementary pension contribution rate is now
equal to 18.55% of total taxable income (18.05% is paid by the employer and 0.5% by the
worker). In addition, under the agreement, new issues are added to the list of subjects that the
print industry social partners discuss at an annual meeting. These new issues are the
production and employment situation, information on new activities, such as the ‘free press’
and the re-organisation and new technology implementation plans of companies that have
different corporate names but a single owner.

H:\My Documents\Projects\UNI-Europa Graphical\2009 web redesign\documents\Annual Collective
Bargaining Survey - 2003.doc
24
In Ireland, the national tripartite agreement entitled Sustaining Progress also contains a
provision to amend the Redundancy Payments Acts to improve statutory redundancy
payments. The former rates of half week’s pay for each year served under the age of 41 and
one week’s pay for each year served over 41 are to be increased to two weeks’ pay per year
of service regardless of age and with the bonus week retained in the calculation of payments.
The agreement also commits the Irish government to introduce legislation to support the right
to organise and be represented. Unions are able to obtain a binding Labour Court
determination on pay and conditions against employers who refuse to recognise workers’
right to be represented by a union.
Vocational Training Arrangement
The 2002 Collective Bargaining Conference in Rome established minimum standards to be
achieved by affiliates in the area of vocational training arrangements. The 2003 Collective
Bargaining Questionnaire collected information on the extent to which these minimum
standards already exist. The results are shown in Figure 3.
In the majority of the countries, employers are under no obligation to inform each employee
of the further vocational training plan envisaged for them. It is also the majority situation
that there is no full union involvement in vocational training arrangement decisions. There is
also an absence of committees to monitor the quality and quantity of vocational training
provided. Most graphical workers in Europe, however, do receive vocational training free of
charge and in normal working hours.

FIGURE 3
Further Vocational Training Arrangements
Country
1 2 3 4 5 6 7 8
Link between
FVT
Improvement
of Qual and
Wage Increases
Annual Plan
For
FVT
Employer to
Inform each
Employee of
FVT Plan
Right of
Employee to
FVT
Union
Involvement in
FVT
FVT
Provided Free of
Charge
FVT
Takes Place in
Working Hours
Existence of
Monitoring
Committees
Austria Yes No No No No Yes Yes No
Belgium No Yes No Yes No No Yes No
Croatia No No No Yes Yes Yes No Yes
Czech No No No No No Yes Yes No
Denmark No response
Finland No Yes Yes No Yes No No No
France Yes Yes Yes Yes Yes Yes Yes No
Germany No No No No No No No No
Iceland No response
Ireland No response
Italy No No No No No No No No
Latvia No No No Yes No Yes Yes No
Netherlands Yes Yes Yes Yes Yes Yes Yes Yes
Norway No Yes Yes Yes Yes Yes No Yes
Portugal No response
Spain No response
Sweden No response
Switzerland No Yes Yes No No Yes Yes Yes
UK No No No No Yes Yes Yes No
Total Responses Yes = 3 No = 11
Yes = 6 No = 7
Yes = 5 No = 8
Yes = 6 No = 7
Yes = 5 No = 8
Yes = 9 No = 4
Yes = 8 No = 5
Yes = 4 No = 9
H:\My Documents\Projects\UNI-Europa Graphical\2009 web redesign\documents\Annual Collective
Bargaining Survey - 2003.doc
26
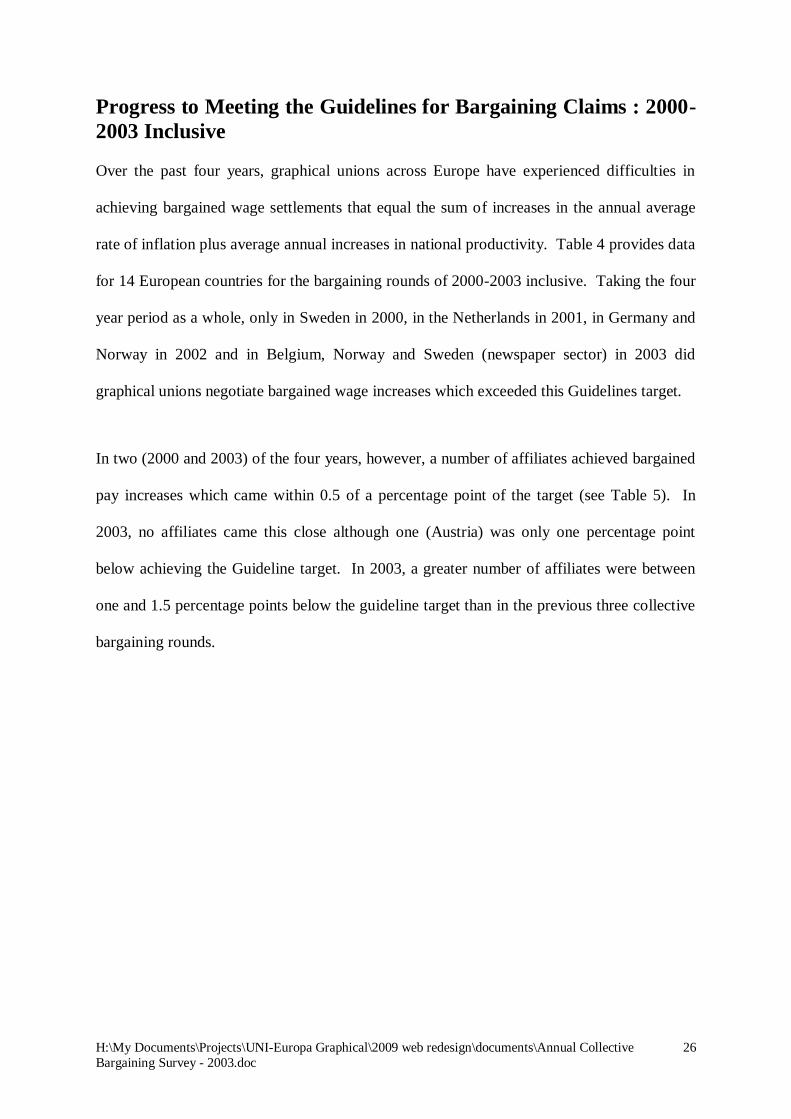
Progress to Meeting the Guidelines for Bargaining Claims : 2000-
2003 Inclusive
Over the past four years, graphical unions across Europe have experienced difficulties in
achieving bargained wage settlements that equal the sum of increases in the annual average
rate of inflation plus average annual increases in national productivity. Table 4 provides data
for 14 European countries for the bargaining rounds of 2000-2003 inclusive. Taking the four
year period as a whole, only in Sweden in 2000, in the Netherlands in 2001, in Germany and
Norway in 2002 and in Belgium, Norway and Sweden (newspaper sector) in 2003 did
graphical unions negotiate bargained wage increases which exceeded this Guidelines target.
In two (2000 and 2003) of the four years, however, a number of affiliates achieved bargained
pay increases which came within 0.5 of a percentage point of the target (see Table 5). In
2003, no affiliates came this close although one (Austria) was only one percentage point
below achieving the Guideline target. In 2003, a greater number of affiliates were between
one and 1.5 percentage points below the guideline target than in the previous three collective
bargaining rounds.

H:\My Documents\Projects\UNI-Europa Graphical\2009 web redesign\documents\Annual Collective
Bargaining Survey - 2003.doc
27
TABLE 4
Progress on Achieving Guidelines : 2000 – 2003 Inclusive
Country
Guideline Determinants 3 4 5
Qualitative
Aspects
Inflation
+
Productivity
Bargained
Wage
Increase
%
Difference
Col 4
Minus
Col 3
Increase
in
Inflation
%
Increase
in
National
Productivity
%
AUSTRIA
2000
2001
2002 2003
Av
+3.0
+2.9
+1.6 +1.8
+2.3
+2.4
+2.2
+1.2 +0.6
+1.6
+5.5
+5.1
+2.8 +2.4
+3.9
+2.0
+2.3
+2.7 +1.8
+2.2
-3.4
-2.8
-0.1 -0.6
-1.7
NO
NO
NO NO
BELGIUM
2000 2001
2002
2003
Av
+3.2 +3.8
+2.6
+2.0
+2.9
+1.2 +1.3
+1.0
+1.0
+1.1
+4.6 +5.1
+3.6
+3.0
+4.0
+1.0 +2.2
+3.2
+4.0
+2.6
-3.6 -2.9
-0.4
-1.0
-1.4
NO YES
YES
YES
CYPRUS 2000
2001
2002
2003 Av
+4.1
+2.0
+3.5
+4.5 +3.5
+2.7
+2.1
+3.5
+1.5 +2.5
+6.8
+4.1
+7.0
+6.0 +6.0
+4.6
+3.2
+6.7
+3.2 +4.4
-2.2
-0.9
-0.3
-2.8 -1.6
NO
NO
YES
NO
DENMARK
2000
2001 2002
2003
Av
+2.9
+3.1 +2.5
+2.8
+2.8
+1.8
+1.9 +1.9
+2.6
+2.1
+4.7
+5.0 +4.4
+5.4
+4.9
+3.7
+3.8 +3.5
+3.2
+3.6
-1.0
-1.2 -0.9
-2.2
-1.3
YES
YES YES
YES
FINLAND 2000
2001
2002
2003 Av
+4.2
+3.2
+2.5
+2.1 +3.0
+1.6
+3.4
+2.4
+2.0 +2.4
+5.8
+6.6
+4.9
+4.1 +5.4
+3.1
+2.3
+2.3
+2.9 +2.7
-2.7
-4.3
-2.6
-1.2 -2.7
YES
YES
NO
YES
GERMANY
2000
2001
2002 2003
Av
+2.5
+3.6
+1.6 +1.6
+2.3
+1.1
+3.0
+0.5 +1.7
+1.6
+3.6
+6.6
+2.1 +3.3
+3.9
+3.0
+2,5
+3.4 +1.5
+2.9
-0.6
-4.1
+1.3 -1.8
-1.3
YES
YES
NO YES
IRELAND
2000 2001
2002
2003
Av
+6.2 +4.1
+5.0
+4.9
+5.1
+3.9 +4.7
+1.9
na
na
+10.1 +8.8
+6.9
na
na
+5.0 +7.5
+4.0
+3.1
+4.9
-5.1 -1.3
-2.9
na
n/a
YES YES
NO
YES
ITALY
2000
2001
2002 2003
Av
+2.7
+2.9
+2.4 +3.7
+2.9
+0.3
+1.8
+1.0 +2.0
+1.3
+3.0
+4.7
+3.4 +5.7
+4.2
+2.5
+2.5
+1.4 +2.8
+2.3
-0.5
-2.2
-2.0 -2.9
-1.9
YES
YES
YES YES
LUXEMBOURG
2000 2001
2002
2003
Av
+3.2 +2.1
+1.7
na
na
+1.6 +1.9
+0.9
na
na
+4.8 +4.0
+2.6
na
na
+1.5 +1.5
+1.5
na
na
-3.3 -2.5
-1.1
na
na
NO NO
NO
NO
NETHERLANDS 2000
2001
2002
2003 Av
+2.9
+2.1
+4.5
+3.2 +3.2
+1.5
+1.4
-0.8
+2.0 +1.4
+4.4
+3.5
+3.7
+5.2 +4.2
+4.0
+4.0
+3.0
+2.0 +3.3
-0.4
+0.5
-0.7
-3.2 -2.5
YES
YES
YES
YES
NORWAY
2000
2001 2002
2003
Av
+3.5
+4.0 +1.3
+3.0
+3.0
+0.6
+1.8 +1.1
+1.8
+1.3
+4.1
+5.8 +2.4
+4.8
+4.3
+3.8
+4.2 +3.5
+5.1
+4.2
-0.3
-1.6 +1.1
+0.3
-0.5
YES
YES YES
YES
SPAIN 2000
2001
2002
2003 Av
+3.0
+4.2
+3.1
+4.1 +3.6
+2.2
+2.5
+1.1
+1.2 +1.8
+5.2
+6.7
+4.2
+5.2 +5.3
+3.1
+3.0
+2.9
+3.9 +3.2
-2.1
-3.7
-1.3
-1.3 -2.1
NO
YES
YES
NO
SWEDEN
2000
2001 2002
2003
Av
+1.0
+3.1 +2.2
+1.5
+2.0
+2.5
+2.3 +1.5
+0.5
+1.6
+3.5
+5.4 +3.7
+2.0
+3.7
+3.8
+4.5 +3.0
+2.5
+3.5
+0.3
-0.9 -0.7
+0.5
-0.2
NO
YES YES
YES
UNITED KINGDOM
2000 2001
2002
2003
Av
+3.3 +2.6
+1.5
+2.9
+2.6
+2.3 +2.2
+0.9
+2.3
+1.9
+5.6 +4.8
+2.4
+5.2
+2.8
+2.9 +3.1
+2.2
+2.8
+2.8
-2.7 -1.7
-0.2
-2.4
-1.8
YES YES
YES
YES

H:\My Documents\Projects\UNI-Europa Graphical\2009 web redesign\documents\Annual Collective
Bargaining Survey - 2003.doc
28
TABLE 5
Achieving the Guideline Target : Number of Countries
Bargaining
Round
Guideline
Achieved
Wage Increase Within:
Total 0.5 Percentage
Point of
Target
One
Percentage
Point of
Target
1.5
Percentage
Points of
Target
In Excess
Of 1.5
Percentage
Points of Target
2000
2001
2002
2003
1
1
2
3
3
0
4
0
0
2
4
1
0
1
2
3
10
10
2
7
14
14
14
14
Table 6 shows for each of the four bargaining rounds separately and for the four as a whole
the average increase in inflation, the average increase in national productivity, the average
increase in the bargained wage and the average shortfall from the inflation plus productivity
increases Guideline. Relative to 2002, 2003 saw a significant deterioration in the shortfall
from the Guideline target. This undoubtedly reflects the difficult economic and political
environment in which the 2003 bargaining round took place. Taking the four collective
bargaining rounds together, the shortfall from the Guideline is minus (-) 1.4 percentage
points.
TABLE 6
Meeting the Guidelines : 2000-2003 Inclusive (n = 14)
Year
(1)
Annual
Increase in
Inflation
(%)
(2)
Annual
Increase in
National
Productivity
(%)
(3)
Annual
Increase in
Inflation
Plus
Productivity
(%)
(4)
Bargained
Wage
Increase
(%)
(5)
Difference
Col (4)
Minus
Col (3)
2000
2001
2002
2003
+3.3
+3.1
+2.7
+2.8
+1.8
+2.3
+1.3
+1.7
+5.1
+5.4
+4.0
+4.5
+4.1
+3.3
+3.1
+2.9
-1.0
-2.1
-0.9
-1.6
Average +3.0 +1.8 +4.8 +3.4 -1.4

H:\My Documents\Projects\UNI-Europa Graphical\2009 web redesign\documents\Annual Collective
Bargaining Survey - 2003.doc
29
Table 4 shows that for six countries (Cyprus, Austria, Denmark, Germany, Italy and the UK)
2003 saw a trend in the reduction, in successive years, in the gap between the bargained wage
increases and Guideline target reversed. Over the last three wage bargaining rounds in Spain
and Finland, wage settlements have moved, in each successive year, closer towards achieving
the Guideline target. In the Netherlands, the trend has been the reverse, namely the size of
the gap has been increasing. In Norway, Sweden and Belgium, over the four year period, the
gap in successive years between bargained wage increases achieved and the Guideline target
has not only been narrowed but in 2003 was exceeded.
Table 6 shows that taking the period 2000-2003 inclusive, the average bargained wage
increase (+3.4%) achieved for graphical workers in Europe through national level bargaining,
exceeded the average annual increase in inflation by +0.4%. The real purchasing power of
graphical workers has, on average, been maintained. In the 2003 bargaining round in six
countries graphical workers received annual pay increases greater than the rate of increases in
inflation. In the four year period, this is the lowest number of affiliates to achieve this. The
corresponding figures for 2002 were nine, for 2001 11 and 2000 eight.
Conclusions
The 2003 collective bargaining round took place in a difficult economic and political
environment. This has been reflected in the bargaining outcomes for the year in that:
The average level of bargained wage increase was the lowest achieved in any of the
last four years.
Relative to previous years the lowest number of affiliates achieved a bargained wage
increase in excess of the annual average increase in inflation

H:\My Documents\Projects\UNI-Europa Graphical\2009 web redesign\documents\Annual Collective
Bargaining Survey - 2003.doc
30
Relative to previous bargaining rounds, the number of affiliates obtaining changes to
the qualitative aspects of their collective agreements was lower than 2001 but the
same number as for 2002.
The number of affiliates, relative to previous years, negotiating qualitative changes to
their agreements such that when a financial estimate is made of the costs of these to
employers they at least equal, if not exceed, the gap between the bargained wage
increase and the sum of inflation plus national productivity increases, was the lowest.
The gap between the bargained wage achieved and the Guideline was almost double
that for 2002.
In six countries the trend in three successive years, towards narrowing the gap
between the bargained wage increase and the Guideline target was reversed.
The year, however, also witnessed some important achievement. The highest number ever of
affiliates succeeded in negotiating bargained wage increases in excess of the sum of inflation
increases plus productivity increases. Taking the last four collective bargaining rounds in
total the average bargained wage increase exceeds the average annual increase in inflation by
0.4 per cent. The real purchasing power of graphical worker over the last four years has thus
been maintained. Wage increases that equal inflation rises can be seen as an absolute ‘floor’
under which wage advancements should not fall.
The assessment of progress towards meeting the Guideline of pay increases, at least equal, to
the sum of average annual increases in inflation plus national productivity should not be seen
as a test where there are winners and losers/those above or below the Guideline. It has
always to be borne in mind that the co-ordinated collective bargaining policy is based around
a Guideline, not a mathematical formula. The Guideline must be seen as a step in a process

H:\My Documents\Projects\UNI-Europa Graphical\2009 web redesign\documents\Annual Collective
Bargaining Survey - 2003.doc
31
in which affiliates discuss with each other the issues relevant to collective bargaining.
Affiliates should use the Guideline as a framework in which to explain to each other why
their wage demands/settlements deviate from the sum of inflation and productivity.