Annual business plan Town of Walkerville 2012-2013 2012 2013.pdf · Annual business plan Town of...
32
Adopted Council Meeting 16 July 2012 Page 1 of 32 Annual business plan Town of Walkerville 2012-2013
Transcript of Annual business plan Town of Walkerville 2012-2013 2012 2013.pdf · Annual business plan Town of...

Adopted Council Meeting 16 July 2012
Page 1 of 32
Annual business plan Town of Walkerville
2012-2013

Adopted Council Meeting 16 July 2012
Page 2 of 32
CONTENTS PAGE
MESSAGE FROM THE CHIEF EXECUTIVE OFFICER.............................. 3
PREAMBLE ................................................................................................. 4
PROFILE ………………………………………………………………………… 5
FRAMEWORK …………………………………………………………………… 6
LIVING IN THE TOWN OF WALKERVILLE: A STRATEGIC PLAN .......... 6
SUMMARY OF OBJECTIVES ..................................................................... 8
ACHIEVING THE OBJECTIVES ................................................................. 8
COUNCIL’S PLANS FOR 2012-2013 .........................................................10
FUNDING THE PLAN .................................................................................12
RATING POLICY ........................................................................................15
RATES CONCESSIONS ............................................................................19
BUDGETED FINANCIAL STATEMENTS 2012-2013 ........................... 22-27
FINANCIAL INDICATORS ..........................................................................28
FINANCIAL INDICATORS ANALYSIS .......................................................31
Front cover: Concept illustration for the Civic Centre entrance by JPE Design Studio

Adopted Council Meeting 16 July 2012
Page 3 of 32
A MESSAGE FROM THE CHIEF EXECUTIVE OFFICER Every year, Council must decide on the level of services it can provide and how much those services will cost its ratepayers The Town of Walkerville is now seeking your views on the projects, services and programs proposed by Council for the 2012-13 financial year. This Annual Business Plan and budget 2012-2013 was endorsed for public consultation by Council on 5 June 2012 and is open for community feedback until 3 July 2012. Council will consider every submission received from residents before it adopts the plan. Once adopted, the projects, services and programs outlined in the plan are incorporated into the capital works and department plans to be delivered in the ensuing financial year. The endorsed plan and budget is available from the Council’s administration office and the website. A summary of the plan will be included with the ratepayers first rate notice and available from the Council. Council will keep residents up-to-date of progress made throughout the year via published material such as quarterly newsletters, website, social media and print media.
Kiki Magro
Chief Executive Officer

Adopted Council Meeting 16 July 2012
Page 4 of 32
PREAMBLE
Under section 123 of the Local Government Act 1999, all Councils have a budget for each financial year. The budget must be consistent with the Council’s Annual business plan and must be adopted before 31st August of the financial year. The Annual business plan is prepared as part of Council’s budget development process and must include:
a summary of Council’s long-term objectives as outlined in its strategic framework
a summary of Council’s objectives for the financial year
an outline of how Council plans to achieve those objectives
the measures (financial and non‐financial) to assess Council’s performance in achieving its
objectives.
The Annual business plan will also:
assess the financial requirements for the financial year and, taking those requirements into account, set out a summary of its proposed operating expenditure, capital expenditure and sources of revenue
set out the rates structure and policies for the financial year
assess the impact of the rates structure and policies on the community based on modelling that has been undertaken or obtained by the Council, and
take into account the Council's long‐term financial plan and relevant issues relating to the
management and development of infrastructure and major assets by the Council. The Annual business plan also includes the annual budget which details operating expenditure (day to day recurrent operations and services) and capital expenditure (renewal and acquisition) as well as identifying sources of revenue and rates for the year. This document has been developed in conjunction with Council’s overall strategic planning framework including: A connected community: The Town of Walkerville urban master plan, Living in the Town of Walkerville: a strategic plan for the Town of Walkerville, Long-term financial plan (LTFP) for the period 2012-2022 and the draft Asset management plans.

Adopted Council Meeting 16 July 2012
Page 5 of 32
PROFILE OF THE TOWN OF WALKERVILLE
The Town of Walkerville was proclaimed in July 1855, making it one of the oldest municipalities in South Australia The Town of Walkerville is located at the north eastern fringe of the Adelaide CBD. Its borders are defined by the River Torrens, the Adelaide Parklands and residential suburbs to the north and north-east.
Consisting of the suburbs of Medindie, Gilberton, Walkerville and Vale Park, the Town of Walkerville has the distinctive position of being the smallest council within the metropolitan area of Adelaide, covering an area of just 3.5 square kilometres.
The relatively small size of the Town of Walkerville and its population, reinforces the need to embrace this unique community scale and provide an adaptive and responsive strategic direction that reflects the needs and aspirations of the community as a whole. With a population of slightly more than 7000 people, the cultural richness in the community presents an exciting opportunity for the next chapter in Walkerville’s history, building upon the contribution by community and leaders in Walkerville since its proclamation in July 1855.

Adopted Council Meeting 16 July 2012
Page 6 of 32
STRATEGIC FRAMEWORK
LIVING IN THE TOWN OF WALKERVILLE: A STRATEGIC PLAN
Living in the Town of Walkerville offers a vision and direction for the future and was adopted by Council in March 2012 following extensive community consultation. Council is guided by the vision outlined in the plan: We live and share a connection to nature and community. We believe in fostering a lively and diverse culture and celebrating our history and identity. We are about creating a forward thinking, economically successful and environmentally responsible society. We are adaptive and responsive to current and future generations. The plan is focused on three central goals:
a lively, local culture
an economically successful community
sensitive environments and development.
Strategic plan
Long term financial plan Asset management plans
ANNUAL BUSINESS PLAN
OHS&W plan Department plans
ANNUAL BUDGET
Disaster recovery plan Business continuity plan
Urban master plan

Adopted Council Meeting 16 July 2012
Page 7 of 32
Each goal is supported by a series of objectives:
Community involvement: encourage active community involvement in events, activities and places.
Diverse culture: promote and support diverse cultural values, heritage and identity.
Active centre: create an active, well-connected Town Centre.
Mixed-use development: identify and develop mixed use opportunities along Main North Road and North East Road.
Linear Park: create a safe, well planned and bio-diverse Linear Park that allows for recreation along the river.
Sensitive development: development in balance with the natural environment.
Connections: create accessible, useable and connected open spaces and streets.
Living in the Town of Walkerville also shares connections with South Australia’s strategic plan and
the Australian Government’s National urban policy.
Photographer: Simon Cassson

Adopted Council Meeting 16 July 2012
Page 8 of 32
0
1
2
3
4
5
6
7
Rates Stat Chgs User Chgs Grants Other
SUMMARY OF OBJECTIVES The key objective of Council’s long term financial plan is to:
maintain financial sustainability while still achieving the objectives of Council’s overall strategic planning framework
ensure that services and infrastructure is delivered without unplanned increases for ratepayers or affecting services
ensure that decisions are made within the context of Council’s overall strategic framework including: A connected community: The Town of Walkerville urban master plan, Living in the Town of Walkerville: a strategic plan for the Town of Walkerville, Long-term financial plan (LTFP) for the period 2012-2022 and the draft Asset management plans
HOW COUNCIL PLANS TO ACHIEVE THESE OBJECTIVES To achieve its objectives for the financial year Council has adopted a strategy that seeks to achieve a reasonable degree of stability and predictability in the overall rates burden over time, while ensuring ratepayers are paying for the services and infrastructure maintenance, renewal and development obligations they are consuming. Long term financial plans enable Council to plan for the future and assess Council’s performance in adhering to key financial indicators and targets for debt, rates and asset sustainability. Council aims to deliver a budget in accordance with the Long term financial plan. This provides optimal conditions to ensure financial viability over the long term. The budget provides the appropriate level of services, meets capital asset renewal and upgrade targets and ensures an equitable distribution of the rate burden. Taking into account revenue sources and factors affecting rates assist Council to achieve its objectives. Council’s primary revenue source comes from property rates, which represent 83% of total revenue. Every year, Council makes an informed assessment of how much it needs to maintain financial sustainability and ensure that services and infrastructure maintenance, renewal and development, can be afforded by the community over the long term.
Revenue sources:

Adopted Council Meeting 16 July 2012
Page 9 of 32
Factors affecting rates:
the Consumer Price Index All Groups Adelaide increase on goods and services for the 12 months ending 31 March 2012, 1.8%
the Local Government Price Index (LGPI) provides Councils with a useful reference regarding the inflationary effect of price changes of goods and services consumed by Local Government, for the 12 months ending 31 March 2012, 4.2%
staff wages increases as a result negotiated Employment Agreements, and staff moving through level increments
increase in the waste collection and disposal charges of approximately 9.5%, from Council’s regional subsidiary, East Waste
Highbury Landfill Authority annual operating contribution and forecast post-closure liability
asset management considerations such as maintaining and renewing assets to the level that meets the community’s expectations and funding depreciation.

Adopted Council Meeting 16 July 2012
Page 10 of 32
COUNCIL’S PLANS FOR 2012-2013 SPECIAL AND CAPITAL PROJECTS Strategic plan initiatives $55,000
As part of an ongoing work emerging from the strategic plan a series of activation strategies were identified within Council’s urban master plan, and validated by Place making strategic planning workshop attended by elected members. The areas of activation come under three focal points: business,/arts & culture/environment and development. IT Software/ Hardware upgrades ongoing $12,000
An allowance has been made for the upgrade of Council’s IT Disaster Recovery project. Vehicle replacement $180,000
The Council has a rolling programme of vehicle upgrades to ensure optimum efficiency and minimise change over costs by changing vehicles at a time to maximise trade-in value of the current vehicle. Scheduled for change over this year is the backhoe and ride on mower per the Plant replacement program.
Civic Centre upgrade $5,500,000
Council funded an upgrade of the existing Administration and Civic Centre, including the Library up to $9.5million to ensure the work environment meets with all current standards and legislation. Initial concept design work and an environmental assessment have been undertaken and the project endorsed by Council to the prudential review stage. Design and scoping works began in 2011/2012 financial year and the construction phase to commence in 2012/13 financial year. Council has endorsed funding for this project through facilities with the Local Government Financial Authority. Community events $45,000
Council conducts or facilitates a number of community events which includes, but is not limited to: Australia Day Citizenship. including Citizen of the Year, Carols by Candlelight; Volunteer of the Year and social programs for the elderly.

Adopted Council Meeting 16 July 2012
Page 11 of 32
CAPITAL WORKS Roadways, Surface kerb & pavement, Surface Various $ 743,747
Surface renewal treatments will be applied to Clarke, Exmouth, St Andrews, Wilsden, Wallace, Yandara and York Streets. Kerb Various $187,200
Kerb renewal works will be undertaken along, Washington and Doreen Streets. Council aims to renew kerbing ahead of planned surface and pavement works. Footpath construction program Various $124,000
As in previous years the program of footpath construction and upgrade will continue. In preparing the renewal program the following has been taken into account; condition of the path, existing construction standards, pedestrian volume and amenity value of constructed works. Stormwater Various $140,000
Council has engaged consulting firm Tonkins Engineering to assess its stormwater system and develop a program of renewal and upgrade. The renewal program for the next few years centres on the installation of a system to service Hay Lane (Stage 2). Parks & gardens Various $420,000
Following an assessment of Council’s parks, ovals and reserve assets a program of renewal and upgrade has been established. Key projects to be undertaken during this financial year include: Replacement of Lower Gilbert and St Andrews St boardwalks, Gilberton Low Level Bridge - concept design for new high level bridge, Gilberton Swing Bridge - detail design to meet standards in readiness for any co-funding opportunities and Willow Bend Reserve - new shelter adjacent tennis courts.

Adopted Council Meeting 16 July 2012
Page 12 of 32
FUNDING THE PLAN
Council is granted the power to acquire funds under Section 133 of the Local Government Act 1999. Sources of funds include: property rates, grants, statutory charges, user charges, income from investments, reimbursements and commercial activity, details of which are shown below. Each year, the Council aims to set a balanced budget, whereby revenues raised are equal, or slightly exceed estimated expenses, including depreciation. The depreciation amount (a non-cash expense allowed for the consumption of long-life assets) is then set aside to fund the capital works program. Where the capital works program budget exceeds the depreciation amount, alternate source of funds is required. Council acknowledges that the projected operating revenue will be insufficient to meet projected operating expenditure to the extent of a $956k (operating deficit). This shortfall will be funded from cash reserves. Council is of the opinion that this does not will not adversely impact on Council’s ability to operate or on its long term sustainability. The projected deficit is due in part to the increase in depreciation associated with Council’s adoption of the revaluation of its stormwater assets in the 2010/11 financial statements. Operational expenditure is impacted by CPI/Local Government Price Index together with salary and wages costs which are adjusted annually in accordance with enterprise agreements, performance reviews, and incremental increases. Depreciation is adjusted subsequent to additions, disposals and revaluations when appropriate. Operational (recurrent) expenditure by activity:
Total Recurrent Operating Expenditure $ 8.521 million
Corporate Services
Customer Service & IT
Community Services
Public Order Library (Including SWAP)
Planning & Building
Sport, Rec & Parks
Infrastructure
Environment & Waste
Works Depot
CEO - Governance

Adopted Council Meeting 16 July 2012
Page 13 of 32
Operating revenue by category (other than rates) and sources:
Total recurrent operating revenue $ 7.565 million Fees and Charges Council sets and reviews its fees and charges pursuant to Section 188 of the Local Government Act 1999, that states fees or charges must not exceed a reasonable estimate of the direct cost to the Council. Fees and charges are taken into account when developing the budget.
Stat Chgs
GrantsInvest
Re-imb
OtherUser Chgs
Revenue source Budget Statutory charges - dog/animal mgmnt $ 29,700 - build/planning fees $148,500 - parking/impound $ 35,150 User Charges - Levi Park $445,975 - child care $ 13,600 - library $ 7,700 - sports/ rec $ 15,800 - sundry $ 4,863 Grants - grants commission $145,000 - library grants $ 52,050 Investments -LGFA cash investment $ 75,000 - community loans $ 13,000 Re-imbursements - legal $ 5,000 - build/plan $ 4,160 - sport/rec $ 1,500 - impound $ 350 Other - OHS&W Rebate $20,000
- NRM levy rebate $ 2,845
- cemetery fees $ 4,600
- library/ arts $ 760
- plan/building $128,500
Adopted Council Meeting 16 July 2012
Page 14 of 32
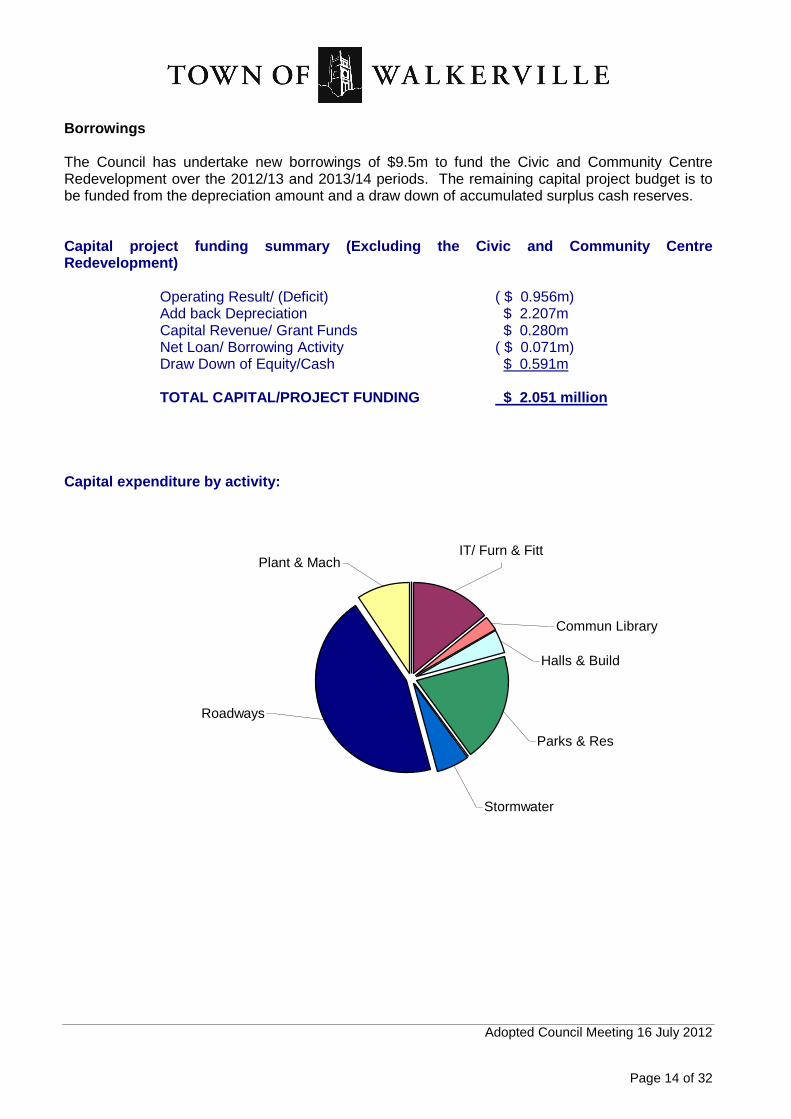
Borrowings The Council has undertake new borrowings of $9.5m to fund the Civic and Community Centre Redevelopment over the 2012/13 and 2013/14 periods. The remaining capital project budget is to be funded from the depreciation amount and a draw down of accumulated surplus cash reserves. Capital project funding summary (Excluding the Civic and Community Centre Redevelopment)
Operating Result/ (Deficit) ( $ 0.956m) Add back Depreciation $ 2.207m Capital Revenue/ Grant Funds $ 0.280m Net Loan/ Borrowing Activity ( $ 0.071m) Draw Down of Equity/Cash $ 0.591m TOTAL CAPITAL/PROJECT FUNDING $ 2.051 million
Capital expenditure by activity:
Roadways
Stormwater
Parks & Res
Halls & Build
Commun Library
IT/ Furn & FittPlant & Mach

Adopted Council Meeting 16 July 2012
Page 15 of 32
RATING POLICY In setting Council’s rates for the 2012-2013 financial year, the Council has considered the following:
Achieving the goals and objectives outlined in Living in the Town of Walkerville – the strategic plan adopted by Council in 2012. This document outlines Council’s vision and direction for the future.
The budget for the 2012-13 financial year and any longer term financial planning.
The financial implications of complying with the requirements of the Local Government Act 1999 and other legislations.
The specific issues faced by our community, including:
the ongoing requirements for a capital program to replace, upgrade and maintain infrastructure assets which include roads, paths, storm water infrastructure, parks & reserves and public buildings
the development of a community service program based on community needs
the current economic climate.
Method used to value land All land within the Council area, except for land specifically exempt (eg Crown land and land owned by Council), is rateable. This Council has decided to continue to use capital value as the basis for valuing land within the Council area. Council considers that this method of valuing provides the fairest method of distributing the rate burden across all ratepayers, as property value is representative of the property owners’ wealth. Council has adopted the most recent valuations made by the Valuer-General. Capital values across Council’s area have decreased on average by 2.1% from the previous year. Objection to valuation A property owner may object to the valuation referred to in their rates notice by writing to the Valuer-General within 60 days after the date of service of the rate notice. Objections are to be forwarded to: The State Valuation Office, 101 Grenfell Street, Adelaide SA 5000. Phone: 1300 653 345 or email: [email protected]. Council has no role in this process. NOTE that the lodgement of an objection does not change the due date for payment. General rates The Local Government Act 1999 provides for a Council to raise revenue for the broad purposes of the Council through a general rate which applies to all rateable property within the Council’s area. To ensure the achievement of Council’s financial goal of delivering an achievable budget Council has determined to raise $6,203,335 in property rates for the 2012-2013 financial year, which represents an overall increase of 6.7% (including growth) from the previous year.

Adopted Council Meeting 16 July 2012
Page 16 of 32
TOTAL PROPERTY RATES 2012-2013: $6,203,335 Projected total rates revenue as per LTFP:
0
1
2
3
4
5
6
7
8
9
2008 2009 2010 2011 2012 2013 2014 2015 2016 2017 2018
This increase is deemed necessary to cover the increase in operating costs, represented by CPI (1.8% Mar 2012 Quarter) and the Local Government Price Index (LGPI) (4.2% Mar 2012 Quarter) and to provide for the capital works program. The LGPI provides Council with a useful reference regarding the inflationary effect of price changes of goods and services consumed by Local Government. The index reflects, over time, the movement in prices for a number of cost components as well as the aggregate spent on these components. The index includes both operating and capital expenditure on a State average basis. Components of rate revenue increase:
CPI/LGPI 3.00% Increase 2.45% Growth 1.25% Total increase 6.70%
The impact on the differential rate and minimum rate are shown below. Differential rate Due to the need to ensure an equitable distribution of the rate burden and to account for the variations within the community’s capacity to pay, the Council will to continue to apply differential rates based on the locality in which the rateable property is situated and the use to which the property is put:
Proposed changes to differential rate
Type Year
2010/11 2011/12 2012/13
Residential 0.002135 0.002108 0.002293
Non-Residential 0.003311 0.003278 0.003553

Adopted Council Meeting 16 July 2012
Page 17 of 32
Minimum rate Council has also determined to again charge a minimum rate against all rateable properties. The reason for a minimum rate is that Council considers it appropriate that all rateable properties make a contribution to the cost of administering the Council’s activities and maintaining infrastructure. MINIMUM RATE 2012-13: $970 The minimum rate is levied against the whole of an allotment (including land under separate lease or licence) and only one minimum rate is levied against two or more pieces of adjoining land owned and occupied by the same ratepayer. The minimum rate will affect approximately 24% of properties. (Maximum permitted under Sec. 158(d) of the LGA 1999 is 35 %.) Movement in rate revenue:
2010/11 2011/12 2012/13
Variance (this Yr)
Total rates revenue $ 5,458,976 $ 5,813,885 $ 6,203,335 6.70%
Residential rates $ 4,786,196 $ 5,071,459 $ 5,357,134 5.63%
Non-residential (res) $ 672,780 $ 742,426 $ 846,219 13.98%
Average res. rate $ 1,499 $ 1,580 $ 1,665 5.38%
Minimum rate $ 875 $ 920 $ 970 5.43%
Objection to land use classification If a ratepayer believes that a particular property has been wrongly classified as to its land use, then the ratepayer may object to that land use within 60 days of being notified. The objection must set out the basis for the objection and details of the land use that should be attributed to that property. The Council may then decide on the objection as it sees fit and notify the ratepayer accordingly. A ratepayer has the right to appeal against the Council’s decision to the Land and Valuation Court. Objections to Council’s land use classification may be lodged with the Chief Executive Officer, Corporation of the Town of Walkerville. NOTE that the lodgement of an objection does not change the due date for payment. Payment of rates The Council has determined that the payment of all rates can be either by full payment – due and payable by the 17th September 2012 or by quarterly instalments due and payable on the following dates:
1st Payment 17th September 2012 2nd Payment 17th December 2012 3rd Payment 17th March 2013 4th Payment 17th June 2013

Adopted Council Meeting 16 July 2012
Page 18 of 32
Rates may be paid by:
Bpay Service (you need to register with your Bank, Credit Union or Building Society, if you have not already done so, to use this service)
Telephone 1300 303 201 using MasterCard or Visa Card
Internet through Council’s website using MasterCard or Visa Card
In person at the Council Offices (66 Walkerville Terrace, Gilberton SA 5081) during office hours of 9.00am to 5.00pm, Monday to Friday (excluding public holidays)
o Cheque, money order, cash, EFTPOS, MasterCard or Visa Card facilities are available for payments (American Express and Diners Club cards are not acceptable)
Post addressed to the Corporation of the Town of Walkerville, PO Box 55, Walkerville SA 5081
The table below shows a comparison of rates on properties, with an average value of $750,000, across Council’s in the eastern region.
$0
$500
$1,000
$1,500
$2,000
$2,500
$3,000
Walkerville Prospect Burnside NPStP TTG Campbelltown

Adopted Council Meeting 16 July 2012
Page 19 of 32
RATES CONCESSIONS
Rate concessions The State Government, in providing equity across SA in this area, funds a range of concessions on Council rates. The concessions are administered by various State Agencies who determine eligibility and pay the concession directly to Council on behalf of the ratepayer. Concessions are only available on the principal place of residence. Ratepayers who believe they are entitled to a concession should not withhold payment of rates pending assessment of an application by the State Government as penalties apply to overdue rates. A refund will be paid to an eligible person if Council is advised that a concession applies and the rates have already been paid. State seniors card ratepayer (Self-funded retiree) This concession is administered by RevenueSA. If you are a self-funded retiree and currently hold a State Seniors Card you may be eligible for a concession towards Council rates. In the case of couples, both must qualify, or if only one holds a State Seniors Card, the other must not be in paid employment for more than 20 hours per week. If you have not received a concession on your rates notice or would like further information please contact the RevenueSA call centre on 1300 366 150. Pensioner concession An eligible pensioner holding a current Pensioner Concession Card or Department of Veterans’ Affairs (DVA) Gold Card (TPI, EDA, WW) may be entitled to a concession on Council rates (and water and effluent charges where applicable). Application forms, which include information on the concessions, are available from the Council, SA Water Corporation and its District Offices or the Department of Human Services and further information can be obtained by telephoning SA Water. Other concessions The Department for Communities and Social Inclusion (DCSI) administers Council rate concessions available to a range of eligible persons receiving State and Commonwealth allowances. This includes, but is not limited to, ratepayers who are in receipt of: Austudy, Newstart, Parenting Payment, Partner Allowance, Sickness Allowance, Special Benefit, Widow Allowance, Youth Allowance, Abstudy, CDEP or a New Enterprise Initiative Scheme. It may also apply to ratepayers in receipt of a pension as a war widow under legislation of the United Kingdom or New Zealand and the holders of a State Concession Card issued by DFC. All enquiries should be directed to your nearest Families SA District Centre by phoning the Concessions Hotline on 1800 307 758.
Natural resources management levy Council collects a regional Natural Resources Management (NRM) Levy on behalf of the Adelaide and Mount Lofty Ranges NRM Board. The NRM Board expends this levy in managing and protecting priority water, land, marine and biodiversity assets. Council has no influence over how the Board allocates its funds. To raise Council’s levied contribution of $219,845 (2012: $213,203) as per State Government Legislation, Council has determined that a separate rate of 0.000092 (2012: 0.000085) in the dollar be levied against all rateable properties within Council’s area. For general NRM levy enquiries please call the NRM Board on 8273 9100.

Adopted Council Meeting 16 July 2012
Page 20 of 32
Late payment of rates The Local Government Act provides that a Council may impose a penalty of 2.0% on any payment for rates, whether by instalment or otherwise, that is received late. A payment that continues to be late is then charged a prescribed interest rate for each month it continues to be late. This rate for 2012-13 will be calculated using the Cash Advance Debenture Rate, plus an amount notified in July, divided by twelve. When rates are unpaid by the due date, Council issues a Final Notice for payment of the rates. Should rates still remain unpaid after the issue of the Final Notice then Council refers the debt to a debt collection agency for collection. The debt collection agency charges collection fees to the ratepayer. When Council receives a payment in respect of overdue rates the Council applies the money received as follows:
1st - satisfy any costs awarded in connection with court proceedings 2nd - to satisfy any interest costs 3rd - in payment of any fines imposed 4th - in payment of rates, in chronological order (starting from the oldest account first). Postponement of rates – Seniors Ratepayers who hold a State Seniors Card (or who are eligible to hold a State Seniors Card and have applied for one) are able to apply to Council to postpone payment of rates on their principal place of residence. Postponed rates remain as a charge on the land and are not required to be repaid until the property is sold or disposed of. Any ratepayer who may experience difficulty in meeting their standard rates payment is invited to contact Council’s Rates Officer to discuss alternative payment arrangements. Remission and postponement of rates due to hardship The Local Government Act permits a Council, on the application of the ratepayer, to partially or wholly remit rates on the basis of hardship. Where a ratepayer is suffering hardship in paying rates they can contact the Rates Officer to discuss the matter. Such enquiries are treated confidentially by Council. While arrangements for extended payments of rates are negotiable, remission of rates in whole or in part is rarely approved due to the inequitable situation for the rest of the community.
Statutory rebate of rates The Local Government Act requires Council to rebate the rates payable on some land including; 100% on land used solely for religious purposes; a minimum of 75% for land used predominantly for educational purposes (subject to some qualifications) and a minimum of 75% on land used for the provision of supported accommodation. Discretionary rebates A Council may grant a rebate of rates or services charges in certain circumstances, as per section 166 of the Local Government Act 1999. The Council has an absolute discretion to:
grant a rebate of rates or service charges as per the Local Government Act 1999
determine the amount of any such rebate. Persons or bodies which seek a discretionary rebate will be required to submit an application form to the Council and provide to the Council such information as stipulated on the application form as well as any other information that the Council may reasonably require.

Adopted Council Meeting 16 July 2012
Page 21 of 32
Sale of land for non-payment of rates The Local Government Act provides that a Council may sell any property where the rates have been in arrears for three years or more. The Council is required to provide the owner with details of the outstanding amounts and advise the owner of its intention to sell the land if payment of the outstanding amount is not received within one month. Disclaimer: A rate cannot be challenged on the basis of non-compliance with this policy and must be paid in accordance with the required payment provisions. Where a ratepayer believes that the Council has failed to properly apply this policy they should raise the matter with the Rates Officer. What do you get for your Rates?
Infrastructure
Roads Gutters Footpaths Ovals Parks Gardens Playgrounds Buildings Stormwater Street lighting
Services
Health Immunisation Inspections
Planning zoning
Building Library Transport Waste
Collection Disposal Management
Compliance
Parking Traffic Dogs Pest control Food premises Public order Planning Building Fire prevention Neighbourhood amenity

Adopted Council Meeting 16 July 2012
Page 22 of 32
BUDGETED FINANCIAL STATEMENTS 2012-2013 (overleaf)
Photographer Simon Casson
Adopted Council Meeting 16 July 2012
Page 23 of 32
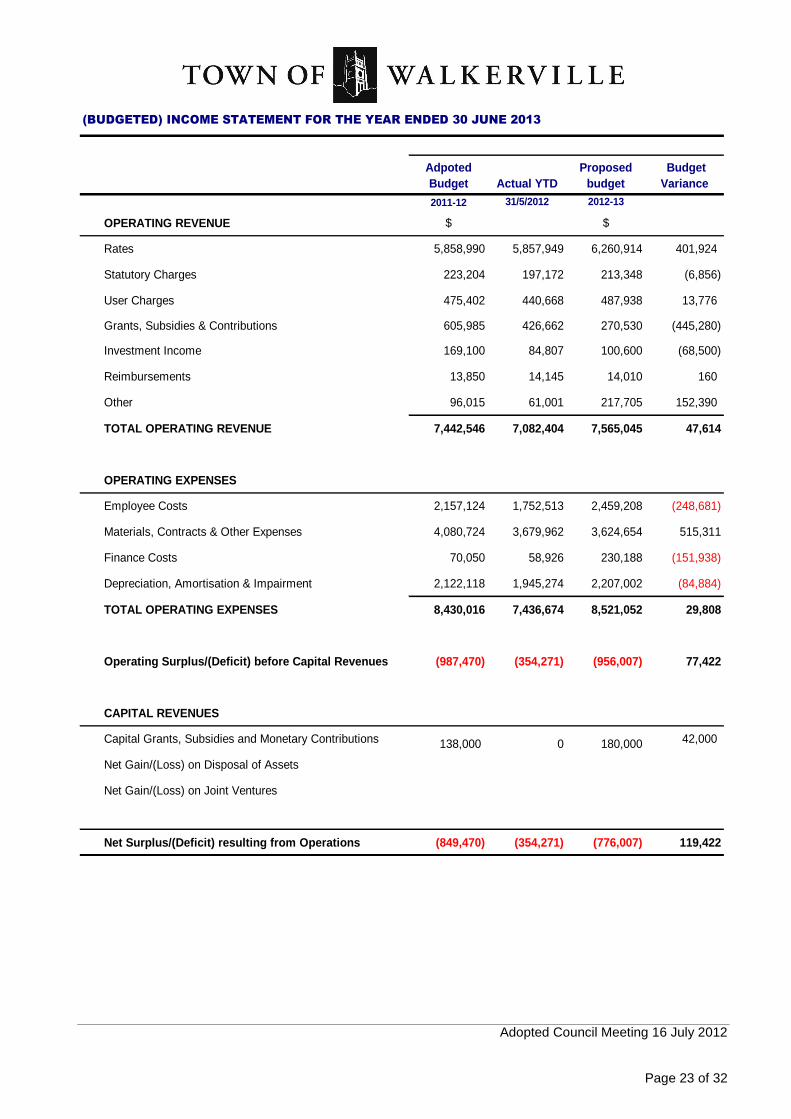
(BUDGETED) INCOME STATEMENT FOR THE YEAR ENDED 30 JUNE 2013
Reviewed as at 31 January 2012
Adpoted
Budget Actual YTD
Proposed
budget
Budget
Variance
2011-12 31/5/2012 2012-13
OPERATING REVENUE $ $
Rates 5,858,990 5,857,949 6,260,914 401,924
Statutory Charges 223,204 197,172 213,348 (6,856)
User Charges 475,402 440,668 487,938 13,776
Grants, Subsidies & Contributions 605,985 426,662 270,530 (445,280)
Investment Income 169,100 84,807 100,600 (68,500)
Reimbursements 13,850 14,145 14,010 160
Other 96,015 61,001 217,705 152,390
TOTAL OPERATING REVENUE 7,442,546 7,082,404 7,565,045 47,614
OPERATING EXPENSES
Employee Costs 2,157,124 1,752,513 2,459,208 (248,681)
Materials, Contracts & Other Expenses 4,080,724 3,679,962 3,624,654 515,311
Finance Costs 70,050 58,926 230,188 (151,938)
Depreciation, Amortisation & Impairment 2,122,118 1,945,274 2,207,002 (84,884)
TOTAL OPERATING EXPENSES 8,430,016 7,436,674 8,521,052 29,808
Operating Surplus/(Deficit) before Capital Revenues (987,470) (354,271) (956,007) 77,422
CAPITAL REVENUES
Capital Grants, Subsidies and Monetary Contributions 138,000 0 180,000 42,000
Net Gain/(Loss) on Disposal of Assets
Net Gain/(Loss) on Joint Ventures
Net Surplus/(Deficit) resulting from Operations (849,470) (354,271) (776,007) 119,422

Adopted Council Meeting 16 July 2012
Page 24 of 32
(BUDGETED) BALANCE SHEET AS AT 30 JUNE 2013
Reviewed as at 31 January 2012
Adpoted
Budget Actual YTD
Proposed
budget
2011-12 31/5/2012 2012-13
CURRENT ASSETS $ $ $
Cash & Cash Equivalents 822,070 1,604,485 230,409
Trade & Other Receivables 322,249 167,274 574,202
Financial Assets (Comm Loans) 20,189 20,189 20,189
Prepayments 11,335 11,335 11,788
Inventory 6,039 6,039 6,039
TOTAL CURRENT ASSETS 1,181,882 1,809,322 842,627
NON-CURRENT ASSETS
Financial Assets (Comm Loans) 185,863 185,863 176,570
Equity Accounted Investments in Council Business 81,951 81,951 58,608
Infrastructure, Property, Plant & Equipment 131,345,327 129,759,608 130,671,648
Less Accumulated Depreciation (31,863,604) (31,871,696) (32,037,338)
Other Non-Current Assets 119,640 - 5,587,053
TOTAL NON-CURRENT ASSETS 99,869,177 98,155,726 104,456,541
TOTAL ASSETS 101,051,059 99,965,048 105,299,168
CURRENT LIABILITIES
Trade & Other Payables 249,487 159,788 159,788
Short-Term Provisions 304,916 304,916 337,693
Borrowings 152,165 152,165 221,361
TOTAL CURRENT LIABILITIES 706,568 616,869 718,842
NON-CURRENT LIABILITIES
Long-Term Provisions 20,578 20,578 27,057
Borrowings 592,740 592,740 5,547,281
Other Non-Current Liabilities 457,299 457,299 508,121
TOTAL NON-CURRENT LIABILITIES 1,070,617 1,070,617 6,082,459
TOTAL LIABILITIES 1,777,185 1,687,486 6,801,301
NET ASSETS 99,273,874 98,277,562 98,497,867
EQUITY
Accumulated Surplus 33,854,582 32,858,270 33,078,575
Asset Revaluation Reserve 65,405,242 65,405,242 65,405,242
Other Reserves 14,050 14,050 14,050
TOTAL EQUITY 99,273,874 98,277,562 98,497,867

Adopted Council Meeting 16 July 2012
Page 25 of 32
B
(BUDGETED) STATEMENT OF CHANGES IN EQUITY FOR THE YEAR ENDED 30 JUNE 2013
Reviewed as at 31 January 2012
Adpoted
Budget Actual YTD
Proposed
budget
Budget
Variance
2011-12 31/5/2012 2012-13
$ $ $ $
ACCUMULATED SURPLUS
Balance at beginning of period 34,704,052 33,212,541 33,854,582
Net Surplus/(Deficit) (849,470) (354,271) (776,007)
Transfers to reserves - -
Transfers from reserves 0
Balance at end of period 33,854,582 32,858,270 33,078,575
ASSET REVALUATION RESERVE
Balance at beginning of period 65,405,242 65,405,242 65,405,242
Transfers to reserve - Revaluation increment -
Transfers from reserve - -
Gain on revaluation of infrastructure - -
Balance at end of period 65,405,242 65,405,242 65,405,242
OTHER RESERVES
Balance at beginning of period 14,050 14,050 14,050
Transfers to reserve - - -
Transfers from reserve 0
Balance at end of period 14,050 14,050 14,050
TOTAL EQUITY 99,273,874 98,277,562 98,497,867
ALANCE SHEET
STATEMENT OF CHANGES IN EQUITY

Adopted Council Meeting 16 July 2012
Page 26 of 32
(BUDGETED) STATEMENT OF CASH FLOWS FOR THE YEAR ENDED 30 JUNE 2013
Reviewed as at 31 January 2012
Adpoted
Budget YTD Actual
Proposed
Budget
Budget
Variance
2011-12 31/5/2012 2012-13
CASHFLOWS FROM OPERATING ACTIVITIES $ $ $ $
RECEIPTS
Rates - General 5,858,990 5,001,849 6,260,914 (401,924)
Statutory Charges 223,204 197,172 213,348 6,856
User Charges 475,402 440,668 487,938 (13,776)
Grants and Subsidies 605,985 426,662 270,530 445,280
Interest Received 169,100 84,807 100,600 68,500
Reimbursements 13,850 14,145 14,010 (160)
Other 96,015 61,001 217,705 (152,390)
TOTAL RECEIPTS 7,442,546 6,226,304 7,565,045 (47,614)
PAYMENTS
Wages and Salaries 2,157,124 1,752,513 2,459,208 (302,084)
Materials, Contracts & Other Expenses 4,080,724 3,679,962 3,624,654 456,070
Interest Payable 70,050 58,926 230,188 (160,138)
Other -
TOTAL PAYMENTS 6,307,898 5,491,400 6,314,050 (6,151)
NET CASH RECEIVED IN OPERATING ACTIVITIES 1,134,648 734,904 1,250,996 116,348
CASH FLOWS FROM FINANCING ACTIVITIES
RECEIPTS
Loans Received - - 5,500,000
PAYMENTS
Loan Principal Repayments (144,467) (144,467) (124,074)
NET CASH USED IN FINANCING ACTIVITIES (144,467) (144,467) 5,375,926
CASH FLOWS FROM INVESTMENT ACTIVITIES
RECEIPTS
Capital Grants and Subsidies 138,000 0 180,000 42,000
Repayments of loans by community groups 20,190 18,508 20,190 -
CONTRIBUTIONS -
Sale of Capital Assets 131,000 3,915 100,000 (31,000)
PAYMENTS -
Capital contributed to associated entities - - - -
Capital Expenditure - Replaced/Renewed (2,229,161) (986,471) (1,210,860) 1,060,145
Capital Expenditure - New Upgraded (263,000) (56,763) (6,307,913) (6,044,913)
NET CASH USED IN INVESTMENT ACTIVITIES (2,202,971) (1,020,812) (7,218,583) (4,973,768)
NET INCREASE (DECREASE) IN CASH HELD (1,212,790) (430,375) (591,661) 708,933
CASH AT BEGINNING OF REPORTING PERIOD 2,034,860 2,034,860 822,070 (1,212,790)
CASH AT END OF REPORTING PERIOD 822,070 1,604,485 230,409 (503,857)
Adopted Council Meeting 16 July 2012
Page 27 of 32
TEMENT OF CASHFLOW
(BUDGETED) UNIFORM PRESENTATION of FINANCES FOR THE YEAR ENDED 30 JUNE 2013
Reviewed as at 31 January 2012
Adpoted
Budget YTD Actual
Proposed
Budget
Budget
Variance
2011-12 31/05/2012 2012-13
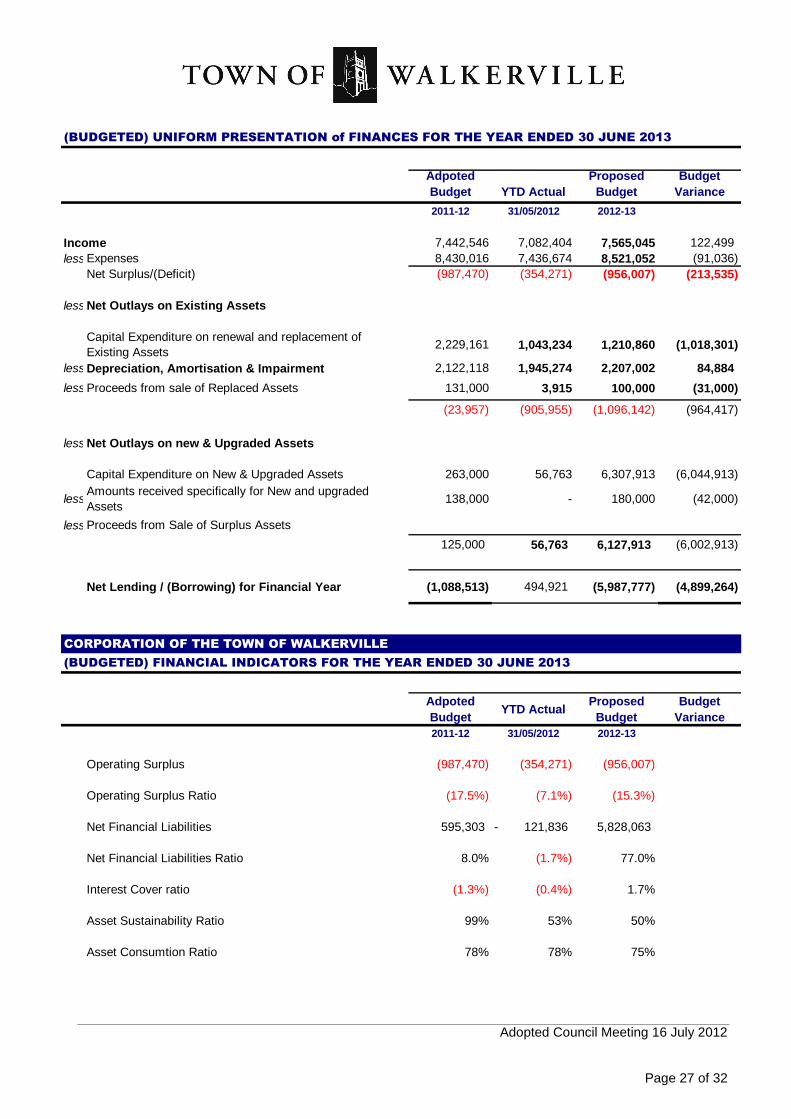
Income 7,442,546 7,082,404 7,565,045 122,499
less Expenses 8,430,016 7,436,674 8,521,052 (91,036)
Net Surplus/(Deficit) (987,470) (354,271) (956,007) (213,535)
less Net Outlays on Existing Assets
Capital Expenditure on renewal and replacement of
Existing Assets2,229,161 1,043,234 1,210,860 (1,018,301)
less Depreciation, Amortisation & Impairment 2,122,118 1,945,274 2,207,002 84,884
less Proceeds from sale of Replaced Assets 131,000 3,915 100,000 (31,000)
(23,957) (905,955) (1,096,142) (964,417)
less Net Outlays on new & Upgraded Assets
Capital Expenditure on New & Upgraded Assets 263,000 56,763 6,307,913 (6,044,913)
less Amounts received specifically for New and upgraded
Assets138,000 - 180,000 (42,000)
less Proceeds from Sale of Surplus Assets
125,000 56,763 6,127,913 (6,002,913)
Net Lending / (Borrowing) for Financial Year (1,088,513) 494,921 (5,987,777) (4,899,264)
CORPORATION OF THE TOWN OF WALKERVILLE
(BUDGETED) FINANCIAL INDICATORS FOR THE YEAR ENDED 30 JUNE 2013
Reviewed as at 31 January 2012
Adpoted
BudgetYTD Actual
Proposed
Budget
Budget
Variance
2011-12 31/05/2012 2012-13
Operating Surplus (987,470) (354,271) (956,007)
Operating Surplus Ratio (17.5%) (7.1%) (15.3%)
Net Financial Liabilities 595,303 121,836- 5,828,063
Net Financial Liabilities Ratio 8.0% (1.7%) 77.0%
Interest Cover ratio (1.3%) (0.4%) 1.7%
Asset Sustainability Ratio 99% 53% 50%
Asset Consumtion Ratio 78% 78% 75%

Adopted Council Meeting 16 July 2012
Page 28 of 32
FINANCIAL INDICATORS
Financial indicators are calculated and provided in accordance with Information Paper 9 – Local Government Financial Indicators prepared as part of the LGA Financial Sustainability Program for the Local Government Association of South Australia. They assist the reader to track Council’s financial management performance in identified critical areas. Council’s focus on its strategic directions in recent years aims to ensure Council creates and implements long term planning of its finances and asset management. This will also ensure it focuses on being financially sustainable. This focus on strategic directions and implementation of long term strategies will continue in 2012-2013 to ensure the implementation of previous strategies and to maintain Council’s focus on its organisational sustainability. More details are provided in the analysis pages following the graphs.

Adopted Council Meeting 16 July 2012
Page 29 of 32
Financial Indicators 2012-2013
Operating Surplus/(Deficit) Operating Surplus Ratio
This ratio indicates the difference between day-to-day
income and expenses for the particular financial year.
This ratio indicates by what percentage does the major
controllable income source vary from day to day
expenses.
TARGET: To achieve an Operating Breakeven Position,
or better, over a five year period.
TARGET: To achieve an Operating Surplus Ratio of
between 0% and 15% over any five year period.
Net Financial Liabilities Net Financial Liabilities Ratio
This ratio indicates what is owed to others less money
held, invested or owed to the Authority.
This ratio indicates how significant the net amount owed
is compared with income.
TARGET: Council's level of Net Financial Liabilities is no
greater than its Annual Operating Revenue and not less
than zero.
TARGET: Net Financial Liabilities Ratio is greater than
zero but less than 100% of total Operating Revenue.
-1,200,000
-1,000,000
-800,000
-600,000
-400,000
-200,000
0
200,000
2005 2006 2007 2008 2009 2010 2011 2012 2013
-20%
-15%
-10%
-5%
0%
5%
2005 2006 2007 2008 2009 2010 2011 2012 2013
-2,000,000
-1,000,000
0
1,000,000
2,000,000
3,000,000
4,000,000
5,000,000
6,000,000
7,000,000
2005 2006 2007 2008 2009 2010 2011 2012 2013
-20%
0%
20%
40%
60%
80%
100%
2005 2006 2007 2008 2009 2010 2011 2012 2013
Adopted Council Meeting 16 July 2012
Page 30 of 32
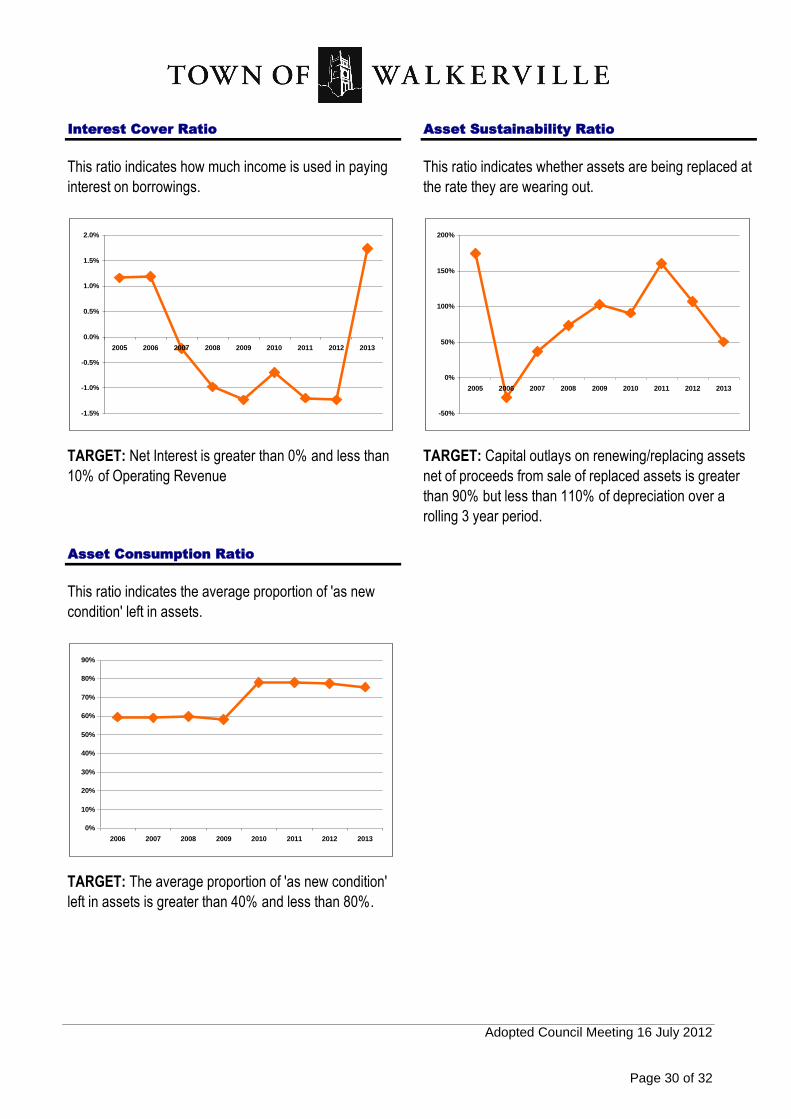
Interest Cover Ratio Asset Sustainability Ratio
This ratio indicates how much income is used in paying
interest on borrowings.
This ratio indicates whether assets are being replaced at
the rate they are wearing out.
TARGET: Net Interest is greater than 0% and less than
10% of Operating Revenue
TARGET: Capital outlays on renewing/replacing assets
net of proceeds from sale of replaced assets is greater
than 90% but less than 110% of depreciation over a
rolling 3 year period.
Asset Consumption Ratio
This ratio indicates the average proportion of 'as new
condition' left in assets.
TARGET: The average proportion of 'as new condition'
left in assets is greater than 40% and less than 80%.
-1.5%
-1.0%
-0.5%
0.0%
0.5%
1.0%
1.5%
2.0%
2005 2006 2007 2008 2009 2010 2011 2012 2013
-50%
0%
50%
100%
150%
200%
2005 2006 2007 2008 2009 2010 2011 2012 2013
0%
10%
20%
30%
40%
50%
60%
70%
80%
90%
2006 2007 2008 2009 2010 2011 2012 2013

Adopted Council Meeting 16 July 2012
Page 31 of 32
FINANCIAL INDICATOR ANALYSIS Operating deficit - ($956,007) The full year budgeted operating result is consistent with the actual results and budgeted results over the past two years. The Council has a target position to achieve a break-even position over a five year period. However this will be reviewed in light of the impact the proposed civic and community centre redevelopment will have on the operating result in the short to medium term. Operating surplus ratio - (15.3%) The operating surplus ratio highlights the operating result as a percentage of total rate revenue (excluding NRM levy). The operating surplus ratio target range is 0 to 15%. The Council has a targeted position to achieve a break-even position over a five year period, therefore impacting the operating surplus ratio and bringing the Council back into the acceptable target range. Net financial liabilities - $5,828,063 This measure indicates the balance of total liabilities after subtracting cash, cash equivalents and other financial assets. The Council target for this ratio is between zero and the total annual budgeted operating income. The increase in net financial liabilities is largely due to the civic and community centre redevelopment and is in line with the Council’s Long Term Financial Plan. Net financial liabilities ratio - 82% This ratio demonstrates the relative size of Council net financial liabilities against total operating income. It can be considered a measure of the ability to service liabilities. As demonstrated above, the net liabilities of Council (after subtracting financial assets only) is budgeted to be within the Council target range and taking into consideration the Civic and Community Centre Re-development. The Council target range represents a ratio of between 0% and 100% of total operating revenue. Interest cover ratio - (1.7%) The interest cover ratio measures net interest (finance costs less investment income) against total operating revenue. The Council target is a range of between 0% and 10%. Asset sustainability ratio - 50% The asset sustainability ratio represents the ratio of new capital expenditure against depreciation (adjusted for sale of assets). This ratio indicates the proportion of investment in new and existing assets against the decline in value of those existing assets. The Council targets a range of between 90% and 110% over a three year period. For the 2012/13 financial year Council’s major capital works will be on the Civic and community centre redevelopment therefore giving a lower than targeted asset sustainability ratio.

Adopted Council Meeting 16 July 2012
Page 32 of 32
Asset consumption ratio - 75% The asset consumption ratio indicates the written down value of assets as a proportion of fair value. Recent revaluations and asset purchases cause this ratio to increase, while depreciation will cause the ratio to decrease. A higher ratio indicates that the overall age and condition of Council assets are newer and more likely to be in good condition, whereas a low ratio will indicate that further investment in Council assets should be made. An example of the ratio is a measure of 50% would indicate that overall the Councils assets have 50% of their useful life remaining. Council target range of between 40% and 80%. Council’s asset consumption ratio is within the target range indicating Council’s assets are in good condition.