ANNUAL BUDGET CITY OF POOLER, GA
169
2017 ANNUAL BUDGET CITY OF POOLER, GA
Transcript of ANNUAL BUDGET CITY OF POOLER, GA

2017 ANNUAL BUDGET
CITY OF POOLER, GA


2017
City of Pooler
Established 1907
AnnuAl budget
CITY OF POOLER, GEORGIA ADOPTED ANNUAL BUDGET
FISCAL YEAR 2017
MAYOR MICHAEL F. LAMB
MAYOR PRO-TEM REBECCA BENTON
COUNCIL MEMBERS BRUCE ALLEN
SHANNON BLACK ASHLEY BROWN
MIKE ROYAL STEVIE E. WALL
CITY MANAGER ROBERT H. BYRD, JR
ASSISTANT CITY MANGER MATT SAXON
FINANCE DIRECTOR MICHELLE WARNER
CITY CLERK MARIBETH LINDLER
CITY ATTORNEY STEVEN E. SCHEER
COMPILED BY – FINANCE STAFF

City of Pooler FY 2017 Annual Budget
TABLE OF CONTENTS Introductory Section
Mayor and City Council ......................................................................................... .1 Appointed Officials and Department Directors ....................................................... .2
Budget Objectives .................................................................................................. 3 City Organizational Chart ........................................................................................ 4 City of Pooler Vision Statement .............................................................................. 5 Zoning Map of Pooler ............................................................................................. 6
Budget Message City Manager’s Budget Message ............................................................................ 7
City-At-A-Glance Introduction ........................................................................................................... 21
Current Position of the City .................................................................................... 23 Population and Demographics ............................................................................... 24 Households and Income ........................................................................................ 25 Economy and Industry ........................................................................................... 26 Local Government ................................................................................................. 27 2016 Statistics ....................................................................................................... 29
Financial Policies Fiscal Policies ....................................................................................................... 30 Fund Accounting ................................................................................................... 31 Basis of Accounting ............................................................................................... 32 Budget Adjustments/Amendments ........................................................................ 32 Purchasing Policy .................................................................................................. 33 Budgets & Budgetary Accounting .......................................................................... 33 Investment Policy .................................................................................................. 34 Reporting Policy/Audit ........................................................................................... 34 Debt Policy ............................................................................................................ 35 Capital Improvement Plan Policy ........................................................................... 35 Reserve Policy ...................................................................................................... 35 Budget Control Guidelines ..................................................................................... 35 Expenditure Control ............................................................................................... 36 Budget Preparation Process .................................................................................. 36 Fiscal Year ............................................................................................................ 37 City of Pooler Budget Process Calendar................................................................ 38

Funds, Debt Summary & Financial Trends Fund Summaries – Governmental Funds Fund Structure of the City of Pooler ....................................................................... 40 Combined Statement of Budget Revenues, Expenditures, & Changes in Fund Balance ..................................................................................... 44 Statement of Revenues & Expenditures ................................................................ 45 General Fund Revenue Summary ......................................................................... 46
General Fund Expenditure Summary ..................................................................... 47 General Fund Revenue Detail ............................................................................... 49 General Fund Largest Source of Revenue ............................................................ 51 General Fund Expenditure Detail ........................................................................... 52
Fund Summaries – Special Revenue Funds Confiscated Fund Summary of Revenues & Expenditures ..................................... 62 Hotel-Motel Tax Fund Summary of Revenues & Expenditures ............................... 63
Fund Summaries – Capital Improvement Fund Capital Projects Fund ............................................................................................ 64 SPLOST Fund Summary of Revenues & Expenditures .......................................... 65
Fund Summaries – Proprietary Funds Water/Wastewater Fund Summary of Revenues & Expenses ................................ 66 Water/Sewer Revenue Summary .......................................................................... 67 Water/Sewer Expense Summary ........................................................................... 68 Water/Sewer Revenue Detail ................................................................................ 71
Debt Summary GEFA Loans .......................................................................................................... 74 Capital Leases ....................................................................................................... 80
Financial Trends Financial Trends .................................................................................................... 87
Personnel Summary 3 Year Personnel Summary ................................................................................... 93 Citywide Personnel Summary ................................................................................ 94 Personnel Summary by Function ........................................................................... 95 Employee Benefits ................................................................................................. 96
Departmental Summaries
General Fund ........................................................................................................ 101 General Government Function ............................................................................... 102 Administration ........................................................................................................ 103 Public Safety Function ........................................................................................... 110 Police .................................................................................................................... 111 Fire ........................................................................................................................ 115 Public Works Function ........................................................................................... 118

Streets and Solid Waste Department ..................................................................... 120 Storm Water Management Department ................................................................. 122 Facilities Maintenance ........................................................................................... 124 Parks and Recreation Function ............................................................................. 126 Parks and Recreation ............................................................................................ 127 Senior Center ........................................................................................................ 130 Community Development Function ........................................................................ 132 Zoning and Inspections Department ...................................................................... 134
Enterprise Funds Enterprise Fund ..................................................................................................... 137 Water/Sewer Fund ................................................................................................. 138 Water/Sewer Fund Operating Revenue Overview ................................................. 139 Water/Sewer Fund Operating Expenses Overview ................................................ 140 Public Works Administration .................................................................................. 141
Water Department.................................................................................................. 143 Sewer Department ................................................................................................ 145 Wastewater Treatment Department ....................................................................... 147
Supplemental Information Glossary ................................................................................................................ 149

2017
CITY OF POOLER
ESTABLISHED 1907
Introductory

1
Mayor &
cIty councIl
Mike Lamb
Mayor
Rebecca Benton Mayor Pro Tem
Shannon Black Council Member
Bruce Allen Council Member
Ashley Brown Mike Royal Stevie Wall Council Member Council Member Council Member

2
DEPARTMENT DIRECTORS
AND APPOINTED POSITIONS
FY 2017 BUDGET
City Manager Robert H. Byrd, Jr.
Assistant City Manager/Public Works
Director Matt Saxon
City Clerk
Maribeth Lindler
City Attorney Steven E. Scheer
Finance Director Michelle Warner
Fire Chief Wade Simmons
Human Resources Director Andrea Anderson
Parks & Recreation Director
Hugh Elton
Police Chief Mark Revenew

3
FY 2017 CITY OF POOLER Introductory
The following information is provided to assist the reader in understanding the purpose of this approved budget document, in addition to finding information. The City of Pooler approved FY 2017 Annual Budget includes financial and service delivery information, combined with policy statements, in a means designed to easily communicate the information to the reader. The FY 2017 Approved Budget, therefore, is intended to serve four purposes:
As a policy document, the Budget indicates which services the City will provide during the next year. Additionally, the level of services and reasons for their provision are stated. The City Manager’s Budget Message summarizes long and short-term concerns for the City, financial situations and how the Budget will address specific issues in FY 2017. Specific policies are addressed in the Financial Policies section. Within the Departmental Summaries section, the four functions list specific short and long-term priorities and goals.
As an operations guide, the Budget indicates how departments and funds are organized to provide services to the citizens of Pooler and visitors to the community. Approved changes for FY 2017 are summarized in the Budget Message and detailed in the Funds, Debt Summary & Financial Trends, Personnel Summary and Departmental Summaries sections. Additionally, within the Departmental Summaries section, each department lists the mission statement, department description, department goals and objectives, approved budgetary additions and/or deletions, line-item history, year-end projections and approved funding for FY 2017.
As a financial plan, the Budget summarizes and details the cost to the citizens for current and approved service levels and includes funding information. Within the Budget Message is a narrative description of the major revenue sources for each fund, expected receipts and summaries of approved expenditures. Detailed financial information is illustrated in the Funds, Debt Service & Financial Trends section in addition to data found within the Departmental Summaries section. Such information is typically listed in five columns: 2015 Actual, 2016 Actual, 2016 Amended Budget, 2016 estimated year end, and 2017 Approved Budget.
The Budget is designed to be a user-friendly document, providing summary information in text, chart, table, and graph. A glossary of financial budget terms is included for the reader’s reference. Additionally, a Table of Contents provides an ordered list of sections within the document. Should the reader have any questions about the Approved FY 2017 Budget, he or she may contact City Staff, at (912) 748-7261.
The Budget as a Communications Device
The Budget as a Financial Plan
The Budget as an Operations Guide
The Budget as a Policy Document
The Budget Objective

4
City of Pooler, Georgia Organization Chart By Department & Function
Citizens
Legislative
Policy Administration Official Records
Public Information
Finance, Executive &
IT/IS
Budget Accounting
Utility Collection Business License
Risk Mgt. Fixed Assets
Revenue Mgt. Debt Mgt.
Human Resources
Employment
Services Counseling
Training Benefits
Administration
Police
Administration Patrol Division Traffic & Truck
Units Criminal
Investigation
Fire
Fire Suppression Fire Protection
Emergency
Management
Public Works
Road Maintenance Canal & Ditch Maintenance Solid Waste Dry Trash Vehicle &
Equipment Maintenance
Garage
Planning & Zoning
Planning Zoning Permits
Inspections Code Enforcement
Recreation
Recreation Programs
Sports Programs Park Services
Park Maintenance Senior Citizens
Center Programs
Water & Sewer
Water Repair Serer Repair
Water Treatment Wastewater Treatment
Utility Billing
Clerk of Council
Finance Officer
City Manager
Development Authority
Planning Commission
Citizen Volunteer Advisory Boards
City Attorney
Mayor & Council
Pooler Citizens Appointed Position
Elected Officials Departments
Advisory Boards
Division & Function

5
CITY OF POOLER
VISION STATEMENT “A growing, prosperous community with a diverse population, offering a balanced range of residential settings, a thriving business community set on continually improving the community’s quality of life.” Pooler is committed to achieving this vision through: Balanced growth guided by planning and management A robust infrastructure that anticipates the needs of growth Exceptional public safety services Extensive cultural, recreational and green space resources Environmental stewardship to create a balance between built and natural systems
Our vision addresses the community’s desire to maintain a community-oriented feel with commercial, employment, and economic development opportunities.
Tom Triplett Park

6
City of Pooler Zoning Map

6
2017
CITY OF POOLER
ESTABLISHED 1907
Budget Message

7
City Manager’s Budget Message Fiscal Year 2017
January 1, 2017
Mayor Lamb and Members of the City Council:
I am pleased to submit for your consideration the following budget document for the fiscal year beginning January 1, 2017. My recommendations are based on direction provided during the August 2016 Retreat, the Budget Workshops, and a thorough review of our current financial status. In the face of current economic trends, this FY 2017 Budget is significantly impacted by fixed costs such as payroll, debt service and insurance, as well as numerous external factors such as fuel prices, interest rates, and the need to expand services for a growing population. Expenditures that are not fixed or set by outside forces have been reviewed to arrive at a balanced budget for each fund. The result is a budget that meets the expectations of a vibrant city that is still evolving 110 years after it was founded.
The City is committed to ensuring that all budgets are balanced as we follow the leadership of the City Council combined with a commitment on the part of all departments to effectively provide a consistent level of service without substantially increasing expenditures. Our experience has shown that city departments must constantly identify appropriate expenditure savings and user fee increases, and to sometimes defer needed replacements, enhancements and additions, as we work to effectively and efficiently utilize available resources.
In building the FY 2017 Budget, the City considered outside factors that affect funding decisions such as state and local economic conditions, federal and state mandates, political and social environment, citizen concerns, and outside agency considerations. Based on these factors, the following assumptions were made to guide the development of the budget for FY 2017:
Pooler’s tax digest continues to grow each year due to new construction of homes
and additional commercial development. Occupational tax receipts also continue to grow as new businesses come to Pooler
due to the increase in population. Local Option Sales Tax (LOST) and Special Purpose Local Option Sales Tax
(SPLOST) collections remain strong since the economic recovery following the downturn in 2008.
Investment earnings are beginning to increase also as a result of economic recovery. Commercial development in the City of Pooler continues to grow as the economy
improves with 620 permits being issued between 2014 and 2016 compared to 442 between 2011 and 2013.
Once the above assumptions were developed, department heads produced their requests for funding and submitted them to the Finance Officer. A thorough review was conducted by the City Manager and the Finance Officer. Meetings were held with each department. Once the City Manager and the Finance Officer completed the initial review, a proposed budget was submitted to Mayor and Council.
8
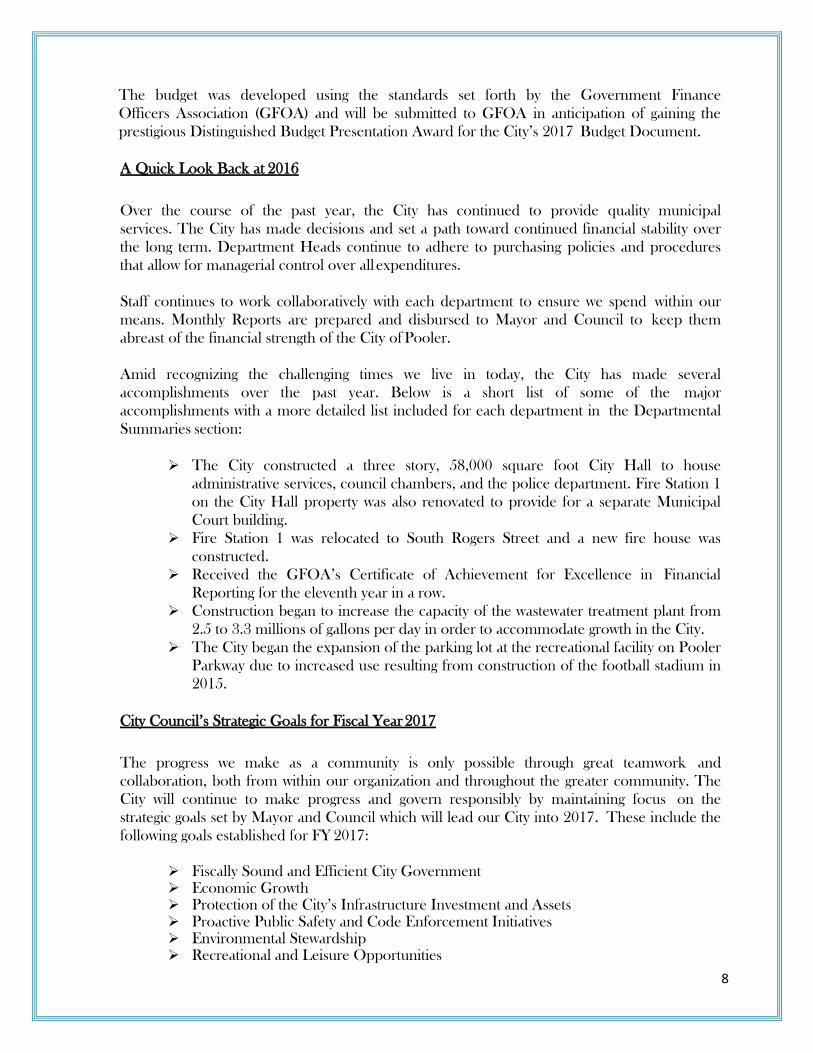
The budget was developed using the standards set forth by the Government Finance Officers Association (GFOA) and will be submitted to GFOA in anticipation of gaining the prestigious Distinguished Budget Presentation Award for the City’s 2017 Budget Document.
A Quick Look Back at 2016
Over the course of the past year, the City has continued to provide quality municipal services. The City has made decisions and set a path toward continued financial stability over the long term. Department Heads continue to adhere to purchasing policies and procedures that allow for managerial control over all expenditures.
Staff continues to work collaboratively with each department to ensure we spend within our means. Monthly Reports are prepared and disbursed to Mayor and Council to keep them abreast of the financial strength of the City of Pooler.
Amid recognizing the challenging times we live in today, the City has made several accomplishments over the past year. Below is a short list of some of the major accomplishments with a more detailed list included for each department in the Departmental Summaries section:
The City constructed a three story, 58,000 square foot City Hall to house
administrative services, council chambers, and the police department. Fire Station 1 on the City Hall property was also renovated to provide for a separate Municipal Court building.
Fire Station 1 was relocated to South Rogers Street and a new fire house was constructed.
Received the GFOA’s Certificate of Achievement for Excellence in Financial Reporting for the eleventh year in a row.
Construction began to increase the capacity of the wastewater treatment plant from 2.5 to 3.3 millions of gallons per day in order to accommodate growth in the City.
The City began the expansion of the parking lot at the recreational facility on Pooler Parkway due to increased use resulting from construction of the football stadium in 2015.
City Council’s Strategic Goals for Fiscal Year 2017
The progress we make as a community is only possible through great teamwork and collaboration, both from within our organization and throughout the greater community. The City will continue to make progress and govern responsibly by maintaining focus on the strategic goals set by Mayor and Council which will lead our City into 2017. These include the following goals established for FY 2017:
Fiscally Sound and Efficient City Government Economic Growth Protection of the City’s Infrastructure Investment and Assets Proactive Public Safety and Code Enforcement Initiatives Environmental Stewardship Recreational and Leisure Opportunities

9
These strategic goals are not intended to replace previous goals but to build on the priorities provided by Mayor and Council in 2016, which included:
Employing, training and maintaining a quality workforce of highly effective and efficient individuals.
Providing and maintaining a safe, secure and clean community. Implementing cost effective improvements through studies, reviews and suggestions.
Focus on the Future
Even during these tough economic times, we must look at today’s challenges as new opportunities that have opened before us. In many cases, it means applying all the lessons we have learned in the past to produce results we had not imagined. It also means taking a forward thinking approach to how we do business and how we strategically apply our resources to meet the high expectations of our citizens.
As the City plans for FY 2017 and beyond, there are key events and challenges that are shaping our vision. First, due to the continued population growth in Pooler, the City is already beginning to plan for renegotiation of the Local Option Sales Tax (LOST) distribution within Chatham County in 2022 and the Special Local Option Sales Tax (SPLOST) referendum that will go before the voters of Chatham County in 2019. Per State law, each County along with the certified municipalities within its jurisdiction must re-negotiate the division of LOST collections when the results of every decennial census are published. While many factors are considered in the allocation, population is a key determinant. LOST revenue can be co-mingled with general fund revenue and is generally used for operations. SPLOST, however, can only be used for capital infrastructure and is a very important component of the City’s capital budget plans.
Second, the City must continue to maintain our current assets and reinvest in the community. The City understands the importance of maintaining and reinvesting in public facilities and infrastructure, and therefore, is beginning plans to further expand both of the City’s recreational facilities to include more softball and soccer fields. Additionally, the City will complete upgrades to the traffic signals on Pooler Parkway in 2017 which will coordinate with the signals on the other side of I95 to improve the flow of traffic in that busy shopping corridor. The City will also complete its objective of lowering the community’s ISO rating by constructing a fifth fire station along Jimmy DeLoach Parkway.
Third, the City will continue its efforts towards quality growth management in order to be an attractive place for businesses to locate. One of the most important issues necessary for development is an abundant source of water as well as the efficient treatment of sewage. In 2014, Pooler completed construction of a well to pump water from the Lower Floridan Aquifer in order to lessen the City’s dependence on purchased water. And while the City is completing an expansion of the wastewater treatment facility in 2017, plans are already underway to begin the permitting process of a second treatment facility to increase the City’s treatment capacity by another 3 or 4 million gallons per day.

10
FY 2017 Annual Budget Overview/Highlights The FY 2017 Annual Budget allows the City to maintain current service levels and provide funds to be allocated at a future date for capital improvements which should enhance the livability of the citizens within the City. The remainder of this transmittal letter details in general terms, the budgetary decisions/actions pertaining to the operating and capital budgets, expenditures and revenues for each fund and changes in the final balance.
As mandated by the City Charter, the FY 2017 Annual Budget represents a balanced budget. Total appropriations from each fund do not exceed estimated fund balances and revenues for each of the City’s respective funds.
Total Uses
The FY 2017 annual budget for all funds totals $50,142,649. Below is a table illustrating the FY 2017 total uses by fund. These figures include expenditures and inter-fund transfers.
FY 2017 Operating Budget
All services provided by the City in FY 2017 are approved at the funding levels which permit the continuation of basic services at established service levels.
The City has been very fortunate that we have not had to do major layoffs, furloughs, salary reductions, or reductions of major benefits. The City will strive to balance the constraints of retaining an effective workforce with the resources available.

11
General Fund Expenditures Total General Fund uses (expenditures and transfers to other funds) for FY 2017 are $20,887,278, which represents a decrease of 12.7%, or $2.651.763 under the FY 2016 amended budget. This decrease is due to a reduced transfer to the capital projects fund since most of the projects related to the new City Hall have been completed or are nearly complete. Revenue projections for the forthcoming fiscal year less Other Financing Sources indicate that $19,931,969 will be available through the City’s diversified sources of revenues.
12
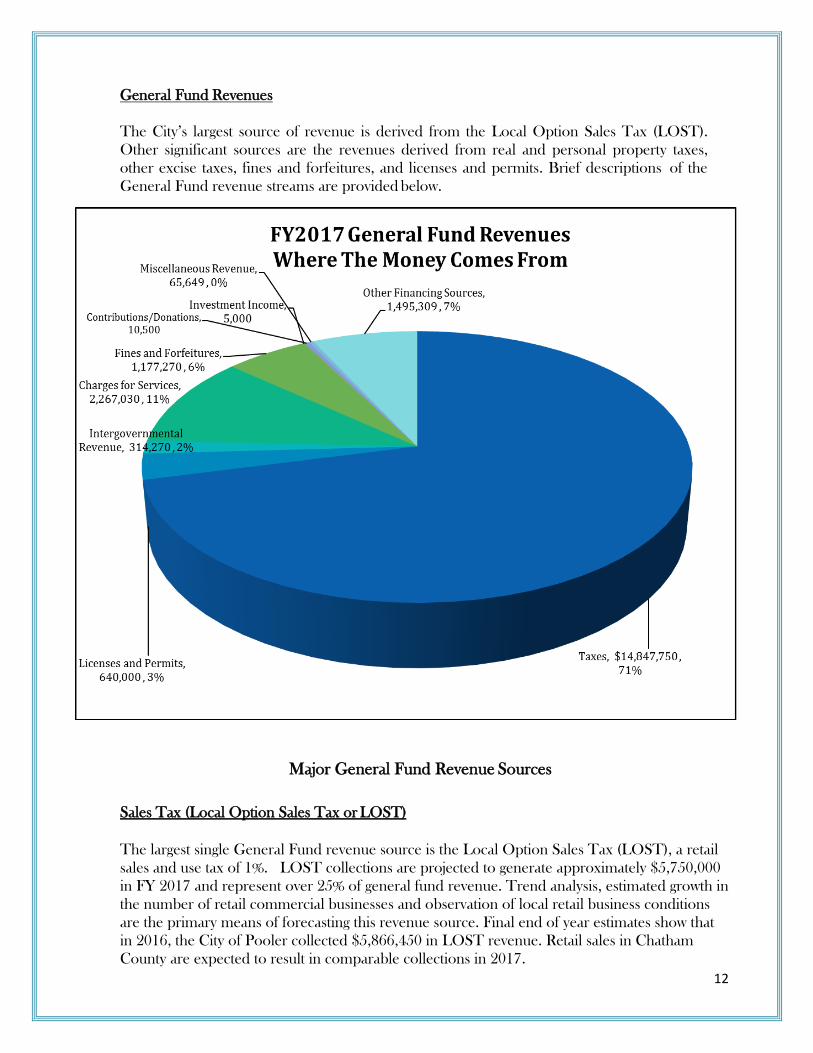
General Fund Revenues The City’s largest source of revenue is derived from the Local Option Sales Tax (LOST). Other significant sources are the revenues derived from real and personal property taxes, other excise taxes, fines and forfeitures, and licenses and permits. Brief descriptions of the General Fund revenue streams are provided below.
Major General Fund Revenue Sources
Sales Tax (Local Option Sales Tax or LOST) The largest single General Fund revenue source is the Local Option Sales Tax (LOST), a retail sales and use tax of 1%. LOST collections are projected to generate approximately $5,750,000 in FY 2017 and represent over 25% of general fund revenue. Trend analysis, estimated growth in the number of retail commercial businesses and observation of local retail business conditions are the primary means of forecasting this revenue source. Final end of year estimates show that in 2016, the City of Pooler collected $5,866,450 in LOST revenue. Retail sales in Chatham County are expected to result in comparable collections in 2017.

13
Real and Personal Property Taxes
The second largest General Fund revenue source is the Real and Personal Property Tax category. This revenue source is projected to generate $4,400,000 in FY 2017 and represents over 20% of General Fund revenues. In 2010, the City of Pooler contracted with the Chatham County Tax Commissioner to perform all of the billing and payment collections of the City’s property tax. This has resulted in a higher percentage of tax collection in any given year.
Excise Tax
The other taxes in the Excise Tax category make up the largest group of General Fund revenues after the Real and Personal Property Taxes and LOST revenues. Excise taxes, consisting of individual items such as beer and wine taxes, franchise taxes, occupational taxes, insurance premium taxes and other similar taxes are expected to realize $3,814,000 in FY 2017.
Charges for Services
Charges for Services are revenues that make up the fourth largest group of General Fund revenues. Charges for Services consist of monies collected from customers, w i t h the Sanitation fees being the largest revenue. The entire revenue source is expected to yield a total of $2,267,030 for FY 2017. This amount represents an increase of $237,437, or 10.48%, over the FY 2016 Amended Budget of $2,029,593. This increase is mostly due to expected growth in 2017 as well as an increase to charges to make up for increased costs associated with collection of solid waste.
Other Financing Sources
Other financing sources combine to make the General Fund’s fifth largest revenue source. Total revenue projected in FY 2017 is $1,115,080 with an additional $380,229 from the fund balance to allow the City to complete some scheduled capital projects. Of this amount, $565,080 is from Capital Leases to purchase 4 new police vehicles, new playground equipment for the Rogers Street facility and new breathing apparatus units for the fire department. The remainder represents a transfer in from the Hotel/Motel Tax Fund in the amount of $550,000 for the City’s percentage of the 6% tax charged by all hotels in the City of Pooler. Revenue for the City generated by the Hotel/Motel tax has been steadily increasing over the past few years due to increased tourism in the area and the construction of new hotels.
Fines and Forfeitures
Fines and Forfeitures is the sixth largest group of General Fund revenues. Fines and Forfeitures consist of monies collected through the court system mostly as a result of traffic fines. This revenue source is expected to yield a total of $ 1,177,270 for FY 2017.

14
Minor General Fund Revenue Sources
Licenses and Permits
Licenses and Permits in FY 2017 are projected to bring in $640,000, which represents a decrease of 20%, or $130,839, from actual revenue in FY 2016. While the City will continue to spur new development, the uncertainty in the economy has led to a conservative estimate for this revenue source. Trend analysis and anticipated construction starts are the primary forecasting tools used for this revenue stream.
Investment Income
Investment Income is one of the minor revenue sources in the General Fund. Investment Income is revenue generated based on interest earned on monies invested during the year. This revenue source is expected to yield a total of $10,000 for FY 2017. This amount represents an increase of $7,000 change from the FY 2016 Amended Budget. The increased health of the overall economy has begun to bring about higher interest rates. The City of Pooler will look at different investment options in 2017 of its fund balances not restricted for ongoing operations and capital projects.
Miscellaneous Revenue
Miscellaneous revenue is comprised of various rental fees, lease agreements, and other miscellaneous fees. In FY 2017, collection of these revenue sources is estimated at approximately $65,649. This is significantly less than collections in 2016 of $141,268, however, due to the inconsistent nature, the City projects miscellaneous revenues conservatively.

15
Summary of Expenditures & Other Financing Uses
General Government Function
The General Government function is comprised of the following departments and divisions:
Executive (City Manager) Information Technology/Information Systems Finance Department Human Resource Department
FY 2017 Approved General Government Expenditures
Public Safety Function The Public Safety function is comprised of the following departments: Police Department
• Municipal Court Fire Department
FY 2017 Approved Public Safety Expenditures

16
Public Works Function
The Public Works function is comprised of four (4) departments: Street Department Storm Water Management Department Solid Waste Facilities Maintenance
FY 2017 Approved Public Works Expenditures
Recreation and Parks Function The Recreation and Parks function is comprised of two (2) departments: Recreation Department • Park Maintenance
Senior Citizen Center
The Recreation and Parks expenditures for FY 2017 total $2,109,836.
FY 2017 Approved Recreation and Parks Expenditures
17
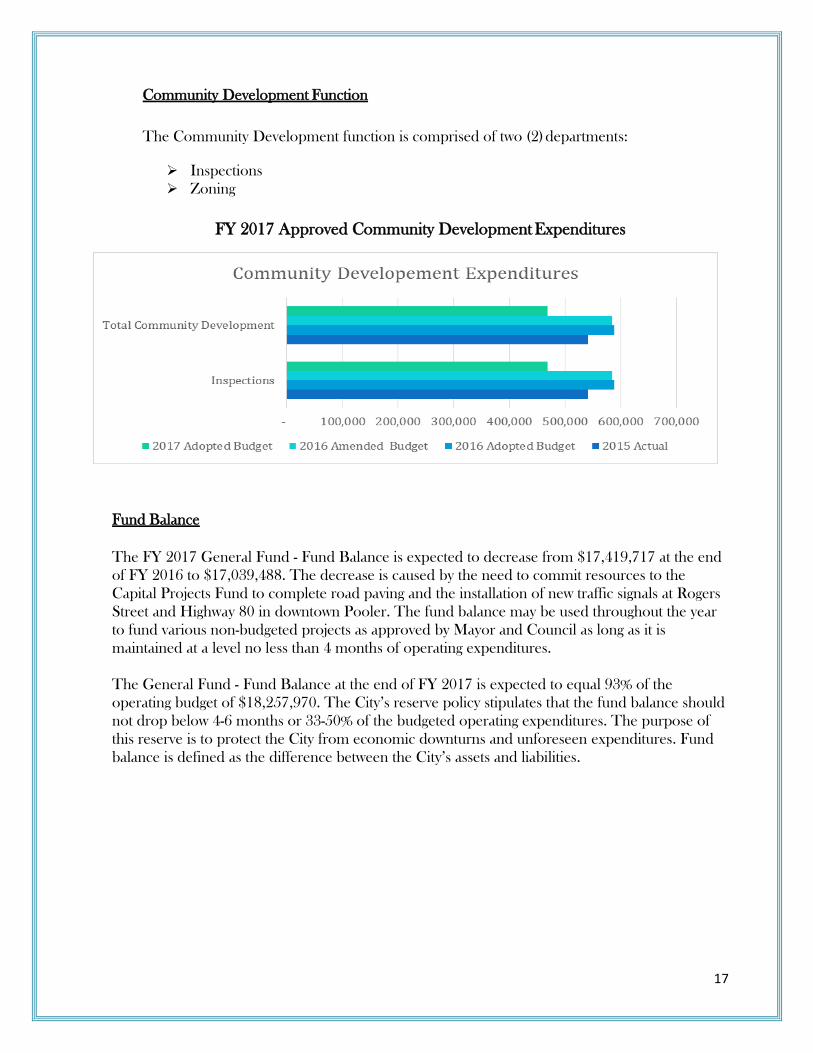
Community Development Function
The Community Development function is comprised of two (2) departments:
Inspections Zoning
FY 2017 Approved Community Development Expenditures
Fund Balance The FY 2017 General Fund - Fund Balance is expected to decrease from $17,419,717 at the end of FY 2016 to $17,039,488. The decrease is caused by the need to commit resources to the Capital Projects Fund to complete road paving and the installation of new traffic signals at Rogers Street and Highway 80 in downtown Pooler. The fund balance may be used throughout the year to fund various non-budgeted projects as approved by Mayor and Council as long as it is maintained at a level no less than 4 months of operating expenditures. The General Fund - Fund Balance at the end of FY 2017 is expected to equal 93% of the operating budget of $18,257,970. The City’s reserve policy stipulates that the fund balance should not drop below 4-6 months or 33-50% of the budgeted operating expenditures. The purpose of this reserve is to protect the City from economic downturns and unforeseen expenditures. Fund balance is defined as the difference between the City’s assets and liabilities.

18
Capital Projects Funds
Special Purpose Local Option Sales Tax Fund
The Special Purpose Local Option Sales Tax (SPLOST) is a citizen approved penny sales tax for specifically designated capital projects. The tax is voter approved for five (5) or six (6) year increments. The FY 2017 Budget includes debt service payments on the purchase of 5 new fire vehicles in 2016 and the police department portion of the new City Hall building that will be completed in 2017. The SPLOST budget also includes the completion of the traffic signal upgrade on Pooler Parkway. Capital Projects Fund
In 2012, the City began accounting for large capital projects in a separate fund. Projects began and scheduled to be completed in 2017 include construction of the new City Hall building and the traffic signal upgrades at the same location. Also included in the 2017 budget is the construction of a new fire station at Jimmy DeLoach Parkway.
Special Revenue Funds
Confiscated Asset Fund
The Confiscated Assets Fund represents a share of the net proceeds in forfeiture cases mostly at the federal level. The City of Pooler has assigned agents who work with the Drug Enforcement Administration (DEA) which in turn results in the shared revenues. The share percentage is based on the agency’s overall participation in and contribution to the investigation. The funds generated, including interest earnings, must be used for law enforcement purposes and must increase and not supplement the appropriate operating budget. This is not a stable source of revenue.
Hotel/Motel Tax Fund
The Hotel/Motel Tax Fund is a special revenue fund created for the purpose of promoting tourism in the City of Pooler. Revenues for the fund are raised from a 6% hotel/motel tax placed on hotels/motels conducting business within city limits. The tax is expected to raise $1,100,000 in FY 2017. One sixth (1/6) of the collections are designated for the purpose of constructing, developing, supporting, and operating the Savannah Maritime Trade Center. One third (1/3) of the collections are directed to the Pooler Chamber of Commerce and are strictly designated for the purposes of promoting tourism, conventions, and trade shows in the City of Pooler as detailed in O.C.G.A.; section 48-13-51 (a) (3.2). The remaining 50% does not have restrictions and can be used to fund general fund expenditures.

19
Enterprise Funds Water and Sewer Fund
Enterprise Funds account for specific services that are funded directly through user fees. The City has one Enterprise Fund, the Water and Sewer Fund (which has four distinct divisions). Typically these funds are intended to be fully self- supporting and are not subsidized by the General Fund. The FY 2017 Budget for the Water and Sewer Enterprise Fund projected revenues and expenses totaled $8,762,022. The percentages of revenues and expenses for the Water and Sewer Fund are reflected in the following charts.

20
Conclusion
To protect the City’s financial condition while achieving the goals outlined in this budget, a conservative and cautious approach was taken in projecting revenues and budgeting expenditures. The FY 2017 budget plan presented to you will fund the personnel and basic operating costs to maintain existing service levels. There is still much uncertainty as to what the future holds for local government revenue streams. Because we do not know what will happen to the sales tax collections, fuel costs, etc., we will need to proceed with caution as we enter the upcoming fiscal year and continue to follow cost control measures that have been implemented in previous years.
This FY 2017 Annual Budget was submitted to the Mayor and Council with the confidence that this document will assist citizens in evaluating approved budgetary and service levels. It also is intended to assist Mayor and Council in setting policy and establishing an overview of operations and City staff in accomplishing stated goals and objectives within financial constraints.
I would like to thank the Mayor and Council for providing direction in order to assist in the development of this FY 2017 Budget document as we continue to address the challenges and opportunities presented for local governments.
In order to compile the data for this document, several staff members have worked diligently to see that the figures and graphs are complete and accurate. To all who have worked to produce this document, I wish to express my very sincere gratitude.
Respectfully submitted,
Robert H. Byrd, Jr. City Manager

2017
CITY OF POOLER
ESTABLISHED 1907
CITY AT A GLANCE
CITY AT A GLANCE 2017
21
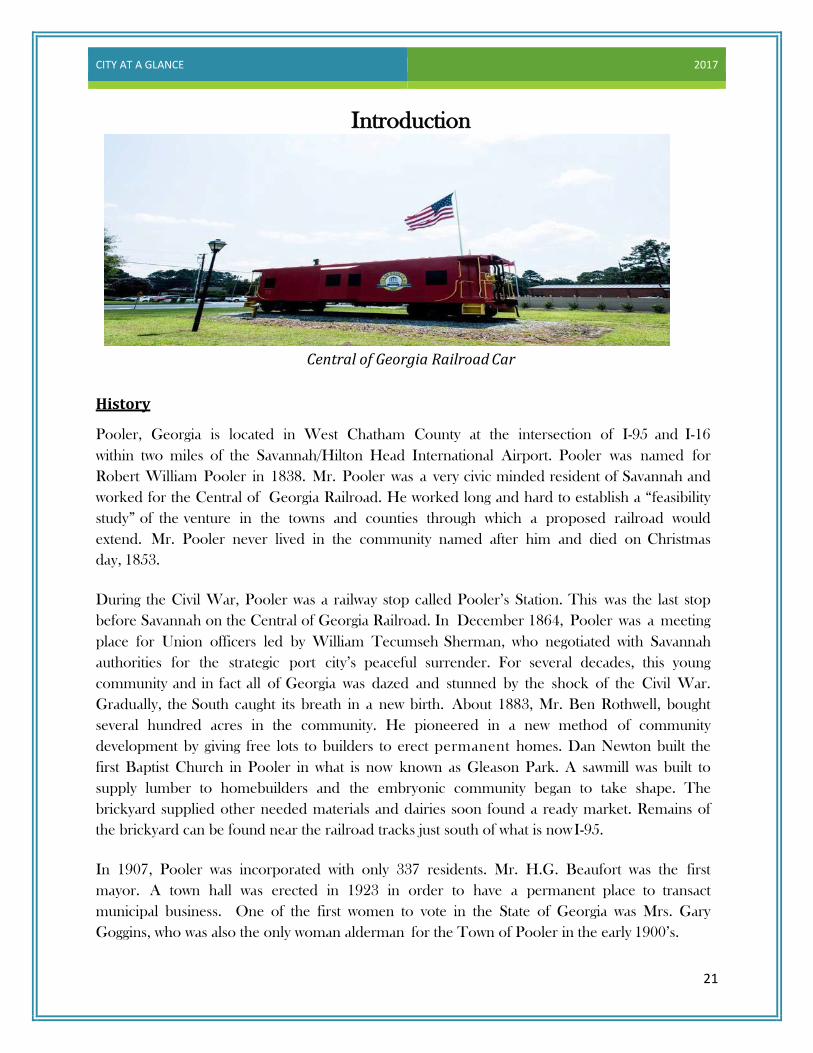
Introduction
Central of Georgia Railroad Car
History
Pooler, Georgia is located in West Chatham County at the intersection of I-95 and I-16 within two miles of the Savannah/Hilton Head International Airport. Pooler was named for Robert William Pooler in 1838. Mr. Pooler was a very civic minded resident of Savannah and worked for the Central of Georgia Railroad. He worked long and hard to establish a “feasibility study” of the venture in the towns and counties through which a proposed railroad would extend. Mr. Pooler never lived in the community named after him and died on Christmas day, 1853.
During the Civil War, Pooler was a railway stop called Pooler’s Station. This was the last stop before Savannah on the Central of Georgia Railroad. In December 1864, Pooler was a meeting place for Union officers led by William Tecumseh Sherman, who negotiated with Savannah authorities for the strategic port city’s peaceful surrender. For several decades, this young community and in fact all of Georgia was dazed and stunned by the shock of the Civil War. Gradually, the South caught its breath in a new birth. About 1883, Mr. Ben Rothwell, bought several hundred acres in the community. He pioneered in a new method of community development by giving free lots to builders to erect permanent homes. Dan Newton built the first Baptist Church in Pooler in what is now known as Gleason Park. A sawmill was built to supply lumber to homebuilders and the embryonic community began to take shape. The brickyard supplied other needed materials and dairies soon found a ready market. Remains of the brickyard can be found near the railroad tracks just south of what is now I-95.
In 1907, Pooler was incorporated with only 337 residents. Mr. H.G. Beaufort was the first mayor. A town hall was erected in 1923 in order to have a permanent place to transact municipal business. One of the first women to vote in the State of Georgia was Mrs. Gary Goggins, who was also the only woman alderman for the Town of Pooler in the early 1900’s.

CITY AT A GLANCE 2017
22
The City has grown by leaps and bounds with the establishment of banks, retail shops, professional offices and restaurants. Also, with the opening of Interstate 95 came other businesses and industries near and in the City of Pooler.
Today, Pooler is the center for commercial development in west Chatham County. Godley Station, the center for business development, has been successful in attracting large companies such as JCB to the area. Newer shopping centers such as The Tanger Outlets are bringing new revenue to the area. A low crime rate and the small town community feel are all factors in the areas explosive growth. Pooler is now one of Georgia’s fastest-growing cities. Also located in Pooler, Georgia is the Mighty Eighth Air Force Museum which is a non-profit 501c.3 organization. It educates visitors through the use of exhibits, artifacts, archival materials, and stories, most of which are dedicated to the history of the Eighth Air Force during World War II. Below is one of the aircraft (F-4 Phantom II) which is displayed at the Mighty Eighth Museum
Phantom II (featured at Mighty Eighth Museum)

CITY AT A GLANCE 2017
23
Current Position of the City of Pooler
Population and Demographics
The City of Pooler is located in Chatham County, Georgia 10 miles west of the City of Savannah. The City encompasses an area of approximately 31 square miles and has a current population of 23,133 according to the 2015 Census Report. This number represents an increase of 21% f r o m the 2010 Census. This number will have a significant impact on the City for the next 10 years, given that the upcoming Local Option Sales Tax distribution will largely depend on the Census figures.
5%13%
0% 2%0%1%1%
5%1%1%61%
10% Land UseAgriculture/Forestry
Residential-Single Family
Residential-Multi Family
Commercial Retail
Commercial Office
Public/Institution

CITY AT A GLANCE 2017
24
Population by Age
According to the 2015 Census, the distribution by age is as follows and is reflected in the chart below. The largest group represented is the age range of 25-34 years at 18.8%. The next largest groups represented are the age group of 35-44 years at 16.6%, followed by the 45-54 years at 12.4%, and the 15-24 years of age group at 11.3%. These four groups represent 59.10% of the population based on the 2015 Census.
0
5000
10000
15000
20000
25000
30000
2007 2008 2009 2010 2011 2012 2013 2014 2015 2016 2017 2018 2019 2020
TOTA
L PO
PULA
TIO
N
YEAR
POPULATION BY YEAR
0-4 yearsAges 10 - 19
10-14 years
15-24 years
25-34 years
35-44 years
45-54 years55-64 years
65-74 years75-84 years 85+ years
Population by Age Group

CITY AT A GLANCE 2017
25
Households and Income
The original grid layout of Pooler set the stage for a vibrant and well-rounded community, which is home to many charming residences to this day. There are several solid existing neighborhoods in Pooler including Savannah Quarters, Forrest Lakes, Godley Station, Harmony, The Arbors, Morgan Pines, Hamilton Grove, The Hunt Club and many other communities that make up the beautiful city of Pooler. Additionally, the City of Pooler has a significant amount of land where new neighborhoods will develop and continue to shape the community.
Home in Forest Lakes Subdivision
The 2015 Census community statistics results for Pooler were very positive. The median income for a household in the City of Pooler was $ 68,787 compared to the Georgia average of $49,342. Pooler’s household income is 2 1 % higher than the state average. The median per capita income of Pooler is $32,973 compared to the State of Georgia average of $25,427, which is 23% higher than the state average. The following graph shows the median income for a household, the average family incomes and the median per capita income.

CITY AT A GLANCE 2017
26
Economy and Industry
Over the past ten years, the City of Pooler has experienced unprecedented growth. In 2000, the U.S. Census Bureau estimated the population of Pooler to be 6,239. Since then, the population has more than tripled according to the 2015 Census which estimates Pooler’s population to be 23,133. Several new communities have been developed in Pooler which has also sparked commercial development and employment opportunities. The geographical location of the City combined with the quality of life benefits that Pooler has to offer contribute to the growth.
Since 2011, the City of Pooler has seen increases in the purchase of building permits for both residential and commercial development indicating a much needed recovery from the recession that began in 2008. Although the number of permits issued in 2016 was less than half from the year before and the past 10-year average, the City does not see this as an economic issue. There are many plans in the works for more development within City Pooler limits, especially commercial development. In 2016, there were 211 residential permits issued compared to 255 in 2015 and 70 commercial permits issued compared to 343 in 2015. The City continues to issue permits to office complexes, restaurants, and other retail establishments.
Median Household Income
Average Family Income
Per Capital Income
- 10,000 20,000 30,000 40,000 50,000 60,000 70,000
PoolerGeorgia
Pooler GeorgiaMedian Household Income 68,787 49,342Average Family Income 66,161 49,280Per Capital Income 32,973 25,427
FY 2016 Income by Category

CITY AT A GLANCE 2017
27
The City of Pooler has 13 hotels to offer the traveling public on Interstate 95. The City is anticipating $1,100,000 in hotel excise tax in 2017. The revenue from this tax has been increasing since 2012 due to higher occupancy rates. Five (5) more hotels are being planned for Pooler, with three (3) of them being constructed on Pooler Parkway at the I16 interchange. The City expects Local Option Sales Tax (LOST) collections to remain steady in 2017. Currently, LOST is the city’s largest source of revenue. After the decennial census is 2020, LOST distributions will be renegotiated amount Chatham County and the municipalities in the County, and the City of Pooler expects to receive a higher distribution at that time due to increasing population and development within the City.
Due to the increase in population over the past decade, the City of Pooler has been attracting several family entertainment-oriented businesses. In 2012, one of the new movie theaters in Pooler expanded to include an IMAX theatre and plans are underway for a third movie theater to be constructed in Pooler in the near future. In addition, t h e d e v e l o p e r o f t h e 14-acre water park near the new bowling alley just off of Pooler Parkway plans to expand the facility. Future commercial development plans tentatively include 2 new grocery stores, additional restaurants and retail business at the outlet mall, and a car dealership. All of these projects will help to stimulate the economy in Pooler, as well as make the city a more attractive place for families to reside.
Local Government
The City of Pooler operates under a Council-Manager form of Government. This system of government combines the strong political leadership of elected officials with the strong managerial experience of an appointed City Manager, enabling the Mayor and City Council to share legislative functions. The Mayor c o n t i n u e s to be recognized as the political head of the City and is a voting member on the City Council. Council appoints a City Manager to manage the City on a daily basis and implement the policies and programs enacted by the Council. The City Manager is responsible for preparing the annual budget, providing leadership and direction in the development of short and long range plans, and advising the Mayor and City Council of financial conditions. The City Council also appoints a City Clerk and a Finance Officer.
The City currently employs approximately 200 full time workers and provides a full range of municipal services, including general government, public safety (police and fire), recreation, public works, code enforcement, solid waste collection and disposal, and water and sewer utilities. The criteria used by the City for including activities in preparing its financial statements are set forth in GASB Statement No. 14. Based on these criteria, all municipal services listed above are included in the City’s financial statements. In addition, the Pooler Development Authority is considered to be a component unit of the City and is treated as such in the City’s financial statements.

CITY AT A GLANCE 2017
28
The City Council adopts and reports annual budgets for its general and special revenue funds as required by state law. The legal level of control (the level at which expenditures may not exceed appropriations) is at the departmental level.
Groundbreaking for New Pooler City Hall-2015

CITY AT A GLANCE 2017
29
Pooler, GA INCORPORATED 1907 FORM OF GOVERNMENT: COUNCIL-MANAGER 2017 POOLER CITY COUNCIL MAYOR ELECTED MICHAEL F. LAMB 2004 COUNCIL MEMBERS ELECTED BRUCE ALLEN 2004 REBECCA BENTON 2004 SHANNON BLACK 2010 ASHLEY BROWN 2016 MIKE ROYAL 2005 STEVE E. WALL 1996 REGISTERED VOTERS 10,636 VETERANS 2,511 Total Businesses 1721 Educational Attainment 94.4% Total Housing Units 8,666 Male Median Income $50,830 Female Median Income $21,496 Percentage of Married 56.1 % Median House Value $173,000
CITY OF POOLER AT A GLANCE
CITY DEMOGRAPHICS
Estimated Population 23,133 Annual Growth Rate 2.51% Projected 2020 Population 25,453 Median Family Income $66,161 Average Household Size 2.53 Per Capita Income $32,973 Annual Growth Rate 3.54%
PUBLIC SCHOOLS LOCATED IN CITY Elementary 2 Middle School 1 High School 0
POLICE PROTECTION Number of Stations 1 Number of Personnel 55 FY 2016 Calls for Service 39,126 FIRE PROTECTION Number of Stations 4 Number of Personnel 59 FY 2016 Calls for Service 3,846
PUBLIC WORKS Miles of Streets Resurfaced .84 Residential Permits Issued 211 Commercial Permits Issued 70
PARKS AND RECREATION Community Centers 1 Parks 2 WATER AND SEWER SYSTEM Daily Average Water Consumption (millions of gallons) 2,180 Max Daily Water Capacity (millions of gallons) 4,454 Max Daily Treatment Capacity (millions of gallons) 3,500
MAJOR EMPLOYERS JCB, Inc. 599 Wal-Mart 288 City of Pooler 204 Jenkins Plumbing 140
2016 STATISTICS

2017
CITY OF POOLER
ESTABLISHED 1907
Financial Policies

FINANCIAL POLICIES 2017
30
The purpose of this section is to present the policies that the City follows in managing its financial and budgetary affairs. These policies represent long- standing principles, traditions, and practices that have guided the City in maintaining financial stability.
Fiscal Policies
The following fiscal policies are employed by the City of Pooler:
The City shall strive to maintain a broad and diversified revenue base that will equitably distribute the burden of supporting City services and will protect t h e City from short-term fluctuations in any one revenue source.
The City will actively support economic and industrial development, recruitment
and retention efforts to expand the revenue base.
The City will maintain timely collection systems and implement necessary enforcement strategies to collect revenues.
The City will project revenues on a conservative basis so that actual revenues
will consistently meet or exceed budgeted revenues.
Basic and essential services provided by the City will receive priority funding.
The City will provide access to medical, dental and life insurance for its employees. The cost for these benefits will be shared between the City and its employees.
The City will provide access to appropriate retirement plans for its employees.
Employees contribute 2% - 4% according to their hire date and the City will make contributions for eligible employees at the percentage defined as reflected in the Personnel Summary section.
Financial Policies

FINANCIAL POLICIES 2017
31
Fund Accounting
In governmental accounting all financial transactions are organized within “funds”. The City abides by Generally Accepted Accounting Principles (GAAP) governing the use of funds. First, a fund contains a group of accounts segregated for certain purposes. Second, the financial transactions related to these purposes will be recorded in the accounts of the fund. And third, these accounts must be self-balancing and must include information about all the financial resources (assets), liabilities, fund balance/retained earnings, revenues and expenditures/expenses.
Governmental Fund Types
The City currently makes use of three Governmental Fund types: General Fund, Special Revenue Funds, and Capital Improvements Fund. The City also makes use of one of the Proprietary fund types, which is the Enterprise Fund and one Fiduciary Fund, which is the Agency Fund. The City has one Enterprise fund which is the Water & Sewer Fund and one Agency fund which is the Municipal Court Fund. Following is a brief description of each fund type.
General Fund: The General Fund is used as the chief operating fund and to account for all resources which are not accounted for in another fund. Most functions of the City are financed within this fund, such as maintenance and operations (M&O), and salaries and benefits. By definition, there can only be one general fund.
Special Revenue Funds: Special Revenue Funds are used to account for the proceeds of specific revenue sources (other than special assessments, expendable trusts, or for major capital projects) that are legally restricted to expenditures for specified purposes.
Capital Improvement Funds: Capital Improvement Funds are used to account for financial resources to be used for the acquisition or construction of major capital projects.
Proprietary Fund Types
Proprietary funds are used to account for the City’s ongoing activities which are similar to those often found in the private sector. The measurement focus (flow of economic resources) is based upon determination of net income. The following is the City’s proprietary fund type.
Enterprise Funds: Enterprise Funds are used to account for operations, which include the Water & Sewer Fund, that are significantly financed through user fees and/or for which a governing body desires periodical information on costs.

FINANCIAL POLICIES 2017
32
Fiduciary Fund Types
Fiduciary fund reporting focuses on net assets and changes in net assets. Fiduciary funds are used to report assets held in a trustee or agency capacity for others and therefore cannot be used to support the government’s own programs. The Fiduciary fund category used by the City of Pooler includes one Agency Fund. GASB 34 excludes the reporting of fiduciary activities in the government-wide financial statements.
Agency Fund: The City of Pooler uses one Agency fund to account for, on a temporary basis, fines collected by the Municipal Court. Pooler’s share is ultimately transferred to the general fund and the balance is distributed to other governmental agencies.
Basis of Accounting
The basis of accounting determines when financial transactions are recorded in the accounts of the various funds used by the City.
Governmental Fund Types: The modified accrual basis is followed in the Governmental Funds. Such funds include the General Fund, Special Revenue Funds and Capital Improvement Funds. The modified accrual basis of accounting recognizes revenues in the accounting period in which they become available and measurable as current assets. “Measurable” means the amount of the transaction can be determined and “available” means collectible within the current period or expected to be collectible soon enough thereafter to be used to pay liabilities of the current period.
Proprietary Fund Types: The full accrual basis is followed in the Proprietary Funds. Such fund types include two sub-types: Enterprise Funds and Internal Service Funds. The City does not have any Internal Service Funds. The full accrual basis of accounting recognizes transactions and events when they occur, regardless of the time of the related cash flow.
Fiduciary Fund Types: Agency Funds are used as a clearing account to distribute financial resources to other funds or outside entities. Agency funds are custodial in nature and do not involve measurement of operations and provide the most appropriate mechanism for accounting for assets and liabilities.
Budget Adjustments/Amendments
From time to time it becomes necessary to modify the adopted budget. Any change that needs to be made to the budget must be presented to and approved by the Mayor and Council. There are different scenarios which require amendment of the budget. One type of change (budget adjustment) is when the “bottom line” total for a department or fund does not change the approved budget. The second type of change is a budget amendment that alters the total appropriation for a department or fund. The City Charter

FINANCIAL POLICIES 2017
33
permits the Mayor and Council to make changes in the appropriations contained in the current operating budget. Circumstances requiring an amendment include but are not limited to:
• Approval of new expenditure • Transfer from one line item to another within a department • Appropriation of additional funding if expenditures are projected to exceed
budgeted amounts; or • The re-appropriation of monies from one department to another when deemed
necessary.
The City Manager considers budget amendments as a last resort. It is a standing policy that departments discipline themselves to initial appropriations made in the original budget ordinance passed at the beginning of the fiscal year.
Purchasing Policy
The City Council shall by ordinance prescribe procedures for a system of centralized purchasing for the City. Procurements of goods and services by the City are made in accordance with the purchasing policy. The policy describes the accepted methods for source selection including professional services, construction acquisitions, and emergency purchases.
All purchases shall be based on an approved budget for which funds have been allocated. Emergency purchases may be authorized by the City Manager. Any purchase made under these conditions for which funds have not been budgeted shall be presented to the Mayor and Council for approval at the next scheduled meeting.
The intent of the City’s purchasing policy is to provide for the fair and equitable treatment of all persons involved in public purchasing by the City, to maximize the purchasing value of public funds in procurement, and to provide safeguards for maintaining a procurement system of quality and integrity.
Budgets and Budgetary Accounting
Annual budgets are adopted for the General Fund, Hotel/Motel Fund, Confiscated Assets Fund, Special Local Options Sales Tax (SPLOST) Fund and the Enterprise Fund. These budgets are adopted on a basis consistent with Generally Accepted Accounting Principles (GAAP).
The General Fund, the Hotel/Motel Fund, the Confiscated Assets Fund, and the SPLOST budgets are all prepared on the modified accrual basis of accounting. Under this basis, revenues are recognized when they become measurable and available to finance expenditures of the current period. Expenditures are recognized when the related fund liability is incurred.

FINANCIAL POLICIES 2017
34
The Water and Sewer budget is prepared on the full accrual basis of accounting. Under this basis, transactions and events are recognized when they occur, regardless of the time of related cash flow.
All appropriated budgets are prepared by fund, function and department. Transfers of appropriations between departments require the approval of Mayor and Council. The legal level of budgetary control is the department level; department heads have the authority to purchase budgeted items up to a $500 maximum without prior approval of the City Manager. The Mayor is authorized to approve budget transfers according to the City Charter. Such transfers, however, are infrequent as department heads are encouraged to stay within the approved line item budgeted levels.
Investment Policy
The City adheres to treasury management practices permitted by state statutes and adopted investment policies. Recognizing that deposit and investment transactions are subject to a variety of risks, the City seeks to promote the safety of principal, provide adequate liquidity for operational needs, earn market rates of return on investments consistent with liquidity needs and investment quality, and conform to legal requirements. The City, subsequently, limits its investments to the types of securities provided by state statutes, considering first the probable safety of capital and then the probable income to be derived.
Reporting Policy/Audit
Each fiscal year, an independent firm is contracted to perform an audit of the City’s basic financial statements. The City’s fiscal year runs from January 1 to December 31. Audits are performed in accordance with Generally Accepted Audit Standards issued by the Comptroller General of the United States. The annual audit report is public record and, therefore, available to the public for review.
In an effort to ensure Mayor and Council are thoroughly informed, staff produces detailed monthly financial statements reporting the activity for funds maintained by the City.
The City prepares an annual budget document providing basic understanding of the City’s planned financial operations for the coming fiscal year. Copies of the proposed and final budget are made available to all interested parties for citizen review and input prior to final Mayor and Council adoption of the budget. This year the City will submit copies of the approved budget to the Government Finance Officer Association (GFOA) Distinguished Budget Presentation program.

FINANCIAL POLICIES 2017
35
Debt Policy
The City will pay for all capital projects and capital improvements with pay as you go financing, using current revenues when possible. If a project or improvement cannot be financed with current revenues, long-term debt might be recommended.
Capital Improvement Policy
The City prepares annually a Capital Improvements Program (CIP), which provides for the orderly maintenance, replacement and expansion of capital needs. The CIP will identify long-range capital projects and capital improvements of all types that will be coordinated with the annual operating budget to maintain full utilization of available resources. Additionally, the City will seek federal, state and other funding to assist in financing capital projects and capital improvements. A capital outlay is defined as an item that costs at least $10,000 or infrastructure improvements costing at least $50,000 and that have an “economic useful life” of one year or more.
Reserve Policy
In December 2011, the City revised its fund balance policy to conform to the Governmental Accounting Standards Board (GASB) Statement 54. The statement is intended to improve the usefulness of the amount reported in fund balance by providing more structured classifications. The statement also clarifies the definition of existing governmental fund types. The policy in place for the City of Pooler formally establishes a minimum unrestricted fund balance policy in the General Fund of 4 – 6 months of operating expenditures.
In the event of an unanticipated budgetary shortfall in excess of $250,000 it would be acceptable for the unrestricted fund balance to fall below the minimum level. However, a plan for replenishing the fund balance must be enacted beginning with the following budget year and must be completed within two years.
Budget Control Guidelines & Monitoring
It is the responsibility of each department head to control expenditures and expend funds only for items that are budgeted. The City’s Charter stipulates that expenditures shall not exceed the appropriation authorized by the budget. No increase in the overall budget for any one department shall be made without the approval of the Mayor and Council. Refer to “Budget Amendments” for additional details.
FINANCIAL POLICIES 2017
36
Expenditure Control
An operational control of departmental budgets is maintained by a preliminary check of funds availability on an object classification basis. Each department is responsible for ensuring funds are available within the object classification before the issuance of purchase orders. In the event of insufficient funds within a department, additional information must be submitted to justify the purchase after which a budget amendment will be done. Budgetary control is established at the department level, not by individual line items within the department.
Budget Preparation Process
The Finance Officer oversees the budget preparation process. The budget is composed of three levels: (1) Department Request, (2) City Manager’s Proposal, and (3) the Mayor and Council Approved Budget. The City Manager is responsible for formulating finance and policy priorities. Specific steps in the budget preparation process include the following:
Budget Preparation Package: In July budget preparation packages are distributed to all department heads. Budget templates are set up in the Incode Accounting system for use by the department heads.
City Manager Overview: After the budget packages are distributed, the City Manager gives the time line for their budget request to be submitted to Finance. Each department head meets with the City Manager and the Finance Officer for additional directions in preparation of the budget and to identify funding priorities.
Goals, Objectives and Tasks: During the month of August, department heads submit their budget requests through inputting their numbers in the system with detailed explanations if necessary. Goals, objectives and tasks are submitted to the Finance Officer for preliminary review. Afterward, the package is submitted to the City Manager for review.
Analysis of Departmental Budgets: In mid-September, department heads meet with the City Manager and the Finance Officer to review their submitted budget requests. During October the Finance Office compiles the proposed budget for submittal to the City Manager with subsequent submittal to Mayor and Council.
City Manager’s Proposed Budget Formally Submitted to Mayor and Council for Review: The City Charter stipulates that the proposed budget document must be submitted by the City Manager to the Mayor and Council each year sixty (60) days prior to the beginning of the next fiscal year. The proposed budget is made available to the public for review during this period.

FINANCIAL POLICIES 2017
37
Consideration of Budget: From the beginning of October through mid-November, Mayor and Council have the opportunity to ask questions, and make revisions to the proposed budget document.
Public Hearing: A public hearing is advertised in mid-November giving the citizens the date the public hearing will be held. The public hearing is held, typically at the first meeting in December, after the work sessions with Mayor and Council are complete. The public hearing permits direct input from citizens. The budget workshop(s) are held prior to the public hearing and are typically in the first half of October.
Budget Adoption: At the second regularly scheduled Council meeting in December, the Mayor and Council enact a budget resolution for the ensuing fiscal year. The resolution details all anticipated revenues to be received during the fiscal year, all anticipated expenditures for the fiscal year and all payments to be applied toward the City’s indebtedness.
The budget calendar on the following pages details the City’s budget preparation process.
Fiscal Year
The fiscal year of the City begins on January 1st of each year and ends December 31st of the same year.

FINANCIAL POLICIES 2017
38
FISCAL YEAR 2017 BUDGET CALENDAR
DATE(s) / TIMELINE
ACTIVITY
Phase 1 Phase 1 – STRATEGY FORMULATION (FY2017 BUDGET PREP DISTRIBUTION)
July 19 FY 2017 Budget request worksheets, instructions, and guidelines are distributed to department heads.
July 19 FY 2017 Budget templates are available on the Incode system for use by department heads.
Phase 2 PHASE 2 – NEEDS ASSESSMENT , REVIEW & DEVELOPMENT OF FY 2017 BUDGET
September 2 FY 2017 Budget request are completed in Incode; Documentation turned into Finance Officer.
September 2 Revenue Estimates are completed.
September 5-September 16
The City Manager & the Finance Officer review Departmental FY 2017 budget requests and make any adjustments deemed necessary.
September 19 – September 23
The City Manager & the Finance Officer hold conferences with the department heads to finalize any changes with the individual budgets.
September 26- October 7
Finance Officer assembles budget requests, compares with revenue estimates, and compiles the budget document.
Phase 3
PHASE 3 – CITY COUNCIL BUDGET DISCUSSIONS & FINAL BUDGETARY DECISIONS FOR FY 2017
October 17 FY 2017 City Council, City Manager & Finance Officer meet for Budget workshop @ 3:00 p.m. to discuss the budget, and incorporate any changes into the budget document.
November 7 FY 2017 City Council, City Manager & Finance Officer meet for Budget workshop @ 3:00 p.m. to discuss the budget, and incorporate any changes into the budget document.
November 12 Advertise FY 2017 Budget information and date of public hearing (Send ad to the paper on November 8th)

FINANCIAL POLICIES 2017
39
November 21 FY 2017 City Council, City Manager & Finance Officer meet for Budget workshop @ 3:00 p.m. to finalize the budget, and make necessary changes.(Pending necessity)
Phase 4 PHASE 4 – ADOPTION & IMPLEMENTATION OF FY2017 BUDGET
November 21 FY 2017 Mayor and Council perform final review. Document ready for the next process. Review of Mayor and Council is complete
November 21 Public Hearing for proposed budget to be conducted at Council Meeting
November 28 Advertise consideration of budget resolution (Send information to the paper on December 2)
December 5 FY 2017 Budget – Final review and revision. Adopt FY 2017 Resolution.
December 6 Print final Budget Document and send copies to department heads and Council members.
January 1, 2017 FY2017 Budget is in effect
2017
CITY OF POOLER
ESTABLISHED 1907
FUNDS, DEBT SUMMARY, AND FINANCIAL TRENDS

FUNDS, DEBT SUMMARY, AND FINANCIAL TRENDS 2017
40
FUND SUMMARIES
The accounts of the City are organized on the basis of funds and account groups, each of which is considered a separate accounting entity. The operations of each fund are accounted for with a separate set of self-balancing accounts that comprise the City’s assets, liabilities, fund equity, revenues, and expenditures or expenses, as appropriate. Government resources are allocated to and accounted for with individual funds based upon the purposes for which they are to be spent and the means by which spending activities are controlled.
The City of Pooler utilizes three major governmental fund types, one enterprise fund and one fiduciary fund. The governmental fund types are the General Fund, Special Revenue Funds, and Capital Project Funds. The City has one enterprise fund and it is the Water & Sewer Fund; and one fiduciary fund which is the Municipal Court Agency Fund.
Governmental Proprietary Fiduciary
Fund
General Fund
Special Revenue
Funds
Capital Projects
Fund
Enterprise Funds
Agency Fund
General X Confiscated Assets X Hotel/Motel Tax X SPLOST X Capital Projects X Water/Sewer X Municipal Court X
Governmental Funds General Fund
The General Fund is the general operating fund of a City. This fund is used to account for all financial resources except those required to be in another fund. By definition, the City has only one General Fund.
Special Revenue Funds
Special Revenue funds account for revenue sources that are legally restricted to expenditures for a specific purpose. The City has two special revenue funds.
Hotel-Motel Fund
The Hotel Motel Fund is used to account for funds received from a 6% hotel/motel tax placed on hotels and motels in the city limits. Monies are distributed as mandated in the city ordinance to promote tourism in the City.
Funds, Debt Summary & Financial Trends

FUNDS, DEBT SUMMARY, AND FINANCIAL TRENDS 2017
41
Confiscated Assets Fund
The Confiscated Assets Fund is used to account for funds received from participation with other law enforcement agencies in drug related cases. The monies are used by the City of Pooler Police Department to purchase necessary equipment and supplies; it cannot be used for wages and benefits. Any projected fund balance automatically carries over to the next year.
Capital Project Funds
Capital Project Funds are used to budget and account for the acquisition or construction of facilities that would otherwise skew the annual operating budget (other than those financed by Proprietary Funds, Special Assessment Funds, and Trust Funds). Generally, capital projects include those that cost more than $250,000 and have a useful life of more than one year.
Special Purpose Local Option Sales Tax (SPLOST) Fund
The City uses one Capital project fund for its SPLOST activities. In 2013, the citizens of Chatham County and Pooler re-approved a 1% Special Purpose Local Option Sales Tax for the purpose of funding capital improvement projects. Approved projects include: streets, recreational facilities, and public safety facilities and equipment. In 2016, SPLOST revenue available did not meet the expenditure needs, which resulted in a negative fund balance. The receipt of anticipated SPLOST revenues in 2017 will increase the fund balance by over 10%. In FY 2017, the City of Pooler will finish upgrading the traffic signals on Pooler Parkway to improve traffic flow as well as construct a new intersection and traffic signal near the canal.
Capital Projects Fund
The City uses a separate Capital Projects fund for various capital improvements unrelated to SPLOST. In FY 2016 the Capital Projects Fund was used to account for the construction of a new city hall, a storage facility, traffic signal improvements at Rogers and Highway 80 as well as the purchase of land in downtown Pooler to be used for redevelopment. In FY 2017, the City plans to finish construction of city hall and the traffic signal improvements and construct a new fire station off of Jimmy Deloach Parkway.
Governmental Funds
General Fund General Fund Summary of Revenues and Expenditures General Fund Revenue Summary General Fund Revenue Detail General Fund Expenditure Summary General Fund Expenditure Detail
FUNDS, DEBT SUMMARY, AND FINANCIAL TRENDS 2017
42
Hotel Motel Fund Hotel Motel Fund Revenues and Expenditures
Confiscated Assets Fund Confiscated Assets Fund Revenues and Expenditures
Capital Projects Fund
Special Purpose Local Option Sales Tax Special Purpose Local Option Sales Tax 2017 Expenditures Capital Improvements Fund Capital projects revenue and expenditures

FUNDS, DEBT SUMMARY, AND FINANCIAL TRENDS 2017
43
Proprietary Funds
Proprietary Funds are used to account for the City’s ongoing activities which are similar to those often found in the private sector. The measurement focus (flow of economic resources) is based upon determination of net position. The City has one Enterprise Fund which falls under the category of Proprietary fund types.
Water/Sewer Fund
The Water/Sewer Fund is divided into four different departments which provide the City with safe, potable drinking water while maintaining an environmentally safe operation. The Water/Sewer Fund encompasses the Public Works Administration Department, the Wastewater Treatment Department, the Water Department and the Sewer Department.
Proprietary Funds
Water and Sewer Enterprise Fund Water and Sewer Fund Operating Revenues and Expenses
Fiduciary Funds
Fiduciary Funds are used to report assets held in a trustee or agency capacity for others and therefore cannot be used to support the government’s own programs. The Fiduciary fund category used by the City of Pooler includes one Agency Fund. GASB 34 excludes the reporting of fiduciary activities in the government-wide financial statements.
Municipal Court Agency Fund
The Municipal Court Agency Fund is used to account for, on a temporary basis, fines collected by the Municipal Court. Pooler’s share is ultimately transferred to the general fund and the balance is distributed to other governmental agencies as required by state law.
Fiduciary Fund
Municipal Court Agency Fund Court Fines and Forfeitures

FUNDS, DEBT SUMMARY, AND FINANCIAL TRENDS 2017
44
All Government Fund Types in FY 2017
Combined Statement of Budgeted Revenues, Expenditures, and Changes in Fund Balance
General Fund Confiscated Hotel/Motel SPLOST CapitalAsset Fund Fund Fund Projects Fund
Resources RevenuesTaxes 14,847,750$ 1,100,000$ -$ -$ Licenses & Permits 640,000 - - - Intergovernmental Revenues 314,270 - 3,000,000 - Charges for Services 2,267,030 - - - Fines & Forfeitures 1,177,270 - - - Investment Income 10,000 - - - Contributions & Private Donations 70,000 Other Revenues 65,649 - - - Other Financing Sources 565,080 - - 12,113,000 Total Revenues 19,957,049 1,100,000 3,000,000 12,113,000
Operating Transfers InGeneral Fund - - - 3,212,259 Hote/Motel Fund 550,000 - - - Total Transfers In 550,000 - - 3,212,259
Total Resources 20,507,049$ 1,100,000$ 3,000,000$ 15,325,259$
General Fund Confiscated Hotel/Motel SPLOST CapitalAsset Fund Fund Fund Projects Fund
Uses ExpendituresGeneral Government 1,548,688$ -$ -$ -$ 13,276,354$ Public Safety 9,458,233 - 1,372,237 400,000 Public Works 4,672,628 - 993,763 415,905 Health and Welfare 167,194 - - Recreation and Parks 1,942,642 20,000 Community Development 468,585 550,000 1,100,000 Debt Service 1,540,533 - - Total Expenditures 19,798,503 550,000 2,366,000 15,212,259
Operating Transfers OutGeneral Fund - 550,000 - 113,000 Splost Fund - - - - Capital Projects Fund 1,088,775 - - - Total Transfers Out 1,088,775 550,000 - 113,000
Total Uses 20,887,278$ 1,100,000$ 2,366,000$ 15,325,259$
Net Resources (380,229) - - 634,000 -
Beginning Fund Balance 17,419,717 945 - (913,630) 1,007,473
Ending Fund Balance 17,039,488 945 - (279,630) 1,007,473

FUNDS, DEBT SUMMARY, AND FINANCIAL TRENDS 2017
45
General Fund Statement of Revenues & Expenditures
2015 2016 2016 2017Actual Adopted Amended Adopted
Budget Budget BudgetBeginning Fund Balance 16,336,480$ 18,555,189$ 18,555,189$ 17,419,717$
ResourcesRevenue Taxes 15,127,820 14,135,600 15,210,100 14,847,750 License & Permits 767,959 577,000 751,000 640,000 Intergovernmental Revenue 832,271 417,542 788,542 314,270 Charges for Services 1,940,854 2,029,593 2,497,215 2,267,030 Fines & Forfeitures 917,245 1,168,189 861,292 1,177,270 Investment Earnings 5,970 3,000 20,000 10,000 Contributions & Donations 30,083 15,000 94,600 70,000 Miscellaneous Revenue 87,545 30,000 138,193 65,649 Total Revenues 19,709,747$ 18,375,924$ 20,360,942$ 19,391,969$
Other Financing Sources Transfer From SPLOST 221,830 561,000 - - Transfer from Capital Project - - 113,000 - Sale of Assets 46,926 - 106,000 - Capital Leases 26,801 367,202 335,202 565,080 Total Other Financing Sources 295,557$ 928,202$ 554,202$ 565,080$ Transfer in - Hotel-Motel Tax Fund 505,476 400,000 601,628 550,000
Total Resources 20,510,780$ 19,704,126$ 21,516,772$ 20,507,049$
UsesExpendituresGeneral Government 685,814$ 1,328,303$ 1,383,599$ 1,548,688$ Public Safety 8,259,463 9,078,351 9,098,621 9,458,233 Public Works 4,762,480 4,580,883 4,583,273 4,672,628 Senior Citizens 119,919 168,285 188,257 167,194 Recreation and Parks 1,256,109 1,555,416 1,693,439 1,942,642 Zoning and Inspections 541,577 588,407 534,406 468,585 Capital lease-principle 414,964 1,591,627 1,591,627 991,310 Capital lease-interest 76,071 526,949 526,949 549,223 Total Expenditures 16,116,397$ 19,418,221$ 19,600,171$ 19,798,503$
Other Financing Uses Transfer out - CIP Fund 2,175,674 2,449,905 3,242,259 1,088,775 Transfer out - Splost Fund - - - - Total Other Financing Uses 2,175,674$ 2,449,905$ 3,242,259$ 1,088,775$
Total Uses 18,292,071$ 21,868,126$ 22,842,430$ 20,887,278$
Change in Fund Balance 2,218,709$ (2,164,000)$ (1,325,658)$ (380,229)$
Ending Fund Balance 18,555,189$ 16,391,189$ 17,229,531$ 17,039,488$

FUNDS, DEBT SUMMARY, AND FINANCIAL TRENDS 2017
46
General Fund Revenue Summary
Taxes, $14,847,750
Licenses and Permits, 640,000
Intergovernmental Revenue, 314,270
Charges for Services, 2,267,030
Fines and Forfeitures, 1,177,270
Investment Income, 5,000
Contributions/Donations, …
Miscellaneous Revenue, 65,649
Other Financing Sources, 1,495,309
FY2017 General Fund Revenues "Where The Money Comes From"
2015 2016 2016 2017Actual Adopted Amended Adopted
Budget Budget BudgetTaxes 15,127,820$ 14,135,600$ 15,210,100$ 14,847,750$ Licenses and Permits 767,959 577,000 751,000 640,000 Intergovernmental Revenue 832,271 417,542 788,542 314,270 Charges for Services 1,940,854 2,029,593 2,497,215 2,267,030 Fines and Forfeitures 917,245 1,168,189 861,292 1,177,270 Investment Income 5,970 3,000 20,000 10,000 Contributions/Donations 30,083 15,000 94,600 70,000 Miscellaneous Revenue 87,541 30,000 138,193 65,649 Other Financing Sources 801,033 3,492,202 2,481,488 1,495,309
Total Revenue & OtherFinancing Sources 20,510,776$ 21,868,126$ 22,842,430$ 20,887,278$

FUNDS, DEBT SUMMARY, AND FINANCIAL TRENDS 2017
47
General Fund
Expenditure Summary
2015 2016 2016 2017Actual Adopted Amended Adopted
General Government Budget Budget BudgetGeneral Administration $685,814 $1,328,303 $1,384,279 $1,548,688Total General Government $685,814 $1,328,303 $1,384,279 $1,548,688
2015 2016 2016 2017Actual Adopted Amended Adopted
Public Safety Budget Budget BudgetPolice 4,328,723$ 4,977,807$ 4,908,077$ 4,684,339$ Fire 3,930,740 4,100,544 4,190,544 4,773,894 Total Public Safety 8,259,463$ 9,078,351$ 9,098,621$ 9,458,233$
2015 2016 2016 2017Actual Adopted Amended Adopted
Public Works Budget Budget BudgetStreet Department & Solid Waste 3,151,203 3,339,661 3,340,170 3,354,412 Storm Water Management 582,197 751,129 746,130 755,241 Facilities Maintenance 682,446 490,093 496,293 562,975 Total Public Works 4,415,846$ 4,580,883$ 4,582,593$ 4,672,628$
2015 2016 2016 2017Actual Adopted Amended Adopted
Health & Welfare Budget Budget BudgetCommunity Services-Senior Center 119,918$ 168,285$ 188,257$ 167,194$ Total Health & Welfare 119,918$ 168,285$ 188,257$ 167,194$
2015 2016 2016 2017Actual Adopted Amended Adopted
Recreation Budget Budget BudgetRecreation 1,256,107 1,555,416 1,693,439 1,942,642 Park Maintenance - - - 123,250 Total Recreation 1,256,107$ 1,555,416$ 1,693,439$ 2,065,892$

FUNDS, DEBT SUMMARY, AND FINANCIAL TRENDS 2017
48
General Fund Expenditure Summary
2015 2016 2016 2017Actual Adopted Amended Adopted
Community Development Budget Budget BudgetInspections 541,577 588,407 534,406 468,585 Total Community Development 541,577$ 588,407$ 534,406$ 468,585$
2015 2016 2016 2017Actual Adopted Amended Adopted
Debt Service Budget Budget BudgetPrincipal 414964 2118576 1591627 1540533Interest 76071 526949Other Financial Services 2175674 2449905 3242259 1088775Total Debt Service 2,666,709$ 4,568,481$ 5,360,835$ 2,629,308$
Total General Fund 18,292,071$ 21,868,126$ 22,842,430$ 20,887,278$
Total General Government, $1,548,688
Total Public Safety, $9,458,233
Total Public Works, $4,672,628
Total Health & Welfare, $167,194
Total Recreation, $1,942,642
Total Community Development,
$468,585 Total Debt Service,
$2,629,308
FY 2017 Expenditures by Function "Where The Money Goes"

FUNDS, DEBT SUMMARY, AND FINANCIAL TRENDS 2017
49
General Fund Revenue Detail
2015 2016 2016 2016 2017Actual Adopted Amended Estimated Adopted
Budget Budget Year End BudgetREVENUE
TaxesReal & Personal Property 4,467,502$ 4,300,000$ 4,450,000$ 4,433,451$ 4,400,000$ Motor Vehicle 117,972 90,000 90,000 77,721 55,000 TAVT Motor Vehicle 633,814 550,000 550,000 506,792 550,000 Mobile Home 16,424 65,000 65,000 15,278 16,000 Intangible Recording 120,599 75,000 155,000 165,704 125,000 Real Estate Transfer Tax 44,641 50,000 50,000 54,698 45,000 Utility Franchise Tax 1,666,671 1,450,000 1,688,500 1,695,763 1,650,000 Local Option Sales Tax 5,905,538 5,600,000 5,865,000 5,881,724 5,750,000 Alcoholic Beverage Excise Tax 562,200 500,000 569,000 569,229 575,000 Mixed Drink Excise Tax 97,599 90,000 110,000 110,138 114,000 Energy Excise Tax 68,174 45,000 85,000 89,963 80,000 Occupational Tax 272,694 265,000 285,000 285,556 285,000 Insurance Premium Tax 1,100,781 1,000,000 1,192,000 1,192,109 1,150,000 Financial Institution Tax 36,935 40,000 40,000 42,233 40,000 Penalty - Property Tax 15,932 15,000 15,000 5,835 12,250 Penalty - Occupational Tax 344 600 600 358 500 Total Taxes 15,127,820 14,135,600 15,210,100 15,126,552 14,847,750
Licenses & PermitsAlcoholic Beverage License 109,480 100,000 112,000 112,000 110,000 Insurance License 29,775 30,000 30,000 30,900 30,000 Zoning & Land Use Permits 38,700 40,000 62,000 63,105 43,000 Regulatory Fees - Businesses 7,138 7,000 7,000 12,537 7,000 Building Permits 582,866 400,000 540,000 535,721 450,000 Total License & Permits 767,959 577,000 751,000 754,263 640,000
Intergovernmental RevenuesFederal Grant - SAFER Grant 460,181 200,000 271,000 271,148 30,000 FBI-OT Reimbursement 1,377 1,000 1,000 3,286 1,000 FED OP & Categorical Direct 1,823 - 300,000 119,420 - Safety Grant - - - 7,000 6,000 State of Georgia - Capital 310,090 171,542 171,542 171,543 227,270 C.C. Narcotic Task Force 58,800 45,000 45,000 54,009 50,000 Total Intergovernmental Revenue 832,271 417,542 788,542 626,406 314,270

FUNDS, DEBT SUMMARY, AND FINANCIAL TRENDS 2017
50
General Fund Revenue Detail
2015 2016 2016 2016 2017Actual Adopted Amended Estimated Adopted
Budget Budget Year End BudgetCharges for ServicesW/S Cost Reimbursement - 443,693 443,693 425,000 563,530 Court Technology Fee I 53,772 40,000 40,000 60,425 53,000 Court Technology Fee II 23,011 20,000 20,000 25,740 22,500 False Alarm Fees 9,600 8,500 8,500 14,900 14,000 Indigent Defense Fee 350 - - 575 - Unicorporated Fire District 43,050 40,000 40,000 53,745 40,000 Sanitation Fees 1,436,055 1,232,500 1,533,500 1,500,739 1,271,000 Sanitation Penalty Revenue 22,903 25,000 25,000 33,355 27,000 Recycled Refuse 3,162 3,000 3,000 544 - Cart Fees 55,672 40,000 56,000 63,800 50,000 Facilities Rental Fees 29,820 20,000 20,000 23,088 30,000 Youth Tournaments 6,759 6,500 6,500 5,761 4,500 Adult Tournaments 1,447 - - - - Youth Sports 62,464 57,000 57,000 63,687 55,000 Adult Sports 2,319 - - 1,933 - Youth Classes & Camps 42,124 25,000 37,000 46,440 38,000 Adult Classes & Camps 60 - - 1,779 - Senior Citizens - Membership 1,966 1,500 1,500 2,000 1,500 Senior Citizens - Receivables 3,049 1,900 1,900 2,576 2,000 Concessions Stand 91,505 60,000 92,600 94,646 90,000 Bloomingdale for Seniors 5,040 5,000 5,000 5,148 5,000 Cemetery Lots - - - 25 - Tree Reimbursement 46,726 - 106,022 118,197 - Total Charges for Services 1,940,854 2,029,593 2,497,215 2,544,103 2,267,030 Fines & ForfeituresFines & Forfeitures 916,518 1,167,189 860,292 860,292 1,177,270 Restitution 727 1,000 1,000 - - Total Fines & Forfeitures 917,245 1,168,189 861,292 860,292 1,177,270 Investment IncomeInterest on Investments 5,970 3,000 20,000 26,392 10,000 Total Investment Income 5,970 3,000 20,000 26,392 10,000 Contributions/Private DonationsDonations - Fire & Police - - 11,600 3,000 - Donations - Sponsors 30,083 15,000 46,000 46,540 40,000 Patriot Weekend - - 37,000 37,353 30,000 Total Contributions/Private Donations 30,083 15,000 94,600 86,893 70,000 Miscellaneous RevenueLease Revenue 26,550 10,000 10,000 9,600 - Tower Lease Agreement 42,739 20,000 20,000 26,933 20,000 Insurance Proceeds - - 88,753 37,701 - GF Convenience Fee - - - 271 - Other (Sundry) 18,252 - 19,440 35,213 45,649 Total Miscellaneous Revenue 87,541 30,000 138,193 109,718 65,649 Other Financing SourcesTransfer From SPLOST 221,830 561,000 - - - Transfer from Capital Project - - 113,000 112,993 - Transfers In - Hotel & Motel 505,476 400,000 601,628 559,093 550,000 Use of Fund Balance - 2,164,000 1,325,658 - 380,229 Sale of Assets 46,926 - 106,000 156,300 - Capital Leases 26,801 367,202 335,202 334,835 565,080 Total Other Financing Sources 801,033 3,492,202 2,481,488 1,163,221 1,495,309 Total Revenue 20,510,776$ 21,868,126$ 22,842,430$ 21,297,840$ 20,887,278$

FUNDS, DEBT SUMMARY, AND FINANCIAL TRENDS 2017
51
General Fund
Largest Source of Revenue
Real & Personal Property Taxes
25%
Local Option Sales Tax32%
Charges for Services13%
Utility Franchise Taxes
9%
Fines and Forfeitures
7%
Insurance Premium Taxes
6%
All Other Revenue8%
FY 2017 Largest Sources ofGeneral Fund Revenues
Real & Personal Property Taxes Local Option Sales TaxCharges for Services Utility Franchise TaxesFines and Forfeitures Insurance Premium Taxes
2015 2016 2016 2017Actual Adopted Amended Adopted
Budget Budget BudgetReal & Personal Property Taxes 4,467,502$ 4,300,000$ 4,450,000$ 4,400,000$ Local Option Sales Tax 5,905,538 5,600,000 5,865,000 5,750,000 Charges for Services 1,940,854 2,029,593 2,497,215 2,267,030 Utility Franchise Taxes 1,666,671 1,450,000 1,688,500 1,650,000 Fines and Forfeitures 917,245 1,168,189 861,292 1,177,270 Insurance Premium Taxes 1,100,781 1,000,000 1,192,000 1,150,000 All Other Revenue 801,033 3,492,202 2,481,488 1,495,309 Total Revenue & OtherFinancing Sources 20,510,780$ 21,868,126$ 22,842,430$ 20,887,278$

FUNDS, DEBT SUMMARY, AND FINANCIAL TRENDS 2017
52
General Fund Expenditure Detail
2015 2016 2016 2016 2017Actual Adopted Amended Estimated Adopted
Budget Budget Year End BudgetGeneral Administration & LegislativeSalaries 224,820 662,196 662,876 665,663 813,158 Overtime Wages 98 200 200 953 - Group Insurance 16,062 64,660 64,660 61,173 69,768 Social Security (FICA) Contributions 987 9,388 9,388 8,237 14,193 Retirement Contributions 21,792 65,875 65,875 65,873 98,810 School Incentive Program 1,800 - - 1,800 1,800 Workers' Compensation 3,596 2,383 2,383 526 5,147 OPEB Trust 20,017 26,584 26,584 26,584 18,334 Vehicle Allowance 1,599 6,000 6,000 6,026 6,000 Total Personnel Services & Benefits 290,771$ 837,286$ 837,966$ 836,835$ 1,027,210$
Official & Managerial Services 40,820 42,000 42,000 42,200 42,000 Professional Services 11,875 24,000 24,000 8,921 10,000 Legal Services 25,725 35,000 35,000 24,395 35,000 Accounting & Audit 9,918 18,000 18,000 18,993 20,000 Engineering & Appraisal Fees 3,928 5,000 21,000 32,700 30,000 Technical Services 583 600 600 342 1,000 Computer Technical Services 14,483 23,454 23,454 22,562 22,849 Bank Charges & Adjustments 997 1,000 1,000 608 500 Beautification - 10,000 10,000 - 10,000 Repairs & Maintenance 1,740 5,550 5,550 6,353 3,000 Building Maintenance 8,539 9,000 9,000 6,616 11,500 Rental Equipment 9,428 6,300 6,300 4,443 5,900 General Insurance 12,689 16,000 16,000 12,991 14,600 Communications 53,903 43,498 41,928 49,325 40,079 Advertising 3,036 3,300 3,300 1,417 3,200 Printing & Publications 14,656 5,000 5,000 4,129 5,500 Travel & Per Diem 6,892 14,000 14,000 8,470 13,000 Expense Allowances 38,000 37,000 37,000 39,400 40,000 Dues & Subscriptions 44,123 54,400 54,400 50,809 47,700 Training & Education 3,906 11,000 11,000 9,516 11,500 Miscellaneous Purchased Services 1,415 2,000 13,600 14,799 5,000 Patriot Weekend - 25,000 36,000 48,812 45,000 Medical Expenses 80 3,000 3,000 120 2,000 Health Fair Expenses 2,079 1,250 1,250 1,959 2,000 Total Purchased & Contracted Services 308,815$ 395,352$ 432,382$ 409,880$ 421,328$
Supplies & Materials 22,604 24,000 55,808 34,009 29,000 Energy - Natural gas 488 - 374 - Energy - Electricity 12,441 12,000 22,566 25,594 16,000 Energy - Gasoline & Diesel 2,885 4,500 4,500 2,202 4,000 Miscellaneous Equipment 9,991 8,500 8,500 8,200 49,350 Uniforms - 1,100 1,300 1,391 1,500 Total Supplies & Expenditures 48,409$ 50,100$ 92,674$ 71,770$ 99,850$
Land Purchase - - 7,500 7,500 - Computer & Peripherals 37,644 45,265 28,265 13,458 - Other Agencies 175 300 300 200 300 Total Miscellaneous 37,819$ 45,565$ 36,065$ 21,158$ 300$
Total Administration 685,814$ 1,328,303$ 1,399,087$ 1,339,643$ 1,548,688$

FUNDS, DEBT SUMMARY, AND FINANCIAL TRENDS 2017
53
2015 2016 2016 2016 2017
Actual Adopted Amended Estimated AdoptedBudget Budget Year End Budget
Police DepartmentSalaries 2,110,128 2,553,429 2,492,429 2,482,457 2,592,615 Overtime Wages 27,921 32,000 72,000 99,141 20,000 Group Insurance 250,104 295,224 289,224 283,836 312,480 Social Security (FICA) Contributions 27,458 36,430 36,430 32,635 37,428 POAB Pension 9,805 13,200 13,200 11,230 13,200 Retirement Contributions 249,551 291,440 291,440 291,439 315,039 School Incentive Program 6,000 8,000 8,000 7,200 7,200 Unemployment 4,298 Workers' Compensation 102,993 122,082 122,082 101,620 114,249 OPEB Trust 122,329 119,631 119,631 119,631 93,333 Allowances - Uniforms 23,188 26,400 26,400 25,651 25,920 Total Personnel Services & Benefits 2,929,477$ 3,497,836$ 3,470,836$ 3,459,138$ 3,531,464$
Professional Services 58,801 43,000 43,000 55,020 52,000 Technical Services 1,450 2,700 2,700 660 2,500 Court Tech Expenses 53,772 - - 85,960 - Computer Technical Services 54,263 193,066 193,066 133,200 193,066 Bank Charges 6,954 - - 4,653 4,653 Repairs & Maintenance 3,814 5,000 5,000 6,038 7,500 Building Maintenance 4,680 2,500 2,500 4,755 6,600 Radar Repairs & Maintenance 2,003 2,500 2,500 2,433 2,500 Vehicle Repairs & Maintenance 17,292 6,000 12,930 11,464 12,000 Rent - Land/Buildings 116,229 129,000 129,000 125,599 - Rental Equipment 9,964 10,000 10,000 6,376 5,000 General Insurance 78,130 85,000 93,300 104,676 96,500 Communications 69,456 69,418 69,418 67,325 73,066 DUI Advertising 160 300 300 200 300 Printing & Publications 2,055 2,500 2,500 70 2,000 Travel & Per Diem 6,943 9,000 9,000 8,851 7,000 Dues & Subscriptions 926 3,000 3,000 2,139 3,000 Training & Education 4,734 10,000 10,000 5,568 10,000 Judicial Education - 2,000 2,000 325 2,000 Contract Labor 6,410 4,000 4,000 5,125 7,000 Miscellaneous Purchased Services 1,329 1,000 1,500 1,561 700
500 Medical Expenses 1,976 2,000 2,000 3,280 4,000 Investigating Expense 3,639 7,500 7,500 771 5,000 Victim Medical Costs - 2,000 2,000 - 2,000 Court Expense - Subpoena - 1,000 1,000 - 1,000 Total Purchased/Contracted Services 504,980$ 592,984$ 608,214$ 636,049$ 499,385$
Supplies & Materials 37,576 62,785 62,785 37,301 40,000 Vehicle Supplies & Materials 36,402 35,000 35,000 33,150 35,000 Energy - Electricity 24,987 22,000 22,000 39,000 10,000 Energy - GCIC Utility - - - - 750 Energy - Gasoline & Diesel 99,603 130,000 130,000 89,207 130,000 Miscellaneous Equipment 106,400 75,000 152,040 150,284 175,000 Uniforms 43,070 15,000 15,000 18,786 20,000 Patriot Weekend 8,216 - - - - Total Supplies & Expenditures 356,254$ 339,785$ 416,825$ 367,728$ 410,750$
C/O - Vehicle 445,540 367,202 367,202 360,908 218,080 C/O - Furniture/Fixtures - 45,000 45,000 35,015 - Computer & Peripheral 26,801 - - - - C/O - Other Equipment 65,221 135,000 - - 24,660 Principal - Capital Leases 174,900 - - - - Interest - Capital Leases 7,982 - - - - Total Miscellaneous 720,444$ 547,202$ 412,202$ 395,923$ 242,740$
Total Police 4,511,155 4,977,807 4,908,077 4,858,839 4,684,339

FUNDS, DEBT SUMMARY, AND FINANCIAL TRENDS 2017
54
General Fund Expenditure Detail 2015 2016 2016 2016 2017
Actual Adopted Amended Estimated AdoptedBudget Budget Year End Budget
Fire Department Salaries 2,231,826 2,475,359 2,357,359 2,350,006 2,589,137 Overtime Wages 84,261 67,600 190,600 186,266 120,000 Insurance - Group - GMA 298,522 312,504 312,504 302,450 387,672 Social Security (FICA) Contributions 31,164 35,871 35,871 33,178 37,409 Firefighters' Pension 15,750 15,000 15,000 15,050 16,000 Retirement Contributions 242,885 276,685 276,685 276,684 314,617 School Incentive Program 540 1,800 1,800 1,134 1,800 Workers' Compensation 63,448 76,758 76,758 78,985 90,994 OPEB Trust 129,002 130,708 130,708 130,708 98,333 Total Personnel Services & Benefits 3,097,398$ 3,392,285$ 3,397,285$ 3,374,461$ 3,655,962$
Professional Services 9,361 8,000 8,000 8,558 8,000 Technical Services 7,043 13,280 13,280 7,344 10,000 Computer Technical Services 11,894 20,000 20,000 13,781 30,541 Repairs & Maintenance 20,881 25,000 19,200 7,779 20,000 Building Maintenance 6,829 10,000 25,500 27,178 25,000 Vehicle Repairs & Maintenance 73,972 35,000 35,000 47,292 35,000 Rental Equipment 18,897 15,000 15,000 17,477 15,000 Insurance General 51,090 55,000 52,000 51,295 52,000 Communications 41,622 29,416 29,416 32,632 38,733 Printing & Publications 932 1,050 1,050 684 1,000 Travel & Per Diem 5,609 9,400 9,400 11,129 7,000 Dues & Subscriptions 2,089 3,000 3,000 4,159 4,500 Training & Education 14,308 15,000 15,000 10,364 15,000 Miscellaneous Purchased Services 4,933 2,500 2,500 3,359 2,500 Medical Expenses 13,687 18,000 18,000 3,724 18,000 Total Purchased/Contracted Services 283,147$ 259,646$ 266,346$ 246,755$ 282,274$
Training Supplies & Materials - 10,000 10,000 5,699 15,000 Supplies & Materials 68,019 50,000 50,000 61,593 70,000 Vehicle Materials & Supplies 35,748 20,000 20,000 27,369 20,000 Vehicle Repair Supplies - 2,500 2,500 15,238 20,000 Medical Supplies 12,820 15,345 15,345 15,981 16,000 Fire Prevention Supplies 3,283 3,500 3,500 4,892 4,700 Energy - Natural gas 1,319 1,200 1,200 - 3,500 Energy - Electricity 59,866 31,560 37,360 62,749 64,000 Energy - Gasoline & Diesel 53,520 75,850 75,850 41,803 72,058 Miscellaneous Equipment 171,925 100,000 188,000 143,224 377,900 Personal Protective Equipment - 51,474 51,474 27,584 50,000 Uniforms 45,670 29,035 29,035 29,797 34,000 Total Supplies & Expenditures 452,170$ 390,464$ 484,264$ 435,929$ 747,158$
Site Improvements - 15,500 - - 40,000 C/O - Buildings - 15,000 15,000 7,174 20,000 C/O - Machinery - 10,124 10,124 - - C/O - Vehicle 29,987 - - - - C/O - Furniture/Fixtures - 17,525 17,525 8,434 - C/O - Other Equipment 68,038 - - - 28,500 Principal - Capital Leases 237,998 - - - - Interest - Capital Leases 67,841 - - - - Total Miscellaneous 403,864$ 58,149$ 42,649$ 15,608$ 88,500$
Total Fire Department 4,236,579$ 4,100,544$ 4,190,544$ 4,072,752$ 4,773,894$

FUNDS, DEBT SUMMARY, AND FINANCIAL TRENDS 2017
55
General Fund Expenditure Detail 2015 2016 2016 2016 2017
Actual Adopted Amended Estimated AdoptedBudget Budget Year End Budget
Street DepartmentSalaries 323,411 377,791 357,791 353,776 358,476 Overtime Wages 1,503 1,500 4,000 3,969 1,000 Insurance - Group - GMA 46,731 49,028 49,028 46,911 46,344 Social Security (FICA) Contributions 3,162 5,343 5,343 3,806 5,125 Retirement Contributions 34,121 43,255 43,255 43,254 43,560 Workers' Compensation 28,908 37,795 37,795 30,249 31,742 OPEB Trust 17,793 19,939 19,939 19,939 13,333 Total Personnel Services & Benefits 455,629$ 534,651$ 517,151$ 501,904$ 499,580$
Engineering 15,044 10,000 10,000 2,320 - Property Services 194,764 330,000 443,009 679,207 230,000 Equipment Repairs & Maintenance 60 5,000 5,000 159 5,000 Vehicle Repairs & Maintenance 2,649 5,000 5,000 280 5,000 R/M - Traffic Signals 7,988 17,100 17,100 4,578 13,100 Road Repairs & Maintenance 6,020 25,000 25,000 - 25,000 Rental Equipment 13,778 7,000 2,000 - 7,000 Insurance General 11,666 12,000 12,000 10,158 12,000 Communications 2,452 2,665 2,665 2,544 2,700 Travel, Seminars & Entrt - - - - 500 Training & Education - 800 800 - - Miscellaneous Purchased Services 134,028 - 17,500 16,724 - Tree Trimming - - 7,500 57,000 25,000 Medical Expenses 508 200 200 225 - Total Purchased & Contracted Services 388,957$ 414,765$ 547,774$ 773,195$ 325,300$
S/M -Grounds Maintenance - - - 86 - Supplies & Materials 6,711 6,000 6,000 11,453 11,000 Vehicle Supplies & Materials 15,917 15,000 15,000 10,097 12,000 Paving Materials 32,138 30,000 30,000 29,430 30,000 Street Signs 4,458 5,000 5,000 5,074 5,000 Electricity -Traffic Signals 9,402 5,000 5,000 5,795 6,180 Electricity -Street Lights 499,705 500,000 500,000 537,531 552,000 Energy - Gasoline & Diesel 13,495 16,100 16,100 10,251 20,000 Miscellaneous Equipment 1,526 - - - - Uniforms 5,634 5,970 5,970 2,929 - Total Supplies & Expenditures 588,986$ 583,070$ 583,070$ 612,646$ 636,180$
C/O - Infrastructure 222,939 200,000 200,000 199,700 250,000 C/O - Machinery 35,310 15,680 15,680 15,930 - C/O - Vehicle - 22,545 22,545 22,545 34,762 PW Admin Cost Allocate - 103,950 103,950 102,667 127,390 Principal - Capital Leases - - - - - Interest - Capital Leases - - - - - Total Miscellaneous 258,249$ 342,175$ 342,175$ 340,842$ 412,152$
Solid Waste DepartmentDump Fees 32,192 30,000 5,000 3,578 - Recycling Program 7,666 7,000 7,000 2,960 1,200 Contracted Residential 1,389,956 1,398,000 1,308,000 1,305,175 1,440,000 Total Purchased/Contracted Services 1,429,814$ 1,435,000$ 1,320,000$ 1,311,713$ 1,441,200$
Carts 29,568 30,000 30,000 - 40,000 Total Supplies & Expenditures 29,568$ 30,000$ 30,000$ -$ 40,000$
Total Solid Waste Department 1,459,382$ 1,465,000$ 1,350,000$ 1,311,713$ 1,481,200$
Total Street Department 1,691,821$ 1,874,661$ 1,990,170$ 2,228,587$ 1,873,212$
Total Street and Solid Waste 3,151,203$ 3,339,661$ 3,340,170$ 3,540,300$ 3,354,412$

FUNDS, DEBT SUMMARY, AND FINANCIAL TRENDS 2017
56
General Fund Expenditure Detail
2015 2016 2016 2016 2017Actual Adopted Amended Estimated Adopted
Budget Budget Year End BudgetStorm Water DepartmentSalaries 299,352 329,059 309,059 230,905 279,959 Overtime Wages 2,154 2,400 7,400 7,062 1,200 Insurance - Group - GMA 42,662 52,320 52,320 46,328 52,128 Social Security (FICA) Contributions 3,971 4,670 4,670 4,020 4,538 Retirement Contributions 32,724 37,195 37,195 37,195 38,272 Workers' Compensation 27,155 39,046 39,046 35,272 28,104 OPEB Trust 22,242 22,154 22,154 22,154 15,000 Total Personnel Services & Benefits 430,260$ 486,844$ 471,844$ 382,936$ 419,201$
Professional Services 17,740 18,000 18,000 21,780 24,000 Repairs & Maintenance 9,877 12,800 12,800 2,303 13,000 Vehicle Repairs & Maintenance 4,887 5,000 5,000 6,862 7,000 Rental Equipment 20,088 20,000 50,000 49,543 40,000 Insurance General 10,457 11,000 9,700 9,223 10,000 Communications 3,484 3,485 3,485 3,575 3,400 Travel & Per Diem 702 750 750 - 750 Training & Education 2,006 2,000 2,000 - 1,000 Miscellaneous Purchased Services 6,425 3,000 3,000 1,793 3,000 Tree Trimming 6,000 5,000 5,000 7,000 5,000 Medical Expenses 240 200 200 150 - Total Purchased/Contracted Services 81,906$ 81,235$ 109,935$ 102,229$ 107,150$
Supplies & Materials 24,372 24,000 24,000 28,727 30,000 Paving Materials 555 1,000 1,000 - 1,000 Street Signs - 500 500 - 500 Energy - Gasoline & Diesel 25,221 35,000 15,000 13,610 35,000 Miscellaneous Equipment 3,335 2,300 2,300 - 5,000 Uniforms 5,612 4,300 4,300 3,257 5,000 Total Supplies & Expenditures 59,095$ 67,100$ 47,100$ 45,594$ 76,500$
Drainage Improvements 337 12,000 13,300 13,209 25,000 C/O - Machinery 10,599 - - - - C/O - Vehicle - - - - - PW Admin Cost Allocation - 103,950 103,951 102,667 127,390 Total Miscellaneous 10,936$ 115,950$ 117,251$ 115,876$ 152,390$
Total Storm Water Department 582,197$ 751,129$ 746,130$ 646,635$ 755,241$

FUNDS, DEBT SUMMARY, AND FINANCIAL TRENDS 2017
57
General Fund Expenditure Detail
2015 2016 2016 2016 2017Actual Adopted Amended Estimated Adopted
Budget Budget Year End BudgetFacilities Maintenance DepartmentSalaries 351,792 208,171 212,271 211,936 223,358 Overtime Wages 5,779 4,800 6,500 6,567 4,500 Insurance - Group - GMA 45,800 21,708 24,408 24,349 28,920 Social Security (FICA) Contributions 4,867 3,002 3,502 3,354 3,210 Retirement Contributions 36,121 23,835 23,835 23,834 27,141 Workers' Compensation 22,660 7,785 9,585 9,563 10,754 OPEB Trust 17,793 11,077 11,077 10,824 6,667 Total Personnel Services & Benefits 484,812$ 280,378$ 291,178$ 290,427$ 304,550$
Professional Services - - - - 35,000 Repairs & Maintenance 4,340 2,700 2,700 919 2,700 Building Maintenance 410 10,300 10,300 1,927 5,800 Vehicle Repairs & Maintenance 2,847 1,000 1,000 1,095 2,000 Rental Equipment 6,381 2,000 2,000 981 - Insurance General 12,046 11,500 11,500 7,581 7,500 Communications 4,177 4,300 4,300 3,025 3,100 Travel & Per Diem 291 1,000 1,000 746 1,500 Dues & Subscriptions 240 100 100 - - Training & Education 553 10,000 10,000 5,165 1,000 Miscellaneous Purchased Services 537 - - 43 - Medical Expenses 525 200 200 40 200 Total Purchased/Contracted Services 32,347$ 43,100$ 43,100$ 21,522$ 58,800$
S/M -Grounds Maintenance 10,267 - - - - Supplies & Materials 31,729 19,800 19,800 21,439 27,900 Vehicle Supplies & Materials 12,141 14,000 18,700 17,840 17,700 Tree Reimbursement 17,508 - - - - Energy - Gasoline & Diesel 16,259 15,200 15,200 8,445 9,000 Miscellaneous Equipment 17,597 - - 900 14,900 Uniforms 5,251 2,865 2,865 3,220 2,735 Total Supplies & Expenditures 110,752$ 51,865$ 56,565$ 51,844$ 72,235$
C/O - Machinery 3,500 - - - - C/O - Vehicles 34,118 - - - - Other Equipment 16,917 10,800 1,500 1,125 - PW Admin Cost Allocation - 103,950 103,950 102,667 127,390 Total Miscellaneous 54,535$ 114,750$ 105,450$ 103,792$ 127,390$
Total Facilities Maintenance Department 682,446 490,093 496,293 467,585 562,975

FUNDS, DEBT SUMMARY, AND FINANCIAL TRENDS 2017
58
General Fund Expenditure Detail
2015 2016 2016 2016 2017Actual Adopted Amended Estimated Adopted
Budget Budget Year End BudgetSenior Center AdministrationSalaries 53,006 65,001 65,001 57,859 70,646 Overtime Wages 391 200 200 1,076 - Insurance - Group - GMA 5,947 5,624 5,624 5,682 5,855 Social Security (FICA) Contributions 1,488 3,002 3,002 1,653 1,827 Retirement Contributions 6,544 7,441 7,441 7,440 5,264 Workers' Compensation 264 240 240 129 224 OPEB Trust 1,908 2,215 2,215 2,215 1,667 Total Personnel Services & Benefits 69,548$ 83,723$ 83,723$ 76,054$ 85,483$
Computer Technical Services 2,913 - 2,900 2,981 3,809 Repairs & Maintenance 88 1,420 1,420 1,059 1,400 Building Maintenance 8,782 9,305 13,005 13,016 17,150 Vehicle Repairs & Maintenance 57 1,000 100 100 1,000 Rental Equipment 1,338 1,548 1,548 1,387 2,300 Insurance General 2,050 2,100 2,100 1,712 1,800 Communications 1,440 - 1,850 1,858 6,047 Travel & Per Diem - 1,000 1,000 184 1,000 Dues & Subscriptions 257 505 505 441 505 Training & Education 133 - - - - Contract Labor 385 600 600 340 600 Miscellaneous 385 - 4,522 4,522 - Alarm Systems 490 684 684 1,001 1,500 Medical Expenses - 200 200 - 200 Seniors Travel Expense 1,742 5,000 5,000 3,187 5,000 Total Purchased/Contracted Services 20,060$ 23,362$ 35,434$ 31,788$ 42,311$
Supplies & Materials 10,838 7,500 7,900 9,039 14,000 Energy - Natural gas 1,002 1,400 1,400 1,207 1,400 Energy - Electricity 5,706 6,000 13,500 14,218 10,500 Energy - Gasoline & Diesel 2,123 3,800 3,800 1,624 3,500 Seniors Meals 10,641 10,000 10,000 10,218 10,000 Miscellaneous Equipment - 1,500 1,500 (120) - Total Supplies & Expenditures 30,310$ 30,200$ 38,100$ 36,186$ 39,400$
C/O - Vehicle - 31,000 31,000 31,000 - Total Miscellaneous -$ 31,000$ 31,000$ 31,000$ -$
Total Senior Center Administration 119,918$ 168,285$ 188,257$ 175,028$ 167,194$

FUNDS, DEBT SUMMARY, AND FINANCIAL TRENDS 2017
59
General Fund Expenditure Detail
2015 2016 2016 2016 2017Actual Adopted Amended Estimated Adopted
Budget Budget Year End BudgetParks & Recreation DepartmentSalaries 451,035 681,366 681,366 680,654 843,554 Overtime Wages 5,488 6,000 6,000 3,513 6,000 Insurance - Group - GMA 59,292 81,012 81,012 80,905 121,608 Social Security (FICA) Contributions 6,053 9,684 9,684 8,641 12,957 Retirement Contributions 49,290 72,397 72,397 72,397 125,955 Workers' Compensation 19,083 20,503 12,003 11,933 34,041 OPEB Trust 24,240 33,231 33,231 33,231 28,333 Total Personnel Services & Benefits 614,481$ 904,193$ 895,693$ 891,274$ 1,172,448$
Professional Services - 2,500 2,500 700 2,500 Computer Technical Services 8,714 13,217 13,217 12,200 52,329 Garbage Disposal 7,910 10,500 10,500 7,191 10,500 Repairs & Maintenance 9,587 15,500 15,500 5,699 17,700 Building Maintenance 28,000 24,500 24,500 30,184 32,600 Vehicle Repairs & Maintenance - - 5,123 6,439 5,000 Rental Equipment 5,312 3,548 3,548 4,330 6,300 Insurance General 16,413 18,000 16,700 18,533 18,000 Communications 26,709 19,095 19,095 26,560 20,463 Advertising 5,976 5,000 5,000 9,217 4,500 Printing & Publications 5,474 3,000 3,000 1,305 3,000 Travel & Per Diem 106 1,500 1,500 530 1,500 Dues & Subscriptions 611 3,555 3,555 1,154 1,875 Training & Education - 1,000 1,000 235 1,000 Contract Labor 92,330 79,600 108,600 103,631 80,500 Miscellaneous Purchased Services - - 4,200 4,022 - Alarm Systems 2,448 2,360 2,360 2,433 7,410 Tree Reimbursement Expenses - - 73,500 55,730 - Employee Screening 360 200 200 400 250 Tournament Expense 11,016 17,000 17,000 16,527 19,500 Total Purchased/Contracted Services 220,966$ 220,075$ 330,598$ 307,020$ 284,927$
Supplies & Materials 91,252 137,560 135,560 133,609 133,900 Vehicle Supplies & Materials 2,165 2,500 2,500 3,180 3,000 Awards 4,508 3,000 3,000 4,066 4,000 Energy - Natural gas 714 4,000 4,000 408 1,000 Energy - Electricity 102,831 85,000 98,000 99,950 85,000 Energy - Gasoline & Diesel 7,435 14,500 14,500 10,458 14,500 Concessions Expenses 52,002 40,000 65,000 58,291 48,500 Miscellaneous Equipment 18,511 2,310 2,310 1,435 12,900 Uniforms 2,648 4,946 4,946 4,127 6,100 Equipment & Uniforms 76,562 65,000 65,000 51,969 70,000 Total Supplies & Expenditures 358,628$ 358,816$ 394,816$ 367,493$ 378,900$
Site Improvements 13,576 - - - - C/O - Buildings - - - - - C/O - Machinery 20,494 21,400 21,400 20,669 - C/O - Vehicle - 43,090 43,090 42,960 34,762 C/O - Furniture & Fixtures 12,876 - - - - Computers & Peripherals 3,491 - - - - C/O - Other Equipment 11,595 7,842 7,842 7,842 71,605 Total Miscellaneous 62,032$ 72,332$ 72,332$ 71,471$ 106,367$
Total Recreation 1,256,107$ 1,555,416$ 1,693,439$ 1,637,258$ 1,942,642$
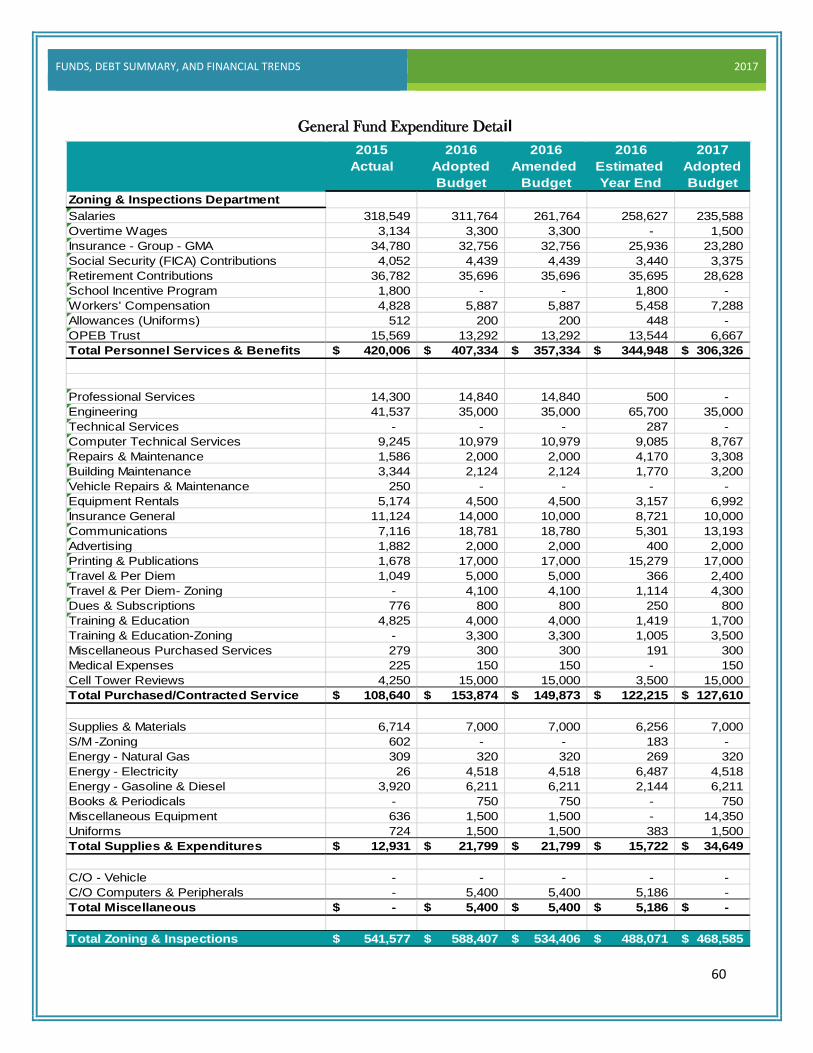
FUNDS, DEBT SUMMARY, AND FINANCIAL TRENDS 2017
60
General Fund Expenditure Detail
2015 2016 2016 2016 2017Actual Adopted Amended Estimated Adopted
Budget Budget Year End BudgetZoning & Inspections DepartmentSalaries 318,549 311,764 261,764 258,627 235,588 Overtime Wages 3,134 3,300 3,300 - 1,500 Insurance - Group - GMA 34,780 32,756 32,756 25,936 23,280 Social Security (FICA) Contributions 4,052 4,439 4,439 3,440 3,375 Retirement Contributions 36,782 35,696 35,696 35,695 28,628 School Incentive Program 1,800 - - 1,800 - Workers' Compensation 4,828 5,887 5,887 5,458 7,288 Allowances (Uniforms) 512 200 200 448 - OPEB Trust 15,569 13,292 13,292 13,544 6,667 Total Personnel Services & Benefits 420,006$ 407,334$ 357,334$ 344,948$ 306,326$
Professional Services 14,300 14,840 14,840 500 - Engineering 41,537 35,000 35,000 65,700 35,000 Technical Services - - - 287 - Computer Technical Services 9,245 10,979 10,979 9,085 8,767 Repairs & Maintenance 1,586 2,000 2,000 4,170 3,308 Building Maintenance 3,344 2,124 2,124 1,770 3,200 Vehicle Repairs & Maintenance 250 - - - - Equipment Rentals 5,174 4,500 4,500 3,157 6,992 Insurance General 11,124 14,000 10,000 8,721 10,000 Communications 7,116 18,781 18,780 5,301 13,193 Advertising 1,882 2,000 2,000 400 2,000 Printing & Publications 1,678 17,000 17,000 15,279 17,000 Travel & Per Diem 1,049 5,000 5,000 366 2,400 Travel & Per Diem- Zoning - 4,100 4,100 1,114 4,300 Dues & Subscriptions 776 800 800 250 800 Training & Education 4,825 4,000 4,000 1,419 1,700 Training & Education-Zoning - 3,300 3,300 1,005 3,500 Miscellaneous Purchased Services 279 300 300 191 300 Medical Expenses 225 150 150 - 150 Cell Tower Reviews 4,250 15,000 15,000 3,500 15,000 Total Purchased/Contracted Service 108,640$ 153,874$ 149,873$ 122,215$ 127,610$
Supplies & Materials 6,714 7,000 7,000 6,256 7,000 S/M -Zoning 602 - - 183 - Energy - Natural Gas 309 320 320 269 320 Energy - Electricity 26 4,518 4,518 6,487 4,518 Energy - Gasoline & Diesel 3,920 6,211 6,211 2,144 6,211 Books & Periodicals - 750 750 - 750 Miscellaneous Equipment 636 1,500 1,500 - 14,350 Uniforms 724 1,500 1,500 383 1,500 Total Supplies & Expenditures 12,931$ 21,799$ 21,799$ 15,722$ 34,649$
C/O - Vehicle - - - - - C/O Computers & Peripherals - 5,400 5,400 5,186 - Total Miscellaneous -$ 5,400$ 5,400$ 5,186$ -$
Total Zoning & Inspections 541,577$ 588,407$ 534,406$ 488,071$ 468,585$

FUNDS, DEBT SUMMARY, AND FINANCIAL TRENDS 2017
61
General Fund Expenditure Detail
2015 2016 2016 2016 2017Actual Adopted Amended Estimated Adopted
Budget Budget Year End BudgetDebt Service Capital Lease-Principle 415,117 1,591,627 1,591,627 1,344,102 991,310 Capital Lease-Interest 75,918 526,949 526,949 738,271 549,223 Total Debt Service 491,035$ 2,118,576$ 2,118,576$ 2,082,373$ 1,540,533$
Other Financial Uses Transfer to Capital Project 2,175,674 2,449,905 3,242,259 3,096,148 1,088,775 Transfer to Splost Fund - - - 76,042 - Total Other Financial Uses 2,175,674$ 2,449,905$ 3,242,259$ 3,172,190$ 1,088,775$
Total Debt & Other Financial Uses 2,666,709$ 4,568,481$ 5,360,835$ 5,254,563$ 2,629,308$

FUNDS, DEBT SUMMARY, AND FINANCIAL TRENDS 2017
62
Confiscated Assets Fund
Special Revenue Fund
The Confiscated Assets fund consists solely of confiscated, condemned funds released by the court system. The monies are used by the City of Pooler Police Department to purchase necessary equipment and supplies; they cannot be used for wages and benefits. Any projected fund balance automatically carries over to the next year.
Confiscated Fund 2015 2016 2016 2017Actual Adopted Estimated Adopted
Budget Year End BudgetRevenuesFines and Forfeitures 845$ Other Revenues 16,000 - Total Revenues 845
ExpendituresPublic Safety 16,000 Total Expenditures
Other Financing Sources (Uses)Transfer in - General FundTotal Other Financing Sources
Total Confiscated Expenditures
Net change in fund balanceFund balance, beginning of year 100 100 Fund Balance, end of year 100$ -$ 945$ 945$

FUNDS, DEBT SUMMARY, AND FINANCIAL TRENDS 2017
63
Hotel / Motel Tax Fund
Special Revenue Fund The Hotel/Motel Tax Fund is a special revenue fund created for the purpose of promoting tourism in the City of Pooler. Revenues for the fund are raised from a 6% hotel/motel tax placed on hotels/motels conducting business within city limits. The tax is expected to g e n e r a t e $1,100,000 in FY 2017.
Hotel/Motel Tax Fund 2015 2016 2016 2017Actual Amended Estimated Adopted
Budget Year End BudgetRevenuesHotel/Motel Taxes 1,010,946 1,100,000 1,005,672 1,100,000 Other RevenuesTotal Revenues 1,010,946 1,100,000 1,005,672 1,100,000
ExpendituresTrade Center 168,491 186,000 186,000 186,000 Pooler Chamber of Commerce 336,982 364,000 364,000 364,000 Total Expenditures 505,473 550,000 550,000 550,000
Other Financing Sources (Uses)Transfer out - General Fund 505,476 550,000 550,000 550,000
Total Hotel/Motel Expenditure 1,010,949 1,100,000 1,100,000 1,100,000
Revenue over/under expenditures - (94,328) -
Net change in fund balance 0% 0% 0% 0%Fund balance, beginning of year 0% 0% 0% 0%Fund Balance, end of year 0% 0% 0% 0%

FUNDS, DEBT SUMMARY, AND FINANCIAL TRENDS 2017
64
Capital Projects Fund
The Capital Projects Fund is used to account for financial resources to be used for the acquisition or construction of major capital projects.
Capital Improvement Projects Fund 2015 2016 2016 2017Actual Amended Estimated Adopted
Budget Year End BudgetRevenuesInterest on Investments 3,972 - 11,434 - Other Revenues 0 - - - Total Revenues 3972 0 11,434 0
Other Financing SourcesTransfer in - General Fund 2,175,674 3,212,259 3,242,420 1,088,775 Capital Leases 18,475,000 - - - Total Other Financing Sources 20,650,674 3,212,259 3,242,420 1,088,775
Total Revenue & Other Financing Sources 20,654,646 3,212,259 3,253,854 1,088,775
ExpendituresProfessional Services 390,308 200,000 148,401 Legal Fees 25,757 - 5,195 - Land Acquisition 458,217 - 212,647 - Downtown Redevelopment - 1,100,000 1,106,092 Municipal Complex-site im 82,252 212,000 54,045 Municipal Complex-c 4,652,003 12,000,000 12,866,554 Storage Building-2016 - 132,000 132,062 New City Hall Tech - 122,000 129,525 LMIG Paving 550,102 285,905 165,750 City Hall Drainage 252,703 144,000 143,175 Pedestrian Park 46,688 20,000 15,711 Rogers Street Parking Lot 461,661 - 2,302 - Rothwell Drainage 4,250 - 280 - Rogers St. Traffic Light - 130,000 140,839 688,775 Capital Outlay - Furniture/Fixtures - 466,354 519,905 Capital Outlay - Fire Station #3 - - 1,900 Capital Outlay - Fire Station #5 - 400,000 39,818 400,000 Transfer to General Fund - 113,000 112,993 Insurance Cost 308,186 - - - Total Expenditures 7,232,127 15,325,259 15,797,194 1,088,775
Net change in fund balance 13,422,519 (12,113,000) - (12,543,340) - Fund balance, beginning of year 124,095 13,546,614 13,546,614 1,007,473 Fund Balance, end of year 13,546,614 1,007,473 1,007,473 1,007,473

FUNDS, DEBT SUMMARY, AND FINANCIAL TRENDS 2017
65
SPLOST Fund
Schedule of Projects Constructed With Special Purpose Local Option Sales Tax Proceeds
SPLOST FUND Prior 2015 2016 2017 TotalProject Years Actual Projected Budget Cost
2014-2020 Referendum
RecreationFootball Stadium 12,666 2,091,242 - - 2,103,908 Football Concession/Locker Rooms - 966,588 - - 966,588 Parking Lot Expansion at Pooler Parkway - - 1,875,001 - 1,875,001
Public SafetyNew Fire Station #1 - 106,427 1,594,638 - 1,701,065 4 Fire Pumpers and 1 Ladder Truck - - 2,731,873 - 2,731,873 Debt Service for 4 Pumpers/1 Ladder Truck - - - 821,237 821,237 Debt Service for Police Department - - - 551,000 551,000
Streets and RoadsPooler Pkwy Traffic Signal Improvements - - 597,416 993,763 1,591,179
Total Expenditures 12,666 3,164,257 6,798,928 2,366,000 12,341,851

FUNDS, DEBT SUMMARY, AND FINANCIAL TRENDS 2017
66
Enterprise Fund FY 2017 Combined Statement of Budgeted
Revenues, Expenses, and Changes in Net Assets
Water and Sewer Fund
Resources RevenuesIntergovernmental Revenues -$ Charges for Services 6,602,170 Investment Income 20,000 Contributions & Donations 1,699,353 Other Revenues 139,500
Total Revenues 8,461,023
Operating Transfers InGeneral Fund 301,000
Total Transfers In 301,000
Total Resources 8,762,023$
Uses ExpendituresPersonnel Services 1,674,276 Purchased/Contractual Services 871,255 Materials and Supplies 1,425,045 Depreciation/Debt Service 4,363,746 Capital Outlay 427,701
Total Expenditures 8,762,023
Operating Transfers OutGeneral Fund -
Total Transfers Out -
Total Uses 8,762,023$
Net Assets -$
Net Assets, Beginning of Year 38,319,620$
Net Assets End of Year 38,319,620$
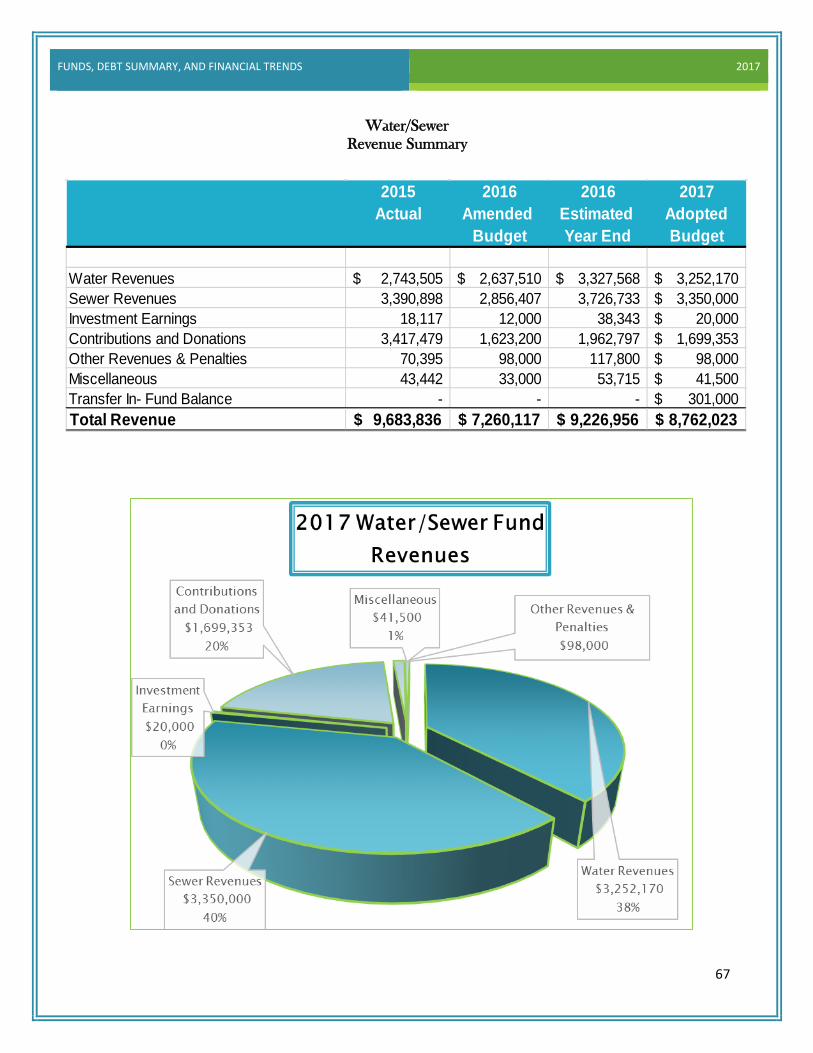
FUNDS, DEBT SUMMARY, AND FINANCIAL TRENDS 2017
67
Water/Sewer
Revenue Summary
2015 2016 2016 2017Actual Amended Estimated Adopted
Budget Year End Budget
Water Revenues 2,743,505$ 2,637,510$ 3,327,568$ 3,252,170$ Sewer Revenues 3,390,898 2,856,407 3,726,733 3,350,000$ Investment Earnings 18,117 12,000 38,343 20,000$ Contributions and Donations 3,417,479 1,623,200 1,962,797 1,699,353$ Other Revenues & Penalties 70,395 98,000 117,800 98,000$ Miscellaneous 43,442 33,000 53,715 41,500$ Transfer In- Fund Balance - - - 301,000$ Total Revenue 9,683,836$ 7,260,117$ 9,226,956$ 8,762,023$

FUNDS, DEBT SUMMARY, AND FINANCIAL TRENDS 2017
68
Water/Sewer
Expenses Summary
2015 2016 2016 2017Actual Amended Estimated Adopted
Budget Year End Budget
Public Works Administration 625,690$ 988,599$ 1,051,822$ 1,265,055$ Sewer Department 1,891,020 1,478,468 813,698 1,616,552 Wastewater Treatment Plant 1,726,080 1,709,885 1,741,406 1,734,267 Water Department 1,558,525 1,487,552 1,740,268 1,570,643 Capital Projects 162,981 2,455,506 6,376 2,575,505 Total Expenses 5,964,296$ 8,120,010$ 5,353,570$ 8,762,022$

FUNDS, DEBT SUMMARY, AND FINANCIAL TRENDS 2017
69
Significant Changes/Comments Mayor and Council approved a 2.5% automatic rate increase every January 1 for water and wastewater services in order to keep up with higher costs associated with operating and maintaining the water/sewer system, such as gasoline, electricity, and personnel costs. The City also wants to maintain a healthy operating cash reserve for emergencies. The following charts show an eleven-year history of water and sewer revenues. Due to the consistent growth in Pooler over this same time period, the revenue steadily increased. However, there was a dip in revenues between 2013 and 2015 due to corrections made to the billing system.

FUNDS, DEBT SUMMARY, AND FINANCIAL TRENDS 2017
70
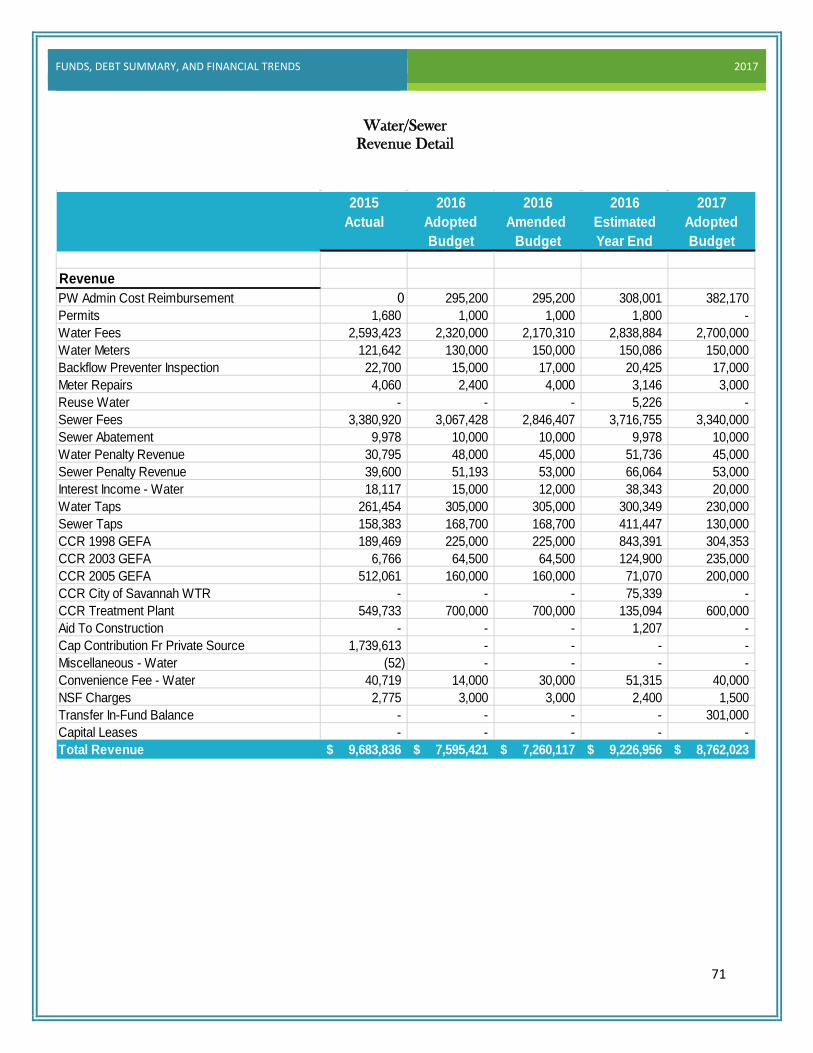
FUNDS, DEBT SUMMARY, AND FINANCIAL TRENDS 2017
71
Water/Sewer
Revenue Detail
2015 2016 2016 2016 2017Actual Adopted Amended Estimated Adopted
Budget Budget Year End Budget
RevenuePW Admin Cost Reimbursement 0 295,200 295,200 308,001 382,170 Permits 1,680 1,000 1,000 1,800 - Water Fees 2,593,423 2,320,000 2,170,310 2,838,884 2,700,000 Water Meters 121,642 130,000 150,000 150,086 150,000 Backflow Preventer Inspection 22,700 15,000 17,000 20,425 17,000 Meter Repairs 4,060 2,400 4,000 3,146 3,000 Reuse Water - - - 5,226 - Sewer Fees 3,380,920 3,067,428 2,846,407 3,716,755 3,340,000 Sewer Abatement 9,978 10,000 10,000 9,978 10,000 Water Penalty Revenue 30,795 48,000 45,000 51,736 45,000 Sewer Penalty Revenue 39,600 51,193 53,000 66,064 53,000 Interest Income - Water 18,117 15,000 12,000 38,343 20,000 Water Taps 261,454 305,000 305,000 300,349 230,000 Sewer Taps 158,383 168,700 168,700 411,447 130,000 CCR 1998 GEFA 189,469 225,000 225,000 843,391 304,353 CCR 2003 GEFA 6,766 64,500 64,500 124,900 235,000 CCR 2005 GEFA 512,061 160,000 160,000 71,070 200,000 CCR City of Savannah WTR - - - 75,339 - CCR Treatment Plant 549,733 700,000 700,000 135,094 600,000 Aid To Construction - - - 1,207 - Cap Contribution Fr Private Source 1,739,613 - - - - Miscellaneous - Water (52) - - - - Convenience Fee - Water 40,719 14,000 30,000 51,315 40,000 NSF Charges 2,775 3,000 3,000 2,400 1,500 Transfer In-Fund Balance - - - - 301,000 Capital Leases - - - - - Total Revenue 9,683,836$ 7,595,421$ 7,260,117$ 9,226,956$ 8,762,023$

FUNDS, DEBT SUMMARY, AND FINANCIAL TRENDS 2017
72
Water/Sewer Expense Detail 2015 2016 2016 2016 2017
Actual Adopted Amended Estimated AdoptedBudget Budget Year End Budget
Public Works AdministrationSalaries 410,588$ 352,001$ 248,493$ 256,521$ 298,039$ Overtime Wages 819$ 300$ 700$ 3,195$ -$ Insurance-Group-GMA 32,026 32,666 27,176 30,237 34,776 Social Security Contributions (FICA) 5,872 8,043 3,510 3,661 4,035 Retirement Plan Contributions 38,792 42,245 12,603 25,206 36,216 School Incentive Program 1,200 - - 600 1,800 Workers Comp 1,387 5,100 917 9,231 1,649 OPEB Trust 4,448 5,446 11,076 11,077 8,333 Vehicle Allowance 3,198 - - 79 - Professional Services - - 4,000 3,359 - Accounting & Audit 16,540 21,000 24,000 16,000 21,000 Engineering 256 - 1,000 2,680 5,160 Technical Services 21,619 264 300 14,430 7,036 Billing Technical Services - - - - 48,000 Computer Technical Services 28,157 63,176 86,756 99,335 46,474 Garbage Disposal 525 2,400 3,600 2,797 3,500 Repairs & Maintenance 1,089 2,820 1,200 3,744 3,100 Building Maintenance 2,534 2,725 15,000 46,792 34,800 Vehicle Repairs & Maintenance 551 - 300 226 300 Rental Equipment 2,571 3,034 2,550 2,427 2,264 General Insurance 10,869 10,500 14,000 11,722 12,000 Communications 21,254 18,936 42,450 39,750 43,483 Travel & Per Diem 1,725 1,800 4,000 611 4,900 Dues & Subscriptions 78 - - - - Training & Education 1,337 700 3,000 875 1,750 Other Purchased Services - - - 139 - Medical Expenses 40 - 200 125 - Supplies & Materials 5,618 6,000 14,800 16,111 18,000 Energy-Electricity 9,954 6,000 12,000 18,062 16,000 Energy-Gasoline & Diesel 2,486 5,000 4,400 3,913 2,760 Miscellaneous Equipment 638 2,400 5,000 3,896 8,750 Uniforms (481) 537 1,875 361 2,400 Capital Outlay - - - - 35,000 Gen Admin Cost Allocation - 443,693 443,693 424,660 563,530 Total Public Works Administration 625,690$ 1,036,786$ 988,599$ 1,051,822$ 1,265,055$
Sewer DepartmentSalaries 143,891 198,708 202,694 176,570 270,327 Overtime Wages 19,097 15,000 16,800 27,897 20,000 Insurance-Group-GMA 26,985 32,783 31,056 28,139 40,560 Social Security Contributions (FICA) 2,292 8,207 3,100 2,762 3,920 Retirement Plan Contributions 14,082 15,646 23,207 23,207 32,848 Workers Comp 3,590 2,350 3,544 3,561 8,326 OPEB Trust 13,345 13,071 13,292 13,292 10,000 Professional Services 1,553 - - - - Engineering 1,281 - - 7,064 5,000 Bank Charges and Adjustments 16,957 - - 21,628 - Repairs & Maintenance 420,158 141,000 266,600 97,280 100,000 Building Maintenance 85 500 500 1,750 500 Grinder Pump Repairs - - - - 12,900 Vehicle Repairs & Maintenance 164 5,500 4,500 - 3,500 Systems Repairs & Maintenance 118,106 35,000 75,000 60,282 75,000 Rental Equipment 321 15,000 2,500 216 2,500 General Insurance 7,216 6,500 - 10,893 11,000 Communications 2,669 2,944 425 1,554 4,200 Printing & Publications 3,791 1,000 2,500 - 1,500 Travel & Seminars 235 1,000 3,500 785 2,500 Dues & Subscriptions - - 500 49 - Training & Education 70 1,000 2,500 - 1,500 Other Purchased Services 16,293 16,000 - 7,532 - Bloomingdale Int Line 937 - - 937 - Medical Expenses 321 - - 265 - Supplies & Materials 42,571 40,000 42,000 52,141 42,000 Vehicle Supplies & Materials 6,194 11,000 5,000 5,850 6,000 Chemicals 1,221 5,000 3,500 - 2,000 System Material & Supplies 55,444 85,200 58,200 76,724 50,000 Energy-Electricity 184,667 120,000 140,000 171,427 162,000 Energy-Gasoline & Diesel 15,462 13,000 13,000 14,779 14,000 Miscellaneous Equipment 18,603 5,300 15,150 4,245 16,600 Uniforms 3,873 3,300 4,400 2,869 5,610 Capital Outlay - 444,200 - - 141,700 Depreciation 724,574 525,000 530,000 - 545,561 Debt Service 163,854 - - 128,198 - Sewer-Bad Debt 24,972 21,000 15,000 - 25,000 Total Sewer Department 2,054,874 1,784,209 1,478,468 941,896 1,616,552

FUNDS, DEBT SUMMARY, AND FINANCIAL TRENDS 2017
73
Water/Sewer Expense Detail 2015 2016 2016 2016 2017
Actual Adopted Amended Estimated AdoptedBudget Budget Year End Budget
WW Treatment PlantSalaries 332,365 326,351 359,831 340,713 326,735 Overtime Wages 10,962 13,000 12,256 31,406 18,000 Insurance - Group- GMA 34,131 38,849 36,852 35,274 34,848 Social Security Contributions (FICA) 4,453 10,229 5,246 4,892 4,738 Retirement Plan Contributions 46,715 33,390 41,200 37,765 39,703 School Incentive Program - - - 1,200 1,800 Workers Compensation 4,139 5,300 6,292 7,232 10,063 OPEB Trust 15,569 15,250 15,508 15,508 11,667 Professional Services 1,585 - - 10,317 - Engineering 9,735 - - 28,017 10,000 Lab Fees 10,314 25,800 11,600 9,029 46,938 Computer Technical Services - - 12,100 492 6,000 Repairs & Maintenance 210,618 244,600 203,600 210,752 119,500 Building Maintenance 6,144 - 1,000 250 1,000 Vehicles Repairs & Maintenance - 1,800 3,000 50 4,500 Rental Equipment 2,706 - 4,500 2,789 - General Insurance 39,483 27,850 - 38,456 42,000 Communications 6,395 2,629 5,000 8,817 13,200 Printing & Publications 3,776 1,000 1,000 - 500 Travel & Seminar 1,820 4,000 4,000 1,770 3,000 Dues & Subscriptions 630 500 500 405 1,000 Training & Education 2,338 2,500 12,000 990 5,000 Other Purchased Services 13,614 13,328 - 64,529 - Medical Expenses 325 - - 160 - Supplies & Materials 79,003 100,000 65,000 45,761 65,000 Vehicles Repairs & Maintenance 5,884 1,500 3,500 5,089 6,000 Chemicals 28,943 35,000 45,000 35,700 105,000 Laboratory Supplies 17,677 18,500 30,000 21,076 26,000 Energy - Electricity 242,972 180,000 180,500 203,437 190,000 Energy - Gasoline/Diesel 6,665 18,000 18,000 6,454 18,000 Miscellaneous Equipment 82,580 100,150 78,100 49,584 30,300 Uniforms 3,598 4,364 4,300 3,492 5,875 Depreciation 500,941 530,000 550,000 520,000 386,900 Capital Outlay - 190,800 190,800 - 201,000 Debt Service 271,010 - - 446,524 - Total WW Treatment Plant 1,997,090 1,944,690 1,900,685 2,187,930 1,734,267
Water DepartmentSalaries 259,856 263,354 271,915 298,404 317,955 Overtime Wages 19,118 20,000 20,000 28,522 20,000 Insurance - Group- GMA 38,007 38,494 31,056 38,221 46,344 Social Security Contributions (FICA) 3,880 4,109 4,120 4,466 4,584 Retirement Plan Contributions 20,953 36,527 31,132 34,566 37,428 School Incentive Program - - - - - Workers Compensation 16,211 16,300 14,896 14,343 16,249 OPEB Trust 15,569 15,250 15,508 15,508 13,333 Professional Services 8,066 - - - 5,000 Engineering 26,224 10,000 15,000 12,221 15,000 Lab Fees 19,832 10,000 21,700 19,449 19,700 Computer Technical Services 3,104 7,800 8,200 4,295 5,000 Bank Charges and Adjustments 16,885 6,000 10,000 21,628 14,000 Repairs & Maintenance 25,212 28,000 28,000 26,603 31,500 System Repairs & Maintenance 15,403 17,000 45,000 15,338 47,100 Rental Equipment 1,849 - - - - General Insurance 10,834 12,600 - 9,843 10,000 Communication 4,249 4,852 4,500 4,628 5,550 Printing & Publications - 500 600 - 600 Travel & Seminar 1,491 2,300 2,000 2,440 1,450 Dues & Subscriptions 1,319 4,600 2,300 4,144 4,600 Contract Labor - 2,900 2,900 3,335 2,900 Training & Education 1,956 2,000 1,500 - 1,200 Other Purchased Services 14,981 15,414 750 2,551 1,000 Medical Expenses 120 150 150 225 150 Supplies & Materials 37,222 50,000 45,000 37,595 45,000 Chemicals 11,172 17,200 15,400 9,102 15,400 Laboratory Supplies 1,696 2,500 2,500 11,847 4,000 Energy - Electricity 40,189 41,000 46,000 19,902 35,000 Energy - Gasoline & Diesel 16,175 25,000 - 13,561 15,000 Inv Pch For Sale - Water 378,071 400,000 400,000 608,787 370,000 Miscellaneous Equipment 1,703 3,000 3,000 - 2,100 New Water Meters 206,063 130,000 135,000 154,288 140,000 Uniforms 3,892 4,575 4,425 5,886 6,250 Depreciation 307,947 450,000 290,000 318,570 237,250 Capital Outlay - 22,545 22,545 50,000 Water - Bad Debt 29,276 25,000 15,000 - 30,000 Total Water Department 1,558,525 1,688,970 1,510,097 1,740,268 1,570,643

FUNDS, DEBT SUMMARY, AND FINANCIAL TRENDS 2017
74
Debt Summary
GEFA Loans – The City has entered into loan agreements with the Georgia Environmental Facilities Authority (GEFA), a state agency. GEFA makes low interest, long-term loans to fund improvements to publicly owned water and sewer systems.
The following schedules show the details of the City’s Long-Term Debt Service requirements to maturity:
Enterprise Funds GEFA Loans
Fiscal Year 98L66WJ 2002L33WQ 2003L42WJ 2005l23WJ CW02007P 2011L11WJ 2013L30WJ Total Debt Service
2017 249,732 50,431 228,847 177,126 855,391 76,995 240,090 1,878,612$ 2018 249,732 50,431 228,847 177,126 855,391 76,995 240,090 1,878,612$ 2019 249,732 50,431 228,847 177,126 855,391 76,995 240,090 1,878,612$ 2020 201,569 50,431 228,847 177,126 855,391 76,995 240,090 1,830,449$ 2021 50,431 228,847 177,126 855,391 76,995 240,090 1,628,880$ 2022 50,431 228,847 177,126 855,391 76,995 240,090 1,628,880$ 2023 50,431 228,847 177,126 855,391 76,995 240,090 1,628,880$ 2024 50,431 228,847 177,126 855,391 76,995 240,090 1,628,880$ 2025 37,764 228,847 177,126 855,391 76,995 240,090 1,616,213$ 2026 228,847 30,184 855,389 76,995 240,090 1,431,505$ 2027 228,847 76,995 240,090 545,932$ 2028 37,515 6,417 240,090 284,022$ 2029 - 240,090 240,090$ 2030 240,090 240,090$ 2031 240,090 240,090$ 2032 240,090 240,090$ 2033 240,090 240,090$ 2034 240,090 240,090$ 2035 240,090 240,090$ 2036 80,030 80,030$
Payments 950,765$ 441,212$ 2,554,832$ 1,624,318$ 8,553,908$ 853,362$ 4,641,740$ 19,620,136$ Less Interest 81,278 74,943 513,940 274,672 1,187,508 144,668 930,899 3,207,907
Balance 869,487 366,269 2,040,892 1,349,646 7,366,400 708,694 3,710,841 16,412,228

FUNDS, DEBT SUMMARY, AND FINANCIAL TRENDS 2017
75
GEFA Loans Debt Summary and Loan Balances

FUNDS, DEBT SUMMARY, AND FINANCIAL TRENDS 2017
76
Notes Payable – GEFA Loans On February 2, 1999, the City of Pooler entered into a loan agreement in the amount of $2,018,000 with Georgia Environmental Facilities Authority (GEFA) to finance the construction of water and sewer infrastructure in the Pine Barren Road/Quacco Road/Interstate 16 area. After scope of work changes and capitalized interest, the final amount financed is $3,000,000. The loan obligation is payable from April 2001 through October 2020 at an interest rate of 4.67%. The loan obligation payable at January 1, 2017 of $950,765 is detailed as follows:
On January 30, 2003, the City of Pooler entered into a loan agreement in the amount of $725,000 with the Georgia Environmental Facilities Authority (GEFA) to finance the wastewater improvements that included modification of pump stations and force main in order to discontinue use of the City of Savannah’s wastewater treatment plant. The final amount financed, including capitalized interest is $672,289. The loan obligation is payable from October 2005 through September 2025 at an interest rate of 4.14%. The loan obligation at January 1, 2017 of $441,212 is detailed as follows:
Loan - 98L66WJ
Fiscal Year Principal Interest Total
2017 213,662 36,070 249,732 2018 223,856 25,876 249,732 2019 234,537 15,195 249,732 2020 197,432 4,137 201,569
Total 869,487$ 81,278$ 950,765$
Loan - 2002L33WQ
Fiscal Year Principal Interest Total
2017 35,159 15,272 50,431 2018 36,723 13,708 50,431 2019 38,356 12,075 50,431 2020 40,062 10,369 50,431 2021 41,844 8,587 50,431 2022 43,706 6,725 50,431 2023 45,650 4,781 50,431 2024 47,681 2,750 50,431 2025 37,088 676 37,764 Total 366,269$ 74,943$ 441,212$

FUNDS, DEBT SUMMARY, AND FINANCIAL TRENDS 2017
77
On June 29, 2005, the City of Pooler entered into a loan agreement in the amount of $2,890,000 with Georgia Environmental Facilities Authority (GEFA) to finance the construction of water and sewer infrastructure to service the Morgan Family Tract along Pine Barren Road. The final amount financed, including capitalized interest is $3,103,709. The loan obligation is payable from March 2008 through February 2028 at an interest rate of 4.16%. The loan obligation payable at January 1, 2017 of $2,554,832 is detailed as follows: On September 8, 2005, the City of Pooler entered into a loan agreement in the amount of $2,153,000 with Georgia Environmental Facilities Authority (GEFA) to finance the construction of water and sewer infrastructure in the Key Slot area in the northernmost part of the City. The total amount financed, along with capitalized interest is $2,406,407. The loan obligation is payable from September 8, 2005 through February 8, 2029 at an interest rate of 4.14%. The loan obligation payable at January 1, 2017 of $1,624,315 is detailed as follows:
Loan - 2005L23WJ
Fiscal Year Principal Interest Total
2017 123,578 53,548 177,126 2018 128,792 48,334 177,126 2019 134,227 42,899 177,126 2020 139,890 37,236 177,126 2021 145,793 31,333 177,126 2022 151,945 25,181 177,126 2023 158,356 18,770 177,126 2024 165,038 12,088 177,126 2025 172,001 5,125 177,126 2026 30,025 159 30,184 Total 1,349,644$ 274,672$ 1,624,315$
Loan - 2003L42WJ
Fiscal Year Principal Interest Total
2017 146,722 82,125 228,847 2018 152,944 75,903 228,847 2019 159,429 69,418 228,847 2020 166,189 62,658 228,847 2021 173,236 55,611 228,847 2022 180,582 48,265 228,847 2023 188,239 40,608 228,847 2024 196,220 32,627 228,847 2025 204,541 24,306 228,847 2026 213,214 15,633 228,847 2027 222,254 6,593 228,847 2028 37,322 193 37,515 Total 2,040,892$ 513,940$ 2,554,832$
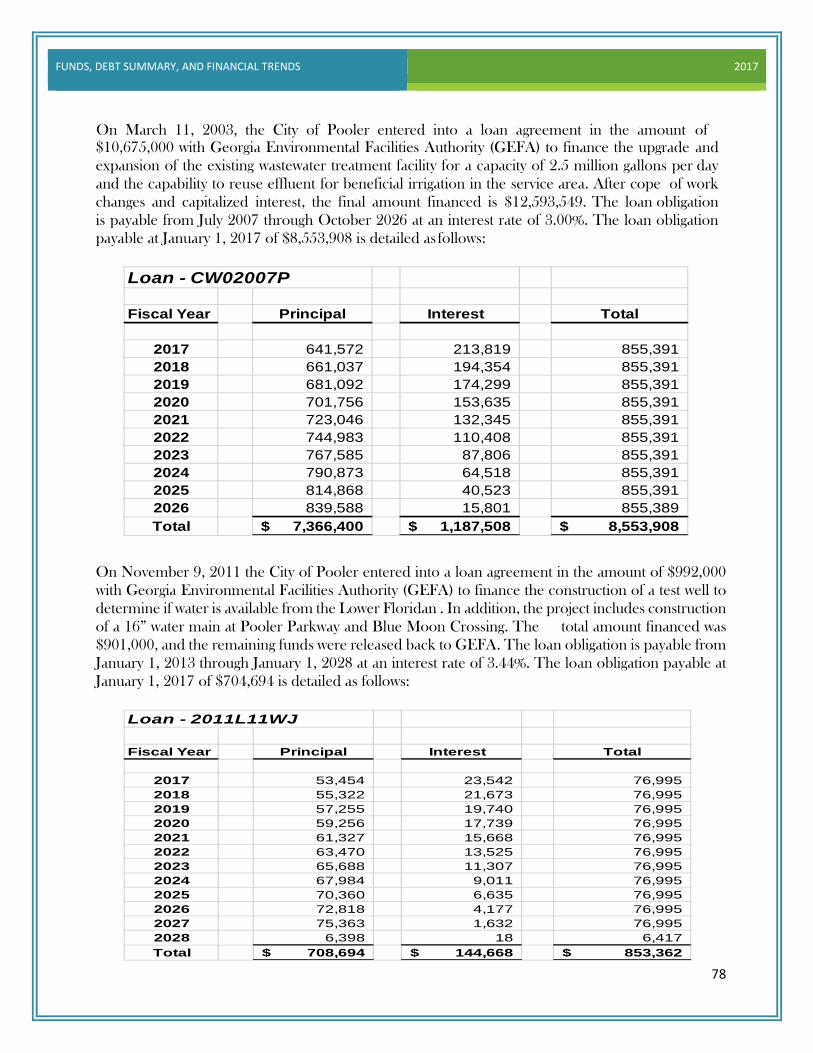
FUNDS, DEBT SUMMARY, AND FINANCIAL TRENDS 2017
78
On March 11, 2003, the City of Pooler entered into a loan agreement in the amount of $10,675,000 with Georgia Environmental Facilities Authority (GEFA) to finance the upgrade and expansion of the existing wastewater treatment facility for a capacity of 2.5 million gallons per day and the capability to reuse effluent for beneficial irrigation in the service area. After cope of work changes and capitalized interest, the final amount financed is $12,593,549. The loan obligation is payable from July 2007 through October 2026 at an interest rate of 3.00%. The loan obligation payable at January 1, 2017 of $8,553,908 is detailed as follows:
On November 9, 2011 the City of Pooler entered into a loan agreement in the amount of $992,000 with Georgia Environmental Facilities Authority (GEFA) to finance the construction of a test well to determine if water is available from the Lower Floridan . In addition, the project includes construction of a 16” water main at Pooler Parkway and Blue Moon Crossing. The total amount financed was $901,000, and the remaining funds were released back to GEFA. The loan obligation is payable from January 1, 2013 through January 1, 2028 at an interest rate of 3.44%. The loan obligation payable at January 1, 2017 of $704,694 is detailed as follows:
Loan - 2011L11WJ
Fiscal Year Principal Interest Total
2017 53,454 23,542 76,995 2018 55,322 21,673 76,995 2019 57,255 19,740 76,995 2020 59,256 17,739 76,995 2021 61,327 15,668 76,995 2022 63,470 13,525 76,995 2023 65,688 11,307 76,995 2024 67,984 9,011 76,995 2025 70,360 6,635 76,995 2026 72,818 4,177 76,995 2027 75,363 1,632 76,995 2028 6,398 18 6,417 Total 708,694$ 144,668$ 853,362$
Loan - CW02007P
Fiscal Year Principal Interest Total
2017 641,572 213,819 855,391 2018 661,037 194,354 855,391 2019 681,092 174,299 855,391 2020 701,756 153,635 855,391 2021 723,046 132,345 855,391 2022 744,983 110,408 855,391 2023 767,585 87,806 855,391 2024 790,873 64,518 855,391 2025 814,868 40,523 855,391 2026 839,588 15,801 855,389 Total 7,366,400$ 1,187,508$ 8,553,908$

FUNDS, DEBT SUMMARY, AND FINANCIAL TRENDS 2017
79
On July 21, 2014 the City of Pooler entered into a loan agreement in the amount of $3,224,884 with the Georgia Environmental Facilities Authority (GEFA) to finance the construction of a well to tap into the Lower Floridian aquifer to reduce the city’s reliance on purchased water. The city also made upgrades to 3 lift stations and the related sewer infrastructure to provide for increased development on Pooler Parkway. The loan was amended on April 28, 2015 due to additional costs. The total amount financed is $3,810,627. The loan obligation is payable from May 1, 2016 through April 1, 2036 at an interest rate of 2.4%. The loan obligation payable at January 1, 2017 of $4,641,740 is detailed as follows:
Loan - 2013L30WJ
Fiscal Year Principal Interest Total
2017 152,702 87,388 240,090 2018 156,408 83,682 240,090 2019 160,203 79,887 240,090 2020 164,091 75,999 240,090 2021 168,072 72,018 240,090 2022 172,151 67,939 240,090 2023 176,328 63,762 240,090 2024 180,607 59,483 240,090 2025 184,989 55,101 240,090 2026 189,478 50,612 240,090 2027 194,076 46,014 240,090 2028 198,786 41,304 240,090 2029 203,609 36,481 240,090 2030 208,550 31,540 240,090 2031 213,611 26,479 240,090 2032 218,794 21,296 240,090 2033 224,103 15,987 240,090 2034 229,541 10,549 240,090 2035 235,111 4,979 240,090 2036 79,631 399 80,030 Total 3,710,841$ 930,899$ 4,641,740$

FUNDS, DEBT SUMMARY, AND FINANCIAL TRENDS 2017
80
Debt Summary
Capital Leases - The City has entered into lease agreements as lessee for financing of equipment and vehicles used in governmental activities. These lease agreements qualify as capital leases for accounting purposes and, therefore, are recorded at the present value.
Capital Leases
2012-Fire 2013-Fire 2015-Police 2015-Sewer 2014-Fire 2015-Police 2016-City Hall 2016-Police 2016-Fire
Fire Station Construction
Pierce Impel Triple
Combination
9 Ford Explorers 2 Taurus
Freightliner Vactor Sewer
Cleaner
2009 Pierce Arrow XT 100'
Platform
L-3 Server -Body
Cameras
City Hall New
Construction8 Ford
Explorers5 Fire
VehiclesYearly Debt
ServiceLease Lease Lease Lease Lease Lease Lease Lease Lease Total
77,452 51,034 94,987 66,261 87,910 6,054 1,503,050 115,125 821,237$ 2,877,913 77,452 51,034 71,240 66,261 87,910 6,054 1,500,750 115,125 720,054 2,811,005 77,452 51,034 66,261 87,910 6,054 1,502,800 86,344 720,054 2,597,909 77,452 51,034 87,910 1,499,070 720,054 2,435,520 77,452 51,034 87,910 1,499,690 1,716,086 77,452 51,034 87,910 1,499,530 1,715,926 77,452 51,034 87,910 1,498,590 1,714,986 77,452 1,501,870 1,579,322 1,069 1,499,240 1,500,309
1,500,830 1,500,830 1,501,510 1,501,510 1,501,280 1,501,280 1,500,140 1,500,140 1,503,090 1,503,090
620,683 314,630 166,227 198,784 615,370 18,163 21,011,440 316,593 2,981,400 26,455,825 76,396 42,611 2,612 8,211 73,805 2,125 3,586,440 4,923 249,527 4,049,412
544,288$ 357,240$ 163,615$ 190,573$ 541,564$ 16,038$ 17,425,000$ 311,670$ 2,731,873$ 22,406,414$

FUNDS, DEBT SUMMARY, AND FINANCIAL TRENDS 2017
81
Capital Leases Debt Summary and Loan Balances

FUNDS, DEBT SUMMARY, AND FINANCIAL TRENDS 2017
82
Fire Station Construction Lease In 2012, the City of Pooler constructed a Fire Station through Georgia Municipal Association (GMA) Bricks and Mortar program in the amount of $880,000 which is financed through BB&T Governmental Finance. The financed amount is payable from February 2012 through February 2025 at an interest rate of 3.26%. The loan obligation payable at January 1, 2017 of $620,683 is detailed as follows:
Fire Department Vehicle Lease
On March 21, 2013, the City of Pooler entered into a lease-purchase agreement in the amount of $429,178 with PNC Finance to purchase a 2013 Pierce Impel Triple Combination Fire Truck. The financed amount is payable from March 2013 through March 2023 at an interest rate of 3.28%. The loan obligation payable at January 1, 2017 of $357,240 is detailed as follows:
Construction of Fire Station- BB&T 9910001296-00008February 8, 2012 - $880,000.00
Fiscal Year Principal Interest Total2017 60,442 17,010 77,452 2018 62,437 15,015 77,452 2019 64,497 12,955 77,452 2020 66,625 10,826 77,452 2021 68,824 8,628 77,452 2022 71,095 6,356 77,452 2023 73,442 4,010 77,452 2024 75,865 1,587 77,452 2025 1,060 9 1,069 Total 544,288$ 76,396$ 620,683$
2013 Pierce Impel Triple Comb. -Fire Truck- PNC 172768000March 21,2013- $429,178.00
Fiscal Year Principal Interest Total2017 40,714 10,320 51,034 2018 42,050 8,984 51,034 2019 43,429 7,605 51,034 2020 44,854 6,181 51,034 2021 46,325 4,710 51,034 2022 47,844 3,190 51,034 2023 49,414 1,621 51,034 Total 314,630$ 42,611$ 357,240$

FUNDS, DEBT SUMMARY, AND FINANCIAL TRENDS 2017
83
Police Department Vehicle Lease On September 25, 2014, the City of Pooler entered into a lease-purchase agreement in the amount of $367,410 with BB&T Governmental Finance to purchase 9 Ford Explorers and 2 Taurus. The financed amount is payable from September 25 through January 2018 at an interest rate of 1.59%. The loan obligation payable at January 1, 2017 of $166,227 is detailed as follows:
Sewer Department Equipment Lease
On November 17, 2014, the City of Pooler entered into a lease-purchase agreement in the amount of $309,575 with BB&T Governmental Finance to purchase a 2015 Freightliner Vactor Sewer Cleaner. The financed amount is payable from November 17 through January 2019 at an interest rate of 2.62%. The loan obligation payable at January 1, 2017 of $198,784 is detailed as follows:
2015 Freightliner Vactor Sewer Cleaner-Sewer Dept.-BB&T 9910001296-00016November 17,2014- $309,575.00
Fiscal Year Principal Interest Total2017 61,873 4,388 66,261 2018 63,510 2,751 66,261 2019 65,190 1,071 66,261 Total 190,573$ 8,211$ 198,784$
9 Explorers & 2 Taurus-Police Dept.-BB&T 9910001296-00015September 25,2014- $367,410.32
Fiscal Year Principal Interest Total2017 92,938 2,049 94,987 2018 70,677 563 71,240 Total 163,615$ 2,612$ 166,227$

FUNDS, DEBT SUMMARY, AND FINANCIAL TRENDS 2017
84
Fire Department Vehicle Lease
On March 7, 2014, the City of Pooler entered into a lease-purchase agreement in the amount of $675,000 with PNC Finance to purchase a 2009 Pierce Arrow XT 100’ Platform. The financed amount is payable from March 2014 through January 2023 at an interest rate of 3.3%. The loan obligation payable at January 1, 2017 of $615,370 is detailed as follows:
Police Department Equipment Lease
On May 7, 2015, the City of Pooler entered into a lease-purchase agreement in the amount of $26,800 with Fleetwood Finance to purchase an L-3 Server for downloading of body cameras. The financed amount is payable from May 2015 through January 2019 at an interest rate of 4.20%. The loan obligation payable at January 1, 2017 of $18,163 is detailed as follows:
2009 Pierce Arrow XT 100' Platform-Fire Dept. -PNC 180/05000March 7, 2014- $675,000.00
Fiscal Year Principal Interest Total2017 70,038 17,872 87,910$ 2018 72,350 15,560 87,910$ 2019 74,737 13,173 87,910$ 2020 77,203 10,706 87,910$ 2021 79,751 8,159 87,910$ 2022 82,383 5,527 87,910$ 2023 85,102 2,808 87,910$ Total 541,564$ 73,805$ 615,370$
L-3 Server-Body Cameras- Police Dept.- Fleetwood Leasing May 7,2015- 26,800.88
Fiscal Year Principal Interest Total2017 5,014 1,041 6,054 2018 5,339 715 6,054 2019 5,685 369 6,054 Total 16,038$ 2,125$ 18,163$

FUNDS, DEBT SUMMARY, AND FINANCIAL TRENDS 2017
85
City Hall New Construction In 2016, the City of Pooler constructed a New City Hall through Georgia Municipal Association (GMA) Bricks and Mortar program in the amount of $18,475,000 which is financed through Ameris Bank Financing. The financed amount is payable from January 2016 through January 2030 at an interest rate of 2.60%. The loan obligation payable at January 1, 2017 of $21,011,440 is detailed as follows:
2016 City Hall New Construction-Ameris Bank 07554000545-00101January 1,2016- $18,475,000.00
Fiscal Year Principal Interest Total2017 1,050,000 453,050 1,503,050 2018 1,075,000 425,750 1,500,750 2019 1,105,000 397,800 1,502,800 2020 1,130,000 369,070 1,499,070 2021 1,160,000 339,690 1,499,690 2022 1,190,000 309,530 1,499,530 2023 1,220,000 278,590 1,498,590 2024 1,255,000 246,870 1,501,870 2025 1,285,000 214,240 1,499,240 2026 1,320,000 180,830 1,500,830 2027 1,355,000 146,510 1,501,510 2028 1,390,000 111,280 1,501,280 2029 1,425,000 75,140 1,500,140 2030 1,465,000 38,090 1,503,090 Total 17,425,000$ 3,586,440$ 21,011,440$
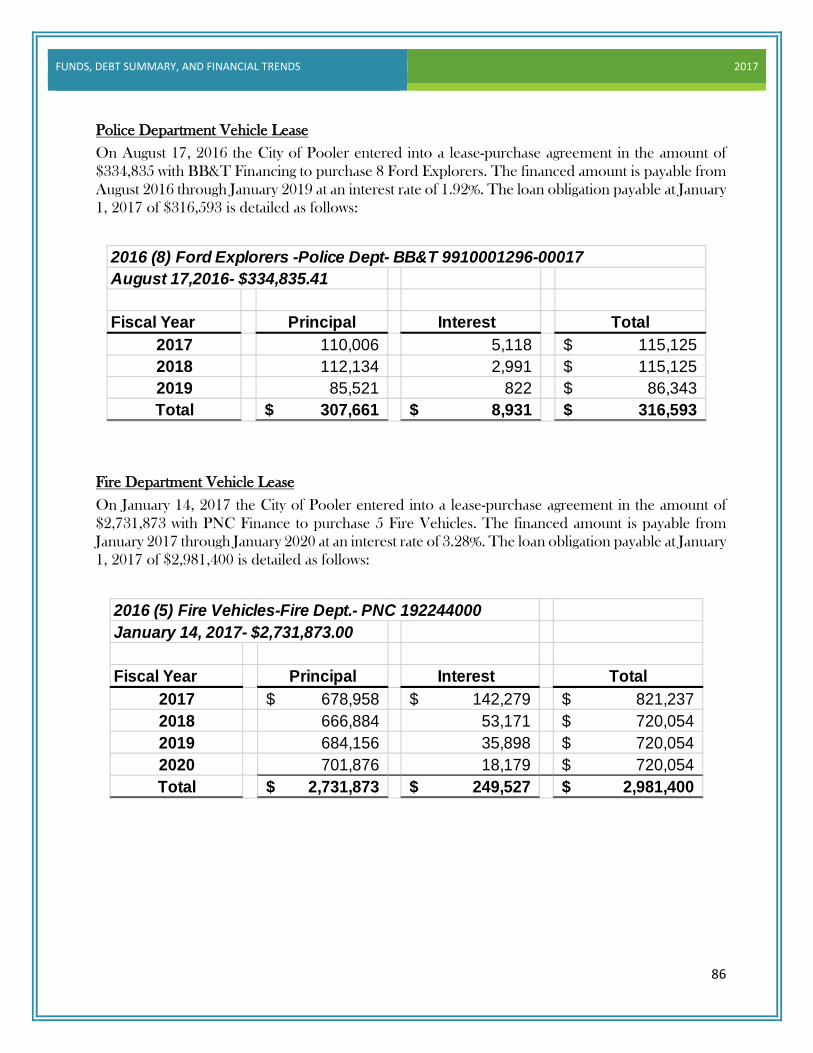
FUNDS, DEBT SUMMARY, AND FINANCIAL TRENDS 2017
86
Police Department Vehicle Lease On August 17, 2016 the City of Pooler entered into a lease-purchase agreement in the amount of $334,835 with BB&T Financing to purchase 8 Ford Explorers. The financed amount is payable from August 2016 through January 2019 at an interest rate of 1.92%. The loan obligation payable at January 1, 2017 of $316,593 is detailed as follows:
Fire Department Vehicle Lease
On January 14, 2017 the City of Pooler entered into a lease-purchase agreement in the amount of $2,731,873 with PNC Finance to purchase 5 Fire Vehicles. The financed amount is payable from January 2017 through January 2020 at an interest rate of 3.28%. The loan obligation payable at January 1, 2017 of $2,981,400 is detailed as follows:
2016 (8) Ford Explorers -Police Dept- BB&T 9910001296-00017August 17,2016- $334,835.41
Fiscal Year Principal Interest Total2017 110,006 5,118 115,125$ 2018 112,134 2,991 115,125$ 2019 85,521 822 86,343$ Total 307,661$ 8,931$ 316,593$
2016 (5) Fire Vehicles-Fire Dept.- PNC 192244000January 14, 2017- $2,731,873.00
Fiscal Year Principal Interest Total2017 678,958$ 142,279$ 821,237$ 2018 666,884 53,171 720,054$ 2019 684,156 35,898 720,054$ 2020 701,876 18,179 720,054$ Total 2,731,873$ 249,527$ 2,981,400$

FUNDS, DEBT SUMMARY, AND FINANCIAL TRENDS 2017
87
Financial Trends Financial trends offer a practical approach for monitoring the economic health of the City. This trend summary provides a global view of the past and present financial resources of the City.
General Fund Resources
Total General Fund resources appropriated in the FY 2017 budget are slightly less than FY 2016 due to less dependence on the fund balance for capital projects. General Fund resources available to the City of Pooler in FY 2017 include operating revenues of $19,391,969 and transfers in from the Hotel/Motel Fund of $550,000 and Capital Leases in the amount of $565,080 as well as $380,229 from the fund balance. The largest sources of General Fund resources are Real and Personal Property Taxes - $4,400,000, Local Option Sales Tax (LOST) - $5,750,000, Charges for Services - $2,267,030, Utility Franchise Taxes - $1,650,000, and Fines and Forfeitures - $1,177,270. Insurance Premium Taxes - $1,150,000 is also a large revenue source. Other minor taxes and other revenues round out the diverse financial resource streams within the General Fund.

FUNDS, DEBT SUMMARY, AND FINANCIAL TRENDS 2017
88
Real & Personal Property Tax
The City of Pooler charges Real and Personal Property taxes which are collected by the Chatham County Tax Commissioner and remitted each month to the city. The current millage rate is 3.909 mills. The City relies on these taxes to ensure a high quality of services to the citizens. This source of revenue has increased over the years due to significant growth in Pooler, which has ensured financial stability for the City and its citizens. Property Tax revenue accounts for roughly 25% of General Fund resources. The City expects to receive $4,400,000 in tax revenues in FY 2017.
Local Option Sales Tax
The Local Option Sales Tax Revenue is another revenue source the City relies on to ensure the ability to deliver a high quality of service to the citizens. This source of revenue accounts for roughly 32% of General Fund resources. The City expects to receive $5,750,000 in LOST funds in FY 2017. Trend analysis, estimated growth in the number of retail commercial businesses and observation of local retail business conditions are the primary means of forecasting this revenue source.

FUNDS, DEBT SUMMARY, AND FINANCIAL TRENDS 2017
89
Excise Taxes
Taxes in the excise tax category include: Franchise Taxes (Electric, Gas, Television Cable, and Telephone), Alcoholic Beverage Taxes, Local Option Mixed Drink Taxes, Business and Occupation Taxes, Insurance Premium Tax, and Financial Institution Tax. In FY 2017 the City expects to garner $3,814,000 which accounts for 20% of General Fund resources. Forecasted similarly to the sales tax, excise tax revenues are directly related to the health of the local economy.
Licenses and Permits
Licenses and Permits revenues are comprised of regulatory fees, alcoholic beverages licenses, non-business licenses and permits, and various other permits. The City projects these revenues will bring in $640,000 in FY 2017. Trend analysis and anticipated construction starts are the primary forecasting tools used for this revenue stream. Since the sharp decline in License and Permit fees that occurred in 2009, this revenue source jumped back to pre-recession levels and has remained steady.

FUNDS, DEBT SUMMARY, AND FINANCIAL TRENDS 2017
90
Intergovernmental Revenues Intergovernmental Revenue received by the City of Pooler often fluctuate from year to year to the inconsistent nature of the sources. During the past 8 years, the City has received grant funding to assist with staffing in the fire department, to purchase new fire equipment, as well as DOT funding for road improvements and traffic signals. The City is also reimbursed by Chatham County for one police officer on the Counter Narcotics Team (CNT). The City’s General Fund is expected to receive $314,270 in FY 2017 in intergovernmental revenue.
Charges for Services
The City charges fees for several of the services it provides to its citizens. Some examples of such fees are recreation sign-up fees, solid waste pick-up fees, and unincorporated fire district fees. Based on trend analysis and a slight increase in certain fees charged by the Recreation Department, the City projects these revenues to bring in $2,267,030. This represents an increase of 12% from the FY 2016 Amended Budget.

FUNDS, DEBT SUMMARY, AND FINANCIAL TRENDS 2017
91
Fines and Forfeitures Fines and Forfeitures are projected to garner a total of $1,177,270 in FY 2017. This represents a slight increase of 1%, or $9,081, under the FY 2016 Amended Budget. Trend analysis is the primary means of forecasting this revenue source.
Investment Income
Due to the health of the economy and raising interest rates, the amount of revenue generated by investment income is beginning to increase after the 2008-2009 recession.

FUNDS, DEBT SUMMARY, AND FINANCIAL TRENDS 2017
92
Other Revenues
The City has certain revenues that do not fit in any of the other categories. These revenue sources are grouped together in the Other Revenues source and may include use of fund balance or transfers from other funds.
General Fund Balance
In November 2011, the City revised its fund balance policy to conform to the Governmental Accounting Standards Board (GASB) Statement 54. This new policy will allow the City the flexibility it needs to operate efficiently, and at the same time, it will provide enough reserves to operate during emergency situations.
SPLOST Funds
The Special Purpose Local Option Sales Tax (SPLOST) is approved in five to six year intervals through popular vote by the citizens of Chatham County. The purpose of the 1% SPLOST tax is to provide revenue to local governments for capital projects. The FY 2017 budget includes revenue from the 2014 SPLOST to fund improvements to the recreation complex on Pooler Parkway, traffic signal upgrades on Rogers Street at Highway 80, and debt service for a portion of the new city hall building where the police department is now housed.

2017
CITY OF POOLER
ESTABLISHED 1907
PERSONNEL SUMMARY

PERSONNEL SUMMARY 2017
93
Personnel Summary Dedicated Service
The City of Pooler is committed to a level of excellence in the quality and delivery of all programs and services. In the FY 2017 Approved Budget, 194 full-time employees a r e approved to meet the daily needs of our citizens and visitors. These employees preserve our public safety, ensure our water is clean and available upon demand, preserve our economic well-being by attracting businesses and supporting commerce, maintain our streets and other infrastructure, protect our homes and businesses, provide our youth and seniors with quality programs, and handle the numerous daily duties necessary in the delivery of services to its citizens.
12015 Actual 1892016 Actual 1942017 Adopted 194
186187188189190191192193194195
No.
of F
ull-T
ime
Empl
oyee
s
Personnel Summary
Department 2015 Actual 2016 Actual 2017 AdoptedGeneral Administration 9 13 13Police 50 55 55Fire 59 57 57Public Works Administratio 5 5 5Street Department 8 8 8Storm Water Department 10 8 8Facilities Maintenance 9 5 5Senior Center 1 1 1Parks and Recreation 12 17 17Zoning and Inspections 6 4 4Wastewater Treatment 7 7 7Water 7 8 8Sewer 6 6 6Total Full-Time Employees 189 194 194

PERSONNEL SUMMARY 2017
94
Highlights Over half of the employees of the City provide direct service to the citizens of Pooler. As shown in the chart above, the Fire Department makes up 29% of the total workforce. The Police Department employs the next largest portion of the City’s workforce with 28%.
In FY 2017, the City is making a commitment to keep staffing levels at a minimum. Only those positions that are vacated and are necessary will be filled by the City.
City Functions
The City groups the various services provided by its employees into five functional areas: General Government, Public Safety, Public Works, Community Development, and Utility Services. Each of these areas includes departments and/or divisions as needed to provide the necessary supervisory support in the development and delivery of related programs and services.
General Administration
7%
Police28%
Fire29%
Public Works Administration
3%Street Department
4%
Storm Water4%
Facilities Maintenance3%
Senior Center0% Parks and
Recreation9%
Zoning and Inspections
2%
Wastewater Treatment
4%Water
4%Sewer
3%
FY 2017 Full-Time Personnel by Department

PERSONNEL SUMMARY 2017
95
CITY FUNCTIONSBY
DEPARTMENT & DIVIISIONS
GENERAL GOVERNMENT
EXECUTIVE
FINANCE
HUMAN RESOURCES
IT & IS
PUBLIC SAFETY
POLICE
FIRE
PUBLIC WORKS
STREETS
STORM WATER
FACILITIES MANTENACE
HEALTH & WELFARE
COMMUNITY SERVICES
RECREATION
RECREATION
PARK MAINTENANCE
COMMUNITY DEVELOPMENT
ZONING & INSPECTION
UTILITY SERVICE
WATER & SEWER
SANITATION

PERSONNEL SUMMARY 2017
96
Employee Benefits
The FY 2017 budget for Personnel Services funds the salary and fringe benefits package offered to all employees. The Personnel Services budget also reflects the funds appropriated to implement a human resource system with its primary goal to establish an environment which affords each employee the opportunity to be as productive as possible. This goal is met through human resource planning, recruitment and selection, orientation, employee services, benefits administration, performance appraisal, wage and salary administration, and pension plan administration. The City of Pooler provides a total benefit package that includes the following:
Salaries Paid Time Off Holiday Pay Group Term Life Insurance Group Health and Dental Ins. Short Term Disability
Worker’s Compensation Ins. Defined Benefit Retirement Plan Defined Contribution Plan Medical Flexible Spending Acct. Educational Assistance Work-Life Balance
The most valuable resources of any municipality are its employees, as they play a crucial role in accomplishment of the aims and objectives of the City. Therefore, the focus of the Human Resources Department is to deal with the manpower and all the decisions related to it that have an impact on productivity. One area of that focus – employee compensation and benefits management – is of primary importance to the City’s ability to attract and retain the best of the available workforce.

PERSONNEL SUMMARY 2017
97
Paid Time Off
The City of Pooler provides paid time off (PTO) for personal use to all regular, full-time employees. Time accrued in the PTO system can be used for time off due to an illness, vacation time or other personal leave time. PTO is accrued based on number of hours actually worked in a pay period and number of years of service. Employees may carry the balance of their PTO bank over into new calendar years; however, they may not accrue more than the total annual amount allotted for their years of service.
2912 – 24 Hour 2184 – 12 Hour
Shift Firefighters Shift Police Officers
2 0.05769 120 (15 days) 168 (7 days) 126 (10.5 days)
5 0.07692 160 (20 days) 224 (9.33 days) 168 (14 days)
9 0.09615 200 (25 days) 280 (11.67 days) 210 (17.5 days)
14 0.11538 240 (30 days) 336 (14 days) 252 (21 days)
15 + 0.13462 280 (35 days) 392 (16.33 days) 294 (24.5 days)
Total Annual PTO Hours Earned by Number of Hours Worked per Year
Completed Years of Service
Amount Accrued per Hour
2080 – 40 Hours per week

PERSONNEL SUMMARY 2017
98
Holidays
It is the policy of the City to designate and observe certain days each year as holidays. Eligible employees will be given a day off and still receive pay for eight hours for each holiday observed. Shift employees that may be required to work on a holiday will be paid eight hours of holiday pay for all city holidays in addition to any pay they receive for working on the holiday.
The schedule of holidays the City will observe during the calendar year is as follows:
New Year’s Day Thanksgiving Day Martin Luther King, Jr. Birthday (observed) Day After Thanksgiving Memorial Day Christmas Day Independence Day Day After Christmas Labor Day New Year’s Eve Veterans Day
Group Term Life Insurance
The City currently provides life insurance for all full-time regular employees at a rate of 1 times their annual salary. Employees may also receive coverage in the amount of $5,000 for a spouse and $2,500 for each dependent child less than 21 years of age. Coverage becomes effective on the first day of the month following 30 days of employment. This coverage is provided at no cost to the employee.
Group Health Insurance
The City of Pooler offers regular full-time employees medical and dental coverage. Currently, the City has three different plans to choose from: a Preferred Provider Organization (PPO), a Health Maintenance Organization (HMO), or a Point of Service (POS) plan. In 2017, the City of Pooler will contribute up to the cost of Employee-Only coverage with the PPO for each eligible employee no matter which plan or dependent coverage they choose. Employees are responsible for dental premiums for all types of plans and coverage’s. Following are the monthly premiums for each health plan offered by the City of Pooler in 2017:
HMO PPO POSEmployee Only $464 $498 $367Employee + Spouse $928 $996 $743Employee + Child(ren) $881 $947 $698Family Coverage $1,392 $1,493 $1,100

PERSONNEL SUMMARY 2017
99
Worker’s Compensation and Short Term Disability
To assist employees with medical expenses and a possible loss of income due to a work-related injury, the City provides all employees with Worker’s Compensation insurance. If an employee is out of work for longer than a week as a result of a work-related injury, worker’s compensation will pay 66 2/3% of his or her average weekly earnings each week until the employee is able to return to work.
The City of Pooler also provides short-term disability insurance to all regular full- time employees at no cost to the employee. The weekly benefit amount is 60% of an employee’s earnings.
Retirement Savings Plans
The City offers two different retirement savings vehicles for employees: a Defined Benefit plan and a Defined Contribution plan. Participation in the Defined Contribution plan is voluntary while the Defined Benefit plan is mandatory for all full-time regular employees.
Defined Benefit Retirement Plan
The City’s Defined Benefit retirement plan is administered by the Georgia Municipal Employee Benefit Services (GMEBS). Participation in the plan occurs immediately. Employees contribute 2%-4% of their earnings depending on when they were hired through a payroll deduction and become vested after 5 years of service. The City’s retirement plan also offers a long-term disability benefit as well as a death benefit.
Upon retirement, vested employees will receive a monthly benefit based on:
Years of Service Average gross earnings for the five highest paid consecutive years
Defined Contribution Plan
The City offers employees the opportunity to participate in a 457 defined contribution plan administered by Newport Group in conjunction with the Georgia Municipal Association. Through tax-deferred payroll deductions, employees may elect to contribute up to the current IRS limits established for defined contribution plans.
PERSONNEL SUMMARY 2017
100
Medical Flexible Spending Account
The City offers employees the opportunity to participate in a flexible spending account which allows them to save a predetermined amount to be used for out- of-pocket medical expenses. Payroll deductions are taken out on a pre-tax basis and held for use over each calendar year. Currently, employees may elect to defer up to $2,000.00 each year.
Educational Assistance
The City of Pooler recognizes that the skills and knowledge of its employees are critical to the success of the City. The Tuition Reimbursement Program encourages personal development through formal education so employees can further their career with the City by attaining higher level positions that provide an increased challenge.
Work-Life Balance The City of Pooler understands the importance of striking a healthy work-life balance for its employees. In 2012, the City added an Employee Assistance Program (EAP) to its benefit package to help achieve this goal.
The EAP is sponsored by Guardian Insurance and gives employees unlimited access to consultants by telephone, resources and tools online and up to three face-to-face visits with counselors for help with a short-term problem. The program also allows for a free, 30 minute in-person and telephonic legal consultation with a local attorney.
With all of the turmoil facing our society, the City felt it had an obligation to equip its employees with the tools needed to navigate through any difficult times they may encounter.

2017
CITY OF POOLER
ESTABLISHED 1907
DEPARTMENTAL SUMMARIES

DEPARTMENTAL SUMMARIES 2017
101
The City of Pooler provides services to citizens and visitors on a daily basis. The direct provision of said services and the support functions are organized into five functions: General Government, Public Safety, Public Works, Recreation, and Community Development. The City departments are funded by the General Fund; therefore, departments are listed within one of the five functions. Consequently, the FY 2017 department summaries will be listed according to funding source.
General Fund Functions:
General Government Public Safety Public Works Recreation Community Development
City of Pooler General Fund

DEPARTMENTAL SUMMARIES 2017
102
General Government Function
General Government Function is comprised of departments and divisions responsible for the management of the City’s resources. This function includes the following departments and divisions: Executive, Information Technology/Information Systems, Finance, and Human Resources.
General Government Function Organization Chart

DEPARTMENTAL SUMMARIES 2017
103
General Government Short Term Priorities & Goals Priorities:
To work with the Mayor and Council to provide necessary resources to develop programs that will enhance the quality of living in the City.
To monitor operations of city’s departments to see that services are provided in the most efficient and cost effective manner.
To submit proposals for grants that would provide funds for projects that would allow for infrastructure improvement.
To monitor city financial data to see that revenues and expenditures are within budget limits set by Mayor and Council.
To ensure integrity of financial reporting through use of internal controls and sound accounting principles.
Goals:
To continually be in compliance with all state and federal regulations. To provide opportunities for staff development in order to better serve the citizens of the
City. To provide City services at the highest level possible. To continually monitor growth in residential as well as commercial areas.
Long Term Priorities & Goals
Priorities:
To develop quality programs, for the improvement and expansion of City Service delivery, that complies with the vision of Mayor and Council.
To offer a work environment which allows the City to attract and retain quality employees.
Focus on quality customer service in all contacts with citizens and customers. Goals:
To utilize plans, studies, projections, and reports as a guide to formulate long term plans both programmatic and financial, in order to effectively handle the growth forecasted for the City.
To use new information technologies to develop cost effective means of interactive communications between staff and citizens.
To continue to use volunteer boards to their fullest extent.

DEPARTMENTAL SUMMARIES 2017
104
General Administration Department Mission Statement
The General Administration Department is led by the City Manager who provides leadership, vision, and direction to City Service Areas, implements City Council policy, and works with the Mayor, City Council, and administrative staff to craft strategic and financial planning objectives. Within this department, there are three separate and distinct functional units; Finance, Human Resources and Information Technology. The Finance Department is a resource service to the City of Pooler, and its mission is to manage the financial affairs of the City which includes the efficient and judicious use of available City resources and the stewardship of public funds. Policy and programs ideas are developed by Mayor and Council, and the Finance Department is responsible for creating a budget that allows for those ideas to be carried out. The Finance Officer has oversight responsibility for all accounting personnel.
Department Description
The General Administration Department is made up of the City Manager and his staff and is responsible for the executive management of the highly diverse operations of the City. The City Manager is appointed by the Mayor and Council and serves as Pooler’s Chief Executive Officer.
The City Manager serves in a highly visible capacity as an ambassador for the community and to other governmental agencies. Duties include:
Oversees the day-to-day functions of the City. Supervises city departments and their personnel. Presents information and recommendations to enable the Mayor/City Council to make
decisions on matters of policy. Responds promptly and positively to all requests of citizens. Disseminates information regarding City activity. Provides input on regional and state issues which affect the City of Pooler. Maintains a sound fiscal position for the City through the preparation of the annual budget. Provides continuous monitoring of financial conditions of the City.
The Finance Department is a coordinated team which provides outstanding professional services to all our customers. This department promotes sound financial practices to ensure that the City's assets are safeguarded and the use of City resources is responsive to community priorities. Public confidence in the fiscal affairs of the City of Pooler is integral to our mission.

DEPARTMENTAL SUMMARIES 2017
105
The responsibility of the Finance Department is to promote the fiscal soundness of the City so that its social, public safety, infrastructure and life quality obligations will be maintained at the level required and desired by the community. This Department is responsible for reporting the City's financial condition in an accurate and timely manner. The Finance Department is also responsible for processing and recording all monies received by the City, completing bi-weekly payroll, as well as ensuring all accounts payable payments are processed in a timely and accurate manner.
The annual budget for the City is first developed in the Finance Department and then reviewed by the City Manager before it is presented to Mayor and Council for approval. The Finance Department is responsible for assisting the City Manager, Mayor, City Council, and City agencies in the allocation of resources through financial planning, management information, and budget preparation in accordance with State and Local laws.
The next unit General Administration structure is the Human Resource Department. The Human Resource (HR) Department supports each City Department in the hiring and onboarding of new employees. This Department provides timely support for human resource inquiries and general employment related requests. The HR department provides support, direction, and counseling to Department Heads, supervisors and employees concerning employee relations, performance and disciplinary issues. This Department employs a Human Resources Director under the direction of the City Manager and an HR Coordinator.
Finally, the Information Technology (IT) Department employs an IT Director and an IT Coordinator who together are responsible for the maintenance of all hardware and software for the City of Pooler. This department provides technical support that meets the internal customers’ requirement while adhering to Department and Enterprise standards and policy. The IT Director maintains the working functionality of the City’s computer network and ensures the integrity of all city technical processes and procedures.
Budget Highlights
In the FY 2017 Budget, General Administration Department expenditures total $1,548,688, an increase of 12% or $172,841 over actual expenditures in the FY 2016 Budget. The increase in the proposed budget is a result of general growth in operations due to the new City Hall, such as additional custodial staff, increase in electricity costs, etc.

DEPARTMENTAL SUMMARIES 2017
106
General Administrative FY 2017 Expenditure Summary
General Administrative Personnel Schedule
2015 2016 2017 Pay StatusClassification Actual Actual Adopted BudgetMayor 1 1 1 ElectedCouncil 6 6 6 ElectedClerk of Council 1 1 1 ExemptTotal Legislative 8 8 8
2015 2016 2017 Pay StatusClassification Actual Actual Adopted BudgetCity Manager 1 1 1 ExemptFinance Officer 1 1 1 ExemptAccounting Clerk 1 1 1 Non-ExemptFinance Coordiantor 0 1 1 Non-ExemptPurchasing Agent 1 1 1 Non-ExemptServices Clerk 1 1 1 Non-ExemptHuman Resources Director 1 1 1 ExemptHuman Resources Coordinator 0 1 1 Non-ExemptI/T Director 1 1 1 ExemptI/T Support Assistant 1 1 1 Non-ExemptAdministrative Coordiantor 0 1 1 Non-ExemptCustodian 0 1 1 Non-ExemptTotal General Administration 8 12 12
Total General Administration & Legislative 16 20 20
2015 2016 2016 2017Actual Amended Estimated Adopted
Expenditure Category Budget Year End BudgetPersonnel Services Total 290,771$ 837,966$ 836,835$ 1,027,210$ Purchased &Contracted Services Total 308,815 432,382 409,880 421,328 Supplies Expenditures Total 48,409 92,674 71,770 99,850 Miscellaneous Total 37,819 36,065 21,158 300 Total General Administration 685,814$ 1,399,087$ 1,339,643$ 1,548,688$

DEPARTMENTAL SUMMARIES 2017
107
General Administrative Detailed Personnel Costs
Goals and Objectives for FY 2017: Fiscally-sound and Efficient Government: Continue to evaluate and prioritize services. Seek innovative solutions to maintain high
quality core services, promote financial transparency and protect Pooler’s financial position and quality of life.
Maintain Pooler’s fiscal health by crafting long-term revenue and expenditure plans to ensure sustainable operations at fair and equitable rates.
Streamline business processes through the use of technology and website enhancements to
decrease costs and eliminate duplicate efforts. Evaluate community trends and consider associated facility and service needs.
Provide an attractive work environment and promote employee excellence. Provide technical assistance/guidance for effectively interacting with advancing technologies and
continued development of efficient delivery systems to the external customer. Continue to electronically engage residents of our community in their own governance by
keeping the City’s website and mobile app current. Research new technologies to reduce cost and give a higher level of service.
Submit FY 2017 Budget to GFOA in anticipation of receiving the Distinguished Budget
2015 2016 2016 2017Actual Amended Estimated Adopted
Expenditure Category Budget Year End BudgetPersonnel Costs and Employee BenefitsSalaries 224,820 662,196 665,663 813,158 Overtime Wages 98 200 953 - Subtotal 224,918$ 662,396$ 666,616$ 813,158$
Group Insurance 16,062 64,660 61,173 69,768 Social Security (FICA) Contributions 987 9,388 8,237 14,193 Retirement Contributions 21,792 65,875 65,873 98,810 School Incentive Program 1,800 - 1,800 1,800 Workers' Compensation 3,596 2,383 526 5,147 OPEB Trust 20,017 26,584 26,584 18,334 Vehicle Allowance 1,599 6,000 6,026 6,000 Subtotal 65,853$ 174,890$ 170,219$ 214,052$
Total Personnel Services 290,771$ 837,286$ 836,835$ 1,027,210$

DEPARTMENTAL SUMMARIES 2017
108
Presentation Award. Submit FY 2016 Comprehensive Annual Financial Report (CAFR) to GFOA in anticipation
of receiving the Certificate of Achievement for Excellence in Financial Reporting. Continue to provide monthly financial statements to the Mayor, Council, and public.
Strengthen internal auditing procedures
1. Continue to audit all petty cash on a monthly basis. 2. Continue to audit Water/Sewer accounts on a monthly basis to ensure accounts are
set up properly 3. Review all areas where cash is collected to ensure proper checks and balances are
in place. 4. Develop a control list for each department’s assets under the $10,000 threshold
for capitalization.
Support each City Department in the hiring and onboarding of new employees. Human Resources will also provide timely support for HR inquiries and general employment related requests.
Ensure employee relations are maintained. Provide support, direction, and counseling to
Department Heads, supervisors and employees concerning employee relations, performance and disciplinary issues. Continue to provide assistance with coaching and counseling; allegations of misconduct; assistance with general employee relations issues such as difficult work relationships, interpersonal problems between and among employees of the same or different levels, concerns about treatment, etc.
Provide support of the City’s diversity outreach efforts - creating a respectful workplace and
valuing differences and oversight for all equal opportunity employment, compliance requirements, and reporting.
Ensure the City's compensation and benefit plans are competitive; enhance the City’s
ability to attract, retain, employees and continue to provide excellent services that are within the City’s funding constraints. Continue to conduct labor market salaries survey and explore all options available concerning health insurance and retirement plan benefits. Continue to help employees balance their work and personal life by sponsoring health and financial wellness informational seminars.
Ensure timely compliance of workplace policy and procedures with federal and state legislative
mandates; maintain safe work practices; and communicate policy and procedural changes and safety procedures to employees through ongoing training sessions.

DEPARTMENTAL SUMMARIES 2017
109
Economic Growth: Continue to carefully consider land use related to development and redevelopment to ensure a
well planned community. Protect the City’s Infrastructure Investment and Assets: Ensure that the City can protect and enhance the useful life of streets and utilities. Continue to
monitor financial resources and economic conditions, and consider timing with regard to infrastructure needs. Evaluate and implement street pavement management plan to maintain and improvement City streets.
Proactive Public Safety and Code Enforcement Initiatives: Continue proactive policing strategies using technology and collaboration to protect and
enhance livability. Build on the successes of fire prevention and fire service programs for a safe community.
2016 Accomplishments: Awarded GFOA’s Certificate of Achievement for Excellence in Financial Reporting for
FY2015. Received Water First designation from the Georgia Department of Community Affairs.

DEPARTMENTAL SUMMARIES 2017
110
Public Safety Function The Public Safety function incorporates those departments responsible for ensuring the safety of all residents and visitors to the City. This function encompasses two departments: Police and Fire. The Police Department is composed of 3 divisions: Administrative Services, Uniform Patrol, and the Criminal Investigation. The Fire Department consists of two divisions: Fire Protection and Fire Safety.
Public Safety Function
Organization Chart

DEPARTMENTAL SUMMARIES 2017
111
Public Safety Short Term Priorities & Goals: Priorities:
To ensure law enforcement personnel and firefighters receive the proper training and materials to conduct their jobs in the safest manner possible.
To update equipment as needed and specified by manufacturers’ guidelines.
To annually recertify all firefighters of core competencies and skills set forth by Georgia Firefighter’s Training Specifications.
Goals:
To continue educational and training opportunities for employees.
To provide law enforcement personnel and firefighters with the equipment needed to perform their duties as new technology becomes available and cost-effective.
To continually ensure the Internal Investigation division has the tools necessary to perform their duties efficiently and effectively.
Long Term Priorities & Goals: Priorities:
To promote the safety and security of the community through tough proactive law enforcement operations and strategies.
To ensure acceptable response times through the acquisition of additional personnel, equipment and satellite locations as required by the continuing growth of the City.
To promote fire safety and prevention education to the community through tough proactive prevention strategies.
Goals:
To provide employees with the equipment and information necessary to complete their jobs and engage in proactive law enforcement and fire prevention strategies.
To maintain adequate building space and geographical locations to ensure acceptable response times.
To maintain enough equipment for all personnel in order to handle immediate growth within the City to maintain response times.

DEPARTMENTAL SUMMARIES 2017
112
Police Department
Mission Statement The Pooler Police Department’s mission is to protect life and property through the maintenance of peace and order, and the provision of law enforcement services. The Pooler Police Department represents all citizens and our belief in equal treatment under the law is sincere. We shall enforce the law impartially without regard to race, creed, color, sex, national origin, or situation in life and shall be diligent in protecting all citizens in the lawful exercise of their civil rights.
Department Description
The Pooler Police Department is comprised of three divisions. The Administrative Division is responsible for records, training, Municipal Court, and GCIC operations. The Patrol Division is responsible for all uniformed patrol and traffic operations, and the Criminal Investigations Division is responsible for investigating criminal activity, evidence custody, and asset forfeiture. The department operates twenty-four hours per day, seven days per week to provide quali ty and responsive law enforcement support for the City of Pooler.
Budget Highlights
In the FY 2017 Budget, Police expenditures total $4,684,340, a decrease of 3% or $162,154 from actual expenditures in FY 2016. The decrease is due to a lesser need to replace patrol vehicles in FY 2017.
Police Department FY 2017 Expenditure Summary
2015 2016 2016 2017Actual Amended Estimated Adopted
Expenditure Category Budget Year End BudgetPersonnel Services Total 2,929,477$ 3,470,836$ 3,459,138$ 3,531,464$ Purchased &Contracted Services Total 504,980 608,214 636,049 499,385 Supplies Expenditures Total 356,254 416,825 367,728 410,750 Miscellaneous Total 720,444 412,202 395,923 242,740 Total Police Department 4,511,155$ 4,908,077$ 4,858,839$ 4,684,339$

DEPARTMENTAL SUMMARIES 2017
113
Police Department Personnel Schedule
Police Department Detailed Personnel Cost
2015 2016 2017 Pay StatusClassification Actual Actual Adopted BudgetChief of Police 1 1 1 ExemptCaptain 0 1 1 ExemptLieutenant 2 1 1 ExemptSergeant 4 9 9 Non-ExemptInvestigator 3 3 3 Non-ExemptCorporal 5 6 6 Non-ExemptAdministrative Supervisor 0 1 1 Non-ExemptCertification Manager 1 1 1 Non-ExemptAdvanced Patrol Officer 7 4 4 Non-ExemptPatrol Officer 13 23 23 Non-ExemptCourt Clerk 1 1 1 Non-ExemptAssistant Court Clerk 1 1 1 Non-ExemptRecords Clerk 3 3 3 Non-ExemptTotal Police 41 55 55
2015 2016 2016 2017Actual Amended Estimated Adopted
Expenditure Category Budget Year End BudgetPersonnel Costs and Employee BenefitsSalaries 2,110,128 2,492,429 2,482,457 2,592,615 Overtime Wages 27,921 72,000 99,141 20,000 Subtotal 2,138,049$ 2,564,429$ 2,581,598$ 2,612,615$
Group Insurance 250,104 289,224 283,836 312,480 Social Security (FICA) contributions 27,458 36,430 32,635 37,428 POAB Pension 9,805 13,200 11,230 13,200 Retirement contributions 249,551 291,440 291,439 315,039 School Incentive program 6,000 7,200 Unemployment - 8,000 4,298 7,200 Workers' Compensation 102,993 122,082 101,620 114,249 OPEB Trust 122,329 119,631 119,631 93,333 Allowances - Uniforms 23,188 26,400 25,651 25,920 Subtotal 791,428 906,407 877,540 918,849 Total Personnel Services 2,929,477$ 3,470,836$ 3,459,138$ 3,531,464$
DEPARTMENTAL SUMMARIES 2017
114
Goals and Objectives for FY 2017:
Fiscally-sound and Efficient Government: Improve response capabilities and preparation for foreseeable major incidents
Successfully completion of scheduled audits by external agencies, including; GCIC Audit of
departmental record keeping and warrant handling, and missing persons and stolen property reporting. Also, a thorough multi-day agency wide audit of policies and practices by Georgia Associations of Chiefs of Police State Accreditation Committee.
Proactive Public Safety and Code Enforcement Initiatives:
Continue our core mission of providing a safe and secure environment for our residents and
visitors on a twenty four hour a day, seven days a week, and three hundred and sixty five days a year schedule.
Improve community relations and positive presence by attending several community events, school functions, and neighborhood watch meetings.
Reduce traffic accidents and fatalities through better data collection and analysis and
concentrated selective enforcement in the areas that warrant extra efforts. Improve professionalism and accountability through implementation of a Professional
Standards Officer who will conduct thorough background checks and investigate all serious allegations and complaints on personnel.
Continue to promote Pooler Police through participation and interagency cooperation by supporting local public safety organizations including; SETEN (Southeast Traffic Enforcement Network), MJIA (Multi-jurisdictional Investigators Association), Crime stoppers, SARIC and by providing officers to teach recruits at the local police academies.
Continue to contest the negative effects of the economic woes through expanding Code
Enforcement efforts, including combating neighborhood degradation through revamping our sign ordinance, condemning derelict properties and abandoned vehicles and other conditions leading to blight.
2016 Accomplishments:
Improved community relations and positive presence by attending several community events, school functions, and neighborhood watch meetings.
Developed and improved our firearms range to enhance officers training and reduce liability.
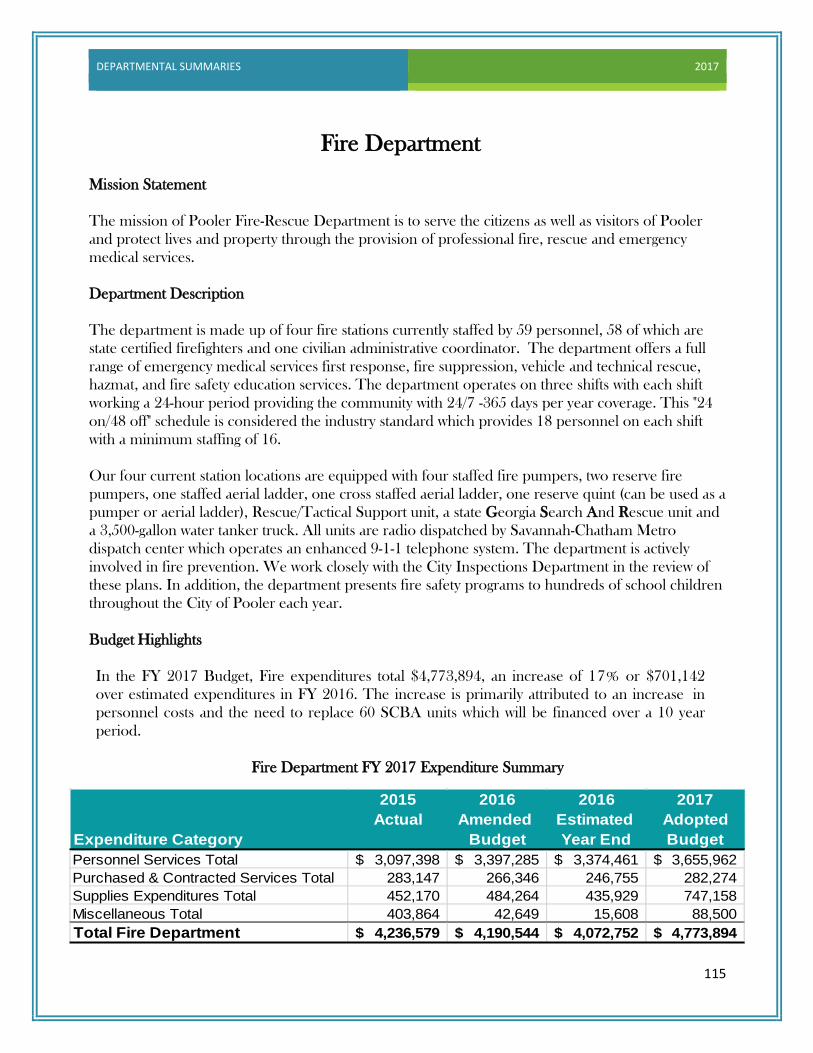
DEPARTMENTAL SUMMARIES 2017
115
Fire Department Mission Statement The mission of Pooler Fire-Rescue Department is to serve the citizens as well as visitors of Pooler and protect lives and property through the provision of professional fire, rescue and emergency medical services. Department Description The department is made up of four fire stations currently staffed by 59 personnel, 58 of which are state certified firefighters and one civilian administrative coordinator. The department offers a full range of emergency medical services first response, fire suppression, vehicle and technical rescue, hazmat, and fire safety education services. The department operates on three shifts with each shift working a 24-hour period providing the community with 24/7 -365 days per year coverage. This "24 on/48 off" schedule is considered the industry standard which provides 18 personnel on each shift with a minimum staffing of 16. Our four current station locations are equipped with four staffed fire pumpers, two reserve fire pumpers, one staffed aerial ladder, one cross staffed aerial ladder, one reserve quint (can be used as a pumper or aerial ladder), Rescue/Tactical Support unit, a state Georgia Search And Rescue unit and a 3,500-gallon water tanker truck. All units are radio dispatched by Savannah-Chatham Metro dispatch center which operates an enhanced 9-1-1 telephone system. The department is actively involved in fire prevention. We work closely with the City Inspections Department in the review of these plans. In addition, the department presents fire safety programs to hundreds of school children throughout the City of Pooler each year. Budget Highlights In the FY 2017 Budget, Fire expenditures total $4,773,894, an increase of 17% or $701,142 over estimated expenditures in FY 2016. The increase is primarily attributed to an increase in personnel costs and the need to replace 60 SCBA units which will be financed over a 10 year period.
Fire Department FY 2017 Expenditure Summary
2015 2016 2016 2017Actual Amended Estimated Adopted
Expenditure Category Budget Year End BudgetPersonnel Services Total 3,097,398$ 3,397,285$ 3,374,461$ 3,655,962$ Purchased & Contracted Services Total 283,147 266,346 246,755 282,274 Supplies Expenditures Total 452,170 484,264 435,929 747,158 Miscellaneous Total 403,864 42,649 15,608 88,500 Total Fire Department 4,236,579$ 4,190,544$ 4,072,752$ 4,773,894$

DEPARTMENTAL SUMMARIES 2017
116
Fire Department Detailed Personnel Schedule
Fire Department Detailed Personnel Cost
2015 2016 2017 Pay Actual Budget Adopted Status
Classification Budget BudgetFire Chief 1 1 1 ExemptDeputy Fire Chief 1 1 1 ExemptTraining/Safety Chief 1 1 1 ExemptCaptain/Shift Commander 3 3 3 ExemptLieutenant 9 9 9 Non-ExemptFire Apparatus Operator 0 0 0 Non-ExemptFirefighter II 22 23 29 Non-ExemptFirefighter I 18 19 13 Non-ExemptEmergency Vehicle Technician 1 1 1 Non-ExemptFire Administrative Coordinator 1 1 1 Non-ExemptTotal Fire 59 59 59
2015 2016 2016 2017Actual Amended Estimated Adopted
Expenditure Category Budget Year End BudgetPersonnel Costs and Employee BenefitsSalaries 2,231,826 2,357,359 2,350,006 2,589,137 Overtime Wages 84,261 190,600 186,266 120,000 Subtotal 2,316,087$ 2,547,959$ 2,536,272$ 2,709,137$
Insurance - Group - GMA 298,522 312,504 302,450 387,672 Social Security (FICA) Contributions 31,164 35,871 33,178 37,409 Firefighters' Pension 15,750 15,000 15,050 16,000 Retirement Contributions 242,885 276,685 276,684 314,617 School Incentive Program 540 1,800 1,134 1,800 Workers' Compensation 63,448 76,758 78,985 90,994 OPEB Trust 129,002 130,708 130,708 98,333 Subtotal 781,311 849,326 838,189 946,825 Total Personnel Services 3,097,398$ 3,397,285$ 3,374,461$ 3,655,962$

DEPARTMENTAL SUMMARIES 2017
117
Goals and Objectives for FY 2017: Fiscally-sound and Efficient Government:
Continue to have no loss of life or serious injury from a fire related incident. Continue to keep fire-related property & contents losses under 1.0% of the appraised value of
the property. Proactive Public Safety and Code Enforcement Initiatives:
Continue to stress fire prevention through annual pre-fire planning of businesses. Continue to stress fire prevention through visits to public schools, daycare facilities and
businesses within the City. Continue to stress early detection of fire through distribution of residential smoke alarms to
residents in need. Continue to properly train firefighters to stress safety in their work. Continue to pursue grants and develop additional funding strategies as an alternative
source of funding for needed capital items. Develop and implement additional funding strategies to protect the department from
material financial loss. Enhance the staffing levels of the department to provide the safest most efficient level of
operations within the growing city. Begin implementing processes and programs in an effort to maintain the current ISO
Class 3 Rating. Develop plan to reduce rating to a Class 2. Provide professional, safe, and efficient emergency response while expanding the
department. Expand/ and/or fully utilize technology to enhance the efficiency of fire department
operations. 2016 Accomplishments:
Absorbed a call volume increase of over 11%, without further resources being required.
Managed transition of Mega-site area to County fire district. Implemented and received an annual fire/rescue fee for service.
Replaced all frontline fire apparatus on 4 engines and 1 aerial ladder truck which came in under budgeted amount.
Developed and initiated an automatic fire response with Garden City (sister city) increasing service levels to both cities.
Conducted first Emergency Medical Technician Class in house, increasing level of care provided to the citizens and visitors of the city.

DEPARTMENTAL SUMMARIES 2017
118
Public Works Function
Public Works provides community services enhancing the quality of life for the citizens of Pooler while protecting the environment by ensuring safe and clean neighborhoods and public places. Departments within Public Works that are accounted for in the General Fund include Streets and Road, Storm Water Management, and Facilities Maintenance. Solid Waste pickup and removal is contracted out to a private firm and is managed through the Street Department.
Public Works Function Organization Chart

DEPARTMENTAL SUMMARIES 2017
119
Public Works
Short Term Priorities & Goals
Priorities:
Protect the City’s investment by maintaining its infrastructure and public facilities. Maintain the cleanliness and aesthetics of the City’s rights-of-way. Ensure that development within the City meets current design criteria and standards
through the prompt, efficient and accurate review of plans and studies. Promote and retain a competent and well-trained staff dedicated to servicing the needs of
residents and businesses. Goals:
Continually review and revise as needed the City’s design criteria, specifications, and standard details to reflect current industry standards.
Demonstrate a commitment to excellence in customer services through improved access to information, friendly service and prompt responses.
Improve efficient and cost effective use of the City’s resources. Long Term Priorities & Goals Priorities:
Anticipate future needs and plan for maintenance and improvements to ensure the City’s requirements and expectations for minimum standards and specifications for public infrastructure are met.
Promote and retain a competent and well-trained staff dedicated to servicing the needs of residents and businesses.
Goals:
Demonstrate a commitment to excellence in customer services through improved access to information, friendly service and prompt responses.
Improve efficient and cost effective use of the City’s resources. Continually review and revise as needed, the City’s design criteria, specifications, and
standard details to reflect current industry standards.

DEPARTMENTAL SUMMARIES 2017
120
Street and Solid Waste Department
Mission Statement The mission of the Street Department is to provide the most cost effective infrastructure and services possible while ensuring residents are able to live their lives and conduct business in a safe, healthy, and environmentally sound manner, in a community they can be proud of.
Department Description The Street Department is a division of the Public Works Department and is responsible for the maintenance of the City’s street and traffic control devices. The Street Department ensures that all Erosion and Sediment Control best practices are adhered to according to City and State Specifications.
Budget Highlights In the FY 2017 Budget, Street Department expenditures total $3,354,412 a decrease of 5.25% or $185,888 under the FY 2016 Estimated Year End due to a decrease in the cost of the city’s contract for roadside mowing and maintenance.
Street/Solid Waste Department FY 2017 Expenditure Summary
Street/Solid Waste Department FY 2017 Personnel Schedule
2015 2016 2017 Pay StatusClassification Actual Actual Adopted BudgetSuperintendent 1 1 1 UnclassifiedHeavy Equipment Operator 1 1 1 ClassifiedCrew Leader 1 1 1 ClassifiedMaintenance Worker 3 3 3 ClassifiedLaborer I 1 1 1 ClassifiedSign Technician 1 1 1 ClassifiedTotal Drainage 8 8 8
2015 2016 2016 2017Actual Amended Estimated Adopted
Expenditure Category Budget Year End BudgetPersonnel Services Total 455,629$ -$ 501,904$ 499,580$ Purchased & Contracted Services Total 388,957 - 773,195 325,300 Supplies Expenditures Total 588,986 583,070 612,646 636,180 Miscellaneous Total 258,249 342,175 340,842 412,152 Solid Waste Department 1,459,382 1,350,000 1,311,713 1,481,200 Total Street Department 3,151,203$ 2,275,245$ 3,540,300$ 3,354,412$

DEPARTMENTAL SUMMARIES 2017
121
Street/Solid Waste Department FY 2017 Personnel Cost
Goals and Objectives for FY 2017: Fiscally-sound and Efficient Government:
Maintain and inspect the City’s streets and traffic control devices by continually
sweeping, repairing and improving the city’s public streets and rights-of-way. Operate in a professional manner and stay within the approved FY 2017 budget while
promoting safety. Ensure that City and State Ordinances and Specifications are observed.
Protect the City’s Infrastructure Investment and Assets:
Create and maintain preventive service schedules for all City-owned equipment and vehicles.
Maintain thorough maintenance records for all City-owned equipment and vehicles to monitor service and repair costs and assist other departments with decisions about repairs and replacements.
Create and maintain preventive service schedules for all public streets and rights-of-way.
2015 2016 2016 2017Actual Amended Estimated Adopted
Expenditure Category Budget Year End BudgetPersonnel Costs and Employee BenefitsSalaries 323,411 357,791 353,776 358,476 Overtime Wages 1,503 4,000 3,969 1,000 Subtotal 324,914$ 361,791$ 357,745$ 359,476$
Insurance - Group - GMA 46,731 49,028 46,911 46,344 Social Security (FICA) Contributions 3,162 5,343 3,806 5,125 Retirement Contributions 34,121 43,255 43,254 43,560 Workers' Compensation 28,908 37,795 30,249 31,742 OPEB Trust 17,793 19,939 19,939 13,333 Subtotal 130,715 155,360 144,159 13,333 Total Personnel Services 455,629$ 517,151$ 501,904$ 372,809$

DEPARTMENTAL SUMMARIES 2017
122
Storm Water Management Department
Mission Statement The Storm Water Management Department’s mission is to provide a comprehensive program for watershed management.
Department Description
The Storm Water Management Department is a division of the Public Works Department and is responsible for the maintenance of drainage infrastructure. This includes maintaining storm drains, canals, ditches, catch basins and overseeing new drainage projects.
Budget Highlights
In the FY 2017 Budget Storm Water Management Department expenditures total $755,241, an increase of 16% or $108,606 over 2016 estimated expenditures due to additional drainage projects that do not qualify for the capital project fund.
Storm Water Department FY 2017 Expenditure Summary
Storm Water Department Personnel Schedule
2015 2016 2016 2017Actual Amended Estimated Adopted
Expenditure Category Budget Year End BudgetPersonnel Services Total 430,260$ 471,844$ 382,936$ 419,201$ Purchased & Contracted Services Total 81,906 109,935 102,229 107,150 Supplies Expenditures Total 59,095 47,100 45,594 76,500 Miscellaneous Total 10,936 117,251 115,876 152,390 Total Stormwater Management 582,197$ 746,130$ 646,635$ 755,241$
2015 2016 2017 Pay StatusClassification Actual Actual Adopted BudgetSuperintendent 1 1 1 UnclassifiedCrew Leader 1 1 1 ClassifiedMaintenance Worker 5 5 5 ClassifiedEquipment Operator 1 1 1 ClassifiedTotal Stormwater Management 8 8 8

DEPARTMENTAL SUMMARIES 2017
123
Storm Water Department Detailed Personnel Cost
Goals and Objectives for FY 2017:
Fiscally-sound and Efficient Government:
Maintain the City’s storm water system by performing routine inspections and repairing the watershed system.
Operate in a professional manner and stay within the approved FY 2017 budget while promoting safety.
Ensure that City and State Ordinances and Specifications are observed.
Protect the City’s Infrastructure Investment and Assets:
Create and maintain preventive service schedules for maintaining the City’s watershed
system. Partner with the Metropolitan Planning Commission in educating the citizens of Pooler,
this will help protect the City’s watershed, waterways and wetlands.
2015 2016 2016 2017Actual Amended Estimated Adopted
Expenditure Category Budget Year End BudgetPersonnel Costs and Employee BenefitsSalaries 299,352 309,059 230,905 279,959 Overtime Wages 2,154 7,400 7,062 1,200 Subtotal 301,506$ 316,459$ 237,967$ 281,159$
Insurance - Group - GMA 42,662 52,320 46,328 52,128 Social Security (FICA) Contributions 3,971 4,670 4,020 4,538 Retirement Contributions 32,724 37,195 37,195 38,272 Workers' Compensation 27,155 39,046 35,272 28,104 OPEB Trust 22,242 22,154 22,154 15,000 Subtotal 128,754$ 155,385$ 144,969$ 138,042 Total Personnel Services 430,260$ 471,844$ 382,936$ 419,201$

DEPARTMENTAL SUMMARIES 2017
124
Facilities Maintenance Department Mission Statement
The Facilities Maintenance Department’s mission is to provide quality service for all of the City’s vehicles, equipment, and facilities.
Department Description
The Facilities Maintenance Department is a division of the Public Works Department and is responsible for the maintenance of all City vehicles, equipment, and facilities.
Budget Highlights
In the FY 2017 Budget the Facilities Maintenance Department expenditures total $562,975, an increase of 2 0 % or $95,390 over 2016 estimated expenditures. This increase is due to the need for additional tools and supplies to run the department.
Facilities Maintenance Department FY 2017 Expenditure Summary
Facilities Maintenance Department Personnel Schedule
2015 2016 2016 2017Actual Amended Estimated Adopted
Expenditure Category Budget Year End BudgetPersonnel Services Total 484,812$ 286,578$ 290,427$ 304,550$ Purchased & Contracted Services Total 32,347 43,100 21,522 58,800 Supplies Expenditures Total 110,752 51,865 51,844 72,235 Miscellaneous Total 54,535 114,750 103,792 127,390 Total Facilities Maintenance Department 682,446$ 496,293$ 467,585$ 562,975$
2015 2016 2017 Pay StatusClassification Actual Actual Adopted BudgetBulding Supervisor 1 1 1 ClassifiedFleet Maintenance Supervisor 1 1 1 UnclassifiedLead Mechanic 1 1 1 ClassifiedMechanic Assistant 1 1 1 ClassifiedElectrician 1 1 1 ClassifiedMaintenance Worker 1 1 1 ClassifiedTotal Facilities Maintenance 6 6 6
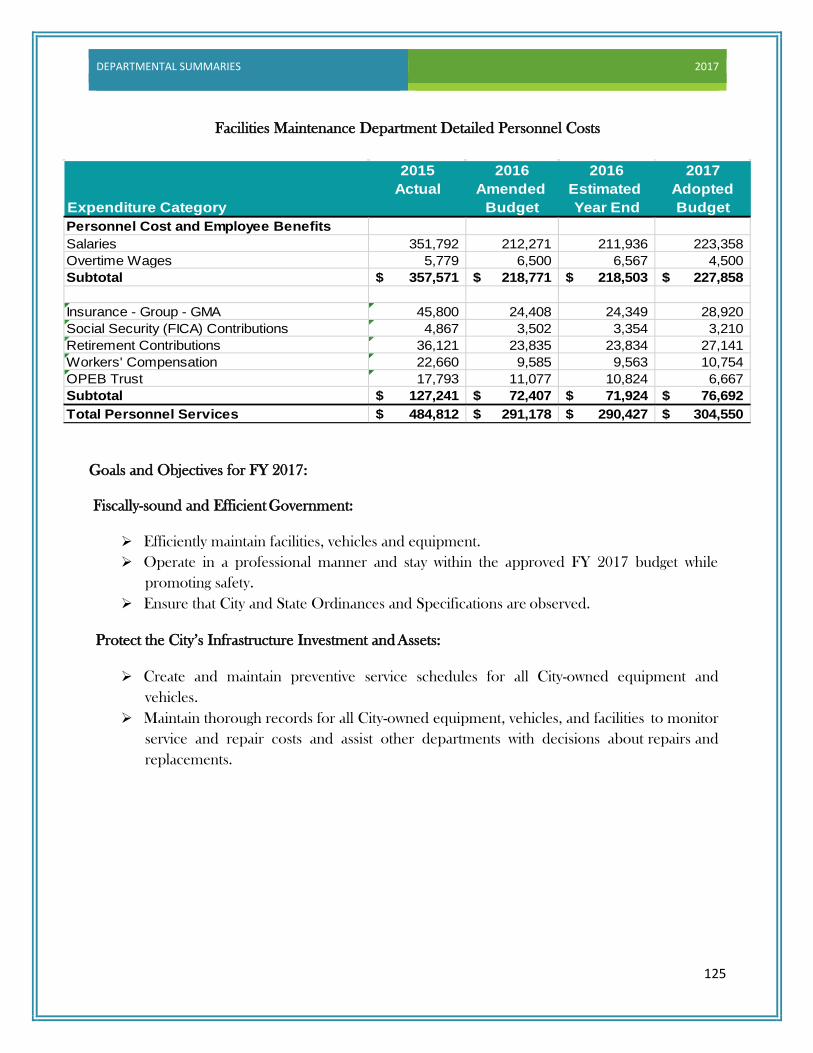
DEPARTMENTAL SUMMARIES 2017
125
Facilities Maintenance Department Detailed Personnel Costs
Goals and Objectives for FY 2017: Fiscally-sound and Efficient Government:
Efficiently maintain facilities, vehicles and equipment. Operate in a professional manner and stay within the approved FY 2017 budget while
promoting safety. Ensure that City and State Ordinances and Specifications are observed.
Protect the City’s Infrastructure Investment and Assets:
Create and maintain preventive service schedules for all City-owned equipment and
vehicles. Maintain thorough records for all City-owned equipment, vehicles, and facilities to monitor
service and repair costs and assist other departments with decisions about repairs and replacements.
2015 2016 2016 2017Actual Amended Estimated Adopted
Expenditure Category Budget Year End BudgetPersonnel Cost and Employee BenefitsSalaries 351,792 212,271 211,936 223,358 Overtime Wages 5,779 6,500 6,567 4,500 Subtotal 357,571$ 218,771$ 218,503$ 227,858$
Insurance - Group - GMA 45,800 24,408 24,349 28,920 Social Security (FICA) Contributions 4,867 3,502 3,354 3,210 Retirement Contributions 36,121 23,835 23,834 27,141 Workers' Compensation 22,660 9,585 9,563 10,754 OPEB Trust 17,793 11,077 10,824 6,667 Subtotal 127,241$ 72,407$ 71,924$ 76,692$ Total Personnel Services 484,812$ 291,178$ 290,427$ 304,550$

DEPARTMENTAL SUMMARIES 2017
126
Parks and Recreation
The Recreation Department includes management of all the City’s parks and recreation programs. This department also oversees programs offered by the Senior Citizen Center which has its own operating budget.
Parks and Recreation Organization Chart

DEPARTMENTAL SUMMARIES 2017
127
Parks and Recreation
Short-Term Priorities & Goals
Priorities:
Continue excellence in planning, building inspections, and beautification to ensure safe, desirable, and quality development within Pooler, while working to preserve existing neighborhoods and commercial areas.
Ensure fiscal responsibility via accurate forecasting of community necessities and department resources.
Provides safe and healthy environment for citizens to enjoy recreational activities at the different parks within the City.
Goals:
Use the operating and capital improvement budgets to allocate funds and resources that will provide a high level of service to meet community needs.
Continue to provide services to the Senior Center community to foster lasting, strong relationships between staff and the citizens.
Long Term Priorities & Goals
Priorities:
To maintain all Community Development Departments at an efficient level of service. Goals:
Familiarize staff with new development concepts, building practices, and training opportunities so that staff can implement long-term plans, strategies, and programs to effectively handle the growth of the City of Pooler.
Continue to examine areas that lend themselves to department improvement, such as interdepartmental communication, public relation efforts, and timely response to citizen inquiry.
Annually examine goals to ensure quality and efficiency of department work programs.

DEPARTMENTAL SUMMARIES 2017
128
Recreation Department
Mission Statement The mission of the Recreation Department is to provide diverse recreational opportunities for the City of Pooler that enhance the overall quality of life by creating and promoting a healthy lifestyle through parks, and recreational facilities and programs, while building and strengthening a sense of community.
Department Description
The Recreation Department provides year-round sports opportunities that include programs such as Men’s Basketball, Youth Baseball, Youth Softball, Youth Basketball, T-Ball, Soccer, and Football, which emphasize fun within a structured sports environment. Our non-team sport programs consist of sport camps, gymnastics, tennis and dance.
Budget Highlights
In the FY 2017 Budget, Recreation expenditures total $1,942,642, an increase of 18% or $305,384 over the estimated expenditures in 2016.
Recreation Department FY 2017 Expenditure Summary
Recreation Department Personnel Schedule
2015 2016 2017 Pay StatusClassification Actual Actual Adopted BudgetDirector 1 1 1 UnclassifiedAssistant Director 1 1 1 UnclassifiedAthletic Coordinator 1 2 2 ClassifiedGrounds Keeper Superintendent 1 1 1 ClassifiedGrounds Keeper Supervisor 1 1 1 ClassifiedOffice Coordinator 1 1 1 ClassifiedCrew Leader 1 2 2 ClassifiedRecreation Specialist 1 1 1 ClassifiedGrounds Keeper 2 4 4 ClassifiedParks Attendant I 1 2 2 ClassifiedMaintenance Worker 1 1 1 ClassifiedTotal Recreation 12 17 17
2015 2016 2016 2017Actual Amended Estimated Adopted
Expenditure Category Budget Year End BudgetPersonnel Services Total 614,481$ 895,693$ 891,274$ 1,172,448$ Purchased & Contracted Services Total 220,966 330,598 307,020 284,927 Supplies Expenditures Total 358,628 394,816 367,493 378,900 Miscellaneous Total 62,032 72,332 71,471 106,367 Total Recreation Department 1,256,107$ 1,693,439$ 1,637,258$ 1,942,642$

DEPARTMENTAL SUMMARIES 2017
129
Recreation Department Detailed Personnel Costs
Goals and Objectives for FY 2017: Protect the City’s Infrastructure Investment and Assets:
Provide continued education and training opportunities for staff. Increase training opportunities for volunteers. Repair and remodel baseball infields that have settled and become dangerous for play. Replace aging playground equipment at Pooler Park. Landscape and complete Memorial Park.
Recreational and Leisure Opportunities: Provide a safe, comfortable place for children after school and during the summer. Provide an opportunity for children to express themselves through various art forms, sports
and special events. Provide an environment that helps promote self-esteem and reinforce positive values. Provide opportunities to develop varied interests, to practice recreational skills and to
experience positive use of leisure time.
2015 2016 2016 2017Actual Amended Estimated Adopted
Expenditure Category Budget Year End BudgetPersonnel Costs and Employee BenefitsSalaries 451,035 681,366 680,654 843,554 Overtime Wages 5,488 6,000 3,513 6,000 Subtotal 456,523$ 687,366$ 684,167$ 849,554$
Insurance - Group - GMA 59,292 81,012 80,905 121,608 Social Security (FICA) Contributions 6,053 9,684 8,641 12,957 Retirement Contributions 49,290 72,397 72,397 125,955 Workers' Compensation 19,083 12,003 11,933 34,041 OPEB Trust 24,240 33,231 33,231 28,333 Subtotal 157,958$ 208,327$ 207,107$ 322,894$
Total Personnel Services 614,481$ 895,693$ 891,274$ 1,172,448$

DEPARTMENTAL SUMMARIES 2017
130
Senior Citizen Department
Mission Statement The Pooler Senior Center’s mission is to promote the successful aging of its citizens.
Department Description
The Senior Center is comprised of one full-time staff member, two part-time staff members and countless volunteers. The Senior Center provides a variety of programs and services for our seniors designed to enhance the quality of their lives and maintain their independence.
Budget Highlights
In the FY 2017 Budget, Senior Center expenditures total $167,194, a decrease of 4.69% or $7,834 under the FY 2016 Estimated year-end. In 2016, the Senior Citizen Center bought a new van to transport the members to various events, therefore, the 2017 overall budget is somewhat reduced.
Senior Citizen Department FY 2017 Expenditure Summary
Senior Citizen Department Personnel Schedule
2015 2016 2017 Pay StatusClassification Actual Actual Adopted BudgetDirector 1 1 1 ClassifiedSenior Center Asistant Part-time) 2 2 2 ClassifiedTotal Senior Center 3 3 3
2015 2016 2016 2017Actual Amended Estimated Adopted
Expenditure Category Budget Year End BudgetPersonnel Services Total 69,548$ 83,723$ 76,054$ 85,483$ Purchased & Contracted Services Total 20,060 35,434 31,788 42,311 Supplies Expenditures Total 30,310 38,100 36,186 39,400 Miscellaneous Total - 31,000 31,000 - Total Senior Center Administration 119,918$ 188,257$ 175,028$ 167,194$

DEPARTMENTAL SUMMARIES 2017
131
Senior Citizen Department Personnel Costs
Goals and Objectives for FY 2017: Fiscally-sound and Efficient Government: Provide continuing education opportunities for staff. Offer computer classes that are not limited to, but include internet safety practices. Identify needs of seniors in community. Continue to provide service opportunities. Upgrade outdoor furniture and remodel outdoor porch areas.
Recreational and Leisure Opportunities: Continue to identify senior citizens recreational needs. Continue to upgrade and repair the center both structurally and cosmetically. Provide seniors the opportunity to participate in community service at local events. Support and contribute to the physical, emotional and social development and
achievement of senior citizens. Maintain the successful operation of an active and growing Senior Center.
FY 2017 Accomplishments: Served over 11,000 meals to senior citizens Offered numerous programs and activities, keeping the seniors active
2015 2016 2016 2017Actual Amended Estimated Adopted
Expenditure Category Budget Year End BudgetPersonnel Costs and Employee BenefitsSalaries 53,006 65,001 57,859 70,646 Overtime Wages 391 200 1,076 - Subtotal 53,397$ 65,201$ 58,935$ 70,646$
Insurance - Group - GMA 5,947 5,624 5,682 5,855 Social Security (FICA) Contributions 1,488 3,002 1,653 1,827 Retirement Contributions 6,544 7,441 7,440 5,264 Workers' Compensation 264 240 129 224 OPEB Trust 1,908 2,215 2,215 1,667 Subtotal 16,151$ 18,522$ 17,119$ 14,837$
Total Personnel Services 69,548$ 83,723$ 76,054$ 85,483$

DEPARTMENTAL SUMMARIES 2017
132
Community Development Function
The Community Development function encompasses those departments responsible for enforcement of Zoning Ordinance Regulations and permits. The Community Development function includes the Zoning and Inspections Department.
Zoning and Inspections Department Organization Chart

DEPARTMENTAL SUMMARIES 2017
133
Community Development
Short-Term Priorities & Goals
Priorities:
1. Continue excellence in planning, building inspections, and beautification to ensure safe, desirable, and quality development within Pooler, while working to preserve existing neighborhoods and commercial areas.
2. Ensure fiscal responsibility via accurate forecasting of community necessities and department resources.
3. Provides safe and healthy environment for citizens to enjoy recreational activities at the different parks within the City.
Goals:
1. Use the operating and capital improvement budgets to allocate funds and resources that will provide a high level of service to meet community needs.
2. Continue to provide services to the Senior Center community to foster lasting, strong relationships between staff and the citizens.
Long Term Priorities & Goals
Priorities:
1. To maintain all Community Development Departments at an efficient level of service. Goals:
1. Familiarize staff with new development concepts, building practices, and training opportunities so that staff can implement long-term plans, strategies, and programs to effectively handle the growth of the City of Pooler.
2. Continue to examine areas that lend themselves to department improvement, such as interdepartmental communication, public relation efforts, and timely response to citizen inquiry.
3. Annually examine goals to ensure quality and efficiency of department work programs.

DEPARTMENTAL SUMMARIES 2017
134
Zoning & Inspections Department Mission Statement
The Zoning & Inspections Department is committed to providing the City’s elected and appointed officials, citizens, businesses, and development community with information and professional expertise used to support decisions, enhance the understanding of the development process, and ensure continued high quality residential, commercial, and industrial development within the City of Pooler.
Department Description
The Zoning & Inspections Department works to assist community members of all types in the daily and long-term economic growth and physical development of the City of Pooler.
Current Planning and Development Review- reviewing and processing development
applications according to the Comprehensive Plan and Zoning Code. Neighborhoods Preservation and Code Enforcement-working to maintain quality
neighborhoods and inspecting projects after construction to verify and maintain compliance with the Zoning Code. The Zoning & Inspections Department distributes and accepts applications for building permits, subdivision approvals, landscape plans, and inspections. The department also works with the Planning Committee and Commission to review and recommend actions for changes in zoning, plat boundary amendments, and variances.
Budget Highlights
In the FY 2017 Budget, Zoning & Inspections expenditures total $306,326, a decrease of 11% or $38,622 under 2016 estimated expenditures. The decrease is due to the reduction of workforce after the outlet mall was constructed and the extra position was no longer necessary.
Zoning & Inspections Department FY 2017 Expenditure Summary
2015 2016 2016 2017Actual Amended Estimated Adopted
Expenditure Category Budget Year End BudgetPersonnel Services Total 420,006$ 357,334$ 344,948$ 306,326$ Purchased & Contracted Services Total 108,640 149,873 122,215 127,610 Supplies Expenditures Total 12,931 21,799 15,722 34,649 Miscellaneous Total - 5,400 5,186 - Total Zoning & Inspections Department 541,577$ 534,406$ 488,071$ 468,585$

DEPARTMENTAL SUMMARIES 2017
135
Zoning & Inspections Department Personnel Summary
Zoning & Inspections Department Personnel Cost
Goals and Objectives for FY 2017:
Proactive Growth Management and Code Enforcement Initiatives:
The Zoning & Inspections Department will continue a comprehensive zoning code
assessment in 2017. This is necessary in order to modernize and tailor our zoning code to the specific needs of the City.
The Zoning & Inspections Department will broaden the effectiveness and diligence of
the Code Enforcement Division through increased staff training, better efficiency due
2015 2016 2017 Pay StatusClassification Actual Actual Adopted BudgetZoning Administrator 1 1 1 UnclassifiedZoning Assistant 1 1 0 ClassifiedInspections Coordinator 1 1 1 ClassifiedCode Enforcement Officer 1 1 1 ClassifiedInspector 1 1 1 ClassifiedTotal Zoning & Inspections 5 5 4
2015 2016 2016 2017Actual Amended Estimated Adopted
Expenditure Category Budget Year End BudgetPersonnel Cost and Employee BenefitsSalaries 318,549 261,764 258,627 235,588 Overtime Wages 3,134 3,300 - 1,500 Subtotal 321,683$ 265,064$ 258,627$ 237,088$
Insurance - Group - GMA 34,780 32,756 25,936 23,280 Social Security (FICA) Contributions 4,052 4,439 3,440 3,375 Retirement Contributions 36,782 35,696 35,695 28,628 School Incentive Program 1,800 - 1,800 - Workers' Compensation 4,828 5,887 5,458 7,288 OPEB Trust 15,569 13,292 13,544 6,667 Subtotal 97,811$ 92,070$ 85,873$ 69,238$
Total Personnel Services 419,494$ 357,134$ 344,500$ 306,326$

DEPARTMENTAL SUMMARIES 2017
136
to new technology, consistency, and more rigorous enforcement actions.
An analysis of the City’s development review process will be completed by the Zoning & Inspections Department to ensure all code and permitting requirements are met, while still providing timely reviews and prompt customer service.
The Zoning & Inspections Department will continue to implement the City’s
Comprehensive Plan and provide elected and appointed officials, citizens, businesses, and the development community with professional expertise in data assessment used to support decision making, enhance the understanding of the development process, and ensure continued growth in the community.

DEPARTMENTAL SUMMARIES 2017
137
City of Pooler Enterprise Fund
The City of Poolers’ Enterprise Fund is a self-supporting fund designated to account for activities supported by user charges; examples include: Water, Sewer and Solid Waste Funds.
Enterprise Fund Functions:
Public Works Administration Water Department Sewer Department Wastewater Treatment Plant

DEPARTMENTAL SUMMARIES 2017
138
Water and Sewer Fund
The Water and Sewer Fund encompasses departments responsible for providing the citizens of the City with safe, potable drinking water while maintaining eco-friendly operations. The Water and Sewer Fund includes four divisions: Public Works Administration, Wastewater Treatment, Sewer Department, and Water Department.
Water/Sewer Fund Organizational Chart

DEPARTMENTAL SUMMARIES 2017
139
Water & Sewer Fund Operating Revenues Overview
2015 2016 2016 2017Actual Amended Estimated Adopted
Budget Year End Budget
Water Revenues 2,743,505$ 2,637,510$ 3,327,568$ 3,252,170$ Sewer Revenues 3,390,898 2,856,407 3,726,733 3,350,000$ Investment Earnings 18,117 12,000 38,343 20,000$ Contributions and Donations 3,417,479 1,623,200 1,962,797 1,699,353$ Other Revenues & Penalties 70,395 98,000 117,800 98,000$ Miscellaneous 43,442 33,000 53,715 41,500$ Transfer In- Fund Balance - - - 301,000$ Total Revenue 9,683,836$ 7,260,117$ 9,226,956$ 8,762,023$

DEPARTMENTAL SUMMARIES 2017
140
Water & Sewer Fund Operating Expenses Overview
2015 2016 2016 2017Actual Amended Estimated Adopted
Budget Year End Budget
Public Works Administration 625,690$ 988,599$ 1,051,822$ 1,265,055$ Sewer Department 1,891,020 1,478,468 813,698 1,616,552 Wastewater Treatment Plant 1,726,080 1,709,885 1,741,406 1,734,267 Water Department 1,558,525 1,487,552 1,740,268 1,570,643 Capital Projects 162,981 2,455,506 6,376 2,575,505 Total Expenses 5,964,296$ 8,120,010$ 5,353,570$ 8,762,022$

DEPARTMENTAL SUMMARIES 2017
141
Public Works Administration Mission Statement
The mission of the Public Works Administration Division is to protect the citizens, the interests of Pooler, the environment, and all receiving waterways by eliminating pollutants in waste water and by meeting or exceeding our National Pollutant Discharge Elimination System (NPDES) permit requirements.
Department Description
The Public Works Administration Division treats household and light industrial waste biologically, and disinfects it to meet or exceed Georgia Environmental Protections and NPDES permit perimeters, and to protect downstream users along with the aquatic environment upon which all life depends.
Budget Highlights
In the FY 2017 Budget, Public Works Administration expenditures total $1,265,055, an increase of 20% or $213,233. This increase is mostly due to other administrative expenses associated with cost sharing of General Administration expenses in the General Fund. This was not a budgeted item in 2015.
Public Works Administration FY 2017 Expense Summary
Public Works Administration Personnel Schedule
2015 2016 2017 Pay Status
Classification Actual Actual Adopted BudgetPublic Works Director 1 1 1 UnclassifiedOffice and Billing Manager 1 1 1 ClassifiedPublic Works Coordinator 1 1 1 ClassifiedBilling Clerk 1 2 2 ClassifiedTotal Public Works 4 5 5
2015 2016 2016 2017Actual Amended Estimated Adopted
Expenditure Category Budget Year End BudgetPersonnel Services Total 498,330$ 304,475$ 339,807$ 384,848$ Purchased/Contracted Services Total 109,145 202,356$ 245,012 233,767 Supplies Expenditures Total 18,215 38,075$ 42,343 47,910 Other Expenses - 443,693$ 424,660 598,530 Total Public Works Administration 625,690$ 988,599$ 1,051,822$ 1,265,055$

DEPARTMENTAL SUMMARIES 2017
142
Public Works Administration Personnel Costs
Goals and Objectives for FY 2017 Fiscally-sound and Efficient Government:
Operate Public Works in a professional manner and stay within the approved FY 2017 budget.
Promote and retain a competent, well-trained, and customer friendly staff dedicated to the residents and business owners of Pooler.
Respond to all residents and business owners’ service requests in a timely and efficient manner to ensure the highest possible standards of customer service.
2015 2016 2016 2017Actual Amended Estimated Adopted
Expenditure Category Budget Year End BudgetPersonnel Costs and Employee BenefitsSalaries 410,588 248,493 256,521 298,039 Overtime Wages 819 700 3,195 - Subtotal 411,407$ 249,193$ 259,716$ 298,039$
Insurance-Group-GMA 32,026 27,176 30,237 34,776 Social Security Contributions (FICA) 5,872 3,510 3,661 4,035 Retirement Plan Contributions 38,792 12,603 25,206 36,216 School Incentive Program 1,200 - 600 1,800 Workers Comp 1,387 917 9,231 1,649 OPEB Trust 4,448 11,076 11,077 8,333 Vehicle Allowance 3,198 - 79 - Subtotal 86,923$ 55,282$ 80,091$ 86,809$
Total Personnel Services 498,330$ 304,475$ 339,807$ 384,848$

DEPARTMENTAL SUMMARIES 2017
143
Water Department
Mission Statement The mission of the Water Department is to provide the citizens of Pooler with the finest drinking water possible at a reasonable rate and to deliver superior service to our customers.
Department Description
The Water Department is a division of the Public Works Department that supplies potable drinking water throughout the city.
Budget Highlights
In the FY 2017 Budget, Water Department expenses total $1,570,643, a decrease of 9% or $189,625 from estimated expenses in 2016. The decrease is due to less need to purchase water from the City of Savannah as a result of the new well built in 2015.
Water Department FY 2017 Expense Summary
Water Department Personnel Schedule
2011 2012 2013 Pay StatusClassification Actual Actual Adopted BudgetSuperintendent 1 1 1 UnclassifiedCRSS CNT Tech & UT Loc 1 1 1 ClassifiedLab Technician 1 1 1 ClassifiedLaborer III 2 2 2 ClassifiedMaintenance Worker 3 3 3 ClassifiedTotal Water Department 8 8 8
2015 2016 2016 2017Actual Amended Estimated Adopted
Expenditure Category Budget Year End BudgetPersonnel Services Total 373,594$ 388,627$ 434,030$ 455,893$ Purchased/Contracted Services Total 151,525 142,600 126,700 164,750 Supplies Expenditures Total 696,183 651,325 860,968 632,750 Miscellaneous Total 337,223 305,000 318,570 317,250 Total Water Department 1,558,525$ 1,487,552$ 1,740,268$ 1,570,643$

DEPARTMENTAL SUMMARIES 2017
144
Water Department Detailed Personnel Costs
Goals and Objectives for FY 2017:
Fiscally-sound and Efficient Government:
Promote and retain a competent, well-trained, and customer friendly staff dedicated to the residents and business owners of Pooler.
Offer education programs to ensure more knowledgeable and informed employees. Operate in a professional manner and stay within the approved FY 2013 budget. Ensure that State and Federal Ordinances and Specification are observed.
Continue to provide the highest quality, complete, accurate and timely billings for
our customers. Continue to maintain the highest standards of customer service when assisting
our customers to solve their problems and/or concerns. Continue to work together with Water Operations to account for water loss by locating
all service connections, meter all connections, and have accounts set up for each. Protect the City’s Infrastructure Investment and Assets:
Create and follow preventive service schedules for maintaining the City’s Water
system.
2015 2016 2016 2017Actual Amended Estimated Adopted
Expenditure Category Budget Year End BudgetPersonnel Costs and Employee BenefitsSalaries 259,856 271,915 298,404 317,955 Overtime Wages 19,118 20,000 28,522 20,000 Subtotal 278,974$ 291,915$ 326,926$ 337,955$
4,120 4,466 4,584 Group Insurance 38,007$ 31,056 38,221 46,344 Social Security (FICA) Contributions 3,880$ 4,120 4,466 4,584 Retirement Plan Contributions 20,953$ 31,132 34,566 37,428 School Incentive Program -$ - - - Workers' Compensation 16,211$ 14,896 14,343 16,249 OPEB Trust 15,569$ 15,508 15,508 13,333 Subtotal 94,620$ 96,712$ 107,104$ 117,938$
Total Personnel Services 373,594$ 388,627$ 434,030$ 455,893$

DEPARTMENTAL SUMMARIES 2017
145
Sewer Department
Mission Statement The mission of the Sewer Department is to maintain the sewer system within the City of Pooler and ensure that best management practices are maintained to prevent any public safety or hazardous conditions within the City.
Department Description
The Sewer Department is a division of the Public Works Department and is responsible for the maintenance of the public sewer system within the City of Pooler.
Budget Highlights
In the FY 2017 Budget, Sewer Department expenditures total $1,616,552, an increase of 4% or $66,651 over estimated 2016 expenditures. The increase is due to normal increases in operating expenses.
Sewer Department FY 2017 Expense Summary
Sewer Department Personnel Schedule
2015 2016 2017 Pay StatusClassification Actual Actual Adopted BudgetCrewleader 1 1 1 ClassifiedGIS Analyst 1 1 1 ClassifiedMaintenance worker 2 3 3 ClassifiedHeavy Equipment Operator 1 1 1 ClassifiedTotal Sewer Department 5 6 6
2015 2016 2016 2017Actual Amended Estimated Adopted
Expenditure Category Budget Year End BudgetPersonnel Services Total 223,282$ 293,693$ 275,428$ 385,981$ Purchased/Contracted Services Total 590,157 358,525 210,235 220,100 Supplies Expenditures Total 328,035 281,250 328,035 298,210 Miscellaneous Total 749,546 545,000 736,203 712,261 Total Sewer Department 1,891,020$ 1,478,468$ 1,549,901$ 1,616,552$

DEPARTMENTAL SUMMARIES 2017
146
Sewer Department Detailed Personnel Costs
Goals and Objectives for FY 2017:
Fiscally-sound and Efficient Government:
Promote and retain a competent, well-trained, and customer friendly staff dedicated to the residents and business owners of Pooler.
Offer education programs to ensure knowledgeable and informed employees. Operate in a professional manner and stay within the approved FY 2017 budget while
promoting safety. Ensure that State and Federal Ordinances and Specifications are observed.
Protect the City’s Infrastructure Investment and Assets:
Create and follow preventive service schedules for maintaining the City’s Sewer system. Identify and maintain inflow and infiltration issues through the I &I program. Continue implementation of the GIS program.
2015 2016 2016 2017Actual Amended Estimated Adopted
Expenditure Category Budget Year End BudgetPersonnel Costs and Employee BenefitsSalaries 143,891 202,694 176,570 270,327 Overtime Wages 19,097 16,800 27,897 20,000 Subtotal 162,988$ 219,494$ 204,467$ 290,327$
Group Insurance 26,985$ 31,056$ 28,139$ 40,560$ Social Security (FICA) Contributions 2,292$ 3,100$ 2,762$ 3,920$ Retirement Plan Contributions 14,082$ 23,207$ 23,207$ 32,848$ Workers' Compensation 3,590$ 3,544$ 3,561$ 8,326$ OPEB Trust 13,345$ 13,292$ 13,292$ 10,000$ Subtotal 60,294$ 74,199$ 70,961$ 95,654$
Total Personnel Services 223,282$ 293,693$ 275,428$ 385,981$
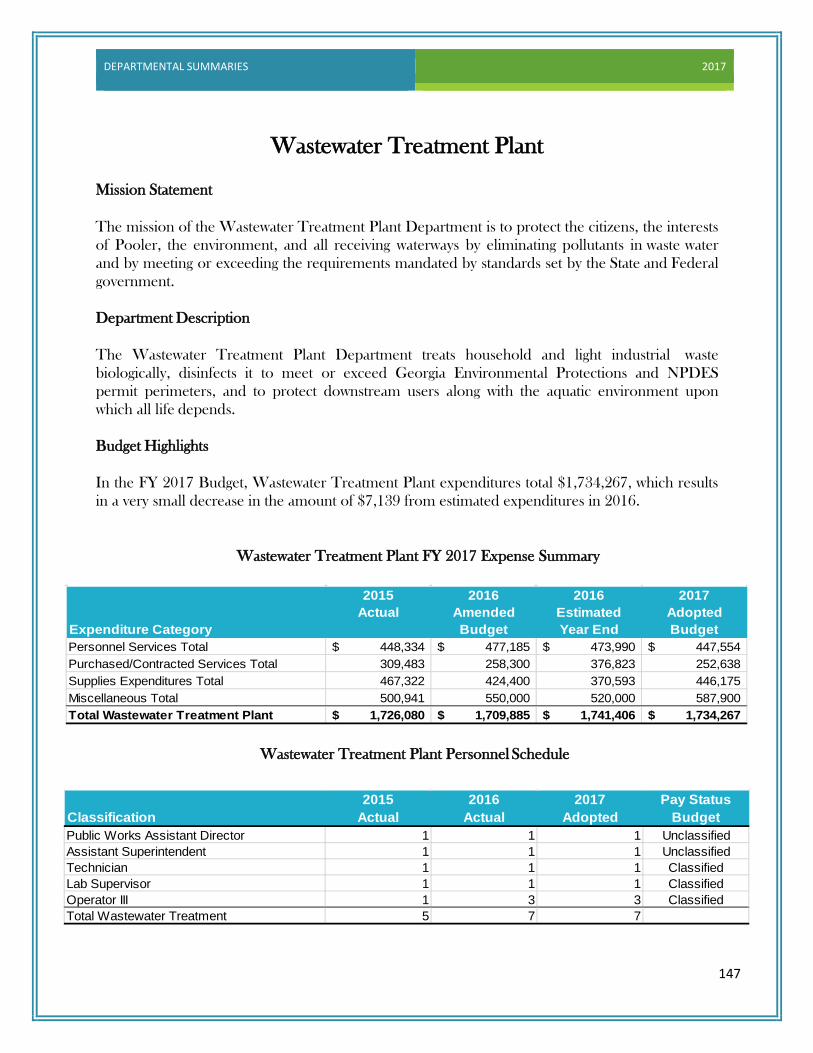
DEPARTMENTAL SUMMARIES 2017
147
Wastewater Treatment Plant Mission Statement
The mission of the Wastewater Treatment Plant Department is to protect the citizens, the interests of Pooler, the environment, and all receiving waterways by eliminating pollutants in waste water and by meeting or exceeding the requirements mandated by standards set by the State and Federal government.
Department Description
The Wastewater Treatment Plant Department treats household and light industrial waste biologically, disinfects it to meet or exceed Georgia Environmental Protections and NPDES permit perimeters, and to protect downstream users along with the aquatic environment upon which all life depends.
Budget Highlights
In the FY 2017 Budget, Wastewater Treatment Plant expenditures total $1,734,267, which results in a very small decrease in the amount of $7,139 from estimated expenditures in 2016.
Wastewater Treatment Plant FY 2017 Expense Summary
Wastewater Treatment Plant Personnel Schedule
2015 2016 2017 Pay Status
Classification Actual Actual Adopted BudgetPublic Works Assistant Director 1 1 1 UnclassifiedAssistant Superintendent 1 1 1 UnclassifiedTechnician 1 1 1 ClassifiedLab Supervisor 1 1 1 ClassifiedOperator III 1 3 3 ClassifiedTotal Wastewater Treatment 5 7 7
2015 2016 2016 2017Actual Amended Estimated Adopted
Expenditure Category Budget Year End BudgetPersonnel Services Total 448,334$ 477,185$ 473,990$ 447,554$ Purchased/Contracted Services Total 309,483 258,300 376,823 252,638 Supplies Expenditures Total 467,322 424,400 370,593 446,175 Miscellaneous Total 500,941 550,000 520,000 587,900 Total Wastewater Treatment Plant 1,726,080$ 1,709,885$ 1,741,406$ 1,734,267$

DEPARTMENTAL SUMMARIES 2017
148
Wastewater Treatment Plant Detailed Personnel Costs
Goals and Objectives for FY 2017:
Fiscally-sound and Efficient Government:
Offer education programs to ensure more knowledgeable and informed employees. Operate in a professional manner and stay within the approved FY 2017 budget
while promoting safety. Ensure that State and Federal Ordinances and Specification are observed.
Protect the City’s Infrastructure Investment and Assets:
Create and maintain preventive service schedules for maintaining the City’s wastewater treatment & collection.
Continue to expand and offer reuse water to new customers and developments. Partner with the Metropolitan Planning Commission to educate the citizens of Pooler in
an effort to help protect the City’s watershed, waterways and wetlands. Environmental Stewards:
Use Best Management Practices to operate and maintain our Wastewater Treatment
facility to the highest standards, to not only meet but exceed our permit parameters in the treatment of our wastewater and to ensure the highest reduction of pollutants in our Plant Effluent.
Continue our good working relationships with EPD and other facilities from neighboring communities.
2015 2016 2016 2017Actual Amended Estimated Adopted
Expenditure Category Budget Year End BudgetPersonnel Costs and Employee BenefitsSalaries 332,365 359,831 340,713 326,735 Overtime Wages 10,962 12,256 31,406 18,000 Subtotal 343,327$ 372,087$ 372,119$ 344,735$
Insurance - Group- GMA 34,131$ 36,852$ 35,274$ 34,848$ Social Security Contributions (FICA) 4,453$ 5,246$ 4,892$ 4,738$ Retirement Plan Contributions 46,715$ 41,200$ 37,765$ 39,703$ School Incentive Program -$ -$ 1,200$ 1,800$ Workers Compensation 4,139$ 6,292$ 7,232$ 10,063$ OPEB Trust 15,569$ 15,508$ 15,508$ 11,667$ Subtotal 105,007$ 105,098$ 101,871$ 102,819$
Total Personnel Services 448,334$ 477,185$ 473,990$ 447,554$

2017
CITY OF POOLER
ESTABLISHED 1907
Glossary
GLOSSARY 2017
149
Glossary
ACCOUNT GROUP - A self-balancing set of accounts which are not a fund or a fiscal entity. General Fixed Assets Account Group and General Long-Term Debt Account Group are such examples.
ACCOUNTING SYSTEM - The total structure of records and procedures that identify, record, classify, summarize and report information on the financial position and results of operations of a governmental unit or any of its funds.
ACCRUAL BASIS ACCOUNTING - A method of accounting in which revenues are recorded when measurable and available, and expenses are recognized when a good or service is used.
ACCRUED REVENUE - Revenue earned during the current accounting period which will not be collected until a subsequent accounting period.
AGENCY FUND - A fund consisting of resources received and held by the governmental unit as an agent for others.
APPROPRIATION - An authorization by the City Council to incur obligations and to expend public funds for a stated purpose. An appropriation is usually limited in amount and as to the time when it may be expended.
ASSETS – Resources owned or held by a government which have monetary value.
AUDIT - A methodical examination of the utilization of and changes in resources. It c o n c l u d e s in a written report of the findings. A financial audit is a test of the management’s financial statements and internal accounting control procedures to determine the extent to w h i c h : internal accounting controls are both available and being used; and to determine whether the financial statements fairly present the City’s financial condition and results of operations.
AUTHORITY - A government or public agency created to perform a single function of a restricted group of related activities. Usually such units are financed from service charges, fees and tools, but in some instances they also have taxing powers. An authority may be completely independent of other governments or partially dependent upon other governments for its creation, its financing or the exercise of certain powers.
AVAILABLE (UNDESIGNATED) FUND BALANCE - This refers to the funds remaining from the prior year which are available for appropriation and expenditure in the current year.
BALANCED BUDGET – A budget in which planned revenues and resources available equals planned expenditures.
BUDGET – An annual financial plan embodying estimated expenditures for providing services and the proposed means of financing them.
BUDGET AMENDMENT - A budget amendment alters the total appropriation for a department or fund and requires approval by a resolution passed by the Pooler City Council.
GLOSSARY 2017
150
BUDGET CALENDAR – The schedule of key dates that a government follows in preparation and adoption of the budget.
BUDGET CONTROL - The control or management of the approved Budget for the purpose of keeping expenditures within the limitations of available appropriations and available revenues.
BUDGET DOCUMENT - The instrument used by the budget-making authority to present a comprehensive financial program to the appropriating body.
BUDGET MESSAGE - A general discussion of the proposed budget as presented in writing by the City Manager to Mayor and Council. The message contains an explanation of the principal budget items and recommendations regarding the financial policy for the coming year.
BUDGET RESOLUTION – The formal statement approved by the Mayor and Council which shows budgeted revenues and expenditures for the approaching fiscal year.
CAFR (Comprehensive Annual Financial Report) – This official annual report, prepared by the Finance Department, presents the status of the City’s finances in a standardized format.
CALEA (Commission on Accreditation for Law Enforcement Agencies) – The primary purpose of the Commission is to improve law enforcement services by creating a national body of standards developed by law enforcement professionals. It recognizes professional achievements by establishing and administering an accreditation process through which a law enforcement agency can demonstrate that it meets those standards.
CAPITAL COST RECOVERY FEE - Fees charged to a new development to offset the cost of infrastructure improvements to the water and sewer system. Fees are based upon the developments proportionate share of demand placed upon the infrastructure.
CAPITAL EXPENDITURES - Capital outlay of five thousand dollars ($5,000.00) or more for assets that have a useful life in excess of one year.
CAPITAL PROJECTS FUND - A fund used to account for financial resources used for the acquisition or construction of major capital equipment or facilities.
CAPITAL OUTLAY - Expenditures that result in the acquisition of/or addition to fixed assets.
CONSTRUCTION IN PROGRESS - The cost of construction work that has been started but not yet completed.
CONTRACTUAL SERVICE - An agreement to perform a service or task by external organizational units. A group of accounts which cover the above, as well as travel and training and other miscellaneous services.
CONTINGENCY FUNDS - Funds set aside to provide for unforeseen expenditures of uncertain amounts.
DEBT LIMIT – The maximum amount of gross or net debt which is legally permitted.
DEBT SERVICE - Expenditures for principal and interest payments on loans, notes, and bonds.

GLOSSARY 2017
151
DEPARTMENT - Departments are the major functional sub-divisions and correspond roughly to the functional hierarchy used by the City. Each department has been assigned to one of the functions according to the type of activity it performs. For example, the Police Department is part of the Public Safety function.
DEPRECIATION - (1) Expiration in the service life of capital assets attributable to wear and tear, deterioration, action of the physical elements, inadequacy or obsolescence. (2) The portion of the cost of a capital asset which is charged as an expense during a fiscal period.
ENTERPRISE FUND - A self-supporting fund designated to account for activities supported by user charges; examples include: Water, Solid Waste and Sewer Funds.
ENTITILEMENT - The amount of payment to which a state or local government is entitled as determined by the Federal government, pursuant to an allocation formula contained in applicable statutes.
EXCISE TAX – A levy on a specific type of transaction at a rate specific to that transaction. Also known as a selective sales tax, these taxes are separate from general sales tax and usually are based on a separate statutory authority. One example is hotel/motel tax.
EXPENDITURE – The payment of cash or the incurring of a liability for the acquisition of goods and services.
EXPENSE - Outflows or other uses of assets or incurring of liabilities during a period from delivering or producing goods, rendering services or carrying out other activities that constitute the entity’s ongoing major or central operations; for example, depreciation.
FIDUCIARY FUND - Any fund held by a governmental unit as an agent or trustee.
FISCAL PERIOD - Any period at the end of which a governmental unit determines its financial position and the results of its operations
FISCAL YEAR - A 12-month period of time of an annual budget, at the end of which a governmental unit determines its financial position and the results of its operations
FIXED ASSETS - Assets of a long-term character which are not intended to be sold for profit, but which are to be used in an organization’s normal course of business, such as land, buildings, machinery, and equipment.
FRANCHISE TAX - Fees levied on a corporation in return for granting a privilege sanctioning a monopoly or permitting the use of public property, usually subject to regulation set by the governing body.
FRINGE BENEFITS - Employers share of F.I.C.A taxes, health and dental insurance, disability insurance, life insurance, worker’s compensation, unemployment taxes, and retirement contributions made on behalf of the City employees.
FULL-TIME POSITION - A position which qualifies for full City benefits and requires the employee to work at least 30 hours per week.

GLOSSARY 2017
152
FUND - A fiscal and accounting entity with a self-balancing set of accounts recording cash and other financial resources, together with all related liabilities and residual equities, or balances and changes therein, which are segregated for the purpose of carrying on specific activities or attaining certain objectives in accordance with special regulations, restrictions, or limitations.
FUND BALANCE - Fund equity (excess of assets over liabilities) available for appropriation.
FUND EQUITY - The excess of assets over liabilities. A portion of the equity may be reserved or designated; the remainder is Fund Balance
GAAP - Generally Accepted Accounting Principles as determined through common practice or as promulgated by the Governmental Accounting Standards Board, Financial Accounting Standards Board, or various other accounting standards setting bodies.
GEFA – Georgia Environmental Facilities Authority
GENERAL FUND - A fund used to account for all transactions of a governmental unit that are not accounted for in another fund.
GFOA – Government Finance Officers Association
GOAL - A goal is a statement of desired conditions to be maintained or achieved through the efforts of an organization. Actual total achievement may be impossible, but the goal is a standard against which to measure progress toward ideal conditions. A goal is a definition of results toward which the work of the organization is directed.
GOVERNMENTAL FUND - A generic classification adopted by the National Council on Governmental Accounting to refer to all funds other than proprietary and fiduciary funds. General fund, special revenue funds and capital projects funds are all examples of governmental fund types.
GRANT - A contribution by one government unit to another unit. The contribution is usually made t aid in the support of a specified function, activity or for the acquisition or construction of fixed assets.
INFRASTRUCTURE - An underlying base or foundation; the basic facilities needed for the functioning of the City.
INTERFUND LOAN - A loan made by one fund to another to be repaid at a later date.
INTERGOVERNMENTAL REVENUE - Revenue from other governments in the form of entitlements, grants, shared revenues or payments in lieu of taxes.
INVESTMENT - Securities held for the production of income in the form of interest and dividends.
LIABILTY - Debts or other legal obligations arising out of transactions in the past that must be liquidated, renewed, or refunded at some future date. This term does not include encumbrances.

GLOSSARY 2017
153
LINE-ITEM - A detailed classification of an expense or expenditures classified within each department.
LINE-ITEM BUDGET - A budget featuring things to be purchased. By relating appropriations to commodities, line-item budget represent a “shopping-list” approach to allocation problems. This approach is believed to express official and citizen interest in the values of economy and control. Also known as traditional budgeting.
LONG-TERM DEBT - Debt with a maturity or more than one year after the date of issuance.
LOST - Local Option Sales Tax.
MPC – Metropolitan Planning Commission
MODIFIED ACCRUAL BASIS - Governmental funds use the modified accrual basis of accounting. Revenues are recognized in the period in which they become both available and measurable. Expenditures are recognized at the time a liability is incurred.
NON-OPERATING EXPENSE - Propriety fund income that is not derived from the basic operations of such enterprises.
OBJECT CODE - Expenditure classification according to the types of items purchased or services obtained; for example, personnel services, materials & supplies, contractual services, and capital.
OBJECTIVE - An objective is a decision about the amount of progress to be made within a specified period of time. It states in measurable and quantitative terms the results to be achieved within a specified time and plans the incremental steps to achieve the goal.
OPERATIING BUDGET – Plans of current expenditures and the proposed means of financing them. The annual operating budget (or, in the case of some governments, the b i e n n i a l operating budget) is the primary means by which most of the financing acquisition, spending, and service delivery activities of a government are controlled. The use of annual operating budgets is usually required by law.
OPERATING COSTS - Operating costs are proprietary (Enterprise) fund expenses that directly relate to the fund’s primary service activities. For example: salaries and wages, expendable supplies, and contractual services.
OPERATING TRANSFER - Legally authorized inter-fund transfers from a fund receiving revenue to the fund that makes expenditures.
ORDINANCE - A formal legislative enactment by the governing body of a municipality. It is not in conflict with any higher form of law, such as state statute or constitutional provision; it has the full force and effect of law within the boundaries of the municipality to which it applies.
ORGANIZATION CHART - A chart representing the authority, responsibility, and relationships among departmental entities within the City organization.
PART-TIME - Part-time employees work less than 30 hours per week and are not entitled to full- time employee benefits.
GLOSSARY 2017
154
PERSONNEL COST - Refers to all costs directly associated with employee, including salaries and fringe benefits
PROFESSIONAL SERVICES - Expenditures incurred by the City to obtain the services of recognized, licensed professionals such as Doctors, Engineers, Certified Public Accountants, etc.
RESERVE - (1) As account used to earmark a portion of fund balance to indicate that it has been earmarked to a particular purpose; and (2) an account used to earmark a portion of fund equity as legally segregated for a future use.
RESIDUAL EQUITY TRANSFERS - Additions to or deductions from the beginning fund balance of governmental funds.
REVENUE – Income of a government from taxation, excise taxes, or other sources to fund financial resources other than from inter-fund transfers and debt issue proceeds.
SALARIES & BENEFITS -The cost of all salaries, wages, and associated fringe benefits required to provide a governmental service.
SPLOST - Special Purpose Local Option Sales Tax.
SPECIAL REVENUE FUND - A fund established to account for revenues from specific taxes or other earmarked revenue sources that by law are designated to finance particular functions or activities of government.
UNRESERVED FUND BALANCE - The amount remaining in a fund that is not designated for some future use and which is available for further appropriation or expenditure.
USER CHARGES - The payment of a fee for direct receipt of a public service by the party benefiting from the service