
ANNUAL AIR QUALITY REPORT
16
ANNUAL AIR QUALITY REPORT SAN LUIS OBISPO COUNTY CALIFORNIA 2006
Transcript of ANNUAL AIR QUALITY REPORT

ANNUAIR Q SAN LUCALIFO
2006AL UALITY REPORT
IS OBISPO COUNTY RNIA
AIR POLLUTION CONTROL DISTRICT COUNTY OF SAN LUIS OBISPO
3433 Roberto Court San Luis Obispo, California 93401
Phone: (805) 781-5912
Fax: (805) 781-1002 Burn Advisory (toll free): (800) 834-2876
Email: [email protected] World Wide Web Homepage: www.slocleanair.org
Air Pollution Control Officer: Larry Allen
Senior StaffCompliance and Monitoring: Karen Brooks
Engineering: Gary Willey Planning: Aeron Arlin Genet
Fiscal: Kevin Kaizuka Administrative Support: Kim Johnson
2006 Annual Air Quality ReportPublished November 2007
By Compliance and Monitoring Division

The air quality database for San Luis Obispo County is a public record and is available from the APCD office in various forms, including comprehensive records of all hourly or other sample values acquired anywhere in the county. Data summaries are published weekly on the APCD’s website and in this Annual Air Quality Report. Ozone summary data appear weekly in the Saturday edition of the San Luis Obispo County Tribune, a local newspaper. Each month’s data from ambient monitoring is added to separate archives maintained by the federal Environmental Protection Agency (EPA) and by the Air Resources Board (ARB). Summary data from San Luis Obispo County can be found in EPA and ARB publications and on the world wide web at the following websites: www.slocleanair.org SLO APCD website www.arb.ca.gov ARB website www.epa.govUS EPA website
2006 Air Quality Summary Although most populated areas of San Luis Obispo County enjoyed very good air quality this year, ozone levels exceeding both federal and state standards were measured on numerous days in the Carrizo Plains due to transported pollution from the San Joaquin Valley. Seven days exceeding the federal 8-hour ozone standard of 0.08 parts per million (ppm) were recorded in 2006 at the Carrizo Plains station, while exceedances of the more stringent state 8-hour ozone standard of 0.070 ppm occurred on fifty-two days there. Four exceedence days in Atascadero and seven exceedence days in Paso Robles were also concurrently recorded for the state 8-hour standard. In addition, four days exceeding the state one hour ozone standard of 0.09 ppm were measured at the Carrizo Plains station. Countywide, exceedences of the state 24 hour PM10 standard of 50 ug/m3 occurred six times out of 61 different sample days. Statistically, this is equivalent to 36 exceedence days for 2006 since sampling is only conducted once every six days. Four exceedence days were recorded at Nipomo Mesa 2 station and one exceedence day was recorded at the Paso Robles station. On October 26, 2006 stations at San Luis Obispo, Morro Bay, Mesa 2, Nipomo Regional Park and Paso Robles all recorded an exceedence of the state PM10 standard due to smoke impacts from the Day Fire in the Angeles National Forest. A county-wide Health Advisory was issued for smoke impacts from that fire by San Luis Obispo County’s Health Officer and Air Pollution Control Officer. There was no measured exceedence of state or federal PM2.5 standards or the federal air quality standard for PM10 in 2006. In San Luis Obispo County, ozone and PM10 are the pollutants of main concern, since exceedences of state health-based standards for those are experienced here in most years. Our county is designated as a non-attainment area for the state PM10 standard. Air Quality Monitoring San Luis Obispo County air quality was measured in 2006 by a network of nine ambient air monitoring stations and one seasonal research station run only during the summer ozone season. Station locations are depicted on the map on page 2. The APCD operated six permanent stations at Nipomo Regional Park, Grover Beach, Morro Bay, Atascadero, Red Hills and Carrizo Plains. The seasonal research station on the summit of Black Mountain was closed at the end of October 2006. The State Air Resources Board (ARB) operated stations at San Luis Obispo and Paso Robles. One station on the Nipomo Mesa was operated by the District for the ConocoPhillips refinery in 2006. A tenth station, a special purpose PM10 monitoring station, is operated at Hillview, Nipomo Mesa. In 2006 District staff completed a comprehensive review of the ambient air monitoring network to evaluate how well it is achieving our goal to provide adequate, representative and useful air quality data. This review will be covered in the 2007 Annual Report. Air quality monitoring is rigorously controlled by federal and state quality assurance and control procedures to ensure data validity. Gaseous pollutant levels are measured continuously and averaged each hour, 24 hours a day. Particulate pollutants are generally sampled by filter techniques for averaging periods of 24 hours. PM10 (respirable particulate matter 10 microns or less in size) and PM2.5 (fine particulate matter 2.5 microns or less in size) are sampled for 24 hours every sixth day on the same schedule nationwide. In addition, PM10 is sampled continuously at the Atascadero monitoring station using a TEOM (tapered element oscillating microbalance) sampler.
1

2

Table 1: Ambient Air Quality Parameters Monitored in San Luis Obispo County in 2006
O3 NO NO2 NOx SO2 CO PM10 PM2.5 TEOM WS WD ATM
APCD Permanent Stations
Atascadero X X X X X X X X X XMorro Bay X X X X X X XNipomo Reg. Park X X X X X X X X XRed Hills X X X XCarrizo Plains X X X X X APCD Research Station
Black Mountain1 X X X XSouth County Special Study Sites Hillview XARB Stations San Luis Obispo2 X X X X X X X X X XPaso Robles X X X X XOperated by APCD Mesa 2, Nipomo X X XX XGrover Beach3
3
X X Notes: 1 Black Mountain was discontinued at the end of October 2006. 2 The Air Resources Board discontinued nitrogen dioxide and carbon monoxide monitoring in November 2006. 3 Grover Beach is operated as a meteorology station only.
Acronyms: O3 Ozone SO2 Sulfur Dioxide PM10 Particulates < 10 microns WS Wind Speed NO Nitric Oxide CO Carbon Monoxide (samples every sixth day) WD Wind Direction NO2 Nitrogen Dioxide NOx Oxides of Nitrogen
TEOM Particulates <10 microns (monitored continuously)
PM2.5 Particulates < 2.5 microns (samples every sixth day)
ATM Ambient Temp
4
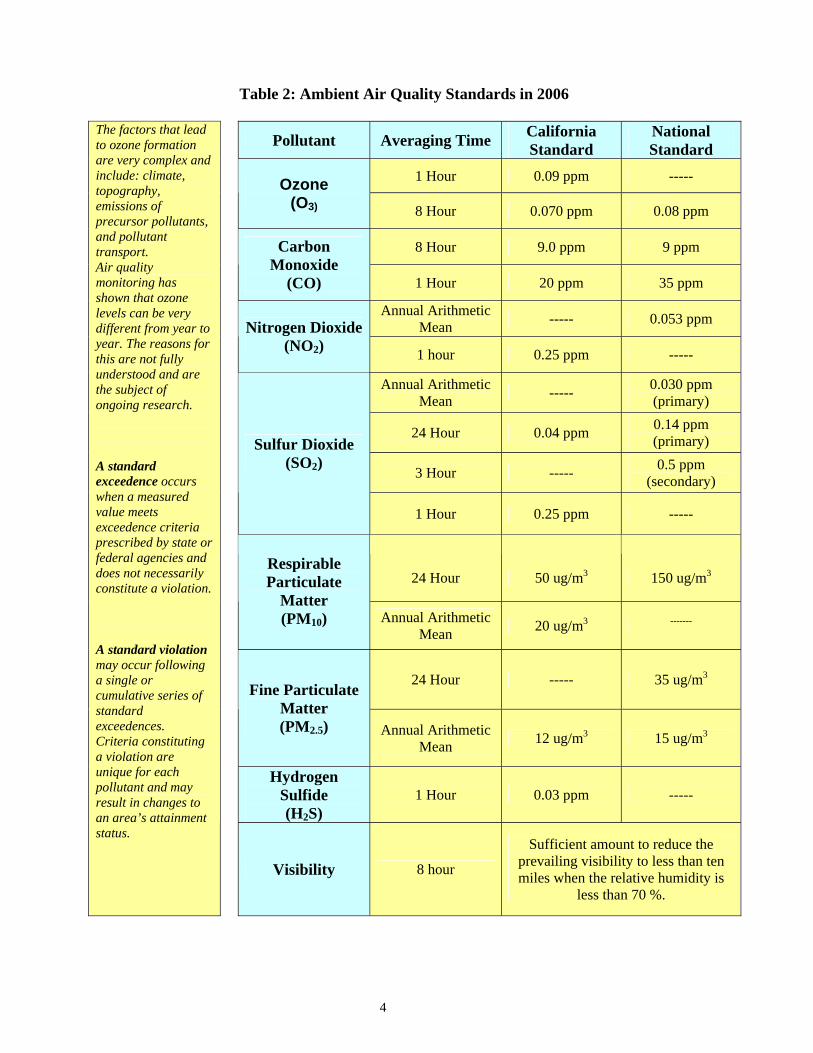
Table 2: Ambient Air Quality Standards in 2006
Pollutant Averaging Time California
Standard National Standard
1 Hour 0.09 ppm -----
Ozone
(O3) 8 Hour 0.070 ppm 0.08 ppm
8 Hour 9.0 ppm 9 ppm
Carbon Monoxide
(CO) 1 Hour 20 ppm 35 ppm
Annual Arithmetic Mean ----- 0.053 ppm
Nitrogen Dioxide
(NO2) 1 hour 0.25 ppm -----
Annual Arithmetic Mean ----- 0.030 ppm
(primary)
24 Hour 0.04 ppm 0.14 ppm (primary)
3 Hour ----- 0.5 ppm
(secondary)
Sulfur Dioxide (SO2)
1 Hour 0.25 ppm -----
24 Hour 50 ug/m3 150 ug/m3
Respirable Particulate
Matter (PM10) Annual Arithmetic
Mean 20 ug/m3 -------
24 Hour ----- 35 ug/m3
Fine Particulate Matter (PM2.5) Annual Arithmetic
Mean 12 ug/m3 15 ug/m3
Hydrogen Sulfide (H2S)
1 Hour 0.03 ppm -----
The factors that lead to ozone formation are very complex and include: climate, topography, emissions of precursor pollutants, and pollutant transport. Air quality monitoring has shown that ozone levels can be very different from year to year. The reasons for this are not fully understood and are the subject of ongoing research. A standard exceedence occurs when a measured value meets exceedence criteria prescribed by state or federal agencies and does not necessarily constitute a violation. A standard violation may occur following a single or cumulative series of standard exceedences. Criteria constituting a violation are unique for each pollutant and may result in changes to an area’s attainment status.
Visibility 8 hour
Sufficient amount to reduce the prevailing visibility to less than ten miles when the relative humidity is
less than 70 %.

5
While ground level ozone is harmful to plants and animals and is considered a pollutant, upper level (stratospheric) ozone occurs naturally and protects the earth from harmful ultra-violet energy from the sun. Fine particulate matter, in addition to being a health hazard, can greatly reduce visibility. Research suggests that fine particulate is much more detrimental to human health than previously thought. NO2 and SO2 create aerosols, which may fall as acid rain causing damage to crops, forests, and lakes. CO is a colorless, odorless gas that can lower the blood’s ability to carry oxygen.
Ambient Air Pollutants Of Local Concern Ozone Although ozone occurs naturally at low concentrations near the earth's surface, much higher and unhealthful levels are created when airborne mixtures of hydrocarbons and oxides of nitrogen are driven by sunlight to react, forming ozone pollution. The emissions of these ozone precursor pollutants come from many human activities, but primarily from industry and the wide use of motor vehicles. As a pollutant, ozone is a strong oxidant gas which attacks plant and animal tissues. It causes impaired breathing and reduced lung capacity, especially among children, athletes and persons with compromised respiratory systems. It also causes significant crop and forest damage. Ozone is a pollutant of particular concern in California where geography, climate and high population densities contribute to frequent violations of health-based air quality standards. Particulate Matter Ambient air quality standards have been established for two classes of particulate matter: PM10 (respirable particulate matter less than 10 microns in aerodynamic diameter), and PM2.5 (fine particulate matter 2.5 microns or less in aerodynamic diameter). Both consist of many different types of particles that vary in their chemical activity and toxicity. PM2.5 tends to be a greater health risk since it cannot be removed from the lungs once it is deeply inhaled. Sources of particulate pollution include: diesel exhaust, mineral extraction and production; combustion products from industry and motor vehicles; demolition and construction; agricultural operations; smoke from open burning; paved and unpaved roads; condensation of gaseous pollutants into liquid or solid particles; and natural sources such as wind-blown dust. NO2, SO2, CO Nitrogen dioxide (NO2) is the brownish-colored component of smog. NO2 irritates the eyes, nose and throat, and can damage lung tissues. Sulfur dioxide (SO2) is a colorless gas with health effects similar to NO2. Both pollutants are generated by fossil fuel combustion from mobile sources (such as vehicles, ships and aircraft), and at stationary sources (such as industry, homes and businesses). SO2 may also be emitted by petroleum production and refining operations. The state and national standards for NO2 have never been exceeded in this county. The Air Resources Board discontinued NO2 monitoring at the San Luis Obispo Station in November 2006. The state standard for SO2 was exceeded periodically on the Nipomo Mesa up until 1993. Equipment and processes at the facilities responsible for the emissions were upgraded as a result, and the state SO2 standard has not been exceeded since that time. Exceedences of the federal SO2 standard have never been measured here. Carbon monoxide (CO) can cause headaches and fatigue and results from fuel combustion of all types. Motor vehicles are by far the chief contributor of CO in outdoor air. State CO standards have not been exceeded in San Luis Obispo County since 1975. The Air Resources Board discontinued CO monitoring at the San Luis Obispo Station in November 2006.

2006 Ozone The following graphs depict 2006 monthly ozone concentrations at seven monitoring stations in the county. There are two data bars presented for each month. The monthly maximum hour bar shows the highest hourly average concentration during the month in parts per billion (ppb). The monthly mean bar is a monthly average concentration and depicts average ozone intensity (in ppb) for the month. There were four days of exceedence of the state hourly standard for ozone in 2006 measured at Carrizo Plains. Fifty-two exeedence days of the state eight hour standard were recorded at the Carrizo Plains station and concurrently four days at the Atascadero and seven days at the Paso Robles stations. There were seven exceedence days of the federal 8-hour ozone standard measured in 2006 recorded at the Carrizo Plains station.
San Luis Obispo 2006 Ozone
0
20
40
60
80
100
120
140
JAN FEB MAR APR MAY JUN JUL AUG SEP OCT NOV DEC
ozon
e co
ncen
tratio
n (p
pb)
Monthly Maximum Hour Monthly Mean
State Standard 0.09 ppm
Morro Bay 2006 Ozone
0
20
40
60
80
100
120
140
JAN FEB MAR APR MAY JUN JUL AUG SEP OCT NOV DEC
ozon
e co
ncen
trat
ion
(ppb
)
Monthly Maximum Hour Monthly Mean
State Standard 0.09 ppm
Nipomo Regional Park 2006 Ozone
0
20
40
60
80
100
120
140
JAN FEB MAR APR MAY JUN JUL AUG SEP OCT NOV DEC
ozon
e co
ncen
tratio
n (p
pb)
Monthly Maximum Hour Monthly Mean
State Standard 0.09 ppm
Carrizo Plains 2006 Ozone
0
20
40
60
80
100
120
140
JAN FEB MAR APR MAY JUN JUL AUG SEP OCT NOV DEC
ozon
e co
ncen
tratio
n (p
pb)
Monthly Maximum Hour Monthly Mean
State Standard 0.09 ppm
Atascadero 2006 Ozone
0
20
40
60
80
100
120
140
JAN FEB MAR APR MAY JUN JUL AUG SEP OCT NOV DEC
ozon
e co
ncen
trat
ion
(ppb
)
Monthly Maximum Hour Monthly Mean
State Standard 0.09 ppm
Paso Robles 2006 Ozone
0
20
40
60
80
100
120
140
JAN FEB MAR APR MAY JUN JUL AUG SEP OCT NOV DEC
ozon
e co
ncen
tratio
n (p
pb)
Monthly Maximum Hour Monthly Mean
State Standard 0.09 ppm
Red Hills 2006 Ozone
0
20
40
60
80
100
120
140
JAN FEB MAR APR MAY JUN JUL AUG SEP OCT NOV DEC
ozon
e co
ncen
trat
ion
(ppb
)
Monthly Maximum Hour Monthly Mean
State Standard 0.09 ppm
6
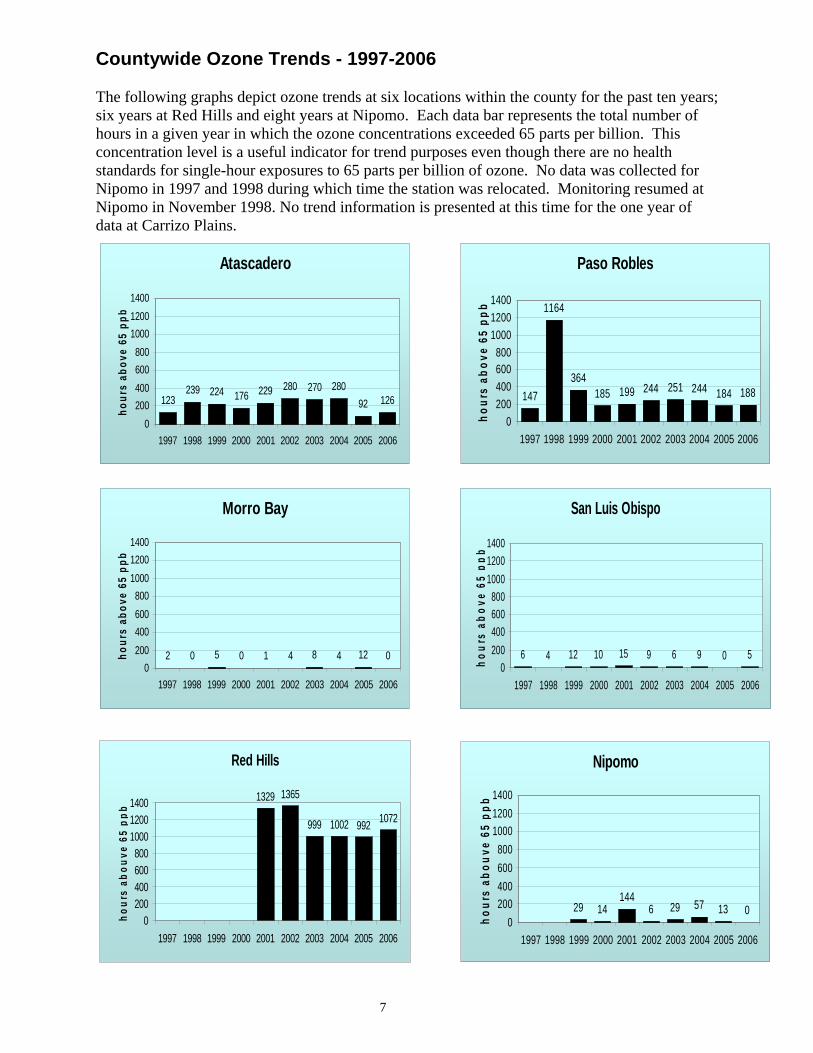
Countywide Ozone Trends - 1997-2006 The following graphs depict ozone trends at six locations within the county for the past ten years; six years at Red Hills and eight years at Nipomo. Each data bar represents the total number of hours in a given year in which the ozone concentrations exceeded 65 parts per billion. This concentration level is a useful indicator for trend purposes even though there are no health standards for single-hour exposures to 65 parts per billion of ozone. No data was collected for Nipomo in 1997 and 1998 during which time the station was relocated. Monitoring resumed at Nipomo in November 1998. No trend information is presented at this time for the one year of data at Carrizo Plains.
Atascadero
123239 224 176 229 280 270 280
92 126
0200400600800
100012001400
1997 1998 1999 2000 2001 2002 2003 2004 2005 2006
hour
s ab
ove
65 p
pb
Paso Robles
147
1164
364185 199 244 251 244 184 188
0200400600800
100012001400
1997 1998 1999 2000 2001 2002 2003 2004 2005 2006
hour
s ab
ove
65 p
pb
San Luis Obispo
6 4 12 10 15 9 6 9 0 50
200400600800
100012001400
1997 1998 1999 2000 2001 2002 2003 2004 2005 2006
hour
s ab
ove
65 p
pb
Morro Bay
2 0 5 0 1 4 8 4 12 00
200400600800
100012001400
1997 1998 1999 2000 2001 2002 2003 2004 2005 2006
hour
s ab
ove
65 p
pb
Nipomo
29 14144
6 29 57 13 00
200400600800
100012001400
1997 1998 1999 2000 2001 2002 2003 2004 2005 2006
hour
s ab
ouve
65
ppb
Red Hills
1329 1365
999 1002 992 1072
0200400600800
100012001400
1997 1998 1999 2000 2001 2002 2003 2004 2005 2006
hour
s ab
ouve
65
ppb
7
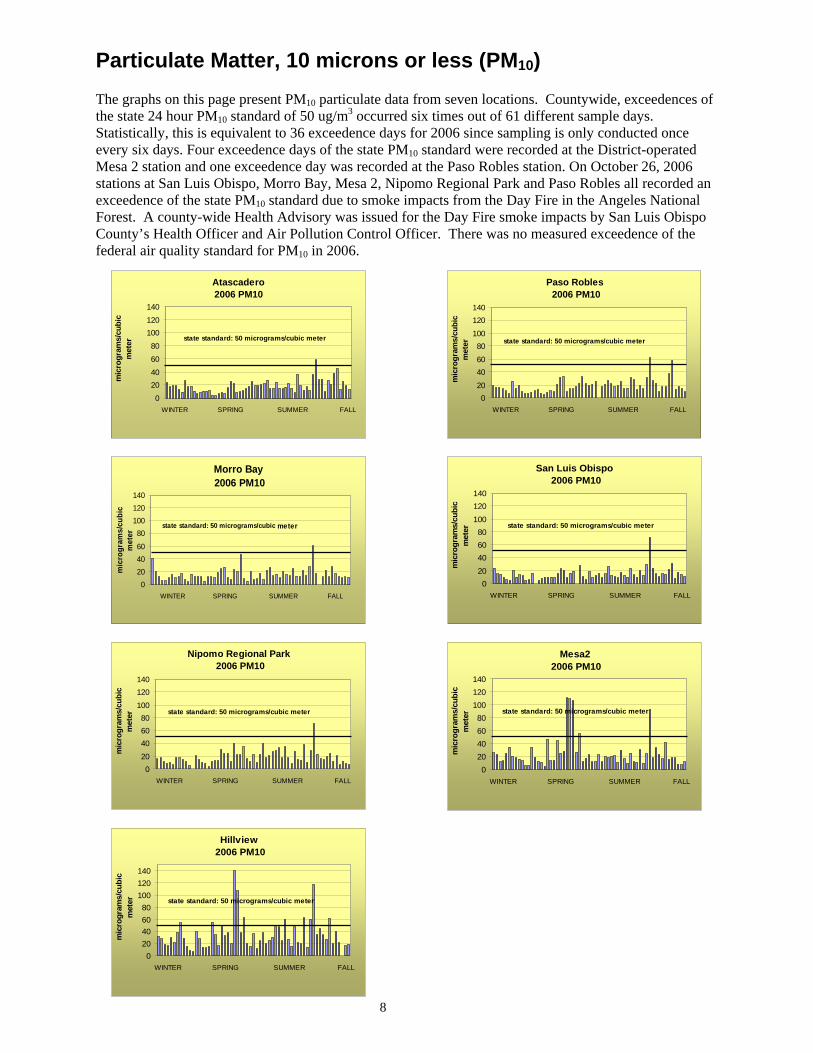
Particulate Matter, 10 microns or less (PM10) The graphs on this page present PM10 particulate data from seven locations. Countywide, exceedences of the state 24 hour PM10 standard of 50 ug/m3 occurred six times out of 61 different sample days. Statistically, this is equivalent to 36 exceedence days for 2006 since sampling is only conducted once every six days. Four exceedence days of the state PM10 standard were recorded at the District-operated Mesa 2 station and one exceedence day was recorded at the Paso Robles station. On October 26, 2006 stations at San Luis Obispo, Morro Bay, Mesa 2, Nipomo Regional Park and Paso Robles all recorded an exceedence of the state PM10 standard due to smoke impacts from the Day Fire in the Angeles National Forest. A county-wide Health Advisory was issued for the Day Fire smoke impacts by San Luis Obispo County’s Health Officer and Air Pollution Control Officer. There was no measured exceedence of the federal air quality standard for PM10 in 2006.
Atascadero2006 PM10
020406080
100120140
WINTER SPRING SUMMER FALL
mic
rogr
ams/
cubi
cm
eter state standard: 50 micrograms/cubic meter
Paso Robles 2006 PM10
020
4060
80100
120140
WINTER SPRING SUMMER FALL
mic
rogr
ams/
cubi
cm
eter state standard: 50 micrograms/cubic meter
Morro Bay 2006 PM10
0204060
80100120140
WINTER SPRING SUMMER FALL
mic
rogr
ams/
cubi
cm
eter
state standard: 50 micrograms/cubic meter
San Luis Obispo 2006 PM10
020406080
100120140
WINTER SPRING SUMMER FALL
mic
rogr
ams/
cubi
cm
eter state standard: 50 micrograms/cubic meter
Nipomo Regional Park 2006 PM10
020406080
100120140
WINTER SPRING SUMMER FALL
mic
rogr
ams/
cubi
cm
eter state standard: 50 micrograms/cubic meter
Mesa2 2006 PM10
020406080
100120140
WINTER SPRING SUMMER FALL
mic
rogr
ams/
cubi
cm
eter state standard: 50 micrograms/cubic meter
Hillview 2006 PM10
020406080
100120140
WINTER SPRING SUMMER FALL
mic
rogr
ams/
cubi
c m
eter state standard: 50 micrograms/cubic meter
8

Particulate Matter, 10 microns or less (PM10) continued. The graph below depicts the annual arithmetic average PM10 concentration at six locations in San Luis Obispo County over the past ten years (seven years at NRP). While occasional exceedences of the state PM10 standard occur at all sites, the monitors on the Nipomo Mesa at NRP and Guadalupe Road/Mesa 2 are consistently higher than elsewhere in the county. The reasons for this are being investigated through the South County Particulate Matter Phase II Study discussed on page 11 of this report.
9
Atascadero 2006 PM2.5
40
50
mic
rogr
ams/
cubi
c m
eter
0
10
20
30
1/5/
2006
2/5/
2006
3/5/
2006
4/5/
2006
5/5/
2006
6/5/
2006
7/5/
2006
8/5/
2006
9/5/
2006
10/5
/200
6
11/5
/200
6
12/5
/200
6
federal standard 35mg/m3
San Luis Obispo 2006 PM2.5
0
10
20
30
40
50
1/5/
2006
2/5/
2006
3/5/
2006
4/5/
2006
5/5/
2006
6/5/
2006
7/5/
2006
8/5/
2006
9/5/
2006
10/5
/200
6
11/5
/200
6
12/5
/200
6
ic m
eter
mic
rogr
ams/
cub
federal standard 35mg/m3
PM10 Trends
0
10
20
30
40
annu
al a
rith
met
ic m
ean
ug/m
3
97 98 99 2000 2001 2002 2003 2004 2005 2006
Paso Atas Moro SLO NRP Guad Rd./Mesa 2
state annual standard 20 ug/m3
Particulate Matter, 2.5 microns or less (PM2.5) Monitoring for fine particulate matter (PM2.5) began in 1999 and is performed at two locations in San Luis Obispo County: the San Luis Obispo and Atascadero monitoring stations. The federal standard for PM2.5 of 35 micrograms per cubic meter was not exceeded during 2006. California has not set a 24 hour PM2.5 standard.

10
Table 3: First, Second and Third Highest Hourly Averages for 2006 The following table lists the highest hourly (and 8-hour for ozone) concentrations (expressed in parts per million) recorded in 2006 for ozone, sulfur dioxide, nitrogen dioxide and carbon monoxide at the stations where they are monitored. Sampling date and hour appears with each data value in the format of month/day: hour.
O3 1-hour O3 8-hour
SO2
NO2
CO Station
1st 2nd
3rd
1st
2nd
3rd
1st
2nd
3rd
1st
2nd
3rd
1st
2nd
3rd
Paso Robles .088 6/22:20
.087 7/9:11
.086 7/21:12
.074 8/9:09 .073
7/16:10 .072 6/22:15
Atascadero .093 6/22:20
.085 7/8:12
.082 7/16:15
.076 7/16:13
.075 6/22:16
.071 8/9:09
.056 10/20:14
.056 12/07:16
.050 10/26:18
Morro Bay .063 10/28:14
.060 2/26:21
.059 5/14:22
.056 10/28:11 .055
2/26:20 .053 2/12:14
.046 12/05:17
.042 11/30:18
.039 02/09:08
San Luis Obispo
.070 8/9:15
.066 10/28:15
.059 09/18:12
.059 10/28:11
.058 8/9:11
.055 2/26:21
.035 10/26:20
.034 01/24:08
.034 02/08:08
1.1
02/23:08
1.1
03/13:06
1.0
02/23:07
Carrizo Plains
.103 5/19:15
.101 7/20:17
.96
9/27:14 .095
7/20:10 .087 7/15:12 .086
6/24:09
Nipomo Regional
Park
.064 9/18:16
.063 8/9:16
.062 02/12:20
.060 2/12:16 .059
2/26:22 .056 2/27:00
.052 07/22:09
.040 12/03:14
.037 12/03:17
.039 10/26:19
.033 12/06:18
.032 01/24:19
Nipomo, Mesa 2
.137 05/30:17
.122 02/13:16
.116 12/02:12
Table 4: Summary of Particulate Matter Concentrations for 2006 The following table lists the highest concentrations and the annual means recorded in 2006 for PM10 and PM2.5 particulate matter at the stations where they are monitored. Values are in micrograms/cubic meter. Values exceeding state or federal standards are in bold.
PM10 PM2.52006 Highest
Concentration Annual Arithmetic
Mean Highest
Concentration Annual Arithmetic
Mean
Paso Robles 62 ug/M3
10/26 19.2 ug/M3
Atascadero 58 ug/M3
10/26 18.2ug/M3 25.2 ug/M3
12/07 8.5 ug/M3
Morro Bay 60ug/M3
10/26 16.1ug/M3
San Luis Obispo 72 ug/M3
10/26 15.2ug/M3 24.2 ug/M3
09/20 7.1 ug/M3
Nipomo Regional Park 71 ug/M3
10/26 19.1ug/M3
Nipomo, Mesa2 110 ug/M3
5/23 25.9ug/M3
Hillview, Nipomo 141ug/M3
5/29 35.1ug/M3

Ozone at the Black Mountain Special Study Site in 2006 The following graph depicts monthly ozone concentrations at the Black Mountain research monitoring station operated by the District in 2006. There are two data bars presented for each month. The monthly maximum hour bar shows the highest hourly average concentration during the month in parts-per-billion (ppb). The monthly mean bar is a monthly average concentration and depicts overall average ozone intensity for the month (in ppb). The Black Mountain station was operated only during the summer ozone season and was discontinued at the end of October 2006. The Black Mountain research monitoring station was sited to provide the District with more information about possible transport of polluted air into our county from other areas, as well as providing us with a profile of ozone concentrations in the air column from ground level to about 4000 foot elevation. In general, ozone levels were higher at the study site located in elevated terrain than in populated areas at lower elevations where we regularly monitor for ozone. Information gathered at the site is used by APCD staff and ARB researchers in understanding regional pollutant transport within California. Special study site data is not reported to the official state or federal air quality databases and is not used in determination of our attainment status for ozone air quality standards.
Black Mtn. 2006 Ozone
0
20
40
60
80
100
120
140
JAN FEB MAR APR MAY JUN JUL AUG SEP OCT NOV DEC
ozon
e co
ncen
trat
ion
(ppb
)
Monthly Maximum Hour Monthly Mean
State Standard 0.09 ppm
South County Particulate Matter Study The report on the Nipomo Mesa Particulate Study, concluded in March 2006, was released to the public in 2007. The results of the study document a serious problem on the Mesa, with exceedances of five of the six state and federal health standards for fine and coarse particulates recorded over the study period. Exceedances of the state 24 hour PM10 standard were measured on over one quarter of the sample days. The study data clearly demonstrates that the single largest contributor to the particulate problem is high northwesterly wind events entraining crustal particles upwind from the Mesa and transporting them to the Mesa area; particulate concentrations dropped off substantially at the farther inland location of the Mesa. The farther the winds extended inland, the farther inland the high particulate concentrations extend. One exception to this pattern was the observation of localized areas of higher concentration that occurred near dirt roads composed of fine sandy particles. This study also attempted to evaluate the potential impacts from off-road vehicle activities at the Oceano Dunes State Vehicle Recreational Area (SVRA) on the elevated particulate levels seen on the Mesa. The SVRA is located upwind of the Mesa in the area shown by the study data to be the major source of particulates when high PM concentrations are measured on the Mesa. An analysis of average weekend and weekday particulate measurements taken on the Mesa over the past 12 years was conducted to determine if there were higher PM 11

12
levels on the weekends relative to the typically higher weekend off-road vehicle activity at the SVRA. The analysis found higher weekend concentrations at one monitoring station, but the data were not conclusive. Secondary impacts from the off-road activities, such as denuding vegetation, may also play a role by destabilizing the dune structure, allowing winds to entrain fine particles and carry them downwind. Determining the potential secondary impacts of the off-road activities is beyond the scope of this report, but deserves further study. Regardless of whether human activities or natural sources are responsible, the study documents the frequent occurrence of unhealthful particulate levels on the Mesa. Even though the composition of the particulates is mostly natural crustal particles, the health implications are not lessened. All fine airborne particulate matter, regardless of composition, can cause respiratory distress when inhaled, especially to the very young, the elderly and those with compromised respiratory systems. In addition, sand particles are high in crystalline silica, a known carcinogen with a high risk factor.
The study results also showed that sulfate concentrations on the Mesa are well below the California state sulfate standard, although higher sulfate concentrations were measured there than at other rural coastal areas of California. On days with light winds, the study data showed monitoring locations downwind from the ConocoPhillips Refinery complex had significantly higher sulfate concentrations than sites located upwind from the refinery. The coke calcining facility, the major source of sulfur dioxide emissions at the refinery complex, shut down in March 2007 and will not resume operations. The District Board of Directors has directed staff to conduct additional studies of particulate matter levels on the Nipomo Mesa to enable more definitive conclusions regarding the source(s) of the pollution and potential mitigation needed. Staff is currently working with the California Department of Parks and Recreation to design and implement a follow-on study to further investigate the potential influence of off-road vehicle use at the SVRA, agriculture and the refinery on the elevated PM levels measured on the Mesa. The study design is nearly complete, with implementation scheduled to begin in mid-January 2008 and run through a full year of PM monitoring in both impacted areas and similar non-impacted areas to provide adequate data on which to reach conclusions and base decisions. Comprehensive analysis of the data will begin after the field work is completed, with a formal report on the study findings expected to be completed in mid-2008.
H:\TECH\ANN_REPT\2006aqrpt\2006aqrptfullversion.doc

1
124240 225 182 237 282 280
141 92 134
0
200
400
600
800
1000
1200
1400
19
97
19
98
19
99
20
00
20
01
20
02
20
03
20
04
20
05
20
06h
ou
rs 6
5 p
pb
an
d a
bo
ve
Atascadero
160
1216
372
164 198 263 253149 184 198
0
200
400
600
800
1000
1200
1400
19
97
19
98
19
99
20
00
20
01
20
02
20
03
20
04
20
05
20
06ho
urs
65 p
pb
an
d a
bo
ve
Paso Robles
0 5 10 0 6 4 8 21 12 00
200
400
600
800
1000
1200
1400
19
97
19
98
19
99
20
00
20
01
20
02
20
03
20
04
20
05
20
06h
ou
rs 6
5 p
pb
an
d a
bo
ve
Morro Bay
7 5 13 10 16 9 6 44 4 50
200
400
600
800
1000
1200
1400
19
97
19
98
19
99
20
00
20
01
20
02
20
03
20
04
20
05
20
06h
ou
rs 6
5 p
pb
an
d a
bo
ve
San Luis Obispo
1411 1379
1068 1105 1077
1361
0
200
400
600
800
1000
1200
1400
1997
1998
1999
2000
2001
2002
2003
2004
2005
2006h
ou
rs 6
5 p
pb
an
d a
bo
ve
Red Hills
0 30 14153
20 58 57 13 00
200
400
600
800
1000
1200
1400
19
97
19
98
19
99
20
00
20
01
20
02
20
03
20
04
20
05
20
06ho
urs
65 p
pb
an
d a
bo
ve
Nipomo Regional Parks
Errata
Subsequent to the original publication of this report, some minor errors were discovered in the
ozone and PM10 trends charts on pages 7 and 9. Corrected charts appear below; see the 2008-2009
Annual Air Quality Report for detailed discussion of the errors in the original figures.

2
0
5
10
15
20
25
30
35
40
an
nu
al ari
thm
eti
c m
ea
n u
g/m
3PM10 Trends
1997
1998
1999
2000
2001
2002
2003
2004
2005
2006
Paso Atas Morro SLO NRP Mesa 2
state annual standard 20 ug/m3


