Annual 2014 Report 2015 - Parliament of Western Australia · In compliance with these guidelines...
148
about this report A workers’ compensation and injury management scheme that works for all Annual Report 2014 2015
Transcript of Annual 2014 Report 2015 - Parliament of Western Australia · In compliance with these guidelines...

about this report
A workers’ compensation and injury management scheme that works for all
AnnualReport
20142015

2
03 Statement of compliance04 About us06 Year in review
03 IntroductionContents
12 131320212229
32
35 3536
41 4962
Chairman & CEO report Agency briefLeadershipPeopleEnabling legislationGovernancePerformance Management FrameworkStrategic Plan 2012–2015
Open and transparent reportingComparative overview2014/15 scheme performance report
Service 1: Scheme RegulationService 2: Scheme ServicesReport against 2014/15Strategic Initiatives
11
34
40
Section 1: Agency in focus
Section 2: Scheme performance
Section 3: Report on operations
WorkCover WA Annual Report 2014/15© WorkCover WA, Government of Western Australia 2015
ISSN 1839-1281ISSN 1839-129X
65 67687071
73 7578788283
Opportunity & accessibilityEquality & inclusionSafety, health & wellbeingAgency challengesIT initiatives
Report on funds managementOther financial disclosuresMinisterial directivesGovernance disclosuresLegal complianceGovernment policy requirements
64
72
Section 4: Opportunities & challenges
Section 5: Disclosures & legal compliance
86 90
105 109
Additional KPI informationKey Performance Indicators
Financial statementsNotes to the financial statements
85
104
Section 6: Key Performance Indicators
Section 7: Financial statements & notes
3 | Annual Report 2014/15
About this reportStatement of complianceTo The Hon Michael Mischin MLC, Minister for Commerce
In accordance with section 63 of the Financial Management Act 2006, we hereby submit for your information and presentation to Parliament the report of the WorkCover Western Australia Authority for the financial year ended 30 June 2015. The Annual Report has been prepared in accordance with the provisions of the Financial Management Act 2006 and, where applicable, a statement acknowledging the incorporation within the Report of any special reporting requirements imposed upon WorkCover Western Australia Authority by any other written law.
Welcome to our 2014/15 Annual ReportThis report delivers a comprehensive analysis of our oversight and regulation of Western Australia’s workers’ compensation and injury management scheme over the past year. An introduction to WorkCover WA (the Agency) and our year in review begins on page 6. For a more comprehensive analysis of aspects of the year refer to section(s):
1. Agency in focus » p. 112. Scheme performance » p. 343. Report on operations » p. 404. Opportunities and challenges » p. 645. Disclosures and legal compliance » p. 726. Key Performance Indicators » p. 857. Financial statements and notes » p. 104 This report was developed in line with the Public Sector Commission’s Western Australian Public Sector Annual Reporting Framework for the 2014/15 Reporting Year and the Department of Treasury’s Model Annual Report for Net Cost of Service Statutory Authorities. In compliance with these guidelines costs were minimised for production and printing. As printed copies of each annual report are limited, this report is published on the Agency’s website workcover.wa.gov.au in the ‘Resources’ section. It adheres to State Government requirements for accessibility and readability, and can be viewed in PDF format as a whole or in sections. Alternative formats are available on request. This publication may be copied in whole or part, with acknowledgement of WorkCover WA.
Greg JoyceChairmanWorkCover WA28 August 2015
Michelle ReynoldsChief Executive OfficerWorkCover WA28 August 2015

| Annual Report 2014/154
Introduction | WorkCover WA Annual Report 2014/15
Our strategic directionThe Agency’s Strategic Plan 2012 – 2015 (see page 32) identifies four strategic goals that direct and focus WorkCover WA’s activities:
• Goal 1: Strategic scheme management Maintain the integrity and stability of the scheme
• Goal 2: Stakeholder confidence and engagement Promote stakeholder engagement and confidence in the sustainability of the scheme
• Goal 3: Regulatory compliance Ensure compliance with the regulatory requirements of the scheme
• Goal 4: Organisational excellence Ensure WorkCover WA has the right people, culture, systems and processes to deliver high quality outcomes
Our profileWorkCover WA is the government agency responsible for overseeing the workers’ compensation and injury management scheme in Western Australia.
Our role includes:• regulating scheme participants and monitoring compliance with the
Workers’ Compensation and Injury Management Act 1981 (the Act);• educating workers, employers and other scheme participants about
workers’ compensation and injury management; and• providing an independent dispute resolution service.
Our purposeWorkCover WA’s purpose is to lead a contemporary, healthy and integrated workers’ compensation scheme that is fair, accessible and cost-effective for all participants through:• providing advice and guidance on workers’ compensation and injury
management• active, responsive and transparent management of the scheme • focused information, education and compliance activities • fair and timely dispute resolution• a strong customer service focus.
About us
VisionA workers’ compensation and injury management scheme that works for all.

5 | Annual Report 2014/15
Our valuesCustomer Service We are clear about what we will deliver We consider our customers and their needs We commit, act and deliver
Innovation We are proactive, positive, flexible and act strategically We recognise that change is constant and that it can bring opportunity We build on opportunities
Respect We embrace diversity and individual differences We seek to understand and recognise peoples’ interests and rights We are fair and prompt in our actions and dealings with others
Integrity We are trustworthy and accountable We act in a consistent and impartial manner We are transparent in our decision making
Collaboration We work as a team We value the contribution of others We embrace a culture of open communication
Our stakeholdersEvery worker and employer is a stakeholder in the workers' compensation and injury management scheme.
By operating in workers’ compensation and injury management contexts, health providers (general practitioners, allied health, Approved Medical Specialists, workplace rehabilitation providers, audiometric officers) and service providers (insurers, legal practitioners) are important scheme participants who contribute to the effective management of the scheme.
The workers’ compensation scheme in Western Australia delivers for workers and employers because of strong relationships between all, exemplified this year at our highly successful Injury Management Conference. WorkCover WA proudly brought the workers’ compensation community together, providing an opportunity to share best practice and collectively consider improvements to the scheme. Collaboration and consultation underpins the way we do our business and ensures scheme sustainability.
Michelle ReynoldsChief Executive OfficerWorkCover WA

Introduction | WorkCover WA Annual Report 2014/15
| Annual Report 2014/156
Year in review
10,621enquiries
into expired policies, cancellations, new businesses and new owner checks
684investigations
into potential breaches of the Act
79prosecutions
completed against non-compliant employers
4,113registrations
of Memorandum of Agreement for the finalisation of workers’ compensation claims via settlement
2,242conciliations
completed
482arbitrations
completed
13,310publications
mailed to workers, employers, health providers and service providers
262,045visits
to the WorkCover WA website
22,836calls
for advice and assistance handled by the Advice and Assistance Unit
2,401hours
of staff training completed
Year in numbers

7 | Annual Report 2014/15
With focus on stakeholder engagement, injury management professionals and other service providers had an opportunity to connect at the inaugural WorkCover WA Injury Management Conference which took place in May 2015. A case study on the development of the biennial conference is detailed in Section 3: Report on operations on page 58.
Internally, the Agency remained committed to the health and wellbeing of its staff through a variety of development and occupational safety and health related initiatives, as outlined in Section 4: Opportunities and challenges.
The Agency’s compliance with State Government policies and its financial performance in 2014/15 is disclosed in Section 5: Disclosures and legal compliance (page 72) and Section 7: Financial statements and notes respectively (page 104).
Year in briefWorkCover WA has a significant role in ensuring the Western Australian workers’ compensation and injury management scheme operates fairly and efficiently for all stakeholders (workers and employers) and scheme participants (insurers, health professionals and legal representatives).
As detailed in Section 1: Agency in focus, WorkCover WA’s contribution to Government Goal 3, ‘Results-Based Service Delivery’ is achieved through the delivery of two services: regulation of scheme participants for compliance with legislative requirements; and the provision of effective and equitable dispute resolution and other services to scheme participants. The Agency’s delivery of these services is analysed in Section 3: Report on operations. WorkCover WA’s success in delivering these services is measured against Key Performance Indicators (KPIs) outlined in Section 6: Key Performance Indicators.
The overall workers’ compensation environment in the State remained healthy in 2014/15. Section 2: Scheme performance presents an analysis of the WA workers’ compensation and injury management scheme.
This year’s report concludes the period covered by WorkCover WA’s Strategic Plan 2012–2015. The four key goals of the Strategic Plan (page 32) focused on the Agency’s approach to strategic scheme management, stakeholder engagement, regulatory compliance and organisational excellence. In 2014/15, three final initiatives were delivered against this plan. The Agency’s successful delivery of these strategic initiatives is described in detail in Section 3: Report on operations. The Strategic Plan 2015 – 2018 commenced on 1 July 2015.

| Annual Report 2014/158
Introduction | WorkCover WA Annual Report 2014/15
Year in dollarsThe majority of funding (62 per cent) for WorkCover WA’s activities is derived from insurer contributions in the form of an annual levy on workers’ compensation premiums paid by employers and by a direct levy on employers who are approved by WorkCover WA to self-insure.
The snapshot below represents a consolidation of both the General and Supplementation Funds. Please refer to Section 7: Financial statements and notes on page 104 for more detailed analysis and disclosure.
Table 1: WorkCover WA totals for 2014/15
Revenue $34.854 million
Expenditure $21.566 million
Staff costs account for 65 per cent of agency expenditure. The remaining funds were expended on claims, supplies and services, accommodation and other expenses.
Refer to Figure 2 for a breakdown of expenditure.
Full financial analysis and disclosures available at: Report on funds management » p. 73 Financial statements and notes » p. 104
Figure 1: WorkCover WA revenue
Figure 2: WorkCover WA expenditure

9 | Annual Report 2014/15
Table 3: Indicators of efficiency snapshot
# Description 2014/15 Target/Result Reference
1.1Average cost per employer compliance activity
Target
Result
$257
$255p.97
1.2
Average cost per approved and monitored service provider
Target
Result
$3,309
$3,250p.98
1.3
Average cost per client contact to provide information and advice
Target
Result
$113
$120p.99
2.1Average cost to complete a conciliation
Target
Result
$2,023
$1,966p.101
2.2Average cost to complete an arbitration
Target
Result
$8,611
$10,042p.102
2.3
Average cost to process a Memorandum of Agreement
Target
Result
$401
$342p.103
Year scorecard
2014/15 performance snapshotThe outcomes of WorkCover WA’s activities and services are measured by Key Performance Indicators (KPIs) comprised of effectiveness and efficiency indicators. The 2014/15 scorecard provides a snapshot view of our performance for the year.
Full explanations on all measures, analysed against previous years and set targets, are located on the page(s) referenced beside each indicator in Table 2 and 3.
Table 2: Indicators of effectiveness snapshot
# Description 2014/15 Target/Result Reference
1.1
Number of non-compliance events identified as a result of a claim on the General Account
Target
Result
8
3p.92
1.2
Proportion of conciliations completed within eight weeks
Target
Result
97.0%
96.3%p.94
1.3Proportion of disputes resolved within six months
Target
Result
90.0%
88.8%p.95

Introduction | WorkCover WA Annual Report 2014/15
| Annual Report 2014/1510
Delivery of Strategic InitiativesTable 4 summarises the delivery of our 2014/15 Strategic Initiatives.
Table 4: Delivery of 2014/15 Strategic Initiatives
# Commitment Outcome Reference
1Legislative review: Phase two
Delivered ✓
This project involved policy development and consultation aimed at enabling a complete redraft of the Act. Cabinet approved the drafting of the new Bill in 2014. In 2015/16 a new project: New Act Implementation will focus on the drafting, consultation and implementation of the new Act.
p.62
2
Injury management guidance material for medical practitioners
Delivered ✓
The Injury Management Guidance Material for Medical Practitioners project has been completed and outcomes will be reflected in the 2015/18 Injury Management Strategy.
p.63
3
Electronic Document and Records Management System
Delivered ✓
The EDRMS Whole of Agency Implementation project was completed with all deliverables achieved. The project included an updated Records Management Policy and a new Recordkeeping Plan which have been submitted to the State Records Office.
p.63

about this report
11 | Annual Report 2014/15
Section 1 Agency in focus12 Chairman & CEO report13 Agency brief13 Leadership20 People21 Enabling legislation22 Governance 29 Performance Management Framework32 Strategic Plan 2012–2015
12
Section 1: Agency in focus | WorkCover WA Annual Report 2014/15
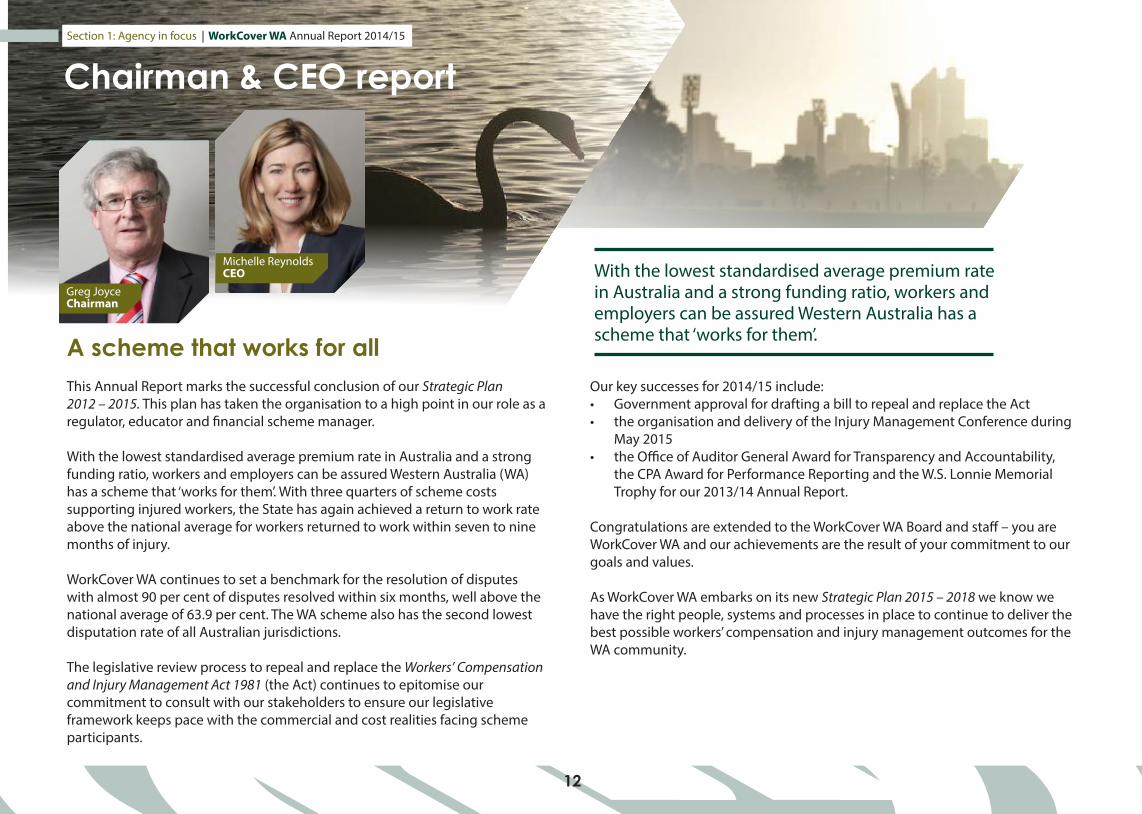
Our key successes for 2014/15 include:• Government approval for drafting a bill to repeal and replace the Act• the organisation and delivery of the Injury Management Conference during
May 2015• the Office of Auditor General Award for Transparency and Accountability,
the CPA Award for Performance Reporting and the W.S. Lonnie Memorial Trophy for our 2013/14 Annual Report.
Congratulations are extended to the WorkCover WA Board and staff – you are WorkCover WA and our achievements are the result of your commitment to our goals and values.
As WorkCover WA embarks on its new Strategic Plan 2015 – 2018 we know we have the right people, systems and processes in place to continue to deliver the best possible workers’ compensation and injury management outcomes for the WA community.
A scheme that works for allThis Annual Report marks the successful conclusion of our Strategic Plan 2012 – 2015. This plan has taken the organisation to a high point in our role as a regulator, educator and financial scheme manager.
With the lowest standardised average premium rate in Australia and a strong funding ratio, workers and employers can be assured Western Australia (WA) has a scheme that ‘works for them’. With three quarters of scheme costs supporting injured workers, the State has again achieved a return to work rate above the national average for workers returned to work within seven to nine months of injury. WorkCover WA continues to set a benchmark for the resolution of disputes with almost 90 per cent of disputes resolved within six months, well above the national average of 63.9 per cent. The WA scheme also has the second lowest disputation rate of all Australian jurisdictions.
The legislative review process to repeal and replace the Workers’ Compensation and Injury Management Act 1981 (the Act) continues to epitomise our commitment to consult with our stakeholders to ensure our legislative framework keeps pace with the commercial and cost realities facing scheme participants.
Chairman & CEO report
With the lowest standardised average premium rate in Australia and a strong funding ratio, workers and employers can be assured Western Australia has a scheme that ‘works for them’.
Greg Joyce Chairman
Michelle Reynolds CEO
13 | Annual Report 2014/15
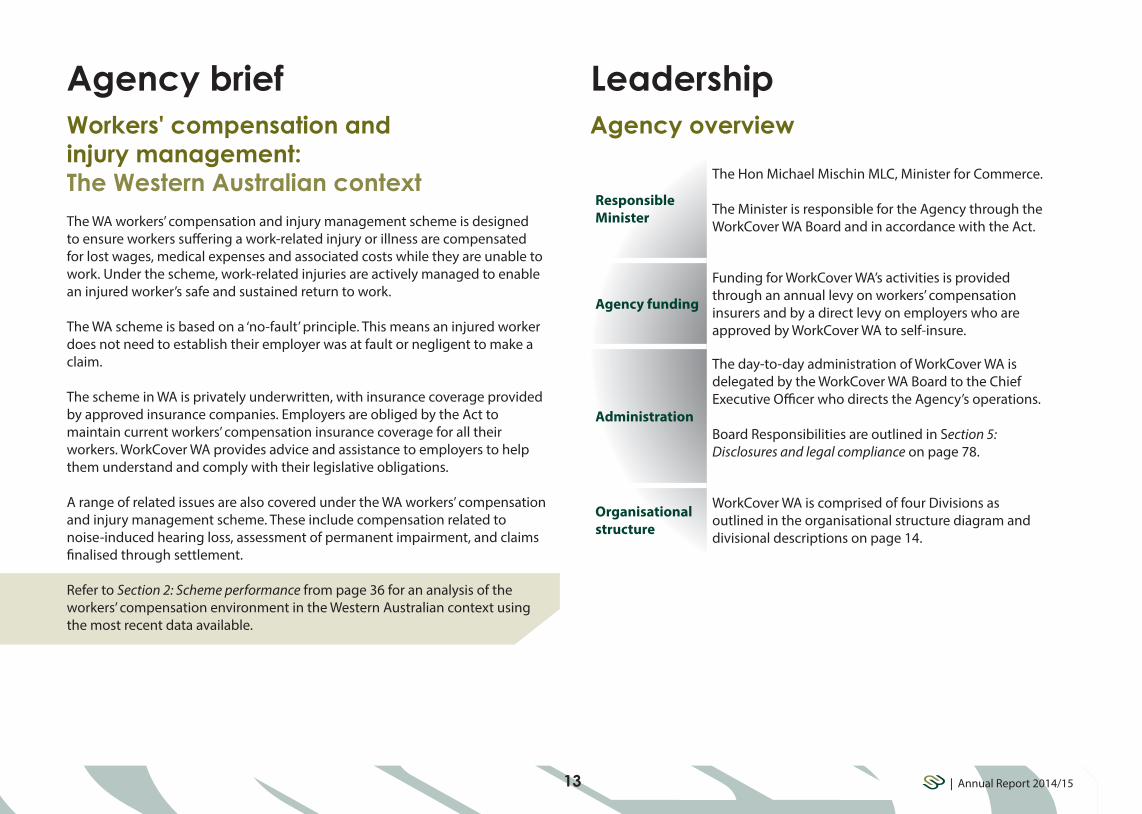
Agency brief LeadershipWorkers' compensation and injury management: The Western Australian contextThe WA workers’ compensation and injury management scheme is designed to ensure workers suffering a work-related injury or illness are compensated for lost wages, medical expenses and associated costs while they are unable to work. Under the scheme, work-related injuries are actively managed to enable an injured worker’s safe and sustained return to work.
The WA scheme is based on a ‘no-fault’ principle. This means an injured worker does not need to establish their employer was at fault or negligent to make a claim.
The scheme in WA is privately underwritten, with insurance coverage provided by approved insurance companies. Employers are obliged by the Act to maintain current workers’ compensation insurance coverage for all their workers. WorkCover WA provides advice and assistance to employers to help them understand and comply with their legislative obligations.
A range of related issues are also covered under the WA workers’ compensation and injury management scheme. These include compensation related to noise-induced hearing loss, assessment of permanent impairment, and claims finalised through settlement.
Refer to Section 2: Scheme performance from page 36 for an analysis of the workers’ compensation environment in the Western Australian context using the most recent data available.
Agency overview
Responsible Minister
The Hon Michael Mischin MLC, Minister for Commerce.
The Minister is responsible for the Agency through the WorkCover WA Board and in accordance with the Act.
Agency funding
Funding for WorkCover WA’s activities is provided through an annual levy on workers’ compensation insurers and by a direct levy on employers who are approved by WorkCover WA to self-insure.
Administration
The day-to-day administration of WorkCover WA is delegated by the WorkCover WA Board to the Chief Executive Officer who directs the Agency’s operations.
Board Responsibilities are outlined in Section 5: Disclosures and legal compliance on page 78.
Organisational structure
WorkCover WA is comprised of four Divisions as outlined in the organisational structure diagram and divisional descriptions on page 14.

Section 1: Agency in focus | WorkCover WA Annual Report 2014/15
Divisions and directionCorporate ExecutiveWorkCover WA is led by a Corporate Executive team comprised of the Chief Executive Officer, divisional heads, Registrar Arbitration and Chief Finance Officer. The Corporate Executive is responsible for developing, monitoring and reporting the Agency’s overall corporate direction, budgeting, planning and monitoring of operational performance.
Organisational structure
MINISTER FOR COMMERCE
WorkCover WA Board
Chief Executive Officer
Executive Services
Corporate Resources Division
Legislation & Scheme Information Division
Regulatory Services Division
Audit
Conciliation & ArbitrationServices
• Provision of dispute resolution services
• Registration of agreements
• Applications for common law access
• Financial and budget management
• Facilities, asset and procurement management
• Records management
• Information and communications technology and systems
• Human resource services
• Legislation• Scheme
information• Policy and scheme
development• Business
intelligence services
• Investigation and enforcement
• Standards and accreditation
• Complaints management
• Customer assistance and advice
• Communications and education
14
From left: Registrar Nilan Ekanayake, General Manager Corporate Resources Ron de Blank, General Manager Legislation & Scheme Information Chris White, Chief Executive Officer Michelle Reynolds, General Manager Conciliation and Arbitration Services Harley White, Chief Finance Officer John Hull, and General Manager Regulatory Services Wendy Attenborough
Refer to page 18 for Senior Officer profiles

15 | Annual Report 2014/15
Conciliation & Arbitration ServicesThe Conciliation and Arbitration Services Division is responsible for the resolution of disputes in the WA workers’ compensation and injury management scheme. The Division comprises the Conciliation Service (where the objective is agreement between parties to disputes) and the Arbitration Service (where disputes unresolved by conciliation are determined according to their substantial merits with as little formality and technicality as possible).
Corporate ResourcesThe Corporate Resources Division ensures human, financial, technical, information and physical resources are available to support WorkCover WA’s operations.
Legislation & Scheme InformationThe Legislation and Scheme Information Division maintains scheme viability and effectiveness through:• policy and legislation development• collection, quality assurance and analysis of data provided by insurers and
self-insurers to assist compliance activities and set premium rates.
The Division has a strategic focus on activities to assist the Board and Government to effectively manage the workers’ compensation system.
Regulatory ServicesThe Regulatory Services Division ensures parties operating within the workers’ compensation and injury management scheme comply with their statutory and administrative obligations by:• establishing and monitoring performance standards for scheme
participants• conducting compliance investigations where breaches of statutory
obligations are suspected• investigating complaints against scheme participants and taking regulatory
actions, such as prosecution or issuing infringement notices • educating and assisting scheme stakeholders.

16
Section 1: Agency in focus | WorkCover WA Annual Report 2014/15
WorkCover WA BoardThe WorkCover Western Australia Authority (the Board) is responsible for governance of the Agency; the provision of independent advice to the Minister; and the approval of certain service providers. Constituted under section 94(1) of the Act, the Board is authorised to use and operate under the trading name ‘WorkCover WA’.
The Chief Executive Officer, who is a member of the Board, directs the operations and day-to-day administration of WorkCover WA through the implementation of the Board’s strategic direction. The Chief Executive Officer and all other staff of WorkCover WA are employed under the provisions of the Public Sector Management Act 1994.
To provide diversity and ensure all parties to workers’ compensation activities are fairly represented membership of the Board is defined under section 95 of the Act.
ChairmanAppointed by the Governor on the recommendation of the Minister
Greg Joyce has been a member and Chair of WorkCover WA’s Board since 1 May 2005. Mr Joyce was reappointed for a further three year term from 4 January 2014.Mr Joyce was the Director General of the Department of Housing and Works from July 2001 until his retirement in January 2005. Mr Joyce has a law degree from the University of Western Australia and is qualified to practise as a barrister and solicitor in Western Australia.
MembersMember – Chief Executive Officer of WorkCover WA *
Michelle Reynolds has served as Chief Executive Officer of WorkCover WA since 25 December 2008. Since commencing in the role, Ms Reynolds has been successful in delivering a legislative reform agenda which has resulted in the abolition of age restrictions in the Act along with other progressive changes. Ms Reynolds has 30 years’ experience in the Western Australian public sector, the past 14 years in senior executive roles and has played a key role in shaping public sector management policy. Ms Reynolds has a Bachelor of Arts and a Masters of Business Administration (University of Western Australia).
* From 1 July 2014 to 11 October 2014 Chris White, WorkCover WA's General Manager of Legislation and Scheme Information, was the Acting Chief Executive Officer of WorkCover WA whilst Ms Reynolds was seconded to the Department of the Premier and Cabinet. Mr White’s profile is available in the Senior Officers section on page 18.
Member – Chief Executive Officer of the Department of the Public Service of the State principally assisting the Minister charged with the administration of the Occupational Safety and Health Act 1984
Brian Bradley PSM is the Director General of the Department of Commerce. He served as Chairman of the former Workers' Compensation and Rehabilitation Commission from 2000 to 2005, and was the Western Australian member of the Australian Safety and Compensation Council from 2005 to April 2009.Mr Bradley is currently the Deputy Chair of the Western Australian Commission for Occupational Safety and Health, Western Australian member of Safe Work Australia and a member of the Legal Aid Commission.
Greg Joyce
Michelle Reynolds
Brian Bradley

Member – Experienced in workers' interests
Owen Whittle was appointed to the WorkCover WA Board on 4 January 2014, and was reappointed for three years on 30 December 2014. Mr Whittle is currently the Assistant Secretary of UnionsWA, with responsibility for workers’ compensation and occupational health and safety matters. Mr Whittle was previously employed by the Australian Manufacturing Workers’ Union and is a member of the ACTU’s Occupational Health and Safety Committee.
Member – Experienced in accounting and financial management
Victoria Wilmot was appointed to WorkCover WA’s Board on 4 January 2005, and was reappointed for a further three year term from 4 January 2014. She is Deputy Director Financial Services at the University of Western Australia. Ms Wilmot is a member of the Institute of Chartered Accountants (CA) in Australia, a Fellow of the Financial Services Institute of Australasia and a member of the Board of the University Credit Society Ltd.
Member – Experienced in employers' interests
Karin Lee was appointed a member of the WorkCover WA Board on 22 February 2011, and was reappointed for a further three years from 4 January 2014. Ms Lee is the Manager Safety and Risk Services at the WA Chamber of Commerce and Industry. Ms Lee has over 15 years of experience in the area of workers’ compensation and has previously worked at Allianz Insurance and WorkCover QLD, and in personal injury litigation matters. Ms Lee holds a Bachelor of Laws and a Graduate Certificate in Case Management (Rehabilitation) and is a graduate of the Australian Institute of Company Directors. Ms Lee is a member of the WA Commission for Occupational Safety and Health.
Member – Experienced in insurance matters
Steven Burns was appointed a member of the WorkCover WA Board on 1 October 2013, for a three year term. Mr Burns is a member of QBE Australia’s national workers’ compensation leadership team. Mr Burns joined the insurance industry in 1993 and has held general management and product management responsibility in Tasmania, Northern Territory, Western Australia, ACT and New Zealand. Board meeting attendance
and other disclosures available in Section 5: Disclosures and legal compliance on page 78.
Karin Lee
Steven Burns
17 | Annual Report 2014/15
Owen Whittle
Victoria Wilmot

18
Section 1: Agency in focus | WorkCover WA Annual Report 2014/15
General Manager, Conciliation and Arbitration Services; Director, Conciliation *
Harley White is General Manager, Conciliation and Arbitration Services. He has been employed in workers’ compensation and related fields since 1994, and has held positions in a number of areas within WorkCover WA including dispute resolution, policy and legislation, and regulation. He is a career public sector employee, having joined the sector in 1978 and holds a Diploma in Legal Studies.
* During the reporting period Ross Paparone, Wendy Attenborough and Christine Kain also undertook the role of the General Manager Conciliation and Arbitration Services; Director, Conciliation.
General Manager, Corporate ResourcesRon de Blank commenced at WorkCover WA as acting General Manager, Corporate Resources in May 2014. Mr de Blank is seconded from the Department of the Premier and Cabinet and brings significant senior experience working in the WA public sector and as a management consultant in areas including labour relations, human resource management and strategic policy. He holds a Bachelor of Economics with Honours from the University of Western Australia.
Senior officersThe Corporate Executive is WorkCover WA’s senior management team. The Corporate Executive team met monthly during 2014/15.
Chief Executive Officer *Michelle Reynolds has been successful in delivering a legislative reform agenda which has resulted in the abolition of age restrictions in the Act along with other progressive changes. Ms Reynolds has 30 years’ experience in the Western Australian public sector, the past 14 years in senior executive roles. Ms Reynolds has a Bachelor of Arts and a Masters of Business Administration from University of Western Australia.
* Chris White was the Acting Chief Executive Officer from 1 July 2014 to 11 October 2014.
General Manager, Legislation and Scheme InformationChris White is General Manager Legislation and Scheme Information and has more than 30 years’ experience in WA’s workers’ compensation and occupational safety and health policy. Mr White has held senior policy and management roles at both WorkCover WA and WorkSafe. Mr White holds a Master of Arts (Public Policy) from Murdoch University.
Michelle Reynolds
Chris White
Harley White
Ron de Blank

19 | Annual Report 2014/15
In June 2015 Nilan Ekanayake was appointed to the role of Registrar, Arbitration. Mr Ekanayake joined WorkCover WA from the independent Bar. He holds a Bachelor of Laws and a Bachelor of Arts from the Victoria University of Wellington.
Chief Finance OfficerJohn Hull commenced with WorkCover WA as Chief Finance Officer in July 2010. He has extensive public sector experience and has undertaken senior finance, compliance and corporate management roles across a range of agencies including the Department of Treasury and Finance and the Office of the Auditor General. Mr Hull is a CPA and has a Bachelor of Business in Finance and Accounting.
General Manager, Regulatory Services *Wendy Attenborough joined WorkCover WA in July 2008. She has since undertaken a number of Corporate Executive roles within WorkCover WA, including General Manager Scheme Development and General Manager Conciliation and Arbitration Services. Ms Attenborough assumed the responsibility of General Manager Regulatory Services in February 2015. Prior to joining WorkCover WA, Ms Attenborough was employed in a number of senior policy roles within the Western Australian Department of the Premier and Cabinet, including the Intergovernmental Relations Unit. Ms Attenborough holds a Bachelor of Arts from the University of Western Australia.
* During the reporting period Harley White also undertook the role of the General Manager Regulatory Services.
Registrar, Arbitration *Shane Melville was appointed as Registrar, Arbitration, in December 2011 and previously held the position of Director, Dispute Resolution Directorate. Mr Melville commenced at WorkCover WA as an Arbitrator in the Dispute Resolution Directorate in November 2005. He holds the degrees of Bachelor of Jurisprudence and Bachelor of Laws from the University of Western Australia, accreditation from the Institute of Arbitrators and Mediators Australia and has more than 25 years of experience as a legal practitioner in workers’ compensation litigation.
Mr Melville resigned from WorkCover WA on 4 December 2014 to take up the position of Principal Registrar at the District Court of Western Australia.
Wendy Attenborough
Shane Melville
Nilan Ekanayake
John Hull

20
Section 1: Agency in focus | WorkCover WA Annual Report 2014/15
Staff perceptionsWorkCover WA completed the Public Sector Commission’s (PSC) Public Sector Employee Perception Survey in April 2014. The survey responses were made available in September 2014, indicating:• WorkCover WA achieved a significantly
higher ‘strong satisfaction rating’ against the majority of questions than other public sector agencies.
• WorkCover WA staff have an excellent understanding and awareness of agency and public sector standards and policies.
People
Workforce profileFigure 3 summarises the Agency’s 2014/15 workforce profile. WorkCover WA’s complete FTE profile is disclosed on page 75 under ‘Employment and industrial relations’ in Section 5: Disclosures and legal compliance.
Workforce policiesWorkCover WA’s workforce policies are outlined under ‘Opportunity and accessibility’ in Section 4: Opportunities and challenges, and the entries disclosed under ‘Legal compliance’ in Section 5: Disclosures and legal compliance.
81%
7%
7% 3% 1% 1%
Full-time permanent
Full-time contract
Part-time (FTE)
Part-time contract (FTE)
Staff on secondment
Staff on traineeship
Figure 3: WorkCover WA workforce profile

21 | Annual Report 2014/15
Key legislation impacting on WorkCover WA’s activities• A New Tax System (Fringe Benefits Reporting) Act 1999 (Commonwealth)• A New Tax System (Goods and Services Tax) Act 1999 (Commonwealth)• Auditor General Act 2006• Corruption and Crime Commission Act 2003• Disability Services Act 1993• Electoral Act 1907• Electronic Transactions Act 2011• Equal Opportunity Act 1984• Financial Management Act 2006• Freedom of Information Act 1992• Industrial Relations Act 1979• Minimum Conditions of Employment Act 1993• Occupational Safety and Health Act 1984• Occupiers’ Liability Act 1985• Public and Bank Holidays Act 1972• Public Interest Disclosure Act 2003• Public Sector Management Act 1994• Public Sector Management (Redeployment and Redundancy) Regulations 1994• Salaries and Allowances Act 1975• Superannuation Guarantee (Administration) Act 1992 (Commonwealth)• State Supply Commission Act 1991• State Records Act 2000
Other written laws impacting on WorkCover WA’s activities• Competition Policy Reform (WA) Act 1996• Constitution Act 1889• Constitution Acts Amendment Act 1899• Coroners’ Act 1996• Criminal Code Act Compilation Act 1913• Defence Act 1903 (Commonwealth)• Evidence Act 1906• Interpretation Act 1984• State Administrative Tribunal Act 2004• Statutory Corporations (Liability of Directors) Act 1996
The WorkCover Western Australia Authority is constituted under section 94 of the Act. WorkCover WA’s functions and powers are detailed in sections 100 and 101 of the Act. The objectives and constitution of the Conciliation and Arbitration Services are contained within sections 177, 181 and 182ZO of the Act.
Legislation administered In the performance of its functions, WorkCover WA administers the following legislation:
• Workers’ Compensation and Injury Management Act 1981• Employers’ Indemnity Supplementation Fund Act 1980• Workers’ Compensation and Injury Management (Acts of Terrorism) Act 2001• Workers’ Compensation (Common Law Proceedings) Act 2004• Waterfront Workers’ (Compensation for Asbestos Related Diseases) Act 1986• Employers’ Indemnity Policies (Premium Rates) Act 1990
Subsidiary legislation• Workers’ Compensation and Injury Management Regulations 1982• Workers’ Compensation Code of Practice (Injury Management) 2005• Workers’ Compensation and Injury Management (Scales of Fees) Regulations 1998• Workers’ Compensation (Legal Practitioners and Registered Agents) Costs
Determination 2015• Workers’ Compensation and Rehabilitation (Acts of Terrorism) (Final Day)
Regulations 2002• WorkCover Western Australia Guides for the Evaluation of Permanent
Impairment – Third Edition• Workers’ Compensation and Injury Management Conciliation Rules 2011• Workers’ Compensation and Injury Management Arbitration Rules 2011
Enabling legislation
22
Section 1: Agency in focus | WorkCover WA Annual Report 2014/15
Medical CommitteeThe Medical Committee is an advisory committee established under section 100A of the Act to primarily provide guidance on permanent impairment assessment but also other matters of a medical nature within the Western Australian workers’ compensation scheme.
The Medical Committee is chaired by the Agency CEO and meets as required.Refer to page 80 under ‘Committees’ in Section 5: Disclosures and legal compliance for full disclosures on this committee.
Delegation of authorityTo contribute to the effectiveness of the Board and to meet specific legislative obligations, an Audit Committee, Costs Committee and Medical Committee are established to provide objective administration and management of certain elements of the WA workers' compensation and injury management scheme. Governance issues for the committees are included as a standing item at Board meetings.
As part of their governance practices these committees have:• formal documented terms of reference/standing orders• an appointed Chair who is also a Board member• committee members with the expertise most relevant to their respective
roles• mechanisms for regular reporting to the Board• appropriate administrative support.
Audit CommitteeThe Audit Committee provides assurance and assistance to the Board on WorkCover WA’s risk, control and compliance framework, and its external accountability responsibilities.
The Audit Committee is chaired by a member of the Board. Refer to page 79 under ‘Committees’ in Section 5: Disclosures and legal compliance for full disclosures on this committee.
Costs CommitteeThe Costs Committee is an independent committee established under section 269 of the Act reporting directly to the Minister for Commerce. It is empowered to make, amend or revoke a determination fixing maximum costs for legal and registered agent services in relation to conciliation and arbitration. The Costs Committee is chaired by the Agency CEO and meets every two years or as required. Refer to page 80 under ‘Committees’ in Section 5: Disclosures and legal compliance for full disclosures on this committee.
Governance
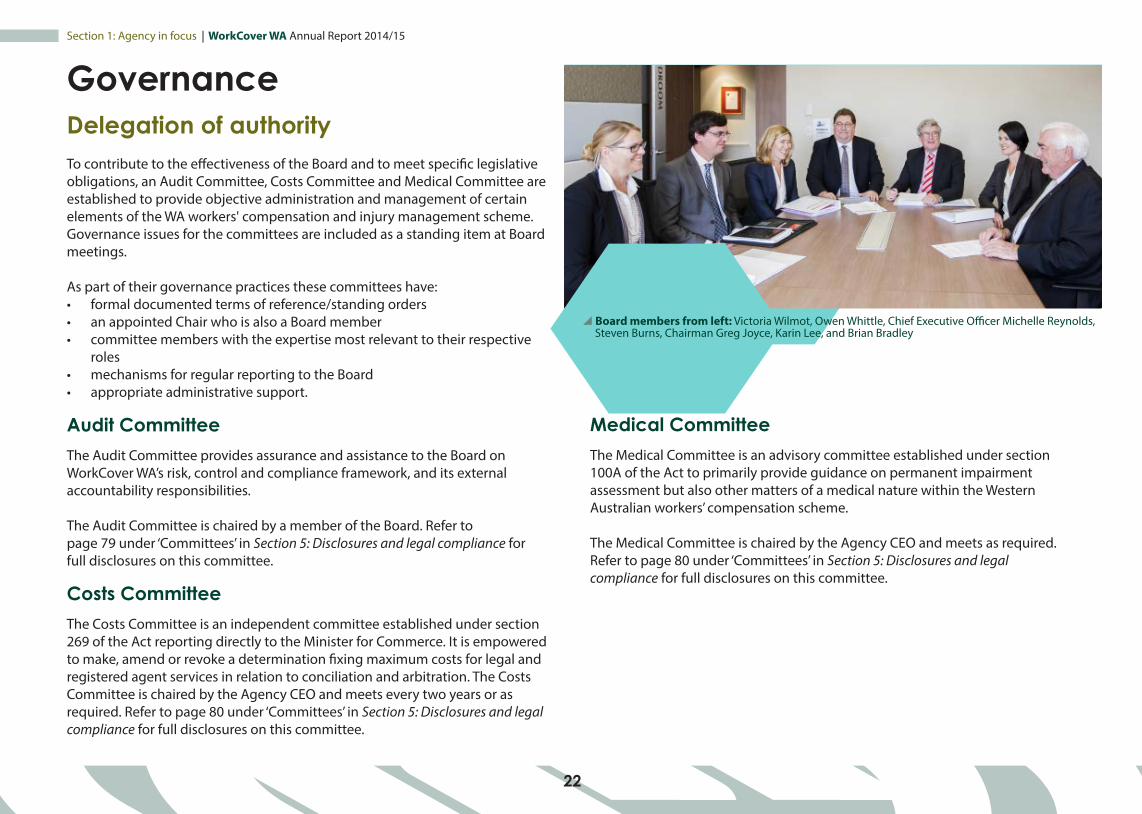
Board members from left: Victoria Wilmot, Owen Whittle, Chief Executive Officer Michelle Reynolds, Steven Burns, Chairman Greg Joyce, Karin Lee, and Brian Bradley

23 | Annual Report 2014/15
Emergency Planning CommitteeThe Emergency Planning Committee (EPC), in conjunction with the Emergency Control Organisation (ECO), is responsible for the development, implementation and maintenance of emergency plans, emergency response procedures and related training.
The Emergency Planning Committee is chaired by a member of the Corporate Executive and meets quarterly or as required.
During 2014/15 the EPC directed the ECO to conduct the required evacuation drill, specifically a scenario to address one of WorkCover WA’s most significant risks, a bush fire.
In response to a review of WorkCover WA’s security arrangements:• procedures for admitting visitors to the WorkCover WA building were
updated• photo identification of all staff has been introduced, and• procedures for dealing with difficult or threatening customers were
updated.
An SMS identification test, structured walkthrough and simulation tests were conducted. In response to these exercises all the business continuity documents were reviewed and updated.
Workplace consultationWorkCover WA has a number of internal committees which are all chaired by an Agency General Manager on a rotational basis. This level of participation reinforces the Agency’s commitment to each committee from an executive level.
Equity and Diversity CommitteeThe WorkCover WA Equity and Diversity Committee supports the delivery of the Agency’s commitment to develop a workplace culture compliant with and committed to equal employment opportunity and diversity principles, in which all people are treated with fairness, dignity and respect.
The Equity and Diversity Committee is chaired by a member of the Corporate Executive and meets quarterly.
It monitors policies relating to equal employment opportunity, disability and indigenous matters, and associated action plans. This includes the development of initiatives to raise staff awareness and understanding of equity and diversity; matters affecting people with disabilities; and employment strategies supporting diversity at WorkCover WA.
In 2014/15, the Committee:• developed the Agency’s Reconciliation Action Plan (RAP) for approval by
Reconciliation Australia• monitored the Agency’s progress against the Agency’s Disability Access and
Inclusion Plan• raised staff awareness of broad cultural sensitivities through the
development of an information sheet made available to all new and existing staff
• reviewed our premises and internal and external infrastructure to ensure accessibility for people with a disability
• ensured all new WorkCover WA forms comply with accessibility guidelines.
Section 1: Agency in focus | WorkCover WA Annual Report 2014/15
24
Joint Consultative CommitteeThe Joint Consultative Committee (JCC) is chaired by a member of the Corporate Executive and comprises WorkCover WA’s elected union delegates, the CEO and senior management representatives. The Committee meets quarterly or as required to ensure consultation occurs between staff and management on major issues affecting the working conditions of employees.
In 2014/15 the JCC made recommendations regarding the:• implementation of initiatives arising from the Public Sector Commission’s
Employee Perception Survey• election of Safety and Health representatives• the ‘Christmas/New Year closedown’ period• amendments to the Performance Development Agreement process.
The JCC also provided feedback on the review of a range of corporate policies and procedures.
Innovation Support CommitteeThe Innovation Support Committee was established in January 2015 to promote and support innovation in the Agency.
The Innovation Support Committee is chaired by the CEO and members meet fortnightly. The functions of the Committee are to:• oversee the operation of WorkCover WA’s Innovation Framework• promote innovation in the Agency• assist staff with the development of their ideas• review submissions and recommend supported ideas to the relevant
General Manager for implementation• report on innovation and outcomes to the Corporate Executive.
Since the Committee commenced in January 2015 it has met 11 times.
During the year the Innovation Support Committee introduced Launchpad, an internal web based idea management tool as a dedicated forum to raise and share ideas aimed at improving the Agency’s overall performance.
Since the commencement of this Committee 30 ideas have been submitted and four ideas implemented. In addition, two forums have been conducted where staff were invited to respond to a posed issue or problem. WorkCover WA also developed an Innovation Maturity Model based on Landgate’s Innovation Maturity Model. The model was developed to analyse the maturity of WorkCover WA’s innovation program and identify the steps required to lift the maturity of the program to the next level.

25 | Annual Report 2014/15
KPI Performance Reporting CommitteeThe KPI Performance Reporting Committee reviews and manages the Agency’s Outcome Based Management (OBM) structure. The KPI Performance Reporting Committee is chaired by the CEO and members consisting of the Corporate Executive and relevant staff meet quarterly or as required. The Committee must comply with relevant government directives, guidelines and legislation in developing, implementing and monitoring organisational performance outcomes. The KPI Performance Reporting Committee has integrated the Agency’s KPIs with operational processes to ensure KPIs are regarded as integral to the Agency’s reporting framework.
The Committee met five times in 2014/15. During the year, WorkCover WA received a Best Practice award from the Auditor General for the management and reporting of its finances and KPIs in 2013/14. WorkCover WA also received the CPA Australia Specialist Award for Performance Reporting at the prestigious IPAA W.S. Lonnie Awards which recognise excellence in annual reporting.
Risk Management Review GroupThe Risk Management Review Group (RMRG) oversees WorkCover WA’s risk management processes and is responsible for maintaining the Agency’s risk management framework. The RMRG is chaired by a Corporate Executive member and:• monitors and tracks risks• encourages and promotes greater awareness and understanding of risk
throughout all levels of the Agency• provides guidance on risk management.
During 2014/15 the RMRG participated in a comprehensive review of the Agency’s risk management framework. This involved:• development of a revised Agency risk structure• review of all Agency risks• evaluation and implementation of new risk management software systems• revised documentation of the risk management framework. A revised risk register has been implemented based on a structure integrating strategic, operational and project risks. The new systems have enhanced risk reporting to the Audit Committee.
Occupational Safety and Health CommitteeThe Occupational Safety and Health (OSH) Committee facilitates consultation and cooperation across WorkCover WA by examining issues affecting the health and wellbeing of staff, and developing and implementing measures to prevent workplace accidents and injuries. The Committee makes recommendations to both the Agency and its employees regarding the establishment, maintenance and monitoring of programs, measures and procedures in the workplace relating to the safety and health of all employees.
The OSH Committee is chaired by a member of the Corporate Executive and is comprised of a Human Resources Officer, the Administration Officer Business Services, and three elected employee representatives. The Committee meets on a quarterly basis to address OSH issues, and review hazards and incident reports.
In 2014/15, the OSH Committee was involved with the following initiatives:• election of new Safety and Health Representatives• ongoing implementation of the 2013–2015 OSH Management Plan• continuing provision of ergonomic workstation setups/assessments for new
employees• improvements to the online Hazard Management Reporting System• trial of an amended schedule for regular OSH workplace inspections.
During 2014/15 WorkCover WA maintained its gold status under the WorkSafe Plan issued by the Department of Commerce.
Occupational safety and health is a standing agenda item for all meetings of the Agency’s Corporate Executive.

Section 1: Agency in focus | WorkCover WA Annual Report 2014/15
26
All customer feedback was actioned within the agreed deadlines of five working days for verbal feedback and 10 working days for written feedback. Since 2013/14 the total number of complaints, compliments and suggestions increased by 33.3 per cent. This increase is seen as positive as it indicates that more people are using the Customer First Feedback System.
Complaints against scheme participants
Management of complaints about scheme participants is detailed in Section 3: Report on operations under ‘Regulating service providers’:• Complaints against insurers – page 46• Complaints against registered agents – page 47• Complaints against approved workplace rehabilitation providers (WRPs)
– page 47 • Complaints against approved medical specialists (AMS) – page 47
Complaints handlingCustomer First Feedback policy and proceduresFeedback from customers is the most immediate and effective way an agency can analyse public perception of its performance. A customer feedback system forms part of an agency’s commitment to continuously improve services to customers and the community.
WorkCover WA’s Customer First Feedback System complies with the Australian Standard on Complaints Handling (AS 10002-2006) and Public Sector Commission Circular 2009-27: Complaints Handling. The system provides customers with an avenue to deliver positive or negative feedback about the Agency’s services, decisions, procedures, policies and facilities.
This feedback mechanism increases WorkCover WA’s understanding of customer needs and expectations and identifies opportunities for organisational improvements. Customer feedback is reported regularly to the Agency’s Corporate Executive for discussion and trend identification.
Customer feedback is recorded either verbally (in person or by telephone) or in writing (by Customer First Feedback Form, email, website, letter, fax or ministerial). A response to verbal feedback must be provided within five working days, and written feedback must be responded to within 10 working days. More complex complaints are expected to be resolved within 30 working days.
2014/15 outcomes
Compliments 7
Complaints 16
Suggestions 7

27 | Annual Report 2014/15
Governance Policy: Official Communication This policy governs the flow of information between members of the Board, Board Committees and stakeholders, as well as the dissemination of information from the CEO to Agency employees.
This policy establishes:• who should communicate with whom, and when (including authorisation
to make public comment on behalf of WorkCover WA)• the extent of what should be communicated• confidentiality considerations.
External Data Release Policy
As WorkCover WA receives requests for aggregate and unit level data from external parties on a regular basis, the External Data Release Policy governs the supply of data to government agencies, researchers, stakeholders and the general public. The policy protects the Agency’s intellectual property and data confidentiality, and ensures the terms and conditions for the use of the supplied data are clearly outlined in written agreements.
Restriction of Communications when dealing with Unreasonable Customer Behaviour Policy
Open communication with stakeholders and the general public is part of WorkCover WA’s Values and Code of Conduct. However, customers may be restricted or excluded from contact with WorkCover WA staff where their behaviour is deemed unreasonable. This policy provides WorkCover WA staff with guidance on managing customers who have displayed unreasonable behaviour in the course of communications, whether it be in person, on the telephone or in writing (email, social media or letter).
Disclosure of Personal Information Policy
This policy ensures all personal information concerning WorkCover WA staff remains strictly confidential unless the staff member in question has given written consent for its disclosure.
Communications policiesWorkCover WA has a number of policies which govern internal communications with staff and external communications with stakeholders. These policies are supported by WorkCover WA’s Freedom of Information Policy, Records Management Policy and Code of Conduct to ensure the Agency is complying with relevant legislation whilst maintaining transparent and responsive internal and external communications.
An approved schedule ensures each policy is reviewed by a WorkCover WA Board and/or Corporate Executive member for adequacy, currency and effectiveness.
Customer Service Charter
The WorkCover WA Customer Service Charter identifies the Agency’s commitment to our customers and outlines the service they can expect to receive in dealing with us. The Customer Service Charter is supported by the Agency’s Customer First Feedback Policy and Procedures and managed through the online Customer First Feedback System as detailed in Section 1: Agency in focus under ‘Complaints handling – policy and procedures’ on page 26.
Communications Protocol
In accordance with section 74 of the Public Sector Management Act 1994, WorkCover WA has a Communications Protocol which outlines the manner and circumstances in which the CEO and Agency employees interact with the Minister’s Office.
Ministerial Correspondence
To ensure precise and timely provision of information to the Minister and accurate recordkeeping, WorkCover WA actively manages all ministerial communications. Detailed procedures exist to assist all officers involved in ministerial communication.
Statistical information regarding Ministerial communication is regularly reviewed by the Corporate Executive and the Board.
Section 1: Agency in focus | WorkCover WA Annual Report 2014/15
28
WorkCover WA’s risk management framework includes:• an Audit Committee (see ‘Governance disclosures’ in Section 5: Disclosures
and legal compliance on page 79) charged with the responsibility of providing assurance to the Board on WorkCover WA’s risks and controls
• an Audit Services Manager with the responsibility of advising the Agency on risk management
• a Risk Management Policy and Risk Management Guidelines• a Risk Management Review Group (see ‘Workplace consultation: Risk
Management Review Group’ on page 25) which provides ongoing assurance to the Corporate Executive risks are being addressed in a timely and appropriate manner
• risk management software.
The Agency’s Risk Management Policy and Risk Management Guidelines were reviewed in 2014/15 as part of an internal project to consider the effectiveness of our approach to risk management.
A new Risk Management Framework Guide was developed and endorsed by the Corporate Executive and the Audit Committee to support an Agency wide approach and commitment to risk management.
WorkCover WA will conduct a full audit in 2015/16 to evaluate the effectiveness of the risk management processes in place, compliance with ISO 31000:2009 and the effectiveness of the risk management software.
Other policies & proceduresThe Agency’s other policies and procedures involving risk management include:• business continuity manuals and plans• an Agency Governance Framework• Occupational Safety and Health Procedures• an Occupational Safety and Health Policy• an Occupational Safety and Health Management Plan• an Occupational Safety and Health Risk and Legal Register• an IT Risk Management Policy• an Information Security Policy• a Fraud and Corruption Prevention Policy.
Public Interest Disclosure
WorkCover WA is committed to the aims and objectives of the Public Interest Disclosure Act 2003 which facilitates the disclosure of public interest information by providing protection for those who make disclosures and those who are the subject of disclosures.
Information on what can be considered as a matter of public interest for disclosure, information to be included, how to make the disclosure and who to make the disclosure to is provided on the Agency’s internal intranet and external Website.
Freedom of Information
The Freedom of Information Act 1992 (the FOI Act) gives a general right of access to documents held by State and Local Government Agencies.
As required by section 94 of the FOI Act, WorkCover WA has published a Freedom of Information Statement. The Statement outlines the Agency’s processes and timelines for responding to FOI requests.
Risk management policiesRisk Management Framework
Risk management is a key business process for effective planning and decision making. WorkCover WA has developed organisation wide capabilities in risk management to ensure consistent, efficient and effective assessment of risk in the achievement of strategic objectives.
Our approach to risk is based on the principle that every staff member has a role to play in risk management and mitigation. Policies informing staff of all risk and occupational safety and health responsibilities are embedded in business activities and consolidated through training initiatives. These procedures ensure the Agency manages risks in accordance with the Australian and New Zealand standard AS/NZS ISO 31000:2009.
29 | Annual Report 2014/15
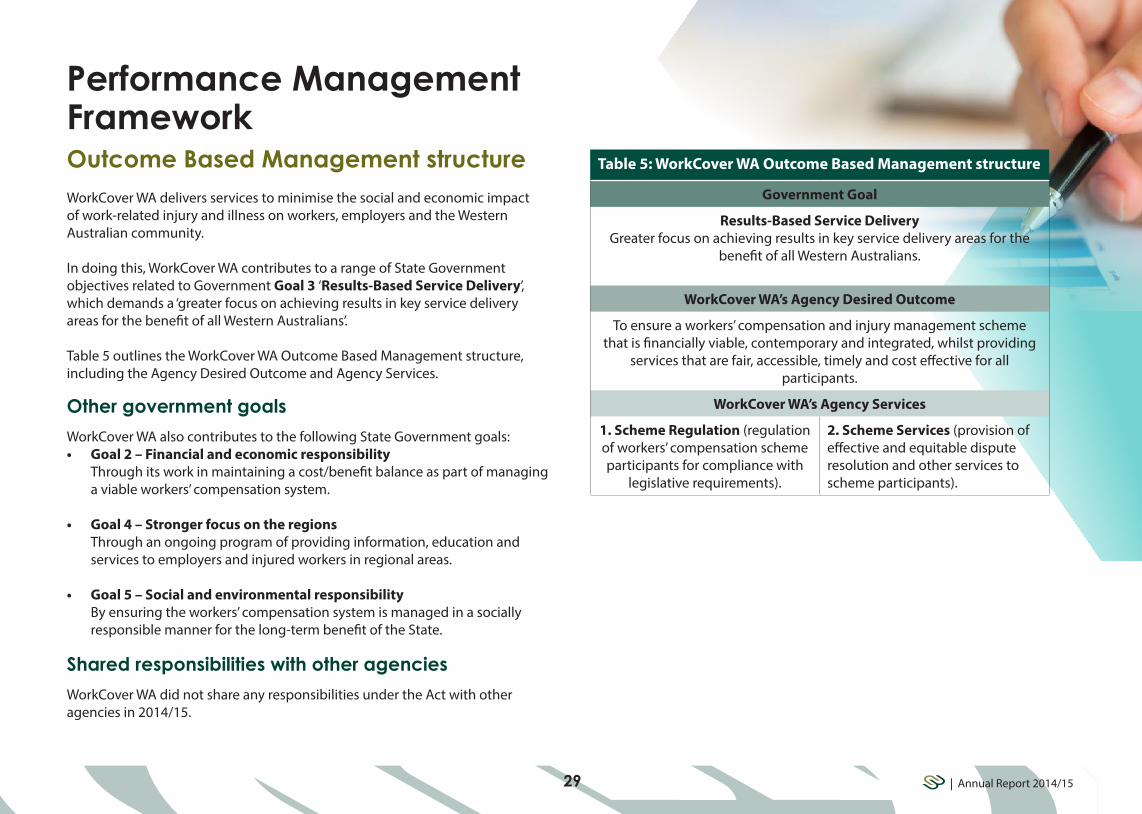
Table 5: WorkCover WA Outcome Based Management structure
Government Goal
Results-Based Service DeliveryGreater focus on achieving results in key service delivery areas for the
benefit of all Western Australians.
WorkCover WA’s Agency Desired Outcome
To ensure a workers’ compensation and injury management scheme that is financially viable, contemporary and integrated, whilst providing
services that are fair, accessible, timely and cost effective for all participants.
WorkCover WA’s Agency Services
1. Scheme Regulation (regulation of workers’ compensation scheme participants for compliance with
legislative requirements).
2. Scheme Services (provision of effective and equitable dispute resolution and other services to scheme participants).
Outcome Based Management structureWorkCover WA delivers services to minimise the social and economic impact of work-related injury and illness on workers, employers and the Western Australian community.
In doing this, WorkCover WA contributes to a range of State Government objectives related to Government Goal 3 ‘Results-Based Service Delivery’, which demands a ‘greater focus on achieving results in key service delivery areas for the benefit of all Western Australians’.
Table 5 outlines the WorkCover WA Outcome Based Management structure, including the Agency Desired Outcome and Agency Services.
Other government goals
WorkCover WA also contributes to the following State Government goals:• Goal 2 – Financial and economic responsibility
Through its work in maintaining a cost/benefit balance as part of managing a viable workers’ compensation system.
• Goal 4 – Stronger focus on the regions Through an ongoing program of providing information, education and services to employers and injured workers in regional areas.
• Goal 5 – Social and environmental responsibility By ensuring the workers’ compensation system is managed in a socially responsible manner for the long-term benefit of the State.
Shared responsibilities with other agencies
WorkCover WA did not share any responsibilities under the Act with other agencies in 2014/15.
Performance Management Framework

Section 1: Agency in focus | WorkCover WA Annual Report 2014/15
30
Key Performance Indicators (KPIs)
The Agency’s two services are linked to KPIs comprised of effectiveness and efficiency which indicate the extent to which WorkCover WA achieved its Agency Desired Outcome.
Key 'effectiveness' indicators
1.1 Number of non-compliance events identified as a result of a claim on the General Account
1.2 Proportion of conciliations completed within eight weeks
1.3 Proportion of disputes resolved within six months
Key 'efficiency' indicators
1.1 Average cost per employer compliance activity
1.2 Average cost per approved and monitored service provider
1.3 Average cost per client contact to provide information and advice
2.1 Average cost to complete a conciliation
2.2 Average cost to complete an arbitration
2.3 Average cost to process a Memorandum of Agreement
How we measure our performanceIn order to evaluate its contribution to State Government Goal 3 ‘Results-Based Service Delivery’, WorkCover WA measures its performance in the delivery of two services:
• Service 1: Scheme Regulation Regulation of workers’ compensation scheme participants for compliance with legislative requirements.
• Service 2: Scheme Services Provision of effective and equitable dispute resolution and other services to scheme participants.

31 | Annual Report 2014/15
Change 2: Key Effectiveness Indicator 1.3
This change involved replacing effectiveness KPI 1.3 'The average number of days to resolve a dispute' with a new KPI 'The proportion of disputes resolved within six months' to better show the overall performance of WorkCover WA in resolving disputes.
What this change meansThe new KPI shows the percentage of disputes resolved within six months from the initial date of acceptance for conciliation through to the day they are resolved through conciliation or arbitration.
The KPI is based on a long established metric calculated at a national level to compare the performance of workers’ compensation dispute resolution systems. This comparative information is provided in an annual performance monitoring report produced by Safe Work Australia which includes comparison of the performance of workers’ compensation dispute resolution agencies across Australia and New Zealand.
The new KPI covers all disputes resolved through conciliation or arbitration. The discontinued KPI, ‘The average number of days to resolve a dispute’, only measured disputes finalised through arbitration.
The discontinued KPI suggested case duration was typically lengthy, however these results were misleading as only 22 per cent of all disputed matters proceeded to arbitration in 2013/14 with an average of 190 days to resolution relative to a target of 126 days.
Refer to Section 6: Key Performance Indicators from page 85 for detailed information on WorkCover WA’s KPIs.
Changes to Key Performance Indicators (KPIs) in 2014/15WorkCover WA undertakes regular reviews of its OBM and KPI framework to ensure it provides the most suitable measures to indicate the Agency’s performance.
Changes to the OBM for the 2014/15 reporting year were endorsed by the Board on 20 November 2014, approved by the Under Treasurer on 16 December 2014, and noted by the Minister on 5 January 2015.
The two changes to the Agency’s KPIs were as follows:
Change 1: Key Effectiveness Indicator 1.2
This change involved shortening the title of Effectiveness KPI 1.2 from ‘The proportion of conciliations completed within eight weeks of the date the application for conciliation was accepted’ to ‘The proportion of conciliations completed within eight weeks.’
What this change meansIncluding the words 'of the date the application for conciliation was accepted' in the title of the KPI is unnecessary and simply stated part of the methodology used to determine the indicator outcome. No change was made to the methodology of the KPI and the shortened name brings the title more in line with other agency KPIs.

32
Section 1: Agency in focus | WorkCover WA Annual Report 2014/15
Strategic
Leaders
hip
WorkCover WA’s operations are guided by our Strategic Plan.
The Strategic Plan 2012–2015 recognises and reflects the Agency’s increasing maturity as an organisation, and the significant gains that have been made to the scheme and the organisation through a focus on our stakeholders, regulation and organisational excellence.
Strategic goals & initiativesThe Agency’s Strategic Plan 2012–2015 outlines four strategic goals that frame WorkCover WA’s business plans.
The four strategic goals are:
1. Strategic scheme management2. Stakeholder confidence and engagement3. Regulatory compliance4. Organisational excellence
Across each year of the Strategic Plan, WorkCover WA outlines Strategic Initiatives which are delivered within that financial year. These initiatives are aligned with, and contribute to, one or more of the four strategic goals.
To view the Agency’s performance against the 2014/15 Strategic Initiatives refer to page 62.
Strategic Plan 2012 – 2015
33 | Annual Report 2014/15
Strategic Initiatives we will deliver in 2015/16
Aligned with the three goals of the new strategic plan, WorkCover WA’s Strategic Initiatives for 2015/16 are outlined in Table 6.
Table 6: Strategic Goals vs 2015/16 Strategic Initiatives
Strategic Goal Strategic Initiative
1
Review of dispute resolution• An external review of the effectiveness of the current
dispute resolution processes
1
Development of an employer regulatory risk framework• A risk framework that assists in identifying and
regulating employers who are not compliant with the requirement to hold the requisite policy of insurance
2
GP clinical guidelines for mental health claims• GP engagement in injury management and return to
work processes• Impact of psychological injury and mental health
claims
3
Standard operating environment replacement strategy• Standard operating environment, desktop and laptop
replacement, and infrastructure upgrade. Delivery of a new operating environment and infrastructure
Outlook for the futureWorkCover WA’s new Strategic Plan 2015–2018 took effect on 1 July 2015 and positions the Agency to meet the challenges ahead with renewed purpose.
The plan articulates operational themes underpinning three redefined strategic goals:
1. Strategic Scheme Management2. Leadership3. Agile and Innovative Organisation
The Agency’s commitment to achieving these goals provides opportunities to further strengthen WorkCover WA and make Western Australia’s workers’ compensation and injury management scheme the best in Australia.
View the Strategic Plan 2015–2018 at workcover.wa.gov.au/about-us/workcover-wa-at-a-glance/strategic-direction/

about this report
34
Section 2 Scheme performance35 Open and transparent reporting35 Comparative overview36 2014/15 scheme performance report
Section 2: Scheme performance | WorkCover WA Annual Report 2014/15

35 | Annual Report 2014/15
Open & transparent reporting
The Western Australian workers’ compensation and injury management scheme is working well. According to the Comparative Performance Monitoring Report, Seventeenth Edition, analysis of the most recent comparative statistics shows WorkCover WA leads a scheme with:
✓ the lowest standardised average premium rate across the states and territories
✓nearly three quarters of scheme costs expended on services and payments for claimants, on par with the national average
✓ 89.5 per cent of claim disputes resolved within six months, well above the national average of 63.9 per cent
✓ a disputation rate of 3.1 per cent, the second lowest of all Australian jurisdictions
As a regulatory authority, the Agency monitors the performance of all aspects of the workers’ compensation and injury management scheme, and collects data about all workers’ compensation claims lodged. Codes are applied to the data to classify claims by industry and occupation.
WorkCover WA is an industry leader with the transparency of scheme data. To provide scheme participants with up-to-date information about scheme trends WorkCover WA regularly publishes a range of statistical reports on the WorkCover WA website.
During 2014/15 the Agency published the following:• Workers’ Compensation Annual Statistical Report• Scheme Quarterly Status Report• Insurer Claim Status Report • Medical, Allied Health and Vocational Rehabilitation Services Status Report• Conciliation and Arbitration Services Status Report.
In May 2015, WorkCover WA also released the publication Workers’ Compensation Scheme Trends (May 2015) which provides an accessible snapshot of the current WA workers’ compensation and injury management scheme.
WorkCover WA continues to work with the scheme actuary to produce annual recommended premium rates and quarterly statistical summaries from an actuarial perspective; these reports are also available at workcover.wa.gov.au.
Comparative overviewWorkCover WA is an industry leader with the transparency of scheme data.
Business Intelligence Services team From left: Han Chan, Manager Leona Glasby, Eoin Byrne, and Franky Ku

36
Section 2: Scheme performance | WorkCover WA Annual Report 2014/15
2014/15 scheme performance report
Claim trendsFrom 2009/10 to 2013/14, the annual number of claims lodged in the workers’ compensation scheme of WA decreased from 36,580 to 35,562 (three per cent). In 2011/12, claims peaked at 38,708 and dropped in 2013/14 by eight per cent.
The number of long duration claims (claims with 60 or more days/shifts lost) increased over the last five years, whereas claims with shorter duration and no lost-time decreased.
Figure 5: Claim trends
Important: Due to the nature of the processes involved in the capture, verification and analysis of claims data, information relating to time lost as a result of workers’ compensation claims is only available one year retrospectively. Therefore, some information from 2014/15 was unavailable at the time of publishing this report and we have reported on information from 2013/14.
Claim numbersIn 2013/14, 35,562 claims were lodged. Of these, 48 per cent involved at least one day or shift off work (claims with lost-time). Of all lost-time claims lodged in 2013/14, 32 per cent of claims had 60 or more days or shifts lost (long duration claims).
Further information on scheme performance is available from workcover.wa.gov.au under 'Resources – research, evaluation and statistics'.
Figure 4: Claim numbers 2013/14

37 | Annual Report 2014/15
Frequency of lost time claims by industry
In 2013/14, the industries with the highest lost-time claim frequencies were Arts and recreation services; Agriculture, forestry and fishing; Manufacturing; Health care and social assistance; and Construction.
Figure 7: Frequency of lost time claims by industry 2013/14
Frequency ratesThe number of lost-time claims per million hours worked (frequency rate) decreased by 13 per cent between 2009/10 and 2013/14. However, the frequency rate of longer duration claims increased for reporting period.
Figure 6: Frequency rates

38
Section 2: Scheme performance | WorkCover WA Annual Report 2014/15
Average recommended premium ratesWorkCover WA publishes annual recommended premium rates for workers’ compensation insurance for each industry. The average recommended premium rate for 2015/16 represents a decrease of 4.7 per cent on the previous rate, down from 1.556 per cent of total wages to 1.483 per cent of total wages.
The decrease in premium rates for 2015/16 was largely driven by:• wages growth in excess of wage inflation in Western Australia and a
decrease in the future rate of inflation• a decrease in the claim numbers for 2013/14 and in the half year to
31 December 2014• a lower rate of growth of claims with more than 60 days lost.
The average recommended premium rate has reduced by 30 per cent since 2006/07. High wages growth, improved occupational health and safety performance and strong rates of return for insurers over the last 10 years were the main drivers of these reductions.
Figure 9: WA average recommended premium rates
Scheme payments 2014/15During 2014/15, 67 per cent of scheme payments were paid directly to workers in the form of income payment and common law and lump sum payouts, while 22 per cent of payments were made for treatment services such as medical, allied health and vocational rehabilitation services. 11 per cent of payments were related to legal and other services.
Figure 8: Scheme payments 2014/15
During 2014/15, 67 per cent of scheme payments were paid directly to workers in the form of income payment and common law and lump sum payouts.
39 | Annual Report 2014/15
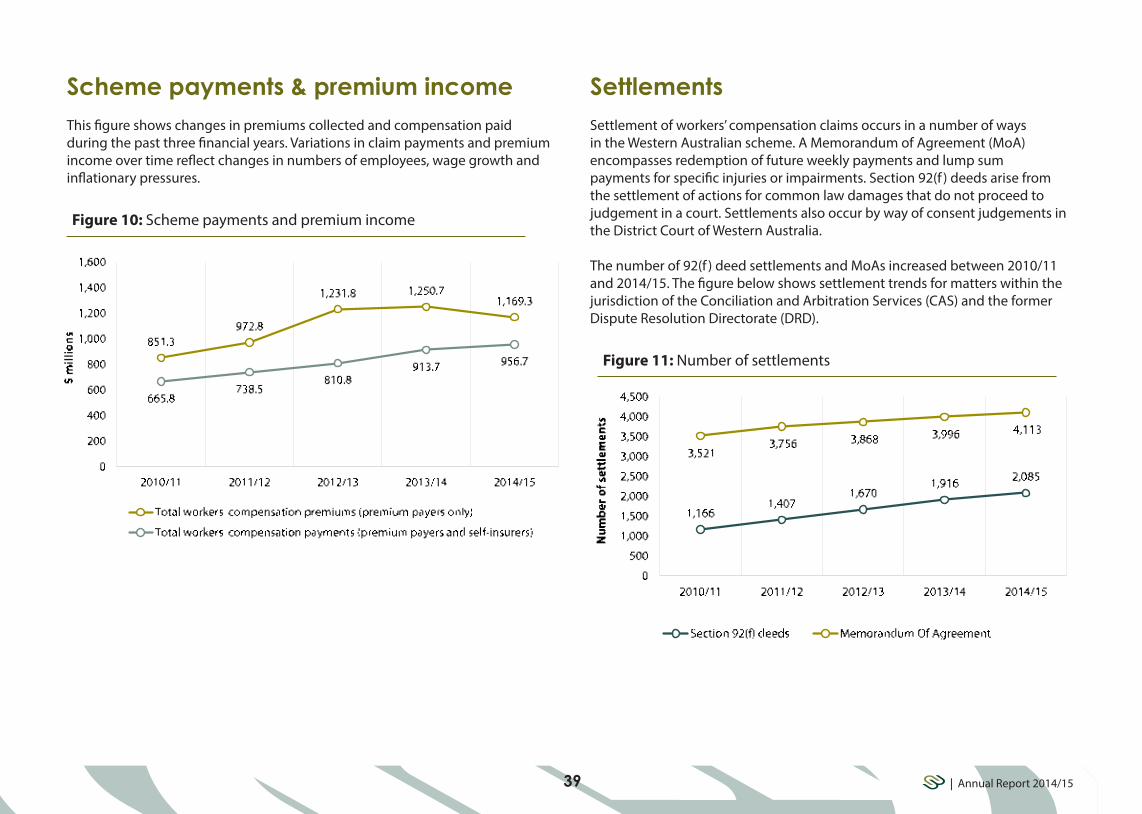
SettlementsSettlement of workers’ compensation claims occurs in a number of ways in the Western Australian scheme. A Memorandum of Agreement (MoA) encompasses redemption of future weekly payments and lump sum payments for specific injuries or impairments. Section 92(f ) deeds arise from the settlement of actions for common law damages that do not proceed to judgement in a court. Settlements also occur by way of consent judgements in the District Court of Western Australia.
The number of 92(f ) deed settlements and MoAs increased between 2010/11 and 2014/15. The figure below shows settlement trends for matters within the jurisdiction of the Conciliation and Arbitration Services (CAS) and the former Dispute Resolution Directorate (DRD).
Figure 11: Number of settlements
Scheme payments & premium incomeThis figure shows changes in premiums collected and compensation paid during the past three financial years. Variations in claim payments and premium income over time reflect changes in numbers of employees, wage growth and inflationary pressures.
Figure 10: Scheme payments and premium income

about this report
40
Section 3 Report on operations41 Service 1: Scheme Regulation49 Service 2: Scheme Services62 Report against 2014/15 Strategic Initiatives
Section 3: Report on operations | WorkCover WA Annual Report 2014/15
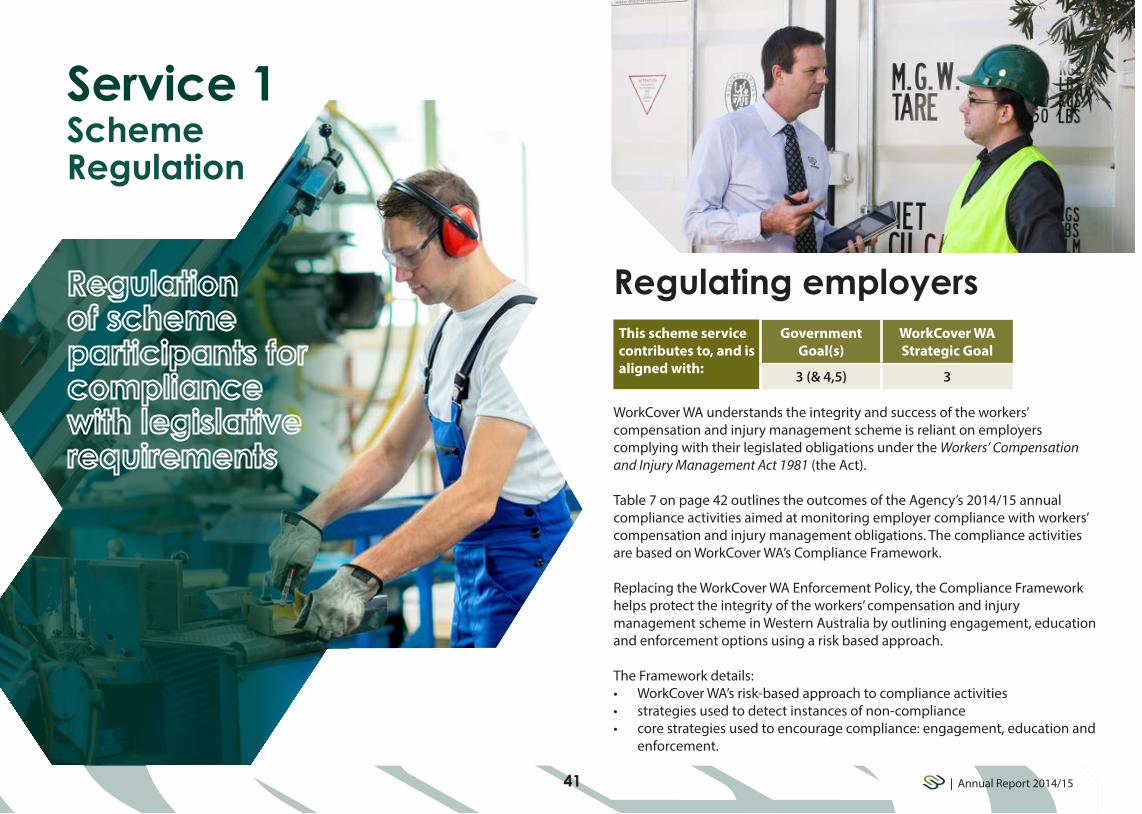
WorkCover WA understands the integrity and success of the workers’ compensation and injury management scheme is reliant on employers complying with their legislated obligations under the Workers’ Compensation and Injury Management Act 1981 (the Act).
Table 7 on page 42 outlines the outcomes of the Agency’s 2014/15 annual compliance activities aimed at monitoring employer compliance with workers’ compensation and injury management obligations. The compliance activities are based on WorkCover WA’s Compliance Framework.
Replacing the WorkCover WA Enforcement Policy, the Compliance Framework helps protect the integrity of the workers’ compensation and injury management scheme in Western Australia by outlining engagement, education and enforcement options using a risk based approach.
The Framework details:• WorkCover WA’s risk-based approach to compliance activities• strategies used to detect instances of non-compliance• core strategies used to encourage compliance: engagement, education and
enforcement.
Service 1 Scheme Regulation
This scheme service contributes to, and is aligned with:
Government Goal(s)
WorkCover WA Strategic Goal
3 (& 4,5) 3
41 | Annual Report 2014/15
Regulating employers

Section 3: Report on operations | WorkCover WA Annual Report 2014/15
Review of employer-focused compliance activitiesAs part of its focus on continuous improvement WorkCover WA conducted a review of employer-focused compliance activities in 2014/15. The review identified a backlog of minor compliance cases that were pending investigation. Reviewing practices associated with completing these cases significantly reduced the backlog from over 522 cases to less than 28.
The backlog was further reduced through the introduction of a Field Officer position to assist in the ‘triaging’ of cases. The Field Officer now provides a quick response to urgent matters and reinforces WorkCover WA’s education and enforcement activities.
Table 7: 2014/15 employer compliance outcomes
Compliance activity Total number
Enquiries into lapsed/expired policies 5,282
Enquiries into policy cancellations 4,715
Australian Business Register (data matching) 624
Compliance investigations 684
Letters of caution sent to employers 67
Infringements issued 178
Prosecutions completed 79
Targeting injury management & return to work obligationsWorkCover WA is continually exploring ways to improve injury management and return to work outcomes and practices across Western Australia. In 2014/15, WorkCover WA hosted a two-day Injury Management Conference which drew together the workers’ compensation and injury management community to discuss the challenges and opportunities in the injury management field.
The event was a resounding success with over 350 delegates attending over the two days to view 13 exhibitions and listen to 34 presentations by Australia’s leading minds and experts in injury management and workers' compensation.
To view the full description of the WorkCover WA 2015 Injury Management Conference refer to ‘Case Study 2’ in Section 3: Report on operations on page 58.
42

43 | Annual Report 2014/15
Phase two involved a three day visit to Kalgoorlie which saw inspectors target potentially non-compliant employers in industries with high claim rates.Results as at 30 June 2015 were:
Inspections 60
Matters under investigation 8
Inspectors met with industry representatives and stakeholders to improve their understanding of the duty to insure and to raise awareness of the risks and consequences associated with failing to insure against the liability to pay workers’ compensation arising from a workplace related injury or disease.
Regional compliance visitsWorkCover WA’s commitment to Government Goal 3 (Results-Based Service Delivery) and Government Goal 4 (Stronger focus on the regions) ensures the Agency completes compliance visits to regional areas. WorkCover WA’s regional compliance activity is recorded below.
Albany & Denmark
In November 2014 a WorkCover WA inspector conducted targeted inspections of businesses located in the South West Regional towns of Albany and Denmark in Western Australia. Results as at 30 June 2015 are:
Inspections 30
Prosecutions 3
Letter of caution 1
As part of the visit the Department of Commerce (Albany Office), Albany Chamber of Commerce and Industry, and WAPOL were contacted to:• consolidate intelligence regarding local businesses• assist strategic planning for future compliance activities in the area, and• reinforce messages regarding employer obligations under the Act.
Kalgoorlie-Boulder
In May 2015 WorkCover WA began an operation in the Kalgoorlie-Boulder region aiming to increase employer compliance with section 160(1) of the Act (duty to insure).
Phase one of the operation sought to encourage voluntary compliance through advice and education. Local industry representatives were instrumental in delivering key messages to highlight common issues and misconceptions identified as contributing to unintentional non-compliance.
Local industry representatives were instrumental in delivering key messages to highlight common issues.

44
Section 3: Report on operations | WorkCover WA Annual Report 2014/15
Case Study 1 Regional compliance visits (Kalgoorlie)
Outcome 1
Inspectors met with Kalgoorlie Chamber of Commerce and Industry representatives who provided insight into the pressures of operating a small business. Discussions highlighted the trend in reliance on independent bookkeeping services by small business owners in the region, suggesting they would be ideally placed to facilitate compliance by passing on relevant educational material. Inspectors subsequently engaged with financial service providers in the area who were prepared to pass on information to their clients.
Outcome 2
Inspectors met with several brokers in the region. Discussions focused on the consequences employers faced when failing to renew polices prior to expiry and failing to obtain proof of cover. Brokers noted policy renewal was dependent on timely return of completed wage declarations and payment of the premium. Inspectors enquired into the practice of broker issued confirmation of cover. Brokers were reminded only an insurer issued certificate of currency could excuse an employer from being in breach of the duty to insure. One of the larger brokers in the region offered to incorporate a compliance segment into its upcoming injury management seminar and invited WorkCover WA inspectors back to the region to participate.
Outcome 3
A prior investigation into a failure to hold insurance concluded whilst inspectors were in Kalgoorlie. The employer was convicted of failing to produce wage records when required to do so by a WorkCover WA inspector, with total fines and costs of $5,165.00.
Acting on noise-induced hearing lossIn 2014/15, WorkCover WA continued to offer advice and guidance to workers and employers across the State with regards to noise-induced hearing loss (NIHL) related tests and claims. Table 8 below outlines the Agency’s activities involving the monitoring and management of NIHL claims.
Table 8: Involvement in noise-induced hearing loss
NIHL activity/outcome Total number
Workers identified with potential NIHL claims 767
Full audiological assessments arranged 204
Otorhinolaryngology (ear, nose and throat) assessments of occupational hearing loss arranged
184
Successful claims for work-related gradual onset NIHL 129
First election claims (10 per cent permanent hearing loss) 114
Subsequent election claims (additional five per cent permanent hearing loss) 15

45 | Annual Report 2014/15
Table 9: Approval of service providers
Type of service provider
Approvals in 2013/14
Approvals in 2014/15
Total at 30 June 2015
Approved insurers 1 0 9
Approved self-insurers 1 1 27
Approved workplace rehabilitation providers 219 200 224
Registered agents 6 8 37
Approved medical specialists 7 16* 251
Approved audiometric officers, audiologists and audiometrists
87 79 550
Total approvals 321 304 1098
* Seven of the 16 approvals in 2014/15 were Gazetted on 1 July 2014 and were inadvertently included in the 2013/14 Annual Report.
This scheme service contributes to, and is aligned with:
Government Goal(s)
WorkCover WA Strategic Goal
3 (& 5) 3
WorkCover WA continued to approve and monitor service providers in 2014/15 to ensure compliance with the Act and the delivery of appropriate standards of service. Monitored service providers include approved insurers, self-insurers, registered agents, workplace rehabilitation providers (WRPs), Approved Medical Specialists (AMS), audiometric officers and audiologists.
Regulatory activities regarding service providers in 2014/15 included:• approval, monitoring and renewal of service providers (Table 9)• annual reviews of approved insurers and self-insurers• audits of service provider performance including workplace rehabilitation
providers (WRPs) quality assurance checks based on Agency data and other intelligence
• investigation of complaints against service providers (Table 10)• provision of assistance and guidance to all stakeholders, including service
providers and employers• provision of training and workshops to service providers and other groups• peer review of service providers.
Regulating service providers

46
Section 3: Report on operations | WorkCover WA Annual Report 2014/15
Complaints about service providersWorkCover WA investigates complaints against service providers made by scheme participants. Table 10 compares 2014/15 complaint statistics for service providers to previous years.
Table 10: Complaints against service providers
Type of service provider
2011/12 2012/13 2013/14 2014/15
Approved insurers 11 17 4 11
Approved self-insurers 1 1 0 0
Registered agents 6 6 1 7
Approved workplace rehabilitation providers 4 7 1 2
Approved medical specialists 2 1 5 2
Approved audiometric officers, audiologists and audiometrists
2 0 0 0
Total complaints 26 32 11 22
Insurers & self-insurersInsurer monitoring
Approved insurers must meet requirements set out in the Act. WorkCover WA reviews the performance of all approved insurers on an annual basis to ensure compliance with these requirements.
Historically WorkCover WA has reviewed insurer performance through a process of annual insurer returns. In 2014/15 this was augmented by a new approach which tests specific performance measures through on-site insurer audits. An audit based approach aligns WorkCover WA practices with compliance and performance monitoring used in other jurisdictions. The audit process is in a 12 month test phase and will be evaluated in the 2015/16 year.
The performance of all approved insurers is considered by the WorkCover WA Board in an Annual Review Report. The most recent (2013/14) Annual Review Report assessed approved insurer performance against selected performance and financial indicators and focused on:• financial management and viability• material and financial resources• claims management• data management and reporting• complaints• standards of service.
All approved insurers were found to have met their statutory obligations and maintained appropriate financial requirements, while some matters for improvement were identified and discussed with each approved insurer.
Insurer complaints
There were 11 complaints against approved insurers in 2014/15, compared with four in the previous year. Of these, two were substantiated, two were proven to be unsubstantiated, four were resolved by the parties, two were outside WorkCover WA’s jurisdiction and one was withdrawn. WorkCover WA manages complaints made about approved insurers in accordance with the Complaints Against Scheme Participants Policy. Processes and procedures for making a complaint are available on the WorkCover WA website.

47 | Annual Report 2014/15
Registered agentsWorkCover WA registers agents who may represent parties in proceedings in the Conciliation and Arbitration Services. Registered agents are subject to performance monitoring by WorkCover WA for compliance with the Registered Agents Code of Conduct. Most registered agents are employees of insurers, self-insurers, law firms or representative organisations and act under the instruction of their employer. Additionally, in 2014/15 there were five independent registered agents.
Registered agent complaints
WorkCover WA received seven formal complaints against independent registered agents in 2014/15. Of these complaints, two were withdrawn, two proved to be unsubstantiated, and one complaint involved five allegations, three of which were substantiated. Two complaints remain under investigation.
Workplace rehabilitation providersAudit framework
WorkCover WA utilises an audit framework for WRPs based on Service Provision and Service Description Standards implemented in December 2011. These WRP standards are nationally consistent and are used by all workers’ compensation jurisdictions.
Throughout 2014/2015 WorkCover WA completed the five audits planned for the year.
Workplace rehabilitation provider complaints
There were two complaints against WRPs in 2014/15, compared to one in the previous financial year.
One complaint was partially substantiated and the other was substantiated. Both complaints resulted in a requirement that the WRP amend its procedures.
Approved audiometric officersAudiometric officers, audiometrists and audiologists (AAOs) are approved by WorkCover WA to conduct air conduction hearing tests. A regulatory framework ensures high standards are maintained for the processing of hearing tests and audiological testing.
No complaints were recorded against AAOs in 2014/15.
Approved Medical SpecialistsWorkCover WA approves medical specialists who are designated to assess a worker’s degree of permanent whole person impairment.
To provide ongoing education in the assessment of permanent whole person impairment, WorkCover WA conducts AMS peer review sessions to discuss case studies. Two peer review sessions were held in 2014/15, with the most recent event focused on psychiatric assessment.
Based on the success of the peer review format and the inaugural Psychiatric Peer Review session, WorkCover WA will continue the program in 2015/16, with a focus on speciality areas.
Approved Medical Specialists complaints
Two complaints were brought against AMS in 2014/15 both of which were unsubstantiated. Two of the five complaints filed in 2013/14 remain under investigation.

48
Section 3: Report on operations | WorkCover WA Annual Report 2014/15
Improving scheme performance
Progressing legislative reform
This scheme service contributes to, and is aligned with:
Government Goal(s)
WorkCover WA Strategic Goal
3 (& 2,5) 1
WorkCover WA continued to actively manage the workers’ compensation and injury management scheme during the financial year to ensure stakeholders have ongoing access to a viable, equitable and robust system. This included the calculation and gazettal of variations to entitlement limits, and to other workers’ compensation amounts, for the financial year commencing 1 July 2015; as well as the indexation of medical and allied health fees, effective 1 November 2014.
National Insurer Data SpecificationThe National Insurer Data Specification was implemented in Western Australia in January 2014. All insurers provided data in accordance with the NIDS during 2014/15.
New industry classes for recommended premium rates
WorkCover WA is working with stakeholders to transition from premium rating classifications (PRC) based on the Australian and New Zealand Standard Industry Classification (ANZSIC) 1993 to classifications based on the ANZSIC 2006 standard. Insurers provided policy data with ANZSIC 1993 and ANZSCI 2006 based classification codes for the 2012/13 and 2013/14 reporting years, and the requirement for dual coded data will continue during the transition period.
Following advice from the scheme actuary, the planned gazettal of recommended premium rates based on ANZSIC 2006 will now occur in 2017/18, instead of 2016/17 as originally planned. This will ensure sufficient claims experience is included in the calculation of the new rates.
This scheme service contributes to, and is aligned with:
Government Goal(s)
WorkCover WA Strategic Goal
3 (& 2,5) 1
Recognition of acupuncture as an 'approved treatment'On 1 April 2015 regulatory amendments came into effect to recognise acupuncture as an approved treatment under the Act.
Acupuncture was previously only a compensable service in the scheme if performed by a medical practitioner. The regulatory amendments recognise Chinese Medicine Practitioners, and other health practitioners endorsed under the Health Practitioner Regulation National Law (Western Australia), as service providers able to treat injured workers and charge for acupuncture as a compensable service.
Costs determination reviewThe Workers' Compensation (Legal Practitioners and Registered Agents) Costs Determination regulates the amounts claimable and chargeable for legal services provided in the Conciliation and Arbitration Services. The Costs Determination is reviewed on a regular basis to ensure it remains consistent with contemporary practice in WorkCover WA’s Conciliation and Arbitration Services. The last review was undertaken in 2013/14.
Following stakeholder feedback, the WorkCover WA Costs Committee reviewed the recommendations of the Agency and issued the Workers’ Compensation (Legal Practitioners and Registered Agents) Costs Determination 2015. The Determination came into effect on 1 July 2015. WorkCover WA will monitor the effects of the amended Costs Determination during 2015/16.

Service 2 Scheme Services
49 | Annual Report 2014/15
WorkCover WA’s Conciliation and Arbitration Services (CAS) provide a fair and cost effective system for the resolution of disputes that:• is timely• is accessible, approachable and professional• minimises costs to parties to disputes• in the case of conciliation, leads to final and appropriate agreements
between parties in relation to disputes • in the case of arbitration, enables disputes not resolved by conciliation to
be determined according to their substantial merits with as little formality and technicality as practicable.
In addition to facilitating the resolution of disputes by conciliation the Conciliation Service is responsible for recording the finalisation of workers’ compensation claims through settlements (i.e. registration of memoranda of agreement and common law settlement deeds) and the processing of documents submitted in relation to common law claims. The Conciliation Service registered 4,113 memoranda of agreement in 2014/15.
General CAS initiatives in 2014/15 included:• engagement of arbitrators on a sessional basis to assist in dealing with
disputes in a timely manner • publication of a revised Costs Determination• appointment of an additional Conciliation Officer• ongoing enhancement of the core business management system (Dispute
Case Management System)• review of the Workers’ Compensation Conciliation Rules 2011 and Workers’
Compensation Arbitration Rules 2011.
This scheme service contributes to, and is aligned with:
Government Goal(s)
WorkCover WA Strategic Goal
3 (& 2) 4
Resolving disputes
The Conciliation Service registered 4,113 memoranda of agreement in 2014/15.

50
Section 3: Report on operations | WorkCover WA Annual Report 2014/15
Dispute resolution performanceThe objective of the Conciliation Service is to provide a timely and effective service to assist parties to resolve their dispute by agreement. The focus of the Arbitration Service is resolving disputes according to their substantial merits. Figure 12 illustrates WorkCover WA’s achievement of these objectives, including numbers of applications accepted and cases completed.
In Figure 13, KPI effectiveness indicator 1.2 relates to Conciliation Services and 1.3 to Conciliation and Arbitration Services combined.
Figure 12: 2014/15 CAS applications and cases Figure 13: 2014/15 KPI effectiveness indicators related to CAS
# Description 2014/15 Target/Result Reference
1.2 Proportion of conciliations completed within 8 weeks
p. 94
1.3 Proportion of disputes resolved within 6 months p. 95
1,945 1,899
463 422
Conciliation applicationsaccepted
Conciliation casescompleted
Arbitration applicationsaccepted
Arbitration casescompleted
2,259
2013/14 level
2,242
500 482
Target
Result
97%
96.3%
Target
Result
90%
88.8%

51 | Annual Report 2014/15
Trial of Standard Order templateBefore an application for arbitration can be listed as an arbitration hearing, arbitrators conduct directions hearings to:• clarify and narrow the issues in dispute between the parties• give directions for further requirements to be completed by the parties.
During 2014/15 a Standard Order template was trialled to encourage parties to confer with each other before attending the directions hearing. By encouraging this early exchange, parties can acknowledge the matters they agree on, allowing the arbitrator to focus on resolving disputes about procedural matters and progress the application to arbitration in a timely and fair manner.
Preliminary results indicate there was minimal uptake of the Standard Order template suggesting further strategies may be needed to encourage greater conferral between parties in relation to procedural and substantive matters.
In 2015/16 the development of Arbitration Service Practice Directions will form an extension of this initiative.
Advocacy training programArbitration is a formal proceeding at which evidence is heard and a legally qualified arbitrator makes a final determination. Parties to arbitration are entitled to be legally represented at the hearing. The Workers’ Compensation Arbitration Service has identified practitioners appearing at arbitration hearings can at times employ advocacy skills which lead to unnecessary delays and or undesirable outcomes.
In 2014/15 WorkCover WA developed a concept paper regarding the delivery of targeted advocacy training for practitioners. The paper discusses the context in which the training is required, defines program content and delivery, and identifies potential accreditation by the Legal Practice Board of WA.
Review of the RulesThe Conciliation and Arbitration Services came into effect on 1 December 2011, replacing the Dispute Resolution Directorate. The Workers’ Compensation Rules 2011 and the Workers’ Arbitration Rules 2011 (the Rules) were implemented concurrently to regulate the practices and procedures of the Services.
The review sourced feedback from staff and external stakeholders regarding the operation of the Rules. The feedback formed the basis of amendments to the Rules which are expected to result in improvements to operational practices in the Conciliation and Arbitration Services. The amendments took effect from 1 July 2015.
The Agency will monitor the impact of the changes during 2015/16.
Analysis of disputes consuming above average CAS resourcesDiscussions with CAS officers and analysis of significant amounts of data was commenced to identify characteristics of disputes consuming above average CAS resources. These characteristics include psychological injury and unrepresented parties.
The project has recommended areas for further consideration as part of the second phase of the project to be undertaken during 2015/16.
The objective of the Conciliation Service is to provide a timely and effective service to assist parties to resolve their dispute by agreement. The focus of the Arbitration Service is resolving disputes according to their substantial merits.

52
Section 3: Report on operations | WorkCover WA Annual Report 2014/15
Figure 14: 2014/15 Publication numbers
Education & informationThis scheme service contributes to, and is aligned with:
Government Goal(s)
WorkCover WA Strategic Goal
3 (& 4) 2
The Agency offers education, advice and assistance to workers, employers and all scheme participants via a number of methods and resources. The provision of education and information is a vital WorkCover WA service aimed at establishing and increasing stakeholders’ knowledge of rights and responsibilities in regards to workers’ compensation and injury management.
PublicationsWorkCover WA has a variety of publications providing workers, employers, insurance brokers and other scheme participants with relevant and comprehensive sources of information.
In 2014/15, these publications continued to be promoted and utilised across the State by stakeholders and the general public. Workers’ Compensation and Injury Management: A Guide for Workers was again the most requested publication by mail, comprising 60 per cent of all publications ordered. In contrast, Injury Management: A Guide for Employers was the most downloaded publication, recording 33 per cent of all downloads. This indicates the different distribution requirements for workers and employers.
A full statistical breakdown for the distribution of publications in 2014/15 is outlined in Figure 14.
Making scheme performance accessible
New in 2014/15, the publication Workers’ Compensation Scheme Trends (May 2015) provides a summary of recent trends within the Western Australian workers’ compensation and injury management scheme. The new publication coincided with a broader review of WorkCover WA’s scheme performance publications. A full list of scheme reports is available in Section 2: Scheme Performance on page 35.
13, 310
9, 578
2013/14 level
Publications mailed
Publications downloaded
60% 33%
27%
18%
13%
5%
3%
1%
14%
13%
7%
2%
2%
2%
Workers' Compensation & Injury Management: A Guide for Workers
Injury Management: A Guide for Employers
Workers' Compensation & Injury Management: A Guide for Workers
Workers' Compensation: A Guide for Employers
A technical note on contractors and workers' compensation
What happens if thereis a dispute?
A Guide to Noise Induced Hearing Loss
Insurance Brokers' Code of Practice
Workers' Compensation: A Guide for Employers
Injury Management: A Guide for Employers
A technical note on contractors & workers' compensation
A Guide to Noise Induced Hearing Loss
Insurance Brokers' Code of Practice
What happens if thereis a dispute?
WorkCover WA publications can be downloaded from the resources section at workcover.wa.gov.au

53 | Annual Report 2014/15
WebsiteReplacement of external website
On 8 October 2014 a new WorkCover WA website was launched. The new website:• is built using technology that will receive vendor support for at least the
next technology cycle (3–5 years)• is compliant with public sector accessibility requirements• is compatible with common browsers and devices, including mobiles• incorporates modern functionality important for improved user experience,
including a user-friendly stakeholder based structure; improved navigation and search functionality
• incorporates other features to: º improve notification of changes to the workers’ compensation and injury management scheme º remind stakeholders of key obligations º promote important initiatives.
Feedback from internal and external stakeholders has been positive, with users able to search and locate pertinent information quickly. Statistical information shows a reduction in calls to the Advice and Assistance line and a large increase in downloaded documents in 2014/15; suggesting a greater reliance by stakeholders on website material.
WorkCover WA will continue to monitor feedback and implement minor enhancements to the website in 2015/16.
Statistical information shows a reduction in calls to the Advice and Assistance line and a large increase in downloaded documents in 2014/15.

54
Section 3: Report on operations | WorkCover WA Annual Report 2014/15
Downloads
There were a total of 113,921 unique downloads of publications, forms, reports and other information in 2014/15. This is a 72 per cent increase from 2013/14 and can be largely attributed to the usability and search functionality of the new website.
Other than publications, key download highlights include:
Workers' Compensation Claim Forms 5,289
Form 100 – Application for Conciliation 2,009
Variations to the Prescribed Amount 2014/15 5,231
Recommended Premium Rates 2014/15 3,576
General website statistics
Figure 15: Site visits
Old website1 July 2014 to 7 October 2014
New website8 October 2014 to 30 June 2015
Figure 16: Direct traffic sources
Figure 17: Views by WorkCover WA website channels (combined)
Old website1 July 2014 to 7 October 2014
New website8 October 2014 to 30 June 2015

55 | Annual Report 2014/15
Figure 18: gpsupport site visits and traffic sources
TwitterWorkCover WA utilises Twitter to engage and communicate with external stakeholders. Important and relevant information is tweeted with links directing the follower to a corresponding page on the WorkCover WA website for more comprehensive information.
During 2014/15 WorkCover WA ‘tweeted’ 80 times and accumulated 212 followers including workers, healthcare providers, business managers, human resource officers and advocacy groups.
Injury Management Conference websiteTo promote the 2015 Injury Management Conference and maximise exposure of the Conference program, WorkCover WA launched a subsidiary website injurymanagement.workcover.wa.gov.au in 2014/15.
The website was launched in November 2014 and had a total of 6,969 visitors. It was a successful self-contained site which contained the Conference program, registration details, speaker details, venue details and all Conference updates.
gpsupport websiteThe gpsupport website was launched in May 2014 to provide a centralised educational resource for General Practitioners (GPs) involved with treating injured workers.
On gpsupport GPs and practice staff can find information on:• their role in the workers’ compensation scheme• WorkCover WA’s fee schedule• Certificates of Capacity and evaluation notes• health benefits of work• how to support work participation• evidence-based principles• useful assessment tools for:
º identifying injured workers who may be at risk of delayed outcomes º measuring the effectiveness of injury management interventions.
This subsidiary website was heavily utilised by GPs and medical practices from 1 July 2014 when the new Certificates of Capacity came into effect.
In March 2015 a project was commenced to redevelop the gpsupport website to connect it to the technology platform of the main WorkCover WA website. The redeveloped gpsupport website is expected to be made available to the public in 2015.
Prosecution results are published on the WorkCover WA website and @WorkCoverWA Twitter account as an educational detterent.

56
Section 3: Report on operations | WorkCover WA Annual Report 2014/15
Advice & Assistance UnitWorkCover WA’s Advice and Assistance Unit is the Agency’s frontline service for workers, employers and other scheme participants who require immediate answers to questions related to workers’ compensation and injury management matters.
In 2014/15, the Unit responded to 22,836 requests for advice and assistance from workers and employers. Topics covered included the claims process, injury management, return to work, weekly compensation rates and entitlements, workplace rehabilitation entitlements and dispute resolution.
The Agency implemented call-back and call recording functionality in 2014/15 for quality assurance and training purposes. The call-back technology provides callers with an option to leave a message and request a call back if they do not wish to remain on the line. The next available operator will return the call without the caller losing their position in the queue. The call recording functionality enables WorkCover WA to analyse the quality of service provided and identify training needs, as well as providing a platform for the induction of new staff.
During 2014/15 the Agency delivered a range of educational and information events in the form of seminars, information sessions and presentations. The activities engaged and educated scheme participants and the general public on relevant issues surrounding workers’ compensation and injury management. The activities also promoted collaboration and mutual respect between stakeholder groups by providing insight into the various elements of the scheme.
Welcome to WorkCover WA seminarsWelcome to WorkCover WA seminars are regular events in the Agency’s calendar. Providing an introductory overview of WorkCover WA and its role within the workers’ compensation and injury management scheme, the seminar offers scheme participants an opportunity to discuss individual queries and concerns with experienced divisional heads.
WorkCover WA conducted four seminars in 2014/15 informing and educating a total of 194 stakeholders about the scheme.
In 2014/15, the Unit responded to 22,836 requests for advice and assistance from workers and employers.
Training & seminars
Harley White, General Manager Conciliation & Arbitration, explains the dispute resolution process

57 | Annual Report 2014/15
Presentations on requestWorkCover WA delivers a range of tailored external presentations to employers and health providers upon request.
During 2014/15 the Agency delivered seven external presentations to stakeholders including small business owners, universities, mining companies and union representatives.
Consultation & engagement with stakeholders2014 Stakeholder EventWorkCover WA held its annual stakeholder networking event in October 2014 and the central theme was the launch of the 2015 Injury Management Conference.
An address was delivered by the Honourable Michael Mischin MLC, Minister for Commerce. The event provided WorkCover WA with an opportunity to engage with key stakeholders, and to provide an update on current developments across the scheme.
Injury Management Conference 2015The delivery of the 2015 Injury Management Conference represented our commitment to consult and engage stakeholders in 2014/15. Refer to Case Study 2 on page 58 for more details.
Approved Medical Specialist trainingWorkCover WA organises training in the WorkCover WA Guides for the Evaluation of Permanent Impairment for medical practitioners seeking to become an AMS. AMS play an integral role in the scheme by assessing the level of permanent impairment of an injured worker.
The Agency organised two training sessions during 2014/15 attended by doctors and medical practice personnel.
Approved Medical Specialist Peer ReviewEach year WorkCover WA hosts AMS Peer Review evenings in conjunction with the Australasian Faculty of Occupational and Environmental Medicine (AFOEM). The events aim to educate AMS and AFOEM members on permanent impairment issues, as identified through WorkCover WA’s peer review; provide for informal discussions on relevant case studies; and offer medical stakeholders an opportunity to network and liaise with relevant professionals.
In 2014/15 the Agency held two AMS Peer Review evenings, with a total of 32 attendees.
Franchise Council of Australia WA BreakfastIdentifying a recent number of prosecutions had been completed against WA franchises, WorkCover WA delivered a presentation to franchise owners and industry affiliates at the Franchise Council of Australia WA Breakfast event in June. The presentation was aimed at raising awareness of employer obligations, namely with respect to workers’ compensation, and the risks of non-compliance for franchisors and franchisees.

58
Section 3: Report on operations | WorkCover WA Annual Report 2014/15
Case Study 2 A Biennial Conference
WorkCover WA successfully delivered its inaugural biennial Injury Management Conference on 5 and 6 May 2015 at Crown Perth.
The Western Australian workers’ compensation and injury management community including employers, injury management consultants, insurers and health providers came together to discuss the challenges and opportunities facing injury management today.
Over the two days 351 delegates attended the Conference to view 13 exhibitions on display and listen to 34 presentations by Australia’s leading minds and experts.
A Welcome Reception, supported by the Insurance Council of Australia (WA), was held on the evening of Tuesday 5 May and provided delegates with an opportunity to circulate amongst the exhibits and discuss the day’s sessions and learnings.
Left: The Hon. Michael Mischin MLC, Minister for Commerce, opens the Injury Management Conference 2015
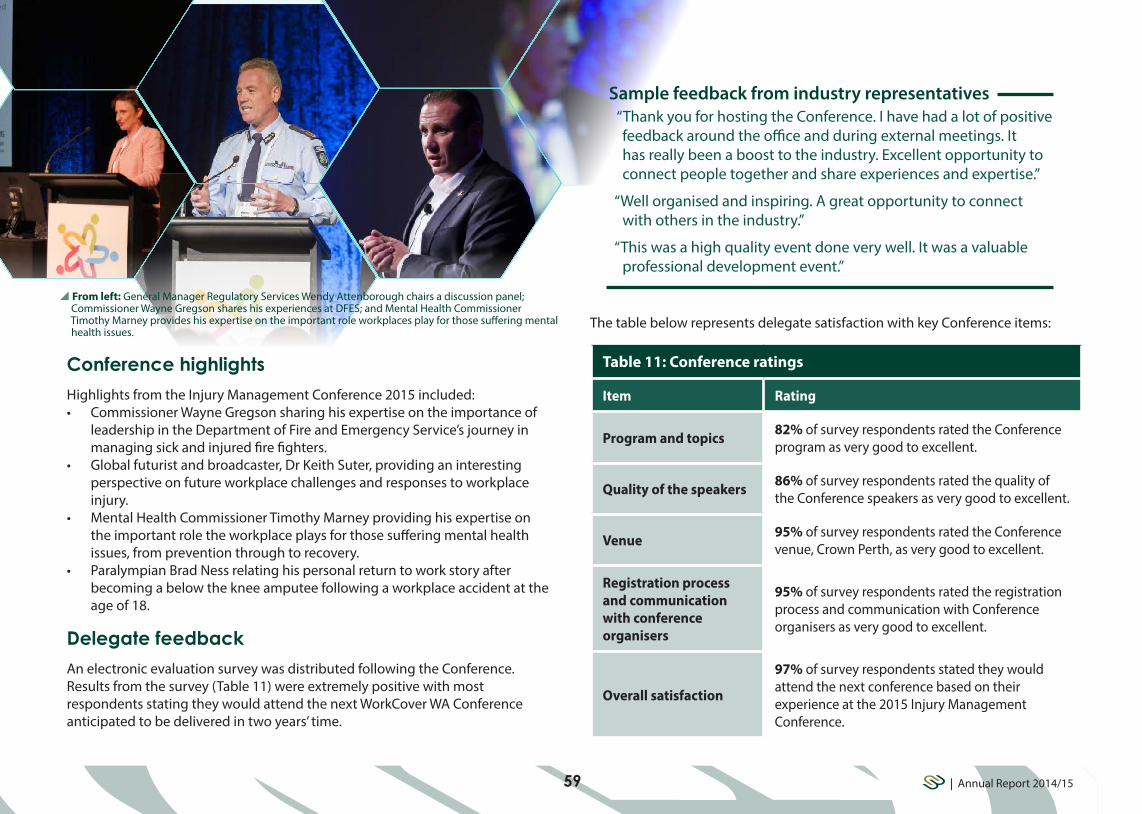
59 | Annual Report 2014/15
The table below represents delegate satisfaction with key Conference items:
Table 11: Conference ratings
Item Rating
Program and topics 82% of survey respondents rated the Conference program as very good to excellent.
Quality of the speakers 86% of survey respondents rated the quality of the Conference speakers as very good to excellent.
Venue 95% of survey respondents rated the Conference venue, Crown Perth, as very good to excellent.
Registration process and communication with conference organisers
95% of survey respondents rated the registration process and communication with Conference organisers as very good to excellent.
Overall satisfaction
97% of survey respondents stated they would attend the next conference based on their experience at the 2015 Injury Management Conference.
Conference highlights
Highlights from the Injury Management Conference 2015 included:• Commissioner Wayne Gregson sharing his expertise on the importance of
leadership in the Department of Fire and Emergency Service’s journey in managing sick and injured fire fighters.
• Global futurist and broadcaster, Dr Keith Suter, providing an interesting perspective on future workplace challenges and responses to workplace injury.
• Mental Health Commissioner Timothy Marney providing his expertise on the important role the workplace plays for those suffering mental health issues, from prevention through to recovery.
• Paralympian Brad Ness relating his personal return to work story after becoming a below the knee amputee following a workplace accident at the age of 18.
Delegate feedback
An electronic evaluation survey was distributed following the Conference. Results from the survey (Table 11) were extremely positive with most respondents stating they would attend the next WorkCover WA Conference anticipated to be delivered in two years’ time.
Sample feedback from industry representatives “Thank you for hosting the Conference. I have had a lot of positive feedback around the office and during external meetings. It has really been a boost to the industry. Excellent opportunity to connect people together and share experiences and expertise.”
“Well organised and inspiring. A great opportunity to connect with others in the industry.”
“This was a high quality event done very well. It was a valuable professional development event.”
From left: General Manager Regulatory Services Wendy Attenborough chairs a discussion panel; Commissioner Wayne Gregson shares his experiences at DFES; and Mental Health Commissioner Timothy Marney provides his expertise on the important role workplaces play for those suffering mental health issues.

60
Section 3: Report on operations | WorkCover WA Annual Report 2014/15
Collaboration
Australian Business Register
WorkCover WA collaborates with the Australian Business Register to obtain data in relation to new business entities that have registered for GST and/or have a turnover of greater than $75,000 – both of which indicate an intention to employ. This information is then matched against WorkCover WA data, providing the Agency with a source of intelligence regarding employers who may not be appropriately covered by a policy of insurance. This program continues to work well ensuring new business owners are informed of their obligations.
In 2014/15 the data matching program identified 3,592 new business entities, which met the criteria indicating the potential employment of workers after start up. WorkCover WA wrote to each of these businesses to inform them of their obligations to obtain appropriate cover with insurance for workers’ compensation. 624 of these businesses were identified for further follow up by WorkCover WA’s Regulatory Services Division to verify their obligations had been met.
Personal Injury Education Foundation
WorkCover WA is a member of the Personal Injury Education Foundation (PIEF, www.pief.com.au) and continued to support programs developed by PIEF, including return to work and case management training for people working within the personal injury industry (such as case managers and employer representatives).
The Agency is involved in a number of collaborative initiatives contributing to the effective management of the workers’ compensation and injury management scheme, and aimed at ensuring stakeholders are educated and informed about their rights and responsibilities under the Act.
International collaborationSingapore’s Ministry of Manpower
In April 2015 WorkCover WA hosted a delegation from Singapore’s Ministry of Manpower to provide an overview of the Western Australian workers’ compensation and injury management scheme. The Ministry of Manpower provided insights into their own workers’ compensation arrangements. The visit offered perspectives into international arrangements and provided learnings for both parties.
National collaborationStrategic Issues Group – Workers’ Compensation
WorkCover WA’s Chief Executive Officer is represented on the Safe Work Australia Strategic Issues Group – Workers’ Compensation. This is a forum for workers’ compensation authorities and social partners to discuss national policy issues and progress proposals to improve workers’ compensation arrangements across Australia.
Some of the key activities progressed in 2014/15 by the Strategic Issues Group include: • work to implement nationally consistent arrangements for the assessment
of permanent impairment• development of an up-to-date list of ‘deemed diseases’ that are considered
work-related• publication of the Comparison of Workers’ Compensation Report.
Above: A delegation from Singapore's Ministry of Manpower collaborate with key WorkCover WA staff to provide insights into their respective workers' compensation arrangements.

61 | Annual Report 2014/15
State collaborationPublic Sector Safety and Injury Management Steering Committee
WorkCover WA is a member of the Public Sector Safety and Injury Management Steering Committee, which consists of representatives from WorkSafe and the Office of the Director General, RiskCover, Public Sector Commission and UnionsWA.
Industrial Foundation for Accident Prevention
WorkCover WA’s cooperative partnership with the not-for-profit Industrial Foundation for Accident Prevention (IFAP) continued in 2014/15 with the provision of free information sessions to injured workers. IFAP is a registered training organisation providing education and information to injured workers about the workers’ compensation, injury management and return to work process.
In 2014/15, 11 free IFAP seminars were delivered to a total of 110 injured workers. One seminar was delivered in regional Western Australia (Karratha).
Commission for Occupational Safety and Health
The WorkCover WA Chief Executive Officer attends the Commission for Occupational Safety and Health meetings as an observer. The Commission consists of representatives of employers, employees, government and people with expertise and knowledge in occupational safety and health matters. WorkCover WA provides ongoing support of the Commission’s objectives in the form of statistical data about work-related injury and disease.
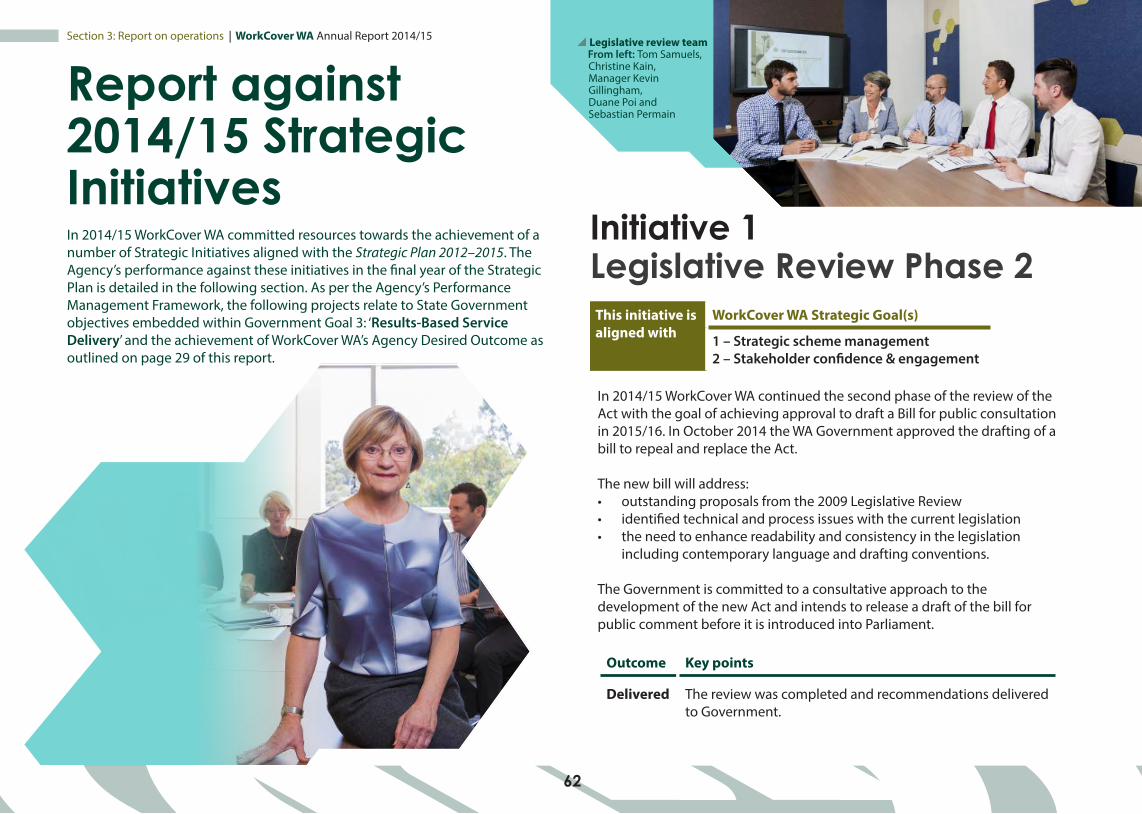
Section 3: Report on operations | WorkCover WA Annual Report 2014/15
62
Initiative 1Legislative Review Phase 2This initiative is aligned with
WorkCover WA Strategic Goal(s)
1 – Strategic scheme management2 – Stakeholder confidence & engagement
In 2014/15 WorkCover WA continued the second phase of the review of the Act with the goal of achieving approval to draft a Bill for public consultation in 2015/16. In October 2014 the WA Government approved the drafting of a bill to repeal and replace the Act.
The new bill will address:• outstanding proposals from the 2009 Legislative Review• identified technical and process issues with the current legislation• the need to enhance readability and consistency in the legislation
including contemporary language and drafting conventions.
The Government is committed to a consultative approach to the development of the new Act and intends to release a draft of the bill for public comment before it is introduced into Parliament.
Outcome Key points
Delivered The review was completed and recommendations delivered to Government.
Report against 2014/15 Strategic Initiatives In 2014/15 WorkCover WA committed resources towards the achievement of a number of Strategic Initiatives aligned with the Strategic Plan 2012–2015. The Agency’s performance against these initiatives in the final year of the Strategic Plan is detailed in the following section. As per the Agency’s Performance Management Framework, the following projects relate to State Government objectives embedded within Government Goal 3: ‘Results-Based Service Delivery’ and the achievement of WorkCover WA’s Agency Desired Outcome as outlined on page 29 of this report.
Legislative review team From left: Tom Samuels, Christine Kain, Manager Kevin Gillingham, Duane Poi and Sebastian Permain

63 | Annual Report 2014/15
Initiative 2 Injury Management Guidance Material for Medical Practitioners
Initiative 3 Electronic Document & Records Management SystemThis initiative is aligned with
WorkCover WA Strategic Goal
4 – Operational excellence
WorkCover WA has traditionally relied on paper-based files for recordkeeping purposes. In 2013/14 a project was commenced to outfit the Agency with an Electronic Document and Records Management System (EDRMS). Phase 1 of the project was successfully completed in December 2013 by replacing legacy records systems with a pilot implementation of HP TRIM within the Records area only.
During 2014/15 a successful Agency-wide implementation was completed with all staff having access to TRIM and TRIM training. This has delivered the following benefits:• all documents can be saved and edited in a single location, strengthening
version control and preserving naming standards• easier searching and distribution of documents• access to sensitive information is now being restricted• reduced physical storage requirements.
In addition, an amended Recordkeeping Plan has been submitted to the State Records Office.
Outcome Key points
Delivered Electronic Document and Records Management System implemented across the Agency.
This initiative is aligned with
WorkCover WA Strategic Goal(s)
2 – Stakeholder confidence & engagement3 – Regulatory compliance
WorkCover WA launched new Certificates of Capacity on 1 July 2014 in conjunction with new guidance materials made available on WorkCover WA’s gpsupport website for GPs. The Certificates and guidance materials were developed to improve the information captured within the Certificates about a worker’s injury and capacity to return to work.
The guidance materials have enabled a smooth transition to the new Certificates by outlining expectations and intended use. The website gpsupport provided a centralised source of information for GPs and medical providers in 2014/15 – gpsupport website statistics can be found on page 55.
WorkCover WA has continued to consult with stakeholders in 2014/15 regarding the new Certificates. Further stakeholder feedback led to minor design revisions in late 2014.
Seeking to consolidate these initiatives, WorkCover WA developed a new Injury Management Strategy in 2014/15, which outlines the Agency’s injury management focuses for the period 2015 to 2018.
Outcome Key points
Delivered • The guidance materials enabled a smooth transition to the new Certificates of Capacity launched on 1 July 2014.
• An Injury Management Strategy has been developed for the period 2015 – 2018.

64
Section 4
Section 4: Opportunities & challenges | WorkCover WA Annual Report 2014/15
Opportunities & challenges65 Opportunity & accessibility67 Equality and inclusion68 Safety, health & wellbeing70 Agency challenges71 IT initiatives
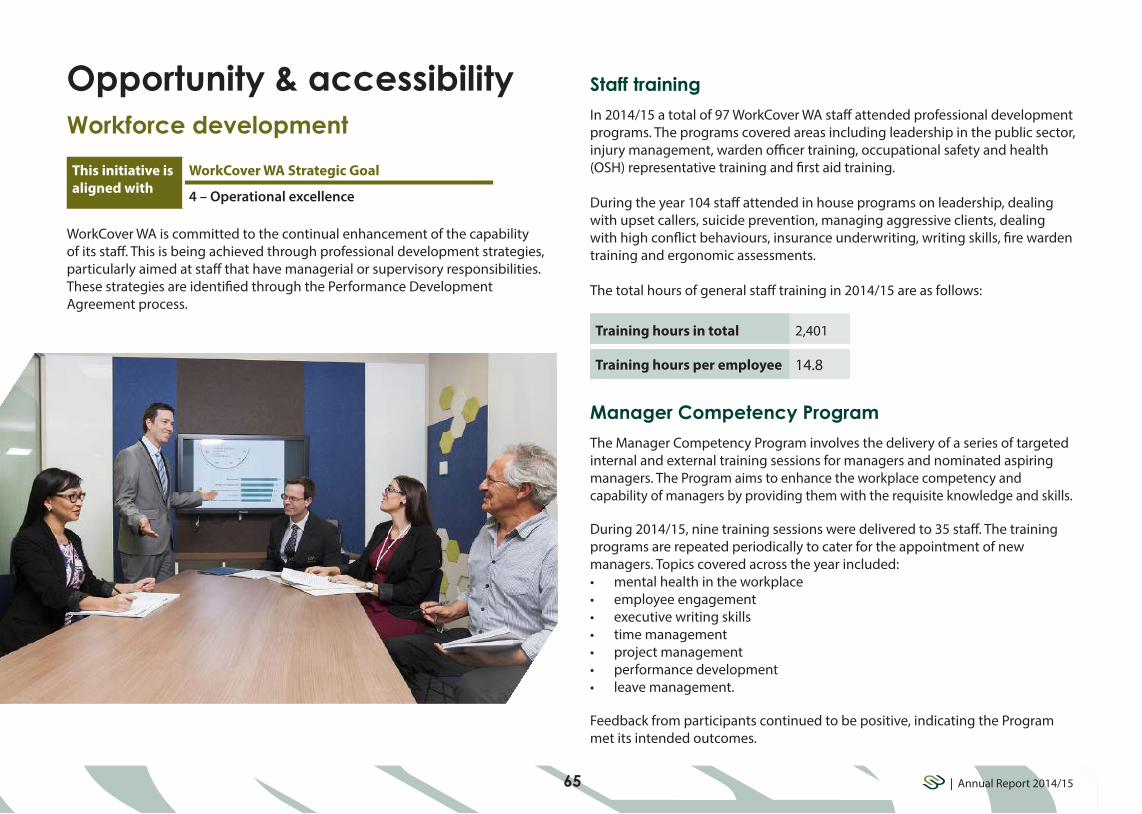
65 | Annual Report 2014/15
Staff training
In 2014/15 a total of 97 WorkCover WA staff attended professional development programs. The programs covered areas including leadership in the public sector, injury management, warden officer training, occupational safety and health (OSH) representative training and first aid training.
During the year 104 staff attended in house programs on leadership, dealing with upset callers, suicide prevention, managing aggressive clients, dealing with high conflict behaviours, insurance underwriting, writing skills, fire warden training and ergonomic assessments.
The total hours of general staff training in 2014/15 are as follows:
Training hours in total 2,401
Training hours per employee 14.8
Manager Competency Program
The Manager Competency Program involves the delivery of a series of targeted internal and external training sessions for managers and nominated aspiring managers. The Program aims to enhance the workplace competency and capability of managers by providing them with the requisite knowledge and skills.
During 2014/15, nine training sessions were delivered to 35 staff. The training programs are repeated periodically to cater for the appointment of new managers. Topics covered across the year included:• mental health in the workplace• employee engagement• executive writing skills• time management• project management• performance development• leave management.
Feedback from participants continued to be positive, indicating the Program met its intended outcomes.
Workforce developmentThis initiative is aligned with
WorkCover WA Strategic Goal
4 – Operational excellence
WorkCover WA is committed to the continual enhancement of the capability of its staff. This is being achieved through professional development strategies, particularly aimed at staff that have managerial or supervisory responsibilities. These strategies are identified through the Performance Development Agreement process.
Opportunity & accessibility

66
Section 4: Opportunities & challenges | WorkCover WA Annual Report 2014/15
Employee development
Performance Development Agreement (PDA) processWorkCover WA’s employee development process is supported through our PDA system. All staff participate in two formal PDA meetings each year.
During the year WorkCover WA conducted a survey that sought staff feedback about their perceptions of the effectiveness of the PDA process as a means of assessing staff performance, establishing individual development strategies and providing a forum for meaningful discussions between supervisors and staff.
The results of the survey led to enhancements to the process and forms which place a greater focus on innovation and career development. There was also an increased emphasis on measuring performance indicators for branch managers. These enhancements will continue to be monitored.
Focus on line managersIn February 2015 the Human Resources branch began developing an initiative to create individual professional development programs for line managers. These are based on competencies in their current role, and the skills and experience they may require to undertake senior management roles within the Agency.
Attraction & retention
Graduate ProgramThe Graduate Program advances graduate career opportunities in an exciting, supportive and diverse environment. The Graduate Program ties into the WorkCover WA Workforce Plan by developing future management and leadership capabilities. As part of the Program the graduates complete placements across the Agency to provide practical ‘on-the-job’ skills and experience applicable to WorkCover WA’s business operations.
Two graduates commenced employment with WorkCover WA in February 2015. To date the graduates have completed work placements in the Conciliation and Arbitration Services and Regulatory Services divisions. As part of their work placements both Graduates have assisted with the preparation of submissions to be considered by the WorkCover WA Board.
The Graduates are concurrently completing the Public Sector Commission’s Graduate Future Leaders program.
New attraction & recruitment methodsLast financial year WorkCover WA implemented new attraction and recruitment methods to enhance the Agency’s ability to identify the most suitable and available candidates for appointment. A review of these new methods conducted during the year concluded that they were highly effective in engaging quality employees in previously difficult to fill positions.
In 2014/15 WorkCover WA successfully recruited eight new employees through alternative attraction and recruitment methods, including:• selecting appointees who were second ranked for similar positions• permanent appointment of staff on secondment to WorkCover WA• advertising for a pool of applicants for entry level positions to be drawn on
as required• engaging recruitment agencies to source candidates prior to advertising• engaging employees on fixed term contracts prior to advertising.
All appointees were subject to a merit-based selection and appointment process.
Succession management reviewWorkCover WA’s succession planning framework enhances leadership development and business continuity and ensures our staff are capable of undertaking different roles across the Agency.
During the year the capacity of WorkCover WA to fill its critical positions for short and long term periods was reviewed. This resulted in strategies to increase the Agency’s capability to fill these roles. These strategies have been included in the Performance Development Agreement process.

67 | Annual Report 2014/15
Equality & inclusionThis initiative is aligned with
WorkCover WA Strategic Goal
4 – Operational excellence
Disability Access & Inclusion PlanThrough the Disability Access and Inclusion Plan (DAIP), WorkCover WA commits to the inclusion of people with disabilities by ensuring they have suitable access to our facilities and services.
WorkCover WA’s Equity and Diversity Committee meets quarterly and is responsible for the delivery of the DAIP. In 2014/15 the Committee reviewed all initiatives in the Plan. DAIP initiatives implemented during the year included:• a review of the WorkCover WA website to ensure compliance with best
practice as defined by W3C Web Content Accessibility 2.0 guidelines; and• upgrade of ‘JAWS’ software to support a vision impaired staff member’s
access to a career development opportunity.
Workplace consultation
Innovation framework developmentWorkCover WA’s Innovation Framework provides a high-level approach to exploring innovative practice and policy across WorkCover WA.
The Agency seeks to build a culture of innovation by providing opportunities to raise and share ideas to achieve cost savings, and improve performance and service delivery.
In January 2015 the Framework was implemented through the development of the following four elements:
• Innovation Support Committee The Committee first met in February 2015 and oversees the operation of the Innovation Framework.
• Idea Management Tool Known as ‘Launchpad’ the online idea management tool went live in January 2015 to provide a forum for staff to raise and share ideas across the organisation. All submitted ideas are reviewed by the Innovation Support Committee. Collaboration is encouraged between staff to generate and/or implement ideas.
• Promotion Promotion of Launchpad and innovation in general occurs via intranet news articles, all-staff emails, demonstrations of the Idea Management Tool, and other initiatives.
• Recognition WorkCover WA staff are recognised for their contribution to innovation in the Agency through opportunities to be involved in the development of their ideas (even if they don’t work in the area affected by the idea), and acknowledgement in the monthly CEO message and intranet news articles.
2014/15 outcomes from the Innovation Framework can be found under ‘Innovation Support Committee’ in Section 1: Agency in focus on page 24.

68
Section 4: Opportunities & challenges | WorkCover WA Annual Report 2014/15
Traineeship programPrimarily targeted at youth under the age of 25, WorkCover WA’s traineeship program also contains an emphasis on engaging with young Aboriginal and Torres Strait Islander Australians.
Once employed at WorkCover WA, trainees are required to complete a Certificate III in Government while undertaking a range of work placements across the Agency. This arrangement provides trainees with skills and experience to enable them to be ‘job ready’ for future employment opportunities.
Two trainees completed the program this financial year. At the end of 2014/15 one trainee was still employed by WorkCover WA, whilst the other trainee was engaged by another public sector agency following the completion of her traineeship.
Reconciliation Action PlanIn May 2014 WorkCover WA developed a new Reconciliation Action Plan (RAP) to raise awareness about the culture and values of Aboriginal and Torres Strait Islander Australians. The RAP was approved by Reconciliation Australia in June 2014.
In 2014/15 WorkCover WA joined the Commonwealth/State Aboriginal and Torres Strait Islander Networking Group at its quarterly meetings which are designed to develop effective strategies to improve indigenous employment within the public service. The Group hopes to share and advocate best practice relating to policies and processes for indigenous employment within State and federal agencies.
All intended RAP initiatives were completed in 2014/15, including:• engaging with Aboriginal and Torres Strait Islander businesses on
procurement of goods and services• increasing employee understanding of protocols involving
Acknowledgement of Country and Welcome to Country ceremonies.
Safety, health & wellbeingThis initiative is aligned with
WorkCover WA Strategic Goal
4 – Operational excellence
Occupational Safety & Health Management PlanThe WorkCover WA Board and Corporate Executive are committed to ensuring all employees are able to perform their duties in a safe working environment. In accordance with the Occupational Safety and Health Act 1984 (OSH Act 1984), the Occupational Safety and Health Regulations 1996, the Public Sector Occupational Safety and Health Code of Practice 2007 and the WorkSafe Plan 2010, WorkCover WA’s OSH Management Plan ensures the Agency maintains a systematic and consistent approach to OSH management.
During 2014/15, initiatives implemented from the OSH Management Plan included:• review of the WorkCover WA OSH Policy• review of the WorkCover WA OSH Risk Register• re-training of two First Aid Officers• re-training of nine Fire Wardens• the election of new Safety and Health representatives• upgrades to the functionality of the Hazard and Incident Reporting system
to allow for easier reporting of incidents and accidents• all new starters completing online OSH induction training.
The WorkCover WA OSH Committee facilitates consultation and cooperation across the Agency by collaboratively examining issues affecting the health and wellbeing of staff, and developing and implementing measures to prevent workplace accidents and injuries. The Committee’s members and activities are outlined in detail on page 25 under ‘Workplace consultation’ in Section 1: Agency in focus.
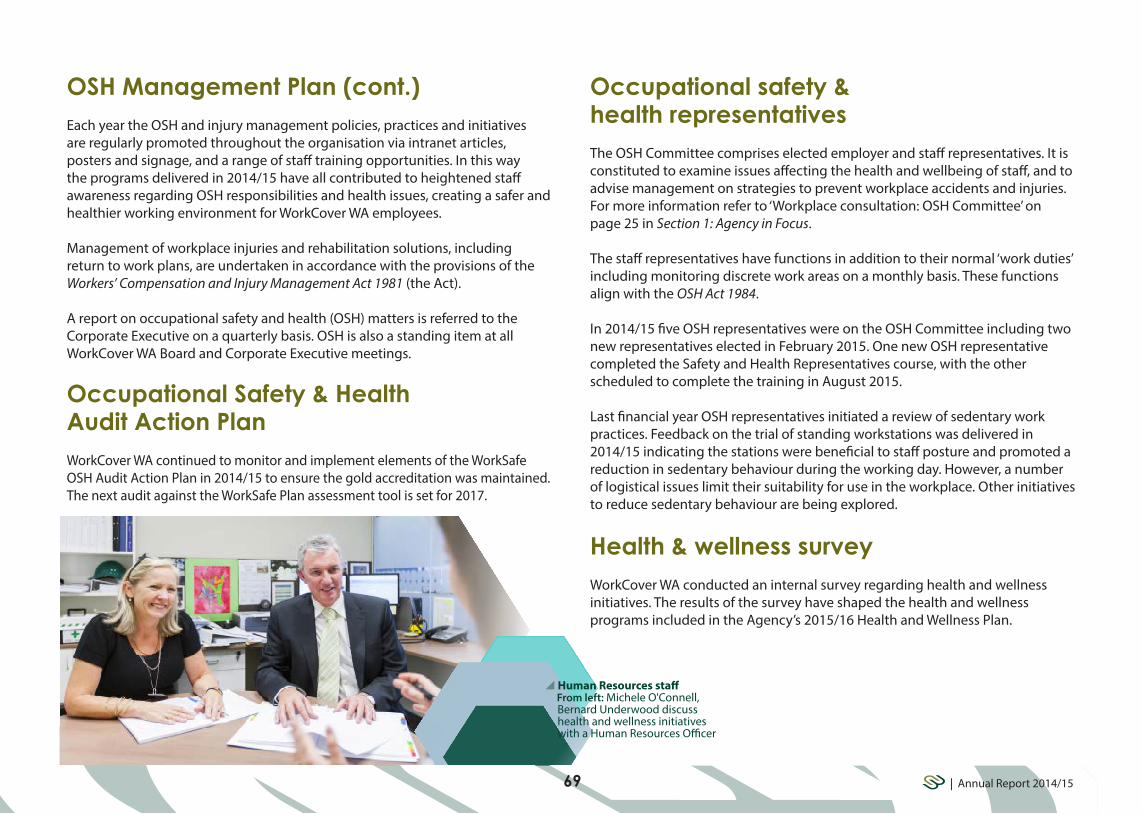
Occupational safety & health representatives The OSH Committee comprises elected employer and staff representatives. It is constituted to examine issues affecting the health and wellbeing of staff, and to advise management on strategies to prevent workplace accidents and injuries. For more information refer to ‘Workplace consultation: OSH Committee’ on page 25 in Section 1: Agency in Focus.
The staff representatives have functions in addition to their normal ‘work duties’ including monitoring discrete work areas on a monthly basis. These functions align with the OSH Act 1984.
In 2014/15 five OSH representatives were on the OSH Committee including two new representatives elected in February 2015. One new OSH representative completed the Safety and Health Representatives course, with the other scheduled to complete the training in August 2015.
Last financial year OSH representatives initiated a review of sedentary work practices. Feedback on the trial of standing workstations was delivered in 2014/15 indicating the stations were beneficial to staff posture and promoted a reduction in sedentary behaviour during the working day. However, a number of logistical issues limit their suitability for use in the workplace. Other initiatives to reduce sedentary behaviour are being explored.
Health & wellness survey WorkCover WA conducted an internal survey regarding health and wellness initiatives. The results of the survey have shaped the health and wellness programs included in the Agency’s 2015/16 Health and Wellness Plan.
OSH Management Plan (cont.)Each year the OSH and injury management policies, practices and initiatives are regularly promoted throughout the organisation via intranet articles, posters and signage, and a range of staff training opportunities. In this way the programs delivered in 2014/15 have all contributed to heightened staff awareness regarding OSH responsibilities and health issues, creating a safer and healthier working environment for WorkCover WA employees.
Management of workplace injuries and rehabilitation solutions, including return to work plans, are undertaken in accordance with the provisions of the Workers’ Compensation and Injury Management Act 1981 (the Act).
A report on occupational safety and health (OSH) matters is referred to the Corporate Executive on a quarterly basis. OSH is also a standing item at all WorkCover WA Board and Corporate Executive meetings.
Occupational Safety & Health Audit Action Plan WorkCover WA continued to monitor and implement elements of the WorkSafe OSH Audit Action Plan in 2014/15 to ensure the gold accreditation was maintained. The next audit against the WorkSafe Plan assessment tool is set for 2017.
Human Resources staff From left: Michele O'Connell, Bernard Underwood discuss health and wellness initiatives with a Human Resources Officer
69 | Annual Report 2014/15

70
Section 4: Opportunities & challenges | WorkCover WA Annual Report 2014/15
Agency challengesElectronic Document & Records Management SystemOne of the key recommendations of the IT Strategic Plan 2012–2015 was the implementation of an Electronic Document and Records Management System (EDRMS).
The project was addressed as a Strategic Initiative in 2014/15 and outcomes are reported on page 62 under Report against 2014/15 Strategic Initiatives.
Review of Risk Management FrameworkIn accordance with the Public Sector Commissioners (PSC) Circular 2015-03 and Treasurers Instruction 825, all public sector bodies must practice risk management; regularly undertake a structured risk assessment process to identify the risks facing the organisation; be able to demonstrate the management of risks; and where appropriate, have business continuity plans to ensure they can respond to and recover from any business disruption.
In 2014/15 the Agency completed a major project to:• identify and implement a new cloud based risk management support
system• implement a revised hierarchical risk management framework linking
planning outcomes and viability elements of the Western Australian workers’ compensation scheme to Agency risks both strategic and operational
• review all Agency strategic and operational risks and realign them to a structured set of specific guidelines
• review the Terms of Reference for the Agency’s risk management oversight group.
Review of Freedom of Information policyA review of the Agency’s Freedom of Information (FOI) policy, procedures and processes was conducted in 2014/15 to:• ensure the current WorkCover WA FOI Policy and FOI Information Statement
comply with the Freedom of Information Act 1992 and the Act• ensure internal processes are consistent with legislative requirements• examine online opportunities for work processes. The review was successfully completed, resulting in our internal processes being strengthened and outlined in a new FOI Procedure Manual. New online opportunities identified will assist WorkCover staff and external applicants to deal with FOI related matters in the most efficient and effective manner.
Review of corporate policies & proceduresIn 2014/15 the Agency reviewed all corporate policies and procedures in order to minimise and simplify necessary policies and procedures, and remove policies and procedures considered redundant.

71 | Annual Report 2014/15
IT Strategic PlanSupporting WorkCover WA’s strategic planning process, the IT Strategic Plan 2012–2015 defines IT strategies to ensure the Agency is appropriately supported by technology.
Two strategic initiatives commenced in 2014/15:• the Standard Operating Environment Desktop and Laptop Replacement
Project• an IT Infrastructure Upgrade Project.
The two initiatives have since been combined into one project to reduce the overall capital costs by leveraging the right mix of technology to meet business needs.
In the last financial year a detailed technical design requirements document was developed to inform the procurement process.
IT initiatives

72
about this report
72
Section 5: Disclosures & legal compliance | WorkCover WA Annual Report 2014/15
Section 5 Disclosures & legal compliance73 Report on funds management75 Other financial disclosures78 Ministerial directives78 Governance disclosures82 Legal compliance83 Government policy requirements
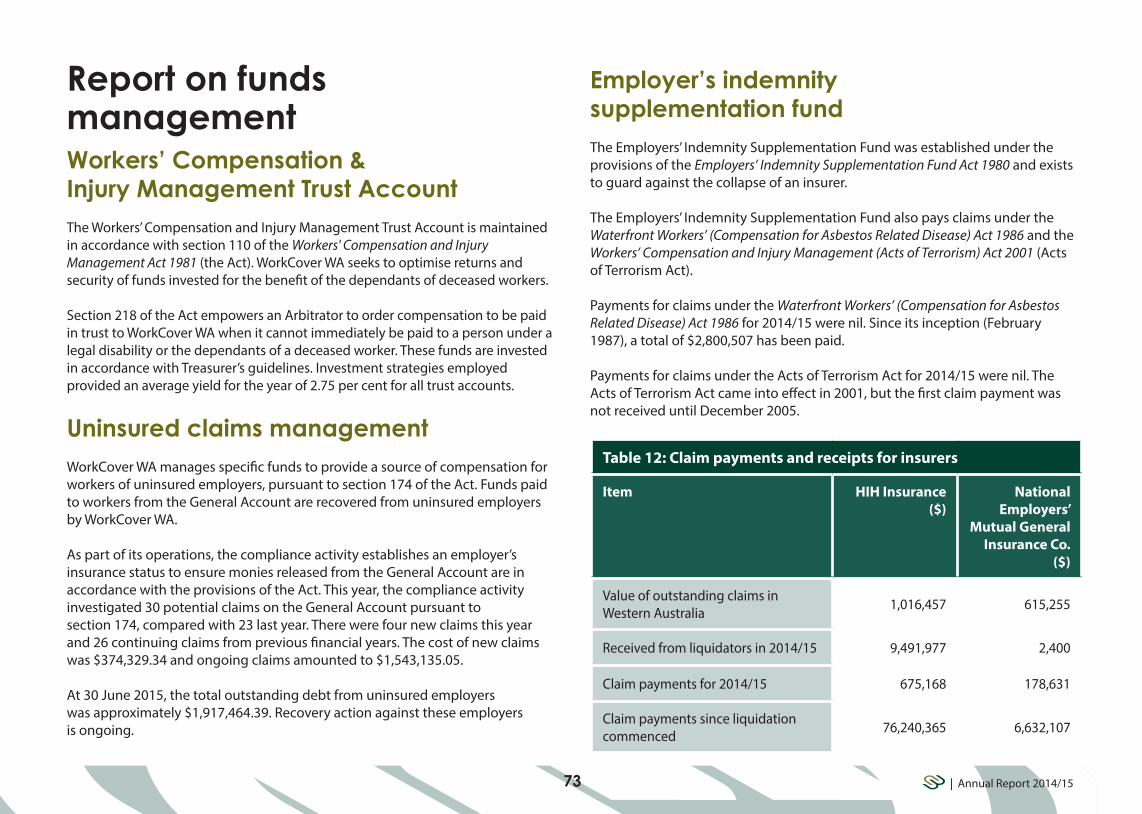
73 | Annual Report 2014/15
Report on funds management
Employer’s indemnity supplementation fundThe Employers’ Indemnity Supplementation Fund was established under the provisions of the Employers’ Indemnity Supplementation Fund Act 1980 and exists to guard against the collapse of an insurer.
The Employers’ Indemnity Supplementation Fund also pays claims under the Waterfront Workers’ (Compensation for Asbestos Related Disease) Act 1986 and the Workers’ Compensation and Injury Management (Acts of Terrorism) Act 2001 (Acts of Terrorism Act).
Payments for claims under the Waterfront Workers’ (Compensation for Asbestos Related Disease) Act 1986 for 2014/15 were nil. Since its inception (February 1987), a total of $2,800,507 has been paid.
Payments for claims under the Acts of Terrorism Act for 2014/15 were nil. The Acts of Terrorism Act came into effect in 2001, but the first claim payment was not received until December 2005.
Table 12: Claim payments and receipts for insurers
Item HIH Insurance ($)
National Employers’
Mutual General Insurance Co.
($)
Value of outstanding claims in Western Australia 1,016,457 615,255
Received from liquidators in 2014/15 9,491,977 2,400
Claim payments for 2014/15 675,168 178,631
Claim payments since liquidation commenced 76,240,365 6,632,107
Workers’ Compensation & Injury Management Trust AccountThe Workers’ Compensation and Injury Management Trust Account is maintained in accordance with section 110 of the Workers' Compensation and Injury Management Act 1981 (the Act). WorkCover WA seeks to optimise returns and security of funds invested for the benefit of the dependants of deceased workers.
Section 218 of the Act empowers an Arbitrator to order compensation to be paid in trust to WorkCover WA when it cannot immediately be paid to a person under a legal disability or the dependants of a deceased worker. These funds are invested in accordance with Treasurer’s guidelines. Investment strategies employed provided an average yield for the year of 2.75 per cent for all trust accounts.
Uninsured claims managementWorkCover WA manages specific funds to provide a source of compensation for workers of uninsured employers, pursuant to section 174 of the Act. Funds paid to workers from the General Account are recovered from uninsured employers by WorkCover WA.
As part of its operations, the compliance activity establishes an employer’s insurance status to ensure monies released from the General Account are in accordance with the provisions of the Act. This year, the compliance activity investigated 30 potential claims on the General Account pursuant to section 174, compared with 23 last year. There were four new claims this year and 26 continuing claims from previous financial years. The cost of new claims was $374,329.34 and ongoing claims amounted to $1,543,135.05.
At 30 June 2015, the total outstanding debt from uninsured employers was approximately $1,917,464.39. Recovery action against these employers is ongoing.

74
Section 5: Disclosures & legal compliance | WorkCover WA Annual Report 2014/15
Debts & investmentsAt 30 June 2015, there were 77 outstanding debtors resulting from fines and penalties awarded under section 170 of the Act, with debts outstanding of $535,518. In 2014/15, the weighted average rate of return on General Account investments was 3.31 per cent.
Table 13: Actual results vs budget results
Item 2014/15 Target
$000
2014/15 Actual
$000
Variation $000
Total Revenue(sourced from Statement of Comprehensive Income)
32,281 34,854 2,573 (a)
Total Expenses(sourced from Statement of Comprehensive Income)
26,665 21,566 5,096 (b)
Total Equity(sourced from Statement of Financial Position)
83,481 92,716 9,235 (c)
Net increase/(decrease) in cash held(sourced from Statement of Cash Flows)
7,273 10,858 3,585 (d)
Approved full-time equivalent (FTE) staff level 137.4 135.4 2
Further explanations are also contained in Note 34 ‘Explanatory statement’ to the financial statements.
a) Higher than anticipated revenue was the result of additional recoveries in the Supplementation Fund, due to the liquidation of HIH Insurance.
b) The variance is the result of a decrease in claims expense, due to a reduction in the actuarial assessed claims liability for the Uninsured and Employer’s Indemnity Supplementation Fund.
c) The variation is a result of a combination of factors including increased cash reserves from higher than expected HIH Insurance liquidation recoveries for the Supplementation Fund and higher than expected cash surplus from operational savings.
d) The variance is due to increased cash receipts resulting from higher than expected HIH Insurance liquidation recoveries for the Supplementation Fund and a higher than expected cash surplus from operational savings.

75 | Annual Report 2014/15
Other financial disclosures Board remunerationIn accordance with section 99(2) of the Act, the Chairman and Board members are paid such fees and allowances as may be fixed by the Minister on the recommendation of the Minister for Public Sector Management. On 11 January 2012, the Minister fixed the remuneration at $29,650 per annum for the Chairman and $15,500 per annum for Board members. In accordance with government policy, Board members who are public service officers are not entitled to payment.
Table 15: WorkCover WA Board remuneration
Position Name Type of remuneration
Period of membership
Gross/actual remuneration
Chairman Greg Joyce Annual 04/01/14 to 03/01/17 $29, 646
Member Michelle Reynolds
N/A – Public Service
Virtue of office Nil
Member Brian Bradley
N/A – Public Service
Virtue of office Nil
Member Karin Lee Annual 04/01/14 to 03/01/17 $15, 500
Member Owen Whittle Annual 30/12/14 to
29/12/17
Nil (Mr Whittle elected not to receive sitting
fees)
Member Steven Burns Annual 01/10/13 to
30/09/16 $15,500
Member Victoria Wilmot Annual 04/01/14 to
03/01/17 $15,500
Total $76,146
Employment & industrial relationsEmployees at WorkCover WA are employed under the provisions of the Public Service Award 1992 and the Public Service and Government Officers General Agreement 2014.
Table 14: WorkCover WA FTE Status
Employment type 2012 2013 2014 2015
Full-time permanent 115 109 109 112
Full-time contract 14 15 14 10
Part-time measured on an FTE basis 10.79 12.09 11.2 13.4
Total 139.79 136.09 134.2 135.4
Staff on secondment 6 7 5 2
Staff on traineeship 2 2 2 1
Staff in Graduate Program 0 1 0 2
Internal workers’ compensationThere were no workers’ compensation claims made by WorkCover WA staff in 2014/15.
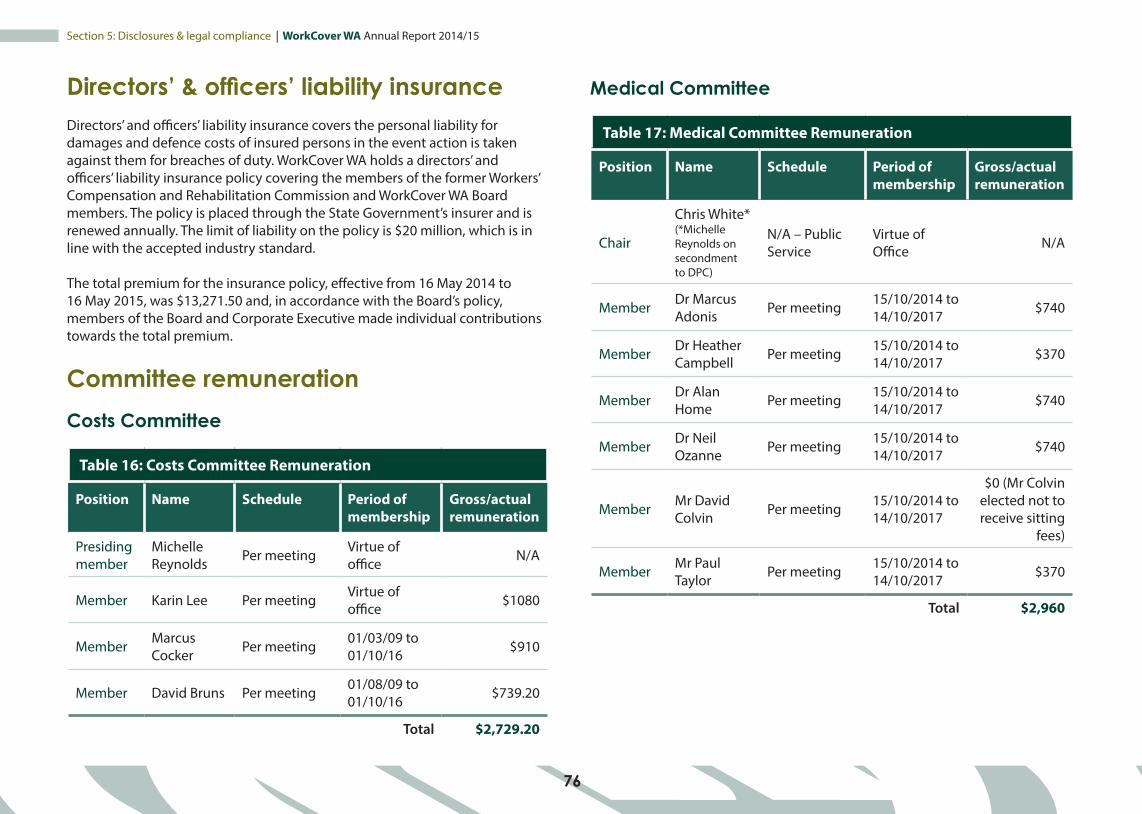
76
Section 5: Disclosures & legal compliance | WorkCover WA Annual Report 2014/15
Directors’ & officers’ liability insuranceDirectors’ and officers’ liability insurance covers the personal liability for damages and defence costs of insured persons in the event action is taken against them for breaches of duty. WorkCover WA holds a directors’ and officers’ liability insurance policy covering the members of the former Workers’ Compensation and Rehabilitation Commission and WorkCover WA Board members. The policy is placed through the State Government’s insurer and is renewed annually. The limit of liability on the policy is $20 million, which is in line with the accepted industry standard.
The total premium for the insurance policy, effective from 16 May 2014 to 16 May 2015, was $13,271.50 and, in accordance with the Board’s policy, members of the Board and Corporate Executive made individual contributions towards the total premium.
Committee remunerationCosts Committee
Table 16: Costs Committee Remuneration
Position Name Schedule Period of membership
Gross/actual remuneration
Presiding member
Michelle Reynolds Per meeting Virtue of
office N/A
Member Karin Lee Per meeting Virtue of office $1080
Member Marcus Cocker Per meeting 01/03/09 to
01/10/16 $910
Member David Bruns Per meeting 01/08/09 to 01/10/16 $739.20
Total $2,729.20
Medical Committee
Table 17: Medical Committee Remuneration
Position Name Schedule Period of membership
Gross/actual remuneration
Chair
Chris White* (*Michelle Reynolds on secondment to DPC)
N/A – Public Service
Virtue of Office N/A
Member Dr Marcus Adonis Per meeting 15/10/2014 to
14/10/2017 $740
Member Dr Heather Campbell Per meeting 15/10/2014 to
14/10/2017 $370
Member Dr Alan Home Per meeting 15/10/2014 to
14/10/2017 $740
Member Dr Neil Ozanne Per meeting 15/10/2014 to
14/10/2017 $740
Member Mr David Colvin Per meeting 15/10/2014 to
14/10/2017
$0 (Mr Colvin elected not to receive sitting
fees)
Member Mr Paul Taylor Per meeting 15/10/2014 to
14/10/2017 $370
Total $2,960
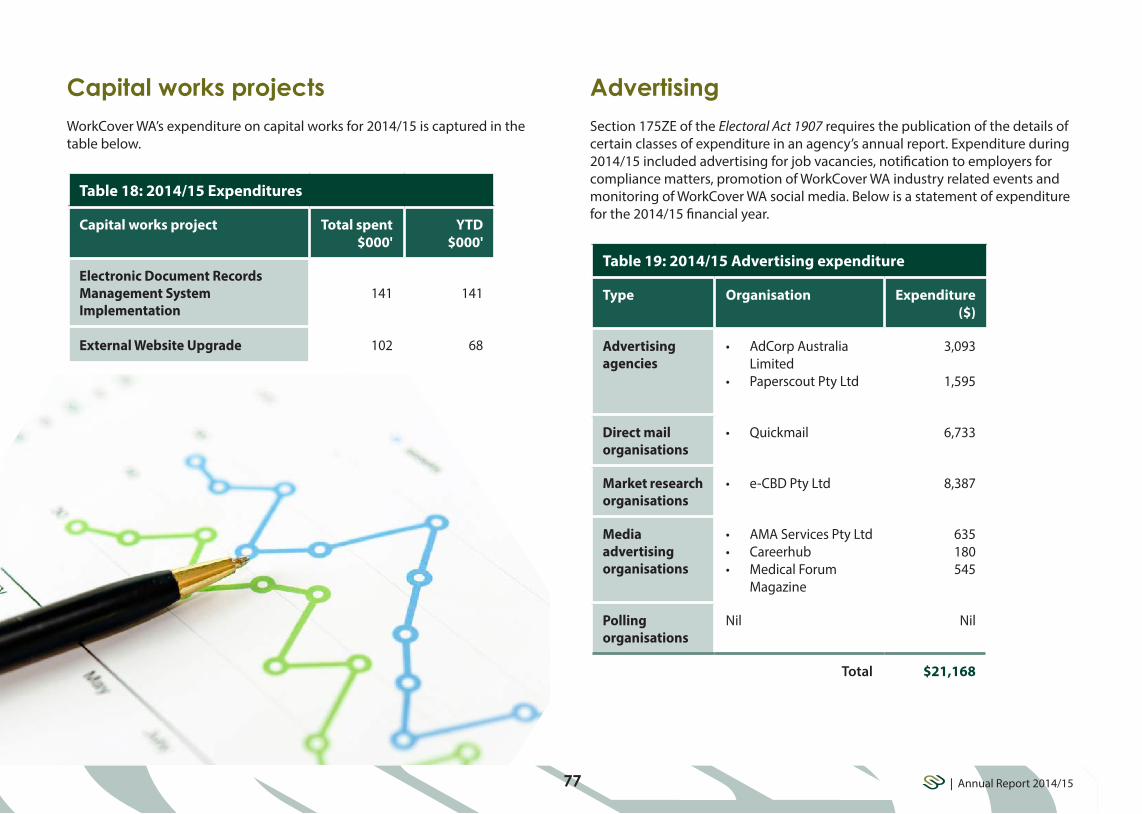
77 | Annual Report 2014/15
AdvertisingSection 175ZE of the Electoral Act 1907 requires the publication of the details of certain classes of expenditure in an agency’s annual report. Expenditure during 2014/15 included advertising for job vacancies, notification to employers for compliance matters, promotion of WorkCover WA industry related events and monitoring of WorkCover WA social media. Below is a statement of expenditure for the 2014/15 financial year.
Table 19: 2014/15 Advertising expenditure
Type Organisation Expenditure($)
Advertising agencies
• AdCorp Australia Limited
• Paperscout Pty Ltd
3,093
1,595
Direct mail organisations
• Quickmail 6,733
Market research organisations
• e-CBD Pty Ltd 8,387
Media advertising organisations
• AMA Services Pty Ltd• Careerhub• Medical Forum
Magazine
635180545
Polling organisations
Nil Nil
Total $21,168
Capital works projectsWorkCover WA’s expenditure on capital works for 2014/15 is captured in the table below.
Table 18: 2014/15 Expenditures
Capital works project Total spent$000'
YTD$000'
Electronic Document Records Management System Implementation
141 141
External Website Upgrade 102 68

78
Section 5: Disclosures & legal compliance | WorkCover WA Annual Report 2014/15
Ministerial directivesNo Ministerial directives were received during the financial year.
Governance disclosuresBoard responsibilitiesWorkCover WA’s corporate governance arrangements ensure transparency in decision making and operation, as well as accountability to stakeholders, by promoting strong leadership, sound management and effective planning and review.
WorkCover WA aims to achieve high standards in corporate governance to assure the State Government, stakeholders and the community, it is complying with statutory responsibilities and meeting expectations with due diligence and accountability.
The Board’s governance responsibilities include:• the setting of strategic direction• establishment of goals for WorkCover WA and monitoring achievement
against those goals to optimise the Agency’s performance• ensuring compliance with statutory requirements• approving Corporate Executive recommendations• making recommendations to the Minister (where appropriate)• giving effect to Ministerial directives• managing strategic risk.
Board meeting attendance is captured in Table 20.
Board policiesThe Agency has a Board Charter, meeting procedures and governance policies to guide the actions of the Board and ensure responsibilities set down in the Act are met.
Table 20: WorkCover WA Board meeting attendance
Member Number of meetings eligible to attend
Number of meetings attended
Greg Joyce (Chairman) 10 10
Brian Bradley 10 7
Karin Lee 10 10
Victoria Wilmot 10 10
Owen Whittle 10 10
Steven Burns 10 7
Chris White 2 2
Michelle Reynolds 8 8
Conflicts of interestIn accordance with Treasurer’s Instruction 903 (14) (iii), senior officers and members of the WorkCover WA Board declared any interest held in existing or proposed contracts with WorkCover WA.
In 2014/15, Board Member Steven Burns declared he is the Manager Underwritten States of QBE Insurance (Australia) Pty Ltd. Mr Burns also declared employment with the same insurer in 2013/14.

79 | Annual Report 2014/15
CommitteesAudit Committee
The Audit Committee provides independent assurance and assistance to the Board on WorkCover WA’s risk, control and compliance framework and its external accountability responsibilities. The Committee reviews strategic and annual internal audit plans, monitors the progress of audit recommendations, and provides stewardship by promoting discussion with internal and external auditors to ensure effective systems and policies are in place.
In 2014/15, two external and 12 internal audits took place.
The Agency received a clear audit from the Auditor General for its overall control environment and internal controls relating to finances and KPIs. From the 12 internal audits undertaken, 21 findings were identified. All findings have been reported to the Audit Committee and actioned by management.
Table 21: Audit Committee attendance
Member Number of meetings eligible to attend
Number of meetings attended
Victoria Wilmot (Chair) 5 5
Greg Joyce 5 5
Brian Bradley 5 4
CEO Performance AgreementThe Agency’s performance is monitored by the WorkCover WA Board and the Minister for Commerce through deliverables determined in the annual CEO Performance Agreement.
The Performance Agreement is developed each year between the CEO, the Chairman of the Board, the Minister and the Public Sector Commissioner. An evaluation against each pre-determined deliverable is assessed by the Chairman at year end and further endorsed by the Minister and the Commissioner. The monitoring and assessment of this agreement ensures the CEO delivers on expected outcomes or explanations are provided on undelivered items.
The agreement is a statutory requirement of section 47 of the Public Sector Management Act 1994 (PSM Act) and is prepared based on a set template which includes Agency specific goals and commitments; contribution to sector-wide initiatives; and personal development goals of the CEO.
Review against the PSC Good Governance GuideIn accordance with proposed deliverables of the CEO’s 2014/15 Performance Agreement WorkCover WA undertook a review of the Agency’s performance against the Public Sector Commission’s Good Governance Guide (GGG) for public sector agencies.
The review considered the Agency’s performance and levels of compliance against the operational elements of the nine principles of the GGG. The review also considered annual report references for each of these requirements.
Following a similar review conducted in 2013, the GGG has been used in conjunction with the annual reporting framework to inform the preparation of the Agency’s annual report. In 2012/13 WorkCover WA won the Alan Skinner Award for the best annual report in the General Government Sector and in 2013/14 the WS Lonnie Memorial Trophy for the best annual report of the year.

80
Section 5: Disclosures & legal compliance | WorkCover WA Annual Report 2014/15
Costs Committee
The Costs Committee is an independent committee established under section 269 of the Act, reporting directly to the Minister. The Committee is empowered under section 271 of the Act to make, amend or revoke a determination fixing maximum costs for legal services and registered agent services provided in WorkCover WA’s Conciliation and Arbitration Services.
The Costs Committee met in March and May 2015 to consider a review of the Costs Determination. In April 2015 the Committee circulated a discussion paper to key stakeholders with proposals to amend part of the scale of costs.
The proposals were considered and the Costs Committee amended the Costs Determination. The Workers’ Compensation (Legal Practitioners and Registered Agents) Costs Determination 2015 came into effect on 1 July 2015.
Table 22: Costs Committee attendance
Member Number of meetings eligible to attend
Number of meetings attended
Michelle Reynolds (Chair) 2 2
Karin Lee 2 2
Marcus Cocker 2 2
David Bruns 2 2
Medical Committee
The Medical Committee is an advisory committee established under section 100A of the Act. The Committee provides guidance on matters of a medical nature within the Western Australian workers’ compensation scheme and advises the Board on medical matters, such as:• the WorkCover WA Guides for the Evaluation of Permanent Impairment• the criteria for designation and monitoring of Approved Medical Specialists
(AMS) providing impairment assessments• the role of AMS within the scheme.
In 2014/15, the Medical Committee recommended 10 medical practitioners for designation as an AMS. The applicants were subsequently added to the AMS register. The Committee also provided advice on several key WorkCover WA initiatives and offered opinions on the format of WorkCover WA’s peer review evenings. After consultation with the WorkCover WA Medical Committee, the first Psychiatric Peer Review session was held in May 2015.
Table 23: Medical Committee attendance
Member Number of meetings eligible to attend
Number of meetings attended
Michelle Reynolds (Chair) 2 2
Dr Marcus Adonis 2 2
Dr Heather Campbell 2 1
Dr Alan Home 2 2
Dr Neil Ozanne 2 2
Mr David Colvin 2 2
Mr Paul Taylor 2 1

81 | Annual Report 2014/15
Table 25: Number of IDMP applications
Applications 2010/11 2011/12 2012/13 2013/14 2014/15
New 38 42 38 42 49
Reviewed 6 7 2 11 10
Total 44 49 40 53 59
Table 26: Number of diseases determinations
Disease 2010/11 2011/12 2012/13 2013/14 2014/15
Pneumoconiosis 9 12 12 18 28
Pneumoconiosis & Diffuse Pleural Fibrosis
N/A 5 3 4 4
Pneumoconiosis & Lung Cancer 0 1 0 0 2
Diffuse Pleural Fibrosis N/A 1 2 5 0
Mesothelioma 21 20 13 12 6
Lung Cancer 5 5 6 9 1
Sub total 35 44 36 48 41
Determinations where disease not present or disease present but a 0% level of impairment 9 5 4 5 6
Total 44 49 40 53 47
Industrial Diseases Medical Panel
The Industrial Diseases Medical Panels (IDMP) are established to determine prescribed questions in relation to asbestos related diseases. All claims for compensation in relation to pneumoconiosis, mesothelioma, lung cancer and diffuse pleural fibrosis are referred to the IDMP to determine:• whether the worker is or was suffering from the prescribed diseases• the worker’s degree of permanent whole of person impairment.
The IDMP is comprised of physicians who specialise in diseases of the chest or occupational diseases. IDMPs operate independently with WorkCover WA providing administrative support and funding.
In 2014/15, the panel convened on 26 occasions and made 49 determinations.
Table 24: Industrial Diseases Medical Panel Members
2014/15 Industrial Diseases Medical Panel Chairman (Rotating)
Members
Dr E Gabbay Dr D Bucens
Dr M K Tandon Dr P Psalia-Savona
Dr K C Wan Dr J Wrobel
Dr Q Summers
Dr M Musk
Dr J Sim

82
Section 5: Disclosures & legal compliance | WorkCover WA Annual Report 2014/15
Legal compliancePublic Sector standards & ethical codesWorkCover WA has policies, procedures and guidelines in place to ensure Agency obligations are met with respect to the Public Sector Standards (Human Resource Management), the WA Public Sector Code of Ethics, and the WorkCover WA Code of Conduct.
These policies and supporting guidelines are available to all staff via the WorkCover WA intranet and the online training system. To support knowledge of these Standards and Codes, training on accountable and ethical decision-making in the Western Australian Public Sector continued to be delivered to new staff via the online induction system in 2014/15.
Public Sector Code of Ethics
There were no claims lodged in 2014/15 relating to the Public Sector Code of Ethics.
WorkCover WA Code of Conduct
In 2014/15, the WorkCover WA Code of Conduct was reviewed, and minor amendments made to reflect current public sector and Agency policy.
There were no claims lodged in 2014/15 relating to the WorkCover WA Code of Conduct.
Public Sector Commissioner’s Instruction Employment Standard
There were no breaches of standard claims against the Employment Standard in 2014/15.
Grievance Resolution Standard
There were no breaches of standard claims against the Grievance Resolution Standard in 2014/15.
Disability Access & Inclusion PlanThe Agency’s Disability Access and Inclusion Plan is outlined on page 67 under 'Equality and inclusion' in Section 4: Opportunities and Challenges.
Recordkeeping PlanUnder the State Records Act 2000 every government organisation is required to have a Recordkeeping Plan (RKP). The RKP must provide an accurate reflection of the recordkeeping program within the organisation and must be complied with by the organisation and its officers. Under Part 3, Division 4 of the State Records Act 2000, the organisation must review its RKP every five years or when there is any significant change to the organisation’s functions.
WorkCover WA’s RKP has been reviewed and updated to reflect the Agency’s improved recordkeeping practices resulting from the implementation of the Electronic Document and Records Management System (EDRMS) and was submitted to the State Records Office in June 2015.
The online records management training module within the Agency’s induction program has been reviewed and updated in the past financial year to reflect the new recordkeeping arrangements. Other training and support was provided to staff to support them in the transition to TRIM.
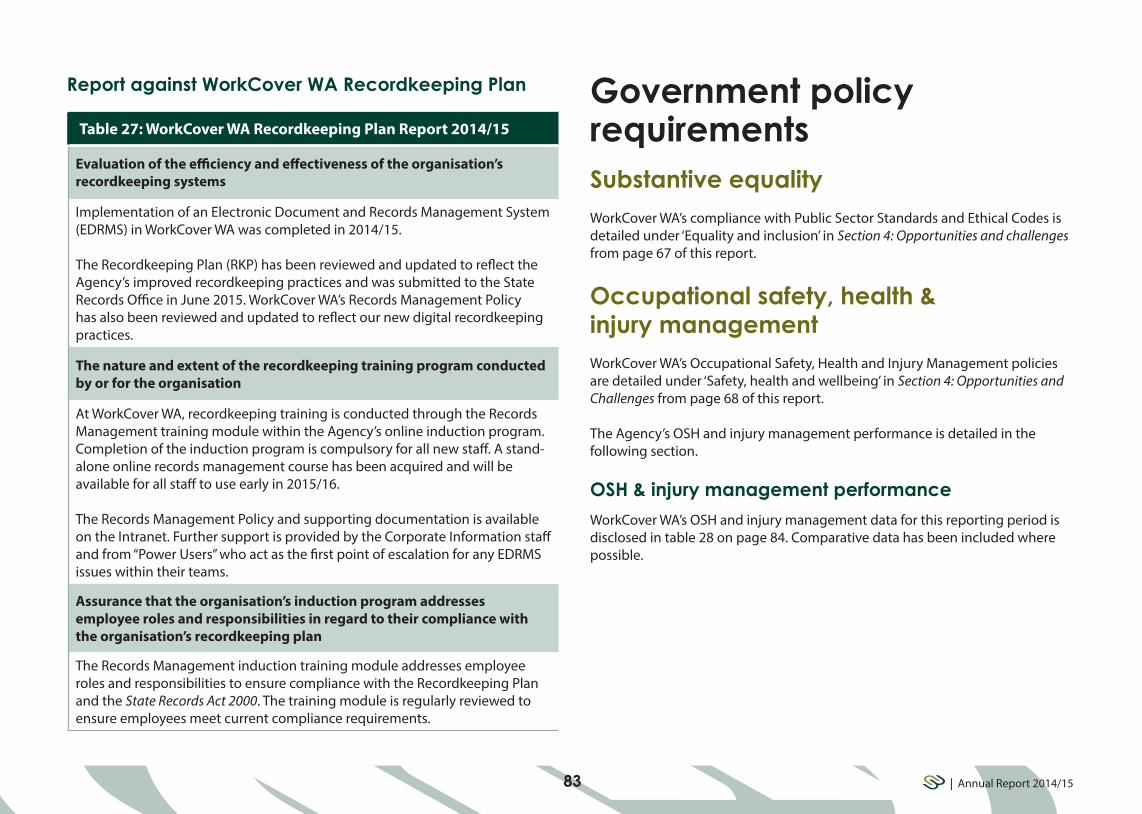
83 | Annual Report 2014/15
Government policy requirementsSubstantive equalityWorkCover WA’s compliance with Public Sector Standards and Ethical Codes is detailed under ‘Equality and inclusion’ in Section 4: Opportunities and challenges from page 67 of this report.
Occupational safety, health & injury managementWorkCover WA’s Occupational Safety, Health and Injury Management policies are detailed under ‘Safety, health and wellbeing’ in Section 4: Opportunities and Challenges from page 68 of this report.
The Agency’s OSH and injury management performance is detailed in the following section.
OSH & injury management performance
WorkCover WA’s OSH and injury management data for this reporting period is disclosed in table 28 on page 84. Comparative data has been included where possible.
Report against WorkCover WA Recordkeeping Plan
Table 27: WorkCover WA Recordkeeping Plan Report 2014/15
Evaluation of the efficiency and effectiveness of the organisation’s recordkeeping systems
Implementation of an Electronic Document and Records Management System (EDRMS) in WorkCover WA was completed in 2014/15.
The Recordkeeping Plan (RKP) has been reviewed and updated to reflect the Agency’s improved recordkeeping practices and was submitted to the State Records Office in June 2015. WorkCover WA’s Records Management Policy has also been reviewed and updated to reflect our new digital recordkeeping practices.
The nature and extent of the recordkeeping training program conducted by or for the organisation
At WorkCover WA, recordkeeping training is conducted through the Records Management training module within the Agency’s online induction program. Completion of the induction program is compulsory for all new staff. A stand-alone online records management course has been acquired and will be available for all staff to use early in 2015/16.
The Records Management Policy and supporting documentation is available on the Intranet. Further support is provided by the Corporate Information staff and from “Power Users” who act as the first point of escalation for any EDRMS issues within their teams.
Assurance that the organisation’s induction program addresses employee roles and responsibilities in regard to their compliance with the organisation’s recordkeeping plan
The Records Management induction training module addresses employee roles and responsibilities to ensure compliance with the Recordkeeping Plan and the State Records Act 2000. The training module is regularly reviewed to ensure employees meet current compliance requirements.

84
Section 5: Disclosures & legal compliance | WorkCover WA Annual Report 2014/15
Table 28: WorkCover WA OSH performance data
OSH indicator 2010/11 2011/12 2012/13 2013/14 2014/15Target
2014/15Actual
Number of fatalities 0 0 0 0 0 0
Lost-time injury/disease incidence rate *
0.67% 0 0 0.75% 0 0
Lost-time injury/disease severity rate
0 0 0 0 0 0
% injured workers returned to work within 13 weeks
- 100% N/A ** 100% 100% N/A
% injured workers returned to work within 26 weeks
- 100% N/A ** 100% 100% N/A
% managers trained in occupational safety, health and injury management responsibilities
82% 92% 92% 92% 100% 99%
OSH training for staffAll staff are required to undertake the WorkCover WA online OSH training module. The module comprises a number of sections, including:• legislative framework and requirements• WorkCover WA OSH Management System• supervisor responsibilities• OSH resources• Hazard and Incident Management System.
Completion rates are monitored by Human Resources and reported to the Corporate Executive on a quarterly basis.
* The lost-time injury/disease incidence rate is the number of lost-time injuries/diseases where one day/shift or more was lost in the financial year per 100 employees** Not applicable – no claims were recorded in 2012/13

about this report
85 | Annual Report 2014/1585
about this report
85
Section 6 Key Performance Indicators86 Additional Key Performance Indicator information90 Key Performance Indicators

86
Section 6: Key Peformance Indicators | WorkCover WA Annual Report 2014/15
Additional Key Performance Indicator informationCertification of KPIsWe hereby certify the key performance indicators are based on proper records, are relevant and appropriate for assisting users to assess WorkCover WA’s performance, and fairly represent the performance of WorkCover WA for the financial year ended 30 June 2015.
Detailed information in support of Key Performance IndicatorsGovernment Goals provide the high level basis of the Government’s intentions to improve the quality of life for all Western Australians, with the needs of Western Australians living in the regions a major priority.
The most recent goals were introduced in 2009 to better reflect current Government priorities. Broad high-level government goals are supported by strategic (whole of Government) outcome statements and at departmental level by agency specific desired outcomes. Agency level desired outcomes clarify the contributions agencies are expected to make towards achieving government policies and priorities, and must be linked to the government goals.
Agencies deliver services to achieve these desired outcomes which ultimately contribute to meeting the Government goals. This linkage creates a hierarchy in which the purpose of each service provided by an agency can be traced to a Government goal.
WorkCover WA contributes to Government Goal 3, ‘Results-Based Service Delivery’ by delivering services aimed at minimising the social and economic impact of work-related injury and disease on workers, employers and the Western Australian community.
WorkCover WA’s purpose is to lead a contemporary, healthy and integrated workers’ compensation scheme that is fair, accessible and cost effective for all participants, through:• providing advice and guidance on workers’ compensation and injury
management;• active, responsive and transparent management of the scheme;• focused information, education and compliance activities;• fair and timely dispute resolution; • a strong customer service focus.
Greg JoyceChairmanWorkCover WA28 August 2015
Michelle ReynoldsChief Executive OfficerWorkCover WA28 August 2015

87 | Annual Report 2014/15
Detailed information in support of Key Performance Indicators (cont.)WorkCover WA strives to achieve its outcome through the effective administration of the Workers’ Compensation and Injury Management Act 1981 (the Act), the provision of quality policy advice to Government, and excellent stakeholder relationships.
Our Agency Desired Outcome linking to this goal relates directly to our vision and purpose: “To ensure a workers’ compensation and injury management scheme that is financially viable, contemporary and integrated whilst providing services that are fair, accessible, timely and cost effective for all participants”.
The Agency Services provided to ensure WorkCover WA achieves its desired outcome are:• Scheme Regulation
(regulation of workers' compensation scheme participants for compliance with legislative requirements); and
• Scheme Services (provision of effective and equitable dispute resolution and other services to scheme participants)
The following table shows the WorkCover WA Outcome Based Management (OBM) Structure including the Agency Desired Outcome and Agency Services.
Table 29: WorkCover WA’s links to Government Goals through its Agency Desired Outcome and Services
Government Goal
Results-Based Service DeliveryGreater focus on achieving results in key service delivery areas for the
benefit of all Western Australians.
WorkCover WA’s Agency Desired Outcome
To ensure a workers’ compensation and injury management scheme that is financially viable, contemporary, and integrated, whilst providing
services that are fair, accessible, timely and cost effective for all participants.
WorkCover WA’s Agency Services
1. Scheme Regulation (regulation of workers’ compensation scheme participants for compliance with
legislative requirements).
2. Scheme Services (provision of effective and equitable dispute resolution and other services to scheme participants).

88
Section 6: Key Peformance Indicators | WorkCover WA Annual Report 2014/15
Changes to the Outcomes Based Management Structure (OBM) in 2014/15Section three of the Treasurer’s Instruction 904 requires that all changes in agency level desired outcomes, services and key performance indicators require the prior approval of the Under Treasurer irrespective of whether they occur within a reporting year or between reporting years. These changes are also required to be disclosed in the agency’s annual report.
WorkCover WA undertakes regular reviews of its OBM and KPI framework to ensure it provides the most suitable measures to indicate the Agency’s performance.
Changes to the OBM for the 2014/15 reporting year were endorsed by the WorkCover WA Board on 20 November 2014, approved by the Under Treasurer on 16 December 2014 and noted by the Minister 5 January 2015.
These changes involved:1. Shortening the title of Effectiveness KPI 1.2 from The proportion of
conciliations completed within 8 weeks of the date the application for conciliation was accepted to The proportion of conciliations completed within 8 weeks. Including the words “of the date the application for conciliation was accepted” in the title of the KPI is unnecessary and simply states part of the methodology used to determine the indicator outcome. No change is proposed to the methodology of the KPI and the shortened name brings the title more in line with other agency KPIs.
2. Replacing effectiveness KPI 1.3 The average number of days to resolve a dispute with a new KPI The proportion of disputes resolved within six months to better show the overall performance of WorkCover WA in resolving disputes. The new KPI shows for the period in review the percentage of disputes resolved within six months from the initial date of acceptance. This KPI will improve the focus of our measurable outcomes and ensure we are providing the most relevant, meaningful and measurable information for our stakeholders. It not only shows our performance in administering dispute resolution but is also a measure that can compare the performance of WorkCover WA with other jurisdictions. This comparative information is provided in an annual performance monitoring report produced by Safe Work Australia that includes comparison of the performance of workers’ compensation dispute resolution agencies across Australia and New Zealand. The KPI covers all disputes resolved whether through conciliation or arbitration, whereas, whilst not clear from the title, the discontinued KPI ‘The average number of days to resolve a dispute’ only measured disputes finalised through arbitration.

89 | Annual Report 2014/15
More relevance to stakeholders
As mentioned above the previous KPI only measured disputes finalised through arbitration. In 2013/14 only 22 per cent of all disputed matters proceeded to arbitration. The average duration of arbitration matters is also significantly affected by a small number of complex and protracted arbitrated cases which can sometimes take a very long time to resolve. The apparent long duration of cases suggested by the KPI is not typical of the majority of disputes which are in fact resolved in a relatively short period.
The new KPI measures all disputes resolved within six months from the day of initial acceptance for conciliation through to the day they are resolved either via conciliation or arbitration. It is based on a long established metric calculated at a national level and provides the performance of workers’ compensation dispute resolution in Western Australia.
Historical data is readily available and comparisons with both the previous dispute resolution process and other Australian jurisdictions are possible.
Issues with the previous KPI 1.3
WorkCover WA has used a number of indicators in an attempt to provide an effective measure of service delivery outcomes for dispute. Until 2012/13 the indicator was The proportion of arbitrations completed within 18 weeks of the date the application for arbitration was accepted.
In 2012/13 the indicator was changed to The average number of days to resolve a dispute. This was adopted as part of a legislative reform which establishedWorkCover WA’s Conciliation and Arbitration Services. The KPI sought to measure the total time taken to resolve disputes from the acceptance of an application for conciliation through to when the arbitration matter is finalised.
While not clear from its description, this previous KPI was based only on disputes which proceed to arbitration. In 2013/14 only twenty two percent of disputes entered arbitration with an average of 190 days to resolution relative to a target of 126 days.
This means only twenty two percent of disputes was being measured. This KPI did not properly reflect the actual performance of conciliation and arbitration, particularly the reality that the overwhelming majority of matters are resolved either at conciliation or quite quickly in the arbitration process.
The average duration of arbitration matters is significantly affected by a small number of complex and protracted arbitrated cases which can sometimes take a very long time to resolve. In addition to the need to consider complex evidence and law, these cases can be appealed to the District Court and may be remitted back to the Arbitration Service for further consideration, all of which affect the average number of days to closure.
The apparent long average duration of arbitrated cases suggested by the previous KPI is not typical of the majority of arbitrated disputes which in fact are resolved in a relatively short period, which is within six months of the initial conciliation application.

90
Section 6: Key Peformance Indicators | WorkCover WA Annual Report 2014/15
Key Performance IndicatorsThe following table shows Key Performance Indicators for WorkCover WA and their relationship with the agency’s Outcome Based Management Structure.
Table 30: WorkCover WA’s key performance indicators and their relationship with the Agency’s Outcome Based Management Structure
Agency Desired Outcome
To ensure a workers’ compensation and injury management scheme that is financially viable, contemporary, and integrated whilst providing services that are fair, accessible, timely and cost effective for all participants.
Effectiveness Indicators
1.1 The number of non-compliance events identified as a result of a claim on the General Account
1.2 The proportion of conciliations completed withins eight weeks
1.3 The proportion of disputes resolved within six months
Agency Services
1. Scheme Regulation (regulation of workers’ compensation scheme participants for compliance with legislative requirements)
2. Scheme Services (provision of effective and equitable dispute resolution and other services to scheme participants)
Efficiency Indicators
1.1 Average cost per employer compliance activity
1.2 Average cost per approved and monitored service provider
1.3 Average cost per client contact to provide information and advice
2.1 Average cost to complete a conciliation
2.2 Average cost to complete an arbitration
2.3 Average cost to process a Memorandum of Agreement
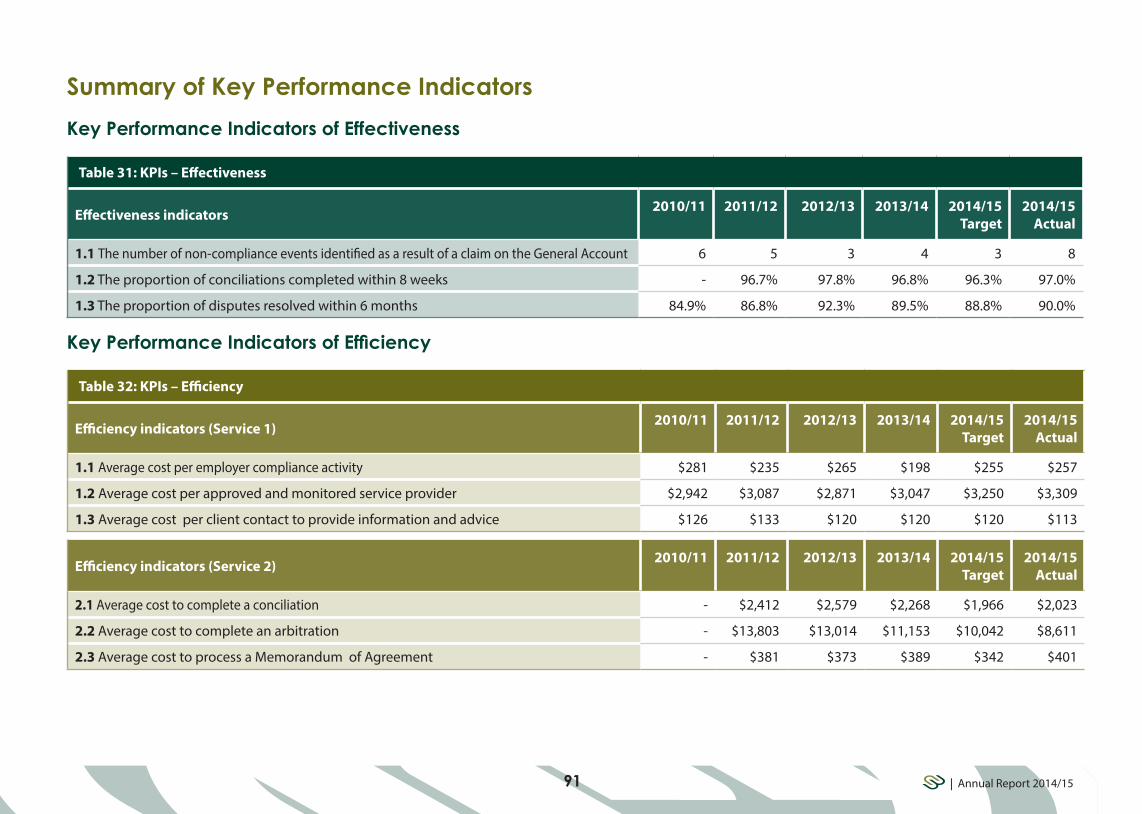
91 | Annual Report 2014/15
Summary of Key Performance IndicatorsKey Performance Indicators of Effectiveness
Table 31: KPIs – Effectiveness
Effectiveness indicators 2010/11 2011/12 2012/13 2013/14 2014/15Target
2014/15Actual
1.1 The number of non-compliance events identified as a result of a claim on the General Account 6 5 3 4 3 8
1.2 The proportion of conciliations completed within 8 weeks - 96.7% 97.8% 96.8% 96.3% 97.0%
1.3 The proportion of disputes resolved within 6 months 84.9% 86.8% 92.3% 89.5% 88.8% 90.0%
Key Performance Indicators of Efficiency
Table 32: KPIs – Efficiency
Efficiency indicators (Service 1) 2010/11 2011/12 2012/13 2013/14 2014/15Target
2014/15Actual
1.1 Average cost per employer compliance activity $281 $235 $265 $198 $255 $257
1.2 Average cost per approved and monitored service provider $2,942 $3,087 $2,871 $3,047 $3,250 $3,309
1.3 Average cost per client contact to provide information and advice $126 $133 $120 $120 $120 $113
Efficiency indicators (Service 2) 2010/11 2011/12 2012/13 2013/14 2014/15Target
2014/15Actual
2.1 Average cost to complete a conciliation - $2,412 $2,579 $2,268 $1,966 $2,023
2.2 Average cost to complete an arbitration - $13,803 $13,014 $11,153 $10,042 $8,611
2.3 Average cost to process a Memorandum of Agreement - $381 $373 $389 $342 $401

Section 6: Key Peformance Indicators | WorkCover WA Annual Report 2014/15
92
Key Performance Indicators of EffectivenessAgency level government desired outcomes should reflect the purpose of the agency. WorkCover WA’s Agency Desired Outcome is: “To ensure a workers’ compensation and injury management scheme that is financially viable, contemporary, and integrated whilst providing services that are fair, accessible, timely and cost effective for all participants.”
WorkCover WA must measure its success in achieving its outcome through effectiveness indicators. Effectiveness indicators provide information on the extent to which agency level Government desired outcomes have been achieved, or contributed to, through the delivery of services.
The effectiveness indicators chosen by WorkCover WA provide information in relation to workers’ compensation compliance activities and timeframes for managing conciliation and arbitration processes.
These indicators relate directly to the two services provided by WorkCover WA, that is Scheme Regulation and Scheme Services.
The commentary below explains the rationale behind each effectiveness indicator and how it measures success in achieving our outcome.
Indicator 1.1 Number of non-compliance events identified as a result of a claim on the General Account
2010/11 2011/12 2012/13 2013/14 2014/15Actual
2014/15Target
6 5 3 4 3 8
DescriptionEffectiveness indicator 1.1 was first introduced in 2009/10 and shows the number of non-compliance events identified as a result of a claim on the General Account, measuring the impact of employers who fail to maintain workers’ compensation insurance policies.
A non-compliance event is defined as “an occupational safety and health incident to a worker or workers of an uninsured employer, which has a financial impact on WorkCover WA’s General Account by way of an uninsured claim payment”. Given the long tail for claims relating to workplace incidents involving asbestos and industrial disease, these are excluded from the definition of an ‘event’. For example, the four main diseases associated with the inhalation of asbestos fibres (i.e. asbestosis, mesothelioma, asbestos-related lung cancer and diffuse pleural fibrosis) generally take many years, if not decades, to develop after a worker has been exposed to asbestos. The inclusion of uninsured employers for these types of work-related disease as an event would not reflect the current level of uninsured employers.
To determine the target for this indicator, an adopted figure based upon an analysis of previous years’ figures of two uninsured claims payments per 10,000 insured claims has been set as the standard. The total number of insured claims for 2013/14 was estimated to be approximately 40,000; therefore, a performance target of eight events was set.

93 | Annual Report 2014/15
The continued low number of uninsured claims (equal to or less than eight) indicates WorkCover WA is meeting its obligations in ensuring that all employers have adequate workers’ compensation coverage for their employees.
This information is derived from two of the Agency information systems. The information in relation to claim numbers is reported from the Q1 database which captures details of all claims as reported by approved insurers and self-insurers.
The data in relation to uninsured claim payments is derived from the Agency Financial Management Information System (FMIS) which reports the commencement of any payments made from the General Account. As FMIS reports all payments made in respect to claims against the General Account, this information is further analysed to exclude those matters where payments are for administration costs only, for example investigation or legal costs. The reported figure relates to payments made to a worker or service provider only. This reflects those matters where there was a legitimate entitlement to the payment of workers’ compensation benefits.
AnalysisIn 2014/15 there were three new claims against the General Account. This is 62.5 per cent less than the set target of eight accepted by the WorkCover WA Board and a slight reduction of one (25 per cent) on the number of claims for 2013/14. The target for this KPI has been historically based on an approved methodology of two claims per 10,000 insured claims whereby the number of insured claims was relatively steady in the vicinity of 40,000 per annum. In recent years this figure has been trending downwards with claims in 2013/14 being 36,878. This downward trend will be considered in setting the target for this KPI in future years.
The continued low number of claims on the General Account can be attributed in part to the focus placed on WorkCover WA’s compliance activities and the consistent application of providing stakeholder information and education to ensure employers have adequate workers’ compensation for their employees.
The graph below shows the trend over the past five years.
Figure 19: New claims on the General Account
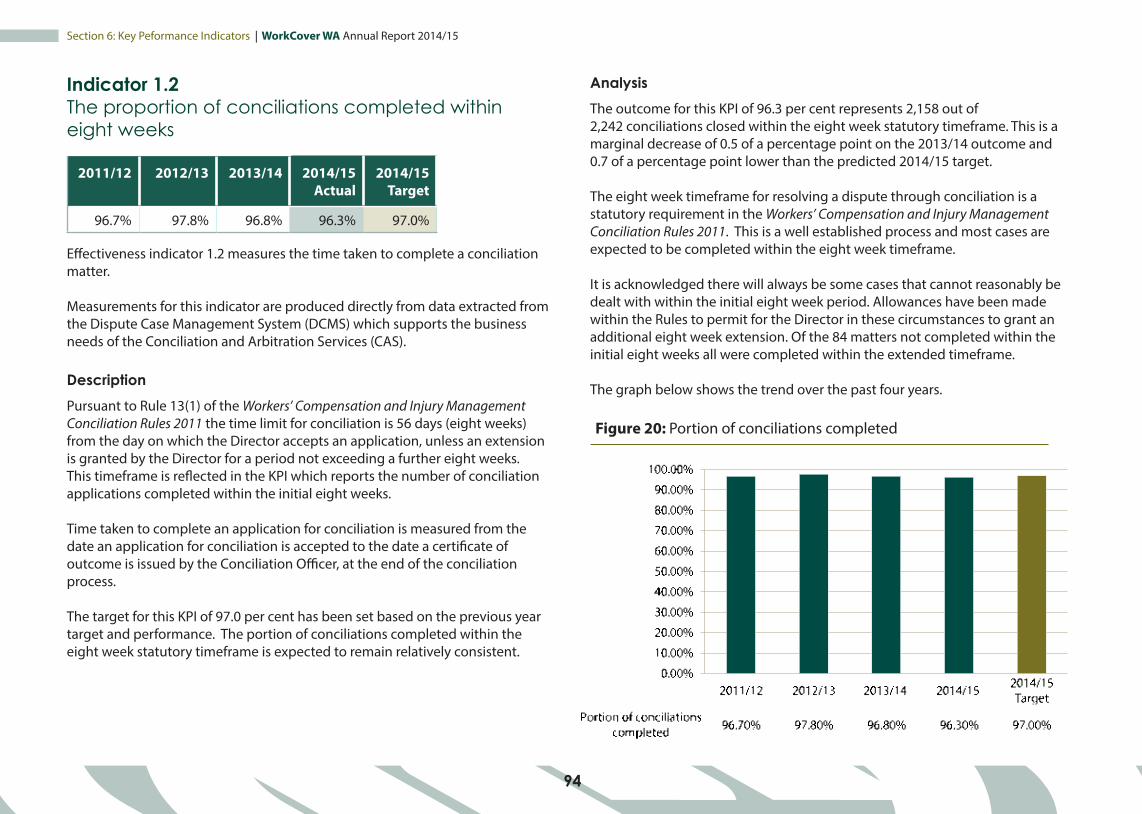
94
Section 6: Key Peformance Indicators | WorkCover WA Annual Report 2014/15
Indicator 1.2 The proportion of conciliations completed within eight weeks
2011/12 2012/13 2013/14 2014/15Actual
2014/15Target
96.7% 97.8% 96.8% 96.3% 97.0%
Effectiveness indicator 1.2 measures the time taken to complete a conciliation matter.
Measurements for this indicator are produced directly from data extracted from the Dispute Case Management System (DCMS) which supports the business needs of the Conciliation and Arbitration Services (CAS).
DescriptionPursuant to Rule 13(1) of the Workers’ Compensation and Injury Management Conciliation Rules 2011 the time limit for conciliation is 56 days (eight weeks) from the day on which the Director accepts an application, unless an extension is granted by the Director for a period not exceeding a further eight weeks. This timeframe is reflected in the KPI which reports the number of conciliation applications completed within the initial eight weeks.
Time taken to complete an application for conciliation is measured from the date an application for conciliation is accepted to the date a certificate of outcome is issued by the Conciliation Officer, at the end of the conciliation process.
The target for this KPI of 97.0 per cent has been set based on the previous year target and performance. The portion of conciliations completed within the eight week statutory timeframe is expected to remain relatively consistent.
AnalysisThe outcome for this KPI of 96.3 per cent represents 2,158 out of 2,242 conciliations closed within the eight week statutory timeframe. This is a marginal decrease of 0.5 of a percentage point on the 2013/14 outcome and 0.7 of a percentage point lower than the predicted 2014/15 target.
The eight week timeframe for resolving a dispute through conciliation is a statutory requirement in the Workers’ Compensation and Injury Management Conciliation Rules 2011. This is a well established process and most cases are expected to be completed within the eight week timeframe.
It is acknowledged there will always be some cases that cannot reasonably be dealt with within the initial eight week period. Allowances have been made within the Rules to permit for the Director in these circumstances to grant an additional eight week extension. Of the 84 matters not completed within the initial eight weeks all were completed within the extended timeframe.
The graph below shows the trend over the past four years.
Figure 20: Portion of conciliations completed

95 | Annual Report 2014/15
Indicator 1.3 The proportion of disputes resolved within six months
2010/11 2011/12 2012/13 2013/14 2014/15Actual
2014/15Target
84.9% 86.8% 92.3% 89.5% 88.8% 90.0%
DescriptionThis KPI reports the time taken to resolve a dispute and is consistent with Part XI, Section 177 of the Act, which states:
The main objectives of the conciliation and arbitration functions are to:Provide a fair and cost effective system for the resolution of disputes under the Act that – a) is timely b) is accessible, approachable and professional c) minimises costs to parties to disputes d) in the case of conciliation, leads to final and appropriate agreements between parties in relation to disputes, and e) in the case of arbitration, enables disputes not resolved by conciliation to be determined according to their substantial merits with as little formality and technicality as practicable.
This KPI measures the proportion of disputes resolved within a six month timeframe from the day they are registered for conciliation through to the day they are resolved either via conciliation or arbitration. For those disputes progressing to arbitration the 28 day statutory gap (or portion of ) allowed to register for arbitration will not be included in the timeframe. The timeframe will count from the day a dispute is registered as accepted for conciliation in the Dispute Case Management System (DCMS) through to the day the dispute is either recorded as completed for conciliation or the case closed and final orders issued where the matter has proceeded to arbitration.
Historical data for this KPI is readily available. Due to the process being measured from end to end the delineation between conciliation and arbitration
is not important for this measure and therefore comparisons with the previous dispute resolution process and other jurisdictions are appropriate. The target for this KPI has been set based on Agency trends and the national average for a six month period over the previous two years.
AnalysisThe proportion of all disputes resolved within 6 months for 2014/15 is 88.8 per cent. This is 0.7 of a percentage point less than the 2013/14 result and 1.2 per cent less than the predicted target.
These results are published in a long standing comparative performance monitoring report produced by Safe Work Australia and shows dispute resolution within the Western Australian workers’ compensation scheme performs well compared to the National average and New Zealand. The latest available data to soon be published in the Comparative Performance Monitoring Report (Edition 17) by Safe Work Australia shows the 2013/14 National and New Zealand averages of 63.9 per cent and 77.7 per cent respectively.
The graph below shows the performance over the past five years.
Figure 21: Portion of disputes resolved within 6 months

Section 6: Key Peformance Indicators | WorkCover WA Annual Report 2014/15
96
Key Performance Indicators of EfficiencyEfficiency indicators relate services to the level of resource inputs required to deliver them. The efficiency indicators for WorkCover WA are focused on financial resources and provide a per unit cost.
There are three efficiency indicators chosen for each of the two services, Scheme Regulation and Scheme Services. These indicators measure the overall costs of delivering the core services for regulation of scheme participants and conciliation and arbitration services.
Allocation of agency costs
The present KPI costing model was first introduced for the 2011/12 reporting year. To ensure accurate allocations of costs to the KPIs across the Agency, a review of Agency cost mapping and associated activities is undertaken every two years.
The review conducted in April 2013 identified changes to the mapping of activities within the Conciliation and Arbitration Services Division which took effect from 1 July 2013.
Budget figures used in the costing model for calculation of 2014/15 targets are consistent with the approved budget.
OverheadsWorkCover WA uses a cost allocation model to determine overheads and to allocate costs across the Agency’s four divisions and six efficiency KPIs.
Direct costs for each activity are allocated to individual cost centres within the relevant business units in the first instance. Indirect costs (overheads) that can easily be attributed to Full Time Equivalent (FTE) positions, such as payroll tax, superannuation, workers compensation and employee entitlements are allocated across all Agency cost centres on an FTE basis. Other overheads, such as rates, water, electricity and depreciation of buildings have been allocated according to the floor space specifically allocated to an area.
In order to account for all Agency costs, expenditure from cost centres that are not attributed directly to a KPI is allocated across all KPIs on an FTE basis.
Exempted expenditureCertain expenditure and revenue in relation to the payment and subsequent recovery of workers compensation claims are not incorporated into the KPI calculation data. This is due to the nature of these transactions and the fact that WorkCover WA has no control over the number or amount of claims lodged in accordance with the Act, which if included, would unduly skew key KPI data (For 2014/15 this represents seven percent of the total expenditure).
Exempted expenditure has decreased from the prior year due to a decrease in the valuation of future workers compensation claims liabilities.
Service 1: Scheme Regulation (regulation of workers' compensation scheme participants for compliance with legislative requirements)
As part of its responsibilities in administering the Act, WorkCover WA has responsibility to ensure the efficient and effective operation of the workers’ compensation scheme by monitoring compliance of employers, insurers and others participating in or affected by the scheme.
The KPIs listed on pages 97 – 103 measure the costs of providing these activities.

97 | Annual Report 2014/15
Indicator 1.1 Average cost per employer compliance activity
2010/11 2011/12 2012/13 2013/14 2014/15Actual
2014/15Target
$281 $235 $265 $198 $255 $257
DescriptionUnder the Act, WorkCover WA has responsibility for ensuring that every employer obtains from an approved insurance office, and keeps current, a policy of insurance for the full amount of any liability to pay compensation under the Act to any worker employed (section 160(1)). Employers have other obligations relating to insurer notifications (section 57A (2)) and regular payments to injured workers (section 57A (7)). The Act has 34 penalty provisions relating to employers’ obligations. Following notification of a possible breach, an investigation/prosecution may result.
Each employer compliance activity is recorded by team members directly into the purpose built Regulatory Services Management System (RSMS) which was commissioned on 1 December 2012. The total number of employer compliance activities for 2014/15 has been extracted directly from this system.
This indicator demonstrates the average cost per employer compliance activity and is measured by dividing the full costs of the Compliance Section plus one third of the Regulatory Services Executive and the determined WorkCover WA overhead allocation by the total number of employer compliance activities.
The target for this indicator was determined using the full year approved budget figures for the compliance activity (including allocated overheads) divided by the estimated full year total number of compliance activity units.
AnalysisThe average cost per employer compliance activity for 2014/15 is $255. This is a very minor variation of 0.8 of a percentage point reduction on the predicted target of $257 and a similar outcome for years prior to 2013/14 (all within 10 per cent variance).
The variance in performance from 2013/14 (28.8 per cent) is primarily due to significant compliance activity in 2013/14 targeted at reducing a large number of outstanding expired policy cases. This significantly increased the number of compliance activities recorded for 2013/14 and in turn contributed to the reduced average cost per activity for that year. Reduced costs for this KPI in 2013/14 due to vacancies within the compliance business unit also contributed to the unusually low cost outcome in 2013/14.
The graph below shows the cost trend over the past five years.
Figure 22: Cost per employer compliance activity

98
Section 6: Key Peformance Indicators | WorkCover WA Annual Report 2014/15
Indicator 1.2 Average cost per approved and monitored service provider
2010/11 2011/12 2012/13 2013/14 2014/15Actual
2014/15Target
$2,942 $3,087 $2,871 $3,047 $3,250 $3,309
DescriptionWorkCover WA is responsible for reviewing the performance of approved participants in the workers’ compensation scheme, and whether performance standards prescribed by legislation or developed by WorkCover WA are being met.
Service providers’ performance is monitored against established standards which can include performance criteria relating to legislative compliance, codes of conduct, codes of practice and guidelines.
Through its standards and monitoring activities, WorkCover WA approves and/or monitors the performance of the following service providers: insurers, self-insurers, workplace rehabilitation providers, approved medical specialists, audiologists/ audiometric officers and registered agents.
This indicator demonstrates the average cost per approved and monitored service provider and is measured by dividing the full costs of the Standards and Monitoring Section, plus one third of the Regulatory Services Executive and the determined WorkCover WA overhead allocation, by the total number of approved and monitored service providers.
All information relevant to the approved and monitored service providers is captured in RSMS as the single data source. Reports to provide the data for this indicator are produced directly from RSMS which has been built to support business needs in the Regulatory Services Division (RS).
The total cost of monitoring services operational activity for the reference period is provided by the Cost Allocation Model.
The target for this indicator was determined by dividing the approved budget for these activities (including allocated overheads) by the estimated total number of approved and monitored service providers.
AnalysisThe average cost per approved and monitored service provider for 2014/15 is $3,250. This is a minor reduction (1.8 per cent) on the target of $3,309 and a 6.7 per cent increase on the 2013/14 result of $3,047.
Whilst the number of service providers has remained relatively constant over time, the result of this KPI in 2013/14 was affected by a long term vacancy that contributed towards the reduced cost outcome for that year.
The graph below shows the cost trend over the past five years.
Figure 23: Average cost per approved and monitored service provider

99 | Annual Report 2014/15
Indicator 1.3 Average cost per client contact to provide information and advice
2010/11 2011/12 2012/13 2013/14 2014/15Actual
2014/15Target
$126 $133 $120 $120 $120 $113
DescriptionWorkCover WA has responsibility under the Act to promote awareness and disseminate information about the workers’ compensation scheme [s100 (h)].This indicator demonstrates the average cost of providing information and advice in relation to all aspects of the scheme.
All written advice notifications and verbal consultations are recorded in WorkCover WA’s Contact Manager system. This includes all in-person enquiries, appointments, and written enquiries. Inward telephone calls made to the Agency Advisory Line (1300 794 744) are captured by the NEC phone system. The total number of matters conducted is then extracted directly from the respective systems and compiled into a monthly activity report. Other enquiries such as Ministerial correspondence is recorded in the Ministerial tracking system and included in this monthly activity report.
The target for this indicator was determined by dividing the approved budget for this activity (including allocated overheads) by the estimated total number of written advice notifications prepared and verbal consultations conducted for the year. The estimated number of activities was based on a small increase on the overall expected activity for 2013/14 and is consistent with the increase in activity between previous years.
AnalysisThe average cost per client contact to provide information and advice for 2014/15 is $120. This is equal to the outcome for the past two years (both 2013/14 and 2012/13) and a 6.2 per cent increase on the target of $113. The Advice and Assistance Unit responds to more than 22,000 requests per annum. The estimated number of responses used to determine the 2014/15 target was calculated by applying a point seven per cent increase on the prior year in line with previous trends however this increase was not realised. The actual number of requests for advice and assistance throughout the year is down by 1,363 (5.6 per cent) from 2013/14 mostly due to a reduction in telephone enquiries. This variance could be attributed to the new WorkCover WA website which was launched on 8 October 2014. The new website offers a user friendly structure and increased search capabilities, enabling users to locate pertinent information more easily.
The graph below shows the cost trend over the past five years.
Figure 24: Average cost per client contact to provide information and advice

Section 6: Key Peformance Indicators | WorkCover WA Annual Report 2014/15
100
Service 2: Scheme Services (provision of effective and equitable dispute resolution and other services to scheme participants)
During 2011 WorkCover WA made significant amendments to the Act. These amendments established new conciliation and arbitration services within WorkCover WA, which commenced operation on 1 December 2011.
Activity is only reported for the period since 1 December 2011, when the new dispute resolution services commenced operation.
Due to the significant differences between the old and new dispute resolution systems it is not possible to provide comparative data for previous years beyond 2011/12 for the following two KPIs 2.1 and 2.2.
Whilst the process for completing Memoranda of Agreement is consistent with that used in previous years, the significant changes to the dispute resolution system and changes in the cost allocation model within which it sits does not lend itself to providing comparisons with previous years beyond 2011/12 for indicator 2.3.

101 | Annual Report 2014/15
Indicator 2.1 Average cost to complete a conciliation
2011/12 2012/13 2013/14 2014/15Actual
2014/15Target
$2,412 $2,579 $2,268 $1,966 $2,023
DescriptionThis KPI measures the average cost to complete a conciliation application. It is measured by dividing the full costs of providing the conciliation process, including the determined WorkCover WA overhead allocation, by the total number of conciliations completed.
All applications for conciliation are recorded in the Dispute Case Management System (DCMS) as are dates completed. ‘Completed’ is measured as the date that a Conciliation Officer records a Certificate of Outcome at the end of a conciliation process. A report showing the number of cases completed is produced directly from DCMS.
The target for this indicator was determined by dividing the approved budget for this activity (including allocated overheads) by the estimated total number of conciliations completed for the year. The estimated number of conciliations is based on the 2013/14 estimated actual and current trends which indicate a steady increase in conciliation activity.
The provision of comparative data from previous years for KPI 2.1 cannot be provided beyond 2011/12 due to the considerable differences in the previous and new dispute resolution systems.
AnalysisThe average cost to complete a conciliation for 2014/15 is $1,966. This is 2.8 per cent lower than the projected target of $2,023 and a 13.3 per cent reduction on the 2013/14 result of $2,268.
The number of conciliations completed for the period is slightly lower (2.5 per cent) than expected however consistent with predictions is significantly (18.0 per cent) higher than those completed in 2013/14.
The average cost of providing this service continues to reduce as the Agency strives to meet increasing demand with existing resources.
The graph below shows the cost trend over the past four years.
Figure 25: Average cost to complete a conciliation

102
Section 6: Key Peformance Indicators | WorkCover WA Annual Report 2014/15
Indicator 2.2 Average cost to complete an arbitration
2011/12 2012/13 2013/14 2014/15Actual
2014/15Target
$13,803 $13,014 $11,153 $10,042 $8,611
DescriptionThis KPI measures the average cost to complete an arbitration application. It is measured by dividing the full costs of providing the arbitration process, including the determined WorkCover WA overhead allocation, by the total number of arbitrations completed.
All arbitration applications are recorded in DCMS, including the dates the matters are finalised. ‘Finalised’ can mean that a matter is discontinued or that finalising orders are issued by an Arbitrator.
The target for this indicator is determined by dividing the approved budget for this activity (including allocated overheads) by the estimated total number of arbitrations completed for the year. The estimated number of arbitrations is based on the previous year’s estimated actual and a growing trend of increased activity throughout 2013/14.
The provision of comparative data from previous years for KPI 2.2 cannot be provided beyond 2011/12 due to the considerable differences in the previous and new dispute resolution systems.
AnalysisThe average cost to complete an arbitration for 2014/15 is $10,042. This is 16.6 per cent more than the target of $8,611 and a reduction of 10.0 per cent on the cost in 2013/14 of $11,153.
The variance to target is predominantly attributed to an over estimation of the number of arbitrations that would be completed for the year. The target arbitrations figure of 550 was based on the number of arbitrations completed for 2013/14 and ongoing trends on the increasing number of disputes being lodged. The actual number of arbitrations completed was 482 a 12.4 per cent decrease on the predicted number.
The 10.0 per cent reduction in the cost per arbitration from the previous year is directly attributed to the increase in the number of arbitrations being completed.
The ongoing reduction in the average cost of providing this service indicates the efficiencies being realised through the continued employment of sessional arbitrators.
The graph below shows the cost trend over the past four years.
Figure 26: Average cost to complete an arbitration

103 | Annual Report 2014/15
Indicator 2.3 Average cost to process a Memorandum of Agreement
2011/12 2012/13 2013/14 2014/15Actual
2014/15Target
$381 $373 $389 $342 $401
DescriptionSubject to the provisions of section 76 of the Act, WorkCover WA is responsible for registering Memoranda of Agreement (MoAs), where parties agree to settle a claim in the workers’ compensation scheme, either through redemption of weekly entitlements and medical expenses, and/or through an assessment of a worker’s impairment.
Registering MoAs involves an assessment of the accuracy of the documentation provided by the parties, as well as compliance with the Act.
Each MoA registered is recorded in the Memoranda of Agreements database which forms part of DCMS. The number of MoAs registered within the reference period is then extracted directly from this system via the MoA Registered Report.
The denominator used to derive the target for this KPI was set based on the previous year’s estimated actual and the continued increase in the number of MoAs being presented.
The processing of MoAs has been undertaken in previous years. However, due to significant changes in the dispute resolution system on 1 December 2011, and changes in the cost allocation model, it is not feasible to provide comparisons with previous years beyond 2011/12 for this indicator.
AnalysisThe average cost to process a Memorandum of Agreement (MoA) for 2013/14 is $342. This is a 14.7 per cent reduction on the expected target and a 12.1 per cent reduction on the previous year.
The variance to the target and the previous year is mostly due to an under spend as a result of some unfilled positions through vacancies and long term leave.
The average cost of providing this service has reduced in 2014/15 due to the agency being able to maintain the level of service provided with reduced resources.
The graph below shows the cost trend over the past four years.
Figure 27: Average cost to complete a Memorandum of Agreement

104
about this reportabout this reportSection 7: Financial Statements & Notes | WorkCover WA Annual Report 2014/15
Section 7 Financial statements & notes105 Financial statements109 Notes to financial statements

105 | Annual Report 2014/15
Financial statementsCertification of financial statements
Michelle ReynoldsChief Executive Officer WorkCover Western Australia Authority
28 August 2015
Greg JoyceChairmanWorkCover Western Australia Authority
28 August 2015
John HullChief Finance OfficerWorkCover Western Australia Authority
28 August 2015
Independent audit opinion
The accompanying financial statements of WorkCover Western Australia Authority have been prepared in compliance with the provisions of the Financial Management Act 2006 from proper accounts and records to present fairly the financial transactions for the financial year ended 30 June 2015 and the financial position as at 30 June 2015.
At the date of signing we are not aware of any circumstances which would render the particulars included in the financial statements misleading or inaccurate.
Auditor General
Page 1 of 3
7th Floor Albert Facey House 469 Wellington Street Perth MAIL TO: Perth BC PO Box 8489 Perth WA 6849 TEL: 08 6557 7500 FAX: 08 6557 7600
INDEPENDENT AUDITOR’S REPORT To the Parliament of Western Australia WORKCOVER WESTERN AUSTRALIA AUTHORITY Report on the Financial Statements I have audited the accounts and financial statements of the WorkCover Western Australia Authority. The financial statements comprise the Statement of Financial Position as at 30 June 2015, the Statement of Comprehensive Income, Statement of Changes in Equity and Statement of Cash Flows for the year then ended, and Notes comprising a summary of significant accounting policies and other explanatory information. Authority’s Responsibility for the Financial Statements The Authority is responsible for keeping proper accounts, and the preparation and fair presentation of the financial statements in accordance with Australian Accounting Standards and the Treasurer’s Instructions, and for such internal control as the Authority determines is necessary to enable the preparation of financial statements that are free from material misstatement, whether due to fraud or error. Auditor’s Responsibility As required by the Auditor General Act 2006, my responsibility is to express an opinion on the financial statements based on my audit. The audit was conducted in accordance with Australian Auditing Standards. Those Standards require compliance with relevant ethical requirements relating to audit engagements and that the audit be planned and performed to obtain reasonable assurance about whether the financial statements are free from material misstatement. An audit involves performing procedures to obtain audit evidence about the amounts and disclosures in the financial statements. The procedures selected depend on the auditor’s judgement, including the assessment of the risks of material misstatement of the financial statements, whether due to fraud or error. In making those risk assessments, the auditor considers internal control relevant to the Authority’s preparation and fair presentation of the financial statements in order to design audit procedures that are appropriate in the circumstances. An audit also includes evaluating the appropriateness of the accounting policies used and the reasonableness of accounting estimates made by the Authority, as well as evaluating the overall presentation of the financial statements. I believe that the audit evidence obtained is sufficient and appropriate to provide a basis for my audit opinion. Opinion In my opinion, the financial statements are based on proper accounts and present fairly, in all material respects, the financial position of the WorkCover Western Australia Authority at 30 June 2015 and its financial performance and cash flows for the year then ended. They are in accordance with Australian Accounting Standards and the Treasurer’s Instructions.

106
Section 7: Financial Statements & Notes | WorkCover WA Annual Report 2014/15
Page 2 of 3
Report on Controls I have audited the controls exercised by the WorkCover Western Australia Authority during the year ended 30 June 2015. Controls exercised by the WorkCover Western Australia Authority are those policies and procedures established by the Authority to ensure that the receipt, expenditure and investment of money, the acquisition and disposal of property, and the incurring of liabilities have been in accordance with legislative provisions. Authority’s Responsibility for Controls The Authority is responsible for maintaining an adequate system of internal control to ensure that the receipt, expenditure and investment of money, the acquisition and disposal of public and other property, and the incurring of liabilities are in accordance with the Financial Management Act 2006 and the Treasurer’s Instructions, and other relevant written law. Auditor’s Responsibility As required by the Auditor General Act 2006, my responsibility is to express an opinion on the controls exercised by the WorkCover Western Australia Authority based on my audit conducted in accordance with Australian Auditing and Assurance Standards. An audit involves performing procedures to obtain audit evidence about the adequacy of controls to ensure that the Authority complies with the legislative provisions. The procedures selected depend on the auditor’s judgement and include an evaluation of the design and implementation of relevant controls. I believe that the audit evidence obtained is sufficient and appropriate to provide a basis for my audit opinion. Opinion In my opinion, the controls exercised by the WorkCover Western Australia Authority are sufficiently adequate to provide reasonable assurance that the receipt, expenditure and investment of money, the acquisition and disposal of property, and the incurring of liabilities have been in accordance with legislative provisions during the year ended 30 June 2015. Report on the Key Performance Indicators I have audited the key performance indicators of the WorkCover Western Australia Authority for the year ended 30 June 2015. The key performance indicators are the key effectiveness indicators and the key efficiency indicators that provide information on outcome achievement and service provision. Authority’s Responsibility for the Key Performance Indicators The Authority is responsible for the preparation and fair presentation of the key performance indicators in accordance with the Financial Management Act 2006 and the Treasurer’s Instructions and for such controls as the Authority determines necessary to ensure that the key performance indicators fairly represent indicated performance. Auditor’s Responsibility As required by the Auditor General Act 2006, my responsibility is to express an opinion on the key performance indicators based on my audit conducted in accordance with Australian Auditing and Assurance Standards.
Page 3 of 3
An audit involves performing procedures to obtain audit evidence about the key performance indicators. The procedures selected depend on the auditor’s judgement, including the assessment of the risks of material misstatement of the key performance indicators. In making these risk assessments the auditor considers internal control relevant to the Authority’s preparation and fair presentation of the key performance indicators in order to design audit procedures that are appropriate in the circumstances. An audit also includes evaluating the relevance and appropriateness of the key performance indicators for measuring the extent of outcome achievement and service provision. I believe that the audit evidence obtained is sufficient and appropriate to provide a basis for my audit opinion. Opinion In my opinion, the key performance indicators of the WorkCover Western Australia Authority are relevant and appropriate to assist users to assess the Authority’s performance and fairly represent indicated performance for the year ended 30 June 2015. Independence In conducting this audit, I have complied with the independence requirements of the Auditor General Act 2006 and Australian Auditing and Assurance Standards, and other relevant ethical requirements. Matters Relating to the Electronic Publication of the Audited Financial Statements and Key Performance Indicators This auditor’s report relates to the financial statements and key performance indicators of the WorkCover Western Australia Authority for the year ended 30 June 2015 included on the Authority’s website. The Authority’s management is responsible for the integrity of the Authority’s website. This audit does not provide assurance on the integrity of the Authority’s website. The auditor’s report refers only to the financial statements and key performance indicators described above. It does not provide an opinion on any other information which may have been hyperlinked to/from these financial statements or key performance indicators. If users of the financial statements and key performance indicators are concerned with the inherent risks arising from publication on a website, they are advised to refer to the hard copy of the audited financial statements and key performance indicators to confirm the information contained in this website version of the financial statements and key performance indicators.
GLEN CLARKE DEPUTY AUDITOR GENERAL Delegate of the Auditor General for Western Australia Perth, Western Australia 28 August 2015

107 | Annual Report 2014/15
Statement of Comprehensive IncomeFor the year ended 30 June 2015
Note 2015 2014$000 $000
IncomeRevenueInsurer contributions 21,491 21,509Interest revenue 7 2,763 2,427Other revenue 8 1,104 780Employers' Indemnity Supplementation Fund 9 9,496 10,005
Total Revenue 34,854 34,721
GainsDecrease in claims liability 27,30 4,425 -
Total Gains 4,425 -
Total Income 39,279 34,721
ExpensesExpenses Employee benefits expense 12 13,959 14,052Supplies and services 13 3,315 2,908Depreciation and amortisation expense 14 1,058 884Accommodation expenses 15 674 587Claims expense 10 1,263 7,840Loss on disposal of non-current assets 11 12 30Other expenses 16 1,285 1,486
Total Expenses 21,566 27,787
Profit before grants and subsidies from State Government 17,713 6,934Services received free of charge 17 211 230
Profit for the period 17,924 7,164
Other Comprehensive IncomeItems not reclassified subsequently to profit or lossRemeasurements of defined benefit liability 27 (405) (267)Changes in asset revaluation surplus 28 (2,665) 190
Total other comprehensive income (3,070) (77)
Total Comprehensive Income For The Period 14,854 7,087
See also note 43 ‘Schedule of Income and Expenses by Service’.
The Statement of Comprehensive Income should be read in conjunction with the accompanying notes.
Statement of Financial PositionFor the year ended 30 June 2015
Note 2015 2014
Assets $000 $000
Current Assets
Cash and cash equivalents 18 9,704 8,917
Restricted cash and cash equivalents 19 82,678 72,607
Receivables 20 1,081 1,233
Other financial assets 21 13,424 9,908
Total Current Assets 106,887 92,665
Non-Current Assets
Property, plant, equipment & vehicles 22 20,761 23,506
Intangible assets 24 2,834 3,173
Total Non-Current Assets 23,595 26,679
Total Assets 130,482 119,344
LiabilitiesCurrent Liabilities
Payables 26 1,238 863
Provisions 27 6,918 6,303
Total Current Liabilities 8,156 7,166
Non-Current Liabilities
Provisions 27 29,610 34,316
Total Non-Current Liabilities 29,610 34,316
Total Liabilities 37,766 41,482
Net Assets 92,716 77,862
Equity 28
Reserves 17,500 20,165
Retained earnings 75,216 57,697
Total Equity 92,716 77,862
The Statement of Financial Position should be read in conjunction with the accompanying notes.

108
Section 7: Financial Statements & Notes | WorkCover WA Annual Report 2014/15
Statement of Changes in EquityFor the year ended 30 June 2015
Note Reserves Retained earnings
Totalequity
$000 $000 $000
Balance at 1 July 2013 28 19,975 50,800 70,775
Profit - 7,164 7,164
Other comprehensive income 190 (267) (77)
Total comprehensive income for the period 190 6,897 7,087
Balance at 30 June 2014 20,165 57,697 77,862
Balance at 1 July 2014 20,165 57,697 77,862
Profit - 17,924 17,924
Other comprehensive income (2,665) (405) (3,070)
Total comprehensive income for the period (2,665) 17,519 14,854
Balance at 30 June 2015 17,500 75,216 92,716
The Statement of Changes in Equity should be read in conjunction with the accompanying notes.
Statement of Cash FlowsFor the year ended 30 June 2015
Note 2015 2014
$000 $000
Cash Flows From Operating ActivitiesReceipts
Supplementation Fund receipts 9,496 10,005
Insurer contributions 21,493 21,509
Provision of services 9 10
Interest received 2,725 2,444
GST receipts on sales 69 74
GST receipts from taxation authority 370 417
Other receipts 1,282 536
Payments
Workers' Compensation claim payments (852) (798)
Employee benefits (14,701) (14,831)
Supplies and services (2,827) (2,991)
Accommodation (677) (618)
GST payments on purchases (471) (501)
Other payments (891) (620)
Net cash provided by operating activities 29 15,025 14,636
Cash Flows From Investing ActivitiesReceipts
Proceeds from sale of non-current physical assets 11 63 53
Payments
Purchase of non-current physical assets (714) (1,272)
Purchase of investments (3,516) (4,571)
Net cash used in investing activities (4,167) (5,790)
Net increase in cash and cash equivalents 10,858 8,846
Cash and cash equivalents at the beginning of the period 81,524 72,678
Cash and cash equivalent at the end of the period 29 92,382 81,524
The Statement of Cash Flows should be read in conjunction with the accompanying notes.

109 | Annual Report 2014/15
Notes to the financial statements1. Australian Accounting Standards
General
The Authority’s financial statements for the year ended 30 June 2015 have been prepared in accordance with Australian Accounting Standards. The term ‘Australian Accounting Standards’ includes Standards and Interpretations issued by the Australian Accounting Standards Board (AASB).
The Authority has adopted any applicable new and revised Australian Accounting Standards from their operative dates.
Early adoption of standards
The Authority cannot early adopt an Australian Accounting Standard unless specifically permitted by TI 1101 Application of Australian Accounting Standards and Other Pronouncements. There has been no early adoption of any Australian Accounting Standards issued or amended (but not operative) by the Authority for the annual reporting period ended 30 June 2015.
2. Summary of significant accounting policies
(a) General statement
The Authority is a not-for-profit reporting entity that prepares general purpose financial statements in accordance with Australian Accounting Standards, the Framework, Statements of Accounting Concepts and other authoritative pronouncements of the AASB as applied by the Treasurer's instructions. Several of these are modified by the Treasurer's instructions to vary application, disclosure, format and wording.
The Financial Management Act 2006 and the Treasurer's instructions impose legislative provisions that govern the preparation of financial statements and take precedence over Australian Accounting Standards, the Framework, Statements of Accounting Concepts and other authoritative pronouncements of the AASB.
Where modification is required and has had a material or significant financial effect upon the reported results, details of that modification and the resulting financial effect are disclosed in the notes to the financial statements.
(b) Basis of preparation
The financial statements have been prepared on the accrual basis of accounting using the historical cost convention, except for land and buildings which have been measured at fair value.
The accounting policies adopted in the preparation of the financial statements have been consistently applied throughout all periods presented unless otherwise stated.
The financial statements are presented in Australian dollars and all values are rounded to the nearest thousand dollars ($’000).
Note 4 ‘Judgements made by management in applying accounting policies’ discloses judgements that have been made in the process of applying the Authority’s accounting policies resulting in the most significant effect on amounts recognised in the financial statements.
Note 5 ‘Key sources of estimation uncertainty’ discloses key assumptions made concerning the future, and other key sources of estimation uncertainty at the end of the reporting period, that have a significant risk of causing a material adjustment to the carrying amounts of assets and liabilities within the next financial year.

110
Section 7: Financial Statements & Notes | WorkCover WA Annual Report 2014/15
(c) Reporting entity
The reporting entity comprises WorkCover Western Australia Authority.
The financial statements represent transactions of the Workers’ Compensation and Injury Management General Account established under Section 106 of the Workers' Compensation and Injury Management Act 1981, and the Supplementation Fund established under Section 5 of the Employers' Indemnity Supplementation Fund Act 1980.
Trust Accounts under Section 110 of the Workers’ Compensation and Injury Management Act 1981 are administered independently of the General Account and Supplementation Fund. See note 38 ‘Workers’ Compensation & Injury Management Trust Account’ for transactions relating to the Trust Account.
(d) Income
Revenue recognition
Revenue is recognised and measured at the fair value of consideration received or receivable. Revenue is recognised for the major business activities as follows:
Insurer contributions and supplementation fund leviesRevenue is recognised when the amount becomes due and payable.
Provision of servicesRevenue is recognised on delivery of the service to the client or by reference to the stage of completion of the transaction.
Grants, donations, gifts and other non-reciprocal contributionsRevenue is recognised at fair value when the Authority obtains control over the assets comprising the contributions, usually when cash is received.
Other non-reciprocal contributions that are not contributions by owners are recognised at their fair value. Contributions of services are only recognised when a fair value can be reliably determined and the services would be purchased if not donated.
Recoveries from uninsured employersRevenue is recognised on receipt of the recovered monies.
InterestRevenue is recognised as the interest accrues.
Gains
Realised and unrealised gains are usually recognised on a net basis. These include gains arising on the disposal of non-current assets and some revaluations of non-current assets.
The effect of an actuarial assessed decrease in the outstanding claims liability is included in the Statement of Comprehensive Income as a Gain. Refer to Provisions – Employers’ Indemnity Supplementation Fund and General Account.
(e) Property, plant and equipment and vehicles
Capitalisation/expensing of assets
Items of property, plant and equipment and vehicles costing $5,000 or more are recognised as assets and the cost of utilising assets is expensed (depreciated) over their useful lives. Items of property, plant and equipment and vehicles costing less than $5,000 are immediately expensed direct to the Statement of Comprehensive Income (other than where they form part of a group of similar items which are significant in total).
Initial recognition and measurement
Property, plant and equipment and vehicles are initially recognised at cost.
For items of property, plant and equipment and vehicles acquired at no cost or for nominal cost, the cost is the fair value at the date of acquisition.

111 | Annual Report 2014/15
Subsequent measurement
Subsequent to initial recognition as an asset, the revaluation model is used for the measurement of land and buildings and historical cost for all other property, plant and equipment. Land and buildings are carried at fair value less accumulated depreciation (buildings only) and accumulated impairment losses. All other items of property, plant and equipment are stated at historical cost less accumulated depreciation and accumulated impairment losses.
Where market-based evidence is available, the fair value of land and buildings is determined on the basis of current market values determined by reference to recent market transactions. When buildings are revalued by reference to recent market transactions, the accumulated depreciation is eliminated against the gross carrying amount of the asset and the net amount restated to the revalued amount.
In the absence of market-based evidence, fair value of land and buildings is determined on the basis of existing use. This normally applies where buildings are specialised or where land use is restricted. Fair value for existing use buildings is determined by reference to the cost of replacing the remaining future economic benefits embodied in the asset, i.e. the depreciated replacement cost. Where the fair value of buildings is determined on the depreciated replacement cost basis, the gross carrying amount and the accumulated depreciation are restated proportionately.
Land and buildings are independently valued annually by the Western Australian Land Information Authority (Valuation Services) and recognised annually to ensure that the carrying amount does not differ materially from the asset’s fair value at the end of the reporting period.
The most significant assumptions and judgements in estimating fair value are made in assessing whether to apply the existing use basis to assets and in determining estimated economic life. Professional judgment by the valuer is required where the evidence does not provide a clear distinction between market type assets and existing use assets.
Derecognition
Upon disposal or derecognition of an item of property, plant and equipment, any revaluation surplus relating to that asset is retained in the asset revaluation surplus.
Asset revaluation surplus
The asset revaluation surplus is used to record increments and decrements on the revaluation of non-current assets on a class of assets basis.
Depreciation
All non-current assets having a limited useful life are systematically depreciated over their estimated useful lives in a manner that reflects the consumption of their future economic benefits.
Depreciation is calculated using the straight line method, using rates that are reviewed annually. Estimated useful lives for each class of depreciable asset are:
Land is not depreciated.
Buildings 25 yearsPlant and equipment 5 to 15 years
Information technology - Hardware 3 to 5 yearsInformation technology - Software (a) 3 to 10 yearsMotor vehicles 6 to 7 years
(a) Software that is integral to the operation of related hardware.

112
Section 7: Financial Statements & Notes | WorkCover WA Annual Report 2014/15
(f) Intangible assets
Capitalisation/expensing of assets
Acquisitions of intangible assets costing $5,000 or more and internally generated intangible assets costing $50,000 or more are capitalised. The cost of utilising the assets is expensed (amortised) over their useful lives. Costs incurred below these thresholds are immediately expensed directly to the Statement of Comprehensive Income.
Intangible assets are initially recognised at cost. For assets acquired at no cost or for nominal cost, the cost is their fair value at the date of acquisition.
The cost model is applied for subsequent measurement requiring the asset to be carried at cost less any accumulated amortisation and accumulated impairment losses.
Amortisation for intangible assets with finite useful lives is calculated for the period of the expected benefit (estimated useful life which is reviewed annually) on the straight line basis. All intangible assets controlled by the Authority have a finite useful life and zero residual value.
The expected useful lives for each class of intangible asset are:
Licences
Licences have a finite useful life and are carried at cost less accumulated amortisation and accumulated impairment losses.
Computer software
Software that is an integral part of the related hardware is recognised as property, plant and equipment. Software that is not an integral part of the related hardware is recognised as an intangible asset. Software costing less than $5,000 is expensed in the year of acquisition.
(g) Impairment of assets
Property, plant and equipment are tested for any indication of impairment at the end of each reporting period. Where there is an indication of impairment, the recoverable amount is estimated. Where the recoverable amount is less than the carrying amount, the asset is considered impaired and is written down to the recoverable amount and an impairment loss is recognised. Where an asset measured at cost is written down to recoverable amount, an impairment loss is recognised in profit or loss. Where a previously revalued asset is written down to recoverable amount, the loss is recognised as a revaluation decrement in other comprehensive income. As the Authority is a not-for-profit entity, unless a specialised asset has been identified as a surplus asset, the recoverable amount is the higher of an asset’s fair value less costs to sell and depreciated replacement cost.
The risk of impairment is generally limited to circumstances where an asset’s depreciation is materially understated, where the replacement cost is falling or where there is a significant change in useful life. Each relevant class of assets is reviewed annually to verify that the accumulated depreciation/amortisation reflects the level of consumption or expiration of asset’s future economic benefits and to evaluate any impairment risk from falling replacement costs.
Intangible assets with an indefinite useful life and intangible assets not yet available for use are tested for impairment at the end of each reporting period irrespective of whether there is any indication of impairment.
The recoverable amount of assets identified as surplus assets is the higher of fair value less costs to sell and the present value of future cash flows expected to be derived from the asset. Surplus assets carried at fair value have no risk of material impairment where fair value is determined by reference to market-based evidence. Surplus assets at cost are tested for indications of impairment at the end of each reporting period.
Licences up to 10 yearsSoftware (a) 3 to 10 years
(a) Software that is not integral to the operation of any related hardware.
113 | Annual Report 2014/15
(h) Leases
The Authority has not entered into any finance lease arrangements.
The Authority has not entered into any operating lease arrangements.
(i) Financial instruments
In addition to cash, the Authority has three categories of financial instrument:
• Loans and receivables;• Held-to-maturity investments (term deposits); and• Financial liabilities measured at amortised cost.
These financial instruments have been disaggregated in the following classes:
Financial Assets• Cash and cash equivalents• Restricted cash and cash equivalents• Receivables• Term deposits
Financial Liabilities• Payables
Initial recognition and measurement of financial instruments is at fair value which normally equates to the transaction cost or the face value. Subsequent measurement is at amortised cost using the effective interest method.
The fair value of short-term receivables and payables is the transaction cost or the face value because there is no interest rate applicable and subsequent measurement is not required as the effect of discounting is not material.
(j) Cash and cash equivalents
For the purpose of the Statement of Cash Flows, cash and cash equivalent (and restricted cash and cash equivalent) assets comprise cash on hand and short-term deposits with original maturities of three months or less that are readily convertible to a known amount of cash and which are subject to insignificant risk of changes in value.
(k) Accrued Salaries
Accrued salaries (refer to note 26 ‘Payables’) represent the amount due to staff but unpaid at the end of the financial year. Accrued salaries are settled within a fortnight of the financial year end. The Authority considers the carrying amount of accrued salaries to be equivalent to its fair value.
(l) Receivables
Receivables are recognised at original invoice amount less an allowance for any uncollectible amounts (i.e. impairment). The collectability of receivables is reviewed on an ongoing basis and any receivables identified as uncollectible are written-off against the allowance account. The allowance for uncollectible amounts (doubtful debts) is raised when there is objective evidence that the Authority will not be able to collect the debts. The carrying amount is equivalent to fair value as it is due for settlement within 30 days.
(m) Investments and other financial assets
Other financial assets (refer to note 21) represents the cash investments by the Authority.
The Authority maintains cash balances to meet general operational costs throughout the year, the future settlement of existing liabilities and asset replacements. The cash balances are invested into term deposits that range from 90 days to 365 days.
The Authority assesses at each balance date whether there is objective evidence that a financial asset or group of financial assets is impaired.

114
Section 7: Financial Statements & Notes | WorkCover WA Annual Report 2014/15
(n) Payables
Payables are recognised at the amounts payable when the Authority becomes obliged to make future payments as a result of a purchase of assets or services. The carrying amount is equivalent to fair value, as settlement is generally within 30 days.
(o) Provisions
Provisions are liabilities of uncertain timing or amount and are recognised where there is a present legal or constructive obligation as a result of a past event and when the outflow of resources embodying economic benefits is probable and a reliable estimate can be made of the amount of the obligation. Provisions are reviewed at the end of each reporting period.
Provisions – employee benefits
All annual leave and long service leave provisions are in respect of employees’ services up to the end of the reporting period.
Annual leaveAnnual leave is not expected to be settled wholly within 12 months after the end of the reporting period and is therefore considered to be ‘other long term employee benefits’. The annual leave liability is recognised and measured at the present value of amounts expected to be paid when the liabilities are settled using the remuneration rate expected to apply at the time of settlement.
When assessing expected future payments consideration is given to expected future wage and salary levels including non-salary components such as employer superannuation contributions, as well as the experience of employee departures and periods of service. The expected future payments are discounted using market yields at the end of the reporting period on national government bonds with terms to maturity that match, as closely as possible, the estimated future cash outflows.
The provision for annual leave is classified as a current liability as the Authority does not have an unconditional right to defer settlement of the liability for at least 12 months after the end of the reporting period.
Long service leaveLong service leave is not expected to be settled wholly within 12 months after the end of the reporting period is recognised and measured at the present value of amounts expected to be paid when the liabilities are settled using the remuneration rate expected to apply at the time of settlement.
When assessing expected future payments consideration is given to expected future wage and salary levels including non-salary components such as employer superannuation contributions, as well as the experience of employee departures and periods of service. The expected future payments are discounted using market yields at the end of the reporting period on national government bonds with terms to maturity that match, as closely as possible, the estimated future cash outflows.
Unconditional long service leave provisions are classified as current liabilities as the Authority does not have an unconditional right to defer settlement of the liability for at least 12 months after the end of the reporting period. Pre-conditional and conditional long service leave provisions are classified as non-current liabilities because the Authority has an unconditional right to defer the settlement of the liability until the employee has completed the requisite years of service.
SuperannuationThe Government Employees Superannuation Board (GESB) and other funds providers administer public sector superannuation arrangements in Western Australia in accordance with legislative requirements. Eligibility criteria for membership in particular schemes for public sector employees vary according to commencement and implementation dates.
Eligible employees contribute to the Pension Scheme, a defined benefit pension scheme closed to new members since 1987, or to the Gold State Superannuation Scheme (GSS), a defined benefit lump sum scheme closed to new members since 1995.

115 | Annual Report 2014/15
Employees commencing employment prior to 16 April 2007 who were not members of either the Pension Scheme or the GSS became non-contributory members of the West State Superannuation Scheme (WSS). Employees commencing employment on or after 16 April 2007 became members of the GESB Super Scheme (GESBS). From 30 March 2012, existing members of the WSS or GESBS and new employees became able to choose their preferred superannuation fund provider. The Authority makes contributions to GESB or other funds providers on behalf of employees in compliance with the Commonwealth Government’s Superannuation Guarantee (Administration) Act 1992. Contributions to these accumulation schemes extinguish the Authority’s liability for superannuation charges in respect of employees who are not members of the Pension Scheme or GSS.
The GSS is a defined benefit scheme for the purposes of employees and whole-of-government reporting. However, it is a defined contribution plan for agency purposes because the concurrent contributions (defined contributions) made by the Authority to GESB extinguishes the agency’s obligations to the related superannuation liability.
The Pension Scheme and the pre-transfer benefit for employees who transferred to the GSS Scheme are defined benefit schemes. These benefits are wholly unfunded and the liabilities for future payments are provided at the end of the reporting period. The liabilities under these schemes have been calculated separately for each scheme annually by PricewaterhouseCoopers Actuaries using the projected unit credit method.
The expected future payments are discounted to present value using market yields at the end of the reporting period on national government bonds with terms to maturity that match, as closely as possible, the estimated future cash outflows.
Provisions – other
Employment on-costsEmployment on-costs, including workers’ compensation insurance and payroll tax, are not employee benefits and are recognised separately as liabilities and expenses when the employment to which they relate has occurred. Employment on-costs are included as part of ‘Other expenses’ and are not included as part of the Authority’s ‘Employee benefits expense’. The related liability is included in ‘Employment on-costs provision’.
Provisions – Employers’ Indemnity Supplementation Fund and General Account
Liability for future claimsThe liability for outstanding claims is measured as the central estimate of the present value of expected future payments against claims incurred at the reporting date, with an additional risk margin to allow for the inherent uncertainty in the central estimate. The expected future payments include those in relation to claims reported but not yet paid, claims incurred but not reported (IBNR), claims incurred but not enough reported (IBNER) and anticipated claims handling costs.
Claims handling costs include costs that can be associated directly with individual claims, such as legal and other professional fees, and costs that can only be indirectly associated with individual claims, such as claims administration costs. The expected future payments are discounted to present value using a risk free rate.
The effect of an actuarial assessed increase in the outstanding claims liability or changes in the discount rate are included in the Statement of Comprehensive Income under 'Claims expense'. The effect of an actuarial assessed decrease in the outstanding claims liability is included in the Statement of Comprehensive Income under 'Gains'.

116
Section 7: Financial Statements & Notes | WorkCover WA Annual Report 2014/15
(p) Superannuation expense
Superannuation expense is recognised in the Statement of Comprehensive Income in profit or loss for defined contribution plans, including the concurrent payment of employer contributions to the GSS scheme, as and when the contributions fall due.
For defined benefit plans (the Pension Scheme and the pre-transfer component of the GSS), changes in the defined benefit obligation are recognised in the Statement of Comprehensive Income either in profit or loss, or, other comprehensive income as follows:
Profit or loss:• current service cost;• past service cost; and• interest cost.
other comprehensive income:• actuarial gains and losses.
(q) Comparative figures
Comparative figures are, where appropriate, reclassified to be comparable with the figures presented in the current financial year.
(r) Assets and services received free of charge or for nominal cost
Assets or services received free of charge or for nominal cost, that the Authority would otherwise purchase if not donated, are recognised as income at the fair value of the assets or services where they can be reliably measured. A corresponding expense is recognised for services received. Receipts of assets are recognised in the Statement of Financial Position.
Assets or services received from other State Government agencies are separately disclosed under Income from State Government in the Statement of Comprehensive Income.
(s) Provision for uninsured claims pursuant to Section 174
Provision is made to meet payments required under Section 174 of the Workers’ Compensation and Injury Management Act 1981 where Conciliation and Arbitration Services has made an order and the worker has not received the compensation due from the General Account at the end of the reporting period.
(t) Provision for Employers’ Indemnity Supplementation Fund (EISF)
The EISF was established by the Employers' Indemnity Supplementation Fund Act 1980 (the Act) to provide for payment of workers' compensation claims in Western Australia. Provision is made to meet the claim costs in the event an approved insurer collapses and to waterfront workers suffering from asbestos related diseases under the Waterfront Workers' (Compensation for Asbestos Related Diseases) Act.
117 | Annual Report 2014/15
3. Segment informationIn accordance with AASB 8 and TI 1101, the Authority has provided summary information at note 43 for each of the Authority’s services inclusive of the General and Supplementation Fund.
4. Judgements made by management in applying accounting policies
The preparation of financial statements requires management to make judgements about the application of accounting policies that have a significant effect on the amounts recognised in the financial statements. The Authority evaluates these judgements regularly.
The judgements that have been made in the process of applying accounting policies that have the most significant effect on the amounts recognised in the financial report include:
i) The Authority uses the services of an actuary for the purpose of determining the liability for workers’ compensation claims for asbestos and non-asbestos claims for the General Account and Supplementation Fund.
ii) The Authority has adopted a policy of obtaining actuarial assessment of employee entitlements.
5. Key sources of estimation uncertaintyKey estimates and assumptions concerning the future are based on historical experience and various other factors that have a significant risk of causing a material adjustment to the carrying amount of assets and liabilities within the next financial year.
Long Service LeaveSeveral estimations and assumptions used in calculating the Authority’s long service leave provision include expected future salary rates, discount rates, employee retention rates and expected future payments. Changes in these estimations and assumptions may impact on the carrying amount of the long service leave provision.
Defined benefit superannuation plansIn determining the Authority’s ultimate cost of its defined superannuation plans, actuarial assumptions are required to be made. The principal actuarial assumptions used are disclosed in note 27 ‘Provisions’.
Assessment of Supplementation Fund and General Account future claims liabilityThe Authority’s risk in relation to outstanding claims liability arising from future claims liability in respect to the Supplementation Fund and General Account has been determined by actuarial assessment. The principal actuarial assumptions used are disclosed in note 27 ‘Provisions’.
118
Section 7: Financial Statements & Notes | WorkCover WA Annual Report 2014/15
Int 21 Levies
This Interpretation clarifies the circumstances under which a liability to pay a government levy imposed should be recognised. There is no financial impact for the Authority at reporting date.
AASB 10 Consolidated Financial Statements
This Standard, issued in August 2011, supersedes AASB 127 Consolidated and Separate Financial Statements and Int 112 Consolidation – Special Purpose Entities, introducing a number of changes to accounting treatments.
The adoption of the new Standard has no financial impact for the Authority as it does not impact accounting for related bodies and the Authority has no interests in other entities.
AASB 11 Joint Arrangements
This Standard, issued in August 2011, supersedes AASB 131 Interests in Joint Ventures, introduces new principles for determining the type of joint arrangement that exists, which are more aligned to the actual rights and obligations of the parties to the arrangement.
There is no financial impact for the Authority as the new standard continues to require the recognition of the Authority’s share of assets and share of liabilities for the unincorporated joint operation.
AASB 12 Disclosure of Interests in Other Entities
This Standard, issued in August 2011, supersedes disclosure requirements in AASB 127 Consolidated and Separate Financial Statements, AASB 128 Investments in Associates and AASB 131 Interests in Joint Ventures. There is no financial impact.
AASB 127 Separate Financial Statements
This Standard, issued in August 2011, supersedes AASB 127 Consolidated and Separate Financial Statements removing the consolidation requirements of the earlier standard whilst retaining accounting and disclosure requirements for the preparation of separate financial statements. There is no financial impact.
6. Disclosure of changes in accounting policy & estimatesInitial application of an Australian Accounting Standard
The Authority has applied the following Australian Accounting Standards effective, or adopted, for annual reporting periods beginning on or after 1 July 2014 that impacted on the Authority.

119 | Annual Report 2014/15
AASB 128 Investments in Associates and Joint Ventures
This Standard supersedes AASB 128 Investments in Associates, introducing a number of clarifications for the accounting treatments of changed ownership interest. The adoption of the new Standard has no financial impact for the Authority as it does not hold investments in associates and joint ventures.
AASB 1031 Materiality
This Standard supersedes AASB 1031 (February 2010), removing Australian guidance on materiality not available in IFRSs and refers to guidance on materiality in other Australian pronouncements. There is no financial impact.
AASB 1055 Budgetary Reporting
This Standard requires specific budgetary disclosures in the general purpose financial statements of not-for-profit entities within the General Government Sector. The Authority has determined that it is not required to disclose additional budgetary information and explanations of major variances between actual and budgeted amounts. There is no financial impact.
AASB 2011-7 Amendments to Australian Accounting Standards arising from the Consolidation and Joint Arrangements Standards [AASB 1, 2, 3, 5, 7, 101, 107, 112, 118, 121, 124, 132, 133, 136, 138, 139, 1023 & 1038 and Int 5, 9, 16 & 17]
This Standard gives effect to consequential changes arising from the issuance of AASB 10, AASB 11, AASB 127 Separate Financial Statements and AASB 128 Investments in Associates and Joint Ventures. There is no financial impact for the Authority.
AASB 2012-3 Amendments to Australian Accounting Standards – Offsetting Financial Assets and Financial Liabilities [AASB 132]
This Standard adds application guidance to AASB 132 to address inconsistencies identified in applying some of the offsetting criteria, including clarifying the meaning of “currently has a legally enforceable right of set-off” and that some gross settlement systems may be considered equivalent to net settlement. There is no financial impact.
AASB 2013-3 Amendments to AASB 136 – Recoverable Amount Disclosures for Non-Financial Assets
This Standard introduces editorial and disclosure changes. There is no financial impact.
AASB 2013-4 Amendments to Australian Accounting Standards – Novation of Derivatives and Continuation of Hedge Accounting [AASB 139]
This Standard permits the continuation of hedge accounting in circumstances where a derivative, which has been designated as a hedging instrument, is novated from one counterparty to a central counterparty as a consequence of laws or regulations. The Authority does not routinely enter into derivatives or hedges, therefore there is no financial impact.
AASB 2013-8 Amendments to Australian Accounting Standards – Australian Implementation Guidance for Not-for-Profit Entities – Control and Structured Entities [AASB 10, 12 & 1049]
The amendments, issued in October 2013, provide significant guidance in determining whether a not-for-profit entity controls another entity when financial returns are not a key attribute of the investor’s relationship. The Standard has no financial impact in its own right, rather the impact results from the adoption of the amended AASB 10.
Initial application of an Australian Accounting Standard (cont.)

120
Section 7: Financial Statements & Notes | WorkCover WA Annual Report 2014/15
AASB 2013-9 Amendments to Australian Accounting Standards – Conceptual Framework, Materiality and Financial Instruments
Part B of this omnibus Standard makes amendments to other Standards arising from the deletion of references to AASB 1031 in other Standards for periods beginning on or after 1 January 2014. It has no financial impact.
AASB 2014-1 Amendments to Australian Accounting Standards
Part A of this Standard consists primarily of clarifications to Accounting Standards and has no financial impact for the Authority.
Part B of this Standard has no financial impact as the Authority contributes to schemes that are either defined contribution plans, or deemed to be defined contribution plans.
Part C of this Standard has no financial impact as it removes references to AASB 1031 Materiality from a number of Accounting Standards.
Future Impact of Australian Accounting Standards not yet operative
The Authority cannot early adopt an Australian Accounting Standard unless specifically permitted by TI 1101 Application of Australian Accounting Standards and Other Pronouncements or by an exemption from TI 1101. Where applicable, the Authority plans to apply the following Australian Accounting Standards from their application date.
TitleOperative for reporting periods beginning on/after
AASB 9 Financial Instruments
This Standard supersedes AASB 139 Financial Instruments: Recognition and Measurement, introducing a number of changes to accounting treatments.
The mandatory application date of this Standard is currently 1 January 2018 after being amended by AASB 2012-6, AASB 2013-9, and AASB 2014-1 Amendments to Australian Accounting Standards. The Authority has not yet determined the application or the potential impact of the Standard.
1 Jan 2018
AASB 15 Revenue from Contracts with Customers
This Standard establishes the principles that the Authority shall apply to report useful information to users of financial statements about the nature, amount, timing and uncertainty of revenue and cash flows arising from a contract with a customer. The Authority has not yet determined the application or the potential impact of the Standard.
1 Jan 2017
AASB 2010-7 Amendments to Australian Accounting Standards arising from AASB 9 (December 2010) [AASB 1, 3, 4, 5, 7, 101, 102, 108, 112, 118, 120, 121, 127, 128, 131, 132, 136, 137, 139, 1023 & 1038 and Int 2, 5, 10, 12, 19 & 127]
This Standard makes consequential amendments to other Australian Accounting Standards and Interpretations as a result of issuing AASB 9 in December 2010.
The mandatory application date of this Standard has been amended by AASB 2012-6 and AASB 2014-1 to 1 January 2018. The Authority has not yet determined the application or the potential impact of the Standard.
1 Jan 2018
Initial application of an Australian Accounting Standard (cont.)

121 | Annual Report 2014/15
AASB 2013-9 Amendments to Australian Accounting Standards Conceptual Framework, Materiality and Financial
Part C of this omnibus Standard defers the application of AASB 9 to 1 January 2017. The application date of AASB 9 was subsequently deferred to 1 January 2018 by AASB 2014-1. The Authority has not yet determined the application or the potential impact of AASB 9.
1 Jan 2015
AASB 2014-1 Amendments to Australian Accounting Standards
Part E of this Standard makes amendments to AASB 9 and consequential amendments to other Standards. It has not yet been assessed by the Authority to determine the application or potential impact of the Standard.
1 Jan 2015
AASB 2014-3 Consolidated Financial Statements
Amendments to Australian Accounting Standards – Accounting for Acquisitions of Interests in Joint Operations [AASB 1 & 11]The Authority does not establish Joint Operations in pursuit of its objectives and does not routinely acquire interests in Joint Operations. Therefore, there is no financial impact on application of the Standard.
1 Jan 2016
AASB 2014-4 Amendments to Australian Accounting Standards – Clarification of Acceptable Methods of Depreciation and Amortisation [AASB 116 & 138]
The adoption of this Standard has no financial impact for the Authority as depreciation and amortisation is not determined by reference to revenue generation, but by reference to consumption of future economic benefits.
1 Jan 2016
AASB 2014-5 Amendments to Australian Accounting Standards arising from AASB 15
This Standard gives effect to the consequential amendments to Australian Accounting Standards (including Interpretations) arising from the issuance of AASB 15. The Authority has not yet determined the application or the potential impact of the Standard.
1 Jan 2017
AASB 2014-7 Amendments to Australian Accounting Standards arising from AASB 9 (December 2014)
This Standard gives effect to the consequential amendments to Australian Accounting Standards (including Interpretations) arising from the issuance of AASB 9 (December 2014). The Authority has not yet determined the application or the potential impact of the Standard.
1 Jan 2018
AASB 2014-8 Amendments to Australian Accounting Standards arising from AASB 9 (December 2014) – Application of AASB 9 (December 2009) and AASB 9 (December 2010) [AASB 9 (2009 & 2010)]
This Standard makes amendments to AASB 9 Financial Instruments (December 2009) and AASB 9 Financial Instruments (December 2010), arising from the issuance of AASB 9 Financial Instruments in December 2014. The Authority has not yet determined the application or the potential impact of the Standard.
1 Jan 2015
AASB 2014-9 Amendments to Australian Accounting Standards – Equity Method in Separate Financial Statements [AASB 1, 127 & 128]
This Standard amends AASB 127, and consequentially amends AASB 1 and AASB 128, to allow entities to use the equity method of accounting for investments in subsidiaries, joint ventures and associates in their separate financial statements. The Authority has not yet determined the application or the potential impact of the Standard.
1 Jan 2016
AASB 2014-10 Amendments to Australian Accounting Standards – Sale or Contribution of Assets between an Investor and its Associate or Joint Venture [AASB 10 & 128]
This Standard amends AASB 10 and AASB 128 to address an inconsistency between the requirements in AASB 10 and those in AASB 128 (August 2011), in dealing with the sale or contribution of assets between an investor and its associate or joint venture. The Authority has not yet determined the application or the potential impact of the Standard.
1 Jan 2016
AASB 2015-1 Amendments to Australian Accounting Standards – Annual Improvements to Australian Accounting Standards 2012–2014 Cycle [AASB 1, 2, 3, 5, 7, 11, 110, 119, 121, 133, 134, 137 & 140]
These amendments arise from the issuance of International Financial Reporting Standard Annual Improvements to IFRSs 2012–2014 Cycle in September 2014, and editorial corrections. The Authority has not yet determined the application or the potential impact of the Standard.
1 Jan 2016
Future Impact of Australian Accounting Standards not yet operative (cont.)
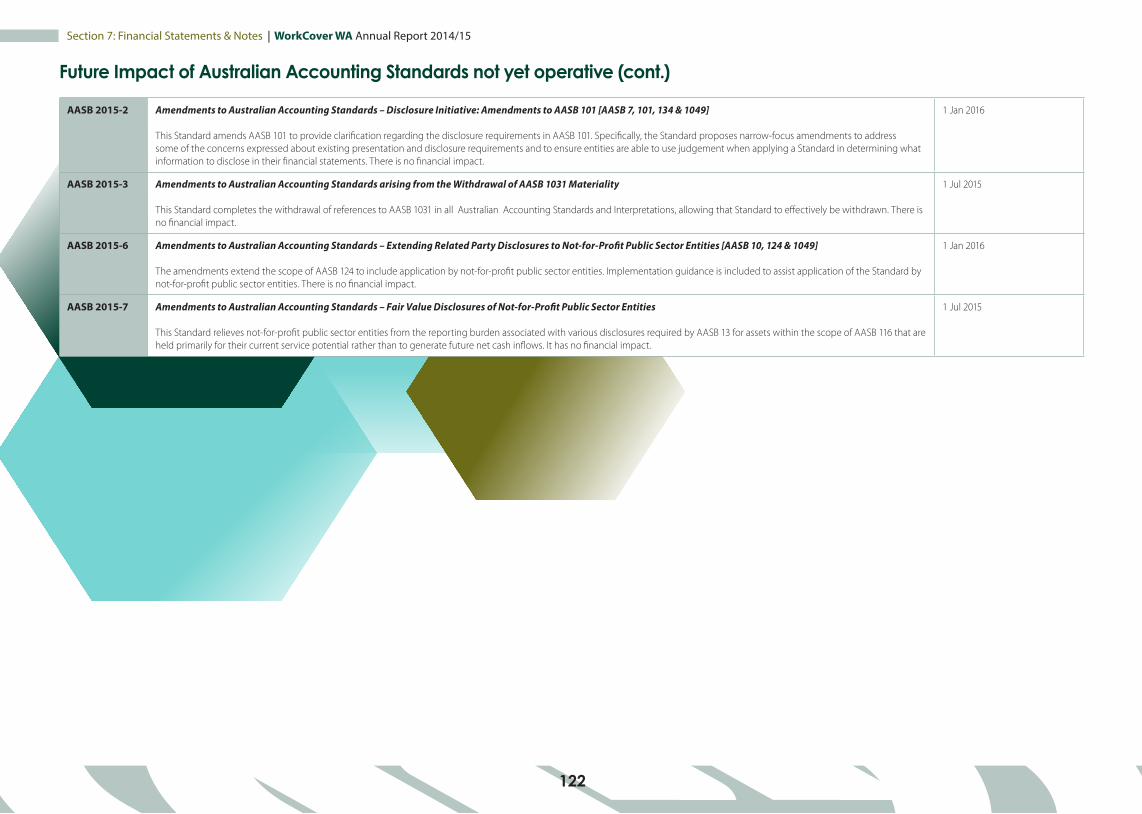
Section 7: Financial Statements & Notes | WorkCover WA Annual Report 2014/15
122
AASB 2015-2 Amendments to Australian Accounting Standards – Disclosure Initiative: Amendments to AASB 101 [AASB 7, 101, 134 & 1049]
This Standard amends AASB 101 to provide clarification regarding the disclosure requirements in AASB 101. Specifically, the Standard proposes narrow-focus amendments to address some of the concerns expressed about existing presentation and disclosure requirements and to ensure entities are able to use judgement when applying a Standard in determining what information to disclose in their financial statements. There is no financial impact.
1 Jan 2016
AASB 2015-3 Amendments to Australian Accounting Standards arising from the Withdrawal of AASB 1031 Materiality
This Standard completes the withdrawal of references to AASB 1031 in all Australian Accounting Standards and Interpretations, allowing that Standard to effectively be withdrawn. There is no financial impact.
1 Jul 2015
AASB 2015-6 Amendments to Australian Accounting Standards – Extending Related Party Disclosures to Not-for-Profit Public Sector Entities [AASB 10, 124 & 1049]
The amendments extend the scope of AASB 124 to include application by not-for-profit public sector entities. Implementation guidance is included to assist application of the Standard by not-for-profit public sector entities. There is no financial impact.
1 Jan 2016
AASB 2015-7 Amendments to Australian Accounting Standards – Fair Value Disclosures of Not-for-Profit Public Sector Entities
This Standard relieves not-for-profit public sector entities from the reporting burden associated with various disclosures required by AASB 13 for assets within the scope of AASB 116 that are held primarily for their current service potential rather than to generate future net cash inflows. It has no financial impact.
1 Jul 2015
Future Impact of Australian Accounting Standards not yet operative (cont.)
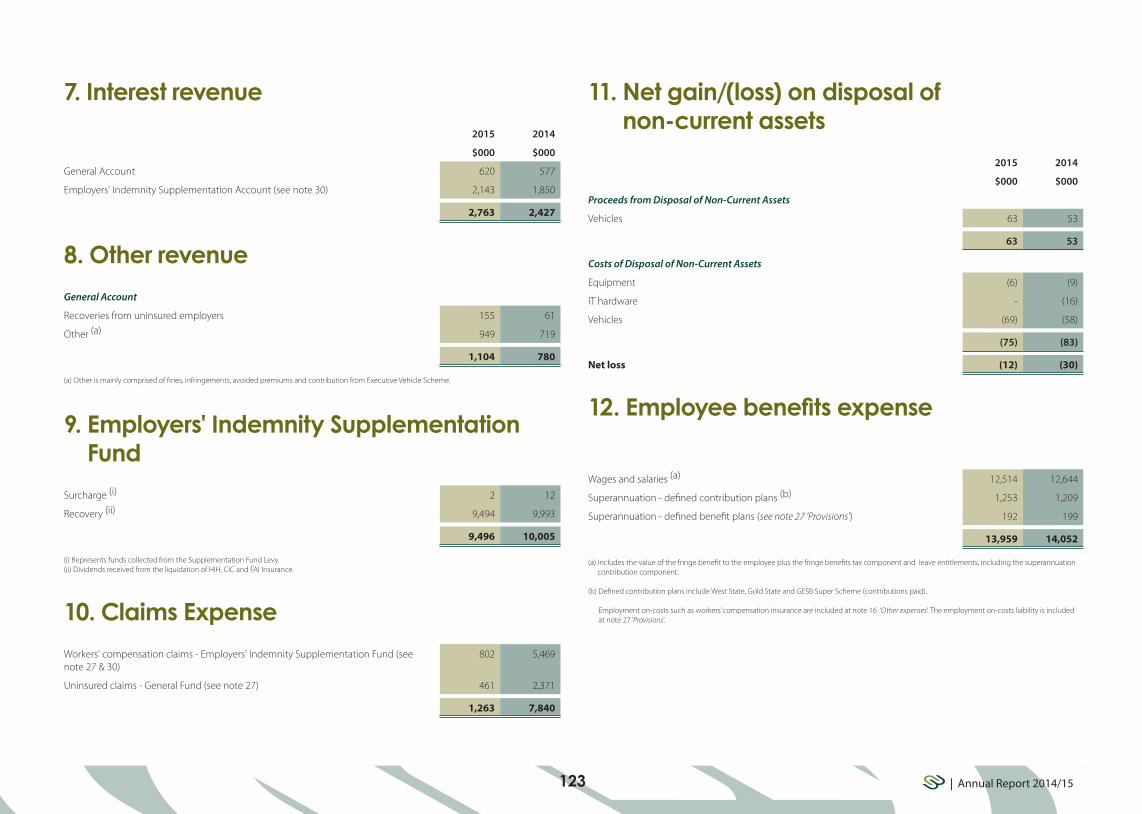
123 | Annual Report 2014/15
7. Interest revenue2015 2014
$000 $000
General Account 620 577
Employers' Indemnity Supplementation Account (see note 30) 2,143 1,850
2,763 2,427
8. Other revenueGeneral Account
Recoveries from uninsured employers 155 61
Other (a) 949 719
1,104 780
(a) Other is mainly comprised of fines, infringements, avoided premiums and contribution from Executive Vehicle Scheme.
9. Employers' Indemnity Supplementation Fund
Surcharge (i) 2 12
Recovery (ii) 9,494 9,993
9,496 10,005
(i) Represents funds collected from the Supplementation Fund Levy.(ii) Dividends received from the liquidation of HIH, CIC and FAI Insurance.
10. Claims ExpenseWorkers' compensation claims - Employers' Indemnity Supplementation Fund (see note 27 & 30)
802 5,469
Uninsured claims - General Fund (see note 27) 461 2,371
1,263 7,840
11. Net gain/(loss) on disposal of non-current assets
2015 2014
$000 $000
Proceeds from Disposal of Non-Current Assets
Vehicles 63 53
63 53
Costs of Disposal of Non-Current Assets
Equipment (6) (9)
IT hardware - (16)
Vehicles (69) (58)
(75) (83)
Net loss (12) (30)
12. Employee benefits expense
Wages and salaries (a) 12,514 12,644
Superannuation - defined contribution plans (b) 1,253 1,209
Superannuation - defined benefit plans (see note 27 'Provisions') 192 199
13,959 14,052
(a) Includes the value of the fringe benefit to the employee plus the fringe benefits tax component and leave entitlements, including the superannuation contribution component.
(b) Defined contribution plans include West State, Gold State and GESB Super Scheme (contributions paid). Employment on-costs such as workers’ compensation insurance are included at note 16 ‘Other expenses’. The employment on-costs liability is included at note 27 ‘Provisions’.

124
Section 7: Financial Statements & Notes | WorkCover WA Annual Report 2014/15
13. Supplies and services2015 2014
$000 $000
Communications 144 146
Consultants and contractors 2,169 1,848
Consumables 747 658
Insurance 43 39
Training 144 143
Travel 22 21
Other 46 53
3,315 2,908
14. Depreciation and amortisation expenseDepreciation
Plant, equipment and vehicles 222 191
Buildings 377 332
Total depreciation 599 523
Amortisation
Intangible assets 459 361
Total amortisation 459 361
Total depreciation and amortisation 1,058 884
16. Other expenses General Account
Joint initiative with WorkSafe 5 253
Employment on-costs (a) 734 725
Seminars 13 10
Doubtful debts expense 75 60
Sitting fees 84 82
Staff wellness programs 61 60
Audit Fees 187 194
Administration fee paid to Insurance Commission of WA for Uninsured General Fund Claims 55 33
Other 31 25
Employers' Indemnity Supplementation Fund (see note 30)
Administration fee paid to Insurance Commission of WA 40 44
1,285 1,486
(a) Includes worker's compensation insurance, payroll tax and other employment on-costs. The on-costs liability associated with the recognition of annual and long service leave liability is included at note 27 'Provisions'. Superannuation contributions accrued as part of the provision for leave are employee benefits and are not included in employment on-costs.
15. Accommodation expenses2015 2014
$000 $000
Outgoings 296 192
Repairs and maintenance 213 190
Other 165 205
674 587

125 | Annual Report 2014/15
17. Services received free of charge2015 2014
$000 $000
Services received free of charge from the State Solicitor’s Office 211 230
211 230
18. Cash and cash equivalentsBank accounts 2,684 1,522
Cash on hand 1 1
Term deposits (a) 7,019 7,394
9,704 8,917
(a) Term deposits are held in order to fund payments as they become due and payable. The term deposits range from 30 days to 3 months.
19. Restricted cash and cash equivalentsCurrentEmployers' Indemnity Supplementation Fund (See note 30)
Cash balance at Treasury 82,660 72,594
Commonwealth Funding - Indian Ocean Territories (Christmas & Cocos-Keeling Islands)
The Commonwealth Government provides funding in accordance with the Service Delivery Arrangement. Under the arrangement the Authority provides a range of workers' compensation related services.
Unspent funds for Indian Ocean Territories 15 1
Commonwealth Funding - Paid Parental Leave Scheme
Cash held 3 12
82,678 72,607
20. Receivables 2015 2014
$000 $000
CurrentGeneral Account
Receivables 48 231
Fines and penalties 536 548
Allowance for impairment of receivables (212) (185)
Accrued interest 122 87
GST receivable 44 16
538 697
Employers' Indemnity Supplementation Fund (see note 30)
Accrued interest 505 502
GST receivable 38 34
543 536
Total current 1,081 1,233
Non-currentGeneral Account
Receivables 418 418
Allowance for impairment of receivables (418) (418)
Total non-current - -
Total receivables 1,081 1,233
Reconciliation of changes in allowance for impairment of receivables
Balance at start of period 185 144
Doubtful debts expense 75 60
Amounts written off during the period (48) (19)
Balance at end of period 212 185
The Authority does not hold any collateral as security or other credit enhancements relating to receivables.

126
Section 7: Financial Statements & Notes | WorkCover WA Annual Report 2014/15
21. Other financial assets2015 2014
$000 $000
CurrentAt Cost:
Term deposits (a) 13,424 9,908
13,424 9,908
(a) The term deposits range from 90 days to 365 days.
22. Property, plant, equipment and vehiclesLand
At fair value (a) 15,400 15,700
15,400 15,700
Buildings
At fair value (a) 3,600 6,100
Accumulated depreciation - -
3,600 6,100
Plant, equipment & vehicles
At cost 2,666 2,533
Accumulated depreciation (927) (827)
1,739 1,706
Work in Progress
At cost 22 -
22 -
20,761 23,506
(a) Land and buildings were revalued as at 30 June 2015 by the Western Australian Land Information Authority. The property was inspected on 17 June 2015. The fair value of all land and buildings have been determined by reference to recent market transactions.
ReconciliationsReconciliations of carrying amounts of property, plant, equipment and vehicles at the beginning and end of the reporting period are set out in the table below:
Land BuildingsWork in
Progress
Plant, equipment
and vehicles Total
$000 $000 $000 $000 $000
2015
Carrying amount at start of period 15,700 6,100 - 1,706 23,506
Additions - 243 22 330 595
Transfers (a) - - - - -
Disposals - - - (75) (75)
Revaluation increments / (decrements) (300) (2,365) - - (2,665)
Depreciation - (378) - (222) (600)
Carrying amount at end of period 15,400 3,600 22 1,739 20,761
2014
Carrying amount at start of period 16,500 6,500 551 482 24,033
Additions - - - 409 409
Transfers (a) - (1,058) (551) 1,089 (520)
Disposals - - - (83) (83)
Revaluation increments / (decrements) (800) 990 - - 190
Depreciation - (332) - (191) (523)
Carrying amount at end of period 15,700 6,100 - 1,706 23,506
(a) Transfers represent the completion of intangible asset projects previously recognised in Work in Progress. In addition, $1.058 million of fitouts were reclassified from buildings to plant, equipment and vehicles.

127 | Annual Report 2014/15
24. Intangible assets 2015 2014
$000 $000
Licences
At cost 170 119
Accumulated amortisation (64) (44)
106 75
Computer Software
At cost 3,828 3,761
Accumulated amortisation (1,100) (663)
2,728 3,098
2,834 3,173
Reconciliations:Licences
Carrying amount at start of period 75 91
Additions 52 -
Amortisation expense (21) (16)
Carrying amount at end of period 106 75
Computer software
Carrying amount at start of period 3,098 2,060
Additions 67 1,383
Amortisation expense (437) (345)
Carrying amount at end of period 2,728 3,098
23. Fair value measurementsAssets measured at fair value
Level 1 Level 2 Level 3
Fair value at end of
period
$000 $000 $000 $000
2015
Land (Note 22) - 15,400 - 15,400
Buildings (Note 22) - 3,600 - 3,600
- 19,000 - 19,000
2014
Land (Note 22) - 15,700 - 15,700
Buildings (Note 22) - 6,100 - 6,100
- 21,800 - 21,800
There were no transfers between Levels 1, 2 or 3 during the current and the previous periods.
Valuation techniques to derive Level 2 fair valuesLevel 2 fair values of Land and Buildings (office accommodation) are derived using the market approach. Market evidence of sales prices of comparable land and buildings (office accommodation) in close proximity is used to determine price per square metre.
Valuation ProcessesThere were no changes in valuation techniques during the period.

128
Section 7: Financial Statements & Notes | WorkCover WA Annual Report 2014/15
26. Payables2015 2014
$000 $000
CurrentGeneral Account
Trade payables 134 75
Accrued expenses 405 260
Accrued salaries 503 379
Other payables 124 27
Employers' Indemnity Supplementation Fund (see note 30)
Claim payments 72 122
1,238 863
27. Provisions2015 2014
$000 $000
CurrentGeneral AccountEmployee benefits provision
Annual leave (a) 471 573
Long service leave (b) 2,257 2,001
Superannuation (d) 524 483
3,252 3,057
Uninsured Workers (e) 1,750 1,189
1,750 1,189
Other provisions
Employment on-costs (c) 163 153
163 153
Employers' Indemnity Supplementation Fund (see note 30)
Liability for estimated future claim payments 1,753 1,904
1,753 1,904
Total current provisions 6,918 6,303
25. Impairment of assetsThere were no indications of impairment to property, plant and equipment or intangible assets as at 30 June 2015.
The Authority held no goodwill or intangible assets with an indefinite useful life during the reporting period. At the end of the reporting period there were no intangible assets not yet available for use.
All surplus assets at 30 June 2015 have either been classified as assets held for sale or written-off.

129 | Annual Report 2014/15
2015 2014
$000 $000
Non-currentGeneral AccountEmployee benefits provision
Long service leave (b) 627 732
Superannuation (d) 5,375 5,134
6,002 5,866
Uninsured Workers (e) 7,322 9,036
7,322 9,036
Other provisions
Employment on-costs (c) 37 44
37 44
Employers' Indemnity Supplementation Fund (see note 30)
Liability for estimated future claim payments 16,249 19,370
16,249 19,370
Total non-current provisions 29,610 34,316
Annual leave liabilities have been classified as current as there is no unconditional right to defer settlement for at least 12 months after the reporting period. Assessments indicate that actual settlement of the liabilities is expected to occur as follows:
Within 12 months of the end of the reporting period 427 490
More than 12 months after the end of the reporting period 44 83
471 573
Long service leave liabilities have been classified as current where there is no unconditional right to defer settlement for at least 12 months after the end of the reporting period. Assessments indicate that actual settlement of the liabilities is expected to occur as follows:
Within 12 months of the end of the reporting period 781 970
More than 12 months after the end of the reporting period 2,103 1,763
2,884 2,733
The settlement of annual and long service leave liabilities gives rise to the payment of employment on-costs including workers’ compensation insurance and payroll tax. The provision is the present value of expected future payments. The associated expense, apart from the unwinding of the discount (finance cost), is disclosed in note 16 ‘Other expenses’.
Defined benefit superannuation plans
Movements in the present value of the defined benefit obligation in the reporting period were as follows:
Pension Scheme
Pre-transfer benefit - Gold State
Superannuation Scheme
2015 2014 2015 2014
$000 $000 $000 $000
Liability at start of period 5,155 4,998 461 483
Included in profit or loss:Current service cost - - - -
Past service cost - - - -
Interest cost 175 184 16 18
175 184 16 18
Included in Other Comprehensive Income:Remeasurements loss (gain) recognised:Actuarial losses/(gains) arising from:
Demographic assumptions - - - -
Financial assumptions 326 187 (2) 2
Experience adjustments 57 90 24 (12)
383 277 22 (10)
Contributions:
Benefits paid (313) (304) - (30)
(313) (304) - (30)
Liability at end of period 5,400 5,155 499 461
The Authority holds no plan assets, therefore the present value of the defined benefit obligation equals the net defined benefit liability. Employer contributions, to the Pension Scheme and the pre-transfer benefit for employees who transferred to the GSS, equal the benefits paid.
(a)
(b)
(c)
(d)

130
Section 7: Financial Statements & Notes | WorkCover WA Annual Report 2014/15
The principal actuarial assumptions used (expressed as weighted averages) were as follows:
Pension Scheme
Pre-transferbenefit - Gold State
Superannuation Scheme
2015 2014 2015 2014
Discount rate 3.00% 3.50% 3.00% 3.50%
Pension increases 2.50% 2.50%
Future salary increases 3.5% for the firstyear, 3% for the
next 3 years, and 4.5% thereafter
N/A 3.5% for the firstyear, 3% for the
next 3 years, and 4.5% thereafter
4.1% for the first 4 years
and 4.5% thereafter
Average longevity at retirement age (65) for current pensioners (years)
Male 22.90 22.80 N/A N/A
Female 25.50 25.40 N/A N/A
Average longevity at retirement age (65) for current employees (years)
Male 22.90 22.80 N/A N/A
Female 25.40 25.40 N/A N/A
At 30 June 2015, the weighted-average duration of the defined benefit obligation was 13 years for Pension Scheme (2014: 13 years) and 5 years for Gold State Superannuation Scheme (2014: 6 years).
The Pension Scheme and the pre-transfer benefit for the GSS expose the Authority to actuarial risks, such as salary risk, longevity risk and interest rate risk. The sensitivity analyses below have been determined based on reasonably possible changes of the respective assumptions occurring at the end of the reporting period, holding all other assumptions constant.
Defined Benefit Obligation
Pension Scheme
Pre-transferbenefit - Gold State
Superannuation Scheme
2015 2014 2015 2014
Increase Decrease Increase Decrease
$000 $000 $000 $000
Discount rate (1% movement) (620) 767 (27) 29
Future salary growth (1% movement) N/A N/A 27 (25)
Pension increases (1% movement) 762 (628) N/A N/A
Future longevity (1 year movement) 267 (225) N/A N/A
Employer funding arrangements for the defined benefit plans The Pension Scheme and the pre-transfer benefit for the GSS in respect of individual plan participants are settled by the Authority on their retirement. Funding requirements are based on invoices provided to the Authority by GESB that represent the cost of benefits paid to members during the reporting period.
Employer contributions of $292k (2014: $286k) are expected to be paid to the Pension Scheme for the subsequent annual reporting period.
Employer contributions of $309k (2014: $304k) are expected to be paid to the Gold State Superannuation Scheme for the subsequent annual reporting period.

131 | Annual Report 2014/15
Movements in other provisionsMovements in each class of provisions during the reporting period, other than employee benefits, are set out below.
2015 2014
$000 $000
Employers' Indemnity Supplementation Fund
Liability for estimated future claim payments
Carrying amount at start of period 21,274 16,724
Additional increase/(decrease) in provisions recognised (2,945) 5,041
Unwinding of the discount 467 412
Payments/other sacrifices of economic benefits (794) (903)
Carrying amount at end of period 18,002 21,274
Uninsured claims
Carrying amount at start of period 10,225 8,074
Additional increase in provisions recognised (912) 2,264
Unwinding of the discount 247 201
Payments/other sacrifices of economic benefits (488) (314)
Carrying amount at end of period 9,072 10,225
Employment on-costs provision
Carrying amount at start of period 197 191
Additional provisions recognised 91 94
Unwinding of the discount 5 5
Payments/other sacrifices of economic benefits (93) (93)
Carrying amount at end of period 200 197
Uninsured Workers
Part of the General Account's obligations are for the provision of workers' compensation benefits to injured employees whose current or former employer has failed to maintain compulsory workers' compensation insurance or if the former employer no longer exists and can not be found and therefore the insurer is unknown.
The actuarial assessed valuation includes both asbestos related diseases (ARD) and non-asbestos related diseases (non-ARD). The approach adopted is to analyse the claim and financial data for the General Account and make projections of future claim payments based on actuarial assumptions, knowledge and experience of similar portfolios.
(ARD) Actuarial methods and assumptionsAs most of the asbestos-related disease liability is for future lodgement of latent claims, projected future claim notifications are combined with average claim sizes and the assumed payment patterns 'to produce':
(a) total projected cost of claims for each future year;(b) claim payments; and(c) gross and net provisions.
The future lodgement patterns are calibrated to closely follow recent claim experience and the future patterns use the research of Professor Berry (University of Sydney) combined with actuarial's research and examination of the reports of the Institute of Actuaries of Australia Asbestos Taskforce and the independent advice to the James Hardie Special Commission of Inquiry.
Average weighted term to settlement
The average term to settlement is calculated separately by class of business based on historic payment patterns.
Future claim lodgements
Future claim lodgements are calculated from the recent lodgement experience and calibrated according to the relevant research studies on latency claims.
Average claim size
Average claim size is based on current actuarial research taking the WA mining experience into account.
(e)

132
Section 7: Financial Statements & Notes | WorkCover WA Annual Report 2014/15
Expense rate
Claims handling expenses are based on the current arrangements in place with ICWA for claims management of the General Account.
Discount rates
Discount rates are derived as the one-year forward rates implied by the Commonwealth Government yield curve as at the balance date.
Inflation rates
Economic inflation assumptions have been set by reference to current economic indicators.
Superimposed inflation
Superimposed inflation being the real increase after adjusting for normal inflation, usually due to non-economic effects e.g. changes in legislation, court settlement precedents. The superimposed inflation rates assumed considered both the portfolio's own real cost increases and industry superimposed inflation trends.
In addition to the above assumptions the following allowances have been made for the Act changes promulgated on 1 October 2011.
The following increases in the average claim size for the removal of age limits:
• 8% increase for claimants aged under 65 year olds; and
• 40% increase for claimants aged over 65. This has decreased from 15% for claimants under 65 and 75% for claimants over 65. It has been adjusted for the portion of the claims experience after the 2011 Amendment Act was implemented which already implicitly allows for the Act change.
• 70% of ARD claims will be lodged as common law claims, with an average claim size 406% greater than the statutory average claim size.
• 2.6% increase in the ARD average claim size to allow for common law claims made by employed contractors. This has reduced from 4.97% last year as the average includes a proportion of experience after the 2011 Amendment Act.
• 13% increase in the number of claims lodged due to behavioural change and the availability of common law access for the General Account. This has reduced from 22% last year as the average includes a proportion of experience after the 2011 Amendment Act.
Assumptions
Uninsured workers: Asbestos-Related Claims (ARD) 2015 2014
Inflation Rate 3.75% for 2016 and later 4.50% for 2015 and later
Discount Rate 2016 2.00% 2015 2.50%
2017 2.00% 2016 2.60%
2018 2.20% 2017 3.00%
2019 2.60% 2018 3.40%
2020 3.10% 2019 3.70%
2021 3.60% 2020 4.00%
2022 3.80% 2021 4.20%
2023 3.90% 2022 4.30%
2024 4.00% 2023 4.40%
2025 4.10% 2024 4.50%
2026 4.20% 2025 4.60%
2027 4.30% 2026 4.70%
2028 4.30% 2027 4.80%
2029 4.40% 2028 4.90%
2030 4.40% 2029 5.00%
2031 Onwards 4.50% 2030 Onwards 5.00%
Claims Managements Expenses 10.5% for claim payments 10.5% for claim payments
Superimposed Inflation 2.50% 2.00%
Risk Margin 20.4% risk margin at the 75% sufficiency level
20.4% risk margin at the 75% sufficiency level
(Non-ARD) Actuarial methods and assumptionsClaims estimates for the workers' compensation business are derived from an analysis of several different actuarial models. Ultimate number of claims incurred are projected based on past reporting patterns. Payments experience is analysed based on average paid per claim incurred, average paid per claim finalised, projected case estimates and Bornheutter Ferguson. Historic case estimates development is also used to form a model of future payments. The resulting projected payments from these models are analysed along with benchmarks foraverage claim size and ratio to case estimates and other statistics, in order to determine the final estimate of outstanding claims.
Claims inflation is built into the resulting projected payments, to allow for both general economic inflation and superimposed inflation detected in the modelling of payment experience. Superimposed inflation arises from non-economic factors such as developments of legal precedent and changes in claimant behaviour.
Projected payments are discounted to allow for the time value of money.

133 | Annual Report 2014/15
Expense rate
Claims handling expenses were calculated by analysis of General Account actual expenses from the Statement of Comprehensive Income over the last 12 months.
Discount rates
Discount rates are derived as the one-year forward rates implied by the Commonwealth Government yield curve as at the balance date.
Inflation rates
Economic inflation assumptions have been set by reference to current economic indicators.
Superimposed inflation
Superimposed inflation being the real increase after adjusting for normal inflation, usually due to non-economic effects e.g. changes in legislation, court settlement precedents. The superimposed inflation rates assumed considered both the portfolio's own real cost increases and industry superimposed inflation trends.
Sufficiency Margin
The inherent uncertainty in the estimated claim liability means that there is a range of possible outcomes. An analysis of the variation of the expected results lead to adoption of a 30% co-efficient of variation and the lognormal distribution. This distribution is then used to calculate the risk margin required to increase the level of sufficiency of the central estimate from 50% to 75%.
In addition to the above assumptions we have included the following prospective allowances for claims incurred from 1 October 2011 due to the 2011 Amendment Act:
• 0.73% increase in the non-ARD average claim size for the removal of age limits. This has decreased from 1.81% last year as the adopted assumptions are usually based on five years of data and three years are after the 2011 Amendment Act so include this allowance implictly;
• 5% of non-ARD claims will be lodged as common law claims, with an average claim size $0.6 million in 30 June 2015 values. This year we have applied to 5% only to claims lodged in the past year or future claims reported. A claimant has to elect to pursue common law damages or apply for an extension within 12 months of a claim being lodged. Therefore no claims lodged prior to 30 June 2014 are eligible to pursue common law damages anymore. This is the same method as last year. The average claim size from the December 2011 report is indexed by three year’s wage inflation and superimposed inflation; and
• 0% allowance for common law claims made by employed contractors as it is assumed to be fully allowed for in the experience.
Average weighted term to settlement
The average term to settlement is calculated separately by class of business based on historic payment patterns.
Future claim reports (IBNR)
Future claim reports are analysed using the ratio of late reported claims to reported claims over future development periods.
Average claim size
Average claim size is a benchmark being the outcome of the accident year blend of actuarial methods described above.
Assumptions
Uninsured workers: Non Asbestos-Related Claims (Non-ARD) 2015 2014
Inflation Rate 3.75% for 2016 and later 4.50% for 2015 and later
Discount Rate 2016 2.00% 2015 2.50%
2017 2.00% 2016 2.60%
2018 2.20% 2017 3.00%
2019 2.60% 2018 3.40%
2020 3.10% 2019 3.70%
2021 3.60% 2020 4.00%
2022 3.80% 2021 4.20%
2023 3.90% 2022 4.30%
2024 4.00% 2023 4.40%
2025 4.10% 2024 4.50%
2026 4.20% 2025 4.60%
2027 4.30% 2026 4.70%
2028 4.30% 2027 4.80%
2029 4.40% 2028 4.90%
2030 4.40% 2029 5.00%
2031 Onwards 4.50% 2030 Onwards 5.00%
Claims Managements Expenses 10.5% for claim payments 10.5% for claim payments
Superimposed Inflation 2.5% for PPCI and PPCF methods
2.5% for PPCI and PPCF methods
Risk Margin 16.76% risk margin at the 75% sufficiency level
16.76% risk margin at the 75% sufficiency level

134
Section 7: Financial Statements & Notes | WorkCover WA Annual Report 2014/15
28. EquityThe Western Australian Government holds the equity interest in the Authority on behalf of the community.Equity represents the residual interest in the net assets of the Authority. The asset revaluation surplus represents that portion of equity resulting from the revaluation of non-current assets.
2015 2014
$000 $000
ReservesAsset revaluation surplus
Balance at start of period 20,165 19,975
Net revaluation increments/(decrements):
Land (300) (800)
Buildings (2,365) 990
Balance at end of period 17,500 20,165
Retained earningsBalance at start of period 57,697 50,800
Result for the period 17,519 6,897
Balance at end of period 75,216 57,697
Total equity at end of period 92,716 77,862
29. Notes to the Statement of Cash FlowsReconciliation of cashCash at the end of the reporting period as shown in the Statement of Cash Flows is reconciled to the related items in the Statement of Financial Position as follows:
2015 2014
$000 $000
Cash and cash equivalents 9,704 8,917
Restricted cash and cash equivalents (note 19 'Restricted cash and cash equivalents') 82,678 72,607
92,382 81,524
Reconciliation of profit after income tax equivalent to net cash flows provided by/(used in) operating activitiesProfit after income tax equivalents 17,924 7,164
Non-cash items:
Depreciation and amortisation expense 1,058 884
Net (gain)/loss on sale of property, plant and equipment 12 30
Remeasurements of defined benefit liability (405) (267)
Decrease/(increase) in assets:
Current receivables 184 (143)
Increase/(decrease) in liabilities:
Current payables (a) 375 49
Current provisions 615 937
Non-current provisions (4,706) 5,992
Net GST receipts/(payments) (b) (32) (10)
Change in GST receivables/(payables) (c) - -
Net cash provided by operating activities 15,025 14,636
(a) Note that the Australian Taxation Office (ATO) receivable/payable in respect of GST and the receivable/payable in respect of the sale/purchase of non-current assets are not included in these items as they do not form part of the reconciling items.
(b) This is the net GST paid/received, i.e. cash transactions.(c) This reverses out the GST in receivables and payables.
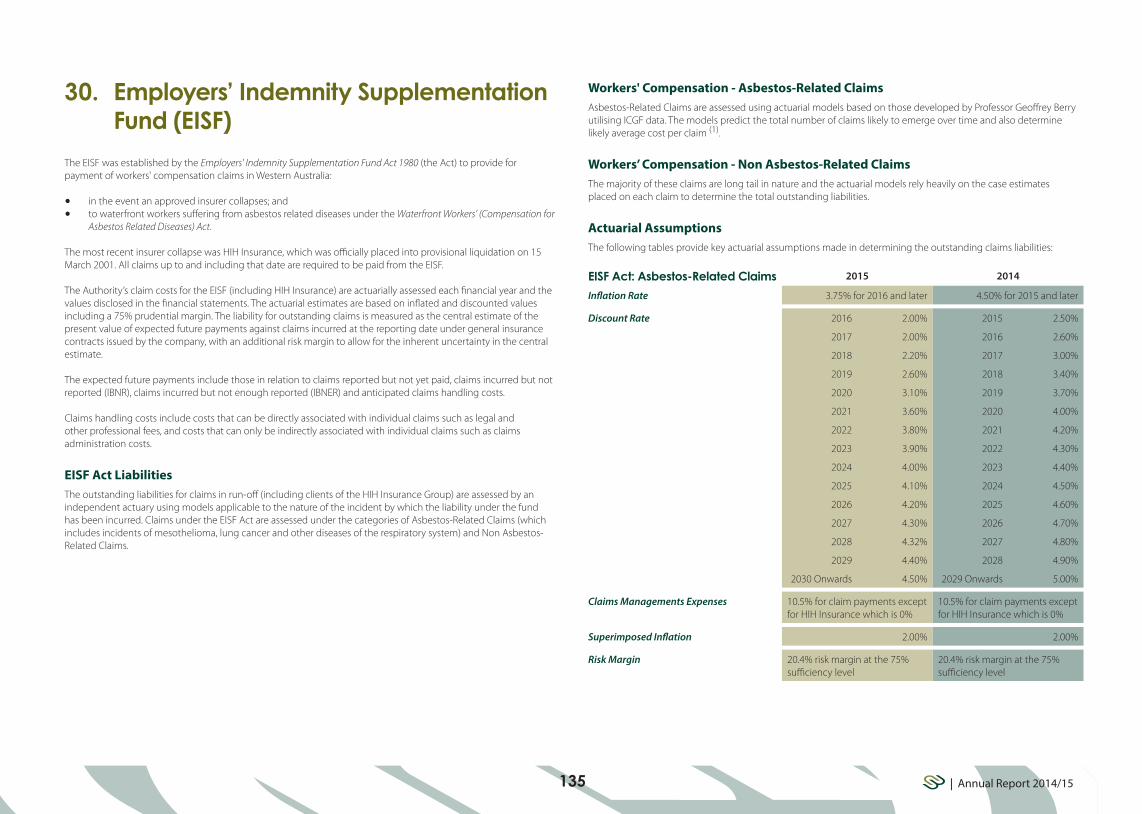
135 | Annual Report 2014/15
30. Employers’ Indemnity Supplementation Fund (EISF)
The EISF was established by the Employers' Indemnity Supplementation Fund Act 1980 (the Act) to provide for payment of workers' compensation claims in Western Australia:
• in the event an approved insurer collapses; and• to waterfront workers suffering from asbestos related diseases under the Waterfront Workers’ (Compensation for
Asbestos Related Diseases) Act.
The most recent insurer collapse was HIH Insurance, which was officially placed into provisional liquidation on 15 March 2001. All claims up to and including that date are required to be paid from the EISF.
The Authority’s claim costs for the EISF (including HIH Insurance) are actuarially assessed each financial year and the values disclosed in the financial statements. The actuarial estimates are based on inflated and discounted values including a 75% prudential margin. The liability for outstanding claims is measured as the central estimate of the present value of expected future payments against claims incurred at the reporting date under general insurance contracts issued by the company, with an additional risk margin to allow for the inherent uncertainty in the central estimate.
The expected future payments include those in relation to claims reported but not yet paid, claims incurred but not reported (IBNR), claims incurred but not enough reported (IBNER) and anticipated claims handling costs.
Claims handling costs include costs that can be directly associated with individual claims such as legal and other professional fees, and costs that can only be indirectly associated with individual claims such as claims administration costs.
EISF Act LiabilitiesThe outstanding liabilities for claims in run-off (including clients of the HIH Insurance Group) are assessed by an independent actuary using models applicable to the nature of the incident by which the liability under the fund has been incurred. Claims under the EISF Act are assessed under the categories of Asbestos-Related Claims (which includes incidents of mesothelioma, lung cancer and other diseases of the respiratory system) and Non Asbestos-Related Claims.
EISF Act: Asbestos-Related Claims 2015 2014
Inflation Rate 3.75% for 2016 and later 4.50% for 2015 and later
Discount Rate 2016 2.00% 2015 2.50%
2017 2.00% 2016 2.60%
2018 2.20% 2017 3.00%
2019 2.60% 2018 3.40%
2020 3.10% 2019 3.70%
2021 3.60% 2020 4.00%
2022 3.80% 2021 4.20%
2023 3.90% 2022 4.30%
2024 4.00% 2023 4.40%
2025 4.10% 2024 4.50%
2026 4.20% 2025 4.60%
2027 4.30% 2026 4.70%
2028 4.32% 2027 4.80%
2029 4.40% 2028 4.90%
2030 Onwards 4.50% 2029 Onwards 5.00%
Claims Managements Expenses 10.5% for claim payments except for HIH Insurance which is 0%
10.5% for claim payments except for HIH Insurance which is 0%
Superimposed Inflation 2.00% 2.00%
Risk Margin 20.4% risk margin at the 75% sufficiency level
20.4% risk margin at the 75% sufficiency level
Workers' Compensation - Asbestos-Related ClaimsAsbestos-Related Claims are assessed using actuarial models based on those developed by Professor Geoffrey Berry utilising ICGF data. The models predict the total number of claims likely to emerge over time and also determine likely average cost per claim (1).
Workers’ Compensation - Non Asbestos-Related ClaimsThe majority of these claims are long tail in nature and the actuarial models rely heavily on the case estimates placed on each claim to determine the total outstanding liabilities.
Actuarial AssumptionsThe following tables provide key actuarial assumptions made in determining the outstanding claims liabilities:

136
Section 7: Financial Statements & Notes | WorkCover WA Annual Report 2014/15
EISF Act: Non Asbestos- Related Claims 2015 2014
Inflation Rate 3.75% for 2016 and later 4.50% for 2015 and later
Discount Rate 2016 2.00% 2015 2.50%
2017 2.00% 2016 2.60%
2018 2.20% 2017 3.00%
2019 2.60% 2018 3.40%
2020 3.10% 2019 3.70%
2021 3.60% 2020 4.00%
2022 3.80% 2021 4.20%
2023 3.90% 2022 4.30%
2024 4.00% 2023 4.40%
2025 4.10% 2024 4.50%
2026 4.20% 2025 4.60%
2027 4.30% 2026 4.70%
2028 4.30% 2027 4.80%
2029 4.40% 2028 4.90%
2030 Onwards 4.50% 2029 Onwards 5.00%
Claims Managements Expenses 10.5% for claim payments except for HIH Insurance which is 0%
10.5% for claim payments except for HIH Insurance which is 0%
Superimposed Inflation 2.00% 2.00%
Risk Margin 16.76% risk margin at the 75% sufficiency level
16.76% risk margin at the 75% sufficiency level
(1) Prediction of mesothelioma, lung cancer, and asbestosis in former Wittenoom asbestos workers, British Journal of Industrial Medicine; 48 793-802.
The EISF non-ARD valuation no longer includes an explicit allowance for the 2011 Amendment Act. This is because the average claim size uses an average of 2014 and 2015 lodgement years. The removal of age limits is assumed to be fully incorporated into the experience therefore no explicit allowance is required. Last year there was an increase of 37% in the average claim size to allow for the removal of age limits resulting from the 2011 Amendment Act.
The actuarial estimates from June 2001 are as follows: Year $’000
2001 122,312
2002 49,923
2003 31,717
2004 24,090
2005 23,421
2006 17,239
2007 15,883
2008 16,647
2009 29,419
2010 23,866
2011 20,871
2012 18,526
2013 16,724
2014 21,274
2015 18,002
The actuarial estimates from 2001 to 2005 provide for current known asbestos related claims.
From 2005 the actuarial assessment makes allowance for current known asbestos related claims and for claims incurred but not reported claims. Prior to 2007 the estimates did not include provision for Non-HIH liabilities.
In accordance with Accounting Standard AASB 1023 General Insurance Contracts the outstanding claims liability at 30 June 2015 was assessed at $18.002 million and a provision for this amount has been included in the financial statements (see note 27).
The actuary's assessment of outstanding claims liability does not recognise that money may be recovered from HIH's liquidator.
For the purpose of addressing the outstanding claims liability, a surcharge was imposed on employers' insurance policies on previous years. From the 25 June 2008 the surcharge was discontinued. The revenue collected previously from the surcharge will be used to pay this liability.
The following increases in the average claim size for the removal of age limits as detailed:• 8% increase for claimants aged under 65 year olds; and• 40% increase for claimants aged over 65.
This has decreased from 15% for claimants under 65 and 75% for claimants over 65 as it has been adjusted for the portion of the claims experience that is after the 2011 Amendment Act was implemented so already implicitly allows for the Act change.

137 | Annual Report 2014/15
31. Commitments 2015 2014
$000 $000
Other expenditure commitmentsOther expenditure commitments including consultants and contracts for service at the end of the reporting periodbut not recognised as liabilities, are payable as follows:
Within 1 year 523 175
523 175
32. Contingent liabilities and contingent assets2015 2014
$000 $000
Contingent LiabilitiesAt 30 June 2015 there was a ongoing common law workers compensation claim in progress relating to a negligent employer whose insurer declined indemnity. The Act provides for the WorkCover WA General Account to meet the cost of any payment due to the worker if the liable employer cannot pay. Whilst a final settlement value is unknown, WorkCover WA's insurance excess liability has been provided for in the uninsured claims provision.
- -
- -
Contingent AssetsThere were no contingent assets in existence at 30 June 2015 and up to the date of this report.
- -
- -
33. Events occurring after the end of the reporting period
There were no known events occurring after the end of the reporting period and up to the date of this report.
Interest revenueThe variance reflects higher interest earned from a larger cash investment base due to budget savings and recoveries from HIH liquidation.
Other revenueThe variance is mainly due to higher than expected recoveries from uninsured claims, as well as fines and penalties issued to businesses for failing to have adequate workers' compensation insurance. Other revenue also includes unbudgeted registration monies for the Injury Management Conference 2015.
Employers' Indemnity Supplementation FundThe variance represents unbudgeted recoveries received from the administrator of HIH.
Employee benefits expensesThe variance mainly reflects a number of vacant positions that remained unfilled at various stages throughout the year.
2015 2015
Actual Estimate Variance
$000 $000 $000
Income
Interest revenue 2,763 2,512 251
Other revenue 1,104 571 533
Employers' Indemnity Supplementation Fund 9,496 - 9,496
Expenses
Employee benefits expenses 13,959 15,079 (1,120)
Claims expense 1,263 1,800 (537)
Other expenses 1,285 1,623 (338)
34. Explanatory statementSignificant variations between estimates and actual results for income and expense as presented in the financial statement titled 'Statement of Comprehensive Income' are shown below. Significant variations are considered to be those greater than10% and $200,000.
Significant variances between estimate and actual for 2015

138
Section 7: Financial Statements & Notes | WorkCover WA Annual Report 2014/15
Claims expenseThe variance is due to lower than expected claims received during the year, combined with a decrease in the actuarially assessed claims liability in the Uninsured and Employer's Indemnity Supplementation Fund.
Other expensesThe variance is primarily due to lower cost injury management initiatives, including the injury management conference and GP educational programs as well as a reduction in employment oncosts.
Significant variances between actual results for 2014 and 20152015 2014 Variance
$000 $000 $000
Income
Interest revenue 2,763 2,427 336
Other revenue 1,104 780 324
Employers' Indemnity Supplementation Fund 9,496 10,005 (509)
Decrease in claims liability 4,425 - 4,425
Expenses
Supplies and services 3,315 2,908 407
Claims expense 1,263 7,840 (6,577)
Other expenses 1,285 1,486 (201)
Interest revenueThe variance reflects higher interest earned from a larger cash investment base due to budget savings and recoveries from HIH liquidation.
Other revenueThe variance is mainly due to higher than expected recoveries from uninsured claims, as well as fines and penalties issued to businesses for failing to have adequate workers' compensation insurance. Other revenue also includes unbudgeted registration monies for the Injury Management Conference 2015.
Employers' Indemnity Supplementation FundThe decrease reflects a slight decline in recoveries received from the administrators of HIH in 2014/15 financial year.
Decrease in claims liabilityThe variance is due to lower than expected claims received during the year, combined with a decrease in the actuarially assessed claims liability in the Employer's Indemnity Supplementation Fund.
Supplies & servicesThe increase is primarily due to an increase in disputed workers compensation claims, resulting in additional costs associated with sessional arbitrators.
Claims expenseThe variance is due to lower than expected claims received during the year, combined with a decrease in the actuarially assessed claims liability in the Uninsured and Employer's Indemnity Supplementation Fund.
Other expensesThe variance is primarily due to lower cost injury management initiatives, including the injury management conference and GP educational programs as well as a reduction in employment oncosts.

139 | Annual Report 2014/15
2015 2014
$000 $000
Financial Assets
Cash and cash equivalents 9,704 8,917
Restricted cash 82,678 72,607
Receivables (i) 999 1,183
Held-to-maturity investments 13,424 9,908
Financial Liabilities
Payables 1,238 863
(i) The amount of receivables excludes GST recoverable from the ATO (statutory receivable).
(b) Categories of financial instruments
The carrying amounts of each of the following categories of financial assets and financial liabilities at the end of the reporting period are:
35. Financial instruments
(a) Financial risk management objectives and policies
Financial instruments held by the Authority are cash and cash equivalents, restricted cash and cash equivalents, receivables, held-to-maturity investments and payables. The Authority has limited exposure to financial risks. The Authority’s overall risk management program focuses on managing the risks identified below.
Credit riskCredit risk arises when there is the possibility of the Authority’s receivables defaulting on their contractual obligations resulting in financial loss to the Authority. The maximum exposure to credit risk at the end of the reporting period in relation to each class of recognised financial assets is the gross carrying amount of those assets inclusive of any provisions for impairment as shown in the table at note 35(c) ‘Financial instruments disclosures’ and note 20 ‘Receivables’.
The Authority has policies in place to ensure that services are provided to customers with an appropriate credit history. In addition, receivable balances are monitored on an ongoing basis with the result that the Authority’s exposure to bad debts is minimal. At the end of the reporting period there were no significant concentrations of credit risk.
Liquidity riskLiquidity risk arises when the Authority is unable to meet its financial obligations as they fall due. The Authority is exposed to liquidity risk through its trading in the normal course of business. The Authority has appropriate procedures to manage cash flows by monitoring forecast cash flows to ensure that sufficient funds are available to meet its commitments.
Market riskMarket risk is the risk that changes in market prices such as foreign exchange rates and interest rates will affect the Authority’s income or the value of its holdings of financial instruments. The Authority does not trade in foreign currency and is not materially exposed to other price risks. Other than as detailed in the interest rate sensitivity analysis table at note 35(c), the Authority is not exposed to any further interest rate risk. The Authority's exposure to market risk for changes in interest rates relates primarily to the cash at bank and term deposit holdings.

140
Section 7: Financial Statements & Notes | WorkCover WA Annual Report 2014/15
(c) Financial instrument disclosures
Credit riskThe following table discloses the Authority’s maximum exposure to credit risk, interest rate exposures and the ageing analysis of financial assets. The Authority’s maximum exposure to credit risk at the end of the reporting period is the carrying amount of financial assets as shown below. The table discloses the ageing of financial assets that are past due but not impaired and impaired financial assets. The table is based on information provided to senior management of the Authority.
The Authority does not hold any collateral as security or other credit enhancement relating to the financial assets it holds.
Aged analysis of financial assets
2015 Carrying AmountNot past due and
not impaired
Past Due But Not Impaired Impaired Financial AssetsUp To 1 Month 1 to 3 Months 3 to 6 Months 6 to 12 Months More than 1 Year
Financial Assets $000 $000 $000 $000 $000 $000 $000 $000
Cash and cash equivalents 9,704 9,704 - - - - - -
Restricted cash 82,678 82,678 - - - - - -
Receivables (a) 999 786 - 12 53 - 148 -
Other financial assets 13,424 13,424 - - - - - -
106,805 106,592 - 12 53 - 148 -
2014Financial Assets
Cash and cash equivalents 8,917 8,917 - - - - - -
Restricted cash 72,607 72,607 - - - - - -
Receivables (a) 1,183 818 50 125 12 100 78 -
Other financial assets 9,908 9,908 - - - - - -
92,615 92,250 50 125 12 100 78 -
(a) The amount of Receivables excludes GST recoverable from the ATO (statutory receivable).
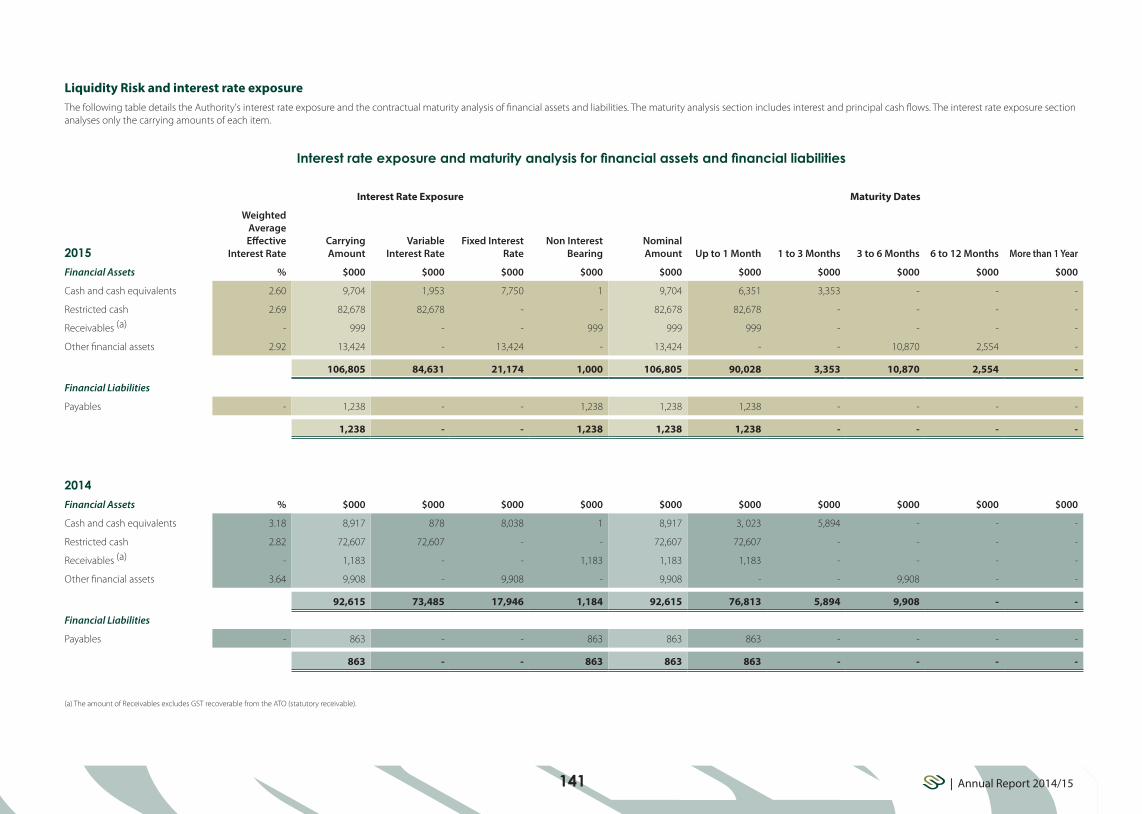
141 | Annual Report 2014/15
Liquidity Risk and interest rate exposureThe following table details the Authority's interest rate exposure and the contractual maturity analysis of financial assets and liabilities. The maturity analysis section includes interest and principal cash flows. The interest rate exposure section analyses only the carrying amounts of each item.
Interest rate exposure and maturity analysis for financial assets and financial liabilities
Interest Rate Exposure Maturity Dates
2015
Weighted Average Effective
Interest RateCarrying Amount
Variable Interest Rate
Fixed Interest Rate
Non Interest Bearing
Nominal Amount Up to 1 Month 1 to 3 Months 3 to 6 Months 6 to 12 Months More than 1 Year
Financial Assets % $000 $000 $000 $000 $000 $000 $000 $000 $000 $000
Cash and cash equivalents 2.60 9,704 1,953 7,750 1 9,704 6,351 3,353 - - -
Restricted cash 2.69 82,678 82,678 - - 82,678 82,678 - - - -
Receivables (a) - 999 - - 999 999 999 - - - -
Other financial assets 2.92 13,424 - 13,424 - 13,424 - - 10,870 2,554 -
106,805 84,631 21,174 1,000 106,805 90,028 3,353 10,870 2,554 -
Financial Liabilities
Payables - 1,238 - - 1,238 1,238 1,238 - - - -
1,238 - - 1,238 1,238 1,238 - - - -
2014Financial Assets % $000 $000 $000 $000 $000 $000 $000 $000 $000 $000
Cash and cash equivalents 3.18 8,917 878 8,038 1 8,917 3, 023 5,894 - - -
Restricted cash 2.82 72,607 72,607 - - 72,607 72,607 - - - -
Receivables (a) - 1,183 - - 1,183 1,183 1,183 - - - -
Other financial assets 3.64 9,908 - 9,908 - 9,908 - - 9,908 - -
92,615 73,485 17,946 1,184 92,615 76,813 5,894 9,908 - -
Financial Liabilities
Payables - 863 - - 863 863 863 - - - -
863 - - 863 863 863 - - - -
(a) The amount of Receivables excludes GST recoverable from the ATO (statutory receivable).

142
Section 7: Financial Statements & Notes | WorkCover WA Annual Report 2014/15
Interest rate sensitivity analysisThe following table represents a summary of the interest rate sensitivity of the Authority's financial assets and liabilities at the end of the reporting period on the surplus for the period and equity for a 1% change in interest rates. It is assumed that the change in interest rates is held constant throughout the reporting period.
Carrying amount -100 basis points +100 basis points
2015 Surplus Equity Surplus Equity
Financial Assets $000 $000 $000 $000 $000
Cash and cash equivalents 1,953 (19) (19) 19 19
Restricted cash and cash equivalents 82,678 (826) (826) 826 826
Total Increase/(Decrease) (845) (845) 845 845
Carrying amount -100 basis points +100 basis points
2014 Surplus Equity Surplus Equity
Financial Assets $000 $000 $000 $000 $000
Cash and cash equivalents 878 (8) (8) 8 8
Restricted cash and cash equivalents 72,607 (726) (726) 726 726
Total Increase/(Decrease) (734) (734) 734 734
Fair valueAll financial assets and liabilities recognised in the Statement of Financial Position, whether they are carried at cost or fair value, are recognised at amounts that represent a reasonable approximation of fair value unless otherwise stated in the applicable notes.

143 | Annual Report 2014/15
36. Remuneration of members of the accountable authority and senior officers
Remuneration of members of the accountable authorityThe number of members of the Accountable Authority, whose total of fees, salaries, superannuation, non-monetary benefits and other benefits for the financial year, fall within the following bands are:
2015 2014
$
0 - 10,000 2 2
10,001 - 20,000 3 3
30,001 - 40,000 1 1
$000 $000
Base remuneration and superannuation 83 86
The total remuneration of members of the accountable authority 83 86
The total remuneration includes the superannuation expense incurred by the Authority in respect of members of the accountable authority.
No members of the Accountable Authority are members of the Pension Scheme.
Remuneration of senior officersThe number of senior officers, other than senior officers reported as members of the Accountable Authority, whose total fees, salaries, superannuation, non-monetary benefits and other benefits for the financial year, fall within the following bands are:
2015 2014
$
10,001 - 20,000 1 -
20,001 - 30,000 1 -
50,001 - 60,000 1 -
60,001 - 70,000 1 -
70,001 - 80,000 - 1
80,001 - 90,000 - 1
100,001 - 110,000 1 2
160,001 - 170,000 1 -
170,001 - 180,000 1 2
180,001 - 190,000 1 -
190,001 - 200,000 1 -
240,001 - 250,000 - 1
$000 $000
Base remuneration and superannuation 1,038 951
Annual leave and long service leave accruals (80) 6
Other benefits - 7
The total remuneration of senior officers 958 964
(a) Five senior officers resided in these remuneration bands due to part-year occupancy and total remuneration being below $160,000.
The superannuation included here represents the superannuation expense incurred by the Authority in respect of senior officers other than senior officers reported as members of the accountable authority.
No senior officers are members of the Pension Scheme.
(a)
144
Section 7: Financial Statements & Notes | WorkCover WA Annual Report 2014/15
37. Remuneration of auditorRemuneration payable to the Auditor General for the reporting period is as follows:
2015 2014
$000 $000
Auditing the accounts, controls, financial statements and key performance indicators 83 82
83 82
38. Workers’ Compensation & Injury Management Trust Account
The purpose of the Trust Fund is to hold funds paid into the custody of the Authority pursuant to Section 110 of the Workers' Compensation and Injury Management Act 1981 . These funds are not consolidated as they are funds that are administered on behalf of dependants of deceased workers.
Income
Amounts paid to the custody of the Authority 266 281
Interest on investments 25 33
291 314
Expenditure
Payments by the Authority 366 299
Administration fee 9 12
375 311
Surplus/(Deficit) (84) 3
Balance July 1 1,086 1,083
Balance June 30 1,002 1,086
Balance of funds held represents:
Cash and cash equivalents 1,002 1,086
1,002 1,086
39. Supplementary financial informationPotential Claims Recoveries Written OffIn relation to the General Account, WorkCover WA may have a statutory obligation to pay a workers' compensation claim. For uninsured claims where the employer has not maintained a workers' compensation insurance policy, or the employer is not able to be identified or located or an employer is in breach of the insurance contract, WorkCover WA seeks to recover the costs of the claims from the employer.
Potential recoveries receivable are assessed with regard to the ability of the debtors to meet their obligation. These recoveries have not been recognised as income because the amount to be recovered could not be reliably measured and consequently the write-off of these debts have not been charged as an expense in the Statement of Comprehensive Income.
The General Account Uninsured debt write-offs outlined below are net of recoveries received from employers.
In accordance with Section 48(2) of the Financial Management Act 2006, potential recoveries were written off from the following fund:
2015 2014
$000 $000
Write-Offs
General account uninsured claims 138 33
Fines and penalties 48 19
186 52
Number of individual recovery write-offs with values between:
$ 0 - 100,000 4 7
$ 100,001 - 150,000 1 -
Losses Through Theft, Defaults And Other Causes
Losses of public money and public and other property through theft, default and other causes
- -
Amount recovered - -
- -

145 | Annual Report 2014/15
40. Related bodiesThe Authority does not have related bodies.
41. Affiliated bodiesThe Authority does not have affiliated bodies.
42. Indian Ocean TerritoriesThe Commonwealth Government has a Service Delivery Arrangement with the Authority for the provision of services to Indian Ocean Territories (Christmas Island and Cocos-Keeling Island).
2015 2014
$000 $000
Opening balance (2) -
Funding received from the Commonwealth 16 -
Revenue received from insurers 13 10
27 10
Payments by Program Area
Regulatory Services 4 4
Conciliation and Arbitration Services 5 5
Legislation and Scheme Information 3 3
Total Payments 12 12
Balance carried forward 15 (2)
146
Section 7: Financial Statements & Notes | WorkCover WA Annual Report 2014/15
43. Schedule of income and expenses by serviceScheme
RegulationScheme Services
Grand Total
2015 2014 2015 2014 2015 2014
Income $000 $000 $000 $000 $000 $000
Insurer contributions 10,086 10,075 11,405 11,434 21,491 21,509
Interest revenue 1,297 1,137 1,466 1,290 2,763 2,427
Other revenue 518 365 586 415 1,104 780
Employers' Indemnity Supplementation Fund 4,457 4,687 5,039 5,318 9,496 10,005
Decrease in claims liability 2,077 - 2,348 - 4,425 -
Total Income 18,435 16,264 20,844 18,457 39,279 34,721
Expenses
Employee benefits expense 6,551 6,582 7,408 7,470 13,959 14,052
Supplies and services 1,556 1,362 1,759 1,546 3,315 2,908
Depreciation and amortisation expense 497 414 561 470 1,058 884
Accommodation expenses 317 275 357 312 674 587
Claims expense 593 3,672 670 4,168 1,263 7,840
Loss on disposal of non current assets 6 14 6 16 12 30
Other expenses 603 696 682 790 1,285 1,486
Total Expenses 10,123 13,015 11,443 14,772 21,566 27,787
Profit before grants and subsidies from State Government 8,312 3,249 9,401 3,685 17,713 6,934
Services received free of charges 99 108 112 122 211 230
Profit for the period 8,411 3,357 9,513 3,807 17,924 7,164

147 | Annual Report 2014/15
about this reportabout this report
workcover.wa.gov.au
about this report