
Announcements, financial operations or both? Generalizing central banks’ FX reaction functions
28
Announcements, financial operations or both? Generalizing central banks’ FX reaction functions Oscar Bernal a, * , Jean-Yves Gnabo b a DULBEA, Université Libre de Bruxelles, 50 Av. F. D. Roosevelt, 1050 Bruxelles, Belgium b Louvain School of Management - Namur Campus, Rempart de la Vierge 8, Belgium article info Article history: Received 26 January 2007 Revised 13 August 2009 Available online 22 September 2009 JEL classification: E58 F31 G15 Keywords: Central banks Foreign exchange market Interventions Communication policy abstract Bernal, Oscar, and Gnabo, Jean-Yves—Announcements, financial operations or both? Generalizing central banks’ FX reaction functions This paper generalizes the reaction functions of central banks’ FX interventions to include oral interventions alongside actual ones. Using Japanese data for the 1991–2004 period, we estimate an ordered-probit model explaining the occurrence of each type of intervention and evaluating the extent to which oral and actual interventions are substitutes or complements. In addition, the effectiveness of interventions is examined using an event-study approach. Our results indicate that the Japanese authorities tended to adopt progressively stronger measures as the exchange rate was found to behave in an increasingly unfavorable way. This suggests that words and deeds were only coordinated (i.e. used in a comple- mentary way) in extreme cases. Overall, interventions are found to be moderately successful in correcting unwanted exchange-rate developments, especially volatility. J. Japanese Int. Economies xxx (xx) (2009) xxx–xxx. DULBEA, Université Libre de Bruxelles, 50 Av. F. D. Roosevelt, 1050 Bruxelles, Belgium; Louvain School of Management - Namur Campus, Rempart de la Vierge 8, Belgium. Ó 2009 Elsevier Inc. All rights reserved. 1. Introduction The Japanese authorities have so far limited themselves to verbal [oral] intervention, with Vice-Finance Minis- ter Koji Tanami warning overnight that Japan will take appropriate measures in the event of drastic cur- rency market fluctuations. But traders said the Bank of Japan would have to spend money intervening to convince the market that Japan was resolute about halting the yen’s rally (Reuters, January 11, 1999). 0889-1583/$ - see front matter Ó 2009 Elsevier Inc. All rights reserved. doi:10.1016/j.jjie.2009.09.001 * Corresponding author. E-mail addresses: [email protected] (O. Bernal), [email protected] (J.-Y. Gnabo). J. Japanese Int. Economies 23 (2009) 367–394 Contents lists available at ScienceDirect Journal of The Japanese and International Economies journal homepage: www.elsevier.com/locate/jjie
-
Upload
oscar-bernal -
Category
Documents
-
view
212 -
download
0
Transcript of Announcements, financial operations or both? Generalizing central banks’ FX reaction functions

J. Japanese Int. Economies 23 (2009) 367–394
Contents lists available at ScienceDirect
Journal of The Japanese andInternational Economies
journal homepage: www.elsevier .com/locate/ j j ie
Announcements, financial operations or both? Generalizingcentral banks’ FX reaction functions
Oscar Bernal a,*, Jean-Yves Gnabo b
a DULBEA, Université Libre de Bruxelles, 50 Av. F. D. Roosevelt, 1050 Bruxelles, Belgiumb Louvain School of Management - Namur Campus, Rempart de la Vierge 8, Belgium
a r t i c l e i n f o a b s t r a c t
Article history:Received 26 January 2007Revised 13 August 2009Available online 22 September 2009
JEL classification:E58F31G15
Keywords:Central banksForeign exchange marketInterventionsCommunication policy
0889-1583/$ - see front matter � 2009 Elsevier Indoi:10.1016/j.jjie.2009.09.001
* Corresponding author.E-mail addresses: [email protected] (O. Bernal)
Bernal, Oscar, and Gnabo, Jean-Yves—Announcements, financialoperations or both? Generalizing central banks’ FX reaction functions
This paper generalizes the reaction functions of central banks’ FXinterventions to include oral interventions alongside actual ones.Using Japanese data for the 1991–2004 period, we estimate anordered-probit model explaining the occurrence of each type ofintervention and evaluating the extent to which oral and actualinterventions are substitutes or complements. In addition, theeffectiveness of interventions is examined using an event-studyapproach. Our results indicate that the Japanese authorities tendedto adopt progressively stronger measures as the exchange rate wasfound to behave in an increasingly unfavorable way. This suggeststhat words and deeds were only coordinated (i.e. used in a comple-mentary way) in extreme cases. Overall, interventions are found tobe moderately successful in correcting unwanted exchange-ratedevelopments, especially volatility. J. Japanese Int. Economies xxx(xx) (2009) xxx–xxx. DULBEA, Université Libre de Bruxelles, 50Av. F. D. Roosevelt, 1050 Bruxelles, Belgium; Louvain School ofManagement - Namur Campus, Rempart de la Vierge 8, Belgium.
� 2009 Elsevier Inc. All rights reserved.
1. Introduction
The Japanese authorities have so far limited themselves to verbal [oral] intervention, with Vice-Finance Minis-ter Koji Tanami warning overnight that Japan will take appropriate measures in the event of drastic cur-rency market fluctuations. But traders said the Bank of Japan would have to spend money intervening toconvince the market that Japan was resolute about halting the yen’s rally (Reuters, January 11, 1999).
c. All rights reserved.
, [email protected] (J.-Y. Gnabo).

368 O. Bernal, J.-Y. Gnabo / J. Japanese Int. Economies 23 (2009) 367–394
Although all monetary authorities intervene in the foreign exchange (FX) market in order toinfluence exchange rates, different types of intervention can be distinguished. Actual interventionsinvolve financial transactions (i.e. currency sales or purchases) whereas oral interventions do not(i.e. they are simply oral announcements). While evidence from the major economies (the UnitedStates, the Eurozone and Japan) indicates a clear shift toward fewer actual interventions, oral inter-ventions continue to be frequently used. Understanding why one type of intervention is usedrather than another is an important issue. Researchers have mainly concentrated on actual inter-ventions largely focusing on their determinants and effects for various countries and periods(Dominguez and Frankel, 1993; Almekinders and Eijffinger, 1996; Dominguez, 1998; Beine et al.,2002; Ito and Yabu, 2007 among many others). It is only recently that researchers have becomeinterested in the authorities’ communications policy and particularly in the role played by oralinterventions as substitutes for or complements to actual interventions (see Beine et al., 2009;Fratzscher, 2008a).
This paper aims to identify useful factors to facilitate our understanding of why each type ofintervention occurs. We propose to analyze the FX intervention topography in the light of thesignaling theory (Mussa, 1981), which assumes that actual and oral interventions share the abilityto influence market agents’ expectations by conveying central banks’ private information.According to Dominguez (1998), it is the nature of interventions (i.e. their signal ‘‘strength”)that determines their effect on the exchange-rate dynamics. We thus need to classify interventionsaccording to the strength of the signal they convey. As secret interventions (i.e. actualinterventions not contemporaneously detected by the market) do not carry an explicit or visiblesignal, they cannot be distinguished from private trades (Evans, 2001). Secret-intervention dayscan thus hardly be differentiated from non-intervention days. By contrast, interventions that areperceived by market participants naturally convey a strong and explicit signal that must beassessed. In this regard, as the total cost supported by the authorities depends on the typeof operation carried out, we assume that the cost associated with the different types ofvisible intervention is an indicator of the signal strength. In other words, we infer that theauthorities’ determination to correct a bad exchange-rate dynamics is given by the cost of theirintervention.
To understand the occurrence of different types of intervention, we estimate an extendedintervention reaction function on traditional determinants (i.e. the deviations of the exchange ratefrom a particular target, the exchange-rate volatility, and the general environment of the econ-omy). We use an ordered probit specification, which is convenient for modeling ordered variablesand obtaining threshold estimates determining the levels of imbalance leading to the use ofincreasingly strong interventions. These thresholds also determine whether oral interventions playthe role of substitute for or complement to actual interventions. Furthermore, given that inter-ventions are used by central banks in an attempt to regulate exchange rates, a natural extensionis to determine whether interventions (secret or not) are an effective policy at all. Therefore, in afinal step, we propose to explore this question using an event-study approach over different timehorizons.
The paper is organized as follows: The theoretical discussion of the different types of interventionand the way they have been studied in the literature is presented in Section 2. A discussion of thetransmission channels of sterilized interventions and the methods used to classify interventionsaccording to the strength of the signal they convey is contained in Section 3. The econometric modeland the data are described in Section 4, while our empirical results are discussed in Section 5. The ef-fects of the different policies on exchange rates are discussed in an extension in Section 6. Section 7contains our conclusions.
2. Interventions on the foreign-exchange (FX) markets
According to Dominguez and Frankel (1993), an intervention can be broadly defined as ‘‘any trans-action or announcement by an official agent of a government that is intended to influence the value of anexchange rate”. Countries intervene in the FX market when they perceive that the exchange-rate

Fig. 1. Several types of intervention can be distinguished according to whether they involve financial transactions. Oralinterventions are speeches or communications by officials and do not involve any transaction. Actual interventions are currencysales or purchases. Confirmed interventions are actual interventions accompanied by a confirming or clarifying announcement.
O. Bernal, J.-Y. Gnabo / J. Japanese Int. Economies 23 (2009) 367–394 369
dynamics are not consistent with their objectives.1 That is, they intervene when the exchange-rate levelis not satisfactory, or when its volatility is excessive (for a recent review of central banks’ interventionpractices, see Neely, 2008).
Different types of intervention can be distinguished by using Dominguez and Frankel (1993)’s def-inition. Actual interventions (AIs) involve central-bank transactions (i.e. currency sales or purchases)designed to influence the exchange-rate dynamics appropriately. These are generally leaning-against-the-wind operations, that is, operations that try to reverse the exchange-rate trend. Anothertype of intervention is an oral intervention (OI). This type of announcement does not involve any cur-rency transaction. Oral interventions are official speeches or communications that are intended toinfluence the exchange rate by providing the market with explicit relevant (private) information. Athird type of intervention is a confirmed intervention (CI). This is an actual intervention accompaniedby an announcement either confirming its occurrence or clarifying its purpose. Using this definition,the topography of FX interventions can be represented by three subsets corresponding to the threekinds of intervention. This is illustrated in Fig. 1. The literature on interventions has generally focusedon the study of the determinants and effects of actual interventions. The results suggest that largedeviations of the exchange rate from its past values and the fundamental-equilibrium level cause cor-rective measures. Furthermore, the leaning-against-the-wind strategy has been generally confirmed(Dominguez and Frankel, 1993; Almekinders and Eijffinger, 1996; Baillie and Osterberg, 1997; Sarnoand Taylor, 2001; Ito, 2003; Ito and Yabu, 2007; Bernal, 2006). The role of exchange-rate volatility as adeterminant of actual interventions is less clear, although recent advances in the way it is measuredmay improve the situation (Andersen et al., 2007; Beine et al., 2006; Gnabo et al., 2009). In particular,Gnabo et al., 2009 show that more interventions are expected by market participants when some com-ponents of the realized volatility increase. Empirical research on the effect of actual interventions onthe exchange-rate level usually indicates that these interventions are effective over short periods(Dominguez, 2006; Fatum and Hutchinson, 2004, 2006). Furthermore, their impact on the volatilitygreatly depends on the market’s overall situation (Bonser-Neal and Tanner, 1996; Dominguez, 1998,2003; Beine and Laurent, 2003; Beine et al., 2002, 2003; Gnabo and Teiletche, 2009).
Interest in the authorities’ communication policy and more precisely in oral interventions, is ratherrecent. Its roots lie in the shift of the policies of the major economies (i.e. the United States, the Euroz-one and to a certain extent Japan) toward the use of this type of intervention and the abandonment ofactual interventions. Having not conducted any actual interventions since 1995, the United Statesintervened once in 2000, and has not entered the market since. In Europe, the authorities have onlyactually intervened on four occasions since the introduction of the euro in 1999. Japan is rather differ-ent as it maintained a policy of frequent actual interventions until March 2004, culminating in some
1 In some countries specific political authorities (e.g. the Treasury in the United States, the Ministry of Finance in Japan and theEuropean Council in the Eurozone) are in charge of FX policy. Central banks conduct their monetary policy independently. Theyonly implement intervention transaction orders in the FX market. In this paper, for the sake of clarity, we neglect the interactionsbetween the different parties to the intervention process (for a discussion see Bernal, 2006). We consider a single agent (i.e. thecentral bank) to be responsible for the process.
370 O. Bernal, J.-Y. Gnabo / J. Japanese Int. Economies 23 (2009) 367–394
massive interventions.2 However, it has not intervened since that time, and now seems to be followingthe path of the United States and the Eurozone (an updated analysis of the Japanese case is presented byIto, 2006).
The role of oral interventions as a substitute for or complement to actual ones is a crucial issue thathas been addressed by several researchers. Fratzscher (2008a,b) has shown that oral interventions aregood substitutes for actual operations. He shows that oral interventions can influence exchange rates,without raising the market’s uncertainty, independently of the general stance of the monetary policyand the occurrence of actual interventions.3 However, in his analysis of the determinants of oral andactual interventions, Fratzscher (2005) indicates that, in practice, the two types of intervention tendto be coordinated domestically. This suggests that they are used during the same periods and indicatesthe ability of the authorities to switch rapidly from one type of measure to the other, depending on themarket conditions. On the other hand, Beine et al. (2009) found that oral interventions clarify the signalconveyed by actual interventions. These authors highlight the complementary relationship betweenthese types of economic-policy measure. More generally, Gnabo and Teiletche (2009) analyzed the im-pact on market expectations of a large set of intervention strategies and confirmed the virtuous effectof transparent measures (i.e. oral, actual and confirmed interventions) compared to opaque ones (i.e. se-cret interventions). In addition, these transparent operations appear to be most effective when theinvolvement of the authorities is high. Therefore, while it is clear that several corrective policies areavailable to the authorities, they cannot be considered as perfectly substitutable.
Interestingly, to the best of our knowledge, no holistic study has been conducted to explore whatfactors induce the authorities to use one type of intervention rather than another (Fratzscher, 2005considers separate logit specifications, one for oral and one for actual interventions, to identify theirdeterminants). Furthermore, no rationale has been provided for the shift in intervention strategy ob-served in major economies. To address these questions appropriately, it is important to understandhow interventions work. We examine this point below, with a particular focus on the signaling-chan-nel theory.
3. The transmission of interventions
3.1. The signaling approach to interventions
The way interventions influence exchange rates has been widely debated. Oral interventions influ-ence exchange rates solely through the signaling channel (Mussa, 1981). Actual interventions may alsoimpact the market through the signaling channel (as long as they are not secret), but they may alsooperate through the portfolio-balance channel (see Edison, 1993; Dominguez and Frankel, 1993; Sarnoand Taylor, 2001; Neely, 2008 for surveys).4
The portfolio-balance approach assumes that financial transactions operated by monetary author-ities affect the proportion of foreign and domestic assets in the market. If they are not perfect substi-tutes, the exchange rate adapts to encourage agents to purchase the set of assets whose proportion isincreasing. On the other hand, the signaling framework describes how the exchange rate can be reg-ulated by the disclosure of the central bank’s private information. In addition to information abouttheir own future monetary and exchange-rate policies, central banks usually have privileged accessto information on general macroeconomic developments.5 This information can be ‘‘signaled” to themarket through interventions to induce traders to reshape their beliefs (e.g. a sale of domestic currency
2 Note that according to Beine and Lecourt (2004) and Beine and Bernal (2007), about 80% of the actual interventions conductedby Japan between 2003 and 2004 were secret. That is, these transactions were not contemporaneously detected by marketparticipants at the time, reducing, therefore, their signaling impact.
3 Note that Jansen and de Haan (2005, 2007) have studied oral interventions made alone and have established that theireffectiveness is limited.
4 Other theories have also been developed to explain how interventions affect exchange rates. These include the noise-tradingchannel (Hung, 1997) and, more recently, the coordination channel (Reitz and Taylor, 2006). However, the portfolio-balance theoryand the signaling channel are still the most popular approaches.
5 Strictly speaking, Mussa (1981)’s signaling-channel theory holds that interventions ‘‘signal” future changes in monetary policy.However, most authors consider that interventions provide general information about economic fundamentals.

Table 1The theoretical impact of interventions in an efficient market.
Level Volatility
Credible and unambiguous signal ½DSt jIt � < 0 var½DSt jIt � < 0Not credible or ambiguous signal ½DSt jIt �P 0 var½DSt jIt � > 0
Note: The impact of an intervention ðIÞ designed to appreciate the domestic currency or to calm disorderly markets on theexchange-rate level (DSt jIt , where St is the domestic price of the foreign currency) or volatility (var½DSt jIt �) depends on thecredibility and unambiguity of the signal conveyed by the intervention. The clearer and more credible the signal, the morevirtuous the impact on exchange rates.
O. Bernal, J.-Y. Gnabo / J. Japanese Int. Economies 23 (2009) 367–394 371
may indicate that it is overvalued; if the signal is clear and credible, it might change the agent’s tradingbehavior, which in turn will help to depreciate the currency).
Empirical evidence massively supports the idea that the signaling channel is the most importanttheory explaining how interventions work (see Edison, 1993; Dominguez and Frankel, 1993; Sarnoand Taylor, 2001 for surveys). This might be explained by the fact that the magnitude of interventionsis relatively small with respect to the market’s overall size. Recent findings of the microstructure ap-proach to exchange rates indicate, however, that there is room for an effect through the portfolio-bal-ance channel (Evans, 2001). Nevertheless, as the different types of intervention share the ability toprovide the market with relevant official information, it is worth examining in more detail the signal-ing framework.
As Dominguez (1998) pointed out, the potential impact of a given intervention on the exchange-rate level or volatility is influenced by the degree of market efficiency and by the credibility and unam-biguity (i.e. clarity) of the operation. For efficient markets, this is illustrated in Table 1. It denotes anactual intervention designed to appreciate the domestic currency or to calm disorderly markets; St
is the exchange-rate level (domestic price of foreign currency); DSt jIt is the change in the exchangerate due to the intervention; and var½DSt jIt � captures the exchange-rate volatility. It is clear that, aslong as the signal conveyed by the intervention is credible and unambiguous it can move the exchangerate in the desired direction or reduce the market’s volatility. On the other hand, if the signal is notsufficiently credible or is ambiguous, it may have counterproductive effects.6
The concept of transparency developed in the monetary policy literature can help us to understandthe mechanism described in the previous paragraph. ‘‘Transparency” synthesizes the two notions ofunambiguity and credibility. It usually refers to the absence of information asymmetry between mon-etary policymakers and the private sector (Geraats, 2002). According to this, improving the degree oftransparency requires the disclosure of private information by the authorities from time to time. How-ever, transmitting a large amount of information is not sufficient to be truly transparent, as this extrainformation will allow agents to make better-informed decisions only insofar as they understand itcorrectly. Winkler (2000) argues that transparency should be seen as a multi-dimensional conceptin which qualitative aspects of the information such as the degree of ‘‘clarity” and ‘‘honesty” of the pol-icy play an important role. That is, the authorities’ measures will be transparent only if they are clearlyperceived and understood by the market (they are unambiguous) and are honest (in the sense that thedeclared objectives are consistent with those actually pursued which means that they are credible).
Dominguez (1998)’s approach may be extended to different types of intervention. Table 1 showsthat, for given market conditions, the degree of credibility and unambiguity are key factors determin-ing the ‘‘strength” of the signal conveyed by an intervention. More generally, these factors also influ-ence the effectiveness of the regulation policies adopted by central banks.7 However, the degree ofcredibility and unambiguity may not be the same for different types of intervention. Hence, they donot all carry the same signal strength. Extending Dominguez (1998)’s framework requires that an assess-ment be made of the strength of the signal conveyed by interventions.
This task is obvious for secret interventions. According to the signaling approach, no distinction interms of the signal sent can be made between days on which secret interventions were conducted and
6 Dominguez (1998) shows that, in inefficient markets, even if the signal is credible and clear, an appropriate impact on theexchange-rate level cannot be guaranteed. However, the market’s volatility will always be increased.
7 Since they are directly derived from a standard forward-looking exchange-rate model with very few assumptions, themechanisms presented in Table 1 are robust and can safely be trusted (see Dominguez, 1998 for details).

372 O. Bernal, J.-Y. Gnabo / J. Japanese Int. Economies 23 (2009) 367–394
days on which no interventions took place. This is supported by the microstructure approach to FXinterventions. In particular, Lyons (2001) and Evans (2001) have shown that the secrecy of order flowsallows an intervention to be indistinguishable from private trades. This is because the authoritiesdeliberately lose the signaling impact of their operations by concealing them. Therefore, despite theirinvolvement in financial trades, secret interventions provide a non-explicit signal.
In comparison with secret interventions, oral, actual and confirmed interventions provide strongerand more explicit signals. In this study, we assume that the strength of these explicit signals can becaptured by the authorities’ determination and credibility when attempting to correct a bad ex-change-rate dynamic. As the cost is not the same for different types of intervention, we use this cri-terion to measure the strength of the signal.8 That is, the greater the cost the authorities havedecided to bear, the greater their determination and credibility, and the stronger the signal of their vis-ible intervention. Below we discuss how the auxiliary information on the total cost of interventions canbe used to assess the strength of the explicit signal conveyed by these interventions.
3.2. The costs of interventions and their signal strength
As discussed above, oral, actual and confirmed interventions provide the market with explicit signals.We assess these by referring to their total cost. Several types of cost can be considered. Almekinders(1995) evokes purely bureaucratic costs (BC), which refer to the loss of flexibility in the regulation policydue to the time and bargaining required to decide on and implement an intervention. This cost may begreater for actual and confirmed interventions than for oral ones. In countries in which specific politicalauthorities order central banks to implement intervention transactions (e.g. the United States, theEurozone and Japan), several agents are involved (the political authorities and the central bank as a min-imum). A minimum of costly coordination is required in order to ensure the efficiency of the interven-tions (see Bernal, 2006 for details).9 Speeches associated with confirmed interventions clarify theauthorities’ policy objectives, and may also require a certain degree of coordination between the agents in-volved in the intervention process. On the other hand, oral interventions are directly decided and con-ducted by the responsible authorities alone, and coordination is less necessary as long as theannouncement is sufficiently vague (i.e. it only provides general orientations and not precise targets,as discussed in Stein, 1989’s cheap-talk approach).10 Financial costs (FC) should also be considered. Theyoccur when operations in the FX market do not move the exchange rate in the desired direction. The cen-tral bank would then hold an open position (i.e. if the currency purchases were not followed by an actualcurrency appreciation, the central bank would experience losses, and the reverse for currency sales).Obviously, these costs are only relevant for interventions involving currency transactions.
Finally, there is the authorities’ overall reputation cost (RC). When interventions are implemented,authorities signal to the market their desire to correct an unsatisfactory exchange-rate situation to themarket. If the intervention fails to correct the exchange-rate dynamics, market participants and for-eign counterparts become aware of the authorities’ inability to correct the situation. The authorities’reputation, and more generally their ability to implement efficient exchange-rate policies, is thenweakened by the failure. In practice, oral interventions rarely indicate precise targets. The sign andmagnitude of actual interventions, when these are later clearly perceived by the market, provide moreaccurate information per se on the authorities’ objectives than do vague announcements. Actual inter-ventions therefore carry a higher reputation cost than oral interventions.11 This view is reinforced bythe fact that statements can be made by isolated policymakers, whereas actual interventions are neces-
8 As we will see, a measure of unambiguity is not necessary to our purpose.9 As expressed by Peter Fisher (Executive Vice-President of the New York Fed in 1998) for the United States (Japan is
institutionally similar): ‘‘The decision to intervene is not one that is made in 60 s. It is a consensus process of getting the [. . .] FederalReserve, [. . .] Treasury officials [and] our counterparts in a foreign country in agreement” (Dow Jones, July 30, 1998). Note that ifinterventions are conducted on several days in a row, the bureaucratic cost associated with subsequent interventions may be lowerthan for the first operation because official approval has already been granted (Ito and Yabu, 2007).
10 Evidence obtained from the Factiva database (http://www.factiva.com) clearly indicates that major central banks only revealtheir precise target in very rare circumstances.
11 If an oral intervention consisted of announcing a precise exchange-rate target, the reputation cost might actually be larger thanfor actual interventions, as the central bank’s loss would become clear to all market participants.

Table 2Interventions classified according to their cost.
Bureaucratic cost ðBCÞ Financial cost ðFCÞ Reputation cost ðRCÞ
Oral intervention ðOIÞ BCOI > 0 – RCOI > 0Actual intervention ðAIÞ BCAI > BCOI FCAI > 0 RCAI > RCOI
Confirmed intervention ðCIÞ BCCI P BCAI FCCI ¼ FCAI RCCI > RCAI
Note: Oral interventions ðOIÞ are associated to the weakest cost, actual interventions ðAIÞ carry an intermediate cost whileconfirmed interventions ðCIÞ carry the highest cost. The cost criterion is used to classify visible interventions signal strength.
O. Bernal, J.-Y. Gnabo / J. Japanese Int. Economies 23 (2009) 367–394 373
sarily the outcome of a political process and definitely reflect the official point of view.12 Furthermore, assome interventions are wrongly reported, some doubt over whether or not a signal was actually sent tothe market remains, even when a news report announces an intervention (see Gnabo et al., 2009). Thisunderlying uncertainty can be removed by confirmation or clarifying speeches. The resulting confirmedintervention then carries a higher reputation cost than an actual intervention.
Table 2 summarizes the theoretical costs associated with the different types of intervention. Thetotal costs are assumed to provide additional information on the strength of the intervention signal.On this basis, the weakest, intermediate and strongest explicit signals are associated with oral, actualand confirmed interventions respectively.
Two important remarks should be made at this point. First, secret interventions also have costs.However, they cannot be distinguished from private trades, and so they only provide a non-explicitsignal. Within the signaling channel framework, days on which secret interventions occur are identicalto days on which no interventions occur. Second, our classification does not incorporate the magni-tude of interventions. While this question is clearly interesting, in practice, numerous problemsemerge. The financial press does not systematically report the size of intervention operations, becausecentral banks rarely favor fully transparent implementation methods.13 Discriminating between inter-ventions on the basis of their size therefore requires data on the market perception of the amount, whichis difficult to obtain, particularly because agents may have conflicting views about the amounts invested.Ad hoc (and thus questionable) techniques for aggregating the different points of view would be needed.For these reasons, we decided not to explore the magnitude of interventions, and to leave this point forfuture research. Based on previous elements, the classification of the different types of intervention stud-ied here is illustrated in Fig. 2.
It may be proposed that cost is a rich but incomplete criterion. It clearly reflects the overall cred-ibility of the policy, as it increases with the cost the authorities decide to sustain. However, the unam-biguity of the signal is not explicitly captured. Our response is that the classification presented in Fig. 2would not be jeopardized if a measure of the unambiguity of interventions were incorporated.
In theory, oral interventions could be made even more precise by providing an explicit target. Asystematic analysis of news reports shows that policymakers are very reluctant to make precise state-ments about their target, as this might give an exchange-rate-level target for speculators to challenge(Chiu, 2003).14 Therefore, market participants can learn from oral interventions whether the domesticcurrency is overvalued or undervalued, but not much more.15 The sign and magnitude of actualinterventions (when they are perceived) may provide a better estimate of the authorities’ objectives. Ac-tual interventions may thus be seen as providing a stronger signal than oral interventions (or at leastan equivalent signal should the amount invested not be clearly perceived by the market). The confir-mation speech accompanying a confirmed intervention obviously provides a clearer signal than eitheroral or actual interventions, as the motivation for the actual intervention is further explained by theofficials themselves. Therefore, this type of intervention carries the strongest signal. Using this reason-
12 During the 1990s, the communication policy of Japan was sometimes discordant. While some officials claimed a depreciationof the currency, others (especially the governor of the Bank of Japan) privileged the status quo.
13 An example of a transparent method of conducting interventions is given by the Electronic Broking System (EBS), in which theexact amount invested is immediately observable by the public.
14 For example a Japanese Ministry of Finance official, Kuroda, announced on November the 1st 1999: ‘‘Yen rise excessive, doesn’treflect fundamentals” (Dow Jones) without clarifying further what he considered an ideal level to be.
15 This phenomenon is well documented in the literature on monetary policy, which talks of ‘‘monetary mystique” (Goodfriend,1986; Rosa and Verga, 2005).

Fig. 2. Confirmed interventions are associated to the strongest explicit signal while oral interventions carry the weakest one.Actual interventions provide an intermediate explicit signal strength. Secret interventions only carry a non-explicit signal andcannot be distinguished from days in which no interventions were conducted.
374 O. Bernal, J.-Y. Gnabo / J. Japanese Int. Economies 23 (2009) 367–394
ing, the location of oral, actual and confirmed interventions in our classification can be determinedusing only the cost criterion. That is, a measure of unambiguity would not change the way interven-tions are classified.
4. Empirical approach
4.1. Econometric model for an extended reaction function
Traditional reaction functions are designed to explain when actual interventions occur. They aregenerally derived from a standard loss-minimization program (see Almekinders and Eijffinger,1996; Ito and Yabu, 2007; Kearns and Rigobon, 2005; Bernal, 2006). Within such a framework, inter-ventions occur because of the losses caused by inadequate exchange-rate levels, excessive volatility ora bad economic environment. Eq. (1) can be seen as a generic reaction function. I�t denotes the optimalinterventions and Xt ; Zt and Wt are vectors of variables capturing changes in the exchange-rate leveland volatility and the economic environment respectively. �t �Nð0;1Þ is a random error term.
16 Asintervenmay beindepensignal).Overall,general
I�t ¼ f ðb1Xt; b2Zt ; b3WtÞ þ �t ð1Þ
In this paper we propose an extended reaction function. It incorporates the different types of inter-vention described above and provides some clues to understanding their occurrence. From the theo-retical discussion above, we know that interventions can be classified in a discrete way according tothe strength of the signal they convey. Furthermore, Eq. (1) can be seen as a model for a latent variable(a shadow intervention). The actual structure of the intervention process may then be appropriately de-scribed by an ordered-probit model (McKelvey and Zavoina, 1975). In such models, the dependent var-iable’s different outcomes correspond to the different types of intervention. Eq. (2) represents such aspecification.
It ¼ 0 I�t 6 H1
It ¼ 1 H1 < I�t 6 H2
It ¼ 2 H2 < I�t 6 H3
It ¼ 3 H3 < I�t
8>>><>>>:
ð2Þ
Outcome 0 denotes secret and no interventions (i.e. no explicit signal), whereas, 1, 2 and 3 corre-spond to oral, actual and confirmed interventions, respectively (i.e. explicit signals).16 H ¼ ðH1H2H3Þ0
is an unknown parameter jointly estimated with b ¼ ðb1b2b3Þ0, which indicates the thresholds causing It
to take the various outcome values (i.e. the thresholds that have to be attained by I�t in order for It toequal 0, 1, 2 or 3). That is, H represents imbalances in terms of Xt ; Zt and Wt , which induce sufficientlylarge losses to cause corrective measures to be taken.
discussed in the previous sections, the signaling theory does not allow making a clear distinction between secrettions and no interventions. However, from an empirical point of view, assimilating secret interventions to no interventionsmisleading. Therefore, in an attempt to address this issue, we incorporated secret interventions (no explicit signal) as andent outcome between the no intervention outcome (no signal) and the oral intervention outcome (the weakest explicitChanging the structure of the reaction function did not alter our main results and only two variables were slightly affected.this suggests that considering secret interventions and no interventions as a single outcome does not lead to a loss of
ity along the lines of the signaling channel framework.

O. Bernal, J.-Y. Gnabo / J. Japanese Int. Economies 23 (2009) 367–394 375
The non-linear econometric model given by Eqs. (1) and (2) is estimated by maximum likelihoodtechniques.17 The interpretation of b is not trivial. For instance, b1 > 0 indicates that Xt positively (resp.negatively) influences the probability of the final (resp. first) outcome occurring. The impact of Xt on theintermediate outcomes cannot be presumed a priori. Specific marginal effects have to be computed.These reflect the change in the probability of occurrence of the different types of intervention inducedby a marginal change in the regressors. According to Wooldridge (2002), these marginal effects are com-puted using Eqs. (3), where / is the standard normal-distribution density function.
17 For18 The
circumvconstanconditio
19 Seetransac
20 For
@PðIt ¼ 0jXtÞ@Xt
¼ �b1/ðH1 � Xtb1 � Ztb2 �Wtb3Þ
@PðIt ¼ 1jXtÞ@Xt
¼ b1 /ðH1 � Xtb1 � Ztb2 �Wtb3Þ � /ðH2 � Xtb1 � Ztb2 �Wtb3Þ½ �
@PðIt ¼ 2jXtÞ@Xt
¼ b1½/ðH2 � Xtb1 � Ztb2 �Wtb3Þ � /ðH3 � Xtb1 � Ztb2 �Wtb3Þ�
@PðIt ¼ 3jXtÞ@Xt
¼ b1/ðH3 � Xtb1 � Ztb2 �Wtb3Þ
ð3Þ
The value of H cannot be interpreted per se. It is however necessary that H1 < H2 < H3 for theprobabilities estimated from the model to be positive.18 As long as H1 < I�t < H2 oral interventionsare likely to be used (i.e. the loss caused to the central bank by Xt ; Zt and Wt is not sufficient to justifystronger measures). If H2 < I�t < H3 actual interventions would be preferred (i.e. the loss is large enoughfor the central bank to involve its own assets). Finally, if H3 < I�t , confirmed interventions may be under-taken (i.e. the loss induced by the bad exchange-rate dynamics is so substantial that very strong correc-tive measures are required giving rise to the simultaneous use of actual interventions andannouncements to enhance the efficiency of the intervention).
To see whether or not the classification imposed by H is meaningful, we tested the hypothesis thatadjacent thresholds are indistinguishable. We used the z-ratio test for a linear combination of coeffi-cients, as given by Eq. (4) where j ¼ 1; 2; 3.
zj;j�1 ¼Hj �Hj�1ffiffiffiffiffiffiffiffiffiffiffiffiffiffiffiffiffiffiffiffiffiffiffiffiffiffiffiffiffiffiffiffiffiffiffiffiffiffiffiffiffiffiffiffiffiffiffi
r̂2Hjþ r̂2
Hj�1� 2r̂HjHj�1
q ð4Þ
Under the null hypothesis that the two adjacent thresholds are equal, the zj;j�1 statistic follows anormal distribution. The critical value at the 5% significance level is 1.96 (see Greene, 2000 for details).
4.2. The data
4.2.1. Measure of interventionsThe dependent variable in the ordered-probit model (It in Eq. (2)) was built using data on the Jap-
anese experience on the YEN/US$ market from April 1991 to September 2004. The Japanese case isparticularly interesting because of the huge variability in both the frequency and intensity of theirinterventions (for a detailed description see Ito, 2003, 2006). Building the dependent variable requireddata to be obtained on the different types of intervention. Official data on Japanese actual interven-tions is publicly available on the Japanese Ministry of Finance website.19 However, this data is aggre-gated in the sense that it does not indicate which interventions were secret and which were not. Nor isdata for oral and confirmed interventions available on a systematic basis. We therefore collected theinformation we needed to build the series from the Factiva online database.20
a technical discussion see Maddala (1983), Greene (2000) or Wooldridge (2002).re is a well-known identification problem with ordered probit models (see Verbeek, 2000 for an intuitive description). Toent this it is usual to fix the value of one of the parameters (this does not affect the probabilities). In this study, we fixed thet at zero. This allowed us to estimate an unconstrained H. An alternative would have been to fix H1 ¼ 0. In that case, then H1 < H2 < H3 would be rewritten as 0 < H2 < H3.http://www.mof.go.jp/english/e1c021.htm. This website gives precise dates of interventions, currencies involved and
tion amounts.details see http://www.factiva.com.

376 O. Bernal, J.-Y. Gnabo / J. Japanese Int. Economies 23 (2009) 367–394
For every day of the period of interest on which no actual intervention occurred (according to officialsources), we searched for the existence of any official announcement indicating that the authorities werenot comfortable with the exchange-rate level or volatility. News reports obtained in this way were usedto identify days on which oral interventions took place. Table 3 contains some examples of news reportsof this kind. To identify confirmed interventions, the procedure consisted of searching, for each day onwhich actual interventions were conducted, for official speeches confirming or commenting on the day’sintervention. Table 4 contains some news reports of this type. Finally, we used the method proposed byBeine and Lecourt (2004) to identify secret interventions. For each official intervention day, we looked fornews reports indicating that the market was aware of the transaction. If no such news reports could befound, the intervention was considered secret (for examples of news reports indicating that the marketknew that an intervention was taking place see Beine and Bernal, 2007).
One important caveat for the approach described above concerns whether all the relevant informa-tion circulating through the market is contained in news reports. Should this not be the case, our mea-sure of actual and secret interventions (i.e. those reported and not reported on the newswires) wouldbe inaccurate. With the disclosure of official information on the interventions of central banks (in 2001for Japan), many studies pointed out the inaccuracy of news reports (Frenkel et al., 2004). Researchersnoted in particular that several interventions were wrongly reported by major newspapers, whilesome operations the market was aware of were not reported (Beine and Lecourt, 2004).
Most of these criticisms, however, concerned newspapers which suffer from particular constraintssuch as a strict limit on the number of pages and a specific timing. Working with newswires allowsmost of these limitations to be overcome. Newswires provide a continuous flow of information, withcritical news often reported in headlines. As emphasized by Oberlechner and Hocking (2004), news-wires constitute the main source of information for traders and bankers. Furthermore, several authorshave begun to rely on this source of information in recent years to depict the market’s perceptions ofinterventions (Beine and Lecourt, 2004; Dominguez and Panthaki, 2007; Fratzscher, 2008b). Havinggathered the data, our dependent variable was built as a categorical variable with four outcomes asillustrated in Table 5.
4.2.2. Independent variables4.2.2.1. Exchange-rate level. The authorities intervene when the exchange-rate level moves away fromtheir target. More generally, interventions are often designed as leaning-against-the-wind operations.These are operations undertaken to fight an inappropriate trend in the exchange rate. The difficulty isto determine the time horizon over which this trend should be defined. To cope with this issue, empir-ical papers (Almekinders and Eijffinger, 1996; Ito, 2003; Ito and Yabu, 2007; Frenkel et al., 2004) haveconsidered movements of the exchange rate over the short-, mid- and long-term as explanatory vari-ables when predicting the occurrence of interventions. In this paper, we adopt the same approach byconsidering the absolute deviation of the current exchange rate from the previous trading day’s rate
ðX1t ¼ 100� jst � st�1jÞ, the 21-trading-day moving average X2t ¼ 100� st � 121
P21i¼1st�i
������
� �and the
Table 3Examples of news reports used to identify oral interventions.
Date Source Newswire
June 9, 1997 Dow Jones Japan MoF Vice Minister Kato: ‘‘excessive forex volatility undesirable”October 9, 1998 Dow Jones Sakakibara: ‘‘Dlr-Yen excessive volatility undesirable”May 21, 1999 Dow Jones Japan Sakakibara: ‘‘Forex volatility undesirable”June 21, 1999 Dow Jones ‘‘An excessively strong yen is bad for both the Japanese and overseas economies”.
Vice-Finance Minister Koji Tanami said on MondaySeptember 2, 2003 Dow Jones ‘‘No real reason for the yen to strengthen at present”, a Japanese Ministry of
Finance official saidDecember 9, 2003 Dow Jones ‘‘Yen’s latest surge against the dollar is out of step with economic fundamentals”,
Japanese Finance Minister said
Note: These news reports indicate that the Japanese authorities were not comfortable with the exchange-rate level or volatility.Therefore, they are used to build the variable indicating the occurrence of oral interventions.

Table 5Descriptive statistics on variable It (April 1991–September 2004)
No (explicit) signal ðIt ¼ 0Þ Explicit signal (It ¼ 1, 2 and 3)
No Secret Oral Actual Confirmed
April 1991–September 2004 2475 131 523 163 49
Note: This table reports some descriptive statistics on variable It from April 1991 to September 2004. It ¼ 0 holds for secretinterventions or days with no interventions. From the signaling framework, these outcomes cannot be distinguished. Oral,actual and confirmed interventions are identified by It ¼ 1, 2 and 3, respectively.
Table 4Example of news reports used to identify confirmed interventions.
Date Source Newswire
September 28,2001
DowJones
‘‘We again intervened this morning single-handedly. Since there have been many speculativedollar/yen moves recently, we’ll continue to intervene as necessary”, Shiokawa told aregular press conference. The finance minister denied the ministry and the Bank of Japanhave any particular target level for the dollar/yen, but said the yen should be a littleweaker (against the dollar) in light of the deteriorating Japanese economy. ‘‘We have noparticular (dollar/yen) target levels in mind. But given the current weak economicconditions in Japan, I think it would be better if the yen was a little weaker”, he said
March 15, 2000 DowJones
‘‘Japan’s Ministry of Finance took action in the foreign exchange market Wednesday andmight intervene again depending on the situation”, Finance Minister Kiichi Miyazawasaid Wednesday. ‘‘We don’t want Japan’s economic recovery disturbed by foreign exchangemoves”, Miyazawa said. ‘‘We might intervene more depending on the situation”, he said
August 15, 1995 DowJones
‘‘US Treasury Secretary Robert Rubin later confirmed the coordinated intervention, and aBoJ official said it was consistent with the April Group of Seven (G-7) communique thatcalled for an orderly reversal of the dollar’s decline”
May 23, 2002 DowJones
‘‘Japan MoF confirms yen-selling intervention”
Note: These news reports are official announcements that refer to an actual intervention conducted during the same day.Therefore, they may be used to identify confirmed interventions.
O. Bernal, J.-Y. Gnabo / J. Japanese Int. Economies 23 (2009) 367–394 377
260-trading-day moving average X3t ¼ 100� st � 1260
P260i¼1 st�i
������
� �. The absolute misalignment is also
included ðX4t ¼ 100� jst � �stjÞ.21 In its current form, however, the variable X4t can suffer from non-sta-tionarity. To circumvent this, as an alternative way of measuring the misalignment, we built a dummyvariable, which takes the value 1 on days of high misalignment and 0 otherwise. The ‘‘high misalign-ment” days are defined as the 10% of trading days with the highest positive misalignment and the 10%of days with the highest negative misalignment. Note that the exchange-rate measures are the domes-tic price of foreign currency (i.e. yen per dollar) and are measured in log values. The variables arelagged to avoid simultaneity issues. Variables X1t ; X2t ;X3t and X4t enter the reaction function to testwhether or not the authorities tend to intervene to avoid large fluctuations in the exchange-rate levelover diverse horizons. If this is the case, the variables are expected to influence positively the proba-bility of observing an intervention (of any type).
4.2.3. Exchange-rate volatilityThe authorities claim to intervene to calm disorderly markets. That is, they intervene when the ex-
change-rate volatility is excessive. Therefore, like Andersen et al. (2001), we introduced a variable Z1t ,which corresponds to the daily realized volatility ðRVÞ. This is computed as the sum of the 288 5-min
squared returns in a day Z1t � RVt;h ¼P288
i¼0 r2t;h�i
� �.22 We chose h as 9 p.m. GMT (i.e. New York market’s
close). The realized volatility is a far less noisy measure than the daily volatility obtained from the
21 �st is the fundamental equilibrium rate estimated by Bénassy-Quéré et al. (2004), which is a rate consistent with a globalequilibrium between the G-20 countries.
22 The 5-min scaled prices were provided by Olsen and Associates.

378 O. Bernal, J.-Y. Gnabo / J. Japanese Int. Economies 23 (2009) 367–394
GARCH-type models used in several studies (Baillie and Osterberg, 1997; Dominguez, 1998; Almekin-ders and Eijffinger, 1996). It is also less subject to the issue of generated regressors (Pagan, 1984). Toprevent any simultaneity problem, the Z1t variable is lagged. Given the clustering of volatility usuallyobserved in exchange rates, this should be a good approximation.
It should be mentioned that, to date, most studies have failed to find evidence that periods of ex-cess volatility are accompanied by corrective measures from central banks. Given the objectives an-nounced by the authorities themselves, this is paradoxical. Two reasons (at least), may explain thisissue. The first is the nature of volatility itself. As volatility is latent (i.e. it cannot be observed), anyvariable capturing it is subject to a measurement-error risk. The second reason is that the authoritiesare usually more concerned by variations in the overall volatility than by specific levels or regimes ofvolatility. These factors suggest that Z1t might not be sufficient to capture the role of volatility as adeterminant of interventions. Additional variables for the exchange-rate volatility should also betested.
To achieve a more precise measure of exchange-rate volatility, the realized volatility ðZ1tÞ can besplit into an integrated volatility process (i.e. continuous and persistent) and a jump process (i.e.the occurrence of which is random). Measures for these two components should then be found. Asnoted by Andersen et al. (2001), the realized volatility is a consistent estimator of the integrated vol-atility only to the extent that there are no jumps in the underlying process. In the presence of jumps,the identification of the jump and non-jump contributions can be achieved by the methods pioneeredby Andersen et al. (2007). Variables Z2t and Z3t are built to represent the integrated volatility andjumps respectively.
Most empirical studies show that interventions tend to increase the exchange-rate volatility, atleast in the short term. Authorities may then be reluctant to intervene for ‘‘volatility purposes” exceptwhen the increase in the market’s overall volatility is considerable. Therefore, two variables wereintroduced here to indicate whether the volatility increased or decreased with respect to the previousday’s volatility. They are denoted by Z4t ¼ ijRVt;h � RVt�1;hj and Z5t ¼ i0jRVt;h � RVt�1;hjwhere i (resp. i0)is an indicator function taking the value 1 when RVt;h � RVt�1;h > 0 (resp. <0) and 0 otherwise. To easethe interpretation of these variables, we considered their absolute values.
Finally, the authorities may also be concerned by long-term volatility.23 The long-run tendency ofvolatility can be measured by the realized-volatility moving average over a long horizon. In this paper,the yearly moving average of realized volatility is incorporated into the model and is denotedZ6t ¼ 1
260
P260i¼1 RVt�i. To cope with potential non-stationarity issues with variable Z6t , a dummy taking
the value 1 on days of high long-run volatility and 0 otherwise is considered instead. High long-run isdefined as the 20% of days with the highest 260-day moving average. Note that we had also considereda measure of the medium-run volatility. The variable, a 21-day moving average, was, however, not in-cluded in the model because of its high correlation with other explanatory variables (such as long-runvolatility).
If the authorities react to excessive volatility, Z5t should reduce the probability of observing an inter-vention while Z1t; Z2t ; Z3t ; Z4t and Z6t should have a positive influence on the intervention activity.
4.2.4. Economic environmentDuring the period of interest, the Japanese economy behaved in a very specific way. Japan entered a
period of deflation in 1997 and has been in a liquidity trap ever since.24 Therefore, when analyzing theexchange-rate policy of the Japanese authorities, it is crucial to take account of the particular behavior ofthe central bank and of the overall economic environment. Variables related to the Japanese economy’sfundamentals should be incorporated into the authorities’ reaction function. Output is a good candidatefor this. However, it is only available on a quarterly basis. As the model is estimated on a daily basis, thiscould be an issue. Therefore, given the export orientation of the Japanese economy, the development ofthe real-trade balance is a good alternative. This information is available on a monthly basis on the Bank
23 We would like to thank one anonymous referee for pointing out the potential role of long-run volatility.24 Statistics on the Japanese consumer-price index are available on the Japanese Ministry of International Affairs and
Communications website (http://www.stat.go.jp/english/data/cpi/index.htm).

O. Bernal, J.-Y. Gnabo / J. Japanese Int. Economies 23 (2009) 367–394 379
of Japan’s website.25 The variable we used is the absolute deviation of the real-trade balance from itsone-year moving average. It is denoted by W1t ¼ jRBt � 1
12
P12i¼1RBt�ij where RB is the real-trade balance.
As variations in the exchange rate potentially influence the real-trade balance, we lagged the variable toavoid simultaneity problems.
As with volatility, we considered two additional variables that indicate whether or not there hadbeen an improvement in the real-trade balance from the previous month’s level. The rationale under-lying the use of such variables is that the authorities may not react symmetrically to an improvementand a deterioration in the real-trade balance. The variables are W2t ¼ jjRBt � RBt�1j andW3t ¼ j0jRBt � RBt�1j where j (resp. j0) is an indicator function taking the value 1 whenRBt � RBt�1 > 0ð< 0Þ and 0 otherwise.
Finally, there is clear evidence that a large proportion of the interventions conducted by Japan be-tween 2003 and 2004 were not sterilized (Watanabe and Yabu, 2007 suggest that about 40% of theamount spent on interventions during that period was not sterilized). To take this feature into account,a control variable denoted by W4t was included. W4t is a dummy taking the value 1 during the period2003–2004 and 0 otherwise.
W2t is expected to be negatively associated with the occurrence of interventions. On the otherhand, W1t and W3t are expected to be positively related to the use of interventions.
5. Results
Table 6 presents the main econometric results. The estimated coefficients should be interpreted interms of the final outcome of the dependent variable (i.e. confirmed interventions that correspond tothe strongest signal). Several models were considered. Specification (1) is the basic model. It does not in-clude either the volatility decomposition or the changes in the real-trade balance. Specification (2) addsthe decomposition of the volatility, and Specification (3) the dynamics of the real-trade balance. Thesetwo measures are incorporated simultaneously into Specification (4). The likelihood ratio, the log likeli-hood and the number of observations are reported for all the specifications. Threshold estimates are indi-cated. They are all significant at the 1% level. The zj;j�1 statistics are also significant and support thehypothesis that adjacent thresholds are statistically different. This confirms the relevance of our classi-fication of the different types of intervention based upon the strength of the signal they convey.
Before examining the main results of our econometric analysis it should be stressed that Japaneseinterventions show a high degree of variability across time. In particular, an apparent structural breakoccurred during the so-called Sakakibara period (mid 1995–2002), as described by Ito (2006) for ac-tual interventions. A dummy was considered to indicate this period. However, it did not appear to besignificant and our principal results were unchanged when it was included.26 This suggests that ourestimates are robust across the different sub-periods.
Results for the exchange-rate level variables ðXtÞ indicate that, for all specifications, large fluctua-tions in the exchange rate cause authorities to send strong and explicit corrective signals (i.e. all the Xt
coefficients are positive and significant). This confirms the leaning-against-the-wind strategy usuallyadopted by the Japanese authorities and documented by Ito (2003), Ito and Yabu (2007) and Bernal(2006).
To get a more accurate view of these results, it is necessary to examine the marginal effects of thesevariables on the intermediate outcomes. These reflect the change in the probability of occurrence ofthe different types of intervention induced by a marginal change in the regressors.27
Note that marginal effects per se provide information on three aspects of the interventions. Thefirst, related to their sign, shows whether a variable influences the probability of observing a modalityor signal (no explicit signal, oral, actual and confirmed intervention) positively or negatively. The sec-ond aspect is derived, for a given variable, from the differences in the magnitude of marginal effectsacross modalities. That is, the marginal effect indicates whether a change of one unit in a variableinfluences the probability of observing one modality or signal (e.g. an oral intervention) more than
25 http://www.boj.or.jp/en/type/stat/dlong/etc/index.htm.26 These results are not reported for the sake of clarity but are available upon request.27 The marginal effects of Specifications (1)–(4) are reported in Appendix A.

Table 6Estimates of the ordered-probit model for Japanese interventions during the period 1991–2004.
Variable (1) (2) (3) (4)
X1t (short-term deviation) 0.16*** (0.05) 0.15*** (0.05) 0.15*** (0.05) 0.156*** (0.05)X2t (mid-term deviation) 0.17*** (0.02) 0.17*** (0.02) 0.16*** (0.02) 0.17*** (0.02)X3t (long-term deviation) 0.04*** (0.01) 0.04*** (0.01) 0.05*** (0.01) 0.04*** (0.01)X4t (misalignment) 0.24*** (0.064) 0.24*** (0.064) 0.27*** (0.064) 0.27*** (0.064)
Z1t (realized volatility) �0.11 (0.08) � �0.12 (0.08) –Z2t (continuous volatility) – �0.13 (0.08) – �0.14 (0.08)Z3t (jumps) – 0.45* (0.25) – 0.42* (0.25)Z4t (positive volatility variation) 0.31** (0.12) 0.27* (0.13) 0.31*(0.12) 0.27* (0.13)Z5t (negative volatility variation) 0.02 (0.06) 0.02 (0.06) 0.01 (0.06) 0.02 (0.06)Z6t (past realized volatility) 0.19*** (0.05) 0.17*** (0.05) 0.21*** (0.05) 0.20*** (0.05)
W1t (real-trade balance variation) �0.007***(0.002)
�0.007***(0.002)
– –
W2t (real-trade balance positive variation) – – �0.002 (0.002) �0.002 (0.002)W3t (real-trade balance negative variation) – – �0.01***
(0.003)�0.01***(0.003)
W4t (sterilization) 0.068 (0.08) 0.067 (0.08) �0.01 (0.08) �0.01 (0.08)
H1 (threshold 1) 1.34*** 1.34*** 1.34*** 1.34***(0.06) (0.06) (0.07) (0.07)
H2 (threshold 2) 2.17*** 2.17*** 2.18*** 2.38***(0.087) (0.07) (0.07) (0.08)
H3 (threshold 3) 2.88*** 2.88*** 2.88*** 3.10***(0.09) (0.09) (0.09) (0.10)
z2;1 (threshold 2 and 1) 24.64*** 24.68*** 24.46*** 24.51***z3;2 (threshold 3 and 2) 12.79*** 12.81*** 12.76*** 12.78***LR (likelihood ratio) 314.23*** 322.34*** 336.13*** 343.60***LL (log likelihood) �2159.42 �2155.36 �2148.47 �2144.73
Number of observations 3341 3341 3341 3341
Note: Specification (1) corresponds to the basic model. It does not include neither the volatility decomposition nor the evolutionof real exports. Specifications (2) and (3) respectively incorporate the volatility decomposition and the dynamics of the real-trade balance. These two alternative measures are simultaneously incorporated in specification (4). The z-ratio statistics, zj;j�1,test whether threshold j is statistically different from threshold j� 1 (the null hypothesis is that Hj ¼ Hj�1 and the critical valueis 1.96). Standard errors are reported between brackets.* Significance at the 10% level.** Significance at the 5% level.*** Significance at the 1% level.
380 O. Bernal, J.-Y. Gnabo / J. Japanese Int. Economies 23 (2009) 367–394
another (e.g. a confirmed intervention). The third aspect concerns the magnitude of the marginal ef-fects of different variables. Note that it is usual to multiply the marginal effect of a given variable bythe standard deviation of that variable. This allows the impact of ‘‘usual variations” in the series to bemeasured and gives a more realistic picture of the situation.
In all the specifications, the marginal effect of the short-term deviation ðX1tÞ has a negative sign forno signal and a positive sign for oral, actual and confirmed interventions (see Tables 8–11 in AppendixA).28 Interestingly, these marginal effects decrease slightly as the strength of the signal increases. Giventhe structure of our econometric model, this could be interpreted as the authorities adopting increasinglystronger and more explicit corrective measures as the magnitude of the exchange-rate deviation from itspast values rises. In other words, the authorities tend to use stronger measures as market conditionsdeteriorate. This confirms the idea that the different types of intervention may be substitutes or comple-ments depending on the circumstances (Fratzscher, 2008a,b; Beine et al., 2009; Gnabo and Teiletche,2009). For instance, in Specification (1) (Table 8), the marginal effect of X1t on the occurrence of oralinterventions is 0.03 meaning that a one unit increase in the short-term deviation raises the probabilityof sending a weak explicit signal (an oral intervention) by 3%. This variation is slightly lower for strongersignals (1% for actual interventions), suggesting that the authorities can rapidly shift from simple
28 By construction, the marginal probability effects change their sign only once when moving from the smallest to the largestoutcome in ordered probit models (Boes and Winkelmann, 2006).

Table 7Effect of interventions in the JPY/US$ market.
(1) (2) (3) (4)
(a) (b) (a) (b) (a) (b) (a) (b)
2-days horizon
H10
t-Test Mean 0.001 �0.122 0.005 �0.220 0.003 �0.730 0.005 0.104p-Value 0.496 0.005 0.000 0.046 0.069 0.000 0.089 0.350
Sign test Success 57 76 18 16 13 17 9 3p-Value 0.676 0.001 0.026 0.124 0.032 0.000 0.020 0.927
H20
t-Tests Mean 0.003 �0.107 0.014 �0.536 0.012 �1.070 0.011 0.169p-Value 0.023 0.087 0.000 0.001 0.005 0.000 0.006 0.503
Sign test # Success 69 63 23 19 16 17 10 4p-Value 0.041 0.261 0.000 0.010 0.000 0.000 0.003 0.806
5-days horizon
H10
t-Test Mean 0.002 �0.123 0.009 �0.357 0.002 �0.824 0.888 �0.591p-Value 0.079 0.018 0.000 0.002 0.309 0.000 0.193 0.031
Sign test # Success 59 75 22 19 12 17 10 6p-Value 0.536 0.002 0.000 0.010 0.084 0.000 0.003 0.387
H20
t-Test Mean 0.007 �0.183 0.020 �0.535 0.020 �1.210 0.013 0.172p-Value 0.001 0.008 0.000 0.010 0.000 0.002 0.024 0.321
Sign test # Success 77 71 23 19 16 15 10 4p-Value 0.001 0.018 0.000 0.010 0.000 0.002 0.003 0.806
10-days horizons
H10
t-Test Mean 0.003 �0.231 0.007 �0.419 0.003 �0.69 0.004 0.018p-Value 0.058 0.000 0.010 0.008 0.282 0.002 0.187 0.343
Sign test # Success 63 80 20 20 10 14 6 7p-Value 0.261 0.000 0.003 0.003 0.324 0.010 0.387 0.194
H20
t-Test Mean 0.009 �0.300 0.016 �0.520 0.026 �1.120 0.011 0.091p-Value 0.001 0.000 0.000 0.020 0.000 0.007 0.069 0.468
Sign test # Success 72 77 22 20 16 15 7 6p-Value 0.011 0.001 0.000 0.003 0.000 0.002 0.194 0.387
Note: This table reports the estimation of the event study specified to determine the impact of BoJ interventions on the JPY/US$moments. Results are computed on the basis of a maximum of five days of tranquility between events. Columns (1)–(3)respectively contain the effect of oral (120 events), public (27 events) and confirmed interventions (19 events) on the exchange-rate level and volatility (sub-columns (a) and (b) respectively). Column (4) reports results for secret interventions (12 events).The tests on exchange-rate moments are implemented using two alternative null hypothesis. H1
0 holds for no change in themoments in the post-event period while H2
0 denotes no change in the moments between the pre-event and post-event periods.2-, 5- and 10-days horizons are considered. Finally, p-values are calculated using the bootstrapped distribution of the t-tests.Results of the non-parametric sign test are also reported.
O. Bernal, J.-Y. Gnabo / J. Japanese Int. Economies 23 (2009) 367–394 381
announcements to actual interventions when the deviation widens. This confirms Fratzscher (2005)’sview that these two types of intervention tend to be domestically coordinated (i.e. they are used inthe same periods). By contrast, the Japanese authorities seem far more reluctant to take the next steptoward using confirmed interventions, since their marginal effect is only 0.4%. In a sense, words anddeeds are used together only in extreme cases. The results are quite similar for medium-term deviationsðX2tÞ while those with longer-term horizons (i.e. the long-term deviation ðX3tÞ and the misalignmentðX4tÞ variables) have smaller marginal effects.29
29 The use of a dummy variable as an alternative to the misalignment variable does not affect the results. For the sake of brevitythese estimates are not reported, but they are available upon request.

Table 9Marginal effects for Specification (2).
Intervention
No/secret (%) Oral (%) Actual (%) Confirmed (%)
X1t (short-term deviation) �2.1 1.4 0.6 0.2X2t (mid-term deviation) �6.3 4.0 1.7 0.5X3t (long-term deviation) �4.5 2.9 1.2 0.4X4t (misalignment) �7.3 4.6 2.1 0.7Z3t (jumps) �1.4 0.9 0.4 0.1Z4t (positive volatility variation) �2.7 1.8 0.7 0.2Z6t (past realized volatility) �5.2 3.3 1.5 0.5W1t (real balance variation) 2.4 �1.6 �0.7 �0.2
Table 10Marginal effects for Specification (3).
Intervention
No/secret (%) Oral (%) Actual (%) Confirmed (%)
X1t (short-term deviation) �2.2 1.4 0.6 0.2X2t (mid-term deviation) �5.9 3.8 1.6 0.5X3t (long-term deviation) �4.6 3.0 1.2 0.4X4t (misalignment) �8.1 5.0 2.3 0.8Z4t (positive volatility variation) �3.1 2.0 0.8 0.3Z6t (past realized volatility) �6.4 4.0 1.8 0.6W3t (negative real balance variation) 4.5 �3.0 �1.2 �0.4
Table 11Marginal effects for Specification (4)
Intervention
No/secret (%) Oral (%) Actual (%) Confirmed (%)
X1t (short-term deviation) �2.1 1.4 0.6 0.2X2t (mid-term deviation) �6.1 3.9 1.6 0.5X3t (long-term deviation) �4.7 3.0 1.3 0.4X4t (misalignment) �8.1 5.0 2.3 0.8Z3t (jumps) �1.3 0.8 0.3 0.1Z4t (positive volatility variation) �0.06 0.04 0.02 0.005Z6t (past realized volatility) �6.0 3.8 1.7 0.6W3t (negative real balance variation) 4.6 �3.0 �1.2 �0.4
Table 8Marginal effects for Specification (1).
Intervention
No/secret Oral (%) Actual (%) Confirmed (%)
X1t (short-term deviation) �2.2 1.4 0.6 0.2X2t (mid-term deviation) �6.2 4.0 1.7 0.5X3t (long-term deviation) �4.5 2.9 1.2 0.4X4t (misalignment) �7.4 4.6 2.1 0.7Z4t (positive volatility variation) �3.2 2.0 0.9 0.3Z6t (past realized volatility) �5.5 3.5 1.6 0.5W1t (real balance variation) 2.3 �1.6 �0.7 �0.2
382 O. Bernal, J.-Y. Gnabo / J. Japanese Int. Economies 23 (2009) 367–394

O. Bernal, J.-Y. Gnabo / J. Japanese Int. Economies 23 (2009) 367–394 383
The marginal effects of the various variables are strongly robust across the different specifications(Tables 8–11). However, they are usually quite small. If we multiply their size by the standard devi-ation of the variable (i.e. its usual variation) the probability of observing any particular signal is verylow. Typically, the probabilities range from 0.2% to 4.6% depending on the horizon of the deviation andthe type of signal. This is actually not surprising since interventions are generally few and far between.It simply reflects the reluctance of the central bank to send a signal given the associated costs, even forthe least costly signal.
An important feature of the differences between the marginal effects is that the authorities respondfar more frequently with a weak than with a strong signal. A possible interpretation is that the centralbank wants to preserve its reputation by ‘‘putting its money where its mouth is” when the situation isworsening. In other words, the communication policy mainly plays the role of a ‘‘first line of defense”.But, when the exchange rate crosses the so-called ‘‘line in the sand”, the FX authorities are prepared toback their words with action. This scenario is well summed up by Kosuke Nakahira (a former JapaneseVice-Finance Minister for International Affairs): ‘‘If verbal [oral] intervention proves to be effective I don’tthink it is necessary for them[the Japanese authorities] to get into the market [to intervene]. If it is inef-ficient, then they have to take stronger means” (Reuters, August 17, 2001).
On the market side, numerous news reports also suggest that market participants need strongersignals to readjust their trading behavior when simply talking is ineffective: ‘‘Ministry of Financecurrency guru Eisuke Sakakibara made his now-routine warning to the market that MoF was determinedto avoid premature yen strength, but mere verbal intervention was having less and less effect unless backedwith money” (Reuters, June 28, 1999). Alternatively, the close dependence between words and deedscan be viewed as a strategy in which statements are used to test market conditions. If these conditionsare favorable, a physical – and financially risky – intervention is conducted; if not, entry into the mar-ket is postponed. In any case, these findings are particularly interesting since they shed some light onthe reasons why market participants usually expect new rounds of intervention (the so-called unre-quited interventions described by Dominguez and Panthaki, 2007, which have been found to have asignificant empirical relationship with official statements, Gnabo et al., 2009) when officials expresstheir discomfort with the exchange rate. Several news reports imply that market participants expectmore interventions after statements such as ‘‘Japanese Vice-Finance Minister for International AffairsHaruhiko Kuroda said earlier that the recent rise in the yen was not appropriate given economic fundamen-tals, keeping markets wary about possible intervention to cap yen strength” (Reuters, August 27, 2001)and ‘‘For the time being, few expect actual market intervention by the Bank of Japan. First they expectJapanese officials to start verbal [oral] intervention in an effort to talk the dollar back down” (Dow Jones,August 6, 1997).
Estimations of the different volatility measures ðZtÞ are generally low. In Specifications (1) and (3),the realized volatility ðZ1tÞ is not significant. This is in line with the bulk of empirical research, but con-trasts with declarations from officials who claim to be concerned by volatility issues. To explorewhether this is due to the way volatility is usually measured, we consider the volatility decompositionin terms of its continuous and jump components. The results are reported in Specifications (2) and (4).The continuous volatility ðZ2tÞ is still not significant. By contrast, the jumps component ðZ3tÞ has a sig-nificant impact at 5%. Interestingly, this justifies our decomposition, since working at an aggregate le-vel obviously hides some information. From an economic point of view, this means that the authoritiespay attention to rapid shifts or jumps in the volatility rather than to its overall level. This interpreta-tion is reinforced by the results for variables indicating whether the volatility increased or decreasedwith respect to the previous day level (Z4t and Z5t). As partially expected, Z5t is not significant; the FXauthorities do not react to decreasing volatility. They do, however, intervene when the volatility in-creases compared to its previous day’s level (Z4t has a positive and significant coefficient). Taken to-gether, these results imply that the authorities are quicker to intervene when there are large andrapid fluctuations in the exchange rate than when the overall volatility is high. This, however, onlyappears to be true for short-run volatility, since periods of high uncertainty, as measured by thelong-run volatility ðZ6tÞ cause significant reactions from the central bank.
Again the marginal effects confirm that the central bank intervenes with increasing strength as thevolatility rises. This result is particularly interesting, since it is consistent with official declarations.Furthermore, these marginal effects are, on average, greater than those for the exchange-rate level

384 O. Bernal, J.-Y. Gnabo / J. Japanese Int. Economies 23 (2009) 367–394
variables. A one standard deviation (0.35) increase in the short-term deviation of the volatility ðZ4tÞraises the probability of having a visible signal by about 3.7%. On the other hand, a one standard devi-ation (0.48) increase in the short-term change in the exchange-rate level ðX1tÞ only raises the proba-bility by about 2.2%.30 This confirms that volatility is an important factor in regulation policy.
Results on the economic environment variables ðWtÞ indicate, on the whole, that the authoritieswere reluctant to send a signal when the real-trade balance moved away from the long-term equi-librium (W1t has a significant negative coefficient in Specifications (1) and (2)) or from the previousmonth’s level (W3t has a significant negative coefficient in Specifications (3) and (4)). Moreover, thevariable controlling for the period of incomplete sterilization ðW4tÞ is not significant. An examinationof the average marginal effects of variables W1t and W3t shows that an increase of one standarddeviation in each variable (11.07 and 11.58) affected the probability of an intervention by about�0.8% and �0.3%, respectively. These results may be interpreted as indicating that the authoritiesdid not react openly when the real-trade balance deteriorated, which in turn may indicate theirreluctance to defend a depreciation policy aimed at supporting their international position with re-spect to their foreign counterparts. Interestingly, US officials regularly expressed their disagreementwith any manipulation of the currency during this period, especially if it was aimed at boosting theeconomy. For instance, the Secretary of the Treasury, Lawrence Summers, warned that ‘‘ Japan’smanipulation of its currency would not help restore prosperity”, and that ‘‘the focus in Japan has tobe on strengthening the fundamentals”. (Dow Jones, July 8, 1999). More generally, this type of policywould be inconsistent with the ‘‘Principles of Guidance” for members’ exchange-rate policiesadopted by the IMF. According to this ‘‘a member shall avoid manipulating exchange rates or the inter-national monetary system in order to prevent effective balance of payments adjustment or to gain an un-fair competitive advantage over other members”.31 This is fully consistent with Japan’s large-scale secretintervention between 2003 and 2004 to depreciate the yen when it was already below the level con-sistent with a global equilibrium (see Bénassy-Quéré et al., 2004; Beine and Lecourt, 2004; Beine andBernal, 2007; Bernal, 2006).
An important implication of our results is that, on average, the authorities tend to be less activewhen the deviations of the exchange rates from their past values or a specific target are moderate.Moreover, the strength of the signal delivered by interventions increases as the magnitude of thesedeviations rises. While predicting the type of future central-bank intervention would be an interest-ing contribution to the literature, it should be stressed that our methodology does not allow us toconduct such an exercise. Discrete-choice models are not well suited to out-of-sample forecasting(Train, 2003). Nevertheless, a careful examination of Figs. 3–5 indicates that variations in the ex-change rate were particularly marked between 1996 and 1999, which is also the period in whichmost of the confirmed interventions occurred (i.e. the strongest signals were sent to the market).This is particularly apparent for short- and mid-term deviations. Conversely, the deviations havebeen smaller in more recent years, and especially since 2004 (when Japan stopped undertaking ac-tual interventions and began to rely only on sporadic verbal statements).32 Clearly, this discussion ofexchange-rate patterns is only informal, but it does appear to be consistent with the main implicationsof our empirical results.
6. Extension
6.1. The approach
Having analyzed the determinants of central-bank signals, a natural extension is to examinewhether oral, actual and confirmed interventions were actually successful in moving the exchange-rate level and volatility in the desired direction. The purpose of this section is therefore to assess
30 For any given variable, the average marginal effects are computed using only the marginal effect on the results of oral, actualand confirmed interventions.
31 http://www.imf.org/external/np/pdr/surv/2004/082404.htm.32 Similar conclusions can be drawn from an analysis of the variables capturing volatility and, to a lesser extent, the economic
environment. For the sake of brevity these statistics are not reported, but they are available upon request.

1991 1992 1993 1994 1995 1996 1997 1998 1999 2000 2001 2002 2003 2004 2005 2006 20070
1
2
3
4
5
6
7
8 1996−1999 2004−2007
Fig. 3. Short-term variations in the JPY/USD$ exchange-rate level.
1991 1992 1993 1994 1995 1996 1997 1998 1999 2000 2001 2002 2003 2004 2005 2006 20070
0.05
0.1
0.15
0.2
0.25 1996−1999 2004−2007
Fig. 5. Long-term variations in the JPY/US$ exchange-rate level level level.
1991 1992 1993 1994 1995 1996 1997 1998 1999 2000 2001 2002 2003 2004 2005 2006 20070
0.02
0.04
0.06
0.08
0.1
0.12
0.14 1996−1999 2004−2007
Fig. 4. Medium-term variations in the JPY/US$ exchange-rate level level.
O. Bernal, J.-Y. Gnabo / J. Japanese Int. Economies 23 (2009) 367–394 385
empirically the effectiveness of interventions. Before detailing the econometric aspects of the analysistwo points regarding the theoretical framework used in this section need to be clarified. First, con-trasting with the first part of the paper, this analysis is not restricted to the signaling channel frame-work. Second, while our dataset allows the assessment of the effectiveness of different strategies ofintervention, it cannot be used to test the validity of the usual theoretical channels. We develop thesepoints below.

386 O. Bernal, J.-Y. Gnabo / J. Japanese Int. Economies 23 (2009) 367–394
The study we have detailed so far considers oral, actual and confirmed interventions as possiblestrategies adopted by central banks to provide the market with explicit signals. As a consequence,our study focusses exclusively on the so-called signaling approach to interventions and excludessecret interventions de facto. In this section, we aim at filling this gap by including secret operationsalongside oral, actual and confirmed interventions. In this respect, this extension covers a broaderscope than the set of strategies considered in the reaction function estimated in the previous sec-tions. Adopting such a comprehensive view of interventions is necessary to assess the effectivenessof central banks’ different foreign exchange policies. But, it implies that this extension does not relyexactly on the same theoretical framework as previously. Indeed, secret interventions are concealedfrom the market by the authorities. In order to do this, they cannot operate through the signalingchannel, and alternative arguments have been developed in the literature to explain their potentialimpact on exchange rates (like the noise trading or the microstructure channels: for a review, seeBeine and Bernal, 2007). These mechanisms were not considered in the theoretical discussion en-abling us to formulate the extended reaction function for two reasons. First, because we neededto anchor our analysis within a uniform framework.33 Second because both the noise trading andthe microstructure channels have received far less empirical validation than the signaling channel.While working within this framework is restrictive (e.g. it precludes us from disentangling secretand no-intervention days), it has been rather convenient for modeling oral intervention alongsideactual ones, which is the main objective of this paper. Now that we are turning to the effect of inter-ventions, however, we do not need to rely on a particular theoretical framework. That is, we areinterested in measuring the effect of different strategies of intervention without any prior assump-tions regarding their theoretical impacts.
Another point that is worth clarifying at this stage concerns the limits of our extension, and par-ticularly the lessons that can be drawn from it. While our dataset allows us to assess whether or nota policy successfully modifies the dynamics of the exchange rate, it does not allow us to determinewhether a specific transmission channel works or not. This is especially true regarding the signalingchannel which specifies that interventions affect market expectations and that, as a result, marketparticipants adapt their trading behavior, which in turn leads to a correction of the currency path.However, the natural way of examining whether this mechanism works or not consists of measuringhow expectations react to interventions using option data (as discussed in Gnabo and Teiletche,2009). Our data (i.e. spot exchange rate data) only allow us to estimate the final impact of interven-tions on exchange rates (and not on market expectations). Overall, these elements explain why ouranalysis does not claim to shed light on the theoretical channels at work in the transmission ofinterventions.
6.2. Examining the impact of interventions
Numerous econometric techniques have been proposed to estimate the impact of interventions.The main approaches are based on time-series (e.g. GARCH models). While easy to implement, suchtechniques generally fail to capture several features of central banks’ activity (e.g. the clustering ofinterventions over time).
As an alternative, Fatum (2000) proposed the use of an event-study approach. Unlike time series, the‘‘event window” is not limited to a single day, but can cover clusters of interventions lasting several days.The rationale underlying this is that the window basically corresponds to one political decision (based ona particular economic and financial environment). A second advantage of event-study approaches is theloosening of the usual (but questionable) assumptions about the central bank’s objectives (which aregenerally not precisely known) by considering several criteria for ‘‘success”. For instance, success canbe a change in either the level or the rate of change of exchange rates in the days following the interven-tion (this corresponds to Humpage, 2000’s reverse or smoothing criteria).
33 Consistency throughout the discussion was achieved by considering the cost of intervention as the key element rationalizingthe use of different strategies of interventions. These costs play no role within the noise trading and the microstructureframeworks. Indeed, as the transactions are anonymous, the costs cannot be used to reinforce the authorities’ credibility andtherefore the potential effect of their operation.

O. Bernal, J.-Y. Gnabo / J. Japanese Int. Economies 23 (2009) 367–394 387
More recently, some authors have also proposed the use of structural models. This approach con-sists of estimating the intervention process as a whole (i.e. a central bank’s reaction function and theresponse of exchange rates to the central bank’s policy). Obviously, structural models are best suitedto measuring short-term impacts directly (i.e. without the risk of simultaneity bias).34 Unfortunately,such models are difficult to implement in practice and the identification of parameters relies on verystrong assumptions (Neely, 2005; Kearns and Rigobon, 2005).35
Suggesting a new structural model, especially for different types of intervention, is beyond thescope of this paper. We follow Fatum and Hutchinson (2003) and Morel and Teiletche (2008) byadopting an event-study approach. The consequences of using such a model, instead of a full structuralmodel, are limited. The main consequence is that, in order to avoid simultaneity bias, we cannot esti-mate the very short-term impact of policies (i.e. contemporaneous effects). However, policymakers of-ten target medium- or long-term objectives, so working on these time scales may be just as relevant.
6.3. An event-study approach to interventions
The starting point for an event study is to define the ‘‘event” and identify an observation periodcalled the ‘‘event window”. As mentioned above, the event window is not limited to a single day. Itfrequently covers clusters of interventions lasting several days. The choice of the event window istherefore key. If it is too small, two events which form part of a single phase of intervention can mis-takenly be distinguished. On the other hand, if it is too large, several phases of intervention can beerroneously considered to stem from the same economic policy decision. In this paper, we follow Mor-el and Teiletche (2008) in setting a maximum number of five days with no intervention as part of thesame event. That is, we consider that two consecutive interventions are part of the same event if theyare separated by a period of less than five business days without any intervention by the authorities.
Once the events have been identified, we need to define ‘‘pre-event” and ‘‘post-event” periods. ti
stands for the first day of the ith period of intervention, si is the duration of the event in days andk indicates the length of the pre- and post-event periods. The pre-event period is defined as ti � kto ti � 1, the event period goes from ti to ti þ si � 1 inclusive, and the post-event period lasts fromti þ si to ti þ si þ k� 1 (for more details, see Morel and Teiletche, 2008). Exchange rates are collectedat the end of the day (9 p.m. GMT).
Let Mt denote a change in either the exchange-rate level or the realized volatility in period t (i.e. Mt
denotes the first two moments of the exchange rate). Changes in the moments of the pre-event andpost-event intervals are denoted respectively by DMpre
i and DMposti , respectively, with
DMprei ¼ Mti�1 �Mti�k and DMpost
i ¼ Mtiþsiþk�1 �Mtiþsi. The test used in this paper to determine whether
these changes are significant is based on two null hypotheses, as given in Eqs. (5) and (6) below.
34 Theexplaineffects
35 Neerealisticthe ma
Hð1Þ0 : E DMposti
� �¼ 0 ð5Þ
Hð2Þ0 : E DMposti � DMpre
i
� �¼ 0 ð6Þ
These hypotheses were implicitly tested by Fatum and Hutchinson (2006) for exchange-rate re-turns. The first null hypothesis corresponds to their ‘‘direction test” while the second null hypothesisrefers to their ‘‘reversal test” and ‘‘smoothing tests” (depending on the sign of the return in the pre-event period). Hð1Þ0 is used to ascertain whether intervention events caused significant changes in ex-change-rate moments in the post-event period. This corresponds to the stronger form of the test. Hð2Þ0
is used to determine whether pre-event changes in the exchange rate are significantly different frompost-event changes. It corresponds to the weaker form of the test, since it does not necessarily requirethe exchange rate to move in the expected direction.
risk of simultaneity bias naturally decreases when the impact of interventions is investigated over a longer horizon. Thiss why researchers usually measure the reaction of the exchange rate one or more days after an intervention. This allows theof the policy to be isolated from the exchange-rate developments that caused the corrective actions.ly (2005) and Kearns and Rigobon (2005) both propose structural models which require specific assumptions that are notfor Japan for the period 1991–2004. Neely (2005) assumes that the central bank sells and purchases currency equally on
rket. Kearns and Rigobon (2005), on the other hand, use a structural break in the series to estimate the model.

388 O. Bernal, J.-Y. Gnabo / J. Japanese Int. Economies 23 (2009) 367–394
The purpose of these tests is to assess the effectiveness of interventions. Specifically, in the case ofthe exchange-rate level, we are interested in determining whether positive variations in the exchangerate are caused by yen sales, and whether negative variations are caused by yen purchases. Naturally,this requires the correct sign to be associated with intervention series (Jansen and de Haan, 2005;Fratzscher, 2008b). We associated a significant positive exchange-rate level change with an effectiveintervention (of either sign). In addition, an intervention is considered to be successful if it reduces thevolatility. The rejection or acceptance of the null hypotheses is based on specific tests on one tail of thedistribution. In event studies, null hypotheses such as Hð1Þ0 and Hð2Þ0 are usually tested using t-tests. It iswell established, however, that t-tests can be fragile in a framework such as ours (small dataset, sen-sitivity to outlying data points). For this reason, we complemented the t-test with a bootstrap. Thenumber of replications (B) was fixed at 10,000. We also tested the significance of the changes in mo-ments using a traditional non-parametric sign test.
6.4. Results
Table 7 reports the estimates of our event-study model. Columns (1)–(3) denote the impact on ex-change-rate moments of oral, actual and confirmed interventions. Columns (a) and (b) give the impactof interventions on the exchange-rate level and volatility, respectively. The impacts of secret interven-tions are reported in Column (4). The success of interventions is assessed through the null hypothesesH1
0 and H20, which are evaluated using a t-test with bootstrap and a sign test. As a robustness check,
these impacts are considered over pre- and post-event periods of different lengths (2, 5 and 10 days).In recent years, the Japanese authorities have often communicated orally information about the va-
lue of the yen. Our methodology allows the identification of 120 oral intervention events. Column (1a)indicates that, in general, oral interventions affected the exchange rates in the desired direction (i.e.the mean is positive). That is, oral interventions supporting the yen led to its appreciation. However,the p-values show that this result is not robust for the stronger hypothesis ðH1
0Þ. This suggests that, bytalking directly to market participants, the Japanese authorities generally succeeded in smoothing thetrend in the yen’s exchange rate, but not in reversing it. Results on volatility are reported in Column(1b). They are more consistent. On the whole, they indicate that official speeches significantly reduceduncertainty regardless of the time horizon and the type of null hypothesis. In this respect, our findingsare consistent with those of Gnabo and Teiletche (2009) and of Fratzscher (2008b), who used an event-study and a time-series approach, respectively.
Actual interventions allow authorities to transmit a stronger signal than simple oral interventions.That is, according to our previous analysis, they involve higher costs. If the signal is fully believed, thecentral bank may expect greater correcting effects on exchange rates. Results for the 27 actual inter-vention events are shown in Column (2). Both the level (Column 2a) and the volatility (Column 2b) ofthe exchange rate are affected in the expected direction. This result holds regardless of the time hori-zon and the null hypothesis. The magnitude of this effect is such that actual interventions cause theyen to either appreciate or depreciate by nearly 0.5% against the dollar in the short run, dependingon the sign of the intervention. These results are more or less in line with the rest of the literaturein which actual interventions are usually asserted to be effective (Dominguez, 1998).
Unlike previous studies, the set of actual interventions in this paper does not include those con-firmed by a speech. Specific results for confirmed interventions are provided in Column 3. Withinthe signaling framework, confirmed interventions theoretically convey the strongest signal. Giventhe cost of this type of intervention, the number of events is, as expected, lower than for other typesof intervention (there were only 19 sequences of confirmed interventions in our sample). Like actualinterventions, the coefficient of volatility is negative and significant at the 10% level (Column (3b)).That is, the confirmation and the clarification of their objectives by the authorities removed someuncertainty in the market. On the other hand, the findings on exchange-rate levels are more varied.Like actual interventions, there was a positive and significant effect in the short run (2-day horizon).In the longer term, however, this policy essentially smoothed the exchange-rate pattern. This providessupport for Beine et al. (2009)’s findings. But it also means that the Bank of Japan did not fully succeedin correcting the exchange-rate level when the situation required strong measures.

O. Bernal, J.-Y. Gnabo / J. Japanese Int. Economies 23 (2009) 367–394 389
Regarding secret interventions, our results are mitigated. Column (4a) reports that secret interven-tions were efficient in affecting the exchange-rate level over the short and medium term (i.e. a 2-dayand 5-day horizon). By contrast, secret operations were not capable of moving the exchange rate in thedesired direction over the 10-day window. As for volatility, Column (4b) reports without any ambigu-ity that secret interventions had a muted impact on this variable. This result contrasts with other stud-ies, which have claimed that secret interventions tend to stimulate volatility (Dominguez and Frankel,1993).
Overall, these results emphasize two important features. First central banks can correctunwanted exchange-rate developments through interventions, even when acting anonymously.Second, the magnitude of the effect on exchange rates is not proportional to the strength of thesignal (e.g. confirmed interventions do not seem to cause stronger effects than actual interven-tions). At first glance, this observation is surprising since it seems inconsistent with the theoreticaldiscussion in Section 3 and, more generally, with the signaling channel framework itself. However,we can reconcile these findings by keeping in mind the main empirical results related to ourextended reaction function (see Table 6). According to these results, central banks are indeed will-ing to adjust their signals to the economic environment and to the state of the market (i.e. largerdeviations of the exchange rate from fundamentals were found to trigger stronger signals). Thisarises because the central bank’s credibility is greater when higher costs are involved. In otherwords, one could expect a greater impact on the exchange rate from stronger signals. From theseresults, one could conclude that a central bank would hardly rely on oral interventions (weak sig-nals) in highly unfavorable situations which are by nature harder to correct. In this respect, theevent-study results might just indicate that it is easier for the authorities to correct a smaller mis-alignment than a large one. Nevertheless, while the potential gains of carrying stronger interven-tions are higher, the potential losses may be higher too. For instance, the central bank’s reputationcan be affected if huge amounts are unsuccessfully invested in order to invert the exchange-ratetrend (this could arise if market participants lost confidence in the central bank’s ability to correctthings). In turn, the initial undesirable exchange-rate trend could even be reinforced despite theauthorities’ efforts to reverse it. Said otherwise, the potential impact of a given intervention isnot only determined by its nature, but also by the characteristics of the situation the authoritiesare seeking to correct. This view can be illustrated by comparing the degree of effectiveness ofthe different types of interventions. Additional empirical results (see Table 12 and 13 of AppendixB) support the fact that the impact of interventions depends heavily on market conditions. Morespecifically, central banks are found to be able to counter small unfavorable exchange rate varia-tions more easily than larger ones.
7. Conclusion
In this paper, we have suggested a new approach to central banks’ reaction functions. The approachtakes account not only of central banks’ official transactions on the FX markets but also of their generalcommunication policy. This allows us to consider different types of intervention, according to whetherthey involve currency transactions (i.e. actual and confirmed interventions) or not (oral interventions).A clear shift has been observed in several important countries (the United States, the Eurozone andmore recently Japan) toward fewer actual interventions. Determining the circumstances leading theauthorities to use one type of intervention rather than another is therefore of practical importance.Understanding to what extent oral interventions may be used instead of, or in addition to actual inter-ventions, is important for policy purposes.
The fact that, at a particular time, the authorities decide to accept an unusually high cost may beseen as a good indicator of their degree of determination. We assume that the strength of the signalconveyed by their visible interventions can be assessed by this criterion. Secret interventions cannotbe distinguished from private trades. They are therefore considered to carry a non-explicit signal. Onthis basis, it is possible to elaborate an econometric ordered-probit model with a categorical variablefor the different types of intervention as the dependent variable. The interventions are classifiedaccording to the strength of the signal they convey. The model was estimated over the usual determi-

390 O. Bernal, J.-Y. Gnabo / J. Japanese Int. Economies 23 (2009) 367–394
nants of interventions (i.e. exchange-rate level and volatility variables, plus control variables for theeconomic environment) using Japanese data for the 1991–2004 period.
The main econometric results indicate that the authorities tend to adopt a leaning-against-the-windstrategy. They try to counteract large deviations of the exchange rate from its past values and the fun-damental equilibrium. Estimates of the volatility variables show that only large fluctuations in the ex-change rate, and especially jumps in the rate, tend to prompt the authorities to intervene. The overalllevel of volatility does not concern them so much; they appear to be aware that, in fact, interventionsgenerally trigger volatility. Results on the real-trade balance variables show that the authorities donot react openly to fluctuations in this value; if it deteriorates, they tend to avoid intervening or theyuse secret interventions. This may indicate that authorities do not want to reveal to their foreign coun-terparts their intention of defending their international position by influencing the exchange rates.
Our examination of the marginal effects on the different outcomes strongly suggests that thestrength of the measures employed by the Japanese authorities increases with the gravity of the cir-cumstances. That is, if the exchange-rate level moves a little in an inappropriate direction, or if thevolatility increases moderately, they will first use oral interventions. Actual or confirmed interven-tions are only used if the magnitude of the fluctuations increases. In other words, it is only in extremecases that words and deeds are used in a complementary way.
Finally, our analysis of the effects of interventions shows that the Japanese policy succeeded in cor-recting several unwelcome trends in the exchange rate even when they were acting secretly. All typesof non-secret intervention were found to have had a virtuous effect on volatility. The findings on theexchange-rate level are more variable, however. In particular, results show that the central bank facesdifficulties in orienting the trend of the currency in the desired direction when the level of misalign-ment is high.
Acknowledgments
Financial support from the Belgian National Fund for Scientific Research (FRFC funding) is grate-fully acknowledged. We thank Michel Beine, Hans Dewachter, Marcel Fratzscher, Eric Girardin, Da-vid-Jan Jansen, Christelle Lecourt, Kim Oosterlinck, Franz Palm and Ariane Szafarz as well as theparticipants of the DULBEA’s internal seminar, of the Fifth Econometrics Day at the University ofParis-Nanterre and of the Summer School on ‘‘New microstructure of financial markets” held inAix-en-Provence for their useful comments and suggestions. We are also indebted to Agnès Bén-assy-Quéré for providing us with estimates of the fundamental exchange rate and to Jérôme Teiletchefor kindly sharing some code with us. Of course, any remaining mistakes are our own responsibility.
Appendix A. Marginal effects
Marginal effects reflect changes in the probability of occurrence of the different types of interven-tion (no explicit signal, oral, actual and confirmed interventions) induced by a marginal change in theregressors. The effects are computed at the mean of the different (significant) explanatory variablesand are multiplied by their standard deviation. Importantly, marginal effects sum to 0. For technicaldetails, see Wooldridge (2002).
Appendix B
To determine whether one type of intervention is more effective than another, it is necessary tocompare the degree of effectiveness of interventions in ‘‘similar” circumstances. Identifying ‘‘similar”events is not a trivial task since it requires defining a set of criteria to characterize them (e.g. a crite-rion for the misalignment and a criterion for the volatility would be natural candidates). However, inpractice, using a multi-criteria approach eventually leads to a fall of the number of events per type ofintervention. Therefore, in an attempt to circumvent this, we opted for a more restrictive approachconsisting in distinguishing low-misalignment and high-misalignment events only, depending onwhether the misalignment exceeds its long-term average or not. Nevertheless, even with this sin-gle-criterion strategy, we end up with a very limited number of events for each of the two misalign-

Table 12Effect of interventions in the JPY/US$ market (high-misalignment events).
(1) (2) (3) (4)
(a) (b) (a) (b) (a) (b) (a) (b)
2-days horizon
H10
t-Test Mean 0.00 �0.15 0.00 �0.36 0.00 �0.62 – –p-Value 0.91 0.02 0.03 0.10 0.30 0.00
Sign test Success 25 42 7 6 4 7 – –p-Value 0.90 0.15 0.00 0.04 0.36 0.00
t-Tests Mean 0.00 �0.23 0.01 �0.64 0.01 �0.94 – –p-Value 0.54 0.02 0.00 0.06 0.05 0.01
Sign test # Success 29 37 7 6 6 8 – –p-Value 0.60 0.04 0.00 0.04 0.04 0.00
5-days horizon
H10
t-Test Mean 0.00 �0.18 0.01 �0.44 �0.01 �0.55 – –p-Value 0.41 0.01 0.05 0.02 0.94 0.06
Sign test # Success 27 40 7 7 2 6 – –p-Value 0.78 0.00 0.00 0.00 0.86 0.04
H20
t-Test Mean 0.00 �0.19 0.02 �0.62 0.00 �0.88 – –p-Value 0.18 0.03 0.00 0.21 0.07 0.07
Sign test # Success 32 39 7 6 5 6 – –p-Value 0.30 0.01 0.00 0.04 0.14 0.04
10-days horizons
H10
t-Test Mean 0.00 �0.33 0.01 �0.44 �0.01 �0.66 – –p-Value 0.38 0.00 0.15 0.02 0.85 0.28
Sign test # Success 28 44 6 7 2 6 – –p-Value 0.70 0.50 0.04 0.00 0.86 0.04
t-Test Mean 0.00 �0.40 0.02 �0.55 0.02 �1.19 – –p-Value 0.18 0.49 0.01 0.16 0.03 0.26
Sign test # Success 32 43 7 7 5 6 – –p-Value 0.30 0.22 0.00 0.00 0.14 0.04
Note: This table reports the estimation of the event study specified to determine the impact of BoJ interventions on the JPY/US$moments. Results are computed on the basis of a maximum of five days of tranquility between events. Events are of the high-misalignment type. Columns (1)–(3) respectively contain the effect of oral (61 events), public (8 events) and confirmedinterventions (8 events) on the exchange-rate level and volatility (sub-columns (a) and (b) respectively). Column (4) normallyreports results for secret interventions. These results are not reported here since only 1 event of the high-misalignment typecould be identified for secret interventions. The tests on exchange-rate moments are implemented using two alternative nullhypothesis. H1
0 holds for no change in the moments in the post-event period while H20 denotes no change in the moments
between the pre-event and post-event periods. 2-, 5- and 10-days horizons are considered. Finally, p-values are calculated usingthe bootstrapped distribution of the t-tests. Results of the non-parametric sign test are also reported.
O. Bernal, J.-Y. Gnabo / J. Japanese Int. Economies 23 (2009) 367–394 391
ment regimes considered36. As a consequence, while we are indeed able to estimate the coefficientsmeasuring the impact of the different types of interventions on the exchange rate, given the limitednumber of observations at stake, we can hardly compare the magnitude of these coefficients for the dif-ferent types of interventions. In other words, our strategy allows, at most, establishing the circumstancesin which a given type of intervention is the most efficient (i.e. in periods of high or weak misalignment)but does not allow concluding on whether one type of intervention is more efficient than another one.
Results for the refined event study (reported in Tables 12 and 13) show that the occurrence ofinterventions in periods of high misalignment relatively to the occurrence of interventions in periods
36 For the high-misalignment regime, 59, 19, 11 and 11 events could be isolated for oral, public and confirmed interventionsrespectively. The effectives are of 61, 8, 8 and 1 events in the low-misalignment regime.
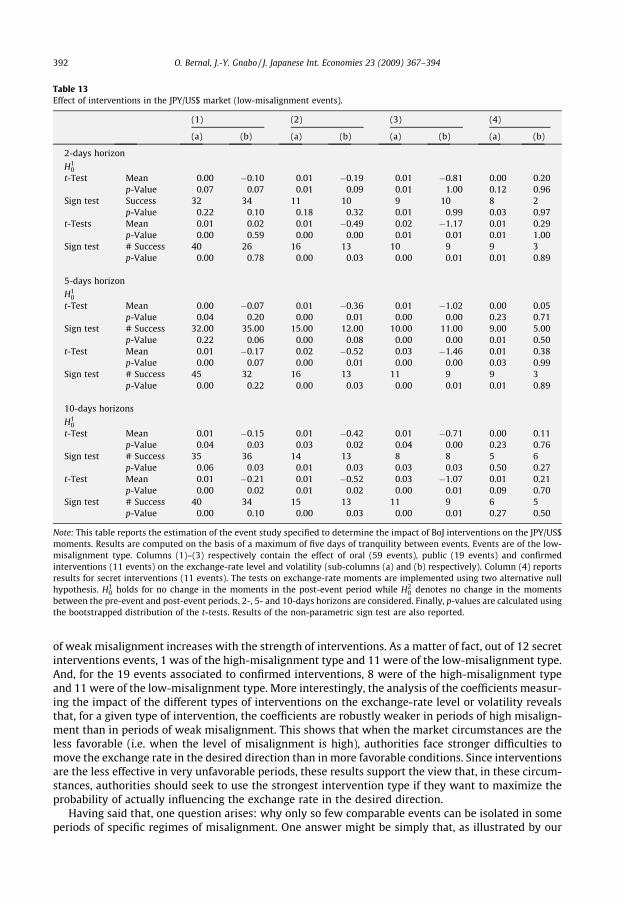
Table 13Effect of interventions in the JPY/US$ market (low-misalignment events).
(1) (2) (3) (4)
(a) (b) (a) (b) (a) (b) (a) (b)
2-days horizon
H10
t-Test Mean 0.00 �0.10 0.01 �0.19 0.01 �0.81 0.00 0.20p-Value 0.07 0.07 0.01 0.09 0.01 1.00 0.12 0.96
Sign test Success 32 34 11 10 9 10 8 2p-Value 0.22 0.10 0.18 0.32 0.01 0.99 0.03 0.97
t-Tests Mean 0.01 0.02 0.01 �0.49 0.02 �1.17 0.01 0.29p-Value 0.00 0.59 0.00 0.00 0.01 0.01 0.01 1.00
Sign test # Success 40 26 16 13 10 9 9 3p-Value 0.00 0.78 0.00 0.03 0.00 0.01 0.01 0.89
5-days horizon
H10
t-Test Mean 0.00 �0.07 0.01 �0.36 0.01 �1.02 0.00 0.05p-Value 0.04 0.20 0.00 0.01 0.00 0.00 0.23 0.71
Sign test # Success 32.00 35.00 15.00 12.00 10.00 11.00 9.00 5.00p-Value 0.22 0.06 0.00 0.08 0.00 0.00 0.01 0.50
t-Test Mean 0.01 �0.17 0.02 �0.52 0.03 �1.46 0.01 0.38p-Value 0.00 0.07 0.00 0.01 0.00 0.00 0.03 0.99
Sign test # Success 45 32 16 13 11 9 9 3p-Value 0.00 0.22 0.00 0.03 0.00 0.01 0.01 0.89
10-days horizons
H10
t-Test Mean 0.01 �0.15 0.01 �0.42 0.01 �0.71 0.00 0.11p-Value 0.04 0.03 0.03 0.02 0.04 0.00 0.23 0.76
Sign test # Success 35 36 14 13 8 8 5 6p-Value 0.06 0.03 0.01 0.03 0.03 0.03 0.50 0.27
t-Test Mean 0.01 �0.21 0.01 �0.52 0.03 �1.07 0.01 0.21p-Value 0.00 0.02 0.01 0.02 0.00 0.01 0.09 0.70
Sign test # Success 40 34 15 13 11 9 6 5p-Value 0.00 0.10 0.00 0.03 0.00 0.01 0.27 0.50
Note: This table reports the estimation of the event study specified to determine the impact of BoJ interventions on the JPY/US$moments. Results are computed on the basis of a maximum of five days of tranquility between events. Events are of the low-misalignment type. Columns (1)–(3) respectively contain the effect of oral (59 events), public (19 events) and confirmedinterventions (11 events) on the exchange-rate level and volatility (sub-columns (a) and (b) respectively). Column (4) reportsresults for secret interventions (11 events). The tests on exchange-rate moments are implemented using two alternative nullhypothesis. H1
0 holds for no change in the moments in the post-event period while H20 denotes no change in the moments
between the pre-event and post-event periods. 2-, 5- and 10-days horizons are considered. Finally, p-values are calculated usingthe bootstrapped distribution of the t-tests. Results of the non-parametric sign test are also reported.
392 O. Bernal, J.-Y. Gnabo / J. Japanese Int. Economies 23 (2009) 367–394
of weak misalignment increases with the strength of interventions. As a matter of fact, out of 12 secretinterventions events, 1 was of the high-misalignment type and 11 were of the low-misalignment type.And, for the 19 events associated to confirmed interventions, 8 were of the high-misalignment typeand 11 were of the low-misalignment type. More interestingly, the analysis of the coefficients measur-ing the impact of the different types of interventions on the exchange-rate level or volatility revealsthat, for a given type of intervention, the coefficients are robustly weaker in periods of high misalign-ment than in periods of weak misalignment. This shows that when the market circumstances are theless favorable (i.e. when the level of misalignment is high), authorities face stronger difficulties tomove the exchange rate in the desired direction than in more favorable conditions. Since interventionsare the less effective in very unfavorable periods, these results support the view that, in these circum-stances, authorities should seek to use the strongest intervention type if they want to maximize theprobability of actually influencing the exchange rate in the desired direction.
Having said that, one question arises: why only so few comparable events can be isolated in someperiods of specific regimes of misalignment. One answer might be simply that, as illustrated by our

O. Bernal, J.-Y. Gnabo / J. Japanese Int. Economies 23 (2009) 367–394 393
reaction function, interventions do not occur in the same periods (i.e. in periods displaying similar lev-els of misalignment). Then, the events that we isolate, in spite of being comparable, may just not benecessarily representative of the typical circumstances in which a given type of intervention occurs.In this respect, the fact that only one secret intervention event of the high-misalignment type couldbe found could be interpreted as authorities not executing this type of intervention in thesecircumstances.
References
Almekinders, G.-J., 1995. Foreign Exchange Intervention: Theory and Evidence. Edward Elgar Publishing Ltd., Cheltenham.Almekinders, G.J., Eijffinger, S.C.W., 1996. A friction model of daily Bundesbank and Federal Reserve intervention. J. Banking
Finance 20, 1365–1380.Andersen, T., Bollerslev, T., Diebold, F., Labys, P., 2001. The distribution of realized exchange rate volatility. J. Amer. Statistical
Assoc. 96, 42–55.Andersen, T., Bollerslev, T., Diebold, F., 2007. Roughing it up: including jump component in the measurement, modeling and
forecasting of return volatility. Rev. Econ. Statist. 89 (4), 701–720 (MIT Press).Baillie, R., Osterberg, W.P., 1997. Why do central banks intervene? J. Int. Money Finance 16 (6), 909–919.Beine, M., Bernal, O., 2007. Why do central banks intervene secretly? Preliminary evidence from the BoJ. J. Int. Finan. Markets,
Inst. Money 17 (3), 291–306.Beine, M., Laurent, S., 2003. Central bank interventions and jumps in double long memory models of daily exchange rates. J.
Empirical Finance 10 (5), 641–660.Beine, M., Lecourt, C., 2004. Reported and secret interventions in the foreign exchange markets. Finance Res. Letters 1 (4), 215–
225.Beine, M., Bénassy-Quéré, A., Lecourt, C., 2002. Central bank intervention and foreign exchange rates: new evidence from
FIGARCH estimations. J. Int. Money Finance 21 (1), 115–144.Beine, M., Laurent, S., Lecourt, C., 2003. Official central bank interventions and exchange rate volatility: evidence from a regime-
switching analysis. Europ. Econ. Rev. 47 (5), 891–911.Beine, M., Lahaye, J., Laurent, S., Neely, C., Palm, F., 2006. Central bank intervention and exchange rate volatility, its continuous
and jump components. Federal Reserve Bank of Saint Louis Working Paper No. 2006-031B.Beine, M., Janssen, G., Lecourt, C., 2009. Should central bankers talk to the FX markets? J. Int. Money Finance 28 (5), 776–803.Bénassy-Quéré, A., Duran-Vigneron, P., Lahrèche-Revil, A., Mignon, V., 2004. Burden sharing and exchange rate misalignments
within the Group of Twenty. CEPII Working Paper No. 2004-13.Bernal, O., 2006. Do interactions between political authorities and central banks influence FX interventions? Evidence from
Japan. DULBEA Working Paper No. 06-03.RS.Boes, S., Winkelmann, R., 2006. Ordered response models. Allgemeines Statistisches Arch. 90 (1), 165–180.Bonser-Neal, C., Tanner, G., 1996. Central bank intervention and the volatility of foreign exchange rates: evidence from the
options market. J. Int. Money Finance 15 (6), 853–878.Chiu, P., 2003. Transparency versus constructive ambiguity in foreign exchange intervention. BIS Working Paper No. 144.Dominguez, K., 1998. Central bank intervention and the exchange rate volatility. J. Int. Money Finance 17, 161–190.Dominguez, K., 2003. The market microstructure of central bank intervention. J. Int. Econ. 59 (1), 25–45.Dominguez, K., 2006. When do central bank intervention influence intradaily and longer-term exchange rate movements? J. Int.
Money Finance 25 (7), 1051–1071.Dominguez, K., Frankel, J.A., 1993. Does Foreign Exchange Intervention Work? Institute for International Economics,
Washington, DC.Dominguez, K., Panthaki, F., 2007. The influence of actual and unrequited interventions. Int. J. Finance Econ. 12, 171–200.Edison, H., 1993. The effectiveness of central-bank intervention: a survey of the literature after 1982. Special Papers in
International Economics, vol. 18, Princeton.Evans, M.D.D., Lyons, R.K., 2001. Portfolio balance, price impact, and secret interventions. NBER Working Paper No. 8356.Fatum, R., 2000. On the effectiveness of sterilized foreign exchange interventions. ECB Working Paper No. 10.Fatum, R., Hutchinson, M., 2003. Is sterilized foreign exchange intervention effective after all? Econ. J. 113, 390–411.Fatum, R., Hutchinson, M., 2004. Foreign exchange intervention and monetary policy in Japan, 2003–04. SSRN Working Paper
No. 642862.Fatum, R., Hutchinson, M., 2006. Effectiveness of official daily foreign exchange market intervention operations in Japan. J. Int.
Money Finance 25 (2), 199–219.Fratzscher, M., 2005. Strategies of exchange rate policy in G3 economies. Econ. Letters 89 (1), 68–74.Fratzscher, M., 2008a. Communication and exchange rate policy. J. Macroecon. 30 (4), 1651–1672.Fratzscher, M., 2008b. Oral interventions versus actual interventions in FX markets: do they matter and why? An event-study
approach. Econ. J. 118, 1–28.Frenkel, M., Pierdzioch, C., Stadtmann, G., 2004. Modelling the intensity of foreign exchange intervention activity. Econ. Letters
85 (3), 347–351.Geraats, P., 2002. Central bank transparency. Econ. J. 112, 532–565.Gnabo, J.-Y., Teiletche, J., 2009. Do central bank strategies of interventions on FX market influence market expectation? Insight
from Japan. J. Int. Finan. Markets, Inst. Money 19 (3), 432–446.Gnabo, J.-Y., Laurent, S., Lecourt, C., 2009. Does transparency in central bank intervention policy bring noise in the FX market? J.
Int. Finan. Markets, Inst. Money 19 (1), 94–111.Goodfriend, M., 1986. Monetary mystique: secrecy and central banking. J. Monet. Econ. 17 (1), 63–92.Greene, W., 2000. Econometric Analysis. Prentice-Hall Inc..Humpage, O., 2000. US intervention: assessing the probability of success. J. Money, Credit, Banking 31, 731–747.

394 O. Bernal, J.-Y. Gnabo / J. Japanese Int. Economies 23 (2009) 367–394
Hung, J., 1997. Intervention strategies and exchange rate volatility: a noise trading perspective. J. Int. Money Finance 16 (5),779–793.
Ito, T., 2003. Is foreign exchange intervention effective? The Japanese experience in the 1990’s. In: Mizen, Paul (Ed.), MonetaryHistory, Exchange Rates and Financial Markets, Essays in Honour of Charles Goodhart, vol. 2, pp. 126–153.
Ito, T., 2006. Myths and reality of foreign exchange interventions: an application to Japan. Paper presented at the Conference onExchange Rate Intervention: Theory and Practice, Cambridge.
Ito, T., Yabu, T., 2007. What prompts Japan to intervene in the Forex market? A new approach to a reaction function. J. Int.Money Finance 26 (2), 193–212.
Jansen, D., de Haan, J., 2005. Talking heads: the effects of ECB statements on the euro-dollar exchange rate. J. Int. Money Finance24 (5), 343–361.
Jansen, D.-J., de Haan, J., 2007. Were verbal efforts to support the euro effective? A high-frequency analysis of ECB statements.Europ. J. Polit. Economy 23 (1), 245–259.
Kearns, J., Rigobon, R., 2005. Identifying the efficacy of central bank interventions: evidence from Australia and Japan. J. Int.Econ. 66 (1), 31–48.
Lyons, R., 2001. The Microstructure Approach to Exchange Rates. The MIT Press.Maddala, G., 1983. Limited Dependent and Qualitative Variables in Econometrics. Econometric Society Monographs, vol. 3.
Cambridge.McKelvey, R., Zavoina, W., 1975. A statistical model for the analysis of ordinal level variables. J. Math. Sociology 4, 103–120.Morel, C., Teiletche, J., 2008. Do interventions in foreign exchange markets modify investors’ expectations? The experience of
Japan between 1992 and 2004. J. Emp. Finance 15 (2), 211–231.Mussa, M., 1981. The Role of Official Intervention. Group of Thirty Occasional Papers, 6, New York.Neely, C.J., 2005. Identifying the effects of central bank intervention. Federal Reserve Bank of Saint Louis Working Paper No.
2005-031C.Neely, C., 2008. Central bank authorities’ beliefs about foreign exchange intervention. J. Int. Money Finance 27 (1), 1–25.Oberlechner, T., Hocking, S., 2004. Information sources, news and rumors in financial markets: insights into the foreign
exchange market. J. Econ. Psych. 25 (3), 407–424.Pagan, A., 1984. Econometric issues in the analysis of regressions with generated regressors. Int. Econ. Rev. 25 (1), 221–247.Reitz, S., Taylor, M., 2006. The coordination channel of foreign exchange intervention: a nonlinear microstructural analysis.
Deutsche Bundesbank Discussion Paper No. 08/2006.Rosa, C., Verga, G., 2005. Is ECB communication effective? CEP Discussion Paper No. 0682.Sarno, L., Taylor, M., 2001. Official intervention in the foreign exchange market: is it effective and, if so, how does it work? J.
Econ. Lit. 39 (3), 839–868.Stein, J., 1989. Cheap talk and the Fed: a theory of imprecise policy announcements. Amer. Econ. Rev. 79 (1), 32–42.Train, K., 2003. Discrete Choice Methods with Simulation. Cambridge University Press.Verbeek, M., 2000. A Guide to Modern Econometrics. John Wiley & Sons Ltd..Watanabe, T., Yabu, T., 2007. The great intervention and massive money injection: the Japanese experience 2003–2004.
Hitotsubashi University Working Paper No. 12.Winkler, B., 2000. Which kind of transparency? On the need for clarity in monetary policy-making. ECB Working Paper No. 26.Wooldridge, J., 2002. Econometric Analysis of Cross Section and Panel Data. The MIT Press.