Annotating Smart Environment Sensor Data for Activity Learning
19
Annotating Smart Environment Sensor Data for Activity Learning S. Szewcyzk, K. Dwan, B. Minor, B.Swedlove, and D. Cook Washington State University Corresponding Author: Diane J. Cook School of Electrical Engineering and Computer Science Box 642752 Washington State University Pullman, WA 99163 Office: +1 509-335-4985 Fax: +1 509-335-3818 Email: [email protected] Abstract The pervasive sensing technologies found in smart homes offer unprecedented opportunities for providing health monitoring and assistance to individuals experiencing difficulties living independently at home. In order to monitor the functional health of smart home residents, we need to design technologies that recognize and track the activities that people perform at home. Machine learning techniques can perform this task, but the software algorithms rely upon large amounts of sample data that is correctly labeled with the corresponding activity. Labeling, or annotating, sensor data with the corresponding activity can be time consuming, may require input from the smart home resident, and is often inaccurate. Therefore, in this paper we investigate four alternative mechanisms for annotating sensor data with a corresponding activity label. We evaluate the alternative methods along the dimensions of annotation time, resident burden, and accuracy using sensor data collected in a real smart apartment. Keywords: activities of daily living, smart homes, activity recognition, health monitoring, machine learning, data annotation
Transcript of Annotating Smart Environment Sensor Data for Activity Learning
Annotating Smart Environment Sensor Data for Activity Learning S. Szewcyzk, K. Dwan, B. Minor, B.Swedlove, and D. Cook Washington State University Corresponding Author: Diane J. Cook School of Electrical Engineering and Computer Science Box 642752 Washington State University Pullman, WA 99163 Office: +1 509-335-4985 Fax: +1 509-335-3818 Email: [email protected]
Abstract
The pervasive sensing technologies found in smart homes offer unprecedented opportunities for
providing health monitoring and assistance to individuals experiencing difficulties living
independently at home. In order to monitor the functional health of smart home residents, we
need to design technologies that recognize and track the activities that people perform at home.
Machine learning techniques can perform this task, but the software algorithms rely upon large
amounts of sample data that is correctly labeled with the corresponding activity. Labeling, or
annotating, sensor data with the corresponding activity can be time consuming, may require
input from the smart home resident, and is often inaccurate. Therefore, in this paper we
investigate four alternative mechanisms for annotating sensor data with a corresponding activity
label. We evaluate the alternative methods along the dimensions of annotation time, resident
burden, and accuracy using sensor data collected in a real smart apartment.
Keywords: activities of daily living, smart homes, activity recognition, health monitoring,
machine learning, data annotation
1. Introduction
A convergence of technologies in machine learning and pervasive computing as well as
development of robust sensors and actuators has caused interest in the development of smart
environments to emerge. Furthermore, researchers are recognizing that smart environments can
assist with valuable functions such as remote health monitoring and intervention. The need for
development of such technologies is underscored by the aging of the population, the cost of
formal health care, and the importance that individuals place on remaining independent in their
own homes.
To function independently at home, individuals need to be able to complete Activities of
Daily Living (ADLs) [21][27] such as eating, dressing, cooking, drinking, and taking medicine.
Automating the recognition of activities is an important step toward monitoring the functional
health of a smart home resident. When surveyed about assistive technologies, family caregivers
of Alzheimer’s patients ranked activity identification and tracking at the top of their list of needs
[22]. We previously designed an activity recognition algorithm [6] that achieved good results
even when errors were present in the data. However, all of the sample data in that study had been
labeled (mapped onto the correct corresponding activity) in advance by the experimenter. The
challenge remains, then, how to efficiently and accurately annotate sensor data with the
corresponding activity. Because the user will need to process a large amount of sensor data,
efficient data annotation is necessary. Because the annotated data will be used to train a machine
learning algorithm, accurate data annotation is paramount. Individuals perform activities
differently due to physical, mental, cultural, and lifestyle differences [29], so sample data needs
to be efficiently and accurately annotated for many individuals before the learned models can
generalize well.

In this paper, we assess alternative approaches to creating labeled activity examples for
algorithms operating in smart environments. Specifically, we consider annotating raw sensor
data without any additional information, annotating raw data with resident feedback, annotating
with a visualization tool, and annotating with a visualization tool and resident feedback. We
assess each approach along multiple dimensions and evaluate the accuracy of the model that is
trained using the labeled data.
2. ADL Tracking
We treat a smart environment as an intelligent agent that perceives the state of the resident and
the physical surroundings using sensors and acts on the environment using controllers in such a
way that the specified performance measured is optimized [5]. Researchers have generated ideas
for designing smart environment software algorithms that track the location and activities of
residents, that generate reminders, and that react to hazardous situations [30].
One limiting factor of these projects is that very few of them test algorithms on data collected
from physical environments and even fewer focus on research for automated functional
assessment and intervention. Projects with physical testbeds include the MavHome project [31],
the Gator Tech Smart House [8], the iDorm [7], and the Georgia Tech Aware Home [1].
Resulting from these advances, researchers are now beginning to recognize the importance of
applying smart environment technology to health assistance [3][12][13][16][19] and companies
are recognizing the potential of this technology for a quickly-growing consumer base [10].
Activity recognition is not an untapped area of research. Because the need for activity
recognition technology is great, researchers have explored a number of approaches to this
problem. The approaches differ according to the type of sensor data that is used for

classification, the model that is designed to learn activity definitions, and the method that is used
to annotate sample data.
Sensor data. Researchers have found that different types of sensor information are effective
for classifying different types of activities. When trying to recognize actions that involve
repetitive body motions (e.g., walking, running, sitting, standing, climbing stairs), data collected
from accelerometers positioned on the body has been used [15]. In contrast, other activities are
not as easily distinguishable by body position. In these cases, researchers such as Munguia-
Tapia et al. [17] and Philipose et al. [18] observe the smart home resident’s interaction with
objects of interest such as doors, windows, refrigerators, keys, and medicine containers.
Munguia-Tapia et al. installed state-change sensors on key items to collect object interaction
data, while Philipose et al. put RFID tags on items and asked participants to wear gloves with
RFID tag readers that recorded when the individual was close to a key item. Other researchers,
including Cook and Schmitter-Edgecombe [6], rely upon motion sensors as well as item sensors
to recognize ADL activities that are being performed.
In addition, some researchers such as Brdiczka et al. [4] video tape smart home residents and
process the video to recognize activities. While individuals have traditionally been resistant to
at-home video monitoring [9], the acceptance of this technology in the home is increasing. On
the other hand, processing the video is very computationally expensive and relies upon first
tracking the resident before the correct video data can be captured and analyzed [25]. Because
the individuals in our on-campus dementia support group are reluctant to allow video data or to
wear sensors, our data collection has consisted solely of passive sensors that could be installed in
a smart environment (as described further in Section 3).

Activity models. The number of machine learning models that have been used for activity
recognition varies almost as greatly as the types of sensor data that have been tested. Naïve
Bayes classifiers have been use with promising results for activity recognition [4][6][17][26].
Naïve Bayes classifiers identify the activity that corresponds with the greatest probability to the
set of sensor values that were observed. These classifiers assume that the features are
conditionally independent. However, when large amounts of sample data are provided the
classifiers yield good accuracy despite this assumption. Other researchers, including Maurer et
al. [15], have employed decision trees to learn logical descriptions of the activities. This
approach offers the advantage of generating rules that are understandable by the user, but it is
often brittle when high precision numeric data is collected. An alternative approach that has
been explored by other researchers is to encode the probabilistic sequence of sensor events using
Markov models, dynamic Bayes networks, and conditional random fields [6][14][18][23]. In our
experiments we initially tested a naïve Bayes classifier for activity recognition because of the
model simplicity and because a large amount of sample data is available for these experiments.
Annotation methods. An aspect of activity recognition that has been greatly under-explored is
the method used to annotate sample data that the scientist can use to train the activity model.
Most of the researchers have published results of experiments in which the participants are
required to manually note each activity they perform at the time they perform it [14][17][18]. In
other cases, the experimenters told the participants in which order specified activities should be
performed, so the correct activity labels were identified before the sensor data was even collected
[6][15]. In one case, the experimenter manually inspected the raw sensor data in order to
annotate it with a corresponding activity label [30]. None of these approaches are practical for all
situations. When activity monitoring is used for older adults with dementia, the resident cannot
reasonably be expected to remember which activities they performed, let alone regularly and
accurately record the correct activity labels and times. Hand labeling from raw sensor data is
very time consuming and therefore may not be the best approach either.
Evaluating the ease, efficiency, and accuracy of activity labeling is the focus of this paper. To
date, little attention has been given to determine how the sample data can be accurately annotated
with minimal effort on the part of the data engineer or the resident. In order to achieve the goal
of making smart environment-based health monitoring a practical reality, we need to carefully
consider alternatives for addressing this problem.
3. Data Collection
The testbed that we are using to validate our algorithms is a three-bedroom apartment located on
the Washington State University campus that is part of the ongoing CASAS smart home project
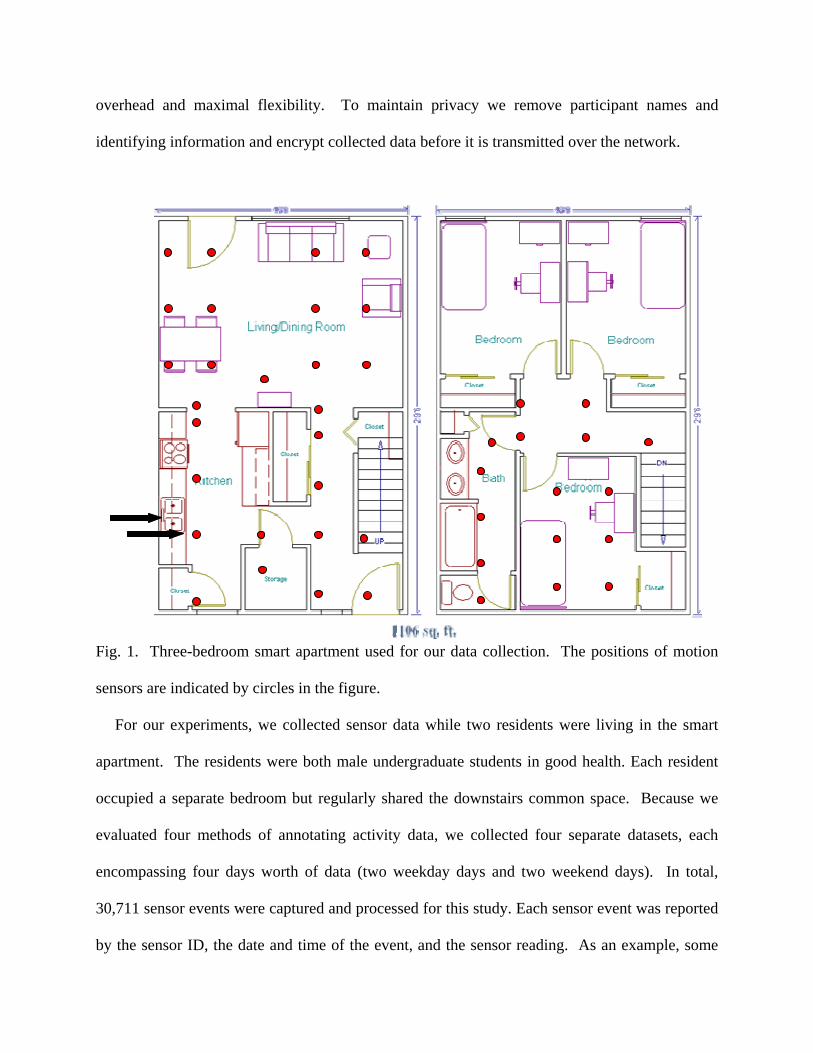
at WSU [20]. As shown in Fig. 1, the smart apartment testbed includes three bedrooms, one
bathroom, a kitchen, and a living / dining room. The apartment is equipped with Insteon motion
sensors distributed approximately 1 meter apart throughout the space. In addition, we have
installed Insteon sensors to provide ambient temperature readings, and custom-built analog
sensors to provide readings for hot water, cold water, and stove burner use. Voice over IP using
the Asterisk software [2] captures phone usage and we use Insteon contact switch sensors to
monitor usage of the phone book, a cooking pot, the medicine container, and key cooking
ingredients in the apartment. Sensor data is captured using a sensor network that was designed
in-house and is stored in a SQL database. Our middleware uses a jabber-based publish/subscribe
protocol [11] as a lightweight platform and language-independent method to push data to client
tools (e.g., the visualization, data mining and activity recognition algorithms) with minimal
overhead and maximal flexibility. To maintain privacy we remove participant names and
identifying information and encrypt collected data before it is transmitted over the network.
Fig. 1. Three-bedroom smart apartment used for our data collection. The positions of motion
sensors are indicated by circles in the figure.
For our experiments, we collected sensor data while two residents were living in the smart
apartment. The residents were both male undergraduate students in good health. Each resident
occupied a separate bedroom but regularly shared the downstairs common space. Because we
evaluated four methods of annotating activity data, we collected four separate datasets, each
encompassing four days worth of data (two weekday days and two weekend days). In total,
30,711 sensor events were captured and processed for this study. Each sensor event was reported
by the sensor ID, the date and time of the event, and the sensor reading. As an example, some
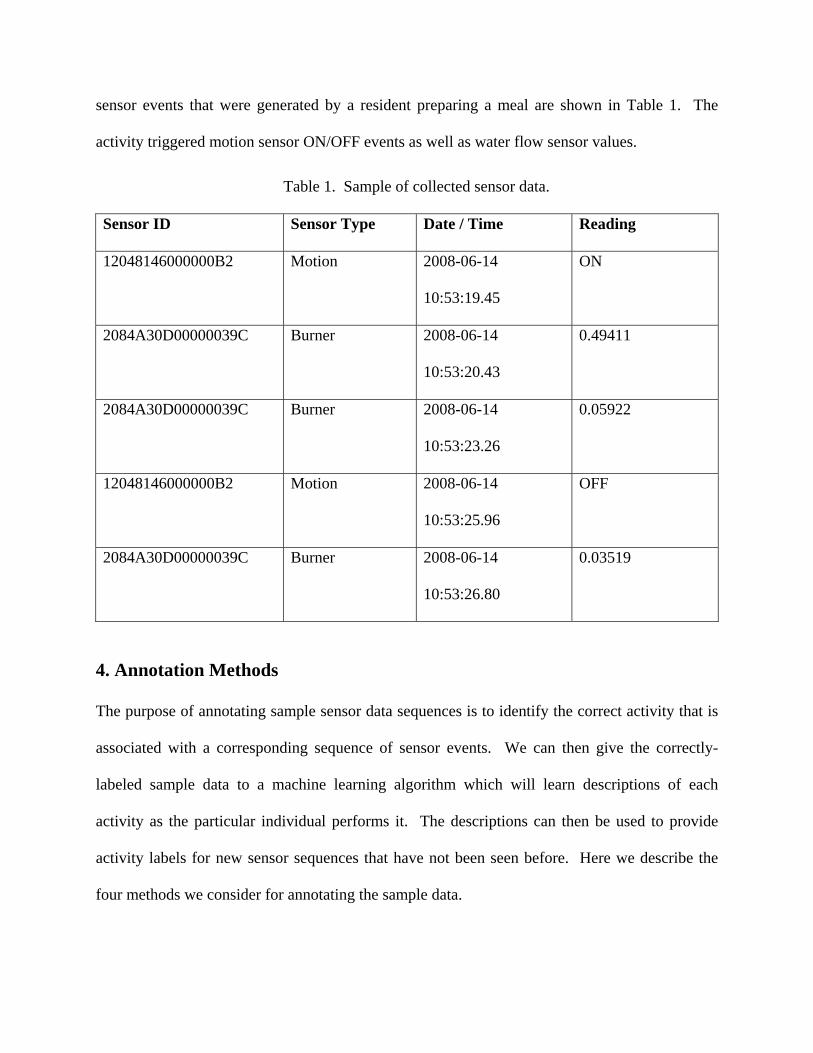
sensor events that were generated by a resident preparing a meal are shown in Table 1. The
activity triggered motion sensor ON/OFF events as well as water flow sensor values.
Table 1. Sample of collected sensor data.
Sensor ID Sensor Type Date / Time Reading
12048146000000B2 Motion 2008-06-14
10:53:19.45
ON
2084A30D00000039C Burner 2008-06-14
10:53:20.43
0.49411
2084A30D00000039C Burner 2008-06-14
10:53:23.26
0.05922
12048146000000B2 Motion 2008-06-14
10:53:25.96
OFF
2084A30D00000039C Burner 2008-06-14
10:53:26.80
0.03519
4. Annotation Methods
The purpose of annotating sample sensor data sequences is to identify the correct activity that is
associated with a corresponding sequence of sensor events. We can then give the correctly-
labeled sample data to a machine learning algorithm which will learn descriptions of each
activity as the particular individual performs it. The descriptions can then be used to provide
activity labels for new sensor sequences that have not been seen before. Here we describe the
four methods we consider for annotating the sample data.
4.1. Method 1: Raw Data Only
For our first method, we used the raw data together with a map of the sensors in the apartment
(shown in Fig. 1) to identify the activities that are being performed. To aid with the analysis we
wrote code that identified when the residents transitioned to the downstairs or upstairs of the
apartment. This tool helped us to track the residents but not to recognize their activities. For
example, the sensor data in Table 1 corresponded to a trigger of the motion sensor and water
sensor. The location of the water sensor is indicated by the top arrow and the location of the
motion sensor is indicated by the bottom arrow in Fig. 1. Based on the time of day and this
sensor information the annotators inferred that the resident was preparing a meal at this time.
4.2. Method 2: Raw Data + Resident Time Diaries
For the next method we asked the two residents to provide time diaries. These diaries reported
on the resident activities inside the apartment every half hour from when they woke up until the
time they went to sleep. While asking residents to complete time diaries makes this approach
more invasive, it is less invasive and simpler than the approach used by others [17]. The diary is
paper-and-pen based and requires little time on the part of the residents. For this reason it could
potentially be useful for an older demographic who may be unfamiliar with alternative PDA-
based approaches. Our participants faithfully reported their activities for the duration of the
study. However, the adherence of older adults to self-reports may not always be reliable.
4.3. Methods 3 and 4: Visualization of Sensor Data
For Methods 3 (use visualization tool) and 4 (use visualization tool and resident feedback) we
made use of an open source 3D environment to visualization the sensor events. Almost all
pervasive computing applications generate large amounts of sensor data. Without tools to
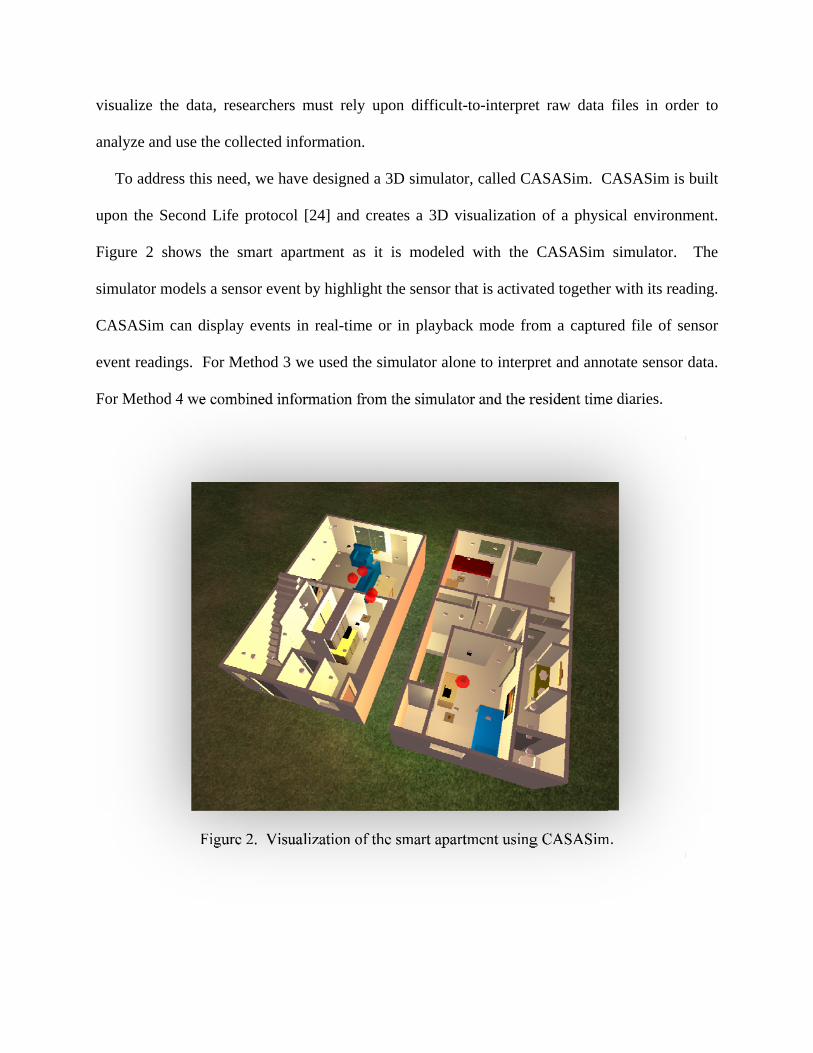
visualize
analyze a
To ad
upon the
Figure 2
simulator
CASASim
event rea
For Meth
e the data, r
and use the c
ddress this ne
e Second Lif
2 shows the
r models a s
m can displ
adings. For
hod 4 we com
Figu
researchers m
collected info
eed, we have
fe protocol
e smart apar
ensor event
lay events in
Method 3 w
mbined infor
ure 2. Visual
must rely up
formation.
e designed a
[24] and cre
rtment as it
by highlight
n real-time o
we used the s
rmation from
lization of th
pon difficul
a 3D simulat
eates a 3D v
t is modele
t the sensor t
or in playba
simulator alo
m the simula
he smart apa
lt-to-interpre
or, called CA
visualization
d with the
that is activa
ack mode fro
one to interp
ator and the r
artment using
et raw data
ASASim. C
n of a physi
CASASim
ated together
om a captur
pret and anno
resident time
g CASASim
files in ord
CASASim is
ical environm
simulator.
r with its rea
red file of se
otate sensor
e diaries.
m.
der to
built
ment.
The
ading.
ensor
data.
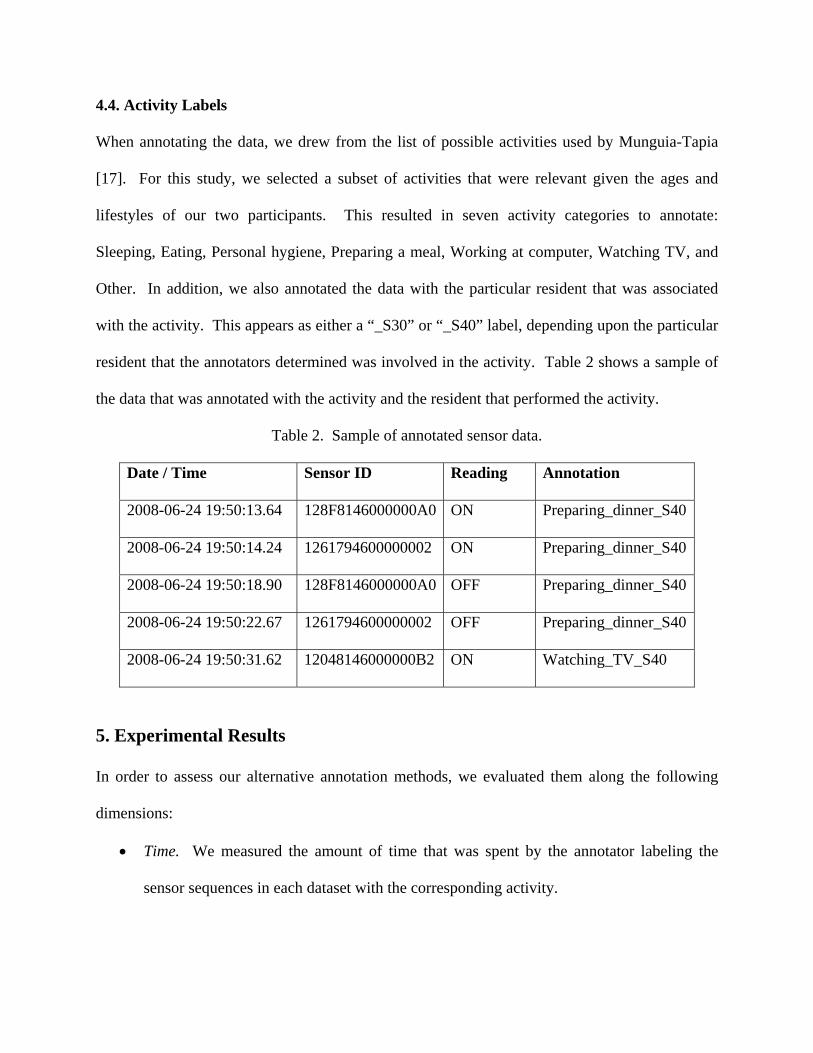
4.4. Activity Labels
When annotating the data, we drew from the list of possible activities used by Munguia-Tapia
[17]. For this study, we selected a subset of activities that were relevant given the ages and
lifestyles of our two participants. This resulted in seven activity categories to annotate:
Sleeping, Eating, Personal hygiene, Preparing a meal, Working at computer, Watching TV, and
Other. In addition, we also annotated the data with the particular resident that was associated
with the activity. This appears as either a “_S30” or “_S40” label, depending upon the particular
resident that the annotators determined was involved in the activity. Table 2 shows a sample of
the data that was annotated with the activity and the resident that performed the activity.
Table 2. Sample of annotated sensor data.
Date / Time Sensor ID Reading Annotation
2008-06-24 19:50:13.64 128F8146000000A0 ON Preparing_dinner_S40
2008-06-24 19:50:14.24 1261794600000002 ON Preparing_dinner_S40
2008-06-24 19:50:18.90 128F8146000000A0 OFF Preparing_dinner_S40
2008-06-24 19:50:22.67 1261794600000002 OFF Preparing_dinner_S40
2008-06-24 19:50:31.62 12048146000000B2 ON Watching_TV_S40
5. Experimental Results
In order to assess our alternative annotation methods, we evaluated them along the following
dimensions:
• Time. We measured the amount of time that was spent by the annotator labeling the
sensor sequences in each dataset with the corresponding activity.
• Invasiveness. This is a qualitative assessment of how disruptive the data collection and
annotation method was to the residents combined with how the method may be perceived
as affecting the privacy of the residents. A highly-invasive approach may also require
too much interaction on the part of the resident, which is not practical for residents who
suffer from dementia or other related conditions.
• Activity recognition accuracy. Our assessment of the accuracy of the labels involved
actually using the labeled data to learn models of the activities. Specifically, we fed the
sensor data into the Weka [28] implementation of a naïve Bayesian classifier and
computed the accuracy of the learned models using 10-fold cross validation.
Using the sensor data to learn activity models required a number of design decisions to be
made. First, since the data was not segmented into separate sequences for each activity (it was
processed as one continuous stream), we moved a fixed-time size window over the data and
include sensor events within the window when we label the current activity. The size of the
window affects the accuracy – too large of a window will likely include sensor events from a
different activity, while too small of a window will not provide sufficient data to the machine
learning algorithm. We experimented with models that used window sizes of 2, 5, 10, 20, 30, 45,
and 60 seconds. Of these choices, the 10 second and 20 second windows consistently achieved
the greatest model accuracy. We used the 10 second window for the remainder of the
experiments because of the expected accuracy and lesser amount of data to process at each point.
Second, the features needed to be selected for the classifier. For this classification task, we
defined the state of the world as a description of which sensors were on and which were off at
the current time. Finally, we added timing information for the sensor event, which was
discretized into the ranges of “morning”, “afternoon”, “evening”, and “night”. For this
assessment we disregarded the resident labels and focused on accurately classifying the current
activity.
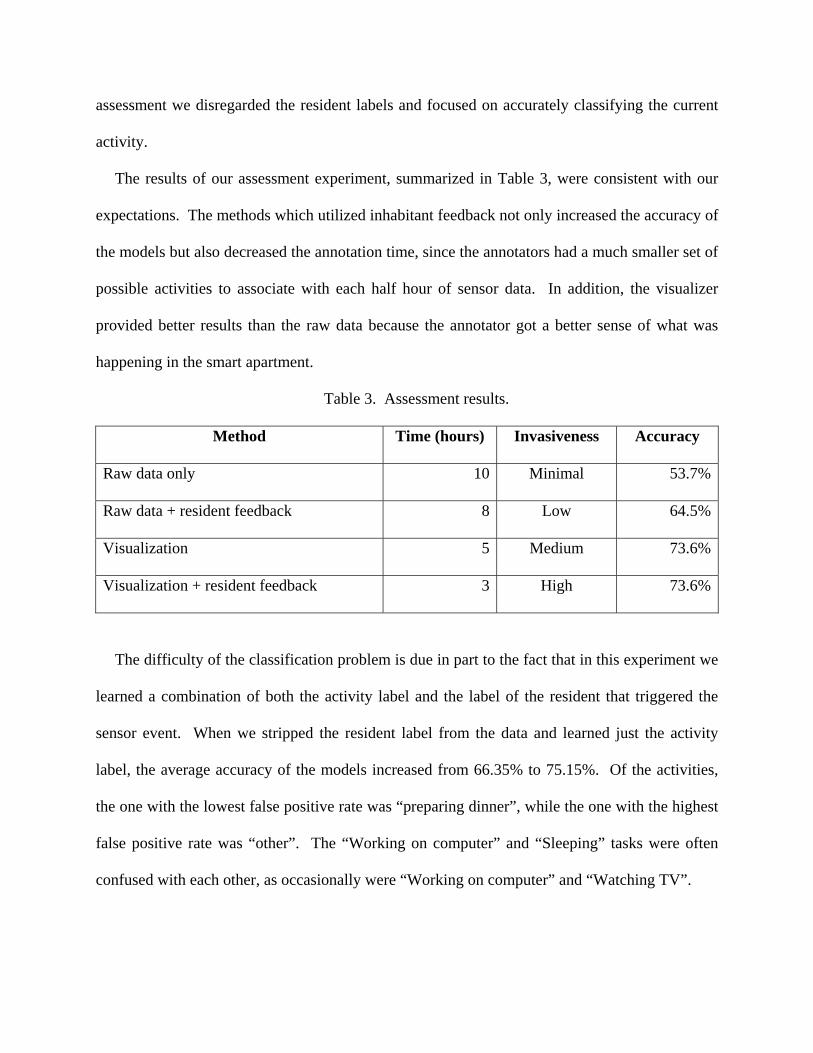
The results of our assessment experiment, summarized in Table 3, were consistent with our
expectations. The methods which utilized inhabitant feedback not only increased the accuracy of
the models but also decreased the annotation time, since the annotators had a much smaller set of
possible activities to associate with each half hour of sensor data. In addition, the visualizer
provided better results than the raw data because the annotator got a better sense of what was
happening in the smart apartment.
Table 3. Assessment results.
Method Time (hours) Invasiveness Accuracy
Raw data only 10 Minimal 53.7%
Raw data + resident feedback 8 Low 64.5%
Visualization 5 Medium 73.6%
Visualization + resident feedback 3 High 73.6%
The difficulty of the classification problem is due in part to the fact that in this experiment we
learned a combination of both the activity label and the label of the resident that triggered the
sensor event. When we stripped the resident label from the data and learned just the activity
label, the average accuracy of the models increased from 66.35% to 75.15%. Of the activities,
the one with the lowest false positive rate was “preparing dinner”, while the one with the highest
false positive rate was “other”. The “Working on computer” and “Sleeping” tasks were often
confused with each other, as occasionally were “Working on computer” and “Watching TV”.

6. Discussion
The models achieved high accuracy, particularly considering the fact that the environment
housed multiple residents. In contrast, random guessing of the activity would yield 14%
accuracy on average (assuming an equal number of sensor events for each activity). Because
there were a large number of activity/resident combinations to learn, we expect that the accuracy
would be higher if more sample data were available for each annotation method.
These results might be improved further if we consider alternative representation and learning
techniques such as Markov models. Because some of the activities such as “Sleeping” and
“Working on computer” occurred in the same part of the apartment, the number times a
particular motion sensor would be activated for these activities will be similar. While a naïve
Bayes classifier considers only the number of occurrences of each sensor event, a Markov model
will also consider the ordering of the sensor events when determining the likelihood that the
sensor belongs to a particular activity. As a result, we expect that this approach would yield
better results for some of the activity classes.
Note that in this study we do not evaluate the accuracy of each annotation. Instead, we
evaluate the accuracy of the model that is built using the annotated data. This allows us to
determine how consistently the data was annotated with a corresponding activity label. Because
different individuals perform activities in different manners, such consistency will be important
when we track the activities that need to be performed by that particular individual.
7. Conclusions
In order to provide robust activity recognition and tracking capabilities for smart home residents,
researchers need to consider appropriate methods for annotating sample data. In this work we
assess four alternative methods for collecting and annotating sensor data collected in a smart
environment with the corresponding activity label. We found that while inhabitant feedback
does decrease annotation time and improve performance, it does so at the cost of some time on
the part of the resident.
The visualizer improves both time and performance. However, there are issues to consider
when using a visualizer. First, a model needs to be constructed for each new space. This took
several weeks for this experiment because the simulator was new, but we except that models for
additional spaces would take 1-2 days to complete. Second, we need to refine the simulator to be
more robust. Because the Second Life server is currently under development, it frequently
crashed while we were using it. As the server improves we expect that the annotation process
will be even more efficient.
Ultimately, we want to use our algorithm design as a component of a complete system that
performs functional assessment of adults in their everyday environments. This type of automated
assessment also provides a mechanism for evaluating the effectiveness of alternative health
interventions. We believe these activity profiling technologies are valuable for providing
automated health monitoring and assistance in an individual’s everyday environments.
References
[1] G. Abowd and E. Mynatt. Designing for the human experience in smart environments. In
D. Cook and S. Das, editors, Smart Environments: Technology, Protocols, and
Applications, Wiley, 2004, pp. 153-174.
[2] Asteriskguru.com, www.asteriskguru.com/tutorials/.
[3] T. Barger, D. Brown, and M. Alwan. Health status monitoring through analysis of
behavioral patterns. IEEE Transactions on Systems, Man, and Cybernetics, Part A,
35(2005), 22-27.

[4] O. Brdiczka, P. Reignier, and J. Crowley. Detecting individual activities from video in a
smart home. Proceedings of the International Conference on Knowledge-Based and
Intelligent Information and Engineering Systems, 2007, pp. 363-370.
[5] D. Cook and. S. Das, editors. Smart Environments: Technology, Protocols, and
Applications. Wiley, 2004.
[6] D. Cook and M. Schmitter-Edgecombe. Activity profiling using pervasive sensing in
smart homes. IEEE Transactions on Information Technology in BioMedicine, under
review.
[7] F. Doctor, H. Hagras, and V. Callaghan. A fuzzy embedded agent-based approach for
realizing ambient intelligence in intelligent inhabited environments. IEEE Transactions
on Systems, Man, and Cybernetics, Part A, 35(2005), 55-56.
[8] A. Helal, W. Mann, H. El-Zabadani, J. King, Y. Kaddoura, and E. Jansen. The Gator
Tech smart house: A programmable pervasive space. IEEE Computer, 38(2005), 50-60.
[9] B.K. Hensel, G. Demiris, and K.L. Courtney. Defining obtrusiveness in home telehealth
technologies: A conceptual framework. Journal of the American Medical Informatics
Association, 13(2006), 428-431.
[10] Intel Proactive Health, http://www.intel.com/research/prohealth/cs-
aging_in_place.htm, 2007.
[11] Jabber.org. Open instant messaging and presence. http://www.jabber.org, 2008.
[12] H. Kautz, L. Arnstein, G. Borriello, O. Etzioni, and D. Fox. An overview of the
assisted cognition project. Proceedings of the AAAI Workshop on Automation as
Caregiver: The Role of Intelligent Technology in Elder Care, 2002, pp. 60-65.
[13] C. Larson. In elder care, signing on becomes a way to drop by. The New York
Times, February 4, 2007.
[14] L. Liao, D. Fox, and H. Kautz. Location-based activity recognition using
relational Markov networks. Proceedings of the International Joint Conference on
Artificial Intelligence, 2005, pp. 773-778.
[15] U. Maurer, A. Smailagic, D. Siewiorek, and M. Deisher. Activity recognition and
monitoring using multiple sensors on different body positions. Proceedings of the
International Workshop on Wearable and Implantable Body Sensor Networks, 2006, pp.
99-102.
[16] A. Mihailidis, J. Barbenl, and G. Fernie. The efficacy of an intelligent cognitive
orthosis to facilitate handwashing by persons with moderate-to-severe dementia.
Neuropsychological Rehabilitation, 14(2004), 135-171.
[17] E. Munguia-Tapia, S.S. Intille, and K. Larson. Activity recognition in the home
using simple and ubiquitous sensors. Proceedings of PERVASIVE, 2004, pp. 158-175.
[18] M. Philipose, K. Fishkin, M. Perkowitz, D. Patterson, D. Fox, H. Kautz, and D.
Hahnel. Inferring activities from interactions with objects. IEEE Pervasive Computing,
3(2004), 50-57.
[19] M. Pollack. Intelligent technology for an aging population: The use of AI to assist
elders with cognitive impairment. AI Magazine, 26(2005), 9-24.
[20] P. Rashidi, G.M. Youngblood, D. Cook, and S. Das. Inhabitant guidance of smart
environments. Proceedings of the International Conference on Human-Computer
Interaction, 2007, pp. 910-919.
[21] B. Reisberg, et al. The Alzheimer’s disease activities of daily living international
scale (ASL-IS). International Psychogeriatrics, 13 (2001), 163-181.
[22] V. Rialle, C. Ollivet, C. Guigui, and C. Herve. What do family caregivers of
Alzheimer’s disease patients desire in smart home technologies? Methods of Information
in Medicine, 47(2008), 63-69.
[23] D. Sanchez, M. Tentori, and J. Favela. Activity recognition for the smart hospital.
IEEE Intelligent Systems, 23(2008), 50-57.
[24] Second Life. Linden Research, Inc. http://secondlife.com.
[25] C. Stauffer and E. Grimson. Learning patterns of activity using real-time tracking.
IEEE Transactions on Pattern Analysis and Machine Intelligence, 22(8):747-757, 2000.
[26] T. van Kasteren and B. Kröse. Bayesian activity recognition in residence for
elders. Proceedings of the International Conference on Intelligent Environments, 2008.
[27] V. Wadley, O. Okonkwo, M. Crowe, and L. A. Ross-Meadows. Mild Cognitive
Impairment and everyday function: Evidence of reduced speed in performing
instrumental activities of daily living. American Journal of Geriatric Psychiatry,
16(2007), 416-424.
[28] I. Witten and E. Frank. Data mining: Practical Machine Learning Tools and
Techniques. Morgan Kaufmann, 2005.
[29] R. Wray and J.E. Laird. Variability in human modeling of military simulations.
Proceedings of the Behaviour Representation in Modeling and Simulation Conference,
2003, 160-169.
[30] C. Wren and E. Munguia-Tapia. Toward scalable activity recognition for sensor
networks, Proceedings of the Workshop on Location and Context-Awareness, 2006, 218-
235.
[31] G. M. Youngblood and D. Cook. Data mining for hierarchical model creation.
IEEE Transactions on Systems, Man, and Cybernetics, Part C, 37(2007), 1-12.