Annex G. Summary of the Early Grade Reading Materials ...
20
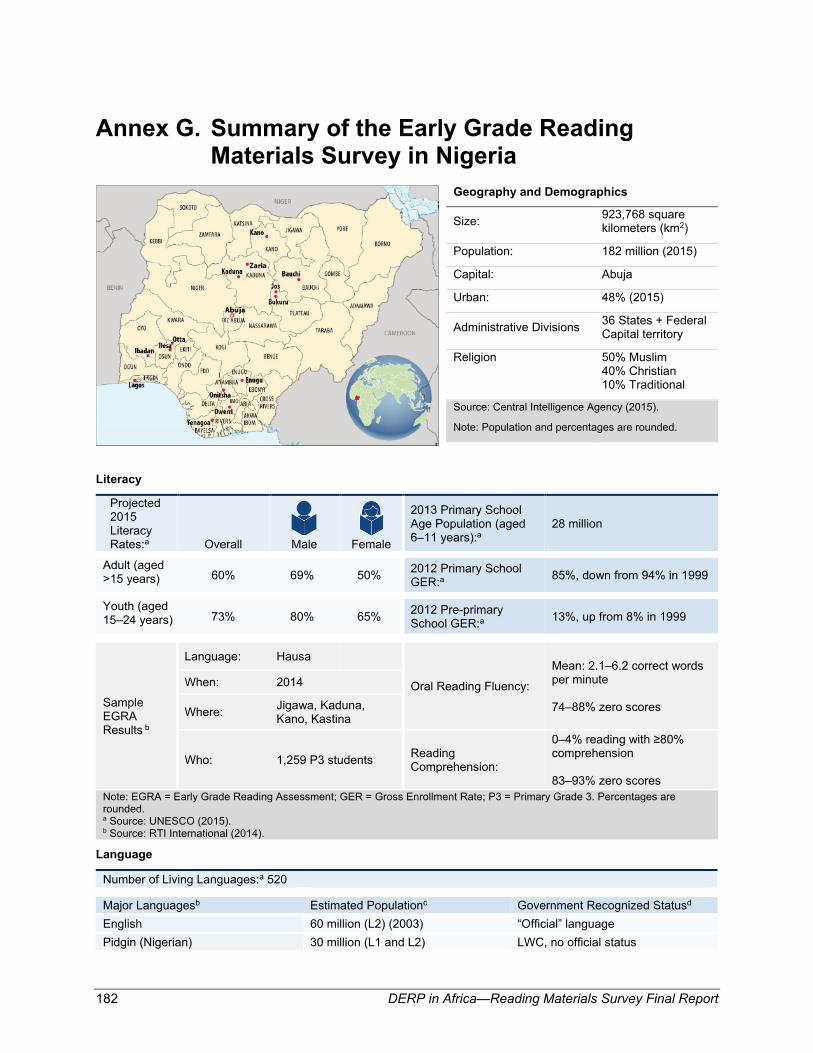
182 DERP in Africa—Reading Materials Survey Final Report Annex G. Summary of the Early Grade Reading Materials Survey in Nigeria Geography and Demographics Size: 923,768 square kilometers (km 2 ) Population: 182 million (2015) Capital: Abuja Urban: 48% (2015) Administrative Divisions 36 States + Federal Capital territory Religion 50% Muslim 40% Christian 10% Traditional Source: Central Intelligence Agency (2015). Note: Population and percentages are rounded. Literacy Projected 2015 Literacy Rates: a Overall Male Female 2013 Primary School Age Population (aged 6–11 years): a 28 million Adult (aged >15 years) 60% 69% 50% 2012 Primary School GER: a 85%, down from 94% in 1999 Youth (aged 15–24 years) 73% 80% 65% 2012 Pre-primary School GER: a 13%, up from 8% in 1999 Sample EGRA Results b Language: Hausa Oral Reading Fluency: Mean: 2.1–6.2 correct words per minute 74–88% zero scores When: 2014 Where: Jigawa, Kaduna, Kano, Kastina Who: 1,259 P3 students Reading Comprehension: 0–4% reading with ≥80% comprehension 83–93% zero scores Note: EGRA = Early Grade Reading Assessment; GER = Gross Enrollment Rate; P3 = Primary Grade 3. Percentages are rounded. a Source: UNESCO (2015). b Source: RTI International (2014). Language Number of Living Languages: a 520 Major Languages b Estimated Population c Government Recognized Status d English 60 million (L2) (2003) “Official” language Pidgin (Nigerian) 30 million (L1 and L2) LWC, no official status
Transcript of Annex G. Summary of the Early Grade Reading Materials ...
182 DERP in Africa—Reading Materials Survey Final Report
Annex G. Summary of the Early Grade Reading
Materials Survey in Nigeria
Geography and Demographics
Size: 923,768 square kilometers (km2)
Population: 182 million (2015)
Capital: Abuja
Urban: 48% (2015)
Administrative Divisions 36 States + Federal Capital territory
Religion 50% Muslim 40% Christian 10% Traditional
Source: Central Intelligence Agency (2015).
Note: Population and percentages are rounded.
Literacy
Projected 2015 Literacy Rates:a
Overall
Male
Female
2013 Primary School Age Population (aged 6–11 years):a
28 million
Adult (aged >15 years) 60% 69% 50% 2012 Primary School
GER:a 85%, down from 94% in 1999
Youth (aged 15–24 years) 73% 80% 65% 2012 Pre-primary
School GER:a 13%, up from 8% in 1999
Sample EGRA Results b
Language: Hausa
Oral Reading Fluency:
Mean: 2.1–6.2 correct words per minute 74–88% zero scores
When: 2014
Where: Jigawa, Kaduna, Kano, Kastina
Who: 1,259 P3 students Reading Comprehension:
0–4% reading with ≥80% comprehension 83–93% zero scores
Note: EGRA = Early Grade Reading Assessment; GER = Gross Enrollment Rate; P3 = Primary Grade 3. Percentages are rounded. a Source: UNESCO (2015). b Source: RTI International (2014).
Language
Number of Living Languages:a 520
Major Languagesb Estimated Populationc Government Recognized Statusd
English 60 million (L2) (2003) “Official” language Pidgin (Nigerian) 30 million (L1 and L2) LWC, no official status
DERP in Africa—Reading Materials Survey Final Report 183
Hausa 18,500,000 (L1) (1991) 15,000,000 (L2) “National” language; LWC
Yoruba 18,900,000 (L1) (1993) 2,000,000 (L2) “National” language; LWC
Igbo 18,000,000 (L1) (1999) “National” language; LWC Fulfulde (Central Nigerian) 11,500,000 (2000) Regional language Fulfulde (Adamawa) 7,610,000 (1991) Regional language
Ibibio 1,500,000 (L1) (1998) 4,500,000 (L2) (2013) Regional language
Kanuri (Central) 3,000,000 (L1) (1985) 500,000 (L2) Regional language
Tiv 2,210,000 (L1) (1991) Regional language
Efik 400,000 (L1) (1998) 2,000,000 (L2) Regional language
Ijawe 1,770,000 (L1) Regional language Anaang 1,400,000 (L1) (1991) Regional language Ebira 1,000,000 (L1) (1989) Regional language
Nupe-Nupe-Tako 800,000 (L1) (1990) 200,000 (L2) (1999) Regional language
Note. L1 = first language; L2 = second language; LWC = language of wider communication. a Source: Lewis et al. (2015). b Most languages go by several different names; several languages have the same name. In case of confusion, refer to the Ethnologue at www.ethnologue.com (Lewis et al., 2015). Language/dialect distinctions that have been assigned separate International Organization for Standardization (ISO) 639-3 codes are provided in parentheses. c Source: Lewis et al. (2015). The dates for the speaker population estimates vary by language and are provided (when available) in parentheses. d Sources: Adegbija (2004) and Article 55, Section 5 of the Nigerian Constitution. e Listed as Izon in Lewis et al. (2015) and includes approximately 30 mutually intelligible dialects.
1. Language in Education Policy in Nigeria English is the official language in Nigeria, with three large languages of wider communication (i.e., Hausa, Igbo, and Yoruba) sharing special status as “national” languages (Adegbija, 2004; Article 55, Section 5 of the Nigerian Constitution). Nigeria has had a progressive, pro-mother tongue policy for many years. Adopted in 1977 (and later revised in 1981 and 1985), the National Policy on Education stipulates that the language of instruction (LOI) at the pre-primary and early primary level should be the “mother tongue or the language of the immediate environment,” with an eventual transition to English. At the secondary school level, English is
Nigeria Findings in Brief:
Nigeria is the most densely multilingual country in Africa. For decades, Nigeria has had an official language in education policy supportive of Nigerian languages as the medium of instruction at the primary level, but implementation lags far behind policy. The study surveyed 364 titles, of which most were textbooks published in “the big three” national languages (i.e., Igbo, Yoruba, and Hausa) by private-sector commercial publishers. Textbook titles outnumbered teacher’s guides by a ratio of 31:1. Supplementary reading materials were and tended to be written at a level too difficult for beginning readers. However, the content that does exist appears, for the most part, to be culturally familiar, appropriate, and not obviously biased in terms of gender, ethnicity, or religion.
184 DERP in Africa—Reading Materials Survey Final Report
the LOI, but each child must also study a Nigerian language as a subject to promote national unity. Every student who completes the Nigerian certificate exam at the end of secondary school (i.e., the West African Examination Council [WAEC]) is required to pass an exam in at least one Nigerian language.1
The adoption of this language in education policy was influenced in part by the Six-Year Primary Project in Ile-Ife (Osun State), a large-scale experiment in the 1970s that employed Yoruba as the medium of instruction for all six years of primary school, transitioning to English in secondary school (Adegbija, 2004). The results of extensive evaluations of the project showed that the treatment groups (i.e., those students receiving instruction in Yoruba [their first language]) significantly outperformed the control groups academically, at least in the short term.
In addition, in 1970, the Rivers State Government initiated the Rivers Readers Project (RRP) to produce readers and supporting materials for use in primary schools in as many as possible of the 34 local languages of the state, so that children could initially learn to read in their first language. The components of the project were orthography development, curricula development, the writing and dissemination of language books, and training of language teachers to use the materials in schools. By 1990, 61 books, including primers, supplementary texts, teacher’s guides, and dictionaries, were available in 21 languages (Adegbija, 2004), though a contact from the RRP indicated that the project is currently hampered by a lack of funds.
Otherwise, since the 1970s, there has been minimal apparent movement from policy articulation to implementation. Some states, including Osun, Oyo, Rivers, Imo, and more recently Bayelsa, have attempted to promote the use of Nigerian languages as LOI. The Language Development Center of the Nigerian Educational Research and Development Council, which is responsible for coordinating and implementing language issues in the education sector, developed orthographies for 43 Nigerian languages and partnered with the Rivers State Government to develop an additional 15 orthographies.2 However, according to a United Nations Educational, Scientific, and Cultural Organization (UNESCO) report about the problems of the national education system in Nigeria, few languages are used as the LOI in the formal primary education sector (Adeniyi, 2003). For example, a 2012 study of Primary Grades 1 through 3 classes in 12 primary schools in Lagos State found that 85 percent to 94 percent of science lessons were orally delivered in the first language in the rural schools, and 27 percent to 62 percent in the urban schools, but the study did not specify whether this oral instruction was accompanied by reading or writing in the first language as well (Okebukola et al., 2012). However, a 2011 random sampling of 720 schools (442 urban and 278 rural) from all 36 states revealed that, contrary to the policy, English was most widely used as the LOI in pre-primary and Primary Grades 1
1 WAEC’s Web site (http://www.waecnigeria.org) mentions only “a Nigerian language,” not necessarily one of the so-called “big three” national languages. However, for a long time, the exam offerings have been limited to the big three languages, and, therefore, those are the options offered most often in the secondary schools. Some states offer other options in some of their schools, such as the Efik and Urhobo languages in Cross Rivers and Delta States; however, this is relatively rare. 2 The Language Development Center was contacted and visited during the course of the fieldwork, but copies of any of the materials reportedly published were not available.

DERP in Africa—Reading Materials Survey Final Report 185
through 6 and that there was no significant difference between urban versus rural schools (Duze, 2011). The study also revealed that written materials supporting instruction in Nigerian languages were not available in schools and that the teachers were not trained to teach in them. The study cited the major constraints to implementing the language policy as inadequate funding; a lack of buy-in by students, parents, and teachers; and a lack of textbooks, teaching aids, and pre- and in-service teacher training.
In short, it appears that, contrary to the official policy, in practice, the “mother tongue or the language of the immediate environment” is rarely used as the LOI in both oral and written communication at the pre-primary and early primary levels.
2. Data Collection The fieldwork in Nigeria took data collectors to the cities of Bauchi, Bukuru, Jos, Kaduna, Kano, and Zaria in the North; Enugu, Onitsha, Owerri, and Yenagoa in the Southeast and South-South; and Ibadan, Ilesha, Lagos, and Otta in the Southwest. The data collectors surveyed 364 titles, including 76 (21 percent) from the North, 108 (30 percent) from the Southwest, and 134 (37 percent) from the Southeast and South-South. The largest number of titles came from publishers (150 [41 percent]) and bookshops (131 [36 percent]).
The data collectors encountered a few challenges in obtaining materials. The delicate security situation in the North and activities for the upcoming elections made it challenging to schedule stakeholder visits in the region. The data collectors did not reach some regions (e.g., Borno and Adamawa States) because of the heightened level of insecurity. Long travel times because of the distance, congested traffic, and numerous checkpoints between sites also slowed data collection.
3. Findings A. Availability of Materials for Early Grade Reading in Nigerian Languages
Materials by Language The data collectors surveyed a total of 364 titles in eight languages: six Nigerian and two European (English and French), as listed in Table G-1.
The largest numbers of titles were encountered in “the big three” national languages: Igbo, Yoruba, and Hausa. However, the low level of representation of Nigeria’s 500 other languages is striking, especially given that the language in education policy is, at least in principle, favorable to the use of regional languages, and even the “mother tongue.” Languages with more than one million speakers in which no materials were encountered include the following: Anaang (spoken in the Southeast), Ebira (Kogi State), Edo (Edo State), Efik (Cross Rivers State), Ibibio (Akwa Ibom State), Kanuri (Northeast), Nupe-Nupe-Tako (Niger State), and Tiv (Southeast). Although the data collectors found nine titles in Ijaw (also known as Izon, a language of Bayelsa State, formerly part of Rivers State), they were unable to locate any of the materials produced in the 20 other languages of Rivers State by the RRP. These materials and others may still exist and may even be used in some places, especially titles in Efik, Ibibio, Ebira, and Tiv. The data collectors were

186 DERP in Africa—Reading Materials Survey Final Report
unable to visit the states most likely to have them, but they were also unable to uncover any specific leads to them, despite extensive inquiries, which suggests that the availability of the titles is, at best, limited.
In addition, the data collectors did not log any materials in Nigerian Pidgin English, which is reportedly used by 30 million speakers in informal settings, especially in the southern, coastal, and urban areas, but which suffers from very low social prestige, considered by most to be nothing more than “broken English” (Adegbija, 2004). In addition, the unknown status and possible absence of materials in the hundreds of other Nigerian languages, some of which have more than one million speakers themselves and are used as regional languages of wider communication, constitutes a challenge for the full implementation of the official language in education policy.
Although English enjoys official status in Nigeria, and numerous materials exist in English, they were not targeted because the focus of the study was on Nigerian language materials. The data collectors considered the materials in English only if the titles were bilingual with a Nigerian language or in a shell book (i.e., a book intended and authorized for adaptation and/or translation into other languages). In addition, French appeared in six shell books.
Out of the 364 titles surveyed, 328 (90 percent) were monolingual and 36 (10 percent) were bilingual. All of the titles were written a Latin-based script. Although Hausa is also written in Ajami script (derived from Arabic script), the data collectors did not encounter any materials in Ajami that were intended for children.
The data collectors recorded whether a title used a standard or outdated orthography, if known. All of the titles in Yoruba, Igbo, and Hausa appeared to use the standard orthography, although a closer examination of each title might still reveal minor discrepancies. The quality of the orthography used in the Fulfulde and Ijaw titles was marked as “unknown.”
Table G-1. Languages in Which Materials Were Found in Nigeria
Languagea
Language ISO 639-3
Codeb Estimated Speaker
Population in Nigeriac Titles per Language
Percentage of Titles
Surveyedd
1 Igbo ibo 18,000,000 (1999) 126 34.6%
2 Yoruba yor 18,9000,000 (L1) (1993) 2,000,000 (L2) 107 29.4%
3 Hausa hau 18,500,000 (L1) (1991) 15,000,000 (L2) 91 25.0%
4 Englishe eng Not applicable 45 12.4%
5 Fulfulde (Adamawa) fub 7,610,000 (1991) 11 3.0%
6 Ijawf ijc 1,770,000 9 2.5%
7 Frenche fra Not applicable 6 1.6%
8 Fulfulde (Central) fuv 11,500,000 (2000) 5 1.4% a Most languages go by several different names; several languages have the same name. In case of confusion, refer to the Ethnologue at www.ethnologue.com (Lewis et al., 2015). Language/dialect distinctions that have been assigned separate
DERP in Africa—Reading Materials Survey Final Report 187
International Organization for Standardization (ISO) 639-3 codes are provided in parentheses. b ISO 639-3 is a code that aims to define three-letter identifiers for all known human languages (SIL International, 2015). c Source: Lewis et al. (2015). The dates for the speaker population estimates vary by language and are provided (when available) in parentheses. Other sources of data may provide different estimates. d Due to bilingual titles, the total will surpass 100%. e The English and French titles were bilingual with a Nigerian language or were “shell” books. f Listed as Izon in Lewis et al. (2015) and includes about 30 mutually intelligible dialects.
Types of Materials Table G-2 details the types of materials found by language. Key observations include the following:
• Of the 364 titles surveyed, 292 titles (80 percent) were textbooks or related materials, and 72 were non-textbook titles (20 percent). Nigeria had the lowest number of non-textbooks across all 11 countries in the study and were fewer than half of the next lowest country.
• The data collectors did not find any supplementary non-textbook titles in Yoruba, one of the “big three” national languages.
• Of the 292 titles that were textbooks or related materials, 250 (86 percent) were student literacy textbooks or primers. Of the 72 non-textbook titles, most (54 [75 percent]) were narrative.
• Only eight literacy teacher’s guides were encountered, making the ratio of student textbooks to teacher’s guides (titles, not copies) approximately 31:1. This means that most textbooks lack an accompanying teacher’s guide.
• Student literacy workbooks were also relatively rare (34 titles [12 percent of textbook related-titles]), and Igbo had twice as many workbooks (18) as any other language.
• Very few titles were informational (e.g., nonfiction), reference, poetry, songs, riddles, proverbs, or similar. The only informational texts surveyed were three English shell books, and the only reference materials were bilingual dictionaries in Igbo-English.3
3 Many reference materials are known to exist for Nigerian languages, such as Efik, Hausa, Fulfulde, Kanuri, Nigerian Pidgin, Yoruba, and potentially others, because they are advertised on international commercial bookseller Web sites such as Amazon.com, but they were not encountered by the field data collectors during the course of the study.

188 DERP in Africa—Reading Materials Survey Final Report
Table G-2. Number of Different Types of Materials Identified, by Language
Language(s)a
Textbook-Related Supplementary/Non-textbook
Student Literacy
Textbook
Student Literacy
Workbook
Literacy Teacher’s
Guide Subtotal
Percentage of Total
Titles Narrative Informational Reference Poetry,
etc. Subtotal
Percentage of Total Titles Total
Percentage of Total Titles
English — — — 0 0% 10 3 — — 13 3.6% 13 3.6%
French — — — 0 0% 3 — — — 3 0.8% 3 0.8%
French-English — — — 0 0% 3 — — — 3 0.8% 3 0.8%
Fulfulde (Adamawa) 4 — 1 5 1.4% 4 — — — 4 1.1% 9 2.5%
Fulfulde (Adamawa)-English
— — — 0 0% 3 — — — 3 0.8% 3 0.8%
Fulfulde (Central) 3 — 1 4 1.1% — — — — 0 0% 4 1.1%
Hausa 55 7 5 67 18.4% 15 — — — 15 4.1% 82 22.5%
Hausa-English 1 — — 1 0.3% 6 — — — 6 1.6% 7 1.9%
Igbo 80 17 — 97 26.6% 9 — — 8 17 4.7% 114 31.3%
Igbo-English 4 1 — 5 1.4% — — 6 — 6 1.6% 11 1.4%
Ijaw 6 — — 6 1.6% — — — — 0 0% 6 1.6%
Ijaw-English 1 — — 1 0.3% 1 — — 1 2 0.5% 3 0.8%
Yoruba 92 9 — 101 27.7% — — — — 0 0% 101 27.7%
Yoruba-English 4 — 1 5 1.4% — — — — 0 0% 5 1.4%
Total 250 34 8 292 80.2% 54 3 6 9 72 19.8% 364 100% Note: Percentages may not sum exactly to 100% due to rounding. a Languages are presented in alphabetical order. Most languages go by several different names; several languages have the same name. In case of confusion, refer to the Ethnologue at www.ethnologue.com (Lewis et al., 2015). Language/dialect distinctions that have been assigned separate International Organization for Standardization (ISO) 639-3 codes are provided in parentheses.

DERP in Africa—Reading Materials Survey Final Report 189
B. Usefulness of Available Materials for Early Grade Children
Pedagogical Components of Textbooks The data collectors analyzed the 292 literacy textbook-related materials with regard to their pedagogical components. The most common components were vocabulary development and/or exercises and reading passages (Figure G-1), each appearing in 230 titles (79 percent) of the textbook-related titles. Slightly fewer titles (203 [70 percent]) contained accompanying comprehension questions. Most materials (203 [70 percent]) used what could be construed as a phonics approach to reading instruction.4
Figure G-1. Pedagogical components in textbook-related materials
Note: Multiple responses were possible per title.
Level Designated Textbook Levels Out of the 292 textbook-related materials, 238 (82 percent) were explicitly labeled by the publisher for a specific grade level in the formal education system, with the highest numbers concentrated in Primary Grades 1 and 2, and the lowest for preschool and kindergarten (Figure G-2). The grade level labels were taken at face value, and the contents of each book were not evaluated against the requirements of the national curriculum for that grade level.
4 A “phonics approach” focuses on the connection between the written letters and the sounds they represent in speech. Phonics approaches may include exercises involving sound recognition and manipulation, blending sounds into syllables or words, and segmenting syllables and words into individual sounds.
16
106
167
203
230
230
203
0 50 100 150 200 250 300
Some other kind of exercises
Grammar instruction and/or exercises
Writing instruction and/or practice
Comprehension questions
Reading passages
Vocabulary development and/or exercises
Phonics approach
Number of textbook-related titles

190 DERP in Africa—Reading Materials Survey Final Report
Figure G-2. Publisher-designated levels for textbook-related materials
Note: Multiple responses per title were possible.
Non-textbook Levels Because supplementary materials were not expected to be labeled for a particular grade level in most cases, the data collectors used a count of the maximum words per page (wpp) to serve as an approximate proxy for relative reading difficulty levels. The data collectors performed this count for 56 narrative and informational texts.
As shown in Figure G-3, although there were few supplementary titles overall, there were even fewer available for early stages of literacy development: none for the earliest stage (1–10 wpp) and very few at the next level up (11–25 wpp). The largest category of supplementary titles (17 titles [30 percent]) featured more than 75 wpp, which is relatively difficult for beginning readers.
15
60
61
49
42
21
54
0 10 20 30 40 50 60 70
Pre-Primary
Primary Grade 1
Primary Grade 2
Primary Grade 3
Primary Grade 4
Other Level
Not Labeled
Number of textbook-related titles

DERP in Africa—Reading Materials Survey Final Report 191
Figure G-3. Number of narrative and informational non-textbook titles by maximum words per page
Note: This calculation was not performed for poetry or reference titles.
Illustrations Out of the 364 titles surveyed, 333 (91 percent) were illustrated. The most common types of illustrations were in all black and white or grayscale, appearing in 165 titles (45 percent); 116 (32 percent) of the titles were illustrated in full color (Figure G-4). The 31 (nine percent) nonillustrated titles were mostly student workbooks (14 [45 percent]), teacher’s guides (five [16 percent]), and reference books (three [10 percent]).
17
10
16
10
0
3
0 10 20
>75 Words per page
51-75 Words per page
26-50 Words per page
11-25 Words per page
1-10 Words per page
Number of non-textbook titles
Narrative Informational

192 DERP in Africa—Reading Materials Survey Final Report
Figure G-4. Presence and type of illustrations
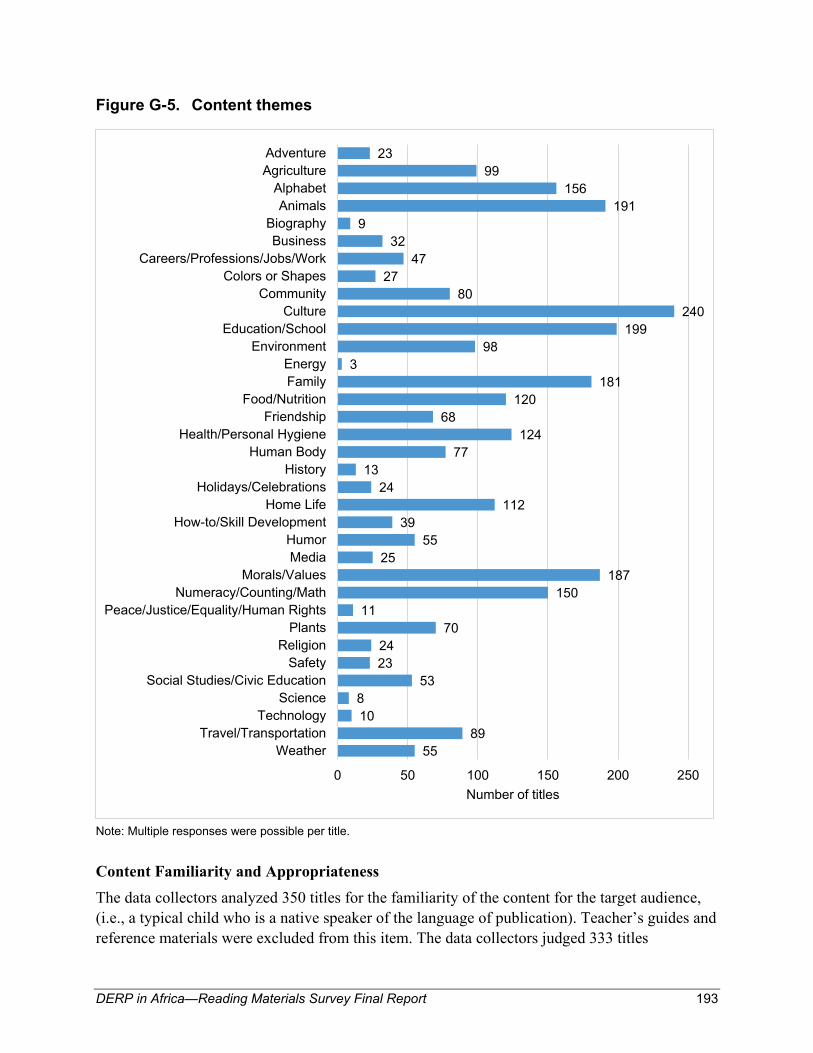
Content Themes The data collectors examined 350 of the titles for content themes, excluding teacher’s guides and reference materials. The data collectors skimmed the texts and illustrations and identified the most prominent themes featured from a set list. The data collectors could select any number of themes because no limits were set for the minimum and maximum numbers. The number of titles tagged for each theme is presented in Figure G-5.
The most common theme was culture, appearing in 240 titles (69 percent), followed by education/school (199 [57 percent]), animals (191 [55 percent]), and morals/values (187 [53 percent]). The least common themes in the surveyed titles in Nigeria included energy (three [one percent]), science (eight [two percent]), biography (nine [three percent]), and technology (10 [three percent]).
Out of the 350 titles examined for content themes, the data collectors determined that only 24 titles (seven percent) contained explicitly religious content. That content was split almost evenly between Christianity (15 titles [63 percent]) and Islam (17 titles [71 percent]); five titles (21 percent) featured elements from or common to both religions.
Yes, all B&W and/or
grayscale, 45%
Yes, some B&W and
some color, 14%
Yes, all color, 32%
No, 9%
Is the book illustrated?
DERP in Africa—Reading Materials Survey Final Report 193
Figure G-5. Content themes
Note: Multiple responses were possible per title.
Content Familiarity and Appropriateness The data collectors analyzed 350 titles for the familiarity of the content for the target audience, (i.e., a typical child who is a native speaker of the language of publication). Teacher’s guides and reference materials were excluded from this item. The data collectors judged 333 titles
5589
108
532324
7011
150187
2555
39112
2413
77124
68120
1813
98199
24080
2747
329
191156
9923
0 50 100 150 200 250
WeatherTravel/Transportation
TechnologyScience
Social Studies/Civic EducationSafety
ReligionPlants
Peace/Justice/Equality/Human RightsNumeracy/Counting/Math
Morals/ValuesMediaHumor
How-to/Skill DevelopmentHome Life
Holidays/CelebrationsHistory
Human BodyHealth/Personal Hygiene
FriendshipFood/Nutrition
FamilyEnergy
EnvironmentEducation/School
CultureCommunity
Colors or ShapesCareers/Professions/Jobs/Work
BusinessBiography
AnimalsAlphabet
AgricultureAdventure
Number of titles

194 DERP in Africa—Reading Materials Survey Final Report
(95 percent) as containing “very familiar” content, 12 (three percent) as containing “semi-familiar,” and only four (one percent) as containing “mostly unfamiliar” content for the target audience.
The data collectors reviewed the illustrations of the same 350 titles for any potentially sensitive content such as traumatic events, gore, smoking and/or illegal drug use, nudity, or other known cultural taboos (Figure G-6). The data collectors did not identify any potentially sensitive content for most of the titles evaluated for this item (i.e., 295 titles [84 percent]). The most common type of content flagged for its potentially sensitive nature was a traumatic event, which was found in 47 (13 percent) of the titles evaluated. The other categories were relatively rare, occurring in fewer than 10 titles each.
Figure G-6. Potentially sensitive content in the illustrations
Note: Multiple responses were possible per title.
Frequency and Equality of Representation The data collectors examined a subset of 226 titles regarding the frequency and equality of representation of people in the illustrations according to gender, ethnic or religious group identity, and disability. The data collectors did not evaluate all titles for these questions; exclusions included teacher’s guides, reference materials, and titles not illustrated with humans or anthropomorphic animals.
Gender The data collectors examined the illustrations in 226 titles for the frequency of representation of each gender and determined that gender was not apparent in 15 titles (seven percent), further reducing the subset for this item to 211 titles. The data collectors judged that there was an overall balance of both genders in 193 of the titles (91 percent; Figure G-7). Male characters dominated the illustrations in 14 titles (seven percent), and female characters appeared in four (two percent).
0
6
0
2
3
9
47
295
0 100 200 300
Unknown/Unable to Evaluate
Other Known Cultural Taboo
Sexual Content
Nudity
Smoking and/or Illegal Drug Use
Gore
Traumatic Event
None Noted
Number of titles

DERP in Africa—Reading Materials Survey Final Report 195
In addition, for 209 titles, the data collectors evaluated whether the illustrations portrayed male and female characters with “equal skills, knowledge, accomplishments, or roles.” The data collectors judged that the male and female characters were portrayed comparably in 185 (89 percent) of these titles, and unequally in only seven (three percent) of these titles. Of the remaining 17 titles (eight percent), data collectors considered that there was an insufficient basis for comparison.
Figure G-7. Frequency of gender representation in the illustrations
Ethnic and Religious Group Identity Similarly to gender, the data collectors examined the illustrations of 226 titles for the frequency of representation of different ethnic or religious group members. Of those titles, the data collectors judged that 182 of the titles (81 percent) did not portray characters with obvious ethnic or religious group identity markers. The data collectors determined that 13 titles (30 percent) portrayed two or more ethnic or religious groups proportionally to their presence in the local population and that five (11 percent) portrayed one group to the exclusion of another group (Figure G-8). In addition, 15 titles (34 percent) were judged to portray exclusively one ethnic or religious group, but in cases where the data collectors judged that the target population was composed overwhelmingly of that group.
For the overwhelming majority of titles, the data collectors judged that there was insufficient basis for comparing the nature of the portrayal, if any, of ethnic or religious groups in the illustrations. The data collectors evaluated only 21 titles for the question of whether different ethnic or religious groups were depicted “with equal skills, knowledge, accomplishments, or roles.” Of those, the data collectors judged that 19 titles (90 percent) portrayed the different groups comparably and that two (10 percent) portrayed them unequally.
193
14
4
0 50 100 150 200
Portray an overall balance of both maleand female
Portray primarily males
Portray primarily females
Number of titles

196 DERP in Africa—Reading Materials Survey Final Report
Figure G-8. Frequency of ethnic and religious group representation in the illustrations
Disability The data collectors also examined how often people with disabilities were represented in the illustrations of 226 titles. Overwhelmingly, the materials surveyed lacked any illustrations of people with any type of disability; they appeared in just three titles (one percent). However, the data collectors judged all three titles as portraying people with disabilities “with skills, knowledge, accomplishments, and roles that are typically attributed to those without disabilities.”
C. Feasibility of Reusing, Adapting, and Reproducing Available Titles
Copyright, Restrictions, and Permissions Out of the 364 titles examined, 339 (93 percent) contained a copyright symbol. Regarding the restrictions or permissions for reuse, 272 titles (75 percent) contained an explicit statement along the lines of “All Rights Reserved,” 42 titles (12 percent) explicitly granted some permissions for reuse (all with a Creative Commons license), and the remaining 49 titles (13 percent) did not contain any explicit statements. The 42 titles with a Creative Commons license were all from the same source (the STudents Empowered through Language, Literacy, and ARithmetic [STELLAR] literacy program of the American University of Nigeria); therefore, Creative Commons is not widely used in Nigeria.
Medium Most of the books (321 [88 percent]) were hard copies; 47 books (13 percent) were soft copies. Of these copies, four books (one percent) were available in both media.
5
15
13
182
0 50 100 150 200
The illustrations primarily portray members ofonly one ethnic or religious group to the
exclusion of another group present in the localpopulation.
The illustrations portray only one ethnic orreligious group, but the local population iscomposed overwhelmingly of that group.
The illustrations proportionally portray two ormore ethnic or religious groups that are present
in the local population.
No ethnic or religious group identity is evident inthe illustrations.
Number of titles

DERP in Africa—Reading Materials Survey Final Report 197
D. Landscape of the Production of Children’s Reading Materials in Nigerian Languages
Publisher Types Figure G-9 shows the number of titles published by each type of organization. By far, the highest number of titles (297 [82 percent]) were collected from commercial publishers. The data collectors found 11 titles (three percent) published by the Universal Basic Education Commission, a government entity, and four titles (one percent) published through a bilateral cooperation agreement with the U.S. Agency for International Development. The academic entities were the Niger Delta University Publishers, Ltd., which is counted under the commercial publishers, and the STELLAR literacy initiative of the American University of Nigeria, which is also counted as a nonprofit organization. Besides STELLAR, the only other nonprofit initiative to provide materials was the Fulfulde Literacy Promotion Project.
Faith-based organizations did not provide any of the materials (Figure G-9). The data collectors reported that although churches and Islamic organizations produce materials in Nigerian languages, these titles are targeted for adults. Because of logistical constraints, the data collectors did not survey these materials. Additional research may be desirable to determine how much of the inventory not surveyed could be adapted for use with children.
Figure G-9. Number of titles by publisher type
Note: Many titles were produced jointly by two or more organizations; therefore, the number of organizations represented exceeds the number of titles surveyed. Publishers can also be included under multiple categories.
Year of Publication Most of the titles found were fairly recent, having been published in the past five years. Despite significant effort devoted to developing Nigerian language materials in the 1970s and 1980s, the data collectors found only 15 titles with publication dates before 1990 (Figure G-10).
11
4
51
297
46
0
0
1
0 100 200 300
Domestic Government Entity
Bi- or Multi-Lateral Cooperation Agreement
Academic
Private - Commercial
Private - Non-Commercial/Nonprofit/NGO
Faith-Based Organization
Private - Self-Published
Unknown
Number of titles

198 DERP in Africa—Reading Materials Survey Final Report
Figure G-10. Year of publication
International Standard Book Number Most books (289 [79 percent]) had an International Standard Book Number (ISBN). This finding indicates that the use of ISBN is fairly common in Nigeria and may be related to the relatively high percentage of books published by commercial publishers.
Price The data collectors recorded the price for 285 of the titles available in hard copy, of which 19 (seven percent) were free (Table G-3). For specific types of books such as teacher’s guides and non-textbooks, price data were available for only a few titles each, so caution should be used when extrapolating generalizations about average price, if at all.
For the titles available in soft copy, 46 (98 percent) of them were recorded as free; for one title (two percent), the price was unknown.
Table G-3. Price of Hard-Copy Materials by Book Type
Book Type
Number Recorded as Free
Number Recorded with
Price >$0.00
Average Price in USDa for
Nonfree Materials Range
Textbook-Related
Student textbook 16 216 $2.20 $0.00–6.00
Student workbook 0 33 $1.52 $0.25–5.00
Teacher’s guide 3 5 $1.07 $0.00–2.50
Non-textbook
Narrative 0 8 $1.16 $0.75–2.50
Informational 0 0 Not applicable —
0 1 1 5 8 18
113
212
60
50
100
150
200
250N
umbe
r of t
itles
DERP in Africa—Reading Materials Survey Final Report 199
Book Type
Number Recorded as Free
Number Recorded with
Price >$0.00
Average Price in USDa for
Nonfree Materials Range
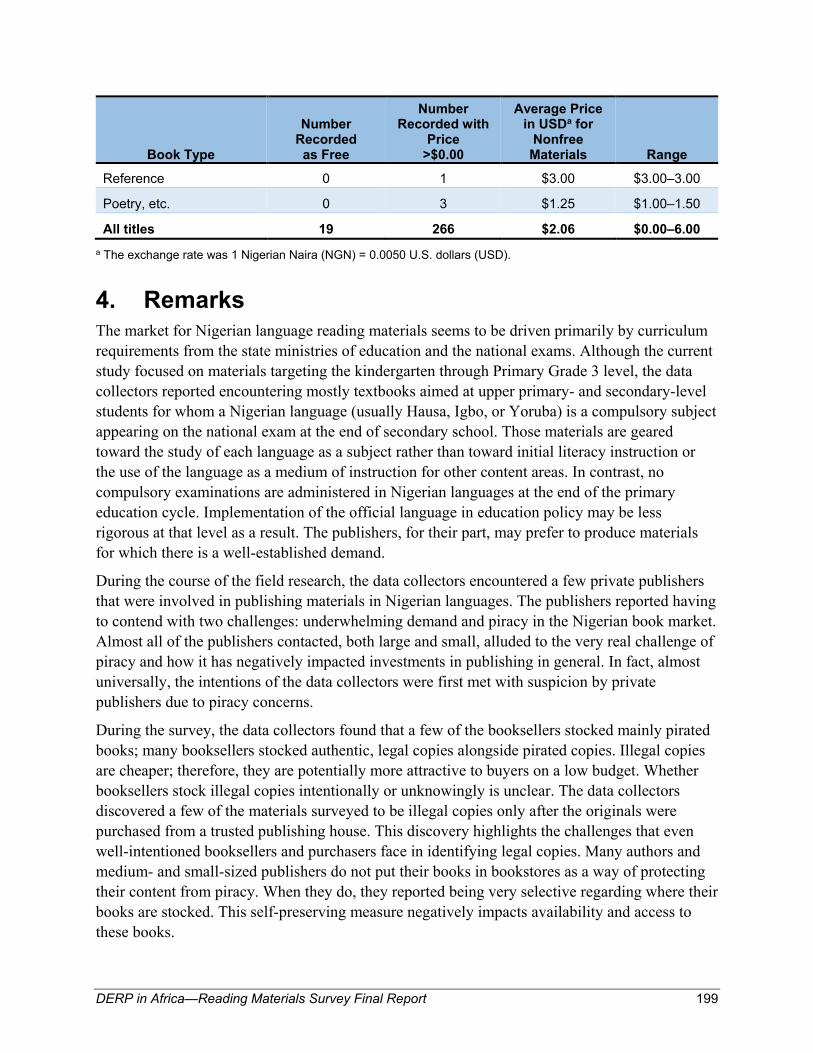
Reference 0 1 $3.00 $3.00–3.00
Poetry, etc. 0 3 $1.25 $1.00–1.50
All titles 19 266 $2.06 $0.00–6.00 a The exchange rate was 1 Nigerian Naira (NGN) = 0.0050 U.S. dollars (USD).
4. Remarks The market for Nigerian language reading materials seems to be driven primarily by curriculum requirements from the state ministries of education and the national exams. Although the current study focused on materials targeting the kindergarten through Primary Grade 3 level, the data collectors reported encountering mostly textbooks aimed at upper primary- and secondary-level students for whom a Nigerian language (usually Hausa, Igbo, or Yoruba) is a compulsory subject appearing on the national exam at the end of secondary school. Those materials are geared toward the study of each language as a subject rather than toward initial literacy instruction or the use of the language as a medium of instruction for other content areas. In contrast, no compulsory examinations are administered in Nigerian languages at the end of the primary education cycle. Implementation of the official language in education policy may be less rigorous at that level as a result. The publishers, for their part, may prefer to produce materials for which there is a well-established demand.
During the course of the field research, the data collectors encountered a few private publishers that were involved in publishing materials in Nigerian languages. The publishers reported having to contend with two challenges: underwhelming demand and piracy in the Nigerian book market. Almost all of the publishers contacted, both large and small, alluded to the very real challenge of piracy and how it has negatively impacted investments in publishing in general. In fact, almost universally, the intentions of the data collectors were first met with suspicion by private publishers due to piracy concerns.
During the survey, the data collectors found that a few of the booksellers stocked mainly pirated books; many booksellers stocked authentic, legal copies alongside pirated copies. Illegal copies are cheaper; therefore, they are potentially more attractive to buyers on a low budget. Whether booksellers stock illegal copies intentionally or unknowingly is unclear. The data collectors discovered a few of the materials surveyed to be illegal copies only after the originals were purchased from a trusted publishing house. This discovery highlights the challenges that even well-intentioned booksellers and purchasers face in identifying legal copies. Many authors and medium- and small-sized publishers do not put their books in bookstores as a way of protecting their content from piracy. When they do, they reported being very selective regarding where their books are stocked. This self-preserving measure negatively impacts availability and access to these books.

200 DERP in Africa—Reading Materials Survey Final Report
The data collectors reported the general conviction that there may be more Nigerian language materials available than they were unable to locate despite their efforts. Therefore, the data collected should not be considered necessarily comprehensive or even representative of the entire country, although the data are useful when considering the languages and regions covered.
When considering initiatives for the future development of materials, it may be desirable to direct attention to the gaps in the inventory highlighted by the survey. These gaps include a lack of supplementary reading materials in general, especially those appropriate for the earliest stages of reading development. Teacher’s guides to accompany textbooks also appear to be in short supply. Most striking of all, however, may be the large number of languages in which no materials were found at all, given both Nigeria’s high linguistic diversity and a language in education policy that is, in principle, supportive of the use of multiple Nigerian languages in early primary grades.

DERP in Africa—Reading Materials Survey Final Report 201
References Adegbija, E. (2004). Language policy and planning in Nigeria. Current Issues in Language
Planning, 5(3), 181–246.
Adeniyi, E. O. (2003). The situation in Nigeria. Retrieved from http://www.ibe.unesco.org/curriculum/AfricaPdf/lago1ade.pdf
Central Intelligence Agency. (2015). World Fact Book. Retrieved from https://www.cia.gov/library/publications/the-world-factbook/geos/ni.html
Duze, C. O. (2011). Implementation of the mother tongue/language component of the National Policy on Education in Nigeria. LWATI: A Journal of Contemporary Research, 8(1), 57–72.
Lewis, M. P., Simons, G. F., & Fennig, C.D. (Eds.). (2015). Ethnologue: Languages of the world. (18th edition). Dallas, TX: SIL International. Retrieved from http://www.ethnologue.com/
Okebukola, P. A., Owolabi, O., & Okebukola, F. O. (2012). Mother tongue as default language of instruction in lower primary science classes: Tension between policy prescription and practice in Nigeria. Journal of Research in Science Writing, 50(1), 62–81.
RTI International. (2014). Nigeria Reading and Access Research Activity: 2014 Hausa & English EGRA Results in Government Primary Schools and IQTE Centers of Jigawa, Kaduna, Kano and Katsina States. Produced for review by USAID/Nigeria. Retrieved from https://www.eddataglobal.org/documents/index.cfm?fuseaction=pubDetail&id=746
SIL International. (2015). ISO 639-3. Retrieved from http://www-01.sil.org/iso639-3/
UNESCO (United Nations Educational, Scientific, and Cultural Organization). (2015). Education for All Global Monitoring Report—Statistical tables. Retrieved from https://en.unesco.org/gem-report/sites/gem-report/files/Statistical%20tables-School%20year%20ending%20in%202013_Longer%20version_Website.xls