Trends in Livestock Production and Consumption - Cees de Haan, World Bank

48
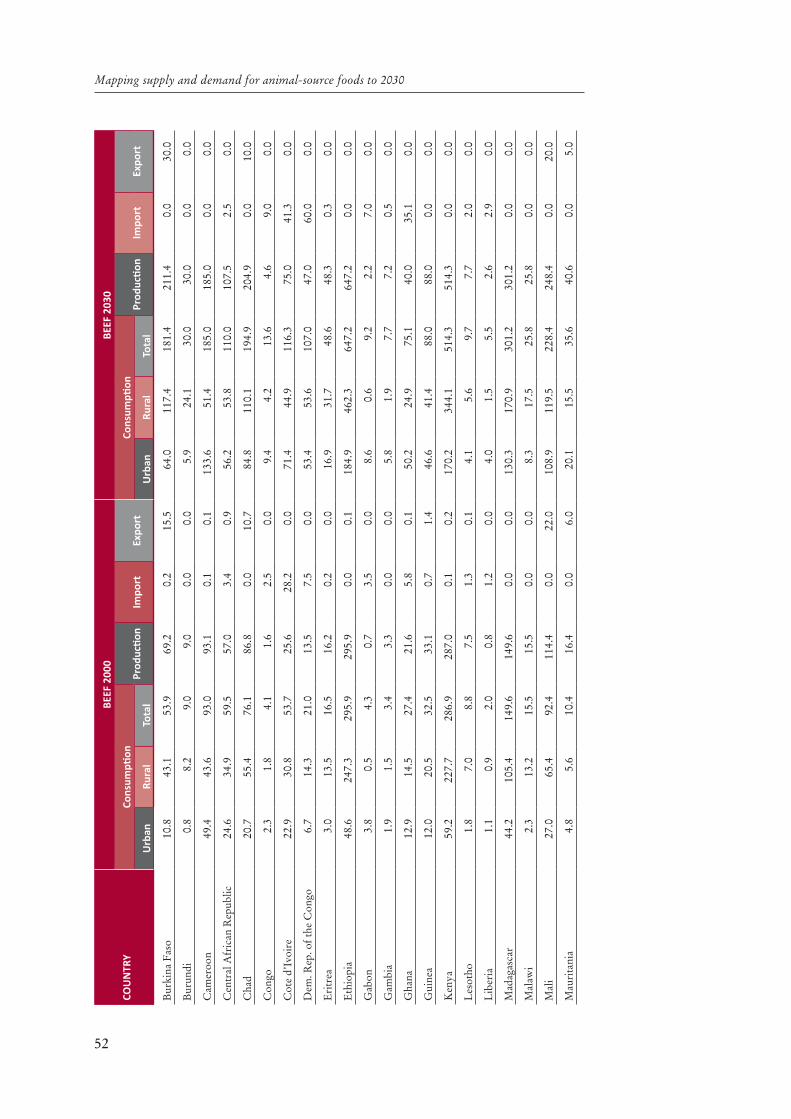
Annex C. Consumption and production of livestock commodities in 2000 and 2030
In this section we report country-level totals of consumption, production, import and export of the different livestock commodities (beef, milk, mutton, pork, poul-try meat and eggs), in 2000 and 2030, and their absolute and proportional change. The consumption totals have been disaggregated by urban and rural areas based on the baseline 2000 GRUMP population distribution, and UN urban and rural pro-portions in 2000, and those projected in 2030. Absolute values have been summed at the regional level, while the proportional changes are expressed as a percentage of the total values in 2000.

49
Annex C
Tabl
e C
1. C
onsu
mpt
ion
and
prod
ucti
on o
f bee
f in
2000
and
203
0 (a
ll m
easu
res
are
in th
ousa
nds
of m
etri
c to
nnes
).
cou
nTr
y
beef
200
0be
ef 2
030
Cons
umpti
onPr
oduc
tion
Impo
rtEx
port
Cons
umpti
onPr
oduc
tion
Impo
rtEx
port
urb
anRu
ral
Tota
lu
rban
Rura
lTo
tal
Eas
t A
sia
and
Paci
fic3
293.
73
493.
16
786.
86
499.
939
0.3
103.
410
233
.95
351.
015
584
.914
815
.389
1.6
122.
0
Cam
bodi
a12
.752
.965
.667
.10.
01.
661
.010
0.6
161.
616
1.6
0.0
0.0
Chi
na2
647.
82
585.
85
233.
65
298.
29.
073
.68
031.
64
090.
312
121
.912
221
.90.
010
0.0
Dem
. Peo
ple’
s R
ep. o
f Kor
ea13
.17.
620
.720
.50.
20.
030
.010
.040
.035
.05.
00.
0
Indo
nesi
a17
2.1
234.
340
6.4
325.
181
.40.
168
1.2
309.
099
0.2
790.
220
0.0
0.0
Lao
Peo
ple’
s D
em. R
ep.
8.1
29.1
37.2
42.0
0.0
4.8
55.4
51.3
106.
711
8.7
0.0
12.0
Mal
aysi
a79
.546
.812
6.3
13.2
115.
72.
526
9.6
57.9
327.
518
.030
9.5
0.0
Mya
nmar
34.9
88.0
122.
913
7.8
0.0
14.8
115.
912
4.7
240.
625
0.6
0.0
10.0
Phi
lippi
nes
208.
514
8.5
357.
021
6.8
140.
40.
268
3.4
212.
689
6.0
646.
025
0.0
0.0
Tha
iland
72.4
158.
823
1.2
193.
443
.55.
817
2.5
204.
637
7.1
250.
012
7.1
0.0
Vie
t Nam
44.6
141.
318
5.9
185.
80.
10.
013
3.1
190.
232
3.3
323.
30.
00.
0
Eas
tern
Eur
ope
and
C
entr
al A
sia
1 97
5.1
747.
52
722.
62
227.
250
5.7
6.4
2 31
2.4
699.
83
012.
22
516.
150
0.0
0.0
Rus
sian
Fed
erat
ion
1 74
7.0
626.
72
373.
71
877.
950
5.6
5.9
1 82
9.8
564.
52
394.
31
898.
250
0.0
0.0
Turk
ey22
8.1
120.
834
8.9
349.
30.
10.
548
2.5
135.
461
7.9
617.
90.
00.
0
Lat
in A
mer
ica/
Car
ibbe
an10
034
.02
659.
712
693
.713
713
.865
8.9
1 45
6.8
17 2
84.9
2 71
0.8
19 9
95.7
23 0
31.2
707.
23
413.
2
Arg
enti
na1
991.
617
4.5
2 16
6.1
2 63
1.6
16.8
310.
62
506.
811
8.2
2 62
5.0
3 71
1.3
0.0
845.
7
Bol
ivia
104.
155
.415
9.5
158.
71.
30.
725
1.2
73.3
324.
532
4.5
0.0
0.0
Bra
zil
4 71
0.9
1 25
0.0
5 96
0.9
6 53
6.7
53.2
629.
07
967.
51
048.
99
016.
410
716
.40.
01
700.
0
Chi
le27
6.4
47.9
324.
322
3.8
101.
10.
650
1.7
46.7
548.
439
8.4
150.
00.
0

50
Mapping supply and demand for animal-source foods to 2030
cou
nTr
y
beef
200
0be
ef 2
030
Cons
umpti
onPr
oduc
tion
Impo
rtEx
port
Cons
umpti
onPr
oduc
tion
Impo
rtEx
port
urb
anRu
ral
Tota
lu
rban
Rura
lTo
tal
Col
ombi
a52
3.9
197.
072
0.9
736.
52.
75.
098
9.7
230.
41
220.
11
255.
00.
010
.0
Cos
ta R
ica
40.5
27.1
67.6
82.2
2.3
16.9
69.8
24.2
94.0
114.
00.
020
.0
Cub
a40
.533
.774
.274
.10.
10.
073
.155
.112
8.2
128.
20.
00.
0
Dom
inic
an R
epub
lic42
.825
.868
.668
.40.
20.
088
.522
.111
0.6
110.
60.
00.
0
Ecu
ador
105.
371
.017
6.3
175.
90.
40.
027
6.1
87.9
364.
036
4.0
0.0
0.0
El S
alva
dor
25.7
18.5
44.2
28.8
15.4
0.0
67.0
29.7
96.7
76.7
20.0
0.0
Gua
tem
ala
30.6
36.8
67.4
62.0
7.7
2.4
114.
874
.218
9.0
189.
00.
00.
0
Guy
ana
0.6
1.3
1.9
1.9
0.0
0.0
1.0
1.4
2.4
2.4
0.0
0.0
Hai
ti14
.323
.137
.437
.30.
20.
049
.522
.672
.172
.10.
00.
0
Hon
dura
s24
.729
.554
.252
.92.
91.
671
.845
.511
7.3
117.
30.
00.
0
Jam
aica
10.8
9.9
20.7
14.0
7.0
0.2
19.0
11.4
30.4
19.6
11.0
0.0
Mex
ico
1 32
9.7
444.
51
774.
21
482.
743
3.0
145.
02
779.
655
9.2
3 33
8.8
2 83
6.9
500.
00.
0
Nic
arag
ua14
.411
.626
.061
.72.
638
.657
.829
.787
.517
0.0
0.0
82.5
Pan
ama
37.2
19.1
56.3
63.8
1.0
7.0
78.1
16.5
94.6
101.
80.
05.
0
Par
agua
y11
0.2
91.0
201.
224
7.5
1.5
47.8
262.
710
9.2
371.
942
1.9
0.0
50.0
Per
u80
.924
.110
5.0
135.
63.
30.
019
7.0
44.6
241.
625
8.5
10.0
0.0
Suri
nam
e3.
10.
53.
62.
00.
50.
05.
20.
55.
73.
91.
80.
0
Uru
guay
165.
414
.618
0.0
417.
00.
225
1.2
201.
911
.821
3.7
913.
70.
070
0.0
Ven
ezue
la35
0.6
52.6
403.
241
8.7
5.5
0.2
655.
147
.770
2.8
725.
014
.40.
0
Mid
dle
Eas
t/N
orth
Afr
ica
908.
981
4.0
1 72
2.9
1 25
9.4
478.
02.
72
314.
71
337.
63
652.
32
830.
782
3.0
0.0
Alg
eria
99.3
42.1
141.
412
6.0
15.5
0.0
279.
960
.434
0.3
305.
335
.00.
0

51
Annex C
cou
nTr
y
beef
200
0be
ef 2
030
Cons
umpti
onPr
oduc
tion
Impo
rtEx
port
Cons
umpti
onPr
oduc
tion
Impo
rtEx
port
urb
anRu
ral
Tota
lu
rban
Rura
lTo
tal
Egy
pt35
0.7
478.
982
9.6
494.
933
5.0
0.3
755.
477
2.2
1 52
7.6
1 20
0.0
327.
60.
0
Iran
(Isl
amic
Rep
ublic
of)
204.
411
1.3
315.
728
7.3
28.4
0.0
516.
714
4.4
661.
162
1.1
40.0
0.0
Iraq
33.1
14.8
47.9
47.9
0.1
0.0
206.
481
.728
8.1
113.
117
5.0
0.0
Jord
an20
.25.
625
.80.
726
.81.
639
.48.
748
.11.
047
.10.
0
Leb
anon
30.4
4.7
35.1
10.0
49.8
0.1
72.3
7.5
79.8
12.0
69.2
0.0
Lib
yan
Ara
b Ja
mah
iriy
a17
.95.
523
.46.
04.
70.
041
.78.
550
.210
.140
.10.
0
Mor
occo
75.1
65.7
140.
813
8.2
2.8
0.6
163.
584
.724
8.2
233.
215
.00.
0
Syri
an A
rab
Rep
ublic
23.6
21.9
45.5
45.2
0.3
0.0
73.7
41.3
115.
010
5.0
10.0
0.0
Tuni
sia
39.4
22.8
62.2
59.6
2.6
0.0
80.0
26.5
106.
510
2.5
4.0
0.0
Yem
en14
.940
.655
.543
.612
.00.
185
.710
1.7
187.
412
7.4
60.0
0.0
Sout
h A
sia
1 13
0.1
2 89
0.5
4 02
0.6
4 25
5.4
0.9
235.
73
160.
04
227.
67
387.
67
687.
60.
030
0.0
Afg
hani
stan
32.9
94.9
127.
812
7.8
0.0
0.0
164.
624
8.3
412.
941
2.9
0.0
0.0
Ban
glad
esh
41.8
133.
417
5.2
175.
20.
00.
014
2.9
209.
635
2.5
352.
50.
00.
0
Indi
a73
3.1
1 89
5.2
2 62
8.3
2 86
1.4
0.2
233.
31
609.
02
357.
43
966.
44
266.
40.
030
0.0
Nep
al22
.814
6.9
169.
717
0.0
0.6
0.9
99.3
226.
632
5.9
325.
90.
00.
0
Pak
ista
n29
3.9
592.
288
6.1
887.
50.
01.
41
134.
61
152.
02
286.
62
286.
60.
00.
0
Sri L
anka
5.6
27.9
33.5
33.5
0.1
0.1
9.6
33.7
43.3
43.3
0.0
0.0
Sub-
Saha
ran
Afr
ica
1 19
5.1
2 14
7.0
3 34
2.1
3 29
8.9
173.
012
4.8
3 58
4.5
3 52
5.6
7 11
0.1
6 85
4.1
396.
313
9.4
Ang
ola
55.6
45.9
101.
585
.016
.50.
022
0.2
74.3
294.
527
9.3
15.2
0.0
Ben
in7.
111
.418
.516
.81.
70.
021
.318
.639
.936
.93.
00.
0
Bot
swan
a4.
12.
76.
827
.22.
723
.39.
62.
912
.551
.90.
039
.4
52
Mapping supply and demand for animal-source foods to 2030
cou
nTr
y
beef
200
0be
ef 2
030
Cons
umpti
onPr
oduc
tion
Impo
rtEx
port
Cons
umpti
onPr
oduc
tion
Impo
rtEx
port
urb
anRu
ral
Tota
lu
rban
Rura
lTo
tal
Bur
kina
Fas
o10
.843
.153
.969
.20.
215
.564
.011
7.4
181.
421
1.4
0.0
30.0
Bur
undi
0.8
8.2
9.0
9.0
0.0
0.0
5.9
24.1
30.0
30.0
0.0
0.0
Cam
eroo
n49
.443
.693
.093
.10.
10.
113
3.6
51.4
185.
018
5.0
0.0
0.0
Cen
tral
Afr
ican
Rep
ublic
24.6
34.9
59.5
57.0
3.4
0.9
56.2
53.8
110.
010
7.5
2.5
0.0
Cha
d20
.755
.476
.186
.80.
010
.784
.811
0.1
194.
920
4.9
0.0
10.0
Con
go2.
31.
84.
11.
62.
50.
09.
44.
213
.64.
69.
00.
0
Cot
e d’
Ivoi
re22
.930
.853
.725
.628
.20.
071
.444
.911
6.3
75.0
41.3
0.0
Dem
. Rep
. of t
he C
ongo
6.7
14.3
21.0
13.5
7.5
0.0
53.4
53.6
107.
047
.060
.00.
0
Eri
trea
3.0
13.5
16.5
16.2
0.2
0.0
16.9
31.7
48.6
48.3
0.3
0.0
Eth
iopi
a48
.624
7.3
295.
929
5.9
0.0
0.1
184.
946
2.3
647.
264
7.2
0.0
0.0
Gab
on3.
80.
54.
30.
73.
50.
08.
60.
69.
22.
27.
00.
0
Gam
bia
1.9
1.5
3.4
3.3
0.0
0.0
5.8
1.9
7.7
7.2
0.5
0.0
Gha
na12
.914
.527
.421
.65.
80.
150
.224
.975
.140
.035
.10.
0
Gui
nea
12.0
20.5
32.5
33.1
0.7
1.4
46.6
41.4
88.0
88.0
0.0
0.0
Ken
ya59
.222
7.7
286.
928
7.0
0.1
0.2
170.
234
4.1
514.
351
4.3
0.0
0.0
Les
otho
1.8
7.0
8.8
7.5
1.3
0.1
4.1
5.6
9.7
7.7
2.0
0.0
Lib
eria
1.1
0.9
2.0
0.8
1.2
0.0
4.0
1.5
5.5
2.6
2.9
0.0
Mad
agas
car
44.2
105.
414
9.6
149.
60.
00.
013
0.3
170.
930
1.2
301.
20.
00.
0
Mal
awi
2.3
13.2
15.5
15.5
0.0
0.0
8.3
17.5
25.8
25.8
0.0
0.0
Mal
i27
.065
.492
.411
4.4
0.0
22.0
108.
911
9.5
228.
424
8.4
0.0
20.0
Mau
rita
nia
4.8
5.6
10.4
16.4
0.0
6.0
20.1
15.5
35.6
40.6
0.0
5.0

53
Annex C
cou
nTr
y
beef
200
0be
ef 2
030
Cons
umpti
onPr
oduc
tion
Impo
rtEx
port
Cons
umpti
onPr
oduc
tion
Impo
rtEx
port
urb
anRu
ral
Tota
lu
rban
Rura
lTo
tal
Mau
riti
us5.
43.
48.
80.
58.
90.
68.
54.
312
.80.
512
.30.
0
Moz
ambi
que
12.5
26.9
39.4
37.4
2.0
0.0
43.2
36.7
79.9
77.9
2.0
0.0
Nig
er6.
734
.341
.044
.90.
14.
028
.592
.812
1.3
126.
30.
05.
0
Nig
eria
149.
219
1.7
340.
928
5.1
55.8
0.0
688.
338
6.5
1 07
4.8
924.
815
0.0
0.0
Rw
anda
3.2
15.0
18.2
18.1
0.1
0.0
13.4
29.7
43.1
43.1
0.0
0.0
Sene
gal
21.4
29.5
50.9
48.8
2.2
0.0
57.7
48.9
106.
610
1.6
5.0
0.0
Sier
ra L
eone
2.5
4.1
6.6
4.7
1.9
0.0
8.3
8.1
16.4
13.5
2.9
0.0
Som
alia
21.0
39.1
60.1
70.2
0.0
10.1
98.2
94.2
192.
420
2.4
0.0
10.0
Sout
h A
fric
a31
9.7
244.
856
4.5
558.
220
.28.
344
9.1
183.
563
2.6
593.
440
.10.
0
Suda
n11
2.7
180.
229
2.9
298.
50.
35.
936
1.1
225.
958
7.0
592.
00.
05.
0
Swaz
iland
4.5
13.5
18.0
14.6
5.1
1.6
7.3
12.1
19.4
14.4
5.0
0.0
Togo
2.3
3.1
5.4
5.2
0.3
0.0
8.4
5.4
13.8
13.6
0.2
0.0
Uga
nda
11.7
86.4
98.1
98.0
0.0
0.0
57.6
228.
028
5.6
285.
60.
00.
0
Uni
ted
Rep
ublic
of T
anza
nia
49.7
173.
722
3.4
223.
40.
10.
117
4.9
280.
345
5.2
455.
20.
00.
0
Zam
bia
15.2
27.7
42.9
42.7
0.2
0.0
35.8
43.4
79.2
79.2
0.0
0.0
Zim
babw
e29
.858
.588
.310
1.8
0.2
13.8
55.0
53.6
108.
612
3.6
0.0
15.0
Hig
h in
com
e co
untr
ies
13 5
77.9
2 88
1.3
16 4
59.2
17 3
05.7
3 74
9.3
4 34
5.3
16 5
88.4
2 31
2.2
18 9
00.6
19 3
85.6
1 95
4.9
2 39
1.1
Aus
tral
ia68
0.8
97.7
778.
52
259.
45.
91
486.
982
1.9
71.8
893.
72
192.
10.
01
300.
0
Can
ada
882.
115
1.4
1 03
3.5
1 61
6.6
366.
294
7.0
1 07
9.9
140.
41
220.
31
711.
50.
049
1.1
Icel
and
3.6
0.1
3.7
3.7
0.0
0.0
3.1
0.9
4.0
4.0
0.0
0.0
Isra
el11
3.5
11.0
124.
537
.187
.70.
017
9.0
14.0
193.
065
.012
8.0
0.0

54
Mapping supply and demand for animal-source foods to 2030
cou
nTr
y
beef
200
0be
ef 2
030
Cons
umpti
onPr
oduc
tion
Impo
rtEx
port
Cons
umpti
onPr
oduc
tion
Impo
rtEx
port
urb
anRu
ral
Tota
lu
rban
Rura
lTo
tal
Japa
n79
6.2
413.
21
209.
450
3.2
909.
02.
51
334.
148
1.2
1 81
5.3
761.
21
100.
00.
0
New
Zea
land
99.9
15.4
115.
357
5.9
11.0
485.
711
0.1
13.3
123.
472
3.4
0.0
600.
0
Nor
way
75.6
16.7
92.3
90.2
5.6
3.5
81.8
17.4
99.2
99.2
0.0
0.0
Rep
ublic
of K
orea
434.
510
7.4
541.
929
1.2
260.
59.
877
8.2
122.
590
0.7
650.
725
0.0
0.0
Saud
i Ara
bia
50.6
11.1
61.7
20.0
44.9
3.3
168.
523
.419
1.9
31.9
160.
00.
0
Swit
zerl
and
116.
334
.115
0.4
136.
715
.72.
094
.222
.311
6.5
106.
510
.00.
0
Trin
idad
and
Tob
ago
1.1
4.8
5.9
0.9
6.0
1.0
2.5
5.8
8.3
1.4
6.9
0.0
Uni
ted
Stat
es o
f Am
eric
a10
323
.62
018.
512
342
.111
770
.82
036.
81
403.
611
935
.01
399.
313
334
.313
038
.730
0.0
0.0

55
Annex C
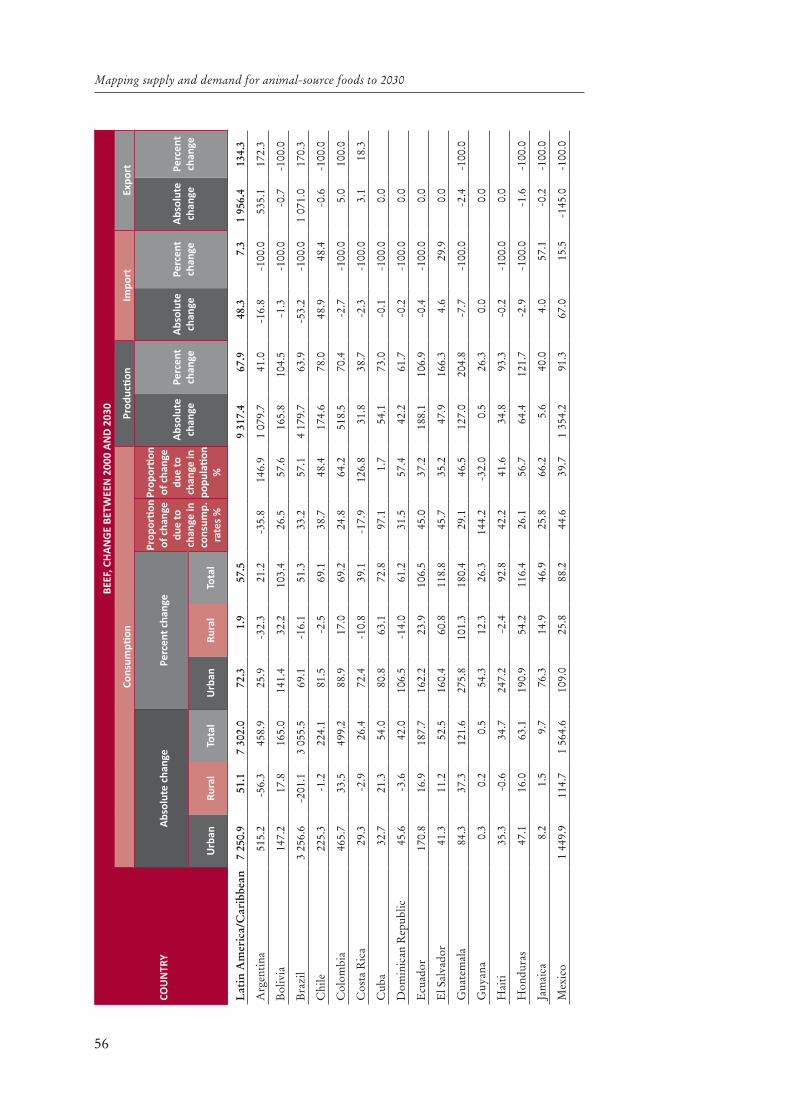
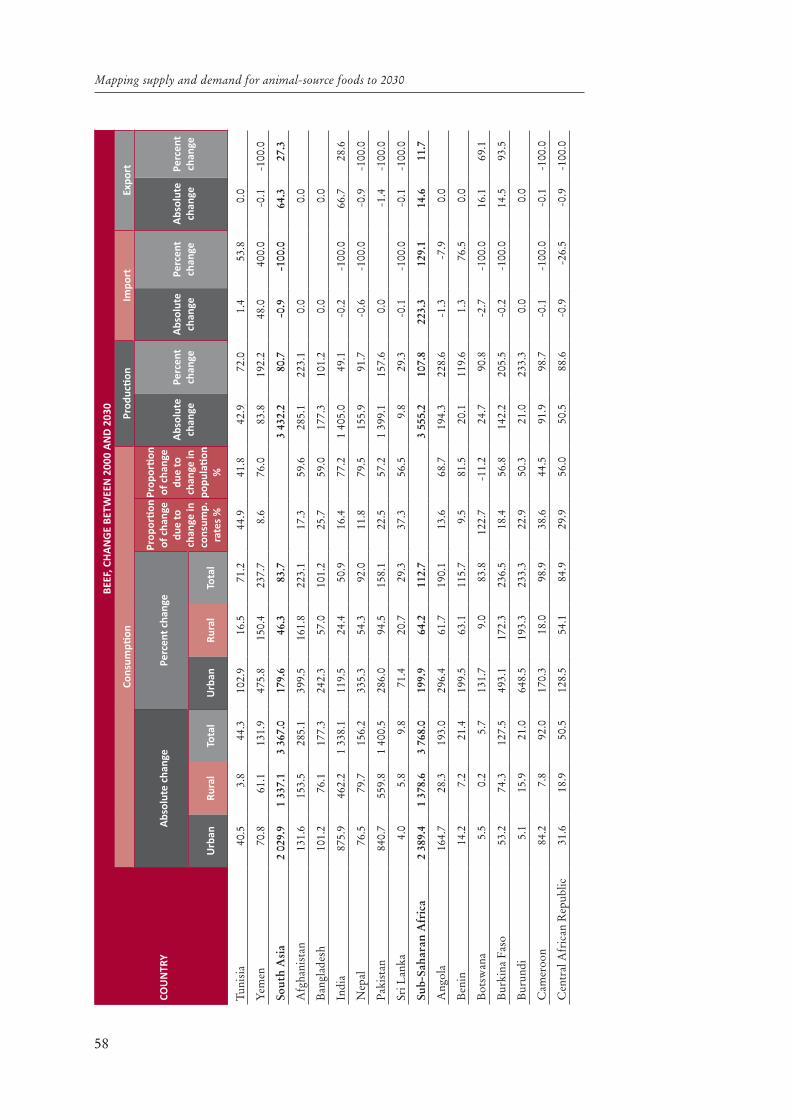
Tabl
e C
2. C
hang
e in
con
sum
ptio
n an
d pr
oduc
tion
of b
eef b
etw
een
2000
and
203
0 (a
bsol
ute
chan
ge is
in th
ousa
nds o
f met
ric
tonn
es, p
ropo
rtio
nal c
hang
e in
per
cent
age)
.
cou
nTr
y
BEEf
, CH
An
GE
BETW
EEn
200
0 A
nD
203
0
Cons
umpti
onPr
oduc
tion
Impo
rtEx
port
Abs
olut
e ch
ange
Perc
ent c
hang
ePr
opor
tion
of
cha
nge
due
to
chan
ge in
co
nsum
p.
rate
s %
Prop
orti
on
of c
hang
e du
e to
ch
ange
in
popu
lati
on
%
Abs
olut
e ch
ange
Perc
ent
chan
geA
bsol
ute
chan
gePe
rcen
t ch
ange
Abs
olut
e ch
ange
Perc
ent
chan
ge
urb
anRu
ral
Tota
lu
rban
Rura
lTo
tal
Eas
t A
sia
and
Paci
fic6
940.
21
857.
98
798.
121
0.7
53.2
129.
68
315.
412
7.9
501.
312
8.4
18.6
18.0
Cam
bodi
a48
.347
.796
.038
0.4
90.1
146.
325
.654
.194
.514
0.8
0.0
-1.6
-100
.0
Chi
na5
383.
81
504.
56
888.
320
3.3
58.2
131.
678
.610
.56
923.
713
0.7
-9.0
-100
.026
.435
.9
Dem
. Peo
ple’
s R
ep. o
f K
orea
16.9
2.4
19.3
129.
631
.093
.277
.513
.014
.570
.74.
82
400.
00.
0
Indo
nesi
a50
9.1
74.7
583.
829
5.9
31.9
143.
759
.721
.746
5.1
143.
111
8.6
145.
7-0
.1-1
00.0
Lao
Peo
ple’
s D
em. R
ep.
47.3
22.2
69.5
583.
676
.418
6.8
33.8
40.6
76.7
182.
60.
07.
215
0.0
Mal
aysi
a19
0.1
11.1
201.
223
9.1
23.7
159.
343
.633
.34.
836
.419
3.8
167.
5-2
.5-1
00.0
Mya
nmar
81.0
36.7
117.
723
1.8
41.8
95.8
54.1
30.2
112.
881
.90.
0-4
.8-3
2.4
Phi
lippi
nes
474.
964
.153
9.0
227.
843
.215
1.0
44.4
33.3
429.
219
8.0
109.
678
.1-0
.2-1
00.0
Tha
iland
100.
245
.714
5.9
138.
428
.863
.150
.337
.756
.629
.383
.619
2.2
-5.8
-100
.0
Vie
t Nam
88.5
48.9
137.
419
8.4
34.6
73.9
34.4
52.3
137.
574
.0-0
.1-1
00.0
0.0
Eas
tern
Eur
ope
and
C
entr
al A
sia
337.
3-4
7.7
289.
617
.1-6
.410
.628
8.9
13.0
-5.7
-1.1
-6.4
-100
.0
Rus
sian
Fed
erat
ion
82.8
-62.
220
.64.
7-9
.90.
92
612.
0-2
047
.820
.31.
1-5
.6-1
.1-5
.9-1
00.0
Turk
ey25
4.4
14.6
269.
011
1.6
12.1
77.1
40.9
44.9
268.
676
.9-0
.1-1
00.0
-0.5
-100
.0
56
Mapping supply and demand for animal-source foods to 2030
cou
nTr
y
BEEf
, CH
An
GE
BETW
EEn
200
0 A
nD
203
0
Cons
umpti
onPr
oduc
tion
Impo
rtEx
port
Abs
olut
e ch
ange
Perc
ent c
hang
ePr
opor
tion
of
cha
nge
due
to
chan
ge in
co
nsum
p.
rate
s %
Prop
orti
on
of c
hang
e du
e to
ch
ange
in
popu
lati
on
%
Abs
olut
e ch
ange
Perc
ent
chan
geA
bsol
ute
chan
gePe
rcen
t ch
ange
Abs
olut
e ch
ange
Perc
ent
chan
ge
urb
anRu
ral
Tota
lu
rban
Rura
lTo
tal
Lat
in A
mer
ica/
Car
ibbe
an7
250.
951
.17
302.
072
.31.
957
.59
317.
467
.948
.37.
31
956.
413
4.3
Arg
enti
na51
5.2
-56.
345
8.9
25.9
-32.
321
.2-3
5.8
146.
91
079.
741
.0-1
6.8
-100
.053
5.1
172.
3
Bol
ivia
147.
217
.816
5.0
141.
432
.210
3.4
26.5
57.6
165.
810
4.5
-1.3
-100
.0-0
.7-1
00.0
Bra
zil
3 25
6.6
-201
.13
055.
569
.1-1
6.1
51.3
33.2
57.1
4 17
9.7
63.9
-53.
2-1
00.0
1 07
1.0
170.
3
Chi
le22
5.3
-1.2
224.
181
.5-2
.569
.138
.748
.417
4.6
78.0
48.9
48.4
-0.6
-100
.0
Col
ombi
a46
5.7
33.5
499.
288
.917
.069
.224
.864
.251
8.5
70.4
-2.7
-100
.05.
010
0.0
Cos
ta R
ica
29.3
-2.9
26.4
72.4
-10.
839
.1-1
7.9
126.
831
.838
.7-2
.3-1
00.0
3.1
18.3
Cub
a32
.721
.354
.080
.863
.172
.897
.11.
754
.173
.0-0
.1-1
00.0
0.0
Dom
inic
an R
epub
lic45
.6-3
.642
.010
6.5
-14.
061
.231
.557
.442
.261
.7-0
.2-1
00.0
0.0
Ecu
ador
170.
816
.918
7.7
162.
223
.910
6.5
45.0
37.2
188.
110
6.9
-0.4
-100
.00.
0
El S
alva
dor
41.3
11.2
52.5
160.
460
.811
8.8
45.7
35.2
47.9
166.
34.
629
.90.
0
Gua
tem
ala
84.3
37.3
121.
627
5.8
101.
318
0.4
29.1
46.5
127.
020
4.8
-7.7
-100
.0-2
.4-1
00.0
Guy
ana
0.3
0.2
0.5
54.3
12.3
26.3
144.
2-3
2.0
0.5
26.3
0.0
0.0
Hai
ti35
.3-0
.634
.724
7.2
-2.4
92.8
42.2
41.6
34.8
93.3
-0.2
-100
.00.
0
Hon
dura
s47
.116
.063
.119
0.9
54.2
116.
426
.156
.764
.412
1.7
-2.9
-100
.0-1
.6-1
00.0
Jam
aica
8.2
1.5
9.7
76.3
14.9
46.9
25.8
66.2
5.6
40.0
4.0
57.1
-0.2
-100
.0
Mex
ico
1 44
9.9
114.
71
564.
610
9.0
25.8
88.2
44.6
39.7
1 35
4.2
91.3
67.0
15.5
-145
.0-1
00.0

57
Annex C
cou
nTr
y
BEEf
, CH
An
GE
BETW
EEn
200
0 A
nD
203
0
Cons
umpti
onPr
oduc
tion
Impo
rtEx
port
Abs
olut
e ch
ange
Perc
ent c
hang
ePr
opor
tion
of
cha
nge
due
to
chan
ge in
co
nsum
p.
rate
s %
Prop
orti
on
of c
hang
e du
e to
ch
ange
in
popu
lati
on
%
Abs
olut
e ch
ange
Perc
ent
chan
geA
bsol
ute
chan
gePe
rcen
t ch
ange
Abs
olut
e ch
ange
Perc
ent
chan
ge
urb
anRu
ral
Tota
lu
rban
Rura
lTo
tal
Nic
arag
ua43
.518
.061
.530
2.3
155.
223
6.5
38.6
32.1
108.
317
5.5
-2.6
-100
.043
.911
3.7
Pan
ama
40.9
-2.6
38.3
109.
8-1
3.6
68.0
14.4
77.9
38.0
59.6
-1.0
-100
.0-2
.0-2
8.6
Par
agua
y15
2.6
18.1
170.
713
8.5
19.9
84.8
2.7
95.2
174.
470
.5-1
.5-1
00.0
2.2
4.6
Per
u11
6.1
20.5
136.
614
3.5
85.2
130.
146
.633
.212
2.9
90.6
6.7
203.
00.
0
Suri
nam
e2.
10.
02.
166
.85.
258
.364
.525
.81.
995
.01.
326
0.0
0.0
Uru
guay
36.4
-2.7
33.7
22.0
-18.
818
.71.
398
.549
6.7
119.
1-0
.2-1
00.0
448.
817
8.7
Ven
ezue
la30
4.6
-5.0
299.
686
.9-9
.474
.319
.470
.530
6.3
73.2
8.9
161.
8-0
.2-1
00.0
Mid
dle
Eas
t/N
orth
Afr
ica
1 40
5.7
523.
71
929.
415
4.7
64.3
112.
01
571.
312
4.8
345.
072
.2-2
.7-1
00.0
Alg
eria
180.
718
.219
8.9
182.
043
.314
0.7
46.2
32.6
179.
314
2.3
19.5
125.
80.
0
Egy
pt40
4.6
293.
469
8.0
115.
461
.384
.117
.172
.470
5.1
142.
5-7
.4-2
.2-0
.3-1
00.0
Iran
(Isl
amic
Rep
ublic
of)
312.
433
.034
5.4
152.
929
.710
9.4
43.3
38.5
333.
811
6.2
11.6
40.8
0.0
Iraq
173.
366
.924
0.2
523.
145
3.0
501.
541
.519
.065
.213
6.1
174.
917
4 90
0.0
0.0
Jord
an19
.23.
122
.395
.254
.986
.410
.082
.90.
342
.920
.375
.7-1
.6-1
00.0
Leb
anon
41.9
2.8
44.7
137.
760
.212
7.4
53.8
27.4
2.0
20.0
19.4
39.0
-0.1
-100
.0
Lib
yan
Ara
b Ja
mah
iriy
a23
.73.
126
.813
2.4
55.9
114.
533
.548
.14.
168
.335
.475
3.2
0.0
Mor
occo
88.4
19.0
107.
411
7.8
28.9
76.3
27.2
60.3
95.0
68.7
12.2
435.
7-0
.6-1
00.0
Syri
an A
rab
Rep
ublic
50.2
19.3
69.5
213.
188
.015
2.7
29.9
48.2
59.8
132.
39.
73
233.
30.
0
58
Mapping supply and demand for animal-source foods to 2030
cou
nTr
y
BEEf
, CH
An
GE
BETW
EEn
200
0 A
nD
203
0
Cons
umpti
onPr
oduc
tion
Impo
rtEx
port
Abs
olut
e ch
ange
Perc
ent c
hang
ePr
opor
tion
of
cha
nge
due
to
chan
ge in
co
nsum
p.
rate
s %
Prop
orti
on
of c
hang
e du
e to
ch
ange
in
popu
lati
on
%
Abs
olut
e ch
ange
Perc
ent
chan
geA
bsol
ute
chan
gePe
rcen
t ch
ange
Abs
olut
e ch
ange
Perc
ent
chan
ge
urb
anRu
ral
Tota
lu
rban
Rura
lTo
tal
Tuni
sia
40.5
3.8
44.3
102.
916
.571
.244
.941
.842
.972
.01.
453
.80.
0
Yem
en70
.861
.113
1.9
475.
815
0.4
237.
78.
676
.083
.819
2.2
48.0
400.
0-0
.1-1
00.0
Sout
h A
sia
2 02
9.9
1 33
7.1
3 36
7.0
179.
646
.383
.73
432.
280
.7-0
.9-1
00.0
64.3
27.3
Afg
hani
stan
131.
615
3.5
285.
139
9.5
161.
822
3.1
17.3
59.6
285.
122
3.1
0.0
0.0
Ban
glad
esh
101.
276
.117
7.3
242.
357
.010
1.2
25.7
59.0
177.
310
1.2
0.0
0.0
Indi
a87
5.9
462.
21
338.
111
9.5
24.4
50.9
16.4
77.2
1 40
5.0
49.1
-0.2
-100
.066
.728
.6
Nep
al76
.579
.715
6.2
335.
354
.392
.011
.879
.515
5.9
91.7
-0.6
-100
.0-0
.9-1
00.0
Pak
ista
n84
0.7
559.
81
400.
528
6.0
94.5
158.
122
.557
.21
399.
115
7.6
0.0
-1.4
-100
.0
Sri L
anka
4.0
5.8
9.8
71.4
20.7
29.3
37.3
56.5
9.8
29.3
-0.1
-100
.0-0
.1-1
00.0
Sub-
Saha
ran
Afr
ica
2 38
9.4
1 37
8.6
3 76
8.0
199.
964
.211
2.7
3 55
5.2
107.
822
3.3
129.
114
.611
.7
Ang
ola
164.
728
.319
3.0
296.
461
.719
0.1
13.6
68.7
194.
322
8.6
-1.3
-7.9
0.0
Ben
in14
.27.
221
.419
9.5
63.1
115.
79.
581
.520
.111
9.6
1.3
76.5
0.0
Bot
swan
a5.
50.
25.
713
1.7
9.0
83.8
122.
7-1
1.2
24.7
90.8
-2.7
-100
.016
.169
.1
Bur
kina
Fas
o53
.274
.312
7.5
493.
117
2.3
236.
518
.456
.814
2.2
205.
5-0
.2-1
00.0
14.5
93.5
Bur
undi
5.1
15.9
21.0
648.
519
3.3
233.
322
.950
.321
.023
3.3
0.0
0.0
Cam
eroo
n84
.27.
892
.017
0.3
18.0
98.9
38.6
44.5
91.9
98.7
-0.1
-100
.0-0
.1-1
00.0
Cen
tral
Afr
ican
Rep
ublic
31.6
18.9
50.5
128.
554
.184
.929
.956
.050
.588
.6-0
.9-2
6.5
-0.9
-100
.0

59
Annex C
cou
nTr
y
BEEf
, CH
An
GE
BETW
EEn
200
0 A
nD
203
0
Cons
umpti
onPr
oduc
tion
Impo
rtEx
port
Abs
olut
e ch
ange
Perc
ent c
hang
ePr
opor
tion
of
cha
nge
due
to
chan
ge in
co
nsum
p.
rate
s %
Prop
orti
on
of c
hang
e du
e to
ch
ange
in
popu
lati
on
%
Abs
olut
e ch
ange
Perc
ent
chan
geA
bsol
ute
chan
gePe
rcen
t ch
ange
Abs
olut
e ch
ange
Perc
ent
chan
ge
urb
anRu
ral
Tota
lu
rban
Rura
lTo
tal
Cha
d64
.154
.711
8.8
309.
298
.815
6.1
8.7
80.3
118.
113
6.1
0.0
-0.7
-6.5
Con
go7.
12.
49.
530
4.7
135.
423
1.7
22.1
51.5
3.0
187.
56.
526
0.0
0.0
Cot
e d’
Ivoi
re48
.514
.162
.621
1.5
45.9
116.
640
.640
.349
.419
3.0
13.1
46.5
0.0
Dem
. Rep
. of t
he C
ongo
46.7
39.3
86.0
696.
027
5.2
409.
532
.229
.333
.524
8.1
52.5
700.
00.
0
Eri
trea
13.9
18.2
32.1
459.
313
5.3
194.
519
.458
.532
.119
8.1
0.1
50.0
0.0
Eth
iopi
a13
6.3
215.
035
1.3
280.
786
.911
8.7
10.8
79.1
351.
311
8.7
0.0
-0.1
-100
.0
Gab
on4.
80.
14.
912
7.7
13.7
114.
027
.754
.91.
521
4.3
3.5
100.
00.
0
Gam
bia
3.8
0.5
4.3
198.
131
.112
6.5
21.4
61.8
3.9
118.
20.
50.
0
Gha
na37
.310
.447
.728
8.4
72.1
174.
137
.138
.318
.485
.229
.350
5.2
-0.1
-100
.0
Gui
nea
34.6
20.9
55.5
287.
310
2.2
170.
827
.749
.154
.916
5.9
-0.7
-100
.0-1
.4-1
00.0
Ken
ya11
1.0
116.
422
7.4
187.
751
.179
.341
.743
.822
7.3
79.2
-0.1
-100
.0-0
.2-1
00.0
Les
otho
2.3
-1.4
0.9
126.
8-2
0.0
10.2
258.
0-1
25.0
0.2
2.7
0.7
53.8
-0.1
-100
.0
Lib
eria
2.9
0.6
3.5
262.
768
.217
5.0
10.4
75.7
1.8
225.
01.
714
1.7
0.0
Mad
agas
car
86.1
65.5
151.
619
4.9
62.1
101.
327
.260
.315
1.6
101.
30.
00.
0
Mal
awi
6.0
4.3
10.3
254.
532
.966
.5-7
.011
2.2
10.3
66.5
0.0
0.0
Mal
i81
.954
.113
6.0
304.
082
.614
7.2
-0.3
100.
813
4.0
117.
10.
0-2
.0-9
.1
Mau
rita
nia
15.3
9.9
25.2
319.
517
6.2
242.
326
.944
.224
.214
7.6
0.0
-1.0
-16.
7

60
Mapping supply and demand for animal-source foods to 2030
cou
nTr
y
BEEf
, CH
An
GE
BETW
EEn
200
0 A
nD
203
0
Cons
umpti
onPr
oduc
tion
Impo
rtEx
port
Abs
olut
e ch
ange
Perc
ent c
hang
ePr
opor
tion
of
cha
nge
due
to
chan
ge in
co
nsum
p.
rate
s %
Prop
orti
on
of c
hang
e du
e to
ch
ange
in
popu
lati
on
%
Abs
olut
e ch
ange
Perc
ent
chan
geA
bsol
ute
chan
gePe
rcen
t ch
ange
Abs
olut
e ch
ange
Perc
ent
chan
ge
urb
anRu
ral
Tota
lu
rban
Rura
lTo
tal
Mau
riti
us3.
20.
84.
058
.824
.645
.543
.447
.30.
00.
03.
438
.2-0
.6-1
00.0
Moz
ambi
que
30.8
9.7
40.5
247.
236
.110
2.8
35.1
47.7
40.5
108.
30.
00.
00.
0
Nig
er21
.858
.580
.332
5.9
170.
519
5.9
2.5
93.1
81.4
181.
3-0
.1-1
00.0
1.0
25.0
Nig
eria
539.
119
4.8
733.
936
1.3
101.
721
5.3
34.9
37.2
639.
722
4.4
94.2
168.
80.
0
Rw
anda
10.2
14.7
24.9
320.
297
.713
6.8
25.5
55.2
25.0
138.
1-0
.1-1
00.0
0.0
Sene
gal
36.3
19.4
55.7
169.
765
.810
9.4
14.8
73.3
52.8
108.
22.
812
7.3
0.0
Sier
ra L
eone
5.8
4.0
9.8
231.
497
.714
8.5
22.9
57.5
8.8
187.
21.
052
.60.
0
Som
alia
77.1
55.2
132.
336
6.9
141.
222
0.1
6.6
81.6
132.
218
8.3
0.0
-0.1
-1.0
Sout
h A
fric
a12
9.5
-61.
468
.140
.5-2
5.1
12.1
139.
8-3
4.0
35.2
6.3
19.9
98.5
-8.3
-100
.0
Suda
n24
8.4
45.7
294.
122
0.4
25.4
100.
424
.660
.429
3.5
98.3
-0.3
-100
.0-0
.9-1
5.3
Swaz
iland
2.9
-1.5
1.4
64.6
-10.
97.
813
1.2
-28.
4-0
.2-1
.4-0
.1-2
.0-1
.6-1
00.0
Togo
6.2
2.2
8.4
270.
871
.415
5.6
27.9
50.2
8.4
161.
5-0
.1-3
3.3
0.0
Uga
nda
45.9
141.
618
7.5
391.
916
3.9
191.
13.
790
.118
7.6
191.
40.
00.
0
Uni
ted
Rep
ublic
of T
an-
zani
a12
5.2
106.
623
1.8
252.
161
.310
3.8
23.8
61.1
231.
810
3.8
-0.1
-100
.0-0
.1-1
00.0
Zam
bia
20.6
15.7
36.3
135.
456
.784
.631
.054
.636
.585
.5-0
.2-1
00.0
0.0
Zim
babw
e25
.3-5
.020
.384
.8-8
.523
.094
.44.
621
.821
.4-0
.2-1
00.0
1.2
8.7
Hig
h in
com
e co
untr
ies
3 01
0.5
-569
.12
441.
422
.2-1
9.8
14.8
2 07
9.9
12.0
-1 7
94.4
-47.
9-1
954
.2-4
5.0

61
Annex C
cou
nTr
y
BEEf
, CH
An
GE
BETW
EEn
200
0 A
nD
203
0
Cons
umpti
onPr
oduc
tion
Impo
rtEx
port
Abs
olut
e ch
ange
Perc
ent c
hang
ePr
opor
tion
of
cha
nge
due
to
chan
ge in
co
nsum
p.
rate
s %
Prop
orti
on
of c
hang
e du
e to
ch
ange
in
popu
lati
on
%
Abs
olut
e ch
ange
Perc
ent
chan
geA
bsol
ute
chan
gePe
rcen
t ch
ange
Abs
olut
e ch
ange
Perc
ent
chan
ge
urb
anRu
ral
Tota
lu
rban
Rura
lTo
tal
Aus
tral
ia14
1.1
-25.
911
5.2
20.7
-26.
514
.8-5
2.4
165.
2-6
7.3
-3.0
-5.9
-100
.0-1
86.9
-12.
6
Can
ada
197.
8-1
1.0
186.
822
.4-7
.218
.1-9
.811
1.7
94.9
5.9
-366
.2-1
00.0
-455
.9-4
8.1
Icel
and
-0.5
0.8
0.3
-13.
254
6.7
8.1
-93.
920
9.9
0.3
8.1
0.0
0.0
Isra
el65
.53.
068
.557
.727
.255
.08.
088
.127
.975
.240
.346
.00.
0
Japa
n53
7.9
68.0
605.
967
.616
.550
.111
4.9
-9.4
258.
051
.319
1.0
21.0
-2.5
-100
.0
New
Zea
land
10.2
-2.1
8.1
10.2
-13.
77.
0-1
30.4
253.
614
7.5
25.6
-11.
0-1
00.0
114.
323
.5
Nor
way
6.2
0.7
6.9
8.2
4.1
7.5
-29.
013
1.9
9.0
10.0
-5.6
-100
.0-3
.5-1
00.0
Rep
ublic
of K
orea
343.
615
.235
8.8
79.1
14.1
66.2
83.9
10.4
359.
512
3.5
-10.
5-4
.0-9
.8-1
00.0
Saud
i Ara
bia
117.
912
.313
0.2
232.
811
1.3
211.
028
.245
.011
.959
.511
5.1
256.
3-3
.3-1
00.0
Swit
zerl
and
-22.
1-1
1.8
-33.
9-1
9.0
-34.
7-2
2.5
73.3
32.0
-30.
2-2
2.1
-5.7
-36.
3-2
.0-1
00.0
Trin
idad
and
Tob
ago
1.4
1.0
2.4
128.
620
.340
.790
.17.
20.
555
.60.
915
.0-1
.0-1
00.0
Uni
ted
Stat
es o
f Am
eric
a1
611.
4-6
19.2
992.
215
.6-3
0.7
8.0
-209
.837
2.7
1 26
7.9
10.8
-1 7
36.8
-85.
3-1
403
.6-1
00.0
62
Mapping supply and demand for animal-source foods to 2030
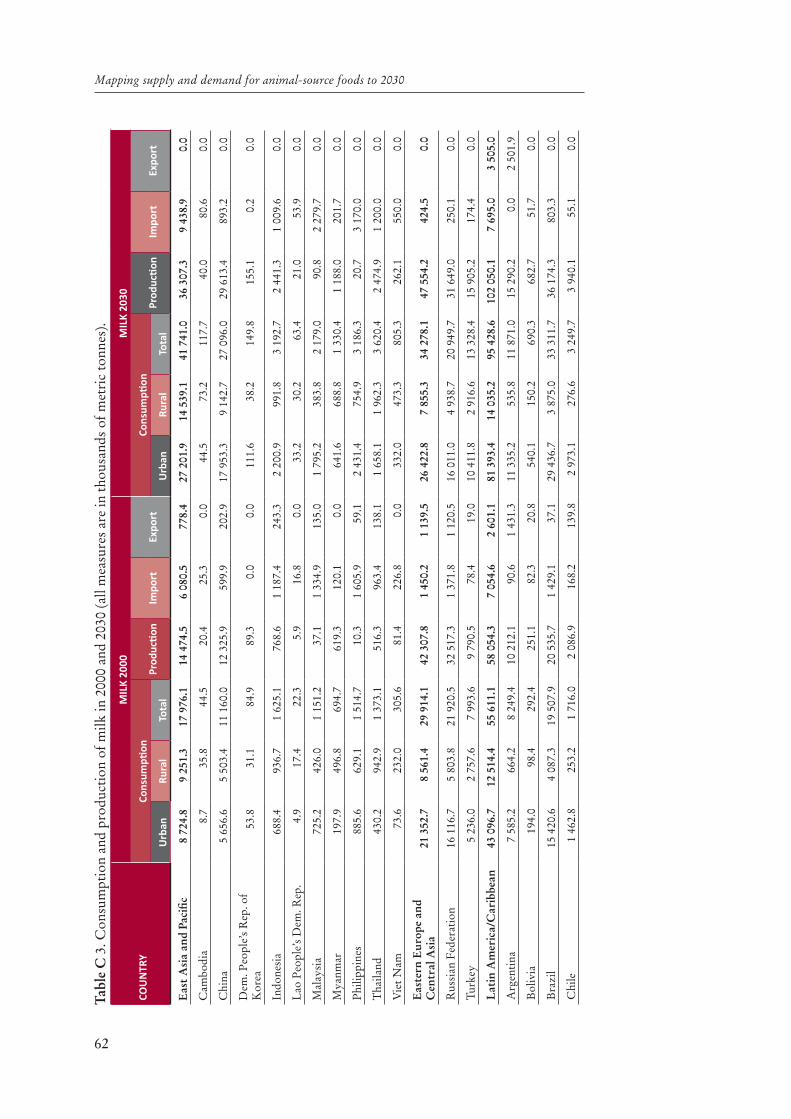
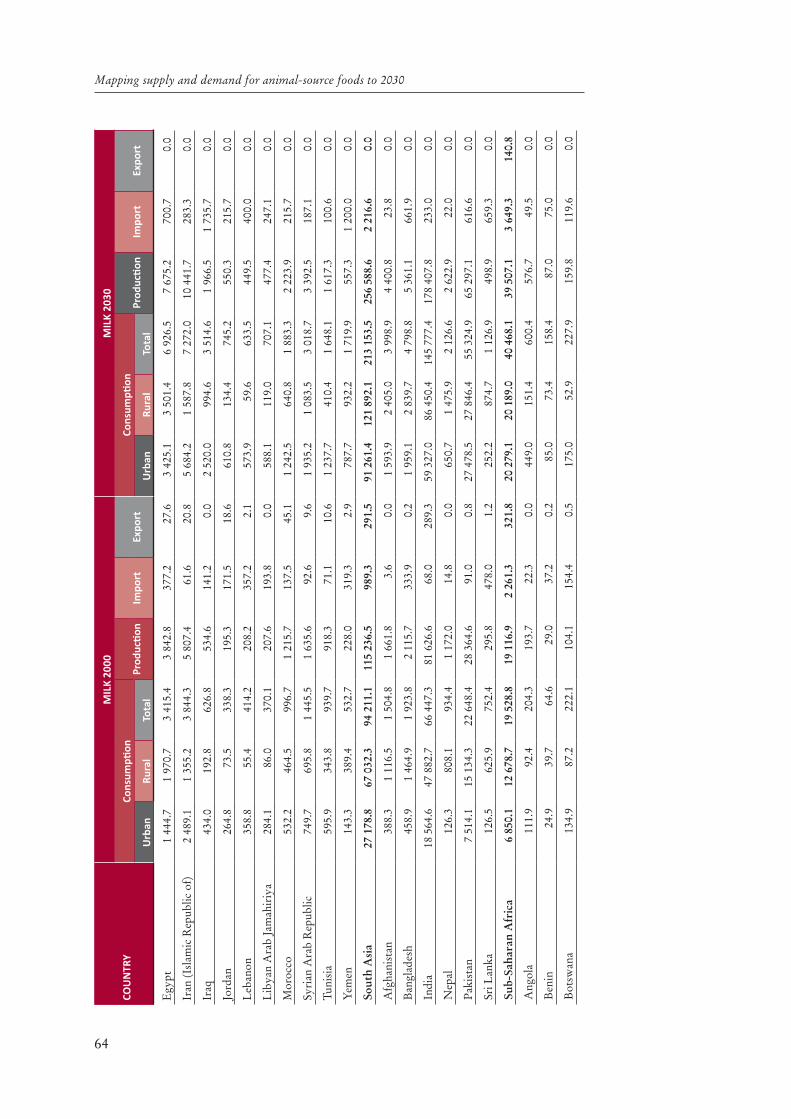
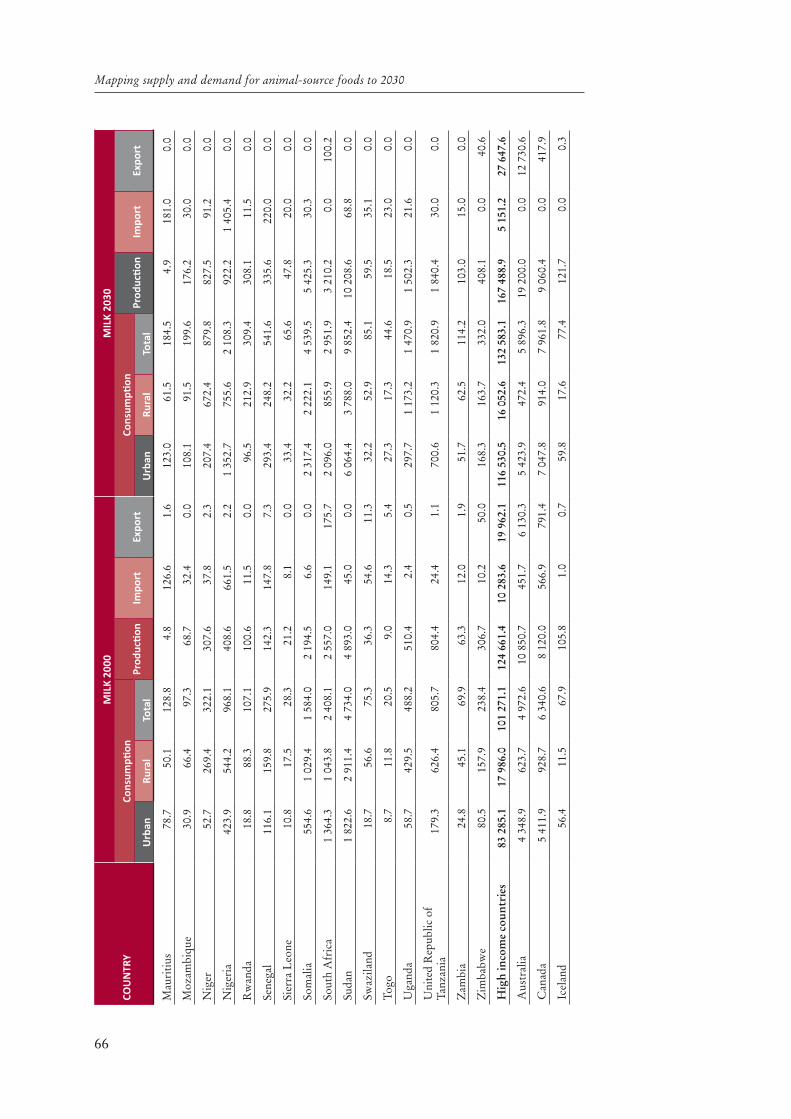
Tabl
e C
3. C
onsu
mpt
ion
and
prod
ucti
on o
f milk
in 2
000
and
2030
(all
mea
sure
s ar
e in
thou
sand
s of
met
ric
tonn
es).
cou
nTr
y
MIl
k 20
00M
Ilk
2030
Cons
umpti
onPr
oduc
tion
Impo
rtEx
port
Cons
umpti
onPr
oduc
tion
Impo
rtEx
port
urb
anRu
ral
Tota
lu
rban
Rura
lTo
tal
Eas
t A
sia
and
Paci
fic8
724.
89
251.
317
976
.114
474
.56
080.
577
8.4
27 2
01.9
14 5
39.1
41 7
41.0
36 3
07.3
9 43
8.9
0.0
Cam
bodi
a8.
735
.844
.520
.425
.30.
044
.573
.211
7.7
40.0
80.6
0.0
Chi
na5
656.
65
503.
411
160
.012
325
.959
9.9
202.
917
953
.39
142.
727
096
.029
613
.489
3.2
0.0
Dem
. Peo
ple’
s R
ep. o
f K
orea
53.8
31.1
84.9
89.3
0.0
0.0
111.
638
.214
9.8
155.
10.
20.
0
Indo
nesi
a68
8.4
936.
71
625.
176
8.6
1 18
7.4
243.
32
200.
999
1.8
3 19
2.7
2 44
1.3
1 00
9.6
0.0
Lao
Peo
ple’
s D
em. R
ep.
4.9
17.4
22.3
5.9
16.8
0.0
33.2
30.2
63.4
21.0
53.9
0.0
Mal
aysi
a72
5.2
426.
01
151.
237
.11
334.
913
5.0
1 79
5.2
383.
82
179.
090
.82
279.
70.
0
Mya
nmar
197.
949
6.8
694.
761
9.3
120.
10.
064
1.6
688.
81
330.
41
188.
020
1.7
0.0
Phi
lippi
nes
885.
662
9.1
1 51
4.7
10.3
1 60
5.9
59.1
2 43
1.4
754.
93
186.
320
.73
170.
00.
0
Tha
iland
430.
294
2.9
1 37
3.1
516.
396
3.4
138.
11
658.
11
962.
33
620.
42
474.
91
200.
00.
0
Vie
t Nam
73.6
232.
030
5.6
81.4
226.
80.
033
2.0
473.
380
5.3
262.
155
0.0
0.0
Eas
tern
Eur
ope
and
C
entr
al A
sia
21 3
52.7
8 56
1.4
29 9
14.1
42 3
07.8
1 45
0.2
1 13
9.5
26 4
22.8
7 85
5.3
34 2
78.1
47 5
54.2
424.
50.
0
Rus
sian
Fed
erat
ion
16 1
16.7
5 80
3.8
21 9
20.5
32 5
17.3
1 37
1.8
1 12
0.5
16 0
11.0
4 93
8.7
20 9
49.7
31 6
49.0
250.
10.
0
Turk
ey5
236.
02
757.
67
993.
69
790.
578
.419
.010
411
.82
916.
613
328
.415
905
.217
4.4
0.0
Lat
in A
mer
ica/
Car
ibbe
an43
096
.712
514
.455
611
.158
054
.37
054.
62
601.
181
393
.414
035
.295
428
.610
2 05
0.1
7 69
5.0
3 50
5.0
Arg
enti
na7
585.
266
4.2
8 24
9.4
10 2
12.1
90.6
1 43
1.3
11 3
35.2
535.
811
871
.015
290
.20.
02
501.
9
Bol
ivia
194.
098
.429
2.4
251.
182
.320
.854
0.1
150.
269
0.3
682.
751
.70.
0
Bra
zil
15 4
20.6
4 08
7.3
19 5
07.9
20 5
35.7
1 42
9.1
37.1
29 4
36.7
3 87
5.0
33 3
11.7
36 1
74.3
803.
30.
0
Chi
le1
462.
825
3.2
1 71
6.0
2 08
6.9
168.
213
9.8
2 97
3.1
276.
63
249.
73
940.
155
.10.
0

63
Annex C
cou
nTr
y
MIl
k 20
00M
Ilk
2030
Cons
umpti
onPr
oduc
tion
Impo
rtEx
port
Cons
umpti
onPr
oduc
tion
Impo
rtEx
port
urb
anRu
ral
Tota
lu
rban
Rura
lTo
tal
Col
ombi
a3
360.
91
263.
04
623.
95
701.
612
4.7
112.
97
154.
71
667.
58
822.
210
605
.25.
80.
0
Cos
ta R
ica
398.
526
6.6
665.
175
8.5
32.5
42.4
938.
432
4.1
1 26
2.5
1 32
0.5
0.0
8.7
Cub
a55
9.9
466.
51
026.
461
7.5
439.
70.
077
6.8
583.
81
360.
61
079.
832
1.7
0.0
Dom
inic
an R
epub
lic31
3.1
188.
150
1.2
406.
311
5.7
0.0
662.
416
5.3
827.
760
3.6
251.
80.
0
Ecu
ador
719.
848
4.9
1 20
4.7
2 06
4.5
10.7
5.6
1 77
5.6
564.
62
340.
24
059.
10.
04.
4
El S
alva
dor
315.
222
5.8
541.
037
9.8
186.
45.
572
1.9
319.
81
041.
787
1.9
204.
80.
0
Gua
tem
ala
211.
825
4.5
466.
326
2.7
205.
32.
360
0.3
386.
898
7.1
587.
140
0.0
0.0
Guy
ana
22.2
46.2
68.4
30.0
38.4
0.0
40.3
60.4
100.
780
.720
.00.
0
Hai
ti49
.880
.813
0.6
63.0
70.3
0.0
157.
971
.722
9.6
107.
912
6.5
0.0
Hon
dura
s31
6.7
378.
769
5.4
575.
812
5.8
5.9
872.
355
2.8
1 42
5.1
1 34
5.4
80.0
0.0
Jam
aica
57.8
53.3
111.
128
.494
.99.
910
4.0
62.5
166.
543
.912
5.0
0.0
Mex
ico
8 26
7.8
2 76
4.1
11 0
31.9
9 35
4.4
2 77
4.0
123.
415
802
.43
166.
318
968
.716
541
.63
580.
20.
0
Nic
arag
ua10
3.2
83.2
186.
423
4.4
54.2
107.
337
8.9
193.
957
2.8
580.
30.
00.
0
Pan
ama
132.
767
.720
0.4
170.
859
.117
.530
9.8
64.9
374.
732
5.7
50.0
0.0
Par
agua
y20
3.7
167.
737
1.4
368.
622
.61.
464
7.2
268.
191
5.3
915.
630
.90.
0
Per
u1
016.
330
0.7
1 31
7.0
1 08
4.8
273.
78.
12
033.
445
7.0
2 49
0.4
2 29
6.1
270.
70.
0
Suri
nam
e23
.53.
727
.213
.29.
50.
031
.93.
235
.119
.117
.50.
0
Uru
guay
604.
553
.265
7.7
1 46
5.4
5.5
524.
782
2.5
48.3
870.
82
315.
60.
099
0.0
Ven
ezue
la1
756.
626
2.7
2 01
9.3
1 38
8.8
641.
45.
23
277.
323
6.9
3 51
4.2
2 26
3.7
1 30
0.0
0.0
Mid
dle
Eas
t/N
orth
Afr
ica
9 59
1.2
6 59
8.9
16 1
90.1
16 2
71.7
3 78
5.2
137.
323
570
.810
532
.634
103
.433
022
.77
785.
90.
0
Alg
eria
2 29
4.7
971.
73
266.
41
478.
21
862.
20.
04
965.
61
068.
96
034.
53
671.
12
500.
00.
0
64
Mapping supply and demand for animal-source foods to 2030
cou
nTr
y
MIl
k 20
00M
Ilk
2030
Cons
umpti
onPr
oduc
tion
Impo
rtEx
port
Cons
umpti
onPr
oduc
tion
Impo
rtEx
port
urb
anRu
ral
Tota
lu
rban
Rura
lTo
tal
Egy
pt1
444.
71
970.
73
415.
43
842.
837
7.2
27.6
3 42
5.1
3 50
1.4
6 92
6.5
7 67
5.2
700.
70.
0
Iran
(Isl
amic
Rep
ublic
of)
2 48
9.1
1 35
5.2
3 84
4.3
5 80
7.4
61.6
20.8
5 68
4.2
1 58
7.8
7 27
2.0
10 4
41.7
283.
30.
0
Iraq
434.
019
2.8
626.
853
4.6
141.
20.
02
520.
099
4.6
3 51
4.6
1 96
6.5
1 73
5.7
0.0
Jord
an26
4.8
73.5
338.
319
5.3
171.
518
.661
0.8
134.
474
5.2
550.
321
5.7
0.0
Leb
anon
358.
855
.441
4.2
208.
235
7.2
2.1
573.
959
.663
3.5
449.
540
0.0
0.0
Lib
yan
Ara
b Ja
mah
iriy
a28
4.1
86.0
370.
120
7.6
193.
80.
058
8.1
119.
070
7.1
477.
424
7.1
0.0
Mor
occo
532.
246
4.5
996.
71
215.
713
7.5
45.1
1 24
2.5
640.
81
883.
32
223.
921
5.7
0.0
Syri
an A
rab
Rep
ublic
749.
769
5.8
1 44
5.5
1 63
5.6
92.6
9.6
1 93
5.2
1 08
3.5
3 01
8.7
3 39
2.5
187.
10.
0
Tuni
sia
595.
934
3.8
939.
791
8.3
71.1
10.6
1 23
7.7
410.
41
648.
11
617.
310
0.6
0.0
Yem
en14
3.3
389.
453
2.7
228.
031
9.3
2.9
787.
793
2.2
1 71
9.9
557.
31
200.
00.
0
Sout
h A
sia
27 1
78.8
67 0
32.3
94 2
11.1
115
236.
598
9.3
291.
591
261
.412
1 89
2.1
213
153.
525
6 58
8.6
2 21
6.6
0.0
Afg
hani
stan
388.
31
116.
51
504.
81
661.
83.
60.
01
593.
92
405.
03
998.
94
400.
823
.80.
0
Ban
glad
esh
458.
91
464.
91
923.
82
115.
733
3.9
0.2
1 95
9.1
2 83
9.7
4 79
8.8
5 36
1.1
661.
90.
0
Indi
a18
564
.647
882
.766
447
.381
626
.668
.028
9.3
59 3
27.0
86 4
50.4
145
777.
417
8 40
7.8
233.
00.
0
Nep
al12
6.3
808.
193
4.4
1 17
2.0
14.8
0.0
650.
71
475.
92
126.
62
622.
922
.00.
0
Pak
ista
n7
514.
115
134
.322
648
.428
364
.691
.00.
827
478
.527
846
.455
324
.965
297
.161
6.6
0.0
Sri L
anka
126.
562
5.9
752.
429
5.8
478.
01.
225
2.2
874.
71
126.
949
8.9
659.
30.
0
Sub-
Saha
ran
Afr
ica
6 85
0.1
12 6
78.7
19 5
28.8
19 1
16.9
2 26
1.3
321.
820
279
.120
189
.040
468
.139
507
.13
649.
314
0.8
Ang
ola
111.
992
.420
4.3
193.
722
.30.
044
9.0
151.
460
0.4
576.
749
.50.
0
Ben
in24
.939
.764
.629
.037
.20.
285
.073
.415
8.4
87.0
75.0
0.0
Bot
swan
a13
4.9
87.2
222.
110
4.1
154.
40.
517
5.0
52.9
227.
915
9.8
119.
60.
0

65
Annex C
cou
nTr
y
MIl
k 20
00M
Ilk
2030
Cons
umpti
onPr
oduc
tion
Impo
rtEx
port
Cons
umpti
onPr
oduc
tion
Impo
rtEx
port
urb
anRu
ral
Tota
lu
rban
Rura
lTo
tal
Bur
kina
Fas
o51
.320
4.2
255.
522
1.0
50.1
0.7
266.
448
7.2
753.
677
7.6
9.9
0.0
Bur
undi
2.9
29.9
32.8
29.3
5.0
0.0
27.0
109.
513
6.5
111.
030
.00.
0
Cam
eroo
n12
1.2
106.
722
7.9
184.
056
.43.
326
7.4
102.
536
9.9
332.
150
.00.
0
Cen
tral
Afr
ican
Rep
ublic
25.4
35.9
61.3
62.8
1.7
0.0
70.0
66.9
136.
913
8.6
3.1
0.0
Cha
d56
.415
0.4
206.
821
9.8
4.7
0.0
239.
331
0.1
549.
458
1.1
5.5
0.0
Con
go20
.815
.636
.41.
035
.50.
183
.937
.012
0.9
3.0
117.
90.
0
Cot
e d’
Ivoi
re49
.165
.711
4.8
24.7
137.
053
.214
2.8
89.8
232.
674
.516
0.0
0.0
Dem
. Rep
. of t
he C
ongo
12.9
27.1
40.0
5.2
35.0
0.0
80.7
79.8
160.
561
.410
0.0
0.0
Eri
trea
14.2
63.6
77.8
67.9
13.3
0.0
67.8
127.
419
5.2
176.
525
.10.
0
Eth
iopi
a20
6.7
1 05
2.4
1 25
9.1
1 30
4.7
7.8
0.0
888.
72
217.
43
106.
13
177.
559
.80.
0
Gab
on34
.54.
739
.21.
637
.80.
075
.45.
180
.56.
274
.70.
0
Gam
bia
19.0
14.3
33.3
7.6
26.2
0.1
49.2
16.3
65.5
26.3
40.0
0.0
Gha
na55
.261
.111
6.3
34.2
84.9
1.0
185.
592
.027
7.5
131.
615
0.0
0.0
Gui
nea
39.3
66.6
105.
979
.031
.00.
212
2.8
108.
523
1.3
188.
950
.00.
0
Ken
ya53
1.4
2 04
2.5
2 57
3.9
2 70
5.9
25.9
2.8
1 32
2.5
2 66
8.1
3 99
0.6
4 14
6.2
24.2
0.0
Les
otho
5.8
22.0
27.8
23.5
6.0
0.0
14.4
19.3
33.7
29.1
6.0
0.0
Lib
eria
4.1
3.4
7.5
0.7
6.8
0.0
17.4
6.5
23.9
2.0
22.0
0.0
Mad
agas
car
155.
036
9.3
524.
353
3.3
18.3
0.2
519.
668
1.1
1 20
0.7
1 19
7.7
46.2
0.0
Mal
awi
6.4
35.7
42.1
34.7
9.2
0.1
23.6
49.8
73.4
48.6
27.2
0.0
Mal
i16
2.5
392.
655
5.1
500.
265
.40.
071
7.3
785.
01
502.
31
380.
815
0.0
0.0
Mau
rita
nia
160.
618
7.7
348.
332
0.6
45.1
0.1
418.
532
1.6
740.
169
4.7
70.7
0.0
66
Mapping supply and demand for animal-source foods to 2030
cou
nTr
y
MIl
k 20
00M
Ilk
2030
Cons
umpti
onPr
oduc
tion
Impo
rtEx
port
Cons
umpti
onPr
oduc
tion
Impo
rtEx
port
urb
anRu
ral
Tota
lu
rban
Rura
lTo
tal
Mau
riti
us78
.750
.112
8.8
4.8
126.
61.
612
3.0
61.5
184.
54.
918
1.0
0.0
Moz
ambi
que
30.9
66.4
97.3
68.7
32.4
0.0
108.
191
.519
9.6
176.
230
.00.
0
Nig
er52
.726
9.4
322.
130
7.6
37.8
2.3
207.
467
2.4
879.
882
7.5
91.2
0.0
Nig
eria
423.
954
4.2
968.
140
8.6
661.
52.
21
352.
775
5.6
2 10
8.3
922.
21
405.
40.
0
Rw
anda
18.8
88.3
107.
110
0.6
11.5
0.0
96.5
212.
930
9.4
308.
111
.50.
0
Sene
gal
116.
115
9.8
275.
914
2.3
147.
87.
329
3.4
248.
254
1.6
335.
622
0.0
0.0
Sier
ra L
eone
10.8
17.5
28.3
21.2
8.1
0.0
33.4
32.2
65.6
47.8
20.0
0.0
Som
alia
554.
61
029.
41
584.
02
194.
56.
60.
02
317.
42
222.
14
539.
55
425.
330
.30.
0
Sout
h A
fric
a1
364.
31
043.
82
408.
12
557.
014
9.1
175.
72
096.
085
5.9
2 95
1.9
3 21
0.2
0.0
100.
2
Suda
n1
822.
62
911.
44
734.
04
893.
045
.00.
06
064.
43
788.
09
852.
410
208
.668
.80.
0
Swaz
iland
18.7
56.6
75.3
36.3
54.6
11.3
32.2
52.9
85.1
59.5
35.1
0.0
Togo
8.7
11.8
20.5
9.0
14.3
5.4
27.3
17.3
44.6
18.5
23.0
0.0
Uga
nda
58.7
429.
548
8.2
510.
42.
40.
529
7.7
1 17
3.2
1 47
0.9
1 50
2.3
21.6
0.0
Uni
ted
Rep
ublic
of
Tanz
ania
179.
362
6.4
805.
780
4.4
24.4
1.1
700.
61
120.
31
820.
91
840.
430
.00.
0
Zam
bia
24.8
45.1
69.9
63.3
12.0
1.9
51.7
62.5
114.
210
3.0
15.0
0.0
Zim
babw
e80
.515
7.9
238.
430
6.7
10.2
50.0
168.
316
3.7
332.
040
8.1
0.0
40.6
Hig
h in
com
e co
untr
ies
83 2
85.1
17 9
86.0
101
271.
112
4 66
1.4
10 2
83.6
19 9
62.1
116
530.
516
052
.613
2 58
3.1
167
488.
95
151.
227
647
.6
Aus
tral
ia4
348.
962
3.7
4 97
2.6
10 8
50.7
451.
76
130.
35
423.
947
2.4
5 89
6.3
19 2
00.0
0.0
12 7
30.6
Can
ada
5 41
1.9
928.
76
340.
68
120.
056
6.9
791.
47
047.
891
4.0
7 96
1.8
9 06
0.4
0.0
417.
9
Icel
and
56.4
11.5
67.9
105.
81.
00.
759
.817
.677
.412
1.7
0.0
0.3

67
Annex C
cou
nTr
y
MIl
k 20
00M
Ilk
2030
Cons
umpti
onPr
oduc
tion
Impo
rtEx
port
Cons
umpti
onPr
oduc
tion
Impo
rtEx
port
urb
anRu
ral
Tota
lu
rban
Rura
lTo
tal
Isra
el1
157.
911
1.3
1 26
9.2
1 22
9.6
132.
38.
61
914.
414
8.7
2 06
3.1
2 09
6.0
124.
90.
0
Japa
n5
543.
02
875.
48
418.
48
419.
22
167.
613
.18
004.
82
886.
810
891
.610
811
.92
710.
10.
0
New
Zea
land
657.
010
1.2
758.
212
092
.856
.19
669.
969
6.0
83.9
779.
916
200
.00.
013
905
.8
Nor
way
949.
223
9.9
1 18
9.1
1 74
1.2
31.2
199.
01
033.
421
9.4
1 25
2.8
2 04
6.7
0.0
171.
9
Rep
ublic
of K
orea
1 02
3.6
252.
71
276.
32
282.
730
8.9
9.2
2 37
9.1
373.
22
752.
34
669.
567
2.2
0.0
Saud
i Ara
bia
1 59
5.1
344.
81
939.
992
3.9
1 27
8.2
211.
64
355.
360
1.6
4 95
6.9
3 56
3.5
1 50
0.0
0.0
Swit
zerl
and
1 65
4.2
485.
82
140.
03
919.
934
4.6
676.
31
614.
938
1.7
1 99
6.6
4 07
9.7
0.0
421.
1
Trin
idad
and
Tob
ago
23.8
102.
712
6.5
10.4
137.
210
.948
.210
9.3
157.
514
.314
4.0
0.0
Uni
ted
Stat
es o
f Am
eric
a60
864
.011
908
.472
772
.474
965
.24
807.
92
241.
183
953
.09
843.
993
796
.995
625
.20.
00.
0

68
Mapping supply and demand for animal-source foods to 2030
Tabl
e C
4. C
hang
e in
con
sum
ptio
n an
d pr
oduc
tion
of m
ilk b
etw
een
2000
and
203
0 (a
bsol
ute
chan
ge is
in th
ousa
nds
of m
etri
c to
nnes
, pro
port
iona
l ch
ange
in p
erce
ntag
e).
cou
nTr
y
mIL
K, C
HA
nG
E BE
TWEE
n 2
000
An
D 2
030
Cons
umpti
onPr
oduc
tion
Impo
rtEx
port
Abs
olut
e ch
ange
Perc
ent c
hang
e
Prop
orti
on
of c
hang
e du
e to
ch
ange
in
cons
ump.
ra
tes
%
Prop
orti
on
of c
hang
e du
e to
ch
ange
in
popu
lati
on
%
Abs
olut
e ch
ange
Perc
ent
chan
geA
bsol
ute
chan
gePe
rcen
t ch
ange
Abs
olut
e ch
ange
Perc
ent
chan
ge
urb
anRu
ral
Tota
lu
rban
Rura
lTo
tal
Eas
t A
sia
and
Paci
fic18
477
.15
287.
823
764
.921
1.8
57.2
132.
221
832
.815
0.8
3 35
8.4
55.2
-778
.4-1
00.0
Cam
bodi
a35
.937
.373
.241
3.4
104.
216
4.5
29.0
48.1
19.6
96.1
55.3
218.
60.
0
Chi
na12
296
.73
639.
315
936
.021
7.4
66.1
142.
879
.39.
717
287
.514
0.3
293.
348
.9-2
02.9
-100
.0
Dem
. Peo
ple’
s R
ep. o
f K
orea
57.9
7.0
64.9
107.
622
.676
.475
.015
.965
.873
.70.
20.
0
Indo
nesi
a1
512.
555
.11
567.
621
9.7
5.9
96.5
51.6
32.3
1 67
2.7
217.
6-1
77.8
-15.
0-2
43.3
-100
.0
Lao
Peo
ple’
s D
em. R
ep.
28.3
12.8
41.1
573.
573
.918
4.3
33.5
41.1
15.1
255.
937
.122
0.8
0.0
Mal
aysi
a1
070.
1-4
2.3
1 02
7.8
147.
6-9
.989
.326
.559
.453
.714
4.7
944.
870
.8-1
35.0
-100
.0
Mya
nmar
443.
719
2.0
635.
722
4.3
38.6
91.5
53.0
31.6
568.
791
.881
.667
.90.
0
Phi
lippi
nes
1 54
5.8
125.
81
671.
617
4.6
20.0
110.
436
.245
.610
.410
1.0
1 56
4.1
97.4
-59.
1-1
00.0
Tha
iland
1 22
7.9
1 01
9.4
2 24
7.3
285.
410
8.1
163.
769
.014
.51
958.
637
9.4
236.
624
.6-1
38.1
-100
.0
Vie
t Nam
258.
424
1.3
499.
735
0.9
104.
016
3.5
55.0
23.7
180.
722
2.0
323.
214
2.5
0.0
Eas
tern
Eur
ope
and
Cen
tral
Asi
a5
070.
1-7
06.1
4 36
4.0
23.7
-8.2
14.6
5 24
6.4
12.4
-1 0
25.7
-70.
7-1
139
.5-1
00.0
Rus
sian
Fed
erat
ion
-105
.7-8
65.1
-970
.8-0
.7-1
4.9
-4.4
-366
.440
1.3
-868
.3-2
.7-1
121
.7-8
1.8
-1 1
20.5
-100
.0
Turk
ey5
175.
815
9.0
5 33
4.8
98.9
5.8
66.7
35.7
51.9
6 11
4.7
62.5
96.0
122.
4-1
9.0
-100
.0

69
Annex C
cou
nTr
y
mIL
K, C
HA
nG
E BE
TWEE
n 2
000
An
D 2
030
Cons
umpti
onPr
oduc
tion
Impo
rtEx
port
Abs
olut
e ch
ange
Perc
ent c
hang
e
Prop
orti
on
of c
hang
e du
e to
ch
ange
in
cons
ump.
ra
tes
%
Prop
orti
on
of c
hang
e du
e to
ch
ange
in
popu
lati
on
%
Abs
olut
e ch
ange
Perc
ent
chan
geA
bsol
ute
chan
gePe
rcen
t ch
ange
Abs
olut
e ch
ange
Perc
ent
chan
ge
urb
anRu
ral
Tota
lu
rban
Rura
lTo
tal
Lat
in A
mer
ica/
C
arib
bean
38 2
96.7
1 52
0.8
39 8
17.5
88.9
12.2
71.6
43 9
95.8
75.8
640.
49.
190
3.9
34.8
Arg
enti
na3
750.
0-1
28.4
3 62
1.6
49.4
-19.
343
.922
.270
.95
078.
149
.7-9
0.6
-100
.01
070.
674
.8
Bol
ivia
346.
151
.839
7.9
178.
452
.613
6.1
35.2
43.8
431.
617
1.9
-30.
6-3
7.2
-20.
8-1
00.0
Bra
zil
14 0
16.1
-212
.313
803
.890
.9-5
.270
.845
.441
.415
638
.676
.2-6
25.8
-43.
8-3
7.1
-100
.0
Chi
le1
510.
323
.41
533.
710
3.2
9.2
89.4
46.9
37.4
1 85
3.2
88.8
-113
.1-6
7.2
-139
.8-1
00.0
Col
ombi
a3
793.
940
4.4
4 19
8.3
112.
932
.090
.835
.349
.04
903.
686
.0-1
18.9
-95.
3-1
12.9
-100
.0
Cos
ta R
ica
539.
957
.559
7.4
135.
521
.689
.830
.055
.156
2.0
74.1
-32.
5-1
00.0
-33.
7-7
9.5
Cub
a21
6.9
117.
333
4.2
38.7
25.2
32.6
95.1
3.8
462.
374
.9-1
18.0
-26.
80.
0
Dom
inic
an R
epub
lic34
9.3
-22.
832
6.5
111.
6-1
2.1
65.1
34.1
54.0
197.
348
.613
6.1
117.
60.
0
Ecu
ador
1 05
5.8
79.7
1 13
5.5
146.
716
.494
.341
.642
.01
994.
696
.6-1
0.7
-100
.0-1
.2-2
1.4
El S
alva
dor
406.
694
.150
0.7
129.
041
.792
.638
.745
.149
2.1
129.
618
.49.
9-5
.5-1
00.0
Gua
tem
ala
388.
613
2.2
520.
818
3.5
51.9
111.
713
.675
.132
4.4
123.
519
4.7
94.8
-2.3
-100
.0
Guy
ana
18.1
14.2
32.3
81.2
30.8
47.2
128.
7-1
7.9
50.7
169.
0-1
8.4
-47.
90.
0
Hai
ti10
8.1
-9.1
99.0
217.
0-1
1.3
75.8
35.4
50.9
44.9
71.3
56.2
79.9
0.0
Hon
dura
s55
5.6
174.
172
9.7
175.
446
.010
4.9
22.4
62.9
769.
613
3.7
-45.
8-3
6.4
-5.9
-100
.0
Jam
aica
46.2
9.2
55.4
80.0
17.2
49.9
28.9
62.2
15.5
54.6
30.1
31.7
-9.9
-100
.0
Mex
ico
7 53
4.6
402.
27
936.
891
.114
.671
.938
.048
.77
187.
276
.880
6.2
29.1
-123
.4-1
00.0

70
Mapping supply and demand for animal-source foods to 2030
cou
nTr
y
mIL
K, C
HA
nG
E BE
TWEE
n 2
000
An
D 2
030
Cons
umpti
onPr
oduc
tion
Impo
rtEx
port
Abs
olut
e ch
ange
Perc
ent c
hang
e
Prop
orti
on
of c
hang
e du
e to
ch
ange
in
cons
ump.
ra
tes
%
Prop
orti
on
of c
hang
e du
e to
ch
ange
in
popu
lati
on
%
Abs
olut
e ch
ange
Perc
ent
chan
geA
bsol
ute
chan
gePe
rcen
t ch
ange
Abs
olut
e ch
ange
Perc
ent
chan
ge
urb
anRu
ral
Tota
lu
rban
Rura
lTo
tal
Nic
arag
ua27
5.8
110.
638
6.4
267.
313
2.9
207.
336
.036
.734
5.9
147.
6-5
4.2
-100
.0-1
07.3
-100
.0
Pan
ama
177.
1-2
.817
4.3
133.
5-4
.287
.025
.561
.015
4.9
90.7
-9.1
-15.
4-1
7.5
-100
.0
Par
agua
y44
3.5
100.
454
3.9
217.
759
.914
6.4
24.8
55.2
547.
014
8.4
8.3
36.7
-1.4
-100
.0
Per
u1
017.
215
6.2
1 17
3.4
100.
151
.989
.135
.948
.51
211.
311
1.7
-3.0
-1.1
-8.1
-100
.0
Suri
nam
e8.
4-0
.57.
936
.0-1
4.7
29.0
41.8
51.8
5.9
44.7
8.0
84.2
0.0
Uru
guay
218.
0-4
.921
3.1
36.1
-9.1
32.4
36.4
56.9
850.
258
.0-5
.5-1
00.0
465.
388
.7
Ven
ezue
la1
520.
7-2
5.8
1 49
4.9
86.6
-9.8
74.0
19.2
70.8
874.
963
.065
8.6
102.
7-5
.2-1
00.0
Mid
dle
Eas
t/N
orth
A
fric
a13
979
.63
933.
717
913
.314
5.8
59.6
110.
616
751
.010
2.9
4 00
0.7
105.
7-1
37.3
-100
.0
Alg
eria
2 67
0.9
97.2
2 76
8.1
116.
410
.084
.731
.554
.12
192.
914
8.3
637.
834
.20.
0
Egy
pt1
980.
41
530.
73
511.
113
7.1
77.7
102.
825
.359
.33
832.
499
.732
3.5
85.8
-27.
6-1
00.0
Iran
(Isl
amic
Rep
ublic
of
)3
195.
223
2.5
3 42
7.7
128.
417
.289
.237
.147
.24
634.
379
.822
1.7
359.
9-2
0.8
-100
.0
Iraq
2 08
6.1
801.
72
887.
848
0.7
415.
846
0.7
40.7
20.7
1 43
1.9
267.
81
594.
51
129.
20.
0
Jord
an34
6.1
60.8
406.
913
0.7
82.7
120.
323
.659
.535
5.0
181.
844
.225
.8-1
8.6
-100
.0
Leb
anon
215.
14.
221
9.3
59.9
7.6
52.9
25.2
66.0
241.
311
5.9
42.8
12.0
-2.1
-100
.0
Lib
yan
Ara
b Ja
mah
iriy
a30
3.9
33.1
337.
010
7.0
38.5
91.1
25.5
60.5
269.
813
0.0
53.3
27.5
0.0
Mor
occo
710.
317
6.3
886.
613
3.4
38.0
89.0
33.1
51.7
1 00
8.2
82.9
78.2
56.9
-45.
1-1
00.0
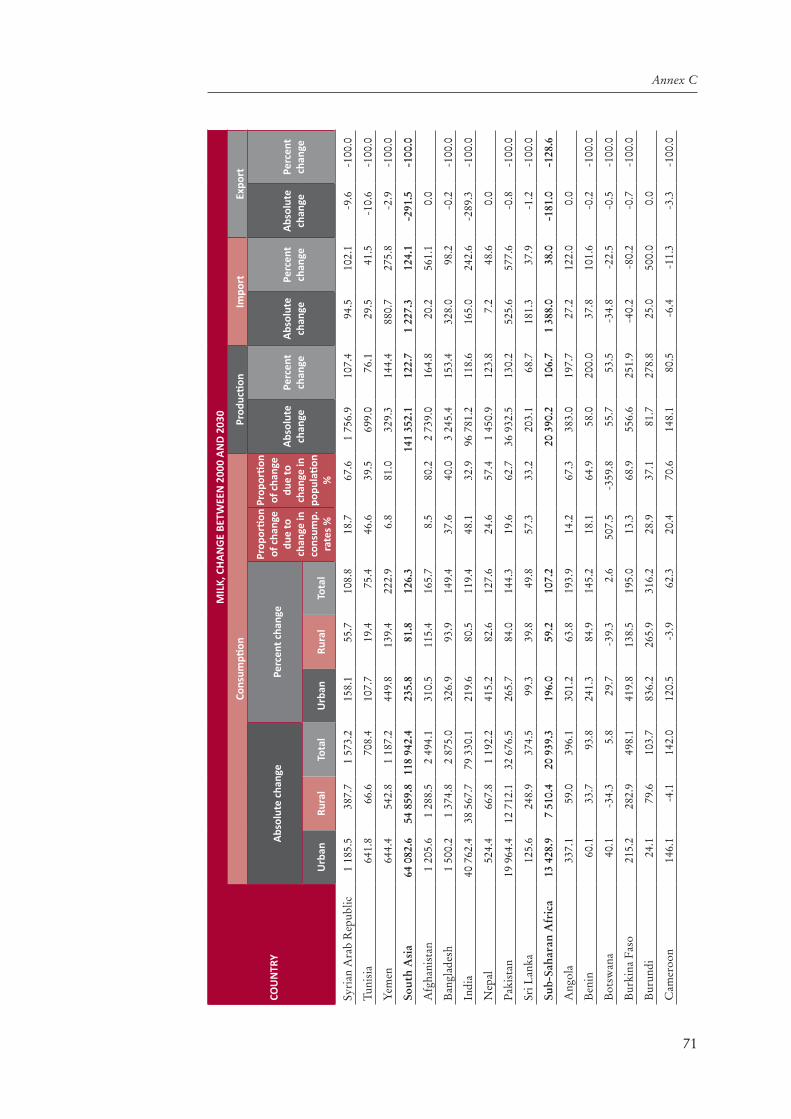
71
Annex C
cou
nTr
y
mIL
K, C
HA
nG
E BE
TWEE
n 2
000
An
D 2
030
Cons
umpti
onPr
oduc
tion
Impo
rtEx
port
Abs
olut
e ch
ange
Perc
ent c
hang
e
Prop
orti
on
of c
hang
e du
e to
ch
ange
in
cons
ump.
ra
tes
%
Prop
orti
on
of c
hang
e du
e to
ch
ange
in
popu
lati
on
%
Abs
olut
e ch
ange
Perc
ent
chan
geA
bsol
ute
chan
gePe
rcen
t ch
ange
Abs
olut
e ch
ange
Perc
ent
chan
ge
urb
anRu
ral
Tota
lu
rban
Rura
lTo
tal
Syri
an A
rab
Rep
ublic
1 18
5.5
387.
71
573.
215
8.1
55.7
108.
818
.767
.61
756.
910
7.4
94.5
102.
1-9
.6-1
00.0
Tuni
sia
641.
866
.670
8.4
107.
719
.475
.446
.639
.569
9.0
76.1
29.5
41.5
-10.
6-1
00.0
Yem
en64
4.4
542.
81
187.
244
9.8
139.
422
2.9
6.8
81.0
329.
314
4.4
880.
727
5.8
-2.9
-100
.0
Sout
h A
sia
64 0
82.6
54 8
59.8
118
942.
423
5.8
81.8
126.
314
1 35
2.1
122.
71
227.
312
4.1
-291
.5-1
00.0
Afg
hani
stan
1 20
5.6
1 28
8.5
2 49
4.1
310.
511
5.4
165.
78.
580
.22
739.
016
4.8
20.2
561.
10.
0
Ban
glad
esh
1 50
0.2
1 37
4.8
2 87
5.0
326.
993
.914
9.4
37.6
40.0
3 24
5.4
153.
432
8.0
98.2
-0.2
-100
.0
Indi
a40
762
.438
567
.779
330
.121
9.6
80.5
119.
448
.132
.996
781
.211
8.6
165.
024
2.6
-289
.3-1
00.0
Nep
al52
4.4
667.
81
192.
241
5.2
82.6
127.
624
.657
.41
450.
912
3.8
7.2
48.6
0.0
Pak
ista
n19
964
.412
712
.132
676
.526
5.7
84.0
144.
319
.662
.736
932
.513
0.2
525.
657
7.6
-0.8
-100
.0
Sri L
anka
125.
624
8.9
374.
599
.339
.849
.857
.333
.220
3.1
68.7
181.
337
.9-1
.2-1
00.0
Sub-
Saha
ran
Afr
ica
13 4
28.9
7 51
0.4
20 9
39.3
196.
059
.210
7.2
20 3
90.2
106.
71
388.
038
.0-1
81.0
-128
.6
Ang
ola
337.
159
.039
6.1
301.
263
.819
3.9
14.2
67.3
383.
019
7.7
27.2
122.
00.
0
Ben
in60
.133
.793
.824
1.3
84.9
145.
218
.164
.958
.020
0.0
37.8
101.
6-0
.2-1
00.0
Bot
swan
a40
.1-3
4.3
5.8
29.7
-39.
32.
650
7.5
-359
.855
.753
.5-3
4.8
-22.
5-0
.5-1
00.0
Bur
kina
Fas
o21
5.2
282.
949
8.1
419.
813
8.5
195.
013
.368
.955
6.6
251.
9-4
0.2
-80.
2-0
.7-1
00.0
Bur
undi
24.1
79.6
103.
783
6.2
265.
931
6.2
28.9
37.1
81.7
278.
825
.050
0.0
0.0
Cam
eroo
n14
6.1
-4.1
142.
012
0.5
-3.9
62.3
20.4
70.6
148.
180
.5-6
.4-1
1.3
-3.3
-100
.0

72
Mapping supply and demand for animal-source foods to 2030
cou
nTr
y
mIL
K, C
HA
nG
E BE
TWEE
n 2
000
An
D 2
030
Cons
umpti
onPr
oduc
tion
Impo
rtEx
port
Abs
olut
e ch
ange
Perc
ent c
hang
e
Prop
orti
on
of c
hang
e du
e to
ch
ange
in
cons
ump.
ra
tes
%
Prop
orti
on
of c
hang
e du
e to
ch
ange
in
popu
lati
on
%
Abs
olut
e ch
ange
Perc
ent
chan
geA
bsol
ute
chan
gePe
rcen
t ch
ange
Abs
olut
e ch
ange
Perc
ent
chan
ge
urb
anRu
ral
Tota
lu
rban
Rura
lTo
tal
Cen
tral
Afr
ican
R
epub
lic44
.631
.075
.617
5.9
86.2
123.
341
.738
.575
.812
0.7
1.4
82.4
0.0
Cha
d18
2.9
159.
734
2.6
324.
310
6.2
165.
710
.875
.736
1.3
164.
40.
817
.00.
0
Con
go63
.121
.484
.530
2.8
137.
723
2.1
22.2
51.4
2.0
200.
082
.423
2.1
-0.1
-100
.0
Cot
e d’
Ivoi
re93
.824
.011
7.8
191.
236
.510
2.6
36.9
45.8
49.8
201.
623
.016
.8-5
3.2
-100
.0
Dem
. Rep
. of t
he
Con
go67
.852
.712
0.5
525.
219
4.6
301.
327
.439
.856
.21
080.
865
.018
5.7
0.0
Eri
trea
53.6
63.8
117.
437
7.0
100.
315
0.9
11.5
75.4
108.
615
9.9
11.8
88.7
0.0
Eth
iopi
a68
2.0
1 16
5.0
1 84
7.0
329.
911
0.7
146.
718
.564
.01
872.
814
3.5
52.0
666.
70.
0
Gab
on40
.90.
441
.311
8.5
9.0
105.
425
.059
.44.
628
7.5
36.9
97.6
0.0
Gam
bia
30.2
2.0
32.2
159.
113
.896
.710
.780
.918
.724
6.1
13.8
52.7
-0.1
-100
.0
Gha
na13
0.3
30.9
161.
223
6.2
50.6
138.
631
.248
.097
.428
4.8
65.1
76.7
-1.0
-100
.0
Gui
nea
83.5
41.9
125.
421
2.4
63.0
118.
415
.970
.810
9.9
139.
119
.061
.3-0
.2-1
00.0
Ken
ya79
1.1
625.
61
416.
714
8.9
30.6
55.0
27.4
63.1
1 44
0.3
53.2
-1.7
-6.6
-2.8
-100
.0
Les
otho
8.6
-2.7
5.9
147.
8-1
2.1
21.2
183.
7-6
0.3
5.6
23.8
0.0
0.0
0.0
Lib
eria
13.3
3.1
16.4
322.
392
.021
8.7
16.9
60.6
1.3
185.
715
.222
3.5
0.0
Mad
agas
car
364.
631
1.8
676.
423
5.3
84.4
129.
07.
284
.966
4.4
124.
627
.915
2.5
-0.2
-100
.0
Mal
awi
17.3
14.0
31.3
270.
539
.374
.3-0
.210
0.3
13.9
40.1
18.0
195.
7-0
.1-1
00.0

73
Annex C
cou
nTr
y
mIL
K, C
HA
nG
E BE
TWEE
n 2
000
An
D 2
030
Cons
umpti
onPr
oduc
tion
Impo
rtEx
port
Abs
olut
e ch
ange
Perc
ent c
hang
e
Prop
orti
on
of c
hang
e du
e to
ch
ange
in
cons
ump.
ra
tes
%
Prop
orti
on
of c
hang
e du
e to
ch
ange
in
popu
lati
on
%
Abs
olut
e ch
ange
Perc
ent
chan
geA
bsol
ute
chan
gePe
rcen
t ch
ange
Abs
olut
e ch
ange
Perc
ent
chan
ge
urb
anRu
ral
Tota
lu
rban
Rura
lTo
tal
Mal
i55
4.8
392.
494
7.2
341.
499
.917
0.6
5.3
86.9
880.
617
6.0
84.6
129.
40.
0
Mau
rita
nia
257.
913
3.9
391.
816
0.6
71.4
112.
52.
395
.337
4.1
116.
725
.656
.8-0
.1-1
00.0
Mau
riti
us44
.311
.455
.756
.222
.943
.241
.449
.70.
12.
154
.443
.0-1
.6-1
00.0
Moz
ambi
que
77.2
25.1
102.
325
0.3
37.7
105.
135
.846
.610
7.5
156.
5-2
.4-7
.40.
0
Nig
er15
4.7
403.
055
7.7
293.
614
9.6
173.
1-1
.910
5.3
519.
916
9.0
53.4
141.
3-2
.3-1
00.0
Nig
eria
928.
821
1.4
1 14
0.2
219.
138
.811
7.8
17.7
68.0
513.
612
5.7
743.
911
2.5
-2.2
-100
.0
Rw
anda
77.7
124.
620
2.3
412.
114
1.2
188.
934
.240
.020
7.5
206.
30.
00.
00.
0
Sene
gal
177.
388
.426
5.7
152.
855
.396
.39.
383
.219
3.3
135.
872
.248
.8-7
.3-1
00.0
Sier
ra L
eone
22.6
14.7
37.3
210.
383
.713
1.8
19.0
64.8
26.6
125.
511
.914
6.9
0.0
Som
alia
1 76
2.8
1 19
2.7
2 95
5.5
317.
911
5.9
186.
61.
396
.33
230.
814
7.2
23.7
359.
10.
0
Sout
h A
fric
a73
1.7
-187
.954
3.8
53.6
-18.
022
.612
3.2
-18.
265
3.2
25.5
-149
.1-1
00.0
-75.
5-4
3.0
Suda
n4
241.
887
6.6
5 11
8.4
232.
730
.110
8.1
27.3
56.1
5 31
5.6
108.
623
.852
.90.
0
Swaz
iland
13.5
-3.7
9.8
72.6
-6.6
13.0
119.
6-1
6.9
23.2
63.9
-19.
5-3
5.7
-11.
3-1
00.0
Togo
18.6
5.5
24.1
214.
546
.311
7.6
18.8
66.5
9.5
105.
68.
760
.8-5
.4-1
00.0
Uga
nda
239.
074
3.7
982.
740
7.1
173.
220
1.3
5.3
85.5
991.
919
4.3
19.2
800.
0-0
.5-1
00.0
Uni
ted
Rep
ublic
of
Tanz
ania
521.
349
3.9
1 01
5.2
290.
878
.812
6.0
30.4
50.3
1 03
6.0
128.
85.
623
.0-1
.1-1
00.0
Zam
bia
26.9
17.4
44.3
108.
438
.663
.418
.572
.939
.762
.73.
025
.0-1
.9-1
00.0

74
Mapping supply and demand for animal-source foods to 2030
cou
nTr
y
mIL
K, C
HA
nG
E BE
TWEE
n 2
000
An
D 2
030
Cons
umpti
onPr
oduc
tion
Impo
rtEx
port
Abs
olut
e ch
ange
Perc
ent c
hang
e
Prop
orti
on
of c
hang
e du
e to
ch
ange
in
cons
ump.
ra
tes
%
Prop
orti
on
of c
hang
e du
e to
ch
ange
in
popu
lati
on
%
Abs
olut
e ch
ange
Perc
ent
chan
geA
bsol
ute
chan
gePe
rcen
t ch
ange
Abs
olut
e ch
ange
Perc
ent
chan
ge
urb
anRu
ral
Tota
lu
rban
Rura
lTo
tal
Zim
babw
e87
.85.
893
.610
9.2
3.6
39.3
96.3
2.7
101.
433
.1-1
0.2
-100
.0-9
.4-1
8.8
Hig
h in
com
e co
untr
ies
33 2
45.4
-1 9
33.4
31 3
12.0
39.9
-10.
730
.942
827
.534
.4-5
132
.4-4
9.9
7 68
5.5
38.5
Aus
tral
ia1
075.
0-1
51.3
923.
724
.7-2
4.3
18.6
-25.
413
1.6
8 34
9.3
76.9
-451
.7-1
00.0
6 60
0.3
107.
7
Can
ada
1 63
5.9
-14.
71
621.
230
.2-1
.625
.617
.579
.094
0.4
11.6
-566
.9-1
00.0
-373
.5-4
7.2
Icel
and
3.4
6.1
9.5
6.1
52.8
14.0
-18.
512
1.7
15.9
15.0
-1.0
-100
.0-0
.4-5
7.1
Isra
el75
6.5
37.4
793.
965
.333
.662
.615
.277
.586
6.4
70.5
-7.4
-5.6
-8.6
-100
.0
Japa
n2
461.
711
.52
473.
244
.40.
429
.412
1.9
-16.
12
392.
728
.454
2.5
25.0
-13.
1-1
00.0
New
Zea
land
39.0
-17.
321
.75.
9-1
7.1
2.9
-443
.562
2.5
4 10
7.2
34.0
-56.
1-1
00.0
4 23
5.9
43.8
Nor
way
84.2
-20.
563
.78.
9-8
.65.
4-7
6.5
184.
130
5.5
17.5
-31.
2-1
00.0
-27.
1-1
3.6
Rep
ublic
of K
orea
1 35
5.5
120.
51
476.
013
2.4
47.7
115.
688
.05.
92
386.
810
4.6
363.
311
7.6
-9.2
-100
.0
Saud
i Ara
bia
2 76
0.2
256.
83
017.
017
3.0
74.5
155.
519
.961
.12
639.
628
5.7
221.
817
.4-2
11.6
-100
.0
Swit
zerl
and
-39.
4-1
04.0
-143
.4-2
.4-2
1.4
-6.7
-8.2
107.
615
9.8
4.1
-344
.6-1
00.0
-255
.2-3
7.7
Trin
idad
and
Tob
ago
24.3
6.7
31.0
102.
26.
524
.585
.512
.03.
937
.56.
85.
0-1
0.9
-100
.0
Uni
ted
Stat
es o
f A
mer
ica
23 0
88.9
-2 0
64.4
21 0
24.5
37.9
-17.
328
.9-2
.910
3.7
20 6
60.0
27.6
-4 8
07.9
-100
.0-2
241
.1-1
00.0

75
Annex C
Tabl
e C
5. C
onsu
mpt
ion
and
prod
ucti
on o
f mut
ton
in 2
000
and
2030
(all
mea
sure
s ar
e in
thou
sand
s of
met
ric
tonn
es).
cou
nTr
y
Mu
TTo
n 2
000
Mu
TTo
n 2
030
Cons
umpti
onPr
oduc
tion
Impo
rtEx
port
Cons
umpti
onPr
oduc
tion
Impo
rtEx
port
urb
anRu
ral
Tota
lu
rban
Rura
lTo
tal
Eas
t A
sia
and
Paci
fic1
456.
81
437.
82
894.
62
869.
833
.18.
23
022.
51
540.
64
563.
14
530.
632
.50.
0
Chi
na1
384.
21
356.
82
741.
02
732.
116
.98.
02
825.
21
453.
14
278.
34
268.
310
.00.
0
Dem
. Peo
ple’
s R
ep. o
f K
orea
6.8
4.0
10.8
10.8
0.0
0.0
16.8
5.7
22.5
22.5
0.0
0.0
Indo
nesi
a33
.245
.478
.678
.00.
70.
195
.743
.213
8.9
138.
90.
00.
0
Lao
Peo
ple’
s D
em. R
ep.
0.1
0.4
0.5
0.5
0.0
0.0
1.0
0.9
1.9
1.9
0.0
0.0
Mal
aysi
a9.
35.
514
.80.
214
.80.
118
.64.
022
.60.
522
.10.
0
Mya
nmar
2.4
6.6
9.0
9.0
0.0
0.0
8.9
9.5
18.4
18.4
0.0
0.0
Phi
lippi
nes
19.5
14.5
34.0
33.5
0.5
0.0
52.1
16.2
68.3
68.3
0.0
0.0
Tha
iland
0.2
0.9
1.1
0.9
0.2
0.0
0.4
1.0
1.4
1.0
0.4
0.0
Vie
t Nam
1.1
3.7
4.8
4.8
0.0
0.0
4.0
6.8
10.8
10.8
0.0
0.0
Eas
tern
Eur
ope
and
C
entr
al A
sia
341.
816
3.5
505.
350
6.0
3.2
4.0
550.
415
9.2
709.
669
9.6
20.0
10.0
Rus
sian
Fed
erat
ion
103.
838
.114
1.9
138.
93.
10.
213
5.4
42.5
177.
915
7.9
20.0
0.0
Turk
ey23
7.9
125.
536
3.4
367.
10.
13.
841
5.0
116.
753
1.7
541.
70.
010
.0
Lat
in A
mer
ica/
Car
ibbe
an34
4.1
98.1
442.
240
6.7
65.2
21.6
577.
610
3.5
681.
163
0.0
89.8
33.3
Arg
enti
na53
.24.
757
.957
.01.
81.
085
.94.
190
.090
.00.
00.
0
Bol
ivia
13.7
7.7
21.4
21.4
0.0
0.0
31.2
9.6
40.8
40.8
0.0
0.0
Bra
zil
91.0
24.5
115.
510
8.2
7.3
0.0
164.
922
.518
7.4
168.
219
.20.
0
Chi
le10
.61.
912
.517
.10.
14.
717
.31.
719
.024
.00.
05.
0
Col
ombi
a9.
23.
512
.713
.00.
00.
315
.33.
719
.019
.00.
00.
0

76
Mapping supply and demand for animal-source foods to 2030
cou
nTr
y
Mu
TTo
n 2
000
Mu
TTo
n 2
030
Cons
umpti
onPr
oduc
tion
Impo
rtEx
port
Cons
umpti
onPr
oduc
tion
Impo
rtEx
port
urb
anRu
ral
Tota
lu
rban
Rura
lTo
tal
Cos
ta R
ica
0.0
0.0
0.0
0.0
0.0
0.0
0.0
0.1
0.1
0.0
0.1
0.0
Cub
a1.
00.
81.
81.
80.
00.
08.
46.
314
.718
.00.
03.
3
Dom
inic
an R
epub
lic0.
70.
41.
11.
00.
10.
00.
80.
31.
11.
10.
00.
0
Ecu
ador
4.6
3.2
7.8
7.7
0.0
0.0
7.8
2.6
10.4
10.4
0.0
0.0
El S
alva
dor
0.0
0.1
0.1
0.1
0.0
0.0
0.1
0.1
0.2
0.2
0.0
0.0
Gua
tem
ala
0.7
1.0
1.7
1.7
0.0
0.0
2.2
1.4
3.6
3.6
0.0
0.0
Guy
ana
0.3
0.5
0.8
0.8
0.0
0.0
0.3
0.4
0.7
0.7
0.0
0.0
Hai
ti2.
64.
26.
86.
80.
00.
011
.45.
216
.616
.60.
00.
0
Hon
dura
s0.
10.
20.
30.
30.
00.
00.
30.
20.
50.
50.
00.
0
Jam
aica
3.4
3.1
6.5
1.7
4.8
0.0
6.1
3.7
9.8
2.2
7.6
0.0
Mex
ico
85.0
29.4
114.
463
.750
.70.
012
9.9
27.4
157.
394
.962
.40.
0
Nic
arag
ua0.
00.
10.
10.
00.
00.
00.
10.
00.
10.
10.
00.
0
Par
agua
y1.
81.
53.
33.
30.
00.
03.
61.
55.
15.
10.
00.
0
Per
u22
.66.
929
.537
.70.
20.
039
.29.
148
.353
.20.
50.
0
Suri
nam
e0.
10.
00.
10.
10.
00.
00.
10.
00.
10.
10.
00.
0
Uru
guay
35.4
3.2
38.6
54.2
0.0
15.6
39.1
2.4
41.5
66.5
0.0
25.0
Ven
ezue
la8.
01.
39.
39.
10.
20.
013
.81.
014
.814
.80.
00.
0
Mid
dle
Eas
t/N
orth
Afr
ica
748.
450
3.7
1 25
2.1
1 23
8.2
47.4
33.5
1 79
5.3
743.
62
538.
92
339.
522
6.8
15.0
Alg
eria
126.
253
.617
9.8
176.
43.
40.
027
7.7
60.1
337.
833
7.8
0.0
0.0
Egy
pt44
.561
.210
5.7
100.
15.
40.
197
.110
0.0
197.
118
7.1
10.0
0.0
Iran
(Isl
amic
Rep
ublic
of)
275.
815
0.4
426.
243
7.2
0.8
11.8
568.
415
8.8
727.
272
7.2
0.0
0.0

77
Annex C
cou
nTr
y
Mu
TTo
n 2
000
Mu
TTo
n 2
030
Cons
umpti
onPr
oduc
tion
Impo
rtEx
port
Cons
umpti
onPr
oduc
tion
Impo
rtEx
port
urb
anRu
ral
Tota
lu
rban
Rura
lTo
tal
Iraq
19.6
8.9
28.5
28.5
0.0
0.0
163.
564
.622
8.1
80.0
148.
10.
0
Jord
an17
.54.
922
.48.
819
.96.
342
.59.
451
.98.
043
.90.
0
Leb
anon
8.2
1.3
9.5
5.4
7.7
0.0
12.8
1.3
14.1
6.0
8.8
0.0
Lib
yan
Ara
b Ja
mah
iriy
a31
.29.
440
.635
.51.
10.
072
.914
.887
.782
.75.
00.
0
Mor
occo
78.5
68.6
147.
114
6.8
0.2
-0.1
176.
991
.426
8.3
267.
31.
00.
0
Syri
an A
rab
Rep
ublic
93.9
87.5
181.
418
8.0
5.3
11.9
231.
512
9.9
361.
438
8.0
0.0
15.0
Tuni
sia
40.2
23.2
63.4
64.1
0.0
0.0
78.8
26.2
105.
010
5.1
0.0
0.0
Yem
en12
.834
.747
.547
.43.
63.
573
.287
.116
0.3
150.
310
.00.
0
Sout
h A
sia
428.
81
068.
91
497.
71
507.
91.
311
.71
379.
31
840.
83
220.
12
957.
626
2.5
0.0
Afg
hani
stan
33.8
97.4
131.
213
1.2
0.0
0.0
209.
231
5.7
524.
952
4.9
0.0
0.0
Ban
glad
esh
31.2
100.
413
1.6
131.
50.
20.
113
0.3
189.
832
0.1
320.
10.
00.
0
Indi
a19
0.4
496.
968
7.3
696.
30.
29.
351
3.3
761.
61
274.
91
024.
925
0.0
0.0
Nep
al5.
334
.639
.939
.80.
30.
227
.262
.489
.689
.60.
00.
0
Pak
ista
n16
7.6
337.
650
5.2
507.
30.
02.
149
8.0
506.
91
004.
999
4.9
10.0
0.0
Sri L
anka
0.4
2.1
2.5
1.8
0.6
0.0
1.3
4.4
5.7
3.2
2.5
0.0
Sub-
Saha
ran
Afr
ica
514.
885
6.9
1 37
1.7
1 37
4.8
81.1
84.3
1 73
7.6
1 51
6.9
3 25
4.5
3 27
8.8
91.2
115.
5
Ang
ola
5.8
4.9
10.7
10.7
0.0
0.0
27.8
9.4
37.2
37.2
0.0
0.0
Ben
in2.
54.
06.
56.
50.
00.
07.
16.
213
.313
.30.
00.
0
Bot
swan
a5.
03.
28.
27.
60.
60.
07.
22.
29.
48.
90.
50.
0
Bur
kina
Fas
o7.
329
.236
.538
.60.
02.
239
.472
.211
1.6
116.
60.
05.
0
Bur
undi
0.3
3.7
4.0
4.0
0.0
0.0
1.9
7.7
9.6
9.6
0.0
0.0

78
Mapping supply and demand for animal-source foods to 2030
cou
nTr
y
Mu
TTo
n 2
000
Mu
TTo
n 2
030
Cons
umpti
onPr
oduc
tion
Impo
rtEx
port
Cons
umpti
onPr
oduc
tion
Impo
rtEx
port
urb
anRu
ral
Tota
lu
rban
Rura
lTo
tal
Cam
eroo
n16
.514
.531
.031
.00.
00.
043
.917
.060
.960
.90.
00.
0
Cen
tral
Afr
ican
Rep
ublic
4.4
6.2
10.6
10.5
0.1
0.0
14.0
13.4
27.4
27.4
0.0
0.0
Cha
d8.
322
.230
.532
.60.
02.
134
.044
.078
.080
.10.
02.
1
Con
go0.
60.
51.
11.
00.
10.
01.
60.
72.
32.
20.
10.
0
Cot
e d’
Ivoi
re4.
35.
710
.08.
11.
90.
011
.37.
318
.616
.62.
00.
0
Dem
. Rep
. of t
he C
ongo
7.0
14.9
21.9
21.8
0.1
0.0
36.2
36.8
73.0
73.0
0.0
0.0
Eri
trea
2.1
9.4
11.5
11.6
0.1
0.1
11.0
20.8
31.8
32.0
0.0
0.2
Eth
iopi
a10
.151
.861
.963
.10.
01.
241
.510
4.5
146.
014
6.0
0.0
0.0
Gab
on1.
10.
11.
21.
00.
20.
02.
00.
22.
22.
00.
20.
0
Gam
bia
0.5
0.3
0.8
0.8
0.0
0.0
1.2
0.4
1.6
1.6
0.0
0.0
Gha
na8.
910
.119
.017
.81.
10.
032
.716
.349
.047
.91.
10.
0
Gui
nea
2.9
5.0
7.9
8.1
0.2
0.4
12.7
11.2
23.9
23.9
0.0
0.0
Ken
ya11
.544
.355
.855
.60.
20.
029
.960
.690
.590
.50.
00.
0
Les
otho
1.1
4.1
5.2
4.3
0.9
0.0
1.6
2.2
3.8
2.8
1.0
0.0
Lib
eria
0.7
0.6
1.3
1.3
0.0
0.0
2.4
1.0
3.4
3.4
0.0
0.0
Mad
agas
car
2.9
6.9
9.8
9.8
0.0
0.0
8.7
11.4
20.1
20.1
0.0
0.0
Mal
awi
0.9
5.2
6.1
6.1
0.0
0.0
6.3
13.5
19.8
19.8
0.0
0.0
Mal
i17
.742
.960
.666
.50.
05.
891
.510
0.4
191.
920
0.0
0.0
8.1
Mau
rita
nia
13.6
15.9
29.5
34.3
0.0
4.8
44.9
34.6
79.5
84.5
0.0
5.0
Mau
riti
us3.
42.
15.
50.
25.
30.
06.
73.
410
.10.
39.
80.
0
Moz
ambi
que
0.9
1.8
2.7
2.7
0.0
0.0
4.3
3.7
8.0
8.0
0.0
0.0

79
Annex C
cou
nTr
y
Mu
TTo
n 2
000
Mu
TTo
n 2
030
Cons
umpti
onPr
oduc
tion
Impo
rtEx
port
Cons
umpti
onPr
oduc
tion
Impo
rtEx
port
urb
anRu
ral
Tota
lu
rban
Rura
lTo
tal
Nig
er6.
432
.739
.142
.80.
03.
722
.974
.297
.110
0.1
0.0
3.0
Nig
eria
100.
513
0.0
230.
522
1.3
9.2
0.0
352.
819
8.9
551.
754
1.7
10.0
0.0
Rw
anda
0.6
2.8
3.4
3.4
0.0
0.0
1.7
3.9
5.6
5.6
0.0
0.0
Sene
gal
13.4
18.5
31.9
27.0
5.0
0.0
41.3
34.9
76.2
71.2
5.0
0.0
Sier
ra L
eone
0.6
1.1
1.7
1.2
0.4
0.0
1.7
1.6
3.3
2.9
0.4
0.0
Som
alia
25.7
47.7
73.4
107.
70.
034
.212
6.3
121.
324
7.6
287.
60.
040
.0
Sout
h A
fric
a10
7.1
82.0
189.
113
4.2
55.1
0.2
129.
453
.118
2.5
121.
860
.70.
0
Suda
n98
.115
6.7
254.
828
4.2
0.0
29.5
466.
529
1.4
757.
981
0.0
0.0
52.1
Swaz
iland
0.8
2.5
3.3
2.8
0.5
0.0
1.3
2.1
3.4
3.0
0.4
0.0
Togo
2.9
4.0
6.9
6.9
0.0
0.0
10.4
6.6
17.0
17.0
0.0
0.0
Uga
nda
3.6
26.4
30.0
30.0
0.0
0.0
15.7
62.6
78.3
78.3
0.0
0.0
Uni
ted
Rep
ublic
of
Tanz
ania
8.8
30.6
39.4
39.3
0.1
0.1
29.3
47.3
76.6
76.6
0.0
0.0
Zam
bia
1.7
3.2
4.9
4.9
0.0
0.0
6.8
8.4
15.2
15.2
0.0
0.0
Zim
babw
e4.
59.
013
.513
.50.
00.
09.
79.
519
.219
.20.
00.
0
Hig
h in
com
e co
untr
ies
708.
513
4.6
843.
11
572.
521
5.2
797.
099
3.6
124.
91
118.
52
294.
540
2.7
1 55
1.0
Aus
tral
ia29
3.1
42.2
335.
380
2.9
0.4
415.
933
1.0
28.9
359.
91
216.
80.
085
0.0
Can
ada
22.3
4.0
26.3
12.8
16.1
1.8
29.1
4.0
33.1
13.5
19.6
0.0
Icel
and
6.5
1.3
7.8
9.0
0.0
1.2
6.0
1.7
7.7
8.7
0.0
1.0
Isra
el6.
50.
67.
15.
21.
90.
010
.80.
711
.58.
03.
50.
0
Japa
n17
.610
.127
.70.
328
.00.
016
.97.
324
.20.
324
.40.
0

80
Mapping supply and demand for animal-source foods to 2030
cou
nTr
y
Mu
TTo
n 2
000
Mu
TTo
n 2
030
Cons
umpti
onPr
oduc
tion
Impo
rtEx
port
Cons
umpti
onPr
oduc
tion
Impo
rtEx
port
urb
anRu
ral
Tota
lu
rban
Rura
lTo
tal
New
Zea
land
82.4
12.7
95.1
539.
74.
035
9.2
83.5
10.1
93.6
813.
90.
070
0.0
Nor
way
19.5
4.9
24.4
23.5
0.9
0.1
21.1
4.5
25.6
25.6
0.0
0.0
Rep
ublic
of K
orea
4.5
1.3
5.8
2.8
4.0
1.0
8.7
1.4
10.1
7.1
3.0
0.0
Saud
i Ara
bia
114.
424
.813
9.2
51.3
89.9
2.0
310.
443
.035
3.4
78.4
275.
00.
0
Swit
zerl
and
10.3
3.1
13.4
6.3
7.1
0.0
9.5
2.3
11.8
7.0
4.8
0.0
Trin
idad
and
Tob
ago
0.4
1.7
2.1
0.5
1.7
0.0
0.7
1.7
2.4
0.0
2.4
0.0
Uni
ted
Stat
es o
f Am
eric
a13
1.1
27.8
158.
911
8.2
61.2
15.8
165.
819
.418
5.2
115.
270
.00.
0
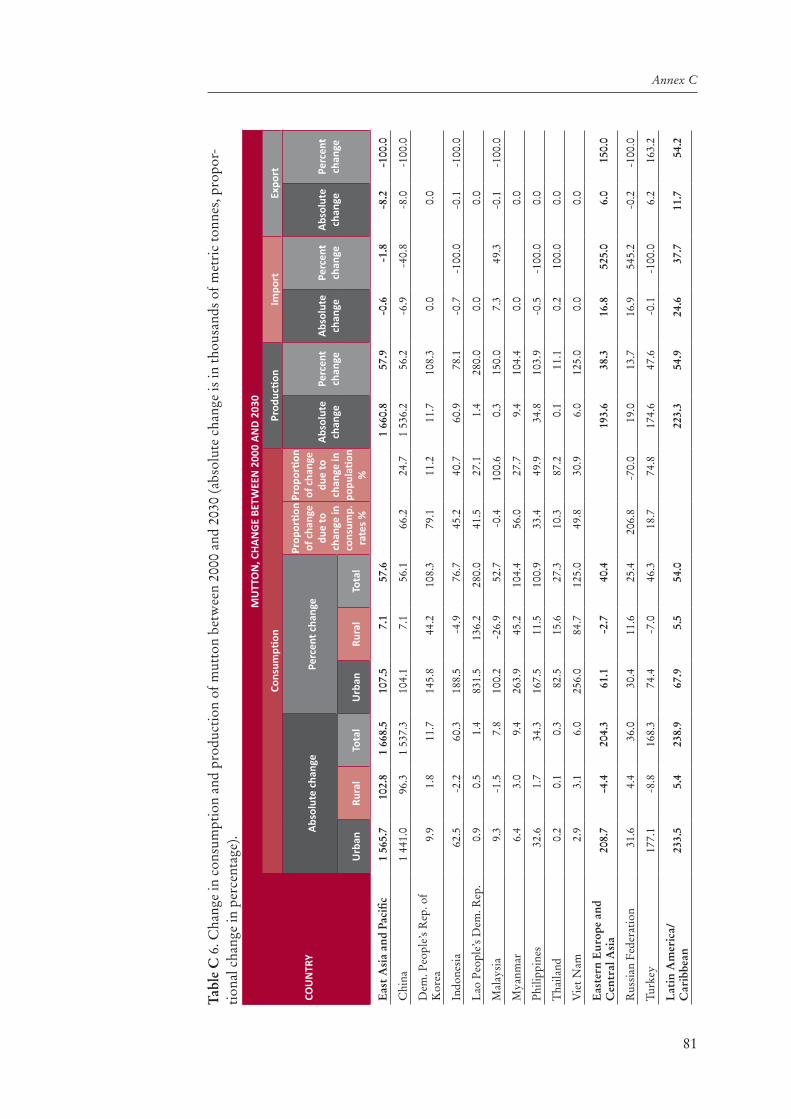
81
Annex C
Tabl
e C
6. C
hang
e in
con
sum
ptio
n an
d pr
oduc
tion
of m
utto
n be
twee
n 20
00 a
nd 2
030
(abs
olut
e ch
ange
is in
thou
sand
s of
met
ric
tonn
es, p
ropo
r-ti
onal
cha
nge
in p
erce
ntag
e).
cou
nTr
y
mu
TTo
n, C
HA
nG
E BE
TWEE
n 2
000
An
D 2
030
Cons
umpti
onPr
oduc
tion
Impo
rtEx
port
Abs
olut
e ch
ange
Perc
ent c
hang
e
Prop
orti
on
of c
hang
e du
e to
ch
ange
in
cons
ump.
ra
tes
%
Prop
orti
on
of c
hang
e du
e to
ch
ange
in
popu
lati
on
%
Abs
olut
e ch
ange
Perc
ent
chan
geA
bsol
ute
chan
gePe
rcen
t ch
ange
Abs
olut
e ch
ange
Perc
ent
chan
ge
urb
anRu
ral
Tota
lu
rban
Rura
lTo
tal
Eas
t A
sia
and
Paci
fic1
565.
710
2.8
1 66
8.5
107.
57.
157
.61
660.
857
.9-0
.6-1
.8-8
.2-1
00.0
Chi
na1
441.
096
.31
537.
310
4.1
7.1
56.1
66.2
24.7
1 53
6.2
56.2
-6.9
-40.
8-8
.0-1
00.0
Dem
. Peo
ple’
s R
ep. o
f K
orea
9.9
1.8
11.7
145.
844
.210
8.3
79.1
11.2
11.7
108.
30.
00.
0
Indo
nesi
a62
.5-2
.260
.318
8.5
-4.9
76.7
45.2
40.7
60.9
78.1
-0.7
-100
.0-0
.1-1
00.0
Lao
Peo
ple’
s D
em. R
ep.
0.9
0.5
1.4
831.
513
6.2
280.
041
.527
.11.
428
0.0
0.0
0.0
Mal
aysi
a9.
3-1
.57.
810
0.2
-26.
952
.7-0
.410
0.6
0.3
150.
07.
349
.3-0
.1-1
00.0
Mya
nmar
6.4
3.0
9.4
263.
945
.210
4.4
56.0
27.7
9.4
104.
40.
00.
0
Phi
lippi
nes
32.6
1.7
34.3
167.
511
.510
0.9
33.4
49.9
34.8
103.
9-0
.5-1
00.0
0.0
Tha
iland
0.2
0.1
0.3
82.5
15.6
27.3
10.3
87.2
0.1
11.1
0.2
100.
00.
0
Vie
t Nam
2.9
3.1
6.0
256.
084
.712
5.0
49.8
30.9
6.0
125.
00.
00.
0
Eas
tern
Eur
ope
and
Cen
tral
Asi
a20
8.7
-4.4
204.
361
.1-2
.740
.419
3.6
38.3
16.8
525.
06.
015
0.0
Rus
sian
Fed
erat
ion
31.6
4.4
36.0
30.4
11.6
25.4
206.
8-7
0.0
19.0
13.7
16.9
545.
2-0
.2-1
00.0
Turk
ey17
7.1
-8.8
168.
374
.4-7
.046
.318
.774
.817
4.6
47.6
-0.1
-100
.06.
216
3.2
Lat
in A
mer
ica/
C
arib
bean
233.
55.
423
8.9
67.9
5.5
54.0
223.
354
.924
.637
.711
.754
.2

82
Mapping supply and demand for animal-source foods to 2030
cou
nTr
y
mu
TTo
n, C
HA
nG
E BE
TWEE
n 2
000
An
D 2
030
Cons
umpti
onPr
oduc
tion
Impo
rtEx
port
Abs
olut
e ch
ange
Perc
ent c
hang
e
Prop
orti
on
of c
hang
e du
e to
ch
ange
in
cons
ump.
ra
tes
%
Prop
orti
on
of c
hang
e du
e to
ch
ange
in
popu
lati
on
%
Abs
olut
e ch
ange
Perc
ent
chan
geA
bsol
ute
chan
gePe
rcen
t ch
ange
Abs
olut
e ch
ange
Perc
ent
chan
ge
urb
anRu
ral
Tota
lu
rban
Rura
lTo
tal
Arg
enti
na32
.7-0
.632
.161
.4-1
2.7
55.4
33.5
56.1
33.0
57.9
-1.8
-100
.0-1
.0-1
00.0
Bol
ivia
17.5
1.9
19.4
127.
524
.890
.721
.465
.819
.490
.70.
00.
0
Bra
zil
73.9
-2.0
71.9
81.2
-8.0
62.3
41.0
47.0
60.0
55.5
11.9
163.
00.
0
Chi
le6.
6-0
.16.
562
.4-7
.652
.026
.864
.36.
940
.4-0
.1-1
00.0
0.3
6.4
Col
ombi
a6.
10.
26.
366
.65.
249
.67.
289
.66.
046
.20.
0-0
.3-1
00.0
Cos
ta R
ica
0.0
0.1
0.1
0.0
100.
010
0.0
66.9
0.0
0.0
0.1
0.0
Cub
a7.
45.
512
.975
4.1
672.
271
6.7
98.6
0.2
16.2
900.
00.
03.
3
Dom
inic
an R
epub
lic0.
1-0
.10.
019
.9-3
2.0
0.0
0.1
10.0
-0.1
-100
.00.
0
Ecu
ador
3.2
-0.6
2.6
68.7
-17.
533
.3-1
3.4
118.
72.
735
.10.
00.
0
El S
alva
dor
0.1
0.0
0.1
237.
121
.810
0.0
41.1
41.8
0.1
100.
00.
00.
0
Gua
tem
ala
1.4
0.5
1.9
199.
046
.711
1.8
13.6
75.0
1.9
111.
80.
00.
0
Guy
ana
0.0
-0.1
-0.1
7.7
-22.
1-1
2.5
35.5
67.5
-0.1
-12.
50.
00.
0
Hai
ti8.
81.
09.
834
3.1
23.5
144.
152
.926
.89.
814
4.1
0.0
0.0
Hon
dura
s0.
10.
10.
212
3.1
30.3
66.7
0.6
99.0
0.2
66.7
0.0
0.0
Jam
aica
2.7
0.6
3.3
81.1
18.1
50.8
29.7
61.1
0.5
29.4
2.8
58.3
0.0
Mex
ico
44.9
-2.0
42.9
52.9
-6.9
37.5
4.9
93.4
31.2
49.0
11.7
23.1
0.0
Nic
arag
ua0.
00.
00.
011
0.4
-43.
10.
00.
10.
00.
0
Par
agua
y1.
80.
01.
898
.32.
154
.5-2
6.6
148.
11.
854
.50.
00.
0

83
Annex C
cou
nTr
y
mu
TTo
n, C
HA
nG
E BE
TWEE
n 2
000
An
D 2
030
Cons
umpti
onPr
oduc
tion
Impo
rtEx
port
Abs
olut
e ch
ange
Perc
ent c
hang
e
Prop
orti
on
of c
hang
e du
e to
ch
ange
in
cons
ump.
ra
tes
%
Prop
orti
on
of c
hang
e du
e to
ch
ange
in
popu
lati
on
%
Abs
olut
e ch
ange
Perc
ent
chan
geA
bsol
ute
chan
gePe
rcen
t ch
ange
Abs
olut
e ch
ange
Perc
ent
chan
ge
urb
anRu
ral
Tota
lu
rban
Rura
lTo
tal
Per
u16
.52.
318
.873
.033
.163
.722
.467
.815
.541
.10.
315
0.0
0.0
Suri
nam
e0.
00.
00.
05.
5-2
9.3
0.0
0.0
0.0
0.0
0.0
Uru
guay
3.7
-0.8
2.9
10.5
-25.
37.
5-1
22.7
245.
312
.322
.70.
09.
460
.3
Ven
ezue
la5.
8-0
.35.
572
.0-2
1.5
59.1
7.5
88.6
5.7
62.6
-0.2
-100
.00.
0
Mid
dle
Eas
t/
Nor
th A
fric
a1
047.
023
9.8
1 28
6.8
139.
947
.610
2.8
1 10
1.3
88.9
179.
437
8.5
-18.
5-5
5.2
Alg
eria
151.
56.
515
8.0
120.
012
.187
.932
.852
.216
1.4
91.5
-3.4
-100
.00.
0
Egy
pt52
.738
.791
.411
8.5
63.2
86.5
18.4
70.5
87.0
86.9
4.6
85.2
-0.1
-100
.0
Iran
(Isl
amic
Rep
ublic
of)
292.
68.
430
1.0
106.
15.
670
.628
.459
.629
0.0
66.3
-0.8
-100
.0-1
1.8
-100
.0
Iraq
143.
955
.719
9.6
733.
462
7.3
700.
444
.313
.651
.518
0.7
148.
10.
0
Jord
an25
.04.
529
.514
2.9
91.6
131.
726
.654
.4-0
.8-9
.124
.012
0.6
-6.3
-100
.0
Leb
anon
4.5
0.1
4.6
55.1
5.6
48.4
20.6
72.1
0.6
11.1
1.1
14.3
0.0
Lib
yan
Ara
b Ja
mah
iriy
a41
.75.
447
.113
3.9
56.9
116.
033
.947
.547
.213
3.0
3.9
354.
50.
0
Mor
occo
98.4
22.8
121.
212
5.4
33.2
82.4
30.2
55.8
120.
582
.10.
840
0.0
0.1
-100
.0
Syri
an A
rab
Rep
ublic
137.
542
.518
0.0
146.
448
.699
.214
.974
.220
0.0
106.
4-5
.3-1
00.0
3.1
26.1
Tuni
sia
38.6
3.0
41.6
96.1
12.7
65.6
42.1
45.4
41.0
64.0
0.0
0.0
Yem
en60
.552
.311
2.8
474.
115
0.6
237.
58.
576
.010
2.9
217.
16.
417
7.8
-3.5
-100
.0
Sout
h A
sia
950.
577
1.9
1 72
2.4
221.
772
.211
5.0
1 44
9.7
96.1
261.
220
092
.3-1
1.7
-100
.0

84
Mapping supply and demand for animal-source foods to 2030
cou
nTr
y
mu
TTo
n, C
HA
nG
E BE
TWEE
n 2
000
An
D 2
030
Cons
umpti
onPr
oduc
tion
Impo
rtEx
port
Abs
olut
e ch
ange
Perc
ent c
hang
e
Prop
orti
on
of c
hang
e du
e to
ch
ange
in
cons
ump.
ra
tes
%
Prop
orti
on
of c
hang
e du
e to
ch
ange
in
popu
lati
on
%
Abs
olut
e ch
ange
Perc
ent
chan
geA
bsol
ute
chan
gePe
rcen
t ch
ange
Abs
olut
e ch
ange
Perc
ent
chan
ge
urb
anRu
ral
Tota
lu
rban
Rura
lTo
tal
Afg
hani
stan
175.
421
8.3
393.
751
8.4
224.
230
0.1
23.9
44.3
393.
730
0.1
0.0
0.0
Ban
glad
esh
99.1
89.4
188.
531
7.3
89.1
143.
236
.541
.718
8.6
143.
4-0
.2-1
00.0
-0.1
-100
.0
Indi
a32
2.9
264.
758
7.6
169.
653
.385
.538
.846
.032
8.6
47.2
249.
812
4 90
0.0
-9.3
-100
.0
Nep
al21
.927
.849
.740
9.1
80.6
124.
623
.858
.849
.812
5.1
-0.3
-100
.0-0
.2-1
00.0
Pak
ista
n33
0.4
169.
349
9.7
197.
250
.198
.94.
591
.448
7.6
96.1
10.0
-2.1
-100
.0
Sri L
anka
0.9
2.3
3.2
210.
111
2.1
128.
074
.712
.91.
477
.81.
931
6.7
0.0
Sub-
Saha
ran
Afr
ica
1 22
2.9
659.
91
882.
823
7.6
77.0
137.
31
904.
013
8.5
10.1
12.5
31.2
37.0
Ang
ola
22.0
4.5
26.5
375.
993
.624
7.7
20.5
52.7
26.5
247.
70.
00.
0
Ben
in4.
62.
26.
818
3.4
55.5
104.
65.
190
.16.
810
4.6
0.0
0.0
Bot
swan
a2.
2-1
.01.
244
.8-3
2.0
14.6
181.
2-6
4.2
1.3
17.1
-0.1
-16.
70.
0
Bur
kina
Fas
o32
.143
.075
.143
8.6
147.
420
5.8
14.8
65.3
78.0
202.
10.
02.
812
7.3
Bur
undi
1.5
4.1
5.6
443.
011
1.1
140.
07.
583
.85.
614
0.0
0.0
0.0
Cam
eroo
n27
.42.
529
.916
6.2
17.3
96.5
37.8
45.6
29.9
96.5
0.0
0.0
Cen
tral
Afr
ican
Rep
ublic
9.6
7.2
16.8
219.
711
5.4
158.
547
.530
.016
.916
1.0
-0.1
-100
.00.
0
Cha
d25
.721
.847
.530
9.4
98.3
155.
78.
680
.547
.514
5.7
0.0
0.0
0.0
Con
go1.
00.
21.
216
0.9
42.4
109.
1-4
.310
9.4
1.2
120.
00.
00.
00.
0
Cot
e d’
Ivoi
re7.
01.
68.
616
4.8
27.5
86.0
30.9
54.6
8.5
104.
90.
15.
30.
0
Dem
. Rep
. of t
he C
ongo
29.2
21.9
51.1
418.
314
6.7
233.
322
.151
.451
.223
4.9
-0.1
-100
.00.
0
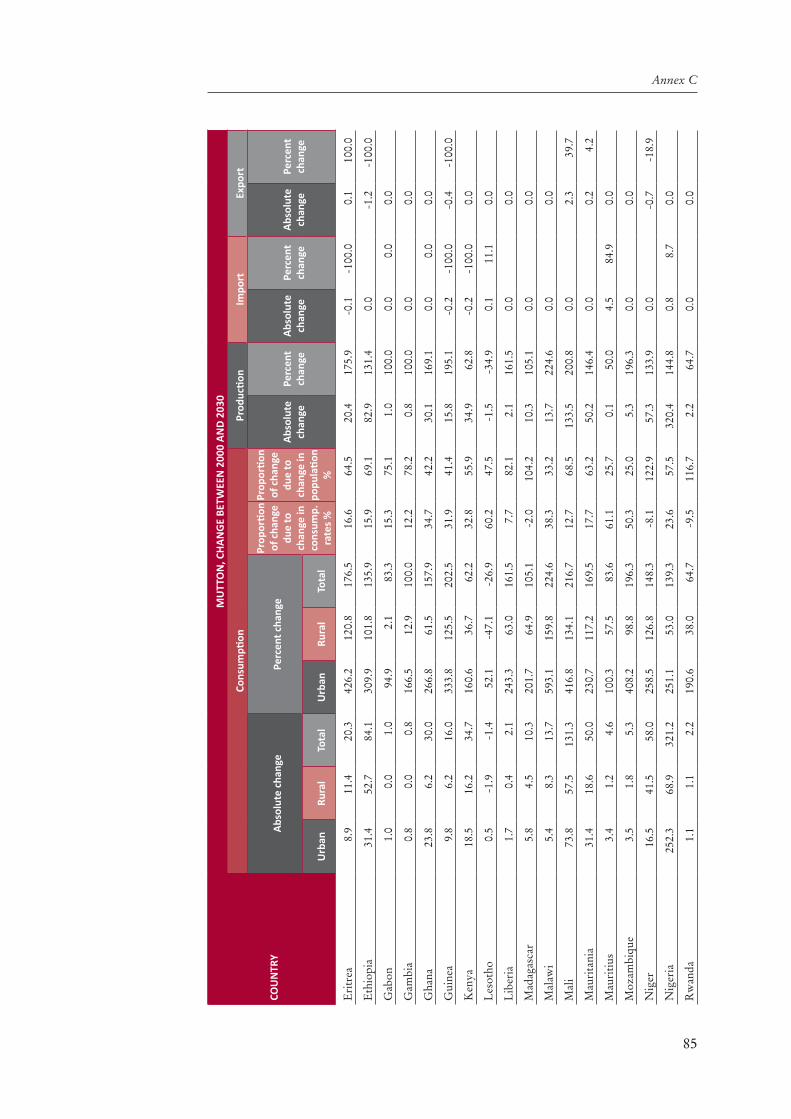
85
Annex C
cou
nTr
y
mu
TTo
n, C
HA
nG
E BE
TWEE
n 2
000
An
D 2
030
Cons
umpti
onPr
oduc
tion
Impo
rtEx
port
Abs
olut
e ch
ange
Perc
ent c
hang
e
Prop
orti
on
of c
hang
e du
e to
ch
ange
in
cons
ump.
ra
tes
%
Prop
orti
on
of c
hang
e du
e to
ch
ange
in
popu
lati
on
%
Abs
olut
e ch
ange
Perc
ent
chan
geA
bsol
ute
chan
gePe
rcen
t ch
ange
Abs
olut
e ch
ange
Perc
ent
chan
ge
urb
anRu
ral
Tota
lu
rban
Rura
lTo
tal
Eri
trea
8.9
11.4
20.3
426.
212
0.8
176.
516
.664
.520
.417
5.9
-0.1
-100
.00.
110
0.0
Eth
iopi
a31
.452
.784
.130
9.9
101.
813
5.9
15.9
69.1
82.9
131.
40.
0-1
.2-1
00.0
Gab
on1.
00.
01.
094
.92.
183
.315
.375
.11.
010
0.0
0.0
0.0
0.0
Gam
bia
0.8
0.0
0.8
166.
512
.910
0.0
12.2
78.2
0.8
100.
00.
00.
0
Gha
na23
.86.
230
.026
6.8
61.5
157.
934
.742
.230
.116
9.1
0.0
0.0
0.0
Gui
nea
9.8
6.2
16.0
333.
812
5.5
202.
531
.941
.415
.819
5.1
-0.2
-100
.0-0
.4-1
00.0
Ken
ya18
.516
.234
.716
0.6
36.7
62.2
32.8
55.9
34.9
62.8
-0.2
-100
.00.
0
Les
otho
0.5
-1.9
-1.4
52.1
-47.
1-2
6.9
60.2
47.5
-1.5
-34.
90.
111
.10.
0
Lib
eria
1.7
0.4
2.1
243.
363
.016
1.5
7.7
82.1
2.1
161.
50.
00.
0
Mad
agas
car
5.8
4.5
10.3
201.
764
.910
5.1
-2.0
104.
210
.310
5.1
0.0
0.0
Mal
awi
5.4
8.3
13.7
593.
115
9.8
224.
638
.333
.213
.722
4.6
0.0
0.0
Mal
i73
.857
.513
1.3
416.
813
4.1
216.
712
.768
.513
3.5
200.
80.
02.
339
.7
Mau
rita
nia
31.4
18.6
50.0
230.
711
7.2
169.
517
.763
.250
.214
6.4
0.0
0.2
4.2
Mau
riti
us3.
41.
24.
610
0.3
57.5
83.6
61.1
25.7
0.1
50.0
4.5
84.9
0.0
Moz
ambi
que
3.5
1.8
5.3
408.
298
.819
6.3
50.3
25.0
5.3
196.
30.
00.
0
Nig
er16
.541
.558
.025
8.5
126.
814
8.3
-8.1
122.
957
.313
3.9
0.0
-0.7
-18.
9
Nig
eria
252.
368
.932
1.2
251.
153
.013
9.3
23.6
57.5
320.
414
4.8
0.8
8.7
0.0
Rw
anda
1.1
1.1
2.2
190.
638
.064
.7-9
.511
6.7
2.2
64.7
0.0
0.0

86
Mapping supply and demand for animal-source foods to 2030
cou
nTr
y
mu
TTo
n, C
HA
nG
E BE
TWEE
n 2
000
An
D 2
030
Cons
umpti
onPr
oduc
tion
Impo
rtEx
port
Abs
olut
e ch
ange
Perc
ent c
hang
e
Prop
orti
on
of c
hang
e du
e to
ch
ange
in
cons
ump.
ra
tes
%
Prop
orti
on
of c
hang
e du
e to
ch
ange
in
popu
lati
on
%
Abs
olut
e ch
ange
Perc
ent
chan
geA
bsol
ute
chan
gePe
rcen
t ch
ange
Abs
olut
e ch
ange
Perc
ent
chan
ge
urb
anRu
ral
Tota
lu
rban
Rura
lTo
tal
Sene
gal
27.9
16.4
44.3
208.
088
.813
8.9
23.5
57.7
44.2
163.
70.
00.
00.
0
Sier
ra L
eone
1.0
0.6
1.6
161.
253
.694
.15.
090
.71.
714
1.7
0.0
0.0
0.0
Som
alia
100.
673
.617
4.2
391.
915
4.2
237.
38.
775
.717
9.9
167.
00.
05.
817
.0
Sout
h A
fric
a22
.2-2
8.8
-6.6
20.7
-35.
2-3
.5-1
8.4
117.
7-1
2.4
-9.2
5.6
10.2
-0.2
-100
.0
Suda
n36
8.4
134.
750
3.1
375.
785
.919
7.4
43.1
30.7
525.
818
5.0
0.0
22.6
76.6
Swaz
iland
0.5
-0.4
0.1
57.2
-14.
83.
017
6.7
-72.
80.
27.
1-0
.1-2
0.0
0.0
Togo
7.5
2.6
10.1
256.
366
.114
6.4
26.2
53.4
10.1
146.
40.
00.
0
Uga
nda
12.2
36.1
48.3
342.
313
6.6
161.
0-2
.510
6.9
48.3
161.
00.
00.
0
Uni
ted
Rep
ublic
of
Tanz
ania
20.6
16.6
37.2
235.
054
.294
.420
.167
.137
.394
.9-0
.1-1
00.0
-0.1
-100
.0
Zam
bia
5.1
5.2
10.3
292.
816
4.9
210.
253
.322
.010
.321
0.2
0.0
0.0
Zim
babw
e5.
20.
55.
711
4.8
5.7
42.2
96.5
2.5
5.7
42.2
0.0
0.0
Hig
h in
com
e co
untr
ies
285.
1-9
.727
5.4
40.2
-7.2
32.7
722.
045
.918
7.5
87.1
754.
094
.6
Aus
tral
ia37
.9-1
3.3
24.6
12.9
-31.
67.
3-1
87.4
333.
241
3.9
51.6
-0.4
-100
.043
4.1
104.
4
Can
ada
6.8
0.0
6.8
30.5
-0.3
25.9
18.2
78.1
0.7
5.5
3.5
21.7
-1.8
-100
.0
Icel
and
-0.5
0.4
-0.1
-8.1
32.2
-1.3
1 22
0.0
-1 3
27.7
-0.3
-3.3
0.0
-0.2
-16.
7
Isra
el4.
30.
14.
465
.621
.862
.014
.778
.22.
853
.81.
684
.20.
0
Japa
n-0
.7-2
.8-3
.5-3
.8-2
8.0
-12.
665
.737
.40.
00.
0-3
.6-1
2.9
0.0

87
Annex C
cou
nTr
y
mu
TTo
n, C
HA
nG
E BE
TWEE
n 2
000
An
D 2
030
Cons
umpti
onPr
oduc
tion
Impo
rtEx
port
Abs
olut
e ch
ange
Perc
ent c
hang
e
Prop
orti
on
of c
hang
e du
e to
ch
ange
in
cons
ump.
ra
tes
%
Prop
orti
on
of c
hang
e du
e to
ch
ange
in
popu
lati
on
%
Abs
olut
e ch
ange
Perc
ent
chan
geA
bsol
ute
chan
gePe
rcen
t ch
ange
Abs
olut
e ch
ange
Perc
ent
chan
ge
urb
anRu
ral
Tota
lu
rban
Rura
lTo
tal
New
Zea
land
1.2
-2.7
-1.5
1.4
-20.
8-1
.61
043.
6-1
129
.627
4.2
50.8
-4.0
-100
.034
0.8
94.9
Nor
way
1.7
-0.5
1.2
8.5
-9.3
4.9
-91.
520
0.5
2.1
8.9
-0.9
-100
.0-0
.1-1
00.0
Rep
ublic
of K
orea
4.2
0.1
4.3
92.1
11.0
74.1
84.9
9.3
4.3
153.
6-1
.0-2
5.0
-1.0
-100
.0
Saud
i Ara
bia
196.
118
.121
4.2
171.
473
.015
3.9
19.6
61.7
27.1
52.8
185.
120
5.9
-2.0
-100
.0
Swit
zerl
and
-0.8
-0.8
-1.6
-7.6
-26.
4-1
1.9
42.7
60.4
0.7
11.1
-2.3
-32.
40.
0
Trin
idad
and
Tob
ago
0.3
0.0
0.3
85.7
-2.2
14.3
77.1
20.6
-0.5
-100
.00.
741
.20.
0
Uni
ted
Stat
es o
f Am
eric
a34
.7-8
.426
.326
.4-3
0.1
16.6
-62.
418
1.0
-3.0
-2.5
8.8
14.4
-15.
8-1
00.0

88
Mapping supply and demand for animal-source foods to 2030
Tabl
e C
7. C
onsu
mpt
ion
and
prod
ucti
on o
f por
k in
200
0 an
d 20
30 (a
ll m
easu
res
are
in th
ousa
nds
of m
etri
c to
nnes
).
cou
nTr
y
pork
200
0po
rk 2
030
Cons
umpti
onPr
oduc
tion
Impo
rtEx
port
Cons
umpti
onPr
oduc
tion
Impo
rtEx
port
urb
anRu
ral
Tota
lu
rban
Rura
lTo
tal
Eas
t A
sia
and
Paci
fic22
154
.722
410
.944
565
.644
814
.818
8.2
439.
847
268
.125
372
.272
640
.372
757
.822
.013
0.0
Cam
bodi
a20
.484
.710
5.1
105.
10.
00.
013
3.4
219.
935
3.3
353.
30.
00.
0
Chi
na20
623
.420
075
.240
698
.640
896
.114
8.5
340.
341
575
.221
173
.462
748
.662
758
.00.
00.
0
Dem
. Peo
ple’
s R
ep. o
f K
orea
90.0
50.9
140.
913
9.6
1.3
0.0
186.
763
.024
9.7
247.
72.
00.
0
Indo
nesi
a20
1.6
275.
047
6.6
493.
21.
919
.11
153.
952
0.7
1 67
4.6
1 69
4.6
0.0
20.0
Lao
Peo
ple’
s D
em. R
ep.
7.3
26.0
33.3
33.3
0.0
0.0
48.2
44.6
92.8
92.8
0.0
0.0
Mal
aysi
a10
6.3
62.7
169.
016
6.1
8.1
5.0
292.
062
.435
4.4
354.
50.
00.
0
Mya
nmar
32.2
81.4
113.
611
3.5
0.2
0.0
147.
515
9.0
306.
530
6.5
0.0
0.0
Phi
lippi
nes
609.
543
3.2
1 04
2.7
1 01
4.8
28.4
0.5
1 86
6.9
579.
72
446.
62
426.
620
.00.
0
Tha
iland
147.
032
2.4
469.
447
1.6
0.1
10.0
448.
853
1.7
980.
599
0.5
0.0
10.0
Vie
t Nam
317.
099
9.4
1 31
6.4
1 38
1.5
-0.3
64.9
1 41
5.4
2 01
7.9
3 43
3.3
3 53
3.3
0.0
100.
0
Eas
tern
Eur
ope
and
C
entr
al A
sia
1 50
1.8
541.
02
042.
81
517.
640
3.7
10.4
1 64
6.0
508.
92
154.
91
958.
820
0.0
0.2
Rus
sian
Fed
erat
ion
1 50
1.8
540.
92
042.
71
517.
440
3.6
10.2
1 64
5.9
508.
92
154.
81
958.
520
0.0
0.0
Turk
ey0.
00.
10.
10.
20.
10.
20.
10.
00.
10.
30.
00.
2
Lat
in A
mer
ica/
Car
ibbe
an3
337.
31
078.
54
415.
84
327.
841
8.6
310.
77
465.
11
356.
18
821.
28
634.
91
103.
489
0.0
Arg
enti
na26
1.9
23.0
284.
920
8.4
77.3
0.8
368.
417
.238
5.6
305.
680
.00.
0
Bol
ivia
49.0
26.9
75.9
75.6
0.3
0.0
123.
036
.315
9.3
159.
30.
00.
0
Bra
zil
1 28
7.4
342.
11
629.
51
845.
91.
121
8.0
3 43
4.3
452.
13
886.
44
736.
40.
085
0.0
Chi
le21
1.7
36.6
248.
326
9.6
3.1
24.4
371.
534
.740
6.2
446.
20.
040
.0

89
Annex C
cou
nTr
y
pork
200
0po
rk 2
030
Cons
umpti
onPr
oduc
tion
Impo
rtEx
port
Cons
umpti
onPr
oduc
tion
Impo
rtEx
port
urb
anRu
ral
Tota
lu
rban
Rura
lTo
tal
Col
ombi
a68
.125
.693
.786
.37.
40.
019
7.5
45.9
243.
422
0.0
23.4
0.0
Cos
ta R
ica
18.5
12.4
30.9
31.8
1.5
2.1
52.4
18.1
70.5
70.5
0.0
0.0
Cub
a79
.966
.514
6.4
133.
011
.8-1
.511
6.5
87.6
204.
118
0.0
24.1
0.0
Dom
inic
an R
epub
lic39
.323
.763
.060
.62.
40.
012
6.5
31.6
158.
115
8.1
0.0
0.0
Ecu
ador
69.2
46.8
116.
011
5.4
0.7
0.1
171.
054
.422
5.4
225.
40.
00.
0
El S
alva
dor
7.2
5.1
12.3
8.1
4.8
0.7
18.2
8.2
26.4
19.4
7.0
0.0
Gua
tem
ala
14.9
18.0
32.9
24.5
10.3
1.9
57.3
37.2
94.5
84.5
10.0
0.0
Guy
ana
0.3
0.5
0.8
0.5
0.3
0.0
0.8
1.3
2.1
0.5
1.6
0.0
Hai
ti12
.920
.933
.828
.75.
10.
061
.027
.888
.883
.75.
10.
0
Hon
dura
s7.
79.
216
.99.
57.
50.
119
.612
.532
.124
.18.
00.
0
Jam
aica
4.2
3.9
8.1
6.6
1.6
0.1
7.4
4.4
11.8
11.8
0.0
0.0
Mex
ico
909.
230
4.2
1 21
3.4
1 01
7.4
258.
762
.61
718.
434
5.3
2 06
3.7
1 16
3.7
900.
00.
0
Nic
arag
ua3.
52.
96.
45.
91.
40.
917
.79.
126
.826
.80.
00.
0
Pan
ama
20.8
10.7
31.5
22.2
10.2
0.2
62.6
13.2
75.8
67.3
10.0
0.0
Par
agua
y76
.963
.714
0.6
139.
90.
80.
115
9.5
66.4
225.
922
5.9
0.0
0.0
Per
u59
.117
.576
.694
.20.
50.
117
0.0
38.2
208.
221
0.0
21.3
0.0
Suri
nam
e1.
40.
21.
61.
10.
40.
02.
50.
22.
72.
00.
70.
0
Uru
guay
33.9
3.0
36.9
26.5
10.4
0.0
44.0
2.5
46.5
36.5
10.0
0.0
Ven
ezue
la10
0.3
15.1
115.
411
6.1
1.0
0.1
164.
912
.017
6.9
177.
22.
20.
0
Mid
dle
Eas
t/N
orth
Afr
ica
12.4
4.1
16.5
6.3
10.8
0.3
20.0
5.0
25.0
9.7
16.4
0.0
Alg
eria
0.2
0.0
0.2
0.1
0.0
0.0
0.2
0.0
0.2
0.2
0.0
0.0
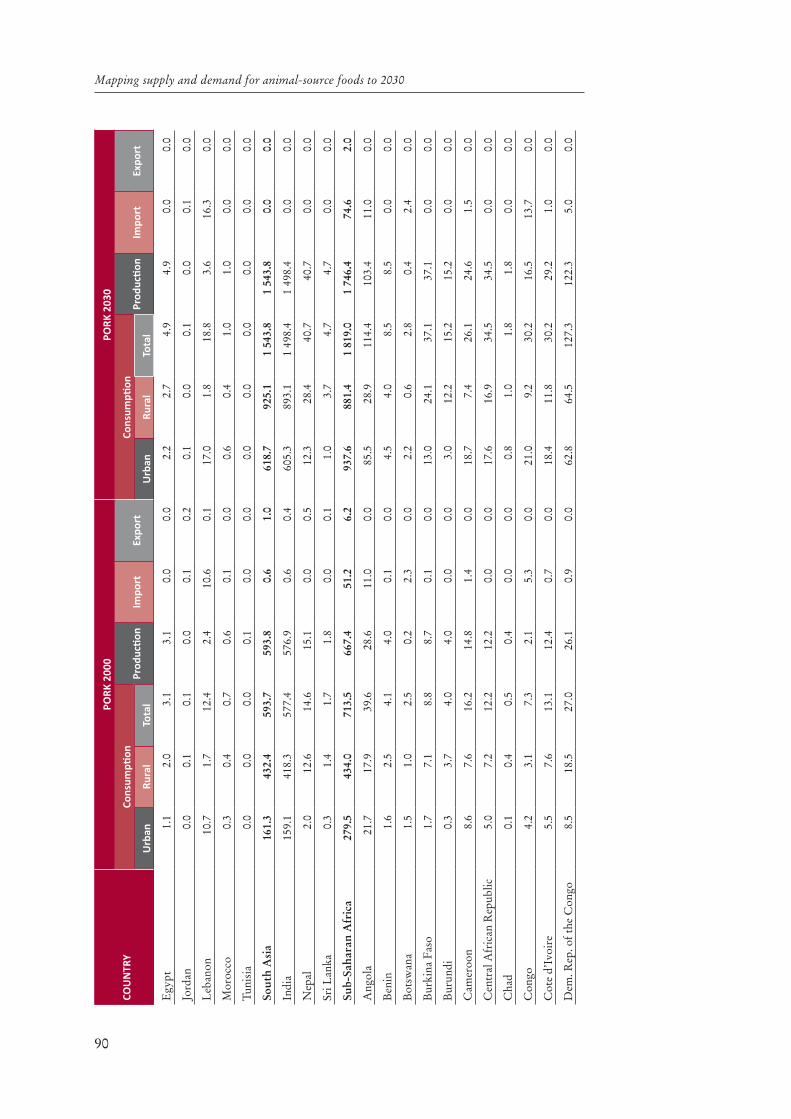
90
Mapping supply and demand for animal-source foods to 2030
cou
nTr
y
pork
200
0po
rk 2
030
Cons
umpti
onPr
oduc
tion
Impo
rtEx
port
Cons
umpti
onPr
oduc
tion
Impo
rtEx
port
urb
anRu
ral
Tota
lu
rban
Rura
lTo
tal
Egy
pt1.
12.
03.
13.
10.
00.
02.
22.
74.
94.
90.
00.
0
Jord
an0.
00.
10.
10.
00.
10.
20.
10.
00.
10.
00.
10.
0
Leb
anon
10.7
1.7
12.4
2.4
10.6
0.1
17.0
1.8
18.8
3.6
16.3
0.0
Mor
occo
0.3
0.4
0.7
0.6
0.1
0.0
0.6
0.4
1.0
1.0
0.0
0.0
Tuni
sia
0.0
0.0
0.0
0.1
0.0
0.0
0.0
0.0
0.0
0.0
0.0
0.0
Sout
h A
sia
161.
343
2.4
593.
759
3.8
0.6
1.0
618.
792
5.1
1 54
3.8
1 54
3.8
0.0
0.0
Indi
a15
9.1
418.
357
7.4
576.
90.
60.
460
5.3
893.
11
498.
41
498.
40.
00.
0
Nep
al2.
012
.614
.615
.10.
00.
512
.328
.440
.740
.70.
00.
0
Sri L
anka
0.3
1.4
1.7
1.8
0.0
0.1
1.0
3.7
4.7
4.7
0.0
0.0
Sub-
Saha
ran
Afr
ica
279.
543
4.0
713.
566
7.4
51.2
6.2
937.
688
1.4
1 81
9.0
1 74
6.4
74.6
2.0
Ang
ola
21.7
17.9
39.6
28.6
11.0
0.0
85.5
28.9
114.
410
3.4
11.0
0.0
Ben
in1.
62.
54.
14.
00.
10.
04.
54.
08.
58.
50.
00.
0
Bot
swan
a1.
51.
02.
50.
22.
30.
02.
20.
62.
80.
42.
40.
0
Bur
kina
Fas
o1.
77.
18.
88.
70.
10.
013
.024
.137
.137
.10.
00.
0
Bur
undi
0.3
3.7
4.0
4.0
0.0
0.0
3.0
12.2
15.2
15.2
0.0
0.0
Cam
eroo
n8.
67.
616
.214
.81.
40.
018
.77.
426
.124
.61.
50.
0
Cen
tral
Afr
ican
Rep
ublic
5.0
7.2
12.2
12.2
0.0
0.0
17.6
16.9
34.5
34.5
0.0
0.0
Cha
d0.
10.
40.
50.
40.
00.
00.
81.
01.
81.
80.
00.
0
Con
go4.
23.
17.
32.
15.
30.
021
.09.
230
.216
.513
.70.
0
Cot
e d’
Ivoi
re5.
57.
613
.112
.40.
70.
018
.411
.830
.229
.21.
00.
0
Dem
. Rep
. of t
he C
ongo
8.5
18.5
27.0
26.1
0.9
0.0
62.8
64.5
127.
312
2.3
5.0
0.0

91
Annex C
cou
nTr
y
pork
200
0po
rk 2
030
Cons
umpti
onPr
oduc
tion
Impo
rtEx
port
Cons
umpti
onPr
oduc
tion
Impo
rtEx
port
urb
anRu
ral
Tota
lu
rban
Rura
lTo
tal
Eth
iopi
a0.
21.
31.
51.
50.
00.
00.
72.
43.
13.
10.
00.
0
Gab
on8.
41.
29.
63.
16.
50.
019
.11.
320
.47.
912
.50.
0
Gam
bia
0.2
0.1
0.3
0.3
0.0
0.0
0.5
0.2
0.7
0.5
0.2
0.0
Gha
na6.
27.
013
.210
.62.
60.
021
.611
.032
.626
.66.
00.
0
Gui
nea
0.6
1.1
1.7
1.6
0.1
0.0
3.2
2.8
6.0
6.0
0.0
0.0
Ken
ya2.
39.
111
.412
.20.
10.
912
.124
.937
.037
.00.
00.
0
Les
otho
0.6
2.1
2.7
2.7
0.0
0.0
2.1
3.0
5.1
5.1
0.0
0.0
Lib
eria
2.8
2.3
5.1
4.3
0.8
0.0
9.0
3.3
12.3
11.3
1.0
0.0
Mad
agas
car
19.5
46.7
66.2
66.0
0.1
0.0
72.3
95.0
167.
316
7.3
0.0
0.0
Mal
awi
3.1
17.6
20.7
20.6
0.1
0.0
22.3
47.1
69.4
69.4
0.0
0.0
Mal
i0.
71.
72.
42.
30.
10.
03.
03.
36.
36.
30.
00.
0
Mau
riti
us1.
71.
12.
80.
82.
00.
02.
91.
44.
31.
33.
00.
0
Moz
ambi
que
4.1
9.1
13.2
12.8
0.3
0.0
15.9
13.4
29.3
29.0
0.3
0.0
Nig
er0.
21.
21.
41.
40.
00.
00.
62.
43.
03.
00.
00.
0
Nig
eria
69.8
90.8
160.
615
8.6
2.0
0.0
265.
214
8.2
413.
440
8.4
5.0
0.0
Rw
anda
0.6
2.6
3.2
3.2
0.0
0.0
2.5
5.6
8.1
8.1
0.0
0.0
Sene
gal
2.9
4.0
6.9
6.7
0.2
0.0
11.8
10.2
22.0
22.0
0.0
0.0
Sier
ra L
eone
0.9
1.5
2.4
2.3
0.0
0.0
2.7
2.6
5.3
5.3
0.0
0.0
Som
alia
0.0
0.1
0.1
0.1
0.0
0.0
0.1
0.2
0.3
0.0
0.3
0.0
Sout
h A
fric
a71
.054
.412
5.4
116.
311
.32.
211
5.9
47.7
163.
615
3.6
10.0
0.0
Swaz
iland
0.6
1.7
2.3
1.1
1.9
1.7
1.2
2.1
3.3
1.6
1.7
0.0

92
Mapping supply and demand for animal-source foods to 2030
cou
nTr
y
pork
200
0po
rk 2
030
Cons
umpti
onPr
oduc
tion
Impo
rtEx
port
Cons
umpti
onPr
oduc
tion
Impo
rtEx
port
urb
anRu
ral
Tota
lu
rban
Rura
lTo
tal
Togo
1.9
2.7
4.6
4.5
0.2
0.1
6.5
4.1
10.6
10.6
0.0
0.0
Uga
nda
9.2
68.7
77.9
77.8
0.2
0.0
52.7
209.
726
2.4
262.
40.
00.
0
Uni
ted
Rep
ublic
of
Tanz
ania
2.9
10.4
13.3
12.8
0.5
0.0
17.3
28.2
45.5
45.5
0.0
0.0
Zam
bia
3.8
7.0
10.8
10.6
0.2
0.0
9.6
11.7
21.3
21.3
0.0
0.0
Zim
babw
e6.
212
.318
.519
.70.
21.
319
.418
.938
.340
.30.
02.
0
Hig
h in
com
e co
untr
ies
10 8
68.9
2 63
8.3
13 5
07.2
13 2
85.6
2 20
2.6
1 73
1.4
14 2
43.5
2 19
8.5
16 4
42.0
16 4
13.9
1 52
5.6
1 28
6.4
Aus
tral
ia31
2.4
44.9
357.
336
6.1
35.7
44.5
460.
440
.150
0.5
500.
50.
00.
0
Can
ada
799.
013
7.4
936.
42
029.
693
.41
036.
398
2.0
127.
41
109.
42
300.
00.
01
031.
4
Icel
and
4.1
0.8
4.9
4.9
0.0
0.0
6.1
1.8
7.9
7.9
0.0
0.0
Isra
el9.
30.
910
.210
.40.
00.
116
.61.
317
.917
.90.
00.
0
Japa
n1
479.
676
8.2
2 24
7.8
1 25
7.6
1 03
5.5
0.9
1 77
7.9
642.
42
420.
31
188.
11
280.
00.
0
New
Zea
land
60.1
9.3
69.4
47.5
22.7
0.4
78.7
9.5
88.2
63.2
25.0
0.0
Nor
way
82.5
20.9
103.
410
7.0
2.4
6.0
106.
522
.712
9.2
133.
00.
05.
0
Rep
ublic
of K
orea
815.
520
1.6
1 01
7.1
946.
716
2.7
64.4
1 42
7.6
223.
81
651.
41
451.
420
0.0
0.0
Saud
i Ara
bia
0.2
0.2
0.4
0.0
1.3
1.0
0.4
0.4
0.8
0.0
0.8
0.0
Swit
zerl
and
190.
255
.824
6.0
228.
617
.70.
317
2.2
40.8
213.
019
7.1
15.8
0.0
Trin
idad
and
Tob
ago
0.9
4.0
4.9
1.8
3.6
0.6
2.0
4.4
6.4
2.4
4.0
0.0
Uni
ted
Stat
es o
f Am
eric
a7
115.
21
394.
28
509.
48
285.
482
7.6
576.
99
213.
21
083.
810
297
.010
552
.40.
025
0.0

93
Annex C
Tabl
e C
8. C
hang
e in
con
sum
ptio
n an
d pr
oduc
tion
of p
ork
betw
een
2000
and
203
0 (a
bsol
ute
chan
ge is
in th
ousa
nds
of m
etri
c to
nnes
, pro
port
iona
l ch
ange
in p
erce
ntag
e).
cou
nTr
y
PoRK
, CH
An
GE
BETW
EEn
200
0 A
nD
203
0
Cons
umpti
onPr
oduc
tion
Impo
rtEx
port
Abs
olut
e ch
ange
Perc
ent c
hang
e
Prop
orti
on
of c
hang
e du
e to
ch
ange
in
cons
ump.
ra
tes
%
Prop
orti
on
of c
hang
e du
e to
ch
ange
in
popu
lati
on
%
Abs
olut
e ch
ange
Perc
ent
chan
geA
bsol
ute
chan
gePe
rcen
t ch
ange
Abs
olut
e ch
ange
Perc
ent
chan
ge
urb
anRu
ral
Tota
lu
rban
Rura
lTo
tal
Eas
t A
sia
and
Paci
fic25
113
.42
961.
328
074
.711
3.4
13.2
63.0
27 9
43.0
62.4
-166
.2-8
8.3
-309
.8-7
0.4
Cam
bodi
a11
3.0
135.
224
8.2
554.
115
9.6
236.
237
.133
.524
8.2
236.
20.
00.
0
Chi
na20
951
.91
098.
122
050
.010
1.6
5.5
54.2
65.4
25.5
21 8
61.9
53.5
-148
.5-1
00.0
-340
.3-1
00.0
Dem
. Peo
ple’
s R
ep. o
f K
orea
96.8
12.0
108.
810
7.6
23.6
77.2
75.1
15.8
108.
177
.40.
753
.80.
0
Indo
nesi
a95
2.2
245.
81
198.
047
2.2
89.4
251.
466
.812
.41
201.
424
3.6
-1.9
-100
.00.
94.
7
Lao
Peo
ple’
s D
em. R
ep.
40.9
18.6
59.5
563.
671
.317
8.7
32.7
42.4
59.5
178.
70.
00.
0
Mal
aysi
a18
5.6
-0.2
185.
417
4.6
-0.4
109.
733
.848
.318
8.4
113.
4-8
.1-1
00.0
-5.0
-100
.0
Mya
nmar
115.
377
.619
2.9
357.
895
.316
9.8
64.3
17.1
193.
017
0.0
-0.2
-100
.00.
0
Phi
lippi
nes
1 25
7.4
146.
51
403.
920
6.3
33.8
134.
641
.737
.41
411.
813
9.1
-8.4
-29.
6-0
.5-1
00.0
Tha
iland
301.
820
9.3
511.
120
5.3
64.9
108.
963
.121
.951
8.9
110.
0-0
.1-1
00.0
0.0
0.0
Vie
t Nam
1 09
8.4
1 01
8.5
2 11
6.9
346.
410
1.9
160.
854
.824
.12
151.
815
5.8
0.3
-100
.035
.154
.1
Eas
tern
Eur
ope
and
Cen
tral
Asi
a14
4.2
-32.
111
2.1
9.6
-5.9
5.5
441.
229
.1-2
03.7
-50.
5-1
0.2
-98.
1
Rus
sian
Fed
erat
ion
144.
2-3
2.1
112.
19.
6-5
.95.
551
5.4
-323
.844
1.1
29.1
-203
.6-5
0.4
-10.
2-1
00.0
Turk
ey0.
1-0
.10.
078
.1-7
8.1
0.0
0.1
50.0
-0.1
-100
.00.
00.
0

94
Mapping supply and demand for animal-source foods to 2030
cou
nTr
y
PoRK
, CH
An
GE
BETW
EEn
200
0 A
nD
203
0
Cons
umpti
onPr
oduc
tion
Impo
rtEx
port
Abs
olut
e ch
ange
Perc
ent c
hang
e
Prop
orti
on
of c
hang
e du
e to
ch
ange
in
cons
ump.
ra
tes
%
Prop
orti
on
of c
hang
e du
e to
ch
ange
in
popu
lati
on
%
Abs
olut
e ch
ange
Perc
ent
chan
geA
bsol
ute
chan
gePe
rcen
t ch
ange
Abs
olut
e ch
ange
Perc
ent
chan
ge
urb
anRu
ral
Tota
lu
rban
Rura
lTo
tal
Lat
in A
mer
ica/
C
arib
bean
4 12
7.8
277.
64
405.
412
3.7
25.7
99.8
4 30
7.1
99.5
684.
816
3.6
579.
318
6.4
Arg
enti
na10
6.5
-5.8
100.
740
.6-2
5.1
35.3
9.1
88.1
97.2
46.6
2.7
3.5
-0.8
-100
.0
Bol
ivia
74.0
9.4
83.4
150.
935
.010
9.9
28.6
54.3
83.7
110.
7-0
.3-1
00.0
0.0
Bra
zil
2 14
6.9
110.
02
256.
916
6.8
32.2
138.
561
.021
.12
890.
515
6.6
-1.1
-100
.063
2.0
289.
9
Chi
le15
9.8
-1.9
157.
975
.5-5
.263
.635
.652
.617
6.6
65.5
-3.1
-100
.015
.663
.9
Col
ombi
a12
9.5
20.2
149.
719
0.1
79.0
159.
850
.027
.813
3.7
154.
916
.021
6.2
0.0
Cos
ta R
ica
33.9
5.7
39.6
183.
246
.112
8.2
41.0
38.6
38.7
121.
7-1
.5-1
00.0
-2.1
-100
.0
Cub
a36
.721
.057
.745
.931
.639
.495
.73.
147
.035
.312
.310
4.2
1.5
-100
.0
Dom
inic
an R
epub
lic87
.18.
095
.122
1.5
33.6
151.
056
.823
.397
.516
0.9
-2.4
-100
.00.
0
Ecu
ador
101.
77.
710
9.4
147.
016
.494
.341
.642
.011
0.0
95.3
-0.7
-100
.0-0
.1-1
00.0
El S
alva
dor
11.1
3.0
14.1
154.
758
.811
4.6
44.8
36.5
11.3
139.
52.
245
.8-0
.7-1
00.0
Gua
tem
ala
42.5
19.1
61.6
285.
210
6.3
187.
230
.044
.860
.024
4.9
-0.3
-2.9
-1.9
-100
.0
Guy
ana
0.6
0.7
1.3
217.
813
4.8
162.
511
4.9
-5.2
0.0
0.0
1.3
433.
30.
0
Hai
ti48
.26.
855
.037
3.6
32.7
162.
755
.123
.755
.019
1.6
0.0
0.0
0.0
Hon
dura
s11
.93.
315
.215
5.5
35.4
89.9
16.1
73.3
14.6
153.
70.
56.
7-0
.1-1
00.0
Jam
aica
3.2
0.5
3.7
75.4
13.6
45.7
24.5
67.9
5.2
78.8
-1.6
-100
.0-0
.1-1
00.0
Mex
ico
809.
241
.185
0.3
89.0
13.5
70.1
37.0
50.0
146.
314
.464
1.3
247.
9-6
2.6
-100
.0

95
Annex C
cou
nTr
y
PoRK
, CH
An
GE
BETW
EEn
200
0 A
nD
203
0
Cons
umpti
onPr
oduc
tion
Impo
rtEx
port
Abs
olut
e ch
ange
Perc
ent c
hang
e
Prop
orti
on
of c
hang
e du
e to
ch
ange
in
cons
ump.
ra
tes
%
Prop
orti
on
of c
hang
e du
e to
ch
ange
in
popu
lati
on
%
Abs
olut
e ch
ange
Perc
ent
chan
geA
bsol
ute
chan
gePe
rcen
t ch
ange
Abs
olut
e ch
ange
Perc
ent
chan
ge
urb
anRu
ral
Tota
lu
rban
Rura
lTo
tal
Nic
arag
ua14
.26.
220
.440
0.9
217.
231
8.8
43.3
23.8
20.9
354.
2-1
.4-1
00.0
-0.9
-100
.0
Pan
ama
41.8
2.5
44.3
200.
723
.514
0.6
40.7
37.7
45.1
203.
2-0
.2-2
.0-0
.2-1
00.0
Par
agua
y82
.72.
685
.310
7.5
4.1
60.7
-18.
313
3.1
86.0
61.5
-0.8
-100
.0-0
.1-1
00.0
Per
u11
0.9
20.7
131.
618
7.7
118.
217
1.8
52.2
25.2
115.
812
2.9
20.8
4 16
0.0
-0.1
-100
.0
Suri
nam
e1.
10.
01.
178
.011
.068
.867
.921
.90.
981
.80.
375
.00.
0
Uru
guay
10.1
-0.5
9.6
29.6
-15.
226
.024
.670
.810
.037
.7-0
.4-3
.80.
0
Ven
ezue
la64
.6-3
.161
.564
.4-2
0.5
53.3
1.1
98.3
61.1
52.6
1.2
120.
0-0
.1-1
00.0
Mid
dle
Eas
t/
Nor
th A
fric
a7.
51.
08.
560
.524
.051
.53.
454
.05.
651
.9-0
.3-1
00.0
Alg
eria
0.0
0.0
0.0
-22.
6-3
82.6
0.0
0.1
100.
00.
00.
0
Egy
pt1.
00.
81.
888
.140
.458
.1-3
.110
4.9
1.8
58.1
0.0
0.0
Jord
an0.
00.
00.
079
.8-5
2.1
0.0
0.0
0.0
0.0
-0.2
-100
.0
Leb
anon
6.3
0.1
6.4
58.5
7.2
51.6
23.9
67.7
1.2
50.0
5.7
53.8
-0.1
-100
.0
Mor
occo
0.2
0.1
0.3
80.4
12.9
42.9
-5.0
107.
40.
466
.7-0
.1-1
00.0
0.0
Tuni
sia
0.0
0.0
0.0
0.0
0.0
0.0
-0.1
-100
.00.
00.
0
Sout
h A
sia
457.
349
2.8
950.
128
3.5
114.
016
0.0
950.
016
0.0
-0.6
-100
.0-1
.0-1
00.0
Indi
a44
6.2
474.
892
1.0
280.
511
3.5
159.
554
.124
.692
1.5
159.
7-0
.6-1
00.0
-0.4
-100
.0
Nep
al10
.415
.726
.152
6.8
124.
617
8.8
34.1
41.0
25.6
169.
50.
0-0
.5-1
00.0

96
Mapping supply and demand for animal-source foods to 2030
cou
nTr
y
PoRK
, CH
An
GE
BETW
EEn
200
0 A
nD
203
0
Cons
umpti
onPr
oduc
tion
Impo
rtEx
port
Abs
olut
e ch
ange
Perc
ent c
hang
e
Prop
orti
on
of c
hang
e du
e to
ch
ange
in
cons
ump.
ra
tes
%
Prop
orti
on
of c
hang
e du
e to
ch
ange
in
popu
lati
on
%
Abs
olut
e ch
ange
Perc
ent
chan
geA
bsol
ute
chan
gePe
rcen
t ch
ange
Abs
olut
e ch
ange
Perc
ent
chan
ge
urb
anRu
ral
Tota
lu
rban
Rura
lTo
tal
Sri L
anka
0.7
2.3
3.0
261.
815
9.5
176.
577
.89.
42.
916
1.1
0.0
-0.1
-100
.0
Sub-
Saha
ran
Afr
ica
658.
144
7.4
1 10
5.5
235.
410
3.1
154.
91
079.
016
1.7
23.4
45.7
-4.2
-67.
7
Ang
ola
63.9
10.9
74.8
294.
761
.018
8.9
13.4
69.1
74.8
261.
50.
00.
00.
0
Ben
in3.
01.
44.
419
1.2
55.8
107.
36.
387
.84.
511
2.5
-0.1
-100
.00.
0
Bot
swan
a0.
6-0
.30.
341
.2-3
3.5
12.0
196.
8-7
8.3
0.2
100.
00.
14.
30.
0
Bur
kina
Fas
o11
.317
.028
.364
6.9
241.
232
1.6
24.8
41.8
28.4
326.
4-0
.1-1
00.0
0.0
Bur
undi
2.7
8.5
11.2
761.
123
4.1
280.
026
.741
.911
.228
0.0
0.0
0.0
Cam
eroo
n10
.1-0
.29.
911
7.3
-2.4
61.1
19.5
72.0
9.8
66.2
0.1
7.1
0.0
Cen
tral
Afr
ican
Rep
ublic
12.6
9.7
22.3
250.
013
5.5
182.
850
.226
.022
.318
2.8
0.0
0.0
Cha
d0.
60.
71.
348
6.4
177.
826
0.0
23.0
48.2
1.4
350.
00.
00.
0
Con
go16
.86.
122
.940
3.4
194.
431
3.7
28.3
38.0
14.4
685.
78.
415
8.5
0.0
Cot
e d’
Ivoi
re12
.94.
217
.123
2.2
55.9
130.
543
.636
.016
.813
5.5
0.3
42.9
0.0
Dem
. Rep
. of t
he C
ongo
54.3
46.0
100.
363
5.9
249.
237
1.5
30.8
32.3
96.2
368.
64.
145
5.6
0.0
Eth
iopi
a0.
51.
11.
623
8.4
84.5
106.
76.
288
.11.
610
6.7
0.0
0.0
Gab
on10
.70.
110
.812
6.3
12.1
112.
527
.355
.74.
815
4.8
6.0
92.3
0.0
Gam
bia
0.3
0.1
0.4
210.
238
.913
3.3
23.2
58.7
0.2
66.7
0.2
20.0
0.0
Gha
na15
.44.
019
.424
6.8
57.8
147.
032
.845
.316
.015
0.9
3.4
130.
80.
0

97
Annex C
cou
nTr
y
PoRK
, CH
An
GE
BETW
EEn
200
0 A
nD
203
0
Cons
umpti
onPr
oduc
tion
Impo
rtEx
port
Abs
olut
e ch
ange
Perc
ent c
hang
e
Prop
orti
on
of c
hang
e du
e to
ch
ange
in
cons
ump.
ra
tes
%
Prop
orti
on
of c
hang
e du
e to
ch
ange
in
popu
lati
on
%
Abs
olut
e ch
ange
Perc
ent
chan
geA
bsol
ute
chan
gePe
rcen
t ch
ange
Abs
olut
e ch
ange
Perc
ent
chan
ge
urb
anRu
ral
Tota
lu
rban
Rura
lTo
tal
Gui
nea
2.6
1.7
4.3
426.
015
8.0
252.
936
.333
.24.
427
5.0
-0.1
-100
.00.
0
Ken
ya9.
815
.825
.641
9.8
174.
422
4.6
62.7
15.5
24.8
203.
3-0
.1-1
00.0
-0.9
-100
.0
Les
otho
1.6
0.8
2.4
289.
637
.588
.913
1.2
-14.
42.
488
.90.
00.
0
Lib
eria
6.2
1.0
7.2
220.
744
.814
1.2
2.6
93.9
7.0
162.
80.
225
.00.
0
Mad
agas
car
52.7
48.4
101.
126
9.7
103.
715
2.7
13.5
71.7
101.
315
3.5
-0.1
-100
.00.
0
Mal
awi
19.1
29.6
48.7
611.
516
8.2
235.
339
.131
.748
.823
6.9
-0.1
-100
.00.
0
Mal
i2.
31.
63.
932
6.0
95.8
162.
53.
591
.34.
017
3.9
-0.1
-100
.00.
0
Mau
riti
us1.
20.
31.
567
.332
.053
.649
.340
.10.
562
.51.
050
.00.
0
Moz
ambi
que
11.7
4.4
16.1
283.
748
.312
2.0
40.1
40.2
16.2
126.
60.
00.
00.
0
Nig
er0.
41.
21.
618
1.6
101.
211
4.3
-21.
115
9.5
1.6
114.
30.
00.
0
Nig
eria
195.
457
.425
2.8
279.
863
.215
7.4
27.3
50.9
249.
815
7.5
3.0
150.
00.
0
Rw
anda
2.0
2.9
4.9
356.
411
0.5
153.
128
.949
.34.
915
3.1
0.0
0.0
Sene
gal
8.9
6.2
15.1
310.
015
3.4
218.
835
.236
.615
.322
8.4
-0.2
-100
.00.
0
Sier
ra L
eone
1.8
1.1
2.9
194.
176
.212
0.8
15.8
70.6
3.0
130.
40.
00.
0
Som
alia
0.1
0.1
0.2
307.
816
2.5
200.
03.
689
.8-0
.1-1
00.0
0.3
30.0
0.0
Sout
h A
fric
a44
.9-6
.738
.263
.2-1
2.3
30.5
118.
3-1
3.5
37.3
32.1
-1.3
-11.
5-2
.2-1
00.0
Swaz
iland
0.7
0.3
1.0
119.
118
.643
.510
7.4
-5.1
0.5
45.5
-0.2
-10.
5-1
.7-1
00.0
Togo
4.5
1.5
6.0
234.
755
.113
0.4
22.5
59.9
6.1
135.
6-0
.2-1
00.0
-0.1
-100
.0

98
Mapping supply and demand for animal-source foods to 2030
cou
nTr
y
PoRK
, CH
An
GE
BETW
EEn
200
0 A
nD
203
0
Cons
umpti
onPr
oduc
tion
Impo
rtEx
port
Abs
olut
e ch
ange
Perc
ent c
hang
e
Prop
orti
on
of c
hang
e du
e to
ch
ange
in
cons
ump.
ra
tes
%
Prop
orti
on
of c
hang
e du
e to
ch
ange
in
popu
lati
on
%
Abs
olut
e ch
ange
Perc
ent
chan
geA
bsol
ute
chan
gePe
rcen
t ch
ange
Abs
olut
e ch
ange
Perc
ent
chan
ge
urb
anRu
ral
Tota
lu
rban
Rura
lTo
tal
Uga
nda
43.5
141.
018
4.5
471.
520
5.3
236.
810
.072
.718
4.6
237.
3-0
.2-1
00.0
0.0
Uni
ted
Rep
ublic
of
Tanz
ania
14.4
17.8
32.2
487.
317
2.4
242.
145
.226
.232
.725
5.5
-0.5
-100
.00.
0
Zam
bia
5.8
4.7
10.5
151.
867
.697
.235
.947
.610
.710
0.9
-0.2
-100
.00.
0
Zim
babw
e13
.16.
719
.821
0.8
54.3
107.
098
.01.
020
.610
4.6
-0.2
-100
.00.
753
.8
Hig
h in
com
e co
untr
ies
3 37
4.6
-439
.82
934.
831
.0-1
6.7
21.7
3 12
8.3
23.5
-677
.0-3
0.7
-445
.0-2
5.7
Aus
tral
ia14
8.0
-4.8
143.
247
.4-1
0.7
40.1
31.3
61.0
134.
436
.7-3
5.7
-100
.0-4
4.5
-100
.0
Can
ada
182.
9-9
.917
3.0
22.9
-7.2
18.5
-7.8
109.
327
0.4
13.3
-93.
4-1
00.0
-4.9
-0.5
Icel
and
2.0
1.0
3.0
50.0
116.
161
.261
.727
.83.
061
.20.
00.
0
Isra
el7.
30.
47.
778
.842
.575
.524
.164
.27.
572
.10.
0-0
.1-1
00.0
Japa
n29
8.4
-125
.917
2.5
20.2
-16.
47.
716
9.6
-61.
6-6
9.5
-5.5
244.
523
.6-0
.9-1
00.0
New
Zea
land
18.6
0.2
18.8
30.9
2.6
27.1
29.1
65.8
15.7
33.1
2.3
10.1
-0.4
-100
.0
Nor
way
24.0
1.8
25.8
29.1
8.6
25.0
55.0
39.5
26.0
24.3
-2.4
-100
.0-1
.0-1
6.7
Rep
ublic
of K
orea
612.
222
.163
4.3
75.1
11.0
62.4
83.3
11.0
504.
753
.337
.322
.9-6
4.4
-100
.0
Saud
i Ara
bia
0.2
0.2
0.4
108.
493
.010
0.0
2.6
95.0
0.0
-0.5
-38.
5-1
.0-1
00.0
Swit
zerl
and
-17.
9-1
5.1
-33.
0-9
.4-2
7.0
-13.
449
.953
.7-3
1.5
-13.
8-1
.9-1
0.7
-0.3
-100
.0
Trin
idad
and
Tob
ago
1.0
0.5
1.5
112.
011
.730
.687
.89.
60.
633
.30.
411
.1-0
.6-1
00.0
Uni
ted
Stat
es o
f Am
eric
a2
097.
9-3
10.3
1 78
7.6
29.5
-22.
321
.0-3
2.8%
142.
6%2
267.
027
.4-8
27.6
-100
.0-3
26.9
-56.
7
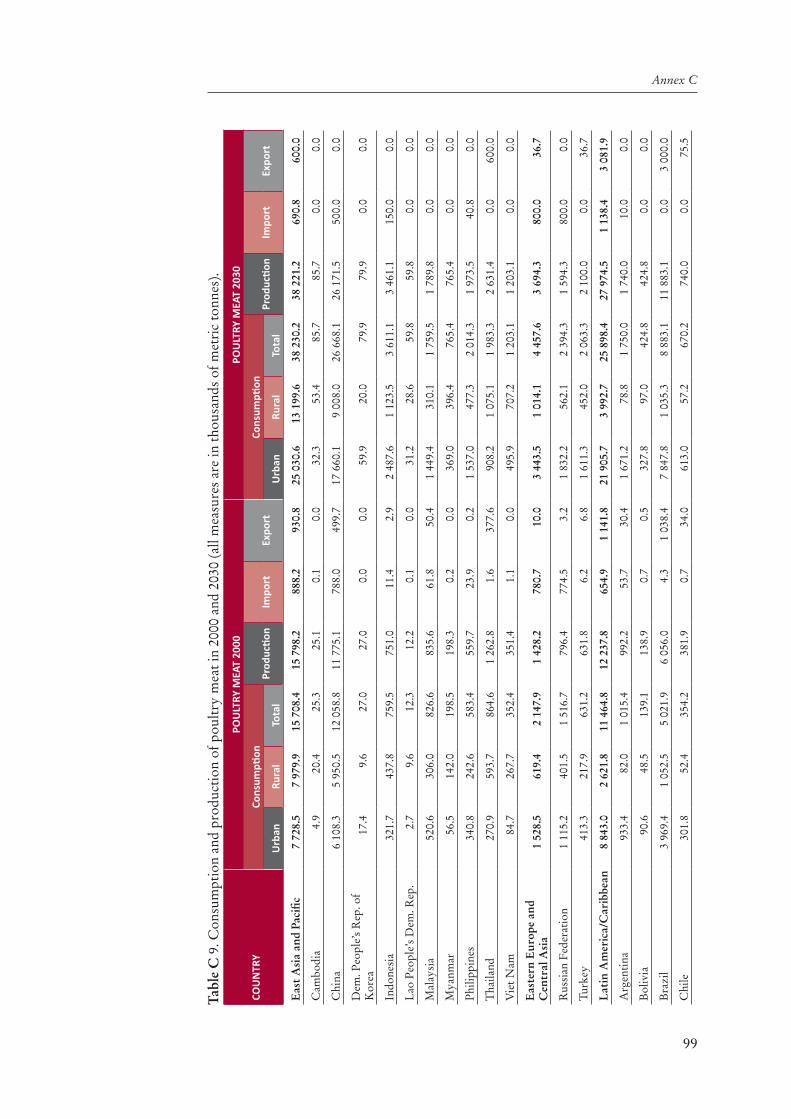
99
Annex C
Tabl
e C
9. C
onsu
mpt
ion
and
prod
ucti
on o
f pou
ltry
mea
t in
2000
and
203
0 (a
ll m
easu
res
are
in th
ousa
nds
of m
etri
c to
nnes
).
cou
nTr
y
pou
lTry
Mea
T 20
00po
ulT
ry M
eaT
2030
Cons
umpti
onPr
oduc
tion
Impo
rtEx
port
Cons
umpti
onPr
oduc
tion
Impo
rtEx
port
urb
anRu
ral
Tota
lu
rban
Rura
lTo
tal
Eas
t A
sia
and
Paci
fic7
728.
57
979.
915
708
.415
798
.288
8.2
930.
825
030
.613
199
.638
230
.238
221
.269
0.8
600.
0
Cam
bodi
a4.
920
.425
.325
.10.
10.
032
.353
.485
.785
.70.
00.
0
Chi
na6
108.
35
950.
512
058
.811
775
.178
8.0
499.
717
660
.19
008.
026
668
.126
171
.550
0.0
0.0
Dem
. Peo
ple’
s R
ep. o
f K
orea
17.4
9.6
27.0
27.0
0.0
0.0
59.9
20.0
79.9
79.9
0.0
0.0
Indo
nesi
a32
1.7
437.
875
9.5
751.
011
.42.
92
487.
61
123.
53
611.
13
461.
115
0.0
0.0
Lao
Peo
ple’
s D
em. R
ep.
2.7
9.6
12.3
12.2
0.1
0.0
31.2
28.6
59.8
59.8
0.0
0.0
Mal
aysi
a52
0.6
306.
082
6.6
835.
661
.850
.41
449.
431
0.1
1 75
9.5
1 78
9.8
0.0
0.0
Mya
nmar
56.5
142.
019
8.5
198.
30.
20.
036
9.0
396.
476
5.4
765.
40.
00.
0
Phi
lippi
nes
340.
824
2.6
583.
455
9.7
23.9
0.2
1 53
7.0
477.
32
014.
31
973.
540
.80.
0
Tha
iland
270.
959
3.7
864.
61
262.
81.
637
7.6
908.
21
075.
11
983.
32
631.
40.
060
0.0
Vie
t Nam
84.7
267.
735
2.4
351.
41.
10.
049
5.9
707.
21
203.
11
203.
10.
00.
0
Eas
tern
Eur
ope
and
C
entr
al A
sia
1 52
8.5
619.
42
147.
91
428.
278
0.7
10.0
3 44
3.5
1 01
4.1
4 45
7.6
3 69
4.3
800.
036
.7
Rus
sian
Fed
erat
ion
1 11
5.2
401.
51
516.
779
6.4
774.
53.
21
832.
256
2.1
2 39
4.3
1 59
4.3
800.
00.
0
Turk
ey41
3.3
217.
963
1.2
631.
86.
26.
81
611.
345
2.0
2 06
3.3
2 10
0.0
0.0
36.7
Lat
in A
mer
ica/
Car
ibbe
an8
843.
02
621.
811
464
.812
237
.865
4.9
1 14
1.8
21 9
05.7
3 99
2.7
25 8
98.4
27 9
74.5
1 13
8.4
3 08
1.9
Arg
enti
na93
3.4
82.0
1 01
5.4
992.
253
.730
.41
671.
278
.81
750.
01
740.
010
.00.
0
Bol
ivia
90.6
48.5
139.
113
8.9
0.7
0.5
327.
897
.042
4.8
424.
80.
00.
0
Bra
zil
3 96
9.4
1 05
2.5
5 02
1.9
6 05
6.0
4.3
1 03
8.4
7 84
7.8
1 03
5.3
8 88
3.1
11 8
83.1
0.0
3 00
0.0
Chi
le30
1.8
52.4
354.
238
1.9
0.7
34.0
613.
057
.267
0.2
740.
00.
075
.5

100
Mapping supply and demand for animal-source foods to 2030
cou
nTr
y
pou
lTry
Mea
T 20
00po
ulT
ry M
eaT
2030
Cons
umpti
onPr
oduc
tion
Impo
rtEx
port
Cons
umpti
onPr
oduc
tion
Impo
rtEx
port
urb
anRu
ral
Tota
lu
rban
Rura
lTo
tal
Col
ombi
a39
4.9
147.
654
2.5
515.
533
.77.
71
509.
335
0.4
1 85
9.7
1 75
9.7
100.
00.
0
Cos
ta R
ica
43.0
28.8
71.8
73.6
1.4
3.5
139.
648
.318
7.9
193.
90.
06.
0
Cub
a59
.049
.310
8.3
59.8
48.4
0.0
129.
597
.322
6.8
155.
071
.80.
0
Dom
inic
an R
epub
lic12
6.5
76.1
202.
619
8.8
3.8
0.0
354.
988
.644
3.5
443.
50.
00.
0
Ecu
ador
95.6
64.4
160.
016
1.2
3.2
4.4
394.
512
5.5
520.
052
0.0
0.0
0.0
El S
alva
dor
26.8
19.2
46.0
47.7
3.3
5.0
103.
745
.914
9.6
150.
00.
00.
4
Gua
tem
ala
69.9
84.1
154.
013
1.3
25.8
3.0
370.
423
8.7
609.
155
9.1
50.0
0.0
Guy
ana
6.3
13.0
19.3
12.1
7.2
0.0
12.6
18.7
31.3
26.7
4.6
0.0
Hai
ti11
.518
.630
.18.
122
.10.
053
.424
.377
.737
.740
.00.
0
Hon
dura
s37
.645
.082
.672
.99.
70.
116
4.0
103.
926
7.9
257.
910
.00.
0
Jam
aica
57.9
53.4
111.
378
.633
.00.
212
6.7
76.1
202.
817
7.8
25.0
0.0
Mex
ico
1 65
8.8
555.
72
214.
51
855.
936
8.1
9.6
5 00
4.2
1 00
7.4
6 01
1.6
5 21
1.6
800.
00.
0
Nic
arag
ua26
.621
.548
.144
.04.
80.
712
9.9
66.5
196.
419
1.4
5.0
0.0
Pan
ama
48.5
24.8
73.3
75.9
4.2
0.4
156.
732
.918
9.6
186.
65.
00.
0
Par
agua
y28
.523
.351
.847
.64.
30.
013
3.7
55.3
189.
018
3.0
6.0
0.0
Per
u24
6.7
73.2
319.
959
4.3
11.5
1.8
1 00
1.2
225.
41
226.
61
362.
90.
00.
0
Suri
nam
e11
.01.
812
.84.
37.
90.
017
.81.
819
.68.
611
.00.
0
Uru
guay
48.2
4.1
52.3
54.7
0.9
0.5
91.5
5.1
96.6
96.6
0.0
0.0
Ven
ezue
la55
0.5
82.5
633.
063
2.5
2.2
1.6
1 55
2.4
112.
21
664.
61
664.
60.
00.
0
Mid
dle
Eas
t/N
orth
Afr
ica
1 51
3.6
1 07
9.9
2 59
3.5
2 53
4.3
97.2
11.3
5 97
1.5
2 91
7.6
8 88
9.1
8 41
3.3
493.
90.
0
Alg
eria
160.
568
.122
8.6
226.
52.
10.
055
5.5
119.
867
5.3
650.
025
.30.
0
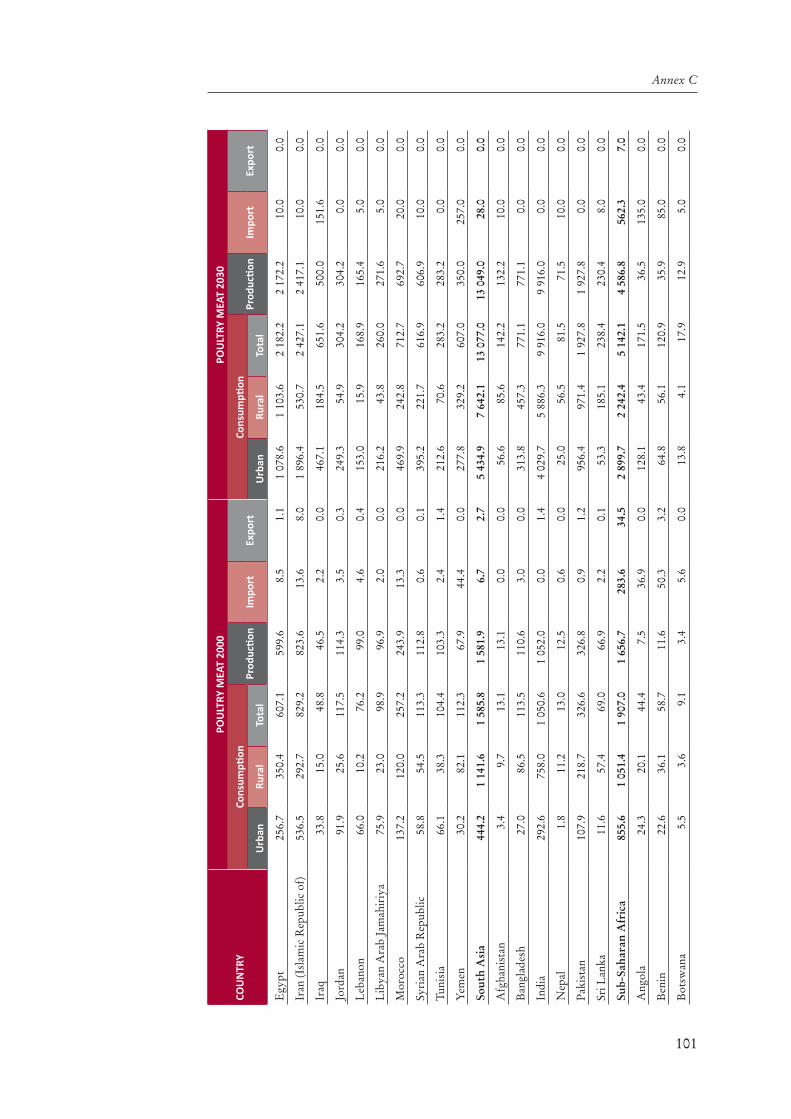
101
Annex C
cou
nTr
y
pou
lTry
Mea
T 20
00po
ulT
ry M
eaT
2030
Cons
umpti
onPr
oduc
tion
Impo
rtEx
port
Cons
umpti
onPr
oduc
tion
Impo
rtEx
port
urb
anRu
ral
Tota
lu
rban
Rura
lTo
tal
Egy
pt25
6.7
350.
460
7.1
599.
68.
51.
11
078.
61
103.
62
182.
22
172.
210
.00.
0
Iran
(Isl
amic
Rep
ublic
of)
536.
529
2.7
829.
282
3.6
13.6
8.0
1 89
6.4
530.
72
427.
12
417.
110
.00.
0
Iraq
33.8
15.0
48.8
46.5
2.2
0.0
467.
118
4.5
651.
650
0.0
151.
60.
0
Jord
an91
.925
.611
7.5
114.
33.
50.
324
9.3
54.9
304.
230
4.2
0.0
0.0
Leb
anon
66.0
10.2
76.2
99.0
4.6
0.4
153.
015
.916
8.9
165.
45.
00.
0
Lib
yan
Ara
b Ja
mah
iriy
a75
.923
.098
.996
.92.
00.
021
6.2
43.8
260.
027
1.6
5.0
0.0
Mor
occo
137.
212
0.0
257.
224
3.9
13.3
0.0
469.
924
2.8
712.
769
2.7
20.0
0.0
Syri
an A
rab
Rep
ublic
58.8
54.5
113.
311
2.8
0.6
0.1
395.
222
1.7
616.
960
6.9
10.0
0.0
Tuni
sia
66.1
38.3
104.
410
3.3
2.4
1.4
212.
670
.628
3.2
283.
20.
00.
0
Yem
en30
.282
.111
2.3
67.9
44.4
0.0
277.
832
9.2
607.
035
0.0
257.
00.
0
Sout
h A
sia
444.
21
141.
61
585.
81
581.
96.
72.
75
434.
97
642.
113
077
.013
049
.028
.00.
0
Afg
hani
stan
3.4
9.7
13.1
13.1
0.0
0.0
56.6
85.6
142.
213
2.2
10.0
0.0
Ban
glad
esh
27.0
86.5
113.
511
0.6
3.0
0.0
313.
845
7.3
771.
177
1.1
0.0
0.0
Indi
a29
2.6
758.
01
050.
61
052.
00.
01.
44
029.
75
886.
39
916.
09
916.
00.
00.
0
Nep
al1.
811
.213
.012
.50.
60.
025
.056
.581
.571
.510
.00.
0
Pak
ista
n10
7.9
218.
732
6.6
326.
80.
91.
295
6.4
971.
41
927.
81
927.
80.
00.
0
Sri L
anka
11.6
57.4
69.0
66.9
2.2
0.1
53.3
185.
123
8.4
230.
48.
00.
0
Sub-
Saha
ran
Afr
ica
855.
61
051.
41
907.
01
656.
728
3.6
34.5
2 89
9.7
2 24
2.4
5 14
2.1
4 58
6.8
562.
37.
0
Ang
ola
24.3
20.1
44.4
7.5
36.9
0.0
128.
143
.417
1.5
36.5
135.
00.
0
Ben
in22
.636
.158
.711
.650
.33.
264
.856
.112
0.9
35.9
85.0
0.0
Bot
swan
a5.
53.
69.
13.
45.
60.
013
.84.
117
.912
.95.
00.
0

102
Mapping supply and demand for animal-source foods to 2030
cou
nTr
y
pou
lTry
Mea
T 20
00po
ulT
ry M
eaT
2030
Cons
umpti
onPr
oduc
tion
Impo
rtEx
port
Cons
umpti
onPr
oduc
tion
Impo
rtEx
port
urb
anRu
ral
Tota
lu
rban
Rura
lTo
tal
Bur
kina
Fas
o5.
321
.126
.427
.80.
21.
534
.062
.596
.596
.50.
00.
0
Bur
undi
0.5
5.5
6.0
5.9
0.1
0.0
4.9
19.7
24.6
24.6
0.0
0.0
Cam
eroo
n19
.016
.935
.925
.610
.30.
062
.624
.487
.077
.010
.00.
0
Cen
tral
Afr
ican
Rep
ublic
1.2
1.8
3.0
3.0
0.0
0.0
3.4
3.2
6.6
6.6
0.0
0.0
Cha
d1.
33.
44.
74.
70.
00.
06.
28.
014
.214
.20.
00.
0
Con
go8.
76.
515
.24.
410
.80.
030
.513
.343
.823
.820
.00.
0
Cot
e d’
Ivoi
re28
.538
.266
.763
.33.
50.
110
4.3
65.5
169.
816
5.8
4.0
0.0
Dem
. Rep
. of t
he C
ongo
7.3
15.9
23.2
11.4
11.9
0.0
106.
510
7.5
214.
011
4.0
100.
00.
0
Eri
trea
0.3
1.6
1.9
1.7
0.2
0.0
2.7
5.2
7.9
7.6
0.3
0.0
Eth
iopi
a6.
834
.841
.641
.50.
20.
054
.613
6.5
191.
119
1.1
0.0
0.0
Gab
on15
.42.
117
.53.
613
.90.
038
.32.
640
.910
.730
.20.
0
Gam
bia
1.3
0.9
2.2
0.9
1.3
0.0
5.3
1.7
7.0
3.0
4.0
0.0
Gha
na16
.518
.434
.918
.716
.20.
087
.343
.313
0.6
95.6
35.0
0.0
Gui
nea
1.8
3.0
4.8
4.1
0.7
0.0
8.6
7.7
16.3
13.3
3.0
0.0
Ken
ya11
.343
.554
.856
.90.
12.
254
.411
0.2
164.
616
6.6
0.0
2.0
Les
otho
1.2
4.6
5.8
1.8
4.0
0.0
3.7
4.9
8.6
4.6
4.0
0.0
Lib
eria
5.3
4.3
9.6
6.9
2.7
0.0
29.9
11.1
41.0
41.0
0.0
0.0
Mad
agas
car
17.9
42.8
60.7
60.5
0.2
0.0
94.0
123.
521
7.5
217.
50.
00.
0
Mal
awi
2.3
13.1
15.4
14.8
0.5
-0.2
11.4
24.3
35.7
34.7
1.0
0.0
Mal
i8.
420
.228
.628
.60.
10.
150
.555
.610
6.1
106.
10.
00.
0
Mau
rita
nia
3.0
3.5
6.5
4.1
2.3
0.0
9.3
7.1
16.4
13.4
3.0
0.0

103
Annex C
cou
nTr
y
pou
lTry
Mea
T 20
00po
ulT
ry M
eaT
2030
Cons
umpti
onPr
oduc
tion
Impo
rtEx
port
Cons
umpti
onPr
oduc
tion
Impo
rtEx
port
urb
anRu
ral
Tota
lu
rban
Rura
lTo
tal
Mau
riti
us13
.48.
622
.021
.50.
80.
335
.017
.552
.552
.50.
00.
0
Moz
ambi
que
12.2
26.4
38.6
34.2
4.4
0.0
69.2
58.6
127.
812
3.4
4.4
0.0
Nig
er4.
322
.326
.626
.50.
10.
021
.469
.691
.091
.00.
00.
0
Nig
eria
77.4
100.
117
7.5
178.
4-0
.90.
043
7.6
245.
868
3.4
650.
033
.40.
0
Rw
anda
0.3
1.3
1.6
1.6
0.0
0.0
1.7
3.7
5.4
5.4
0.0
0.0
Sene
gal
27.8
38.3
66.1
63.9
2.3
0.1
123.
710
4.8
228.
522
6.5
2.0
0.0
Sier
ra L
eone
4.0
6.5
10.5
9.6
0.9
0.0
12.5
12.1
24.6
23.6
1.0
0.0
Som
alia
1.2
2.2
3.4
3.4
0.0
0.0
21.1
20.2
41.3
36.3
5.0
0.0
Sout
h A
fric
a44
3.2
339.
578
2.7
706.
487
.212
.586
8.0
354.
91
222.
91
162.
960
.00.
0
Suda
n11
.518
.530
.029
.80.
20.
077
.448
.912
6.3
126.
30.
00.
0
Swaz
iland
1.3
3.9
5.2
2.5
8.3
5.6
3.5
5.7
9.2
3.2
6.0
0.0
Togo
6.7
9.1
15.8
9.8
6.3
0.2
32.2
20.4
52.6
42.6
10.0
0.0
Uga
nda
5.1
38.3
43.4
42.7
0.8
0.1
34.1
135.
616
9.7
168.
71.
00.
0
Uni
ted
Rep
ublic
of
Tanz
ania
9.5
33.2
42.7
45.5
0.6
3.4
65.5
105.
217
0.7
170.
70.
00.
0
Zam
bia
12.4
22.6
35.0
34.5
0.2
-0.4
51.7
62.5
114.
211
4.2
0.0
0.0
Zim
babw
e9.
518
.828
.333
.70.
45.
836
.235
.371
.576
.50.
05.
0
Hig
h in
com
e co
untr
ies
15 5
16.4
3 43
8.1
18 9
54.5
20 6
07.7
1 56
0.2
3 11
4.3
27 5
47.4
3 82
1.2
31 3
68.6
33 2
58.6
2 25
9.0
4 03
5.0
Aus
tral
ia53
9.3
77.4
616.
763
8.9
0.5
23.0
865.
875
.694
1.4
971.
40.
030
.0
Can
ada
936.
216
0.8
1 09
7.0
1 04
9.2
183.
013
1.3
1 30
9.6
169.
61
479.
21
379.
210
0.0
0.0
Icel
and
3.0
0.4
3.4
3.2
0.2
0.0
5.6
0.7
6.3
6.3
0.0
0.0

104
Mapping supply and demand for animal-source foods to 2030
cou
nTr
y
pou
lTry
Mea
T 20
00po
ulT
ry M
eaT
2030
Cons
umpti
onPr
oduc
tion
Impo
rtEx
port
Cons
umpti
onPr
oduc
tion
Impo
rtEx
port
urb
anRu
ral
Tota
lu
rban
Rura
lTo
tal
Isra
el26
0.0
25.1
285.
128
9.5
7.4
11.3
540.
942
.258
3.1
588.
10.
05.
0
Japa
n1
276.
366
3.1
1 93
9.4
1 19
4.8
783.
13.
72
045.
673
7.8
2 78
3.4
1 43
3.4
1 40
0.0
0.0
New
Zea
land
92.9
14.3
107.
210
7.8
0.5
1.3
135.
216
.315
1.5
151.
50.
00.
0
Nor
way
25.9
6.3
32.2
31.9
0.4
0.1
66.2
12.4
78.6
78.6
0.0
0.0
Rep
ublic
of K
orea
402.
699
.650
2.2
426.
577
.61.
91
037.
716
3.3
1 20
1.0
1 10
1.0
100.
00.
0
Saud
i Ara
bia
582.
412
6.0
708.
438
0.2
344.
015
.71
635.
722
6.2
1 86
1.9
1 26
1.9
600.
00.
0
Swit
zerl
and
71.7
21.1
92.8
36.0
57.3
0.4
96.9
22.9
119.
864
.855
.00.
0
Trin
idad
and
Tob
ago
6.5
27.8
34.3
31.2
3.4
0.3
15.2
34.5
49.7
45.7
4.0
0.0
Uni
ted
Stat
es o
f Am
eric
a11
319
.72
216.
113
535
.816
418
.510
2.8
2 92
5.3
19 7
93.1
2 31
9.6
22 1
12.7
26 1
76.7
0.0
4 00
0.0

105
Annex C
Tabl
e C
10.
Cha
nge
in c
onsu
mpt
ion
and
prod
ucti
on o
f pou
ltry
mea
t bet
wee
n 20
00 a
nd 2
030
(abs
olut
e ch
ange
is in
thou
sand
s of
met
ric
tonn
es,
prop
orti
onal
cha
nge
in p
erce
ntag
e).
cou
nTr
y
Po
uLT
RY m
EAT,
CH
An
GE
BETW
EEn
200
0 A
nD
203
0
Cons
umpti
onPr
oduc
tion
Impo
rtEx
port
Abs
olut
e ch
ange
Perc
ent c
hang
e
Prop
orti
on
of c
hang
e du
e to
ch
ange
in
cons
ump.
ra
tes
%
Prop
orti
on
of c
hang
e du
e to
ch
ange
in
popu
lati
on
%
Abs
olut
e ch
ange
Perc
ent
chan
geA
bsol
ute
chan
gePe
rcen
t ch
ange
Abs
olut
e ch
ange
Perc
ent
chan
ge
urb
anRu
ral
Tota
lu
rban
Rura
lTo
tal
Eas
t A
sia
and
Paci
fic17
302
.15
219.
722
521
.822
3.9
65.4
143.
422
423
.014
1.9
-197
.4-2
2.2
-330
.8-3
5.5
Cam
bodi
a27
.433
.060
.455
6.8
161.
923
8.7
37.3
33.2
60.6
241.
4-0
.1-1
00.0
0.0
Chi
na11
551
.83
057.
514
609
.318
9.1
51.4
121.
277
.811
.414
396
.412
2.3
-288
.0-3
6.5
-499
.7-1
00.0
Dem
. Peo
ple’
s R
ep. o
f K
orea
42.6
10.3
52.9
244.
810
7.6
195.
983
.66.
252
.919
5.9
0.0
0.0
Indo
nesi
a2
165.
968
5.7
2 85
1.6
673.
215
6.6
375.
569
.98.
32
710.
136
0.9
138.
61
215.
8-2
.9-1
00.0
Lao
Peo
ple’
s D
em. R
ep.
28.5
19.0
47.5
1 04
9.3
198.
538
6.2
45.7
19.6
47.6
390.
2-0
.1-1
00.0
0.0
Mal
aysi
a92
8.8
4.1
932.
917
8.4
1.3
112.
934
.647
.095
4.2
114.
2-6
1.8
-100
.0-5
0.4
-100
.0
Mya
nmar
312.
525
4.4
566.
955
3.5
179.
128
5.6
69.7
10.1
567.
128
6.0
-0.2
-100
.00.
0
Phi
lippi
nes
1 19
6.1
234.
81
430.
935
1.0
96.8
245.
352
.920
.51
413.
825
2.6
16.9
70.7
-0.2
-100
.0
Tha
iland
637.
448
1.3
1 11
8.7
235.
381
.112
9.4
65.9
18.4
1 36
8.6
108.
4-1
.6-1
00.0
222.
458
.9
Vie
t Nam
411.
243
9.5
850.
748
5.4
164.
224
1.4
60.6
16.0
851.
724
2.4
-1.1
-100
.00.
0
Eas
tern
Eur
ope
and
Cen
tral
Asi
a1
915.
039
4.7
2 30
9.7
125.
363
.710
7.5
2 26
6.1
158.
719
.32.
526
.726
7.0
Rus
sian
Fed
erat
ion
716.
916
0.7
877.
664
.340
.057
.915
9.0
-30.
779
7.9
100.
225
.53.
3-3
.2-1
00.0
Turk
ey1
198.
123
4.0
1 43
2.1
289.
910
7.4
226.
962
.915
.31
468.
223
2.4
-6.2
-100
.029
.943
9.7

106
Mapping supply and demand for animal-source foods to 2030
cou
nTr
y
Po
uLT
RY m
EAT,
CH
An
GE
BETW
EEn
200
0 A
nD
203
0
Cons
umpti
onPr
oduc
tion
Impo
rtEx
port
Abs
olut
e ch
ange
Perc
ent c
hang
e
Prop
orti
on
of c
hang
e du
e to
ch
ange
in
cons
ump.
ra
tes
%
Prop
orti
on
of c
hang
e du
e to
ch
ange
in
popu
lati
on
%
Abs
olut
e ch
ange
Perc
ent
chan
geA
bsol
ute
chan
gePe
rcen
t ch
ange
Abs
olut
e ch
ange
Perc
ent
chan
ge
urb
anRu
ral
Tota
lu
rban
Rura
lTo
tal
Lat
in A
mer
ica/
C
arib
bean
13 0
62.6
1 37
1.0
14 4
33.6
147.
752
.312
5.9
15 7
36.7
128.
648
3.5
73.8
1 94
0.1
169.
9
Arg
enti
na73
7.8
-3.2
734.
679
.0-3
.972
.343
.543
.074
7.8
75.4
-43.
7-8
1.4
-30.
4-1
00.0
Bol
ivia
237.
248
.528
5.7
261.
810
0.0
205.
444
.529
.028
5.9
205.
8-0
.7-1
00.0
-0.5
-100
.0
Bra
zil
3 87
8.4
-17.
23
861.
297
.7-1
.676
.947
.938
.15
827.
196
.2-4
.3-1
00.0
1 96
1.6
188.
9
Chi
le31
1.2
4.8
316.
010
3.1
9.2
89.2
46.9
37.5
358.
193
.8-0
.7-1
00.0
41.5
122.
1
Col
ombi
a1
114.
420
2.8
1 31
7.2
282.
213
7.3
242.
856
.618
.31
244.
224
1.4
66.3
196.
7-7
.7-1
00.0
Cos
ta R
ica
96.6
19.5
116.
122
4.6
67.7
161.
746
.430
.612
0.3
163.
5-1
.4-1
00.0
2.5
71.4
Cub
a70
.448
.111
8.5
119.
397
.510
9.4
97.7
1.1
95.2
159.
223
.448
.30.
0
Dom
inic
an R
epub
lic22
8.4
12.5
240.
918
0.5
16.5
118.
952
.129
.624
4.7
123.
1-3
.8-1
00.0
0.0
Ecu
ador
298.
961
.136
0.0
312.
794
.922
5.0
59.0
17.6
358.
822
2.6
-3.2
-100
.0-4
.4-1
00.0
El S
alva
dor
76.9
26.7
103.
628
7.2
138.
822
5.2
57.4
18.6
102.
321
4.5
-3.3
-100
.0-4
.6-9
2.0
Gua
tem
ala
300.
515
4.6
455.
142
9.7
183.
929
5.5
39.0
28.4
427.
832
5.8
24.2
93.8
-3.0
-100
.0
Guy
ana
6.3
5.7
12.0
99.2
44.2
62.2
124.
0-1
3.6
14.6
120.
7-2
.6-3
6.1
0.0
Hai
ti42
.05.
647
.636
6.3
30.3
158.
154
.624
.429
.636
5.4
17.9
81.0
0.0
Hon
dura
s12
6.4
58.9
185.
333
6.0
131.
022
4.3
42.5
29.4
185.
025
3.8
0.3
3.1
-0.1
-100
.0
Jam
aica
68.8
22.7
91.5
118.
942
.582
.247
.537
.799
.212
6.2
-8.0
-24.
2-0
.2-1
00.0
Mex
ico
3 34
5.5
451.
63
797.
120
1.7
81.3
171.
558
.920
.43
355.
718
0.8
431.
911
7.3
-9.6
-100
.0

107
Annex C
cou
nTr
y
Po
uLT
RY m
EAT,
CH
An
GE
BETW
EEn
200
0 A
nD
203
0
Cons
umpti
onPr
oduc
tion
Impo
rtEx
port
Abs
olut
e ch
ange
Perc
ent c
hang
e
Prop
orti
on
of c
hang
e du
e to
ch
ange
in
cons
ump.
ra
tes
%
Prop
orti
on
of c
hang
e du
e to
ch
ange
in
popu
lati
on
%
Abs
olut
e ch
ange
Perc
ent
chan
geA
bsol
ute
chan
gePe
rcen
t ch
ange
Abs
olut
e ch
ange
Perc
ent
chan
ge
urb
anRu
ral
Tota
lu
rban
Rura
lTo
tal
Nic
arag
ua10
3.3
45.0
148.
338
8.0
209.
630
8.3
42.8
24.7
147.
433
5.0
0.2
4.2
-0.7
-100
.0
Pan
ama
108.
28.
111
6.3
223.
132
.815
8.7
43.5
33.4
110.
714
5.8
0.8
19.0
-0.4
-100
.0
Par
agua
y10
5.2
32.0
137.
236
9.7
137.
026
4.9
38.4
30.5
135.
428
4.5
1.7
39.5
0.0
Per
u75
4.5
152.
290
6.7
305.
820
7.9
283.
459
.215
.376
8.6
129.
3-1
1.5
-100
.0-1
.8-1
00.0
Suri
nam
e6.
80.
06.
861
.41.
153
.162
.328
.34.
310
0.0
3.1
39.2
0.0
Uru
guay
43.3
1.0
44.3
89.8
25.2
84.7
66.1
21.8
41.9
76.6
-0.9
-100
.0-0
.5-1
00.0
Ven
ezue
la1
001.
829
.81
031.
618
2.0
36.1
163.
044
.532
.11
032.
116
3.2
-2.2
-100
.0-1
.6-1
00.0
Mid
dle
Eas
t/
Nor
th A
fric
a4
457.
91
837.
76
295.
629
4.5
170.
224
2.7
5 87
9.0
232.
039
6.7
408.
1-1
1.3
-100
.0
Alg
eria
395.
051
.744
6.7
246.
275
.919
5.4
52.5
23.5
423.
518
7.0
23.2
1 10
4.8
0.0
Egy
pt82
1.9
753.
21
575.
132
0.2
215.
025
9.4
47.5
23.5
1 57
2.6
262.
31.
517
.6-1
.1-1
00.0
Iran
(Isl
amic
Rep
ublic
of)
1 35
9.9
238.
01
597.
925
3.5
81.3
192.
755
.021
.91
593.
519
3.5
-3.6
-26.
5-8
.0-1
00.0
Iraq
433.
416
9.4
602.
81
283.
21
127.
51
235.
247
.37.
745
3.5
975.
314
9.4
6 79
0.9
0.0
Jord
an15
7.4
29.3
186.
717
1.1
114.
815
8.9
32.0
45.1
189.
916
6.1
-3.5
-100
.0-0
.3-1
00.0
Leb
anon
87.0
5.7
92.7
131.
856
.012
1.7
52.8
28.7
66.4
67.1
0.4
8.7
-0.4
-100
.0
Lib
yan
Ara
b Ja
mah
iriy
a14
0.3
20.8
161.
118
4.7
90.7
162.
942
.733
.817
4.7
180.
33.
015
0.0
0.0
Mor
occo
332.
712
2.8
455.
524
2.4
102.
417
7.1
50.7
26.0
448.
818
4.0
6.7
50.4
0.0
Syri
an A
rab
Rep
ublic
336.
416
7.2
503.
657
2.7
306.
444
4.5
48.1
16.6
494.
143
8.0
9.4
1 56
6.7
-0.1
-100
.0
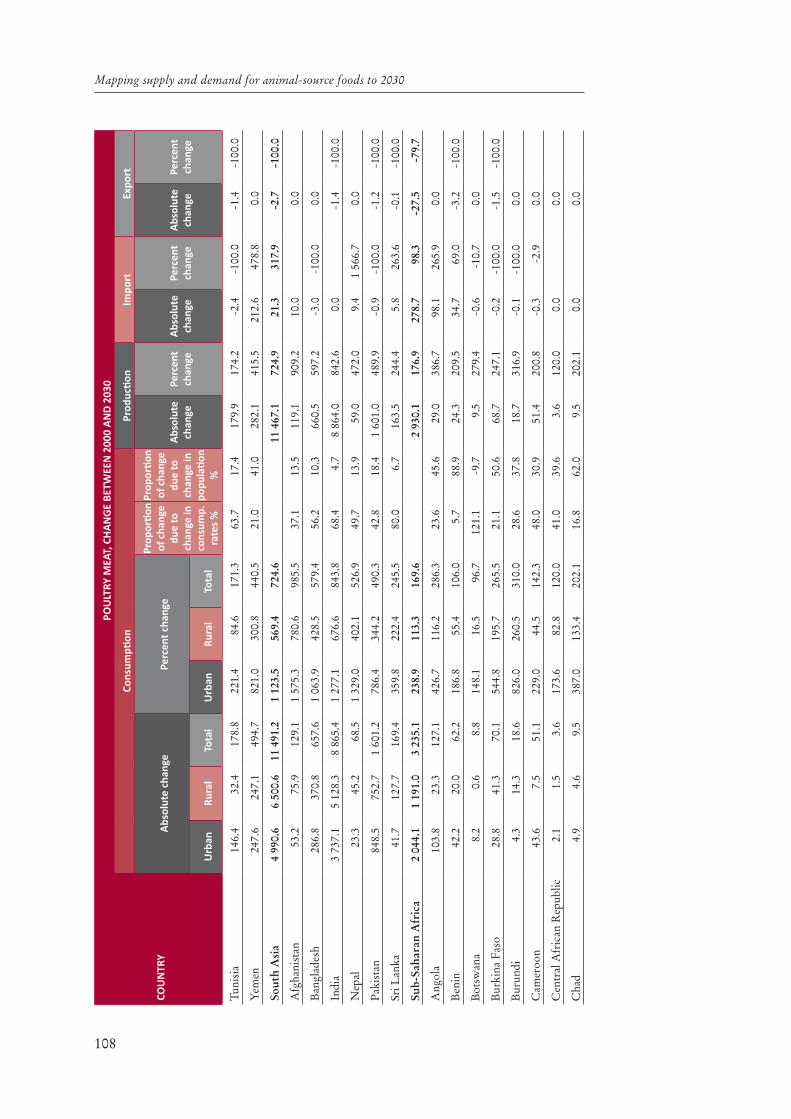
108
Mapping supply and demand for animal-source foods to 2030
cou
nTr
y
Po
uLT
RY m
EAT,
CH
An
GE
BETW
EEn
200
0 A
nD
203
0
Cons
umpti
onPr
oduc
tion
Impo
rtEx
port
Abs
olut
e ch
ange
Perc
ent c
hang
e
Prop
orti
on
of c
hang
e du
e to
ch
ange
in
cons
ump.
ra
tes
%
Prop
orti
on
of c
hang
e du
e to
ch
ange
in
popu
lati
on
%
Abs
olut
e ch
ange
Perc
ent
chan
geA
bsol
ute
chan
gePe
rcen
t ch
ange
Abs
olut
e ch
ange
Perc
ent
chan
ge
urb
anRu
ral
Tota
lu
rban
Rura
lTo
tal
Tuni
sia
146.
432
.417
8.8
221.
484
.617
1.3
63.7
17.4
179.
917
4.2
-2.4
-100
.0-1
.4-1
00.0
Yem
en24
7.6
247.
149
4.7
821.
030
0.8
440.
521
.041
.028
2.1
415.
521
2.6
478.
80.
0
Sout
h A
sia
4 99
0.6
6 50
0.6
11 4
91.2
1 12
3.5
569.
472
4.6
11 4
67.1
724.
921
.331
7.9
-2.7
-100
.0
Afg
hani
stan
53.2
75.9
129.
11
575.
378
0.6
985.
537
.113
.511
9.1
909.
210
.00.
0
Ban
glad
esh
286.
837
0.8
657.
61
063.
942
8.5
579.
456
.210
.366
0.5
597.
2-3
.0-1
00.0
0.0
Indi
a3
737.
15
128.
38
865.
41
277.
167
6.6
843.
868
.44.
78
864.
084
2.6
0.0
-1.4
-100
.0
Nep
al23
.345
.268
.51
329.
040
2.1
526.
949
.713
.959
.047
2.0
9.4
1 56
6.7
0.0
Pak
ista
n84
8.5
752.
71
601.
278
6.4
344.
249
0.3
42.8
18.4
1 60
1.0
489.
9-0
.9-1
00.0
-1.2
-100
.0
Sri L
anka
41.7
127.
716
9.4
359.
822
2.4
245.
580
.06.
716
3.5
244.
45.
826
3.6
-0.1
-100
.0
Sub-
Saha
ran
Afr
ica
2 04
4.1
1 19
1.0
3 23
5.1
238.
911
3.3
169.
62
930.
117
6.9
278.
798
.3-2
7.5
-79.
7
Ang
ola
103.
823
.312
7.1
426.
711
6.2
286.
323
.645
.629
.038
6.7
98.1
265.
90.
0
Ben
in42
.220
.062
.218
6.8
55.4
106.
05.
788
.924
.320
9.5
34.7
69.0
-3.2
-100
.0
Bot
swan
a8.
20.
68.
814
8.1
16.5
96.7
121.
1-9
.79.
527
9.4
-0.6
-10.
70.
0
Bur
kina
Fas
o28
.841
.370
.154
4.8
195.
726
5.5
21.1
50.6
68.7
247.
1-0
.2-1
00.0
-1.5
-100
.0
Bur
undi
4.3
14.3
18.6
826.
026
0.5
310.
028
.637
.818
.731
6.9
-0.1
-100
.00.
0
Cam
eroo
n43
.67.
551
.122
9.0
44.5
142.
348
.030
.951
.420
0.8
-0.3
-2.9
0.0
Cen
tral
Afr
ican
Rep
ublic
2.1
1.5
3.6
173.
682
.812
0.0
41.0
39.6
3.6
120.
00.
00.
0
Cha
d4.
94.
69.
538
7.0
133.
420
2.1
16.8
62.0
9.5
202.
10.
00.
0

109
Annex C
cou
nTr
y
Po
uLT
RY m
EAT,
CH
An
GE
BETW
EEn
200
0 A
nD
203
0
Cons
umpti
onPr
oduc
tion
Impo
rtEx
port
Abs
olut
e ch
ange
Perc
ent c
hang
e
Prop
orti
on
of c
hang
e du
e to
ch
ange
in
cons
ump.
ra
tes
%
Prop
orti
on
of c
hang
e du
e to
ch
ange
in
popu
lati
on
%
Abs
olut
e ch
ange
Perc
ent
chan
geA
bsol
ute
chan
gePe
rcen
t ch
ange
Abs
olut
e ch
ange
Perc
ent
chan
ge
urb
anRu
ral
Tota
lu
rban
Rura
lTo
tal
Con
go21
.86.
828
.625
0.2
105.
218
8.2
16.7
63.4
19.4
440.
99.
285
.20.
0
Cot
e d’
Ivoi
re75
.827
.310
3.1
266.
271
.415
4.6
47.4
30.4
102.
516
1.9
0.5
14.3
-0.1
-100
.0
Dem
. Rep
. of t
he C
ongo
99.2
91.6
190.
81
358.
757
6.2
822.
438
.814
.610
2.6
900.
088
.174
0.3
0.0
Eri
trea
2.4
3.6
6.0
689.
023
2.6
315.
829
.936
.05.
934
7.1
0.1
50.0
0.0
Eth
iopi
a47
.810
1.7
149.
570
4.8
292.
135
9.4
38.1
26.1
149.
636
0.5
-0.2
-100
.00.
0
Gab
on22
.90.
523
.414
8.6
24.9
133.
732
.746
.87.
119
7.2
16.3
117.
30.
0
Gam
bia
4.0
0.8
4.8
320.
481
.521
8.2
36.0
35.8
2.1
233.
32.
720
7.7
0.0
Gha
na70
.725
.095
.742
7.5
136.
027
4.2
45.4
24.3
76.9
411.
218
.811
6.0
0.0
Gui
nea
6.9
4.6
11.5
385.
915
3.6
239.
635
.335
.09.
222
4.4
2.3
328.
60.
0
Ken
ya43
.266
.610
9.8
383.
015
3.1
200.
461
.417
.310
9.7
192.
8-0
.1-1
00.0
-0.2
-9.1
Les
otho
2.5
0.3
2.8
199.
47.
348
.314
5.0
-26.
52.
815
5.6
0.0
0.0
0.0
Lib
eria
24.6
6.8
31.4
467.
415
6.7
327.
125
.640
.534
.149
4.2
-2.7
-100
.00.
0
Mad
agas
car
76.0
80.8
156.
842
3.9
188.
925
8.3
27.5
42.4
157.
025
9.5
-0.2
-100
.00.
0
Mal
awi
9.1
11.2
20.3
392.
085
.513
1.8
24.9
56.6
19.9
134.
50.
510
0.0
0.2
-100
.0
Mal
i42
.135
.477
.550
4.6
174.
627
1.0
18.2
54.7
77.5
271.
0-0
.1-1
00.0
-0.1
-100
.0
Mau
rita
nia
6.3
3.6
9.9
210.
110
3.1
152.
314
.370
.49.
322
6.8
0.7
30.4
0.0
Mau
riti
us21
.68.
930
.516
0.4
104.
513
8.6
69.5
15.5
31.0
144.
2-0
.8-1
00.0
-0.3
-100
.0
Moz
ambi
que
56.9
32.3
89.2
465.
712
2.3
231.
152
.921
.289
.226
0.8
0.0
0.0
0.0

110
Mapping supply and demand for animal-source foods to 2030
cou
nTr
y
Po
uLT
RY m
EAT,
CH
An
GE
BETW
EEn
200
0 A
nD
203
0
Cons
umpti
onPr
oduc
tion
Impo
rtEx
port
Abs
olut
e ch
ange
Perc
ent c
hang
e
Prop
orti
on
of c
hang
e du
e to
ch
ange
in
cons
ump.
ra
tes
%
Prop
orti
on
of c
hang
e du
e to
ch
ange
in
popu
lati
on
%
Abs
olut
e ch
ange
Perc
ent
chan
geA
bsol
ute
chan
gePe
rcen
t ch
ange
Abs
olut
e ch
ange
Perc
ent
chan
ge
urb
anRu
ral
Tota
lu
rban
Rura
lTo
tal
Nig
er17
.047
.464
.439
2.4
212.
824
2.1
8.8
75.3
64.5
243.
4-0
.1-1
00.0
0.0
Nig
eria
360.
314
5.6
505.
946
5.6
145.
528
5.0
39.9
28.1
471.
626
4.3
34.3
-3 8
11.1
0.0
Rw
anda
1.4
2.4
3.8
528.
017
8.1
237.
538
.931
.83.
823
7.5
0.0
0.0
Sene
gal
95.9
66.5
162.
434
5.2
173.
524
5.7
37.4
32.6
162.
625
4.5
-0.3
-13.
0-0
.1-1
00.0
Sier
ra L
eone
8.5
5.6
14.1
213.
186
.013
4.3
19.7
63.6
14.0
145.
80.
111
.10.
0
Som
alia
19.9
18.0
37.9
1 67
2.9
814.
81
114.
730
.016
.132
.996
7.6
5.0
0.0
Sout
h A
fric
a42
4.8
15.4
440.
295
.84.
556
.211
1.9
-7.3
456.
564
.6-2
7.2
-31.
2-1
2.5
-100
.0
Suda
n65
.930
.496
.357
3.4
164.
132
1.0
50.5
18.9
96.5
323.
8-0
.2-1
00.0
0.0
Swaz
iland
2.2
1.8
4.0
169.
146
.476
.910
5.2
-2.9
0.7
28.0
-2.3
-27.
7-5
.6-1
00.0
Togo
25.5
11.3
36.8
381.
912
3.7
232.
937
.333
.532
.833
4.7
3.7
58.7
-0.2
-100
.0
Uga
nda
29.0
97.3
126.
356
4.0
254.
329
1.0
15.0
59.2
126.
029
5.1
0.2
25.0
-0.1
-100
.0
Uni
ted
Rep
ublic
of
Tanz
ania
56.0
72.0
128.
059
2.4
216.
629
9.8
48.3
21.1
125.
227
5.2
-0.6
-100
.0-3
.4-1
00.0
Zam
bia
39.3
39.9
79.2
316.
417
6.8
226.
354
.420
.479
.723
1.0
-0.2
-100
.00.
4-1
00.0
Zim
babw
e26
.716
.543
.228
0.5
87.9
152.
798
.30.
742
.812
7.0
-0.4
-100
.0-0
.8-1
3.8
Hig
h in
com
e co
untr
ies
12 0
31.0
383.
112
414
.177
.511
.165
.512
650
.961
.469
8.8
44.8
920.
729
.6
Aus
tral
ia32
6.4
-1.7
324.
760
.5-2
.352
.743
.046
.433
2.5
52.0
-0.5
-100
.07.
030
.4
Can
ada
373.
48.
838
2.2
39.9
5.5
34.8
35.0
58.0
330.
031
.5-8
3.0
-45.
4-1
31.3
-100
.0

111
Annex C
cou
nTr
y
Po
uLT
RY m
EAT,
CH
An
GE
BETW
EEn
200
0 A
nD
203
0
Cons
umpti
onPr
oduc
tion
Impo
rtEx
port
Abs
olut
e ch
ange
Perc
ent c
hang
e
Prop
orti
on
of c
hang
e du
e to
ch
ange
in
cons
ump.
ra
tes
%
Prop
orti
on
of c
hang
e du
e to
ch
ange
in
popu
lati
on
%
Abs
olut
e ch
ange
Perc
ent
chan
geA
bsol
ute
chan
gePe
rcen
t ch
ange
Abs
olut
e ch
ange
Perc
ent
chan
ge
urb
anRu
ral
Tota
lu
rban
Rura
lTo
tal
Icel
and
2.6
0.3
2.9
86.4
77.4
85.3
68.4
20.0
3.1
96.9
-0.2
-100
.00.
0
Isra
el28
1.0
17.0
298.
010
8.1
67.8
104.
536
.146
.429
8.6
103.
1-7
.4-1
00.0
-6.3
-55.
8
Japa
n76
9.3
74.7
844.
060
.311
.343
.511
6.4
-10.
923
8.6
20.0
616.
978
.8-3
.7-1
00.0
New
Zea
land
42.3
2.0
44.3
45.6
13.7
41.3
48.3
43.1
43.7
40.5
-0.5
-100
.0-1
.3-1
00.0
Nor
way
40.3
6.1
46.4
155.
497
.514
4.1
84.8
6.8
46.7
146.
4-0
.4-1
00.0
-0.1
-100
.0
Rep
ublic
of K
orea
635.
163
.769
8.8
157.
764
.013
9.1
89.0
4.9
674.
515
8.1
22.4
28.9
-1.9
-100
.0
Saud
i Ara
bia
1 05
3.3
100.
21
153.
518
0.9
79.5
162.
821
.458
.488
1.7
231.
925
6.0
74.4
-15.
7-1
00.0
Swit
zerl
and
25.2
1.8
27.0
35.2
8.5
29.1
134.
5-2
4.8
28.8
80.0
-2.3
-4.0
-0.4
-100
.0
Trin
idad
and
Tob
ago
8.7
6.7
15.4
135.
323
.944
.990
.86.
614
.546
.50.
617
.6-0
.3-1
00.0
Uni
ted
Stat
es o
f Am
eric
a8
473.
410
3.5
8 57
6.9
74.9
4.7
63.4
40.6
47.3
9 75
8.2
59.4
-102
.8-1
00.0
1 07
4.7
36.7

112
Mapping supply and demand for animal-source foods to 2030
Tabl
e C
11.
Con
sum
ptio
n an
d pr
oduc
tion
of e
ggs
in 2
000
and
2030
(all
mea
sure
s ar
e in
thou
sand
s of
met
ric
tonn
es).
cou
nTr
y
egg
s 20
00eg
gs
2030
Cons
umpti
onPr
oduc
tion
Impo
rtEx
port
Cons
umpti
onPr
oduc
tion
Impo
rtEx
port
urb
anRu
ral
Tota
lu
rban
Rura
lTo
tal
Eas
t A
sia
and
Paci
fic11
313
.311
309
.322
622
.625
246
.111
.013
0.8
21 6
34.2
11 1
76.3
32 8
10.5
36 2
50.7
0.0
135.
0
Cam
bodi
a2.
610
.813
.414
.90.
00.
017
.829
.347
.152
.50.
00.
0
Chi
na10
281
.710
004
.820
286
.522
382
.50.
360
.117
953
.09
143.
027
096
.029
418
.00.
010
0.0
Dem
. Peo
ple’
s R
ep. o
f K
orea
64.3
36.8
101.
110
8.3
0.1
0.0
142.
949
.419
2.3
206.
30.
00.
0
Indo
nesi
a25
9.3
352.
961
2.2
739.
52.
52.
61
407.
963
4.4
2 04
2.3
2 46
5.6
0.0
0.0
Lao
Peo
ple’
s D
em. R
ep.
1.9
6.5
8.4
9.9
0.0
0.0
14.5
13.3
27.8
32.7
0.0
0.0
Mal
aysi
a17
6.9
104.
028
0.9
407.
21.
759
.446
3.9
99.1
563.
071
3.2
0.0
30.0
Mya
nmar
21.1
53.1
74.2
87.8
0.4
0.0
103.
511
1.1
214.
625
5.2
0.0
0.0
Phi
lippi
nes
274.
619
5.0
469.
651
4.9
2.5
0.2
868.
426
9.6
1 13
8.0
1 25
3.8
0.0
0.0
Tha
iland
189.
641
5.6
605.
279
5.1
1.8
6.6
483.
657
2.3
1 05
5.9
1 38
2.9
0.0
5.0
Vie
t Nam
41.2
129.
917
1.1
186.
01.
71.
917
8.7
254.
843
3.5
470.
50.
00.
0
Eas
tern
Eur
ope
and
C
entr
al A
sia
1 73
6.9
685.
72
422.
62
547.
827
.523
.12
391.
071
5.1
3 10
6.1
3 32
0.9
20.0
20.0
Rus
sian
Fed
erat
ion
1 37
5.3
495.
21
870.
51
911.
625
.68.
21
601.
149
3.9
2 09
5.0
2 16
0.1
20.0
0.0
Turk
ey36
1.6
190.
555
2.1
636.
21.
914
.978
9.8
221.
31
011.
11
160.
80.
020
.0
Lat
in A
mer
ica/
Car
ibbe
an3
133.
01
010.
54
143.
55
028.
744
.929
.66
171.
11
217.
97
389.
08
864.
824
.012
.0
Arg
enti
na25
0.2
21.8
272.
031
5.9
4.0
0.5
381.
917
.939
9.8
470.
00.
00.
0
Bol
ivia
19.8
10.5
30.3
38.9
0.0
0.5
53.6
15.6
69.2
86.5
0.0
0.0
Bra
zil
956.
825
3.6
1 21
0.4
1 56
1.5
0.5
7.0
1 76
6.2
232.
51
998.
72
571.
10.
05.
0
Chi
le70
.212
.282
.410
9.9
0.1
1.5
130.
112
.114
2.2
184.
20.
00.
0
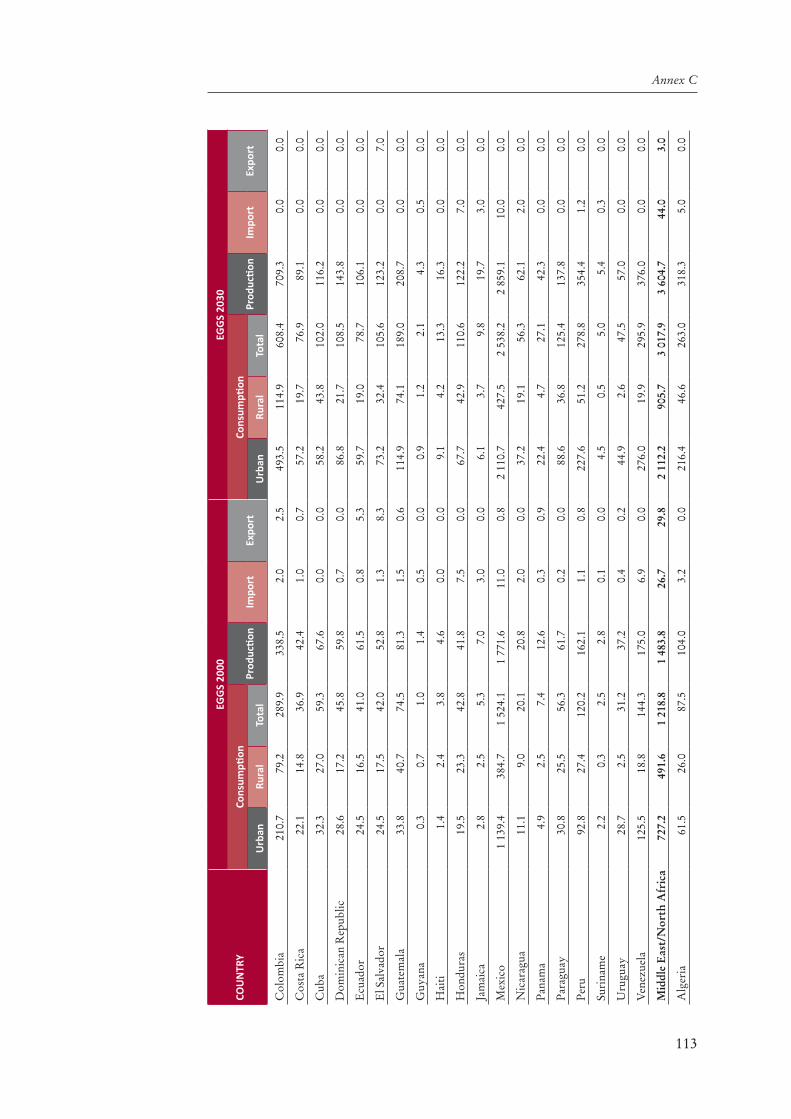
113
Annex C
cou
nTr
y
egg
s 20
00eg
gs
2030
Cons
umpti
onPr
oduc
tion
Impo
rtEx
port
Cons
umpti
onPr
oduc
tion
Impo
rtEx
port
urb
anRu
ral
Tota
lu
rban
Rura
lTo
tal
Col
ombi
a21
0.7
79.2
289.
933
8.5
2.0
2.5
493.
511
4.9
608.
470
9.3
0.0
0.0
Cos
ta R
ica
22.1
14.8
36.9
42.4
1.0
0.7
57.2
19.7
76.9
89.1
0.0
0.0
Cub
a32
.327
.059
.367
.60.
00.
058
.243
.810
2.0
116.
20.
00.
0
Dom
inic
an R
epub
lic28
.617
.245
.859
.80.
70.
086
.821
.710
8.5
143.
80.
00.
0
Ecu
ador
24.5
16.5
41.0
61.5
0.8
5.3
59.7
19.0
78.7
106.
10.
00.
0
El S
alva
dor
24.5
17.5
42.0
52.8
1.3
8.3
73.2
32.4
105.
612
3.2
0.0
7.0
Gua
tem
ala
33.8
40.7
74.5
81.3
1.5
0.6
114.
974
.118
9.0
208.
70.
00.
0
Guy
ana
0.3
0.7
1.0
1.4
0.5
0.0
0.9
1.2
2.1
4.3
0.5
0.0
Hai
ti1.
42.
43.
84.
60.
00.
09.
14.
213
.316
.30.
00.
0
Hon
dura
s19
.523
.342
.841
.87.
50.
067
.742
.911
0.6
122.
27.
00.
0
Jam
aica
2.8
2.5
5.3
7.0
3.0
0.0
6.1
3.7
9.8
19.7
3.0
0.0
Mex
ico
1 13
9.4
384.
71
524.
11
771.
611
.00.
82
110.
742
7.5
2 53
8.2
2 85
9.1
10.0
0.0
Nic
arag
ua11
.19.
020
.120
.82.
00.
037
.219
.156
.362
.12.
00.
0
Pan
ama
4.9
2.5
7.4
12.6
0.3
0.9
22.4
4.7
27.1
42.3
0.0
0.0
Par
agua
y30
.825
.556
.361
.70.
20.
088
.636
.812
5.4
137.
80.
00.
0
Per
u92
.827
.412
0.2
162.
11.
10.
822
7.6
51.2
278.
835
4.4
1.2
0.0
Suri
nam
e2.
20.
32.
52.
80.
10.
04.
50.
55.
05.
40.
30.
0
Uru
guay
28.7
2.5
31.2
37.2
0.4
0.2
44.9
2.6
47.5
57.0
0.0
0.0
Ven
ezue
la12
5.5
18.8
144.
317
5.0
6.9
0.0
276.
019
.929
5.9
376.
00.
00.
0
Mid
dle
Eas
t/N
orth
Afr
ica
727.
249
1.6
1 21
8.8
1 48
3.8
26.7
29.8
2 11
2.2
905.
73
017.
93
604.
744
.03.
0
Alg
eria
61.5
26.0
87.5
104.
03.
20.
021
6.4
46.6
263.
031
8.3
5.0
0.0
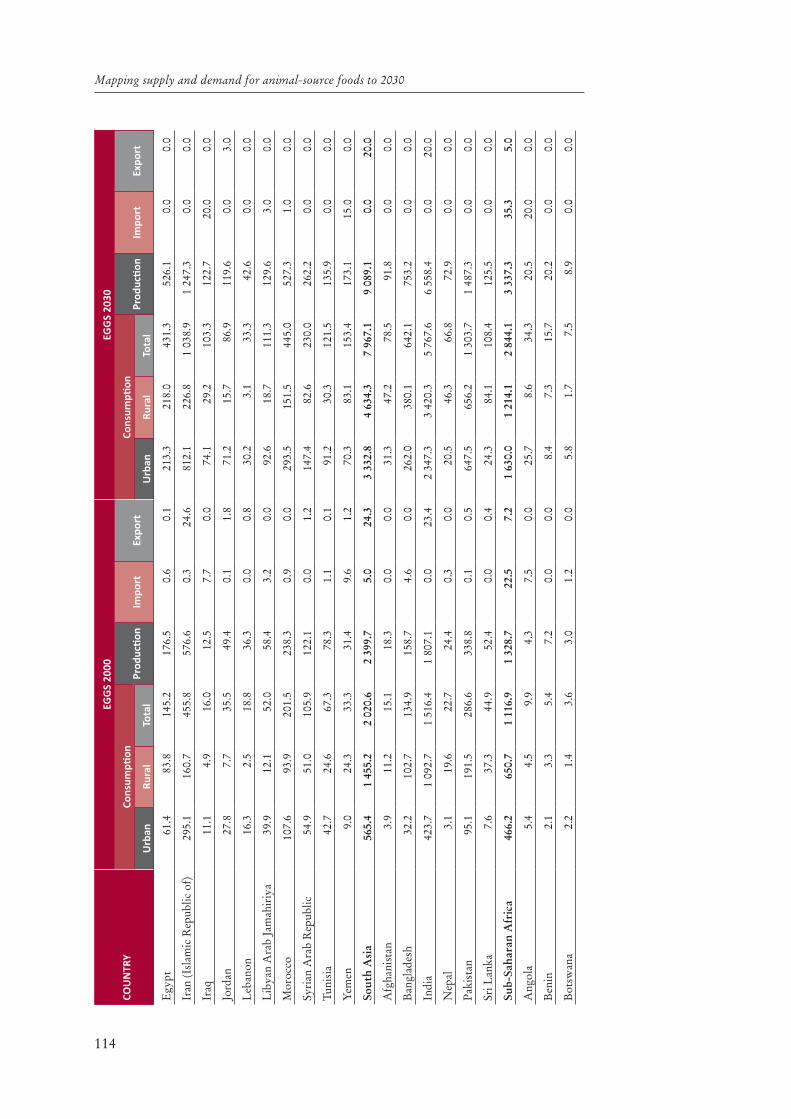
114
Mapping supply and demand for animal-source foods to 2030
cou
nTr
y
egg
s 20
00eg
gs
2030
Cons
umpti
onPr
oduc
tion
Impo
rtEx
port
Cons
umpti
onPr
oduc
tion
Impo
rtEx
port
urb
anRu
ral
Tota
lu
rban
Rura
lTo
tal
Egy
pt61
.483
.814
5.2
176.
50.
60.
121
3.3
218.
043
1.3
526.
10.
00.
0
Iran
(Isl
amic
Rep
ublic
of)
295.
116
0.7
455.
857
6.6
0.3
24.6
812.
122
6.8
1 03
8.9
1 24
7.3
0.0
0.0
Iraq
11.1
4.9
16.0
12.5
7.7
0.0
74.1
29.2
103.
312
2.7
20.0
0.0
Jord
an27
.87.
735
.549
.40.
11.
871
.215
.786
.911
9.6
0.0
3.0
Leb
anon
16.3
2.5
18.8
36.3
0.0
0.8
30.2
3.1
33.3
42.6
0.0
0.0
Lib
yan
Ara
b Ja
mah
iriy
a39
.912
.152
.058
.43.
20.
092
.618
.711
1.3
129.
63.
00.
0
Mor
occo
107.
693
.920
1.5
238.
30.
90.
029
3.5
151.
544
5.0
527.
31.
00.
0
Syri
an A
rab
Rep
ublic
54.9
51.0
105.
912
2.1
0.0
1.2
147.
482
.623
0.0
262.
20.
00.
0
Tuni
sia
42.7
24.6
67.3
78.3
1.1
0.1
91.2
30.3
121.
513
5.9
0.0
0.0
Yem
en9.
024
.333
.331
.49.
61.
270
.383
.115
3.4
173.
115
.00.
0
Sout
h A
sia
565.
41
455.
22
020.
62
399.
75.
024
.33
332.
84
634.
37
967.
19
089.
10.
020
.0
Afg
hani
stan
3.9
11.2
15.1
18.3
0.0
0.0
31.3
47.2
78.5
91.8
0.0
0.0
Ban
glad
esh
32.2
102.
713
4.9
158.
74.
60.
026
2.0
380.
164
2.1
753.
20.
00.
0
Indi
a42
3.7
1 09
2.7
1 51
6.4
1 80
7.1
0.0
23.4
2 34
7.3
3 42
0.3
5 76
7.6
6 55
8.4
0.0
20.0
Nep
al3.
119
.622
.724
.40.
30.
020
.546
.366
.872
.90.
00.
0
Pak
ista
n95
.119
1.5
286.
633
8.8
0.1
0.5
647.
565
6.2
1 30
3.7
1 48
7.3
0.0
0.0
Sri L
anka
7.6
37.3
44.9
52.4
0.0
0.4
24.3
84.1
108.
412
5.5
0.0
0.0
Sub-
Saha
ran
Afr
ica
466.
265
0.7
1 11
6.9
1 32
8.7
22.5
7.2
1 63
0.0
1 21
4.1
2 84
4.1
3 33
7.3
35.3
5.0
Ang
ola
5.4
4.5
9.9
4.3
7.5
0.0
25.7
8.6
34.3
20.5
20.0
0.0
Ben
in2.
13.
35.
47.
20.
00.
08.
47.
315
.720
.20.
00.
0
Bot
swan
a2.
21.
43.
63.
01.
20.
05.
81.
77.
58.
90.
00.
0

115
Annex C
cou
nTr
y
egg
s 20
00eg
gs
2030
Cons
umpti
onPr
oduc
tion
Impo
rtEx
port
Cons
umpti
onPr
oduc
tion
Impo
rtEx
port
urb
anRu
ral
Tota
lu
rban
Rura
lTo
tal
Bur
kina
Fas
o2.
39.
111
.417
.50.
00.
014
.827
.141
.958
.60.
30.
0
Bur
undi
0.2
2.2
2.4
3.1
0.0
0.0
2.2
8.7
10.9
13.5
0.0
0.0
Cam
eroo
n5.
64.
910
.513
.60.
00.
015
.76.
121
.827
.10.
00.
0
Cen
tral
Afr
ican
Rep
ublic
0.5
0.7
1.2
1.4
0.0
0.0
1.4
1.3
2.7
3.2
0.0
0.0
Cha
d1.
02.
63.
64.
40.
00.
03.
95.
08.
910
.70.
00.
0
Con
go1.
00.
81.
81.
21.
20.
03.
71.
65.
34.
42.
50.
0
Cot
e d’
Ivoi
re11
.515
.426
.932
.10.
20.
050
.031
.481
.497
.70.
00.
0
Dem
. Rep
. of t
he C
ongo
1.7
3.5
5.2
7.0
0.4
0.0
21.3
21.5
42.8
57.8
0.2
0.0
Eri
trea
0.3
1.2
1.5
1.8
0.0
0.0
2.2
4.2
6.4
7.3
0.0
0.0
Eth
iopi
a4.
523
.127
.631
.70.
00.
032
.881
.711
4.5
131.
60.
00.
0
Gab
on1.
40.
21.
62.
00.
00.
03.
80.
34.
15.
20.
00.
0
Gam
bia
0.8
0.6
1.4
0.7
1.0
0.0
2.8
0.9
3.7
2.5
2.0
0.0
Gha
na7.
68.
516
.121
.30.
10.
043
.621
.765
.387
.20.
00.
0
Gui
nea
3.4
5.8
9.2
12.3
0.0
0.0
15.8
14.0
29.8
37.4
0.1
0.0
Ken
ya9.
536
.445
.959
.60.
00.
032
.164
.896
.911
8.4
0.4
0.0
Les
otho
0.3
1.0
1.3
1.5
0.1
0.0
1.1
1.5
2.6
3.2
0.0
0.0
Lib
eria
2.6
2.1
4.7
4.3
1.6
0.0
10.0
3.7
13.7
15.3
2.0
0.0
Mad
agas
car
4.3
10.2
14.5
19.0
0.1
0.0
17.4
22.8
40.2
52.6
0.0
0.0
Mal
awi
2.6
14.6
17.2
19.4
1.0
0.0
12.8
26.9
39.7
44.5
1.0
0.0
Mal
i2.
04.
96.
911
.90.
00.
012
.713
.926
.640
.50.
20.
0
Mau
rita
nia
2.0
2.4
4.4
4.9
0.6
0.0
6.2
4.8
11.0
13.4
0.0
0.0
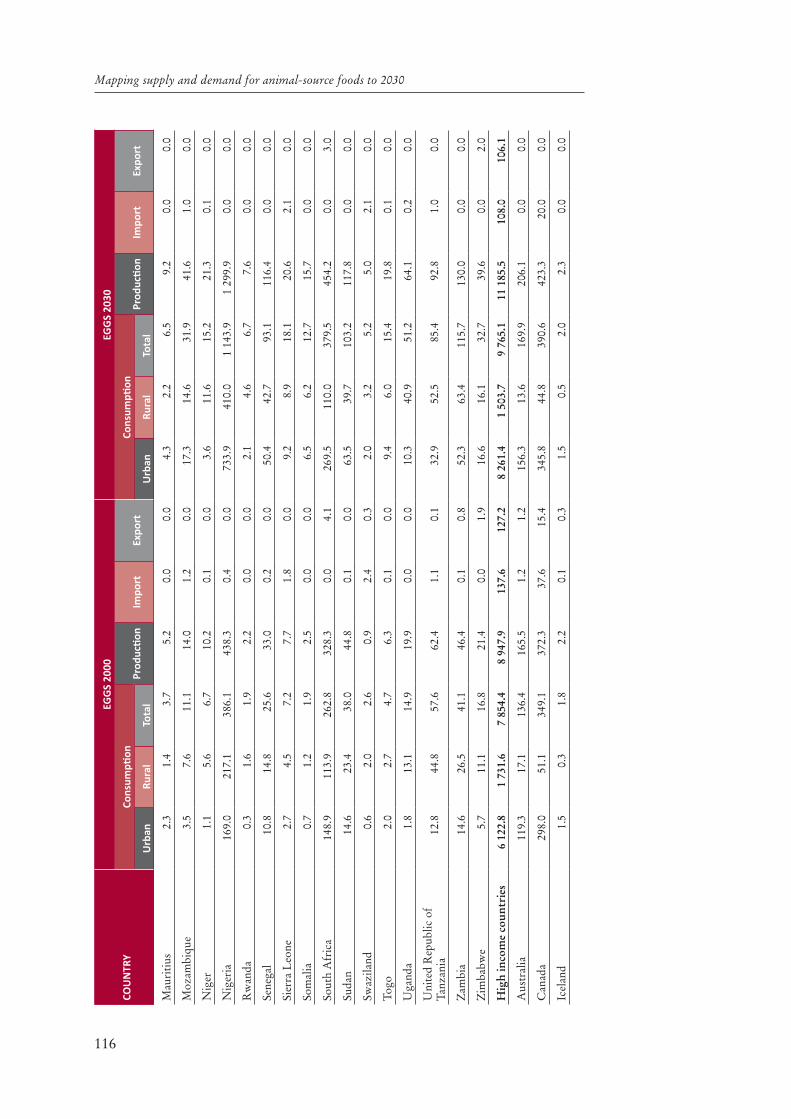
116
Mapping supply and demand for animal-source foods to 2030
cou
nTr
y
egg
s 20
00eg
gs
2030
Cons
umpti
onPr
oduc
tion
Impo
rtEx
port
Cons
umpti
onPr
oduc
tion
Impo
rtEx
port
urb
anRu
ral
Tota
lu
rban
Rura
lTo
tal
Mau
riti
us2.
31.
43.
75.
20.
00.
04.
32.
26.
59.
20.
00.
0
Moz
ambi
que
3.5
7.6
11.1
14.0
1.2
0.0
17.3
14.6
31.9
41.6
1.0
0.0
Nig
er1.
15.
66.
710
.20.
10.
03.
611
.615
.221
.30.
10.
0
Nig
eria
169.
021
7.1
386.
143
8.3
0.4
0.0
733.
941
0.0
1 14
3.9
1 29
9.9
0.0
0.0
Rw
anda
0.3
1.6
1.9
2.2
0.0
0.0
2.1
4.6
6.7
7.6
0.0
0.0
Sene
gal
10.8
14.8
25.6
33.0
0.2
0.0
50.4
42.7
93.1
116.
40.
00.
0
Sier
ra L
eone
2.7
4.5
7.2
7.7
1.8
0.0
9.2
8.9
18.1
20.6
2.1
0.0
Som
alia
0.7
1.2
1.9
2.5
0.0
0.0
6.5
6.2
12.7
15.7
0.0
0.0
Sout
h A
fric
a14
8.9
113.
926
2.8
328.
30.
04.
126
9.5
110.
037
9.5
454.
20.
03.
0
Suda
n14
.623
.438
.044
.80.
10.
063
.539
.710
3.2
117.
80.
00.
0
Swaz
iland
0.6
2.0
2.6
0.9
2.4
0.3
2.0
3.2
5.2
5.0
2.1
0.0
Togo
2.0
2.7
4.7
6.3
0.1
0.0
9.4
6.0
15.4
19.8
0.1
0.0
Uga
nda
1.8
13.1
14.9
19.9
0.0
0.0
10.3
40.9
51.2
64.1
0.2
0.0
Uni
ted
Rep
ublic
of
Tanz
ania
12.8
44.8
57.6
62.4
1.1
0.1
32.9
52.5
85.4
92.8
1.0
0.0
Zam
bia
14.6
26.5
41.1
46.4
0.1
0.8
52.3
63.4
115.
713
0.0
0.0
0.0
Zim
babw
e5.
711
.116
.821
.40.
01.
916
.616
.132
.739
.60.
02.
0
Hig
h in
com
e co
untr
ies
6 12
2.8
1 73
1.6
7 85
4.4
8 94
7.9
137.
612
7.2
8 26
1.4
1 50
3.7
9 76
5.1
11 1
85.5
108.
010
6.1
Aus
tral
ia11
9.3
17.1
136.
416
5.5
1.2
1.2
156.
313
.616
9.9
206.
10.
00.
0
Can
ada
298.
051
.134
9.1
372.
337
.615
.434
5.8
44.8
390.
642
3.3
20.0
0.0
Icel
and
1.5
0.3
1.8
2.2
0.1
0.3
1.5
0.5
2.0
2.3
0.0
0.0
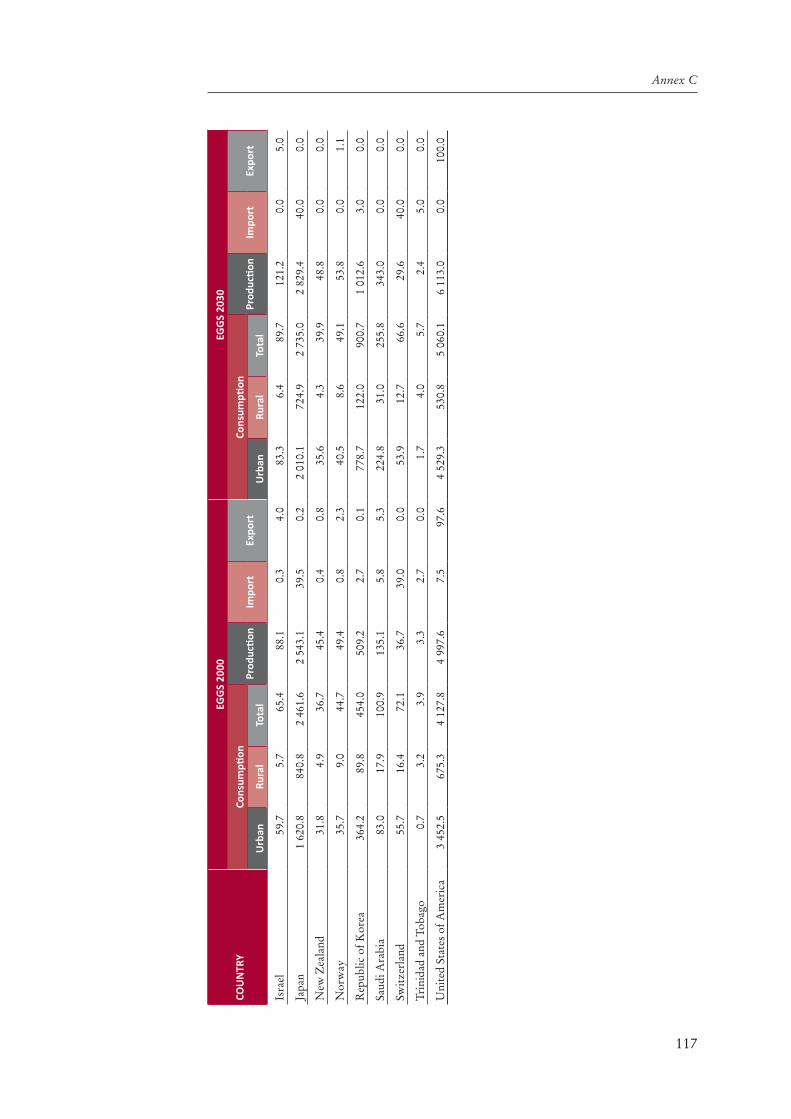
117
Annex C
cou
nTr
y
egg
s 20
00eg
gs
2030
Cons
umpti
onPr
oduc
tion
Impo
rtEx
port
Cons
umpti
onPr
oduc
tion
Impo
rtEx
port
urb
anRu
ral
Tota
lu
rban
Rura
lTo
tal
Isra
el59
.75.
765
.488
.10.
34.
083
.36.
489
.712
1.2
0.0
5.0
Japa
n1
620.
884
0.8
2 46
1.6
2 54
3.1
39.5
0.2
2 01
0.1
724.
92
735.
02
829.
440
.00.
0
New
Zea
land
31.8
4.9
36.7
45.4
0.4
0.8
35.6
4.3
39.9
48.8
0.0
0.0
Nor
way
35.7
9.0
44.7
49.4
0.8
2.3
40.5
8.6
49.1
53.8
0.0
1.1
Rep
ublic
of K
orea
364.
289
.845
4.0
509.
22.
70.
177
8.7
122.
090
0.7
1 01
2.6
3.0
0.0
Saud
i Ara
bia
83.0
17.9
100.
913
5.1
5.8
5.3
224.
831
.025
5.8
343.
00.
00.
0
Swit
zerl
and
55.7
16.4
72.1
36.7
39.0
0.0
53.9
12.7
66.6
29.6
40.0
0.0
Trin
idad
and
Tob
ago
0.7
3.2
3.9
3.3
2.7
0.0
1.7
4.0
5.7
2.4
5.0
0.0
Uni
ted
Stat
es o
f Am
eric
a3
452.
567
5.3
4 12
7.8
4 99
7.6
7.5
97.6
4 52
9.3
530.
85
060.
16
113.
00.
010
0.0

118
Mapping supply and demand for animal-source foods to 2030
Tabl
e C
12.
Cha
nge
in c
onsu
mpt
ion
and
prod
ucti
on o
f egg
s be
twee
n 20
00 a
nd 2
030
(abs
olut
e ch
ange
is in
thou
sand
s of
met
ric
tonn
es, p
ropo
rtio
nal
chan
ge in
per
cent
age)
.
cou
nTr
y
EGG
s, C
HA
nG
E BE
TWEE
n 2
000
An
D 2
030
Cons
umpti
onPr
oduc
tion
Impo
rtEx
port
Abs
olut
e ch
ange
Perc
ent c
hang
e
Prop
orti
on
of c
hang
e du
e to
ch
ange
in
cons
ump.
ra
tes
%
Prop
orti
on
of c
hang
e du
e to
ch
ange
in
popu
lati
on
%
Abs
olut
e ch
ange
Perc
ent
chan
geA
bsol
ute
chan
gePe
rcen
t ch
ange
Abs
olut
e ch
ange
Perc
ent
chan
ge
urb
anRu
ral
Tota
lu
rban
Rura
lTo
tal
Eas
t A
sia
and
Paci
fic10
320
.9-1
33.0
10 1
87.9
91.2
-1.2
45.0
11 0
04.6
43.6
-11.
0-1
00.0
4.2
3.2
Cam
bodi
a15
.218
.533
.758
0.3
171.
625
1.5
86.5
71.2
37.6
252.
30.
00.
0
Chi
na7
671.
3-8
61.8
6 80
9.5
74.6
-8.6
33.6
15.7
12.5
7 03
5.5
31.4
-0.3
-100
.039
.966
.4
Dem
. Peo
ple’
s R
ep. o
f K
orea
78.6
12.6
91.2
122.
334
.190
.265
.011
.498
.090
.5-0
.1-1
00.0
0.0
Indo
nesi
a1
148.
628
1.5
1 43
0.1
442.
979
.823
3.6
127.
725
.81
726.
123
3.4
-2.5
-100
.0-2
.6-1
00.0
Lao
Peo
ple’
s D
em. R
ep.
12.7
6.7
19.4
679.
610
3.2
231.
074
.964
.322
.823
0.3
0.0
0.0
Mal
aysi
a28
6.9
-4.8
282.
116
2.1
-4.6
100.
421
.436
.630
6.0
75.1
-1.7
-100
.0-2
9.4
-49.
5
Mya
nmar
82.4
58.0
140.
438
9.7
109.
418
9.2
105.
024
.516
7.4
190.
7-0
.4-1
00.0
0.0
Phi
lippi
nes
593.
874
.666
8.4
216.
338
.214
2.3
55.8
45.9
738.
914
3.5
-2.5
-100
.0-0
.2-1
00.0
Tha
iland
294.
015
6.7
450.
715
5.1
37.7
74.5
31.2
18.1
587.
873
.9-1
.8-1
00.0
-1.6
-24.
2
Vie
t Nam
137.
512
4.9
262.
433
3.6
96.2
153.
476
.135
.628
4.5
153.
0-1
.7-1
00.0
-1.9
-100
.0
Eas
tern
Eur
ope
and
Cen
tral
Asi
a65
4.1
29.4
683.
537
.74.
328
.277
3.1
30.3
-7.5
-27.
3-3
.1-1
3.4
Rus
sian
Fed
erat
ion
225.
9-1
.422
4.5
16.4
-0.3
12.0
35.4
-17.
424
8.5
13.0
-5.6
-21.
9-8
.2-1
00.0
Turk
ey42
8.2
30.8
459.
011
8.4
16.2
83.1
31.3
30.0
524.
682
.5-1
.9-1
00.0
5.1
34.2

119
Annex C
cou
nTr
y
EGG
s, C
HA
nG
E BE
TWEE
n 2
000
An
D 2
030
Cons
umpti
onPr
oduc
tion
Impo
rtEx
port
Abs
olut
e ch
ange
Perc
ent c
hang
e
Prop
orti
on
of c
hang
e du
e to
ch
ange
in
cons
ump.
ra
tes
%
Prop
orti
on
of c
hang
e du
e to
ch
ange
in
popu
lati
on
%
Abs
olut
e ch
ange
Perc
ent
chan
geA
bsol
ute
chan
gePe
rcen
t ch
ange
Abs
olut
e ch
ange
Perc
ent
chan
ge
urb
anRu
ral
Tota
lu
rban
Rura
lTo
tal
Lat
in A
mer
ica/
C
arib
bean
3 03
8.1
207.
43
245.
597
.020
.578
.33
836.
176
.3-2
0.9
-46.
5-1
7.6
-59.
5
Arg
enti
na13
1.7
-3.9
127.
852
.7-1
8.0
47.0
10.4
26.8
154.
148
.8-4
.0-1
00.0
-0.5
-100
.0
Bol
ivia
33.8
5.1
38.9
170.
948
.412
8.4
33.5
46.4
47.6
122.
40.
0-0
.5-1
00.0
Bra
zil
809.
4-2
1.1
788.
384
.6-8
.365
.121
.522
.71
009.
664
.7-0
.5-1
00.0
-2.0
-28.
6
Chi
le59
.9-0
.159
.885
.2-0
.572
.622
.025
.174
.367
.6-0
.1-1
00.0
-1.5
-100
.0
Col
ombi
a28
2.7
35.8
318.
513
4.2
45.2
109.
938
.838
.137
0.8
109.
5-2
.0-1
00.0
-2.5
-100
.0
Cos
ta R
ica
35.1
4.9
40.0
158.
533
.510
8.4
34.3
43.1
46.7
110.
1-1
.0-1
00.0
-0.7
-100
.0
Cub
a25
.916
.842
.780
.062
.472
.061
.31.
148
.671
.90.
00.
0
Dom
inic
an R
epub
lic58
.24.
562
.720
3.5
26.1
136.
957
.626
.984
.014
0.5
-0.7
-100
.00.
0
Ecu
ador
35.2
2.5
37.7
143.
815
.092
.025
.026
.444
.672
.5-0
.8-1
00.0
-5.3
-100
.0
El S
alva
dor
48.7
14.9
63.6
199.
085
.015
1.4
61.5
33.2
70.4
133.
3-1
.3-1
00.0
-1.3
-15.
7
Gua
tem
ala
81.1
33.4
114.
523
9.8
82.1
153.
734
.876
.812
7.4
156.
7-1
.5-1
00.0
-0.6
-100
.0
Guy
ana
0.5
0.6
1.1
153.
887
.711
0.0
92.4
-6.0
2.9
207.
10.
00.
00.
0
Hai
ti7.
71.
89.
553
1.0
76.7
250.
012
6.0
31.9
11.7
254.
30.
00.
0
Hon
dura
s48
.219
.667
.824
7.3
84.1
158.
457
.067
.580
.419
2.3
-0.5
-6.7
0.0
Jam
aica
3.4
1.1
4.5
122.
044
.684
.931
.123
.512
.718
1.4
0.0
0.0
0.0
Mex
ico
971.
342
.81
014.
185
.211
.166
.520
.130
.11
087.
561
.4-1
.0-9
.1-0
.8-1
00.0

120
Mapping supply and demand for animal-source foods to 2030
cou
nTr
y
EGG
s, C
HA
nG
E BE
TWEE
n 2
000
An
D 2
030
Cons
umpti
onPr
oduc
tion
Impo
rtEx
port
Abs
olut
e ch
ange
Perc
ent c
hang
e
Prop
orti
on
of c
hang
e du
e to
ch
ange
in
cons
ump.
ra
tes
%
Prop
orti
on
of c
hang
e du
e to
ch
ange
in
popu
lati
on
%
Abs
olut
e ch
ange
Perc
ent
chan
geA
bsol
ute
chan
gePe
rcen
t ch
ange
Abs
olut
e ch
ange
Perc
ent
chan
ge
urb
anRu
ral
Tota
lu
rban
Rura
lTo
tal
Nic
arag
ua26
.110
.136
.223
4.8
112.
318
0.1
57.1
73.5
41.3
198.
60.
00.
00.
0
Pan
ama
17.5
2.2
19.7
357.
088
.026
6.2
81.8
31.1
29.7
235.
7-0
.3-1
00.0
-0.9
-100
.0
Par
agua
y57
.711
.469
.118
7.4
44.5
122.
721
.273
.776
.112
3.3
-0.2
-100
.00.
0
Per
u13
4.9
23.7
158.
614
5.4
86.4
131.
945
.932
.119
2.3
118.
60.
19.
1-0
.8-1
00.0
Suri
nam
e2.
40.
12.
511
0.8
32.2
100.
065
.913
.42.
692
.90.
220
0.0
0.0
Uru
guay
16.2
0.1
16.3
56.4
4.7
52.2
23.9
15.5
19.8
53.2
-0.4
-100
.0-0
.2-1
00.0
Ven
ezue
la15
0.4
1.2
151.
611
9.8
6.2
105.
128
.543
.220
1.0
114.
9-6
.9-1
00.0
0.0
Mid
dle
Eas
t/
Nor
th A
fric
a1
385.
041
4.1
1 79
9.1
190.
584
.214
7.6
2 12
0.9
142.
917
.364
.8-2
6.8
-89.
9
Alg
eria
154.
920
.617
5.5
252.
179
.020
0.6
89.3
38.6
214.
320
6.1
1.8
56.3
0.0
Egy
pt15
1.9
134.
228
6.1
247.
216
0.2
197.
069
.650
.134
9.6
198.
1-0
.6-1
00.0
-0.1
-100
.0
Iran
(Isl
amic
Rep
ublic
of)
516.
966
.258
3.1
175.
241
.212
7.9
47.7
33.3
670.
711
6.3
-0.3
-100
.0-2
4.6
-100
.0
Iraq
63.0
24.3
87.3
568.
649
3.8
545.
629
5.4
121.
811
0.2
881.
612
.315
9.7
0.0
Jord
an43
.48.
051
.415
6.4
103.
014
4.8
30.6
51.5
70.2
142.
1-0
.1-1
00.0
1.2
66.7
Leb
anon
13.9
0.6
14.5
85.2
24.6
77.1
16.2
18.1
6.3
17.4
0.0
-0.8
-100
.0
Lib
yan
Ara
b Ja
mah
iriy
a52
.66.
759
.313
1.9
55.1
114.
033
.949
.071
.212
1.9
-0.2
-6.3
0.0
Mor
occo
185.
957
.624
3.5
172.
961
.312
0.8
43.3
38.9
289.
012
1.3
0.1
11.1
0.0
Syri
an A
rab
Rep
ublic
92.5
31.6
124.
116
8.5
61.9
117.
221
.863
.814
0.1
114.
70.
0-1
.2-1
00.0

121
Annex C
cou
nTr
y
EGG
s, C
HA
nG
E BE
TWEE
n 2
000
An
D 2
030
Cons
umpti
onPr
oduc
tion
Impo
rtEx
port
Abs
olut
e ch
ange
Perc
ent c
hang
e
Prop
orti
on
of c
hang
e du
e to
ch
ange
in
cons
ump.
ra
tes
%
Prop
orti
on
of c
hang
e du
e to
ch
ange
in
popu
lati
on
%
Abs
olut
e ch
ange
Perc
ent
chan
geA
bsol
ute
chan
gePe
rcen
t ch
ange
Abs
olut
e ch
ange
Perc
ent
chan
ge
urb
anRu
ral
Tota
lu
rban
Rura
lTo
tal
Tuni
sia
48.6
5.6
54.2
113.
822
.980
.533
.625
.657
.673
.6-1
.1-1
00.0
-0.1
-100
.0
Yem
en61
.358
.812
0.1
684.
424
1.5
360.
768
.119
1.5
141.
745
1.3
5.4
56.3
-1.2
-100
.0
Sout
h A
sia
2 76
7.4
3 17
9.1
5 94
6.5
489.
421
8.5
294.
36
689.
427
8.8
-5.0
-100
.0-4
.3-1
7.7
Afg
hani
stan
27.4
36.0
63.4
703.
032
1.4
419.
910
1.6
109.
773
.540
1.6
0.0
0.0
Ban
glad
esh
229.
827
7.4
507.
271
4.8
270.
037
6.0
168.
350
.859
4.5
374.
6-4
.6-1
00.0
0.0
Indi
a1
923.
62
327.
64
251.
245
4.0
213.
028
0.3
145.
233
.04
751.
326
2.9
0.0
-3.4
-14.
5
Nep
al17
.426
.744
.156
7.1
136.
019
4.3
65.0
68.1
48.5
198.
8-0
.3-1
00.0
0.0
Pak
ista
n55
2.4
464.
71
017.
158
1.0
242.
635
4.9
117.
576
.51
148.
533
9.0
-0.1
-100
.0-0
.5-1
00.0
Sri L
anka
16.7
46.8
63.5
221.
212
5.3
141.
491
.814
.273
.113
9.5
0.0
-0.4
-100
.0
Sub-
Saha
ran
Afr
ica
1 16
3.8
563.
41
727.
224
9.6
86.6
154.
62
008.
615
1.2
12.8
56.9
-2.2
-30.
6
Ang
ola
20.2
4.2
24.4
373.
093
.124
6.5
115.
730
0.6
16.2
376.
712
.516
6.7
0.0
Ben
in6.
34.
010
.330
4.7
119.
219
0.7
37.3
70.7
13.0
180.
60.
00.
0
Bot
swan
a3.
60.
33.
916
2.6
23.5
108.
315
5.9
-11.
35.
919
6.7
-1.2
-100
.00.
0
Bur
kina
Fas
o12
.518
.030
.554
7.8
197.
226
7.5
37.0
87.5
41.1
234.
90.
30.
0
Bur
undi
1.9
6.6
8.5
921.
529
9.4
354.
284
.490
.810
.433
5.5
0.0
0.0
Cam
eroo
n10
.11.
211
.318
1.8
23.4
107.
634
.134
.013
.599
.30.
00.
0
Cen
tral
Afr
ican
Rep
ublic
0.9
0.6
1.5
178.
187
.512
5.0
45.0
40.7
1.8
128.
60.
00.
0
Cha
d2.
92.
45.
329
4.7
91.8
147.
27.
910
2.6
6.3
143.
20.
00.
0

122
Mapping supply and demand for animal-source foods to 2030
cou
nTr
y
EGG
s, C
HA
nG
E BE
TWEE
n 2
000
An
D 2
030
Cons
umpti
onPr
oduc
tion
Impo
rtEx
port
Abs
olut
e ch
ange
Perc
ent c
hang
e
Prop
orti
on
of c
hang
e du
e to
ch
ange
in
cons
ump.
ra
tes
%
Prop
orti
on
of c
hang
e du
e to
ch
ange
in
popu
lati
on
%
Abs
olut
e ch
ange
Perc
ent
chan
geA
bsol
ute
chan
gePe
rcen
t ch
ange
Abs
olut
e ch
ange
Perc
ent
chan
ge
urb
anRu
ral
Tota
lu
rban
Rura
lTo
tal
Con
go2.
70.
83.
525
8.7
108.
319
4.4
51.4
179.
03.
226
6.7
1.3
108.
30.
0
Cot
e d’
Ivoi
re38
.516
.054
.533
4.9
103.
920
2.6
88.8
39.4
65.6
204.
4-0
.2-1
00.0
0.0
Dem
. Rep
. of t
he C
ongo
19.7
17.9
37.6
1 17
8.2
507.
872
3.1
203.
889
.150
.872
5.7
-0.2
-50.
00.
0
Eri
trea
2.0
2.9
4.9
711.
224
0.6
326.
783
.094
.85.
530
5.6
0.0
0.0
Eth
iopi
a28
.258
.786
.962
3.0
254.
331
4.9
99.2
81.8
99.9
315.
10.
00.
0
Gab
on2.
40.
12.
517
2.7
36.1
156.
346
.150
.13.
216
0.0
0.0
0.0
Gam
bia
2.0
0.3
2.3
248.
851
.216
4.3
96.6
156.
41.
825
7.1
1.0
100.
00.
0
Gha
na36
.013
.249
.247
1.5
155.
930
5.6
108.
450
.365
.930
9.4
-0.1
-100
.00.
0
Gui
nea
12.4
8.2
20.6
363.
214
1.7
223.
957
.062
.725
.120
4.1
0.1
0.0
Ken
ya22
.628
.451
.023
8.6
78.0
111.
143
.726
.758
.898
.70.
40.
0
Les
otho
0.8
0.5
1.3
291.
346
.010
0.0
112.
1-1
1.1
1.7
113.
3-0
.1-1
00.0
0.0
Lib
eria
7.4
1.6
9.0
286.
475
.519
1.5
27.7
144.
911
.025
5.8
0.4
25.0
0.0
Mad
agas
car
13.1
12.6
25.7
305.
912
3.3
177.
224
.783
.633
.617
6.8
-0.1
-100
.00.
0
Mal
awi
10.2
12.3
22.5
390.
584
.413
0.8
28.6
66.1
25.1
129.
40.
00.
00.
0
Mal
i10
.79.
019
.752
8.6
184.
928
5.5
32.0
86.0
28.6
240.
30.
20.
0
Mau
rita
nia
4.2
2.4
6.6
206.
610
1.6
150.
018
.696
.28.
517
3.5
-0.6
-100
.00.
0
Mau
riti
us2.
10.
72.
891
.650
.775
.731
.715
.34.
076
.90.
00.
0
Moz
ambi
que
13.8
7.0
20.8
390.
893
.018
7.4
73.6
38.9
27.6
197.
1-0
.2-1
6.7
0.0

123
Annex C
cou
nTr
y
EGG
s, C
HA
nG
E BE
TWEE
n 2
000
An
D 2
030
Cons
umpti
onPr
oduc
tion
Impo
rtEx
port
Abs
olut
e ch
ange
Perc
ent c
hang
e
Prop
orti
on
of c
hang
e du
e to
ch
ange
in
cons
ump.
ra
tes
%
Prop
orti
on
of c
hang
e du
e to
ch
ange
in
popu
lati
on
%
Abs
olut
e ch
ange
Perc
ent
chan
geA
bsol
ute
chan
gePe
rcen
t ch
ange
Abs
olut
e ch
ange
Perc
ent
chan
ge
urb
anRu
ral
Tota
lu
rban
Rura
lTo
tal
Nig
er2.
56.
08.
522
6.9
107.
312
6.9
-12.
911
9.7
11.1
108.
80.
00.
00.
0
Nig
eria
564.
919
2.9
757.
833
4.1
88.9
196.
356
.870
.686
1.6
196.
6-0
.4-1
00.0
0.0
Rw
anda
1.8
3.0
4.8
525.
919
4.2
252.
687
.265
.25.
424
5.5
0.0
0.0
Sene
gal
39.7
27.8
67.5
368.
318
7.7
263.
779
.062
.283
.425
2.7
-0.2
-100
.00.
0
Sier
ra L
eone
6.5
4.4
10.9
236.
699
.215
1.4
33.3
79.8
12.9
167.
50.
316
.70.
0
Som
alia
5.8
5.0
10.8
874.
640
3.5
568.
410
5.6
136.
513
.252
8.0
0.0
0.0
Sout
h A
fric
a12
0.6
-3.9
116.
781
.0-3
.444
.440
.5-3
.312
5.9
38.3
0.0
-1.1
-26.
8
Suda
n48
.916
.365
.233
4.2
69.8
171.
658
.551
.573
.016
2.9
-0.1
-100
.00.
0
Swaz
iland
1.3
1.3
2.6
204.
565
.410
0.0
301.
9-6
.44.
145
5.6
-0.3
-12.
5-0
.3-1
00.0
Togo
7.4
3.3
10.7
373.
612
0.5
227.
762
.658
.313
.521
4.3
0.0
0.0
0.0
Uga
nda
8.6
27.7
36.3
480.
621
1.5
243.
619
.712
8.9
44.2
222.
10.
20.
0
Uni
ted
Rep
ublic
of
Tanz
ania
20.0
7.8
27.8
156.
417
.348
.3-8
.558
.530
.448
.7-0
.1-9
.1-0
.1-1
00.0
Zam
bia
37.8
36.8
74.6
259.
113
8.9
181.
581
.940
.983
.618
0.2
-0.1
-100
.0-0
.8-1
00.0
Zim
babw
e10
.95.
015
.919
2.3
44.9
94.6
72.7
0.8
18.2
85.0
0.0
0.1
5.3
Hig
h in
com
e co
untr
ies
2 13
8.6
-227
.91
910.
734
.9-1
3.2
24.3
2 23
7.6
25.0
-29.
6-2
1.5
-21.
1-1
6.6
Aus
tral
ia37
.0-3
.533
.531
.0-2
0.4
24.6
0.1
20.1
40.6
24.5
-1.2
-100
.0-1
.2-1
00.0
Can
ada
47.8
-6.3
41.5
16.0
-12.
311
.9-6
.518
.951
.013
.7-1
7.6
-46.
8-1
5.4
-100
.0

124
Mapping supply and demand for animal-source foods to 2030
cou
nTr
y
EGG
s, C
HA
nG
E BE
TWEE
n 2
000
An
D 2
030
Cons
umpti
onPr
oduc
tion
Impo
rtEx
port
Abs
olut
e ch
ange
Perc
ent c
hang
e
Prop
orti
on
of c
hang
e du
e to
ch
ange
in
cons
ump.
ra
tes
%
Prop
orti
on
of c
hang
e du
e to
ch
ange
in
popu
lati
on
%
Abs
olut
e ch
ange
Perc
ent
chan
geA
bsol
ute
chan
gePe
rcen
t ch
ange
Abs
olut
e ch
ange
Perc
ent
chan
ge
urb
anRu
ral
Tota
lu
rban
Rura
lTo
tal
Icel
and
0.0
0.2
0.2
3.2
50.1
11.1
-4.1
13.9
0.1
4.5
-0.1
-100
.0-0
.3-1
00.0
Isra
el23
.60.
724
.339
.612
.037
.2-5
.736
.033
.137
.6-0
.3-1
00.0
1.0
25.0
Japa
n38
9.3
-115
.927
3.4
24.0
-13.
811
.116
.1-4
.628
6.3
11.3
0.5
1.3
-0.2
-100
.0
New
Zea
land
3.8
-0.6
3.2
12.0
-12.
48.
7-6
.214
.43.
47.
5-0
.4-1
00.0
-0.8
-100
.0
Nor
way
4.8
-0.4
4.4
13.5
-4.7
9.8
0.0
8.9
4.4
8.9
-0.8
-100
.0-1
.2-5
2.2
Rep
ublic
of K
orea
414.
532
.244
6.7
113.
835
.898
.476
.46.
150
3.4
98.9
0.3
11.1
-0.1
-100
.0
Saud
i Ara
bia
141.
813
.115
4.9
170.
973
.115
3.5
22.4
71.0
207.
915
3.9
-5.8
-100
.0-5
.3-1
00.0
Swit
zerl
and
-1.9
-3.6
-5.5
-3.4
-22.
2-7
.6-0
.9-1
4.2
-7.1
-19.
31.
02.
60.
0
Trin
idad
and
Tob
ago
1.0
0.8
1.8
137.
325
.046
.249
.63.
5-0
.9-2
7.3
2.3
85.2
0.0
Uni
ted
Stat
es o
f Am
eric
a1
076.
8-1
44.5
932.
331
.2-2
1.4
22.6
-4.7
24.7
1 11
5.4
22.3
-7.5
-100
.02.
42.
5