Annex 1: Bosnia and Herzegovina - Country Partnership...
44
39 Annex 1: Bosnia and Herzegovina - Country Partnership Strategy FY12-FY15 RESULTS MATRIX Country Development Goals Issues and Obstacles CPS Outcomes Milestones Bank Program (and Partners) Pillar I - Competitiveness: Support economic growth by tackling some of the bottlenecks to competitiveness and faster productivity growth Competitiveness increase through, inter alia, improvement of business environment. Improve employment opportunities through support for SMEs creation and development, including promotion of entrepreneurship among women. Promote sustainable development through; inter alia; establishment of a functional institutional capacity for agriculture and rural development; stimulating development of the energy sector; and further developing the transport infrastructure. At least three country goals outlined in the Country Development Strategy 2010- 2014 (CDS), (increased competitiveness, employment and sustainable development of agriculture, energy and transport, will be supported by the World Bank Group (WBG) activities under Pillar I. The CPS program will contribute to the achievement of these country development goals through both existing and new operations. BH is ranked at 110 th place in the Doing Business 2011. Country’s weak business environment is one of the main factors affecting its overall competitiveness. The WBG program will contribute to improving the overall business environment, and competitiveness by: (i) improving fiscal sustainability as a foundation for growth and competitiveness. This goal will be supported under the DPO program - see Pillar II below. (ii) improving business environment by strengthening Transparent land markets developed through registration of real estate rights, and complimentary policies that enable transactions to be made with security and efficiency. Baseline (2010): 80,000 backlog of cases and several months (on average) to complete transactions (2010) Target (2011): almost no backlog of cases and transactions completed in one day for 95% of cases. Target (2015) in case of the follow up project: further improved transparency and efficiency by making the integrated registration and cadastre information available on line nationwide. ` Improved investment climate by: a) reducing costs and risks of businesses by improving inspection services, business operations and exit processes; b) improving the information and data exchange system among institutions in BiH in order to comply with respective EU processes, and c) enabling capacity building within institutions. Registration data entered into automated database for 2 million folders. Baseline (2010): 1,453,171 folders completed (RS: 556,171 and FBH 897,000). Target (2011): 1,600,000 folders completed. Completion of systematic registration and cadastre in eight pilot sites. Baseline (2010): In the FBH - two pilot sites completed, and works are ongoing at two additional sites. Target (2011): 8 sites completed. Target (2015) in case of the follow up project: 25% of the country covered. Regulatory simplification of administrative procedures to be completed in selected municipalities, cantons, entities. Baseline (2011): So far only 15 out 143 municipalities, 1 out of 10 cantons underwent regulatory simplification work of administrative procedures. Target (2014): 12-13 municipalities, 2-3 cantons to undergo regulatory Current portfolio: Land Registration Project (P096200) AAAs : Public Expenditure and Institutional Review (underway, FY12 deliverable); REPARIS; Innovation and Science; Benefits of economic integration. Partners : GtZ, EC, Potential new financing Land Registration II : New financing :IFC Advisory Services TA Project on Investment Climate and Competitiveness Partners : SIDA, SECO, Austrian Government
Transcript of Annex 1: Bosnia and Herzegovina - Country Partnership...

39
Annex 1: Bosnia and Herzegovina - Country Partnership Strategy FY12-FY15
RESULTS MATRIX
Country Development Goals Issues and Obstacles CPS Outcomes Milestones Bank Program (and
Partners)
Pillar I - Competitiveness: Support economic growth by tackling some of the bottlenecks to competitiveness and faster productivity growth
Competitiveness increasethrough, inter alia, improvement of business environment.
Improve employment opportunities through support for SMEs creation and development, including promotion of entrepreneurship among women.
Promote sustainable development through; inter alia; establishment of a functional institutional capacity for agriculture and rural development;stimulating development of the energy sector; and further developing the transport infrastructure.
At least three country goals outlined in the Country Development Strategy 2010-2014 (CDS), (increased competitiveness, employment and sustainable development of agriculture, energy and transport, will be supported by the World Bank Group (WBG) activities under Pillar I. The CPS program will contribute to the achievement of these country development goals through both existing and new operations.
BH is ranked at 110th place in the Doing Business 2011. Country’s weak business environment is one of the main factors affecting its overall competitiveness. The WBG program will contribute to improving the overall business environment, and competitiveness by:
(i) improving fiscal sustainability as a foundation for growth and competitiveness. This goal will be supported under the DPO program - see Pillar II below.
(ii) improving business environment by strengthening
Transparent land markets developed through registration of real estate rights, and complimentary policies that enable transactions to be made with security and efficiency.
Baseline (2010): 80,000 backlog of cases and several months (on average) to complete transactions (2010)
Target (2011): almost no backlog of cases and transactions completed in one day for 95% of cases. Target (2015) in case of the follow up project: further improved transparency and efficiency by making the integrated registration and cadastre information available on line nationwide.
`
Improved investment climate by: a) reducing costs and risks of businesses by improving inspection services, business operations and exit processes; b) improving the information and data exchange system among institutions in BiH in order to comply with respective EU processes, and c) enabling capacity building within institutions.
Registration data entered into automated database for 2 million folders.
Baseline (2010): 1,453,171 folderscompleted (RS: 556,171 and FBH 897,000).
Target (2011): 1,600,000 folders completed.
Completion of systematic registration and cadastre in eight pilot sites.
Baseline (2010): In the FBH - two pilot sites completed, and works are ongoing at two additional sites.
Target (2011): 8 sites completed. Target (2015) in case of the follow up project: 25% of the country covered.
Regulatory simplification of administrative procedures to be completed in selected municipalities, cantons, entities.
Baseline (2011): So far only 15 out 143 municipalities, 1 out of 10 cantons underwent regulatory simplification work of administrative procedures.
Target (2014): 12-13 municipalities, 2-3 cantons to undergo regulatory
Current portfolio: Land Registration Project (P096200)
AAAs: Public Expenditure and Institutional Review (underway, FY12 deliverable); REPARIS; Innovation and Science; Benefits of economic integration.
Partners: GtZ, EC,
Potential new financingLand Registration II
:
New financing:IFC Advisory Services TA Project on Investment Climate and Competitiveness
Partners: SIDA, SECO, Austrian Government

40
and upgrading the system of property registration (Land Registration Project I and II), and through advisory services, aimed at strengthening the regulatory framework and eliminating administrative bottlenecks for business registration and operations (IFC advisory services -competitiveness project).
(iii) improving access to finance for SMEs and micro-entrepreneurs through IBRD financed line of credit for SMEs and IFC’s support to the corporate, and the financial sector, including partnership with MCO MI-Bospo which provides credit services to female entrepreneurs.
(iv) REPARIS (Road to Europe Program of Accounting Reform and Institutional Strengthening) will assist Western Balkan countries in aligning their accounting and auditing framework for the private sector with the EU acquis communautaire.
Baseline (2011): 12 procedures, 55 days to register a business in BH.
Target (2014): Reduction in time and procedures to commence operations in BH for 10%, and improvement of investment climate through reformed inspection services and information exchange
Enhance access to finance for SMEs in the context of the global financial crisis.
Baseline (2010): lending under the Enhancing SME Access to Financing project by participating PFIs to SMEs - 0 US$
Target (2014): US$ 70 million.
Improved confidence in the financial statements of business entities, including SMEs, will enhance access to finance and alleviate the administrative burden on SMEs by using accounting standards adapted to their size
Baseline (2010): Partial implementation of the EU acquis communautaire as it relates to corporate financial reporting. Uneven application of international standards for financial reporting.
Target (2015): Better implementation and application of the EU acquis and international standards
simplification of administrative procedures; both entities to continue regulatory simplification.
Medium and long-term loans disbursed under the project by participating PFIs to SMEs.
Baseline (2011): US$ 8.2 million
Target (2014): US$ 70 million
Improved accounting and auditing framework implementing EU requirements.
Baseline (2011) As related in the Accounting and Auditing ROSC, the corporate financial reporting framework is partially aligned with the EU acquis; IFRS for SMEs adopted as the accounting requirement for SMEs remains to be implemented and further aligned with EU requirements.
Target (2015): Legislative and regulatory proposals for the Corporate Financial Reporting to be aligned with the EU acquis. Better application of financial reporting standards and quality assurance mechanisms over audit of public interest entities.
Current portfolio: Enhancing SME Access to Finance(P111780); IFC investments in MFIs..IFC’s Microfinance Advisory Project
AAA: Western Balkan Financial Sector Assessment; Consumer Protection TA.
Partners: EBRD
AAA: REPARIS; National Program on Corporate Financial Reporting
Partners: EC, ADA, SECO, Government of Luxembourg
41
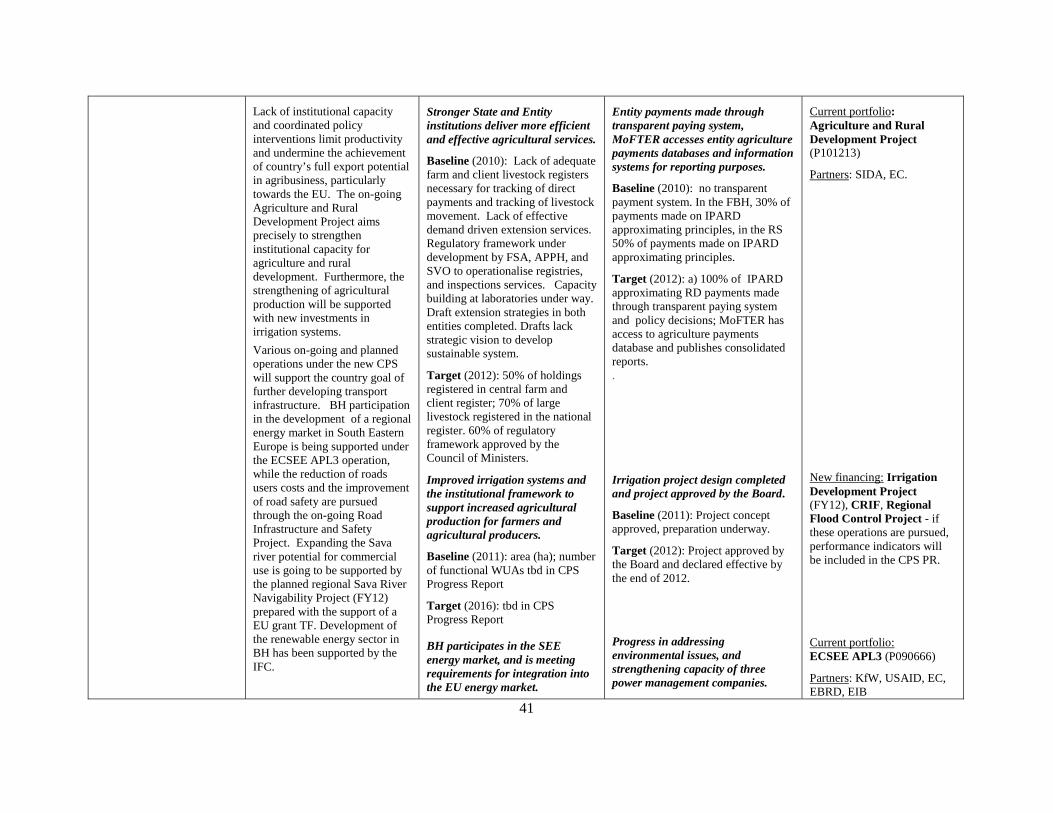
Lack of institutional capacity and coordinated policy interventions limit productivity and undermine the achievement of country’s full export potential in agribusiness, particularly towards the EU. The on-going Agriculture and Rural Development Project aims precisely to strengthen institutional capacity for agriculture and rural development. Furthermore, the strengthening of agricultural production will be supported with new investments in irrigation systems.Various on-going and planned operations under the new CPS will support the country goal of further developing transport infrastructure. BH participation in the development of a regional energy market in South Eastern Europe is being supported under the ECSEE APL3 operation, while the reduction of roads users costs and the improvement of road safety are pursued through the on-going Road Infrastructure and Safety Project. Expanding the Sava river potential for commercial use is going to be supported by the planned regional Sava River Navigability Project (FY12) prepared with the support of a EU grant TF. Development of the renewable energy sector in BH has been supported by the IFC.
Stronger State and Entity institutions deliver more efficient and effective agricultural services.
Baseline (2010): Lack of adequate farm and client livestock registers necessary for tracking of direct payments and tracking of livestock movement. Lack of effective demand driven extension services. Regulatory framework under development by FSA, APPH, and SVO to operationalise registries, and inspections services. Capacity building at laboratories under way. Draft extension strategies in both entities completed. Drafts lack strategic vision to develop sustainable system.
Target (2012): 50% of holdings registered in central farm and client register; 70% of large livestock registered in the national register. 60% of regulatory framework approved by the Council of Ministers.
Improved irrigation systems and the institutional framework to support increased agricultural production for farmers and agricultural producers.
Baseline (2011): area (ha); number of functional WUAs tbd in CPS Progress Report
Target (2016): tbd in CPS Progress Report
BH participates in the SEE energy market, and is meeting requirements for integration into the EU energy market.
Entity payments made through transparent paying system, MoFTER accesses entity agriculture payments databases and information systems for reporting purposes.
Baseline (2010): no transparent payment system. In the FBH, 30% of payments made on IPARD approximating principles, in the RS 50% of payments made on IPARD approximating principles.
Target (2012): a) 100% of IPARD approximating RD payments made through transparent paying system and policy decisions; MoFTER has access to agriculture payments database and publishes consolidated reports. .
Irrigation project design completed and project approved by the Board.
Baseline (2011): Project concept approved, preparation underway.
Target (2012): Project approved by the Board and declared effective by the end of 2012.
Progress in addressing environmental issues, and strengthening capacity of three power management companies.
Current portfolio:Agriculture and Rural Development Project(P101213)
Partners: SIDA, EC.
New financing: Irrigation Development Project(FY12), CRIF, Regional Flood Control Project - if these operations are pursued, performance indicators will be included in the CPS PR.
ECSEE APL3 (P090666) Current portfolio:
Partners: KfW, USAID, EC, EBRD, EIB
42
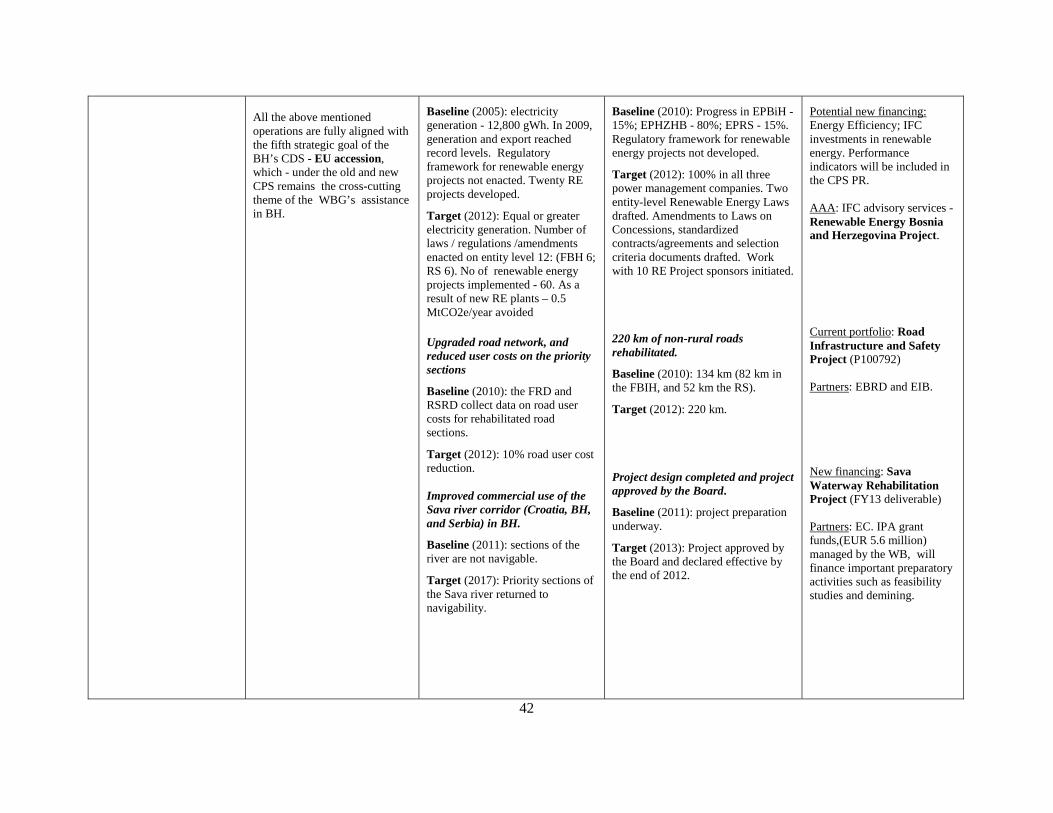
All the above mentioned operations are fully aligned with the fifth strategic goal of the BH’s CDS - EU accession,which - under the old and new CPS remains the cross-cutting theme of the WBG’s assistance in BH.
Baseline (2005): electricity generation - 12,800 gWh. In 2009, generation and export reached record levels. Regulatory framework for renewable energy projects not enacted. Twenty RE projects developed.
Target (2012): Equal or greater electricity generation. Number of laws / regulations /amendments enacted on entity level 12: (FBH 6; RS 6). No of renewable energy projects implemented - 60. As a result of new RE plants – 0.5 MtCO2e/year avoided
Upgraded road network, and reduced user costs on the priority sections
Baseline (2010): the FRD and RSRD collect data on road user costs for rehabilitated road sections.
Target (2012): 10% road user cost reduction.
Improved commercial use of the Sava river corridor (Croatia, BH, and Serbia) in BH.
Baseline (2011): sections of the river are not navigable.
Target (2017): Priority sections of the Sava river returned to navigability.
Baseline (2010): Progress in EPBiH -15%; EPHZHB - 80%; EPRS - 15%. Regulatory framework for renewable energy projects not developed.
Target (2012): 100% in all three power management companies. Two entity-level Renewable Energy Laws drafted. Amendments to Laws on Concessions, standardized contracts/agreements and selection criteria documents drafted. Work with 10 RE Project sponsors initiated.
220 km of non-rural roads rehabilitated.
Baseline (2010): 134 km (82 km in the FBIH, and 52 km the RS).
Target (2012): 220 km.
Project design completed and project approved by the Board.
Baseline (2011): project preparation underway.
Target (2013): Project approved by the Board and declared effective by the end of 2012.
Energy Efficiency; IFC investments in renewable energy. Performance indicators will be included in the CPS PR.
Potential new financing:
AAA: IFC advisory services -Renewable Energy Bosnia and Herzegovina Project.
Current portfolio: Road Infrastructure and Safety Project (P100792)
Partners: EBRD and EIB.
New financing: Sava Waterway Rehabilitation Project (FY13 deliverable)
Partners: EC. IPA grant funds,(EUR 5.6 million) managed by the WB, will finance important preparatory activities such as feasibility studies and demining.

43
Pillar II - Inclusion: Improve the delivery of public services for the vulnerable and the targeting and fiscal sustainability of social benefits to the poor
Improve social inclusion,access to basic services, increase participation of inactive, discouraged population and their re-integration in social life, labour market, and equalisation of opportunities for work.
Six specific strategic sub-goals include:
Social policy aimed at employment;Improve position of families with children; Improve education; Improve health protection; Improve pension policy; andImprove position of persons with disabilities.
Social inclusion is the sixth strategic goal outlined in the CDS, and the main theme of a separate Social Inclusion Strategy. This goal will be primarily supported under the three year programmatic DPOseries. DPO I, which was approved and disbursed in 2010, helped develop a legal framework necessary to improve targeting of non-insurance based cash transfers (both veteran and civilian categories). DPO II(FY12) will continue to support development of effective, efficient and equitable social protection policies. In addition to this, the DPO II will likely support pension reforms. A third phase of the DPO program will continue to focus on improving the safety nets, facilitating pension and public wage reforms. By improving targeting of cash transfers – thus generating some fiscal space -the DPO program will also contribute to the first strategic goal of the CDS -macroeconomic stability.Simultaneously, the on-going Social Safety Net and Employment Support Project will provide technical assistance to strengthen institutional capacity for implementation of effective social protection policies. With recently approved
Increased share of social benefits reach the poorest. Fiscal savings resulting from reforms of cash transfers equal 1.8% of GDP . More effective job brokerage services extended to the vulnerable active job-seekers.
Baseline (2011):t will be established with the 2011 Extended Household Based Survey. Job-brokerage services extended to 1,468 vulnerable active job-seekers. Legal framework in place for implementation of means/income testing for non-insurance cash transfers. Bylaws regulating means/income thresholds need to be adopted.
Target (2014): Improved targeting accuracy by 25%. Job-brokerage services extended to 10,000 vulnerable active job-seekers, 35% are employed one year after receiving the services. Mean/income testing underway for selected vulnerable categories. Fiscal savings equal 1.8% of GDP. Reduced incidence of non-communicable diseases through increased access to quality family medicine primary health care.
Baseline (2010): about 58% of population covered through family medicine (FBH: 1,000,000; RS 1,200,147).
Target (2014): about 70% of population covered (FBH: 1,500,000; RS: 1,250,000)
Implementation of the legislated measures adopted as a part of the reform of the overall system of non-insurance cash transfers -underway.
Baseline (2011): no means/income thresholds established. Legislated provisions for targeting of transfers not implemented for veteran categories.
Target (2012): New eligibility processes and formulae identified . Pension reform underway. Job-brokerage services extended to 3,000 vulnerable active job-seekers.
Increased number of teams operating family medicine, and increased number of health buildings constructed, reconstructed or renovated.
Baseline (2010): 1,301 FM teams (FBH: 652; RS:649), 155 buildings rehabilitated (FBH:79; RS:56).
Target (2014): 1,450 FM teams (FBH:900; RS:650). 239 buildings rehabilitated (FBH:129; RS:110).
Current portfolio: Social Safety Net and Employment Support Project (P116774).
New financing: DPO II(FY12 deliverable).
AAA: Western Balkan Poverty Assessment; Poverty TA and Pension TA.
Current portfolio: Health Sector Enhancement Project-Additional Financing (P088663)
Partners: Council of Europe Development Bank.
Current portfolio: Solid
44
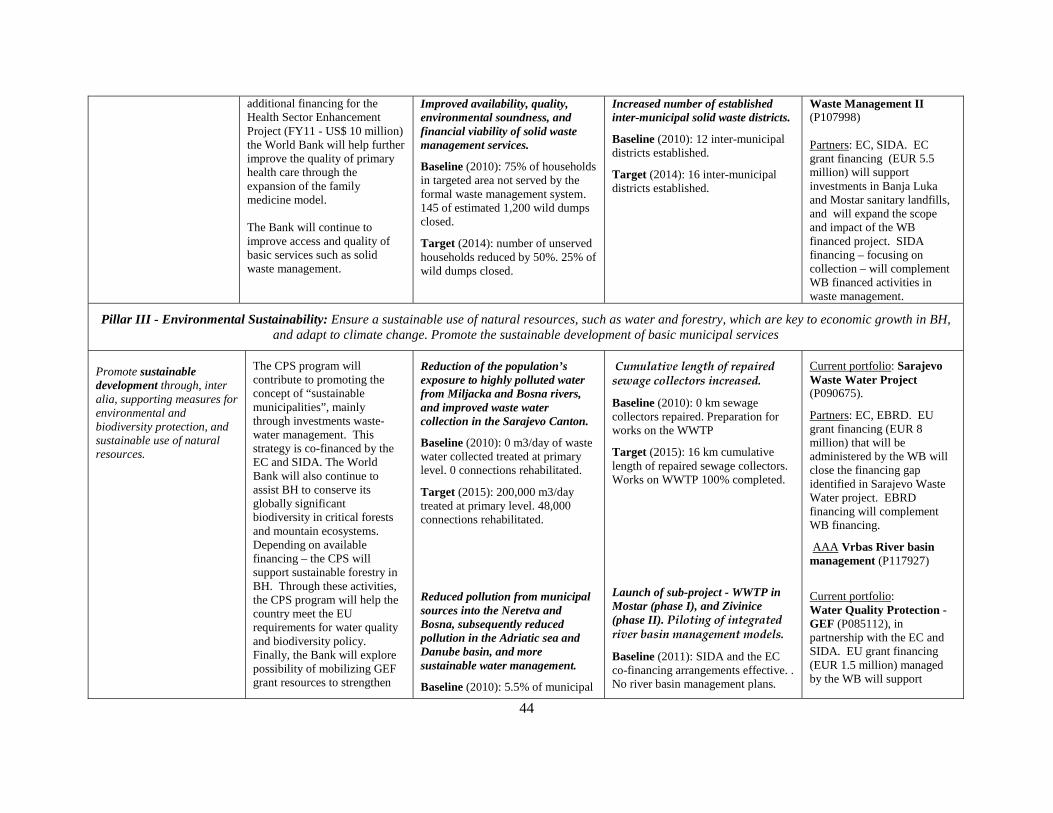
additional financing for the Health Sector Enhancement Project (FY11 - US$ 10 million) the World Bank will help further improve the quality of primary health care through the expansion of the family medicine model.
The Bank will continue to improve access and quality of basic services such as solid waste management.
Improved availability, quality, environmental soundness, and financial viability of solid waste management services.
Baseline (2010): 75% of households in targeted area not served by the formal waste management system. 145 of estimated 1,200 wild dumps closed.
Target (2014): number of unserved households reduced by 50%. 25% of wild dumps closed.
Increased number of established inter-municipal solid waste districts.
Baseline (2010): 12 inter-municipal districts established.
Target (2014): 16 inter-municipal districts established.
Waste Management II(P107998)
Partners: EC, SIDA. EC grant financing (EUR 5.5 million) will support investments in Banja Luka and Mostar sanitary landfills, and will expand the scope and impact of the WB financed project. SIDA financing – focusing on collection – will complement WB financed activities in waste management.
Pillar III - Environmental Sustainability: Ensure a sustainable use of natural resources, such as water and forestry, which are key to economic growth in BH, and adapt to climate change. Promote the sustainable development of basic municipal services
Promote sustainable development through, inter alia, supporting measures for environmental and biodiversity protection, and sustainable use of natural resources.
The CPS program will contribute to promoting the concept of “sustainable municipalities”, mainly through investments waste-water management. This strategy is co-financed by the EC and SIDA. The World Bank will also continue to assist BH to conserve its globally significant biodiversity in critical forests and mountain ecosystems. Depending on available financing – the CPS will support sustainable forestry in BH. Through these activities, the CPS program will help the country meet the EU requirements for water quality and biodiversity policy. Finally, the Bank will explore possibility of mobilizing GEF grant resources to strengthen
Reduction of the population’s exposure to highly polluted water from Miljacka and Bosna rivers, and improved waste water collection in the Sarajevo Canton.
Baseline (2010): 0 m3/day of waste water collected treated at primary level. 0 connections rehabilitated.
Target (2015): 200,000 m3/day treated at primary level. 48,000 connections rehabilitated.
Reduced pollution from municipal sources into the Neretva and Bosna, subsequently reduced pollution in the Adriatic sea and Danube basin, and more sustainable water management.
Baseline (2010): 5.5% of municipal
Cumulative length of repaired sewage collectors increased.
Baseline (2010): 0 km sewage collectors repaired. Preparation for works on the WWTP
Target (2015): 16 km cumulative length of repaired sewage collectors. Works on WWTP 100% completed.
Launch of sub-project - WWTP in Mostar (phase I), and Zivinice (phase II). Piloting of integrated river basin management models.
Baseline (2011): SIDA and the EC co-financing arrangements effective. .No river basin management plans.
Current portfolio: Sarajevo Waste Water Project(P090675).
Partners: EC, EBRD. EUgrant financing (EUR 8 million) that will be administered by the WB will close the financing gap identified in Sarajevo Waste Water project. EBRD financing will complement WB financing.
AAA Vrbas River basin management (P117927)
Current portfolioWater Quality Protection -GEF (P085112), in partnership with the EC and SIDA. EU grant financing (EUR 1.5 million) managed by the WB will support
:
45
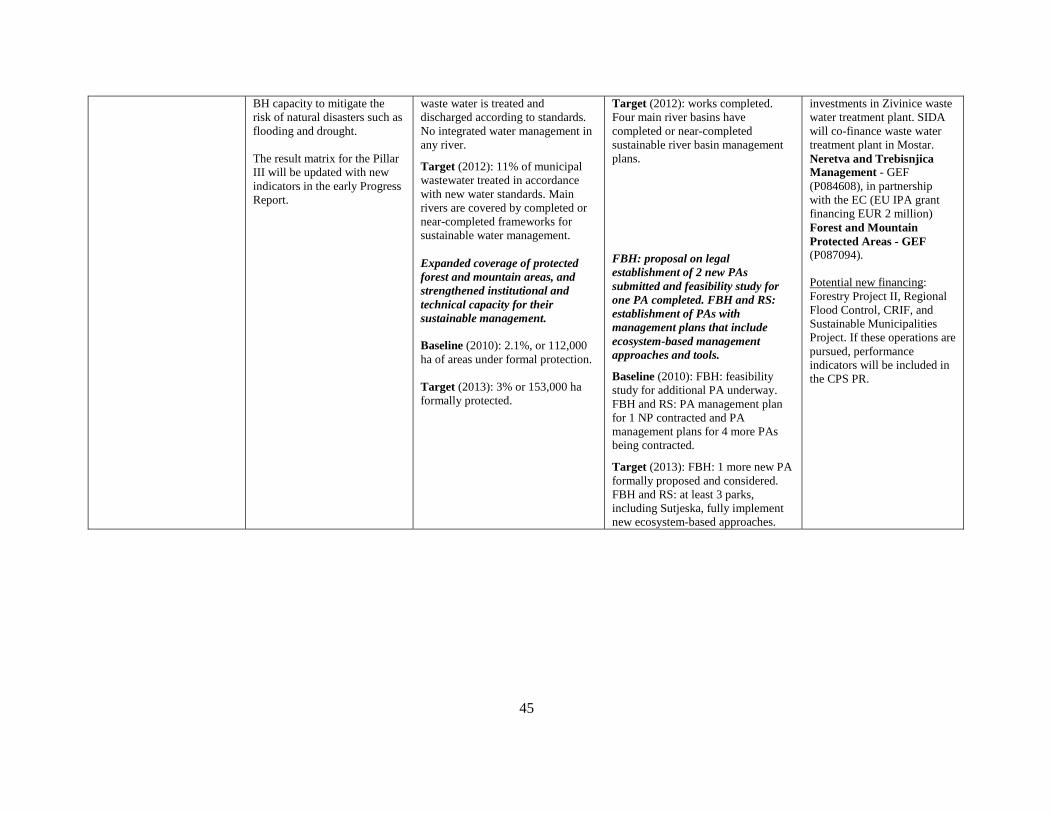
BH capacity to mitigate the risk of natural disasters such as flooding and drought.
The result matrix for the Pillar III will be updated with new indicators in the early Progress Report.
waste water is treated and discharged according to standards. No integrated water management in any river.
Target (2012): 11% of municipal wastewater treated in accordance with new water standards. Main rivers are covered by completed or near-completed frameworks for sustainable water management.
Expanded coverage of protected forest and mountain areas, and strengthened institutional and technical capacity for their sustainable management.
Baseline (2010): 2.1%, or 112,000 ha of areas under formal protection.
Target (2013): 3% or 153,000 ha formally protected.
Target (2012): works completed. Four main river basins have completed or near-completed sustainable river basin management plans.
FBH: proposal on legal establishment of 2 new PAs submitted and feasibility study for one PA completed. FBH and RS: establishment of PAs with management plans that include ecosystem-based management approaches and tools.
Baseline (2010): FBH: feasibility study for additional PA underway. FBH and RS: PA management plan for 1 NP contracted and PA management plans for 4 more PAs being contracted.
Target (2013): FBH: 1 more new PA formally proposed and considered. FBH and RS: at least 3 parks, including Sutjeska, fully implement new ecosystem-based approaches.
investments in Zivinice waste water treatment plant. SIDA will co-finance waste water treatment plant in Mostar. Neretva and Trebisnjica Management - GEF (P084608), in partnership with the EC (EU IPA grant financing EUR 2 million)Forest and Mountain Protected Areas - GEF(P087094).
Potential new financing:Forestry Project II, Regional Flood Control, CRIF, and Sustainable Municipalities Project. If these operations are pursued, performance indicators will be included in the CPS PR.

46
Annex 2:FY
08 –FY
11 CPS C
OM
PLE
TIO
N R
EPO
RT
This report is a self-evaluation by the World B
ank of the experience in implem
enting the FY08 –
FY11
Country Partnership Strategy (C
PS) in Bosnia and H
erzegovina (BH
). The main purpose of this report is
threefold:
i)assess progress tow
ards achieving country goals and in that light examine the developm
ent outcom
es and overall performance of the C
PS program;
ii)assess the perform
ance of the World Bank in delivering the C
PS program; and
iii)derive lessons from
the implem
entation of the CPS program
that will be taken into consideration
for the design and implem
entation of the new C
PS for the period FY12 -FY
15.
I.SU
MM
AR
Y O
F FIND
ING
S
1.O
verall, the CPS program
achieved expected outcomes in both core and non-core areas.
The CPS program
and consequently its expected outcomes w
ere divided into “core”and “non-core”
program areas. C
ore program areas w
ere related to sectors in which there w
as strong demand for
investments along w
ith clear comm
itment for reform
s by the authorities, while the non-core program
referred to reform
areas where political com
mitm
ent needed to be verified prior to engagement. U
nder the core program
, all major outcom
es were either fully or partially achieved. In particular, all core program
indicators w
ere fully achieved in Pillar II of the CPS w
hich aimed at im
proving the quality of public spending and the delivery of public services for the vulnerable. Progress w
as also made in non-core
program areas w
here three out of four non-core program goals w
ere partially achieved. An indicator
related to Sava river navigability was dropped as the project, w
hich would lead to that particular outcom
e, w
as postponed to the next CPS. A
n increase in formal em
ployment w
as the only outcome w
hich was not
achieved. In spite of the progress made during the first tw
o years of the CPS program
implem
entation, perform
ance in this area was severely affected by the econom
ic crisis,
2.W
orld Bank perform
ance in delivering the CPS program
has been satisfactory. Based on the
lessons learned from the im
plementation of the previous C
ountry Assistance Strategy FY
05 -FY07, the
World B
ank followed the principles of result orientation, flexibility, and partnership in delivering the
program. In particular, the W
orld Bank demonstrated flexibility in adjusting its lending program
in response to the im
pact of the global economic crisis. G
iven the rapidly changing economic environm
ent, the B
H authorities and the W
orld Bank pursued an urgent reprogram
ming of the C
PS program to help
mitigate the im
pact of the crisis with focus on m
aintaining macroeconom
ic stability, protecting the vulnerable through im
proved targeting of social benefits, and mitigating the effects on the real econom
y, and sm
all and medium
enterprises in particular. Consistent w
ith these priorities, in FY10 the W
orld Bank
approved four projects for a total amount of U
S$231 million, a record am
ount since the period of post-conflict reconstruction.
3.K
ey lessons and recomm
endations for the new C
PScan be sum
marized as follow
s:
The World B
ank can support structural reforms in B
H’s politically com
plex environment, but
a long-term com
mitm
ent is needed.
Policy dialogue in key areas should be maintained even in the absence of lending, as it
provides valuable input and forms a basis for future policy m
aking.
Build consensus around institutional arrangem
ents tobe pursued under the project during the
project preparation.

FY08-FY11 CPS Completion Report
47
Maintain flexibility in allocation of resources.
Results are possible even in the politically tensed environm
ent when interventions are aligned
with investm
ent priorities of the government.
Reinforce operational cooperation w
ith development partners, IFIs, and the EC
in particular.
II.PR
OG
RE
SS TO
WA
RD
S AC
HIE
VIN
G C
OU
NT
RY
GO
AL
S
4.In the absence of the form
al Country D
evelopment Strategy, the declaration entitled
“Platform for A
ction” from O
ctober 2007, which outlined key reform
areas that governments at all
levels in BH
will pursue, served as the basis for the C
PS design.A
new C
ountry Developm
ent Strategy for the period 2008 -
2013, was still under preparation at the tim
e when the C
PS was agreed.
The Platform for A
ction outlined the comm
itment by the authorities to take collective and coordinated
action in the following three areas: i) im
prove fiscal coordination and stability; ii) create a more
conducive business
environment;
and iii)
promote
other reform
s that
ensure sustainable
development.
Improving Fiscal C
oordination and Stability
5.Satisfactory progress w
as made in term
s of improving fiscal coordination and stability. The
state level Law on Fiscal C
ouncil was adopted in 2008 and the B
H Fiscal C
ouncil was subsequently
established. The Fiscal Council w
as the key forum for discussion related to the IM
F Stand-by A
rrangement in the am
ount of about EUR
1.1 billion (600 percent of the quota) which w
as approved in July 2009. The Fiscal C
ouncil agreed to an overall fiscal envelope for 2009 and 2010, which w
as an explicit condition under the IM
F’s Stand-by Agreem
ent. The World B
ank was not directly involved in
activities related to establishment and perform
ance of the Fiscal Council.
6.E
ntity governments launched structural reform
of the social protection schemes.R
eviewing
and streamlining the social spending schem
e with a view
to improving its effectiveness w
as an explicit objective in this area of the Platform
for Action. R
ecognizing that thesystem
of social protection in BH
w
as poorly targeted, inequitable, and fiscally unsustainable, entity authorities partnered with the W
orld B
ank in designing a reform program
that would im
prove targeting of social benefits and ensure provision of services
to the most vulnerable on a sustainable basis. A
policy matrix developed for the First Public
Expenditure Developm
ent Policy Operation
(DPO
I) contained a set of policy measures that initiated the
process of structural reforms in the area of social protection. Legislative changes that w
ere adopted in late 2009 in the R
S and early 2010 in the FBH
as a part of the DPO
I supported policy reforms, w
ere possibly the m
ost significant structural reforms pursued in B
H over the last five years.
7.T
he economic crisis halted any prom
ise of BH
reducing public expenditure as a share of G
DP. D
ue to the impact of the global econom
ic crisis, GD
P in BH
was reduced for the first tim
e since the w
ar. At the sam
e time, governm
ents in BH
tried to maintain the sam
e level of expenditures during the crisis. C
onsequently, the public expenditure increased from 49.5 percent of G
DP in 2008 to 50.4 percent
of GD
P in 2010. Simultaneously, there w
as a drop in public revenues from 46 percent of G
DP in 2008 to
45 percent of GD
P in 2010. Resulting fiscal deficit w
as partially closed by the IMF stand-by arrangem
ent and the W
orld Bank’s D
PO I.

FY08-FY11 CPS Completion Report
48
Creating a B
etter Business E
nvironment
8.M
odest progress was m
ade in improving the business clim
ate in spite of significant progress in property
registration.W
hile progress was m
ade in simplifying business registration, starting a
business is still slow and com
plex. The World B
ank’s Doing B
usiness 2011 report ranks BH
at 110th
place. BH
is the second lowest ranked econom
y in South East Europe, and only Kosovo is ranked low
er at 118
thplace. How
ever, progress was observed in term
s of property registration. The time it takes to
register property has been reduced from 84 days in 2009 to 33 days in 2010. D
oing Business 2011
recognized this progress and BH
moved from
139th
to 103rd
place in terms of registering property
indicator. While the Bank correctly recognized that there w
as little comm
itment to pursue reform
s in the area of business environm
ent (“non-core” program), there w
ere positive outcomes in this area w
here there w
as substantial Bank engagement, particularly through the Land R
egistration Project. Prom
oting sustainable development
9.A
ccelerated implem
entation of investment projects lead to satisfactory outcom
es in the transport and energy sector,w
hile the development of com
petitive agriculture was only partially
achieved. Sustained and coordinated efforts by IFIs (EBR
D, EIB
and the World B
ank) resulted in substantially im
proved road maintenance, and an increasing level of investm
ents innew
road sections. O
verall, IFIs (EBR
D, EIB
, and the World B
ank) approved about EUR
848 million for investm
ents in the transport sector over the last 5 years, and EU
R 336 m
illion was disbursed m
ainly for road rehabilitation during the period 2009-2010. In
the energy sector, export of power reached record levels in 2009, and the
three power m
anagement com
panies maintained strong perform
ance both in terms of profitability and in
terms of quality of services over the last four years.H
owever, in the agriculture sector absence of political
agreement about the role of different levels of governm
ent has prevented coordinated action to improve
competitiveness of the sector.
III.D
EV
EL
OPM
EN
T O
UT
CO
ME
S AN
D PE
RFO
RM
AN
CE
OF TH
E C
PS PRO
GR
AM
10.T
he CPS program
was w
ell alignedw
ith the priorities outlined in the Platform for A
ction.Pillar I of the C
PS aimed at im
proving the environment for private sector led grow
th and convergence to the EU
. Activities under Pillar I responded to tw
o sets of priorities outlined in the Platformfor A
ction: i) create a better business environm
ent; and ii) promote reform
s that ensure sustainable economic
development. Pillar II w
hich focused on the quality of public spending and the delivery of public services for the vulnerable, responded to the Platform
for Action goal of im
proving stability and fiscal coordination by, inter alia, review
ing and streamlining social spending schem
es with a view
to improve
their effectiveness.
11.O
verall, the CPS program
achieved projected development outcom
es in “core” program
areas, while projects outcom
es in “non-core” areas were partially achieved. A
s mentioned earlier, the
CPS program
and its outcomes w
ere divided into “core” and ”non-core” program areas, w
hereby core areas w
ere related to sectors with strong dem
and for investments along w
ith clear comm
itment by the
authorities, while non-core areas w
ere characterized by less clear political comm
itment to reform
s. In particular, projected outcom
es in the core program areas such as land registration, electricity generation,
water supply and sanitation, prim
ary health care, and small scale agriculture, w
ere fully achieved. CPS
outcomes w
ere partially achieved in other core program areas such as business registration, agricultural
policy, energy market integration, and protected areas. O
utcomes w
ere also partially achieved in all non-core areas except in the case of non-core indicator related to an increase in form
al employm
ent. This goal w
as not achieved due to the economic crisis. A
summ
ary of the CPS outcom
es is schematically show
n in

FY08-FY11 CPS Completion Report
49
Figure 1 below. Please see R
esult Matrix in Table 1 for a detailed description of progress against
individual performance indicators.
Internal and external factors affecting CPS program
performance
12.B
H’s com
plex and fragmented governance structure and political polarization betw
een the key political parties underm
ined the advancement of a single econom
ic space. As recognized in the
CPS docum
ent, heightened political tensions in the BH’s com
plex governance structure represented the m
ain risks for the policies aimed at strengthening the single econom
ic space, and coordinated im
plementation of econom
ic reforms. Project activities that required a degree of political consensus about
the role of different levels of government w
ere negatively affected (for example A
griculture and Rural
Developm
ent Project -AR
DP-see para 17 below
).
13.In spite of the unfavorable political environm
ent, the necessity to respond tothe im
pact of the global econom
ic crisis provided strong incentive to initiate reforms. B
H authorities and the
World B
ank recognized that an effective response to the crisis would require m
acroeconomic stability,
adequate protection of the most vulnerable, and acceleration of investm
ents. In this context, satisfactory results w
ere achieved even in the politically complex environm
ent. Macroeconom
ic stability was
maintained, reform
s were initiated to im
prove targeting of social benefits to the vulnerable, andim
plementation of investm
ent projects was significantly accelerated.
Figure 1: CPS Program
Performance
CPS Pillar
CPS outcom
e areas
CPS im
plementation progress
Not achievedPartially achieved
Achieved
Pillar I:Im
prove the environm
ent for private sector led grow
th and convergence to Europe
Business registration
Land registrationEU
compatible agriculture
Road netw
orkEnergy m
arket integrationElectricity generationEcosystem
protectionA
vian influenzaSava river navigability
Not applicable. Project postponed to the next C
PS.
Privat.& corp.restr.*
Pillar II: Improve
the quality of public spending and the delivery of public services for the vulnerable
Water and sanitation
Solid waste m
anagement
Participatory budgetingPrim
ary health careC
omm
ercial agricultureSocial benef. targeting*Fiscal coordination*Form
al employm
ent** Non-core outcom
es

FY08-FY11 CPS Completion Report
50
Pillar I: Improving the environm
ent for private sector led growth
14.Substantial results w
ere achieved in reducing business registration in courts.The tim
e needed for courts to process business registration fell from
17 days in 2007 to 6 days in 2010 in the RS,
and from 23.7 to 10.4 days in the FB
H. The B
usiness Enabling Environment Structural A
djustment
Credit, w
hich closed in Decem
ber 2007, contributed to achievement of these results. H
owever, progress
in court registration was not follow
ed by streamlining in other areas of business registration. Thus, in
spite of recent progress particularly in the RS, business registration in B
H rem
ains complex. A
s indicated in D
oing Business 2011, business registration takes on average 55 days and involves 12 procedures. The
World B
ank delivered a Doing B
usiness Reform
Mem
orandum in 2008 outlining actions to im
prove the overall business environm
ent. After successful stream
lining of business regulations including business registration in the R
S, the IFC currently supports a “guillotine” initiative in the FBH
in an effort to reduce excessive business rules and procedures.
15.R
egistration of property has been streamlined, and the backlog of cases has been reduced.
The time required to register property has been reduced from
84 days in 2009 to 33 in 2010. A substantial
backlog of property registration cases (80,000 in 2006) was significantly reduced to 18,305 in N
ovember
2010. As m
entioned above, the Doing B
usiness 2011 report recognized this progress and BH
has moved
from 139
thto 103rdplace in term
s of the registering property indicator. The World B
ank has supported reform
s in this area through the Land Registration Project. D
esign of this operation has proven to be sound; and it envisaged the need for a follow
-up operation, which w
ill be considered in the new C
PS. D
esign of a follow-up project should inter alia include a com
munications cam
paign to raise public aw
areness of wom
en’s legal rights, and develop an IT system to collect and m
onitor data by gender. N
amely, recent analysis show
ed that while w
omen’s legal rights are form
ally protected, tradition frequently favors m
ale inheritance of property so that wom
en waive their inheritance of land in favor of
male fam
ily mem
bers
16.T
he Investment C
limate A
ssessment (IC
A) found that the private enterprise sector in B
H
has been on an upswing but its full potential rem
ains constrained. The ICA
report, which w
as delivered in June 2008, identified the m
ain obstacles for private sector development, and recom
mended
actions that should be considered in the enterprise sector, business environment, and corporate
restructuring if private sector-led growth is to becom
e a significant influence in the expansion of theB
H
economy.
17.L
ack of political consensus affected EU
related reforms in the agriculture sector. A
ctivities related to building the institutional capacity and agricultural inform
ation systems are progressing w
ell, w
hile the activities related to establishing the EU com
patible payment system
remain behind schedule due
to the lack of agreement as to the role and authority distribution betw
een the various levels of governm
ent. Acknow
ledging that such an agreement is unlikely to be reached over the short-term
, the W
orld Bank is currently restructuring the A
RD
P to reallocate resources to well perform
ing components,
and in response to the flooding crisis in late 2010 in BH w
hich had severely negative effects on farmers in
affected areas.
18.Investm
ents in the transport and energy sector led to satisfactory outcomes. The R
oad Infrastructure and Safety Project m
ade strong progress against the target of rehabilitating 240km of roads.
The intermediate outcom
e indicator of 120 km of road rehabilitation in each entity has already been m
et in the R
S, while 89%
completed in the FB
H. It is expected that outcom
es related to road safety and reduction in road user costs w
ill be achieved by the end of the project. In the energy sector, continued

FY08-FY11 CPS Completion Report
51
support of the World B
ank (currently ECSEE A
PL3 is under implem
entation), and other development
partners has contributed to achieving record levels of power generation in 2009. The alignm
ent of investm
ents with the priorities of the Entity governm
ents and the implem
enting agencies led to successful outcom
es. Export of power by B
H helped alleviate shortages in the region, deepen integration of regional
electricity market, and w
as comm
ercially attractive for BH
power utilities. C
onvergence of national and regional interests helped strengthen regional pow
er trade and is the building block of regional market
development in the early stages. These results w
ere partially offset by the failure to promote integration of
the power sector into the regional m
arket due to disputes on the functioning of the national transmission
company (TR
AN
SCO
).
19.IFC
financing was w
ell distributed to support SMEs, m
icrofinance, banks, and medium
size local com
panies.IFC
's strategy was to actively support the restructuring and m
odernization of local com
panies in BH
, to improve their com
petitiveness, encourage broader intra-regional collaboration and provide financing to local and regional investors w
ith focus on export-oriented companies. For exam
ple, IFC
financing for CIM
OS com
pany helped to revive the automotive industry in B
H, and has contributed
to about 1,000 jobs. In addition, the project helped the company to develop m
anagement and technical
skills, transfer knowledge, im
prove productivity, and promote efficient use of raw
materials and labor,
which in turn helped to strengthen the com
petitiveness of the domestic autom
otive industry in the country. IFC
supported micro-entrepreneurs and SM
Es through credit lines to two local banks as w
ell as through its financing to tw
o microfinance institutions. Financing to M
FIs “EKI” contributed to
disbursement of 84,000 new
loans during 2009-2011, increased loan portfolio financing for wom
en to U
S$80.0 million by the end of 2011 from
US$47.0 m
illion as of Decem
ber 31, 2007, and is expected to reach an estim
ated 5,000 new m
icro-entrepreneursduring the life of the loan. IFC
loan to MFI “M
I-B
ospo” will help reach an estim
ated 3,000 new m
icro-entrepreneurs.
20.Partially
satisfactory outcom
es w
ere achieved
in protecting
the critical
forests and
mountain areas, w
hile the objectiveof strengthening capacity to respond to avian influenza and
other similar outbreaks w
as fully accomplished. A
lthough the total area under formal protection
increased from 0.55%
in 2007 to 2.1% in 2010, delays in form
ation of Una national park affected overall
progress against the target of 3% of protected areas by 2010. The perceived reduced risk of avian
influenza outbreak has reduced demand to adhere to strict and safe poultry handling procedures.
Nevertheless, it is estim
ated that 50% of the at-risk population practice safe handling procedures.
21.Privatization and corporate restructuring m
ade only moderate headw
ay. Only six strategic
enterprises were privatized during the period of the C
PS implem
entation (2 in the FBH
and 4 in the RS).
Com
mitm
ent to privatization remains elusive, particularly in the FB
H, as privatization goals did not
feature prominently in the program
s of political parties in the campaign for O
ctober 2010 general elections. The W
orld Bank correctly decided to extend lim
ited support in these “non-core” areas through the EC
financed Trust Fund for corporate restructuring and through non-lending services such as the 2008 IC
A. C
ompanies w
hich adopted recomm
endations provided under the EC Trust Fund improved their
operations and profitability in 2010. After a successful Turkish com
pany privatized a soda ash plant, one of the largest em
ployers in Tuzla area, IFC supported its turnaround and increased com
petitiveness through econom
ies of scale. Through its investment IFC
contributed to help alleviate the adverse effects of the global financial crisis on B
iH and sent an encouraging signal to other foreign investors in the
region.

FY08-FY11 CPS Completion Report
52
Pillar II: Improving the quality of public spending and the delivery of public services for the
vulnerable
22.A
llcore program outcom
es under Pillar II were achieved. W
orld Bank supported program
s w
ere successful in improving local infrastructure, enhancing prim
ary health care, and extending support for sm
all scale agriculture in less developed areas.
23.R
esults were
particularly noteworthy in im
proving local infrastructure and services.The
Urban Infrastructure and Services D
elivery Project helped reduce water losses in all participating
municipalities and extend 24h w
ater supply to some 300,000 inhabitants for the first tim
e. Under the
Solid Waste M
anagement Project the B
ank supported six regional sanitary landfills that are now fully
functional. The number of w
ild dumpsites w
as reduced by 15%. The Second Solid W
aste Managem
ent Project, w
hich is currently under implem
entation, will expand the num
ber of regional landfills and im
prove their effectiveness.
24.T
he Health Sector E
nhancement Project w
as successful in promoting the fam
ily medicine
model of prim
ary health care. Targets related to utilization of family m
edicine in primary health care
were exceeded in the FBH
, and fully achieved in the RS. M
ost importantly, the percentage of the
population registered with fam
ily medicine team
s increased from 5%
before the project started, to about 58%
of the population in early 2011. Additional financing in the am
ount of US$10 m
illion approved in Q
3 FY11 w
ill build on this successful implem
entation and further expand the coverage of the family
medicine m
odel of primary health care to 70%
of the population.
25.T
he IFC support for the B
H H
eart Center in T
uzla has increased access to essential cardiovascular services.The C
enter was the first private hospital and thus has helped establish quality
benchmarks for the delivery of private health services. A
lso, the project is an example of successful
public-private partnership in demonstrating the viability of public financing of privately provided
services. The Center is expected to reach 4,500 in-patients and 20,000 outpatients per year by 2012
26.R
eforms w
ere initiated in the non-core program area of im
proving targeting of social benefits.C
ontinued policy dialogue underpinned by the Bank’s analytic w
ork (Social Transfers in BH
: M
oving Toward a M
ore Sustainable and Better-Targeted Safety N
et), laid the groundwork for the reform
of the system
of non-insurance based cash transfers. In late 2009 and early 2010, as a part of the reform
agenda agreed under the DPO
I, the entities adopted legislation that should substantially improve the
targeting of non-insurance based cash benefits. In addition to this, the Social Safety Net and Em
ployment
Support Project was designed to provide technical support for im
plementation of reform
s of the social protection system
, and extend job-brokerage services to vulnerable active job seekers. How
ever, legislation rem
ains pending to introduce the principle of means testing for all non-insurance based cash-
transfers except for war veterans w
ith a disability of 60% and above. N
ewly elected governm
ents are facing significant pressure by interest groups to m
aintain the current levels of spending with no
improvem
ents in targeting. At the sam
e time, Entity governm
ents need further budget support and a follow
up DPO
II will be considered in the new
CPS. In this context, prior to em
barking on a new set of
reforms that w
ould be supported under the DPO
II, the World B
ank and the Entity governments w
ill ensure that there w
as no backtracking and that there continues to be satisfactory progress in implem
enting the D
POI reform
s.

FY08-FY11 CPS Completion Report
53
IV.
WO
RL
D B
AN
K PE
RFO
RM
AN
CE
27.O
verall, the World B
ank performance in delivering and im
plementing the C
PS program
was satisfactory. The B
ank delivered the program that w
as aligned with the country priorities,
realistically achievable,
and w
hich incorporated
principles of
flexibility, partnership
and results
orientation based on lessons learned from the earlier program
s. The two pillars of the C
PS were consistent
with governm
ent priorities, and aimed to accelerate the country’s progress tow
ard the EU m
embership.
28.T
he Bank m
ade the right decision to attune its program to a “Platform
for Action”. In the
absence of a formal country developm
ent strategy, the Platform for A
ction represented the minim
um
comm
on denominator of developm
ent priorities jointly pursued by all levels of government in B
H. The
fact that the new C
ountry Developm
ent Strategy has still not been adopted by all levels of government
suggests a shortcoming in com
mitm
ent among different levels of governm
ent in BH to jointly address key
development priorities. Tensions surrounding the constitutional reform
process created an environment
whereby developm
ent programs and even the process of EU
integration were treated as less im
portant by the key policy m
akers. In such an environment, the B
ank acted pragmatically, aligning its program
behind the single available platform that aim
ed at accelerating the implem
entation of urgent reforms to
attract investment, accelerate job creation and im
prove overall living standards in the country.
29.T
he Bank dem
onstrated responsiveness in allocating resources based on the strong demand
and comm
itment, and flexibility to adjust the lending program
in response to the economic crisis.
During the first phase of C
PS implem
entation (FY08-FY
09) the Bank approved projects in the “core” areas of transport, local infrastructure and environm
ental protection for which there w
as a strong demand
and comm
itment for reform
s by the authorities. During the second phase (FY
10-FY11), the B
ank and the B
H authorities agreed that the rapidly changing econom
ic environment required urgent reprogram
ming of
certain planned investment operations and careful consideration of the D
POs. C
onsequently, the Bank’s
lending program for 2010 included support for the country’s budgets under stress by the drop of revenues
caused by the global economic slow
-down, through the Public Expenditure D
POI (U
S$111 million), and
a line of credit to enhance access to finance for small and m
edium enterprises (U
S$70 million). This also
meant that the Sava R
iver Navigability Project that w
as originally scheduled for this CPS period had to be
postponed to the next CPS cycle.
30.IFC
maintained satisfactory perform
ance combining its investm
ent operations with advisory
services to improve access to finance and com
petitiveness of micro-entrepreneurs and SM
Es, develop trade finance to help trade flow
s during the global financial crisis, and to explore opportunities for public private partnership (PPP) projects. IFC
currently has 9 projects in its BH
portfolio, with total com
mitm
ent of U
S$ 128.4 million. Projects in the financial sectors represent 35%
, general manufacturing 61%
, and health 4%
of the IFC portfolio
31.T
he delivered lending program w
as in line with m
aximum
planned lending. A total of nine
operations, eight investment projects and one D
PO, w
ere delivered during the CPS period (see Table 1).
Maxim
um planned lending w
as US$317 m
illion, and the total amount approved over the C
PS period was
US$315.4 m
illion of which ID
A credits -
US$131, IB
RD
loans -U
S$175 million, and G
EF grants -U
S$9.4 million. IFC
comm
itted over US$76 m
illion for six projects (3 in the financial sector, 1 in health, and 2 in chem
icals).

FY08-FY11 CPS Completion Report
54
32.O
ver the
last year
there has
been significant
progress in
accelerating project
implem
entation and reducing effectiveness delays. In the period 2006-2009 it took on average 10-12m
onths for projects to become effective upon B
oard approval. Consequently, m
any projects were affected
in the initial stages of implem
entation, which led to suboptim
al outcomes. In 2010, this processing tim
e w
as reduced to 6.7 months on average. Further reducing the tim
e required for project effectiveness to 6 m
onths is the target agreed with counterparts from
all project teams and the m
inistries of finance. It is expected that elim
ination of effectiveness delays will greatly accelerate im
plementation and achievem
ent of developm
ent outcomes.
33.Strong disbursem
ent performance. The disbursem
ent ratio in FY10 w
as 25.9% w
hich was the
best result of all Southeast European Countries (EC
CU4) and am
ong the best in the ECA
region. The current disbursem
ent ratio (June 2011) of 24.5% m
eans that strong disbursement perform
ance was
maintained in FY
11 (see Figure 2 below). The m
ain reasons behind the strong recent disbursement
performance are a m
ix of internal and external factors including:i) the urge to accelerate implem
entation in response to the econom
ic crisis and political cycle (general elections in 2010); ii) maturity of larger
projects in the portfolio (for example: R
oad Infrastructure and Safety, ECSEE A
PL3, and Solid Waste
Managem
ent I); and iii) the project design attuned to the domestic priorities and im
plementation capacity.
Figure2: T
rends in Disbursem
ent Rates (%
of undisbursed balances)
FY07
FY08
FY09
FY10
FY11
Bosnia and H
erzegovina13
1316
2625
ECA
1919
1819
17.2B
ank23
2227
2424
34.A
s of June 2011, the active portfolio consisted of 14 projects, with total com
mitm
ents of US$
332.3 million, of w
hich about US$200 m
illion remains available for disbursem
ent. The current portfolio is healthy. The am
ount of comm
itment at risks, a m
easure of the likelihood that projects will
not meet their stated developm
ent objectives on time,represents 6.3%
of the portfolio which com
pared favorably w
ith ECC
U4 (8.7%
) and ECA
averages (12%). O
nly one project is currently consideredto be
at risk. Implem
entation progress for AR
DP is rated as m
oderately unsatisfactory and the project restructuring is pursued to address identified w
eaknesses. Implem
entation progress of all other projects is rated m
oderately satisfactory to satisfactory (see Figure 2 below).
35.A
nalytical and Advisory A
ctivities provided strong input for the policy dialogue, and helped the authorities develop responses to the econom
ic crisis. The analytical work delivered during the
period of the CPS im
plementation w
asaligned w
ith the country demand and econom
ic concerns. A
Policy Note on Social A
ssistance Transfers in BH
(FY09), and Poverty update (FY
10) provided analytical underpinning for the reform
s of the social protection system that w
ere initiated in late 2009 and early 2010. A
n Investment C
limate A
ssessment (FY
08) responded to the need to analyze performance and
structural constraints in the enterprise sector and provide recomm
endations on how to address identifies
challenges. A Transport Sector Review
(FY10)provided a fram
ework for future developm
ent planning in the transport sector. Finally, a series of policy notes on com
petitiveness, which jointly present the
Country Econom
ic Mem
orandum for B
H, inform
ed the policy dialogue about the relevant aspects of com
petitiveness. These Policy Notes and the policy dialogue generated during and after their
presentation contributed to the design of the new C
PS.

FY08-FY11 CPS Completion Report
55
Figure 3: Portfolio Indicators -June 2011
Project name
Board
Effective
Closing
Age in years
Orig.commitment $
% disbursed
% Disb. ratio in FY10
% Disb. ratio in FY11
Latest IP
Latest DO
HEA
LTH SEC
TOR
3/31/2005
4/3/20066/30/2011
6.227.00
91.1%52.8%
53.7%S
MS
SOC
IAL SA
FETY &
EMPL
2/25/201010/7/2010
10/31/20141.3
15.004.9%
0.0%9.3%
MS
SA
GR
& R
UR
AL D
EVT
6/19/20072/26/2008
6/30/20123.9
21.0024.9%
6.9%16.2%
MU
MS
AV
IAN
INFLU
ENZA
6/20/2007
3/28/20086/30/2011
4.05.00
63.3%38.2%
84.2%S
SEC
SEE APL3
6/16/20064/13/2007
6/30/20125.0
36.0048.8%
16.9%47.3%
SS
FOR
EST&M
OU
NT A
REA
S5/29/2008
4/17/20094/30/2013
3.03.40
28.5%9.0%
8.4%M
SM
SLA
ND
REG
ISTRA
TION
4/27/20064/16/2007
3/31/20125.1
15.0058.2%
29.0%40.9%
SS
NER
ETVA
& TR
EBISNJIC
A5/29/2008
3/6/200912/31/2013
3.06.00
28.7%16.6%
25.5%S
SR
OA
D IN
FR &
SAFETY
12/13/20079/19/2008
12/31/20113.5
25.0077.9%
51.2%70.1%
MS
SW
ATER
QU
ALITY
PRO
TECT
6/7/200511/18/2005
2/28/20116.0
8.9056.5%
24.8%37.2%
MS
SU
RB IN
FRA
& SER
7/8/20042/23/2005
6/30/20116.9
25.0068.2%
13.5%46.1%
MS
MS
SOLID
WA
STE II11/25/2008
10/23/20092/28/2014
2.540.00
4.5%4.0%
2.4%M
SS
SAR
AJEV
O W
ASTE W
ATER
12/22/20097/15/2010
11/30/20151.4
35.003.2%
0.0%3.2%
SS
ENH
AN
CIN
G SM
E AC
CESS
12/15/20098/16/2010
7/31/20141.5
70.006.8%
0.0%23.27%
SS
14 active projects3.8
332.338%
25.9%24.5%
36.IFC
advisory services in BH
focused on four business lines: i)sustainable business advisory-w
ith programs on corporate governance, renew
able energy, integrated solid waste m
anagement and
international standards and technical regulations and Balkan hotel market access; ii) investm
ent climate-
with program
s on alternative dispute resolution, and sub-national competitiveness (investm
ent generation as a part of sub-national com
petitiveness); iii) access to finance-with program
s on micro-finance; and iv)
infrastructure-promoting private sector participation (PSP) in all infrastructure sub-sectors.
Highlights of the results achieved through IFC
advisory services include:
BH
’s first initial public offering of a private company w
ith the listing of Fratello Trade at the Banja
Luka Stock Exchange. C
orporate governance codes and corresponding scorecards for the Sarajevo and Banja Luka Stock
Exchanges. W
orking with the U
niversity in Sarajevo IFC helped to set up the first M
asters program in C
orporate G
overnancein the region w
ith 127 postgraduate students being graduated so far. A
dvisory services to 6 local SMEs helped them
to get US$ 13 m
illion in financing from the local
banks and other investors, and US$2 m
illion from IFC
. IFC
supported 6 local companies in
construction materials and food processing sectors to im
plement
international standards needed for export to international markets. C
ompanies received U
S$2.4 m
illion in financing and increased their exports by US$15.6 m
illion.Integrated solid w
aste managem
ent advisory services contributed to the finalization of a €7.5 million
PPP investment into a biom
ass district heating plant in Gracanica.
Sub-national competitiveness project contributed to direct and indirect savings for businesses of
more than U
S$54 million. O
ut of about 1,400 administrative procedures m
ore than 820 were
improved, 90 procedures w
ere changed, more than 1,700 businesses w
ent through the reformed
procedures, and about 900 people were trained.

FY08-FY11 CPS Completion Report
56
IFC’s advisory services helped M
FI “MI-B
ospo” to transform into a m
icrofinance company.
IFC advisory services, w
ith the introduction of the Balkan H
otel Market A
ccess Program assisted to
ongoing efforts to attract international tourists to the BH
by developing three on-line booking web
portals.
V.
LE
SSON
S AN
D SU
GG
EST
ION
S FOR
THE
NE
W C
PS
37.T
he World B
ank can support structural reforms in B
H’s politically com
plex environment,
but a long-term com
mitm
ent is needed. Bank support to structural reform
s—e.g, business environm
ent reform
through the Business Enabling Environm
ent Structural Adjustm
ent Credit—
suggests structural reform
s in BH
take time to im
plement, and desired outcom
es may be achieved only in stages and over the
medium
term. Thus, a longer-term
comm
itment and a com
bination of financial and advisory services are needed to achieve long lasting results.
38.Policy dialogue in key areas should be m
aintained even in the absence of lending, as it provides valuable input and form
s a basis for future policy making. D
espite failure to push forward
much needed
structural reforms in the area of social and veteran benefits, and cancellation of U
S$51 m
illion for the Second Social Sector Structural Adjustm
ent Credit (SO
SAC
II) in 2006, the Bank
continued policy dialogue in this sector. The dialogue culminated w
ith the presentation of findings of 2009 study on social benefits in B
H w
hich revealed that the system w
as inequitable, inefficient, and fiscally unsustainable. C
ontinued policy dialogue and the Bank’s analytic w
ork provided basis for the initiation of reform
sthat w
ere supported under the DPO
I. These reforms w
ill have a greater chance of success since the B
H authorities had access to the right m
ix of financial (DPO
and SSNESP) and advisory
services from the B
ank. It is still preferable in BH
to continue to pursue a degree of reform though
investment lending, and to rely on not overly com
plex or ambitious D
POs opportunistically, in line w
ith dom
estic capacity, and in areas where there is clear com
mitm
ent for reforms. A
t the same tim
e, policy dialogue should be
maintained in selected key areas w
here the Bank’s analytic w
ork may serve as a basis
for the future reforms.
39.B
uild consensus about institutional arrangements to be pursued under the project during
the project preparation. Institutional reforms envisaged under several projects designed during the
previous CA
S did not enjoy political support and implem
entation was consequently delayed. For
example, under the A
RD
P, the activities related to establishing an EU com
patible payment system
are behind schedule due
to the lack of agreement as to the role and authority distribution betw
een the various levels of governm
ent. Furthermore, several projects have experienced delays at the beggining of the
implem
entation since implem
entation arrangements are not firm
ly agreed (for example SSN
ESP in the R
S did not start 4 months after effectiveness). In a politically com
plex environment such as B
H, it is
necessary to reach firm agreem
ent about all aspects of institutional and implem
entation arrangements
during the project preparation.
40.M
aintain flexibility in allocation of resources. The Bank dem
onstrated much needed
responsiveness and flexibility in adjusting its lending program in response to the im
pact of the global econom
ic and financial crisis. Although flexibility m
ayinvolve postponem
ent of some operations, it
should be maintained in the next C
PS cycle as it allows the B
ank to respond to emerging econom
ic concerns by the G
overnment.

FY08-FY11 CPS Completion Report
57
41.T
he Bank’s decision to divide the C
PS program into “core” and “non-core” program
areashas proven successful. Such an approach allow
ed much needed flexibility to the Bank to sim
ultaneously pursue investm
ent lending in “core” areas while m
aintaining policy dialogue and opportunity for engagem
ent in the “non-core” areas. For example, w
hen the opportunity emerged, the B
ank played a lead role in helping the G
overnments achieve the objective of review
ing and streamlining social spending
schemes w
ith a view to im
proving their effectiveness.
42.R
esults are possible even in the politically difficult environment w
hen interventions are aligned w
ith investment priorities of the governm
ent. The Bank applied lessons learned from the
previous CA
S period (FY05-08) and fully aligned its portfolio to the investm
ents priorities of the Entity governm
ents. Whereas in the previous C
AS, the portfolio included structural adjustm
ent credits and associated TA
projects for which there w
as little comm
itment, the structure of the portfolio during this
CPS period m
ainly included investment operations for w
hich there was high level of com
mitm
ent and readiness to im
plementation. This principle should be m
aintained in the next CPS cycle. Furtherm
ore, lim
ited World B
ank resources should be allocated more strategically. W
hile some stream
lining of the portfolio has been achieved, from
16 active projects worth U
S$300 million at the tim
e of CPS approval to
12 projects worth U
S$302.3 million at the end of the C
PS cycle (June 30, 2011), greater selectivity will
be needed in the new C
PS, focusing on the fewer larger operations. Sm
all stand-alone operations should be avoided. A
dditional financing and project restructuring should be considered in sectors where there is
need to scale up operations or where new
circumstances require a different approach. This w
ill involve m
aking some tough strategic choices and even exiting som
e sectors.
43.T
he Bank should continue to strengthen partnerships w
ith other development partners,
International Financial Institutions (IMF, E
BR
D, E
IB, C
oED
B), and the E
uropean Com
mission
(EC
) in particular. During im
plementation of the CPS program
the Bank’s activities w
ere harmonized
with activities of other developm
ent partners. The IMF has been the key partner in supporting reform
s in the social sector as these reform
s complem
ented the IMF’s stabilization program
. Successful partnership w
as maintained w
ith EBRD
and EIB in the transport sector and energy sector, and w
ith CoED
B in the
health sector. Informal coordination am
ong IFIs (EBR
D, EIB
, IMF, IFC
, CoED
B, K
fW) w
as initiated by the B
ank. Cross cutting portfolio issues w
ere examined and it w
as agreed that IFIs will m
ake a joint presentation about the key issues affecting im
plementation of investm
ent projects to the new State level
government. SID
A rem
ains an important developm
ent partner in activities related to business climate,
agriculture and local infrastructure. Finally, given that support for the process of BH
’s EU accession is
likely to remain the key cross cutting them
e in the new C
PS, strategic partnership with the EC
will be the
key in maxim
izing thedevelopm
ent outcomes. In 2010, a new
form of partnership w
as introduced betw
een the EC and the B
ank in BH
with the EU
approving EUR
22.6 million of IPA
funds as co-financing for five B
ank financed investment operations in tw
o sectors: transport, and environment (w
ater m
anagement). Im
plementation of this co-financing arrangem
ent will be an im
portant guide for any future partnership w
ith the EC.
44.Synergy betw
een the IBR
D/ID
A and the IFC
should be further improved. The C
PS period w
as marked by satisfactory cooperation w
ithin the World B
ank Group. H
owever,B
H counterparts w
ill benefit from
a more fully integrated approach by the W
orld Bank G
roup in pursuing country development
goals. In this regard, the Result M
atrix of the new C
PS should reflect outcome indicators that w
ill be achieved by all agencies of the W
orld Bank G
roup (IDA
/IBR
D/IFC
) and its main developm
ent partners.

FY08-FY11 CPS Completion Report
58
Table 1: CPS Program FY08 - FY11 - Summary of Self-evaluation
Country Strategic Goals CPS Outcomes Supporting
Country Goals
Status and Evaluation Summary
Lending and Non-lending activities that contributed to the outcome
Lessons for the new CPS
Pillar I – Improve the environment for private sector led growth and convergence to Europe
Create the conditions for sustainable and balanced economic growth and EU integration process
Key reform priorities in the Platform for Action supporting this goal:
- Create a better business environment
- Promote reforms that ensure sustainable economic development
CORE PROGRAM GOALS
Reduction in the duration and number of procedures required to register a business.
Baseline: June 2007: New Business Registration System (BRS) launched – Average registration time 54 days (DB)Target: 30 days in the FBH, 23 days in the RS (2008)
Development of transparent landmarkets through registration ofreal estate
Baseline: 2006: 150,000 registry folders completed in the automated database, 80,000 backlog cases, several months to complete real estate transactionsTarget: 2 million folders completed, full reconciliation, no backlogs (2011)
PARTIALLY ACHIEVED: Court registration improved but start up process is still slow. In 2010, all 16 courts used the new business registration system; average court registration takes 6 days in the RS and 10.4 days in the FBH. Overall start up process takes 55 days in the FBH and 22 days in the RS.
ACHIEVED: As of June 2011, 1.45 million folders were completed. Backlog has beenreduced to 18,305 and 80% of cases is now resolved in 5 working days in 16 Land Registration Offices (10 in FBH and 6 in the RS). Current progress in implementation of the Land Registration Project provides assurance that the program goal will be fully achieved as planned by the end of 2011.
Business Environment Structural Adjustment Credit (P071001 -BAC) - the credit was closed on December 15, 2007 after meeting the outcome based conditions related to business registration.
Land Registration Project (P096200) - project closing on March 31, 2012. The project document was clear and realistic about what could be achieved during the project implementation as well as what would be needed in the subsequent five year period. Thus, there was the big picture and specific achievable outcomes for a project. These estimates have turned out to be accurate and during the last year of the project the counterparts have been preparing the follow-up program for the next five years.
Structural reforms take time in BH, and desired outcomes may be achieved only in stages and over the medium term (BAC implementation lasted 5 years, very unusual for a SAC). The main lesson from this and other attempts at structural reforms in BH, is that the country and its fragmented governance structure present unique challenges to building commitment for the reform agenda. DPOs may be successfully used to pursue reforms in areas (currently not many) where the commitment to reform – and a certain level of consensus about the path to follow - is evident in both Entities and at the State level. Or where the external environment, be it a global economic crisis or the EU accession agenda, is creating the opportunity to build commitment where it was previously lacking. Thus it is preferable in BH to continue to pursue a degree of reform though investment lending, and to rely on not overly complex or ambitious DPOs opportunistically, in line with domestic capacity, in areas where there is commitment for reforms.

FY08-FY11 CPS Completion Report
59
Country Strategic Goals CPS Outcomes Supporting
Country Goals
Status and Evaluation Summary
Lending and Non-lending activities that contributed to the outcome
Lessons for the new CPS
Support harmonization with the EU’s Common Agricultural Policy by supporting establishment of agricultural information systems, and EU-compatible payment systems for subsidies.
Target: EU-compatible payment system designed (2010). Initiating EU-compatible Rural Development Grants (2011)
Stakeholder driven extension services operational
Baseline: Limited in the RS, none in the FBH (2007)Target: Stakeholder managed, contracted public-private extension services reaching 20% of commercial farmers (2012)
PARTIALLY ACHIEVED: Rule books on farm and client registry and livestock registry completed. In 2010, about 50% of agriculture subsidies in RS and 30% in FBH were structural (investment grants) approximating IPARD requirements. Overall, establishment of registries at state and entity level for effective Agricultural Information System (AIS) required to administer IPARD payments is progressing. However, development of an agreed program, structure, and authority for a state level payment system remains outstanding.
PARTIALLY ACHIEVED:Extension agencies established. Draft extension strategies have been developed in both entities. However, the Bank assessed that drafts lack strategic vision to develop sustainable systems. The strategies are currently under revision based on comments from the Bank team.
Agriculture and Rural Development Project (P101213). Activities related to building the institutional capacity and agricultural information systems are progressing well. Activities related to establishing a EU compatible payment system remain behind schedule due to the lack of agreement as to the role and authority distribution between the various levels of government. Project restructuring underway.
Agriculture and Rural Development Project (P101213).
AAA: Policy Note Series on Trade and Integration: Agriculture Sector Policy Note.
Currently in discussion with UK funded EPIC program to support finalizing extension strategy in both entities. Government considering using project funding to extend EPIC team support to help with this task.
The ARDP was prepared at a time of optimism for BH moving towards building functional state systems including a State-level Ministry of Agriculture. However, resistances to centralized state structures were well apparent. Consequently, project preparation conservatively foresaw initial entitiy-level structures but with the ultimate aim of linking entity systems to an emerging functional State level system. However, during implementation, the main external stakeholders, incl. EC and SIDA, developed a position favoring a single Paying Agency at the state level. At mid-term, the emerging lessons from this are:- the exclusive insistence on the establishment of a unified, state-level Paying Agency prevented progress towards the target of an EU-compatible payment system, which could also have been achieved though state-level coordination of entitiy-level program and payment structures;- the target of a EU-compliant payment structure was overly ambitious. A target of an EU-type payment structure would have offered more implementation choices towards an identical target.
.

FY08-FY11 CPS Completion Report
60
Country Strategic Goals CPS Outcomes Supporting
Country Goals
Status and Evaluation Summary
Lending and Non-lending activities that contributed to the outcome
Lessons for the new CPS
Road network better maintained and safer
Baseline: 2006: road user costs US$0.25 per km per vehicle
Target: Reduction in road user costs of at least 10 percent on rehabilitated roads (2011).
Road safety strategy.
Baseline: No integrated road safety strategy at the State and Entity level Target: Integrated road safety strategy at the State and Entity level is implemented(2011)
To facilitate BH’s participation in the SEE energy market and integration into the EU; BH electricity system operated as a single control area.
Baseline: no ISO (2006)
Target: ISO-administered “Balancing Market Mechanism” for the entire BH
PARTIALLY ACHIEVED: 70% of planned road sections rehabilitated to date and it is expected that the rehabilitation target will be met by the project closure, but the entity road directorates have not yet provided updated road user costs for rehabilitated road sections.
PARTIALLY ACHIEVED: Both entities adopted mutually harmonized road safety strategies in 2008. The Law on Traffic Safety on Roads in the RS has been prepared and is awaiting parliamentary approval. In the FBH, an Action Plan for implementing the Road Transport Safety Strategy has been developed and implementation is underway. It is expected that this goal will be fully achieved by the end of 2011 as originally planned.
PARTIALLY ACHIEVED: ISO was created 2008 and is now functional and is operating the power system in the country. However, the dispute between the Entities on the issue of Transco (and related institutional
Road Infrastructure and Safety Project (P100792). The project closing on December 31, 2011.
Road Infrastructure and Safety Project (P100792).
AAA: Transport Sector Review
ECSEE APL 3 (P090666).
The Bank investments played a catalytic role in supporting road rehabilitation, improvements of road safety including adoption of road safety strategies. The Bank’s work also facilitated involvement of EBRD and EIB whose volumes of lending far outweigh the Bank’s lending in this sector. These IFIs are expected to maintain or increase investments in road and railway infrastructure. Therefore, the Bank should consider focusing on other segments of the transport network to facilitate regional trade and cooperation (for example: Sava river navigability).
Technical assistance for creation and institutional development of the Independent System Operator (ISO) was provided by USAID and investment financing by EIB. Though it was not funded by the Bank, monitoring of this component was included in the Project outcomes since it is an essential

FY08-FY11 CPS Completion Report
61
Country Strategic Goals CPS Outcomes Supporting
Country Goals
Status and Evaluation Summary
Lending and Non-lending activities that contributed to the outcome
Lessons for the new CPS
electricity system is fully operational (2011)
BH electricity generation and exports sustained or increased at corresponding hydrological conditions
Baseline: Power generation 12,800 Gwh (2006)Target: Equal or greater generation and exchangeimport/export transactions between EPs in BH and other regional power utilities.
Improved commercial use of the Sava river corridor
Baseline: 2007: sections of the river are not navigableTarget: Priority sections of the River Sava returned to navigability
Critical forests, water and mountain ecosystems protected and used in a sustainable way
Baseline: Area under formal protection is 0.55% (2007)Target: protected area 3% (2010)
arrangement for ISO) has deepened preventing the proper functioning of Transco, and particularly its investment decisions.
ACHIEVED: Generation and export of power in 2009 has reached record levels and the EPRS and EPBiH have earned record profits inspite of lower prices in the regional electricity market.
NOT ACHIEVED: Sava River Navigability Project has been postponed due to the need to adjust the CPS lending program in response to the crisis.
PARTIALLY ACHIEVED: Area under formal protection increased to 2.4% or 123,000 ha.
ECSEE APL 3 (P090666).
Sava River Navigability Project -under preparation.
GEF Forest and Mountain Protected Areas (P087094).
component of sector restructuring and market development. Because of political disagreements between the two Entities, this component could achieve the targeted outcome only partially. State level policy and sector structure issues that require political resolution and close collaboration among the State and the Entities should not be included in investment projects but should be supported through technical assistance with the involvement of key donors.
Flexibility was one of the three key operating principles of the CPS (other two being results, and partnerships). The Bank demonstrated flexibility in 2009 to adjust its lending program in response to the impact of the economic and financial crisis. Although this meant postponement of some operations (such as Sava River), flexibility principle should be maintained in the next CPS cycle.
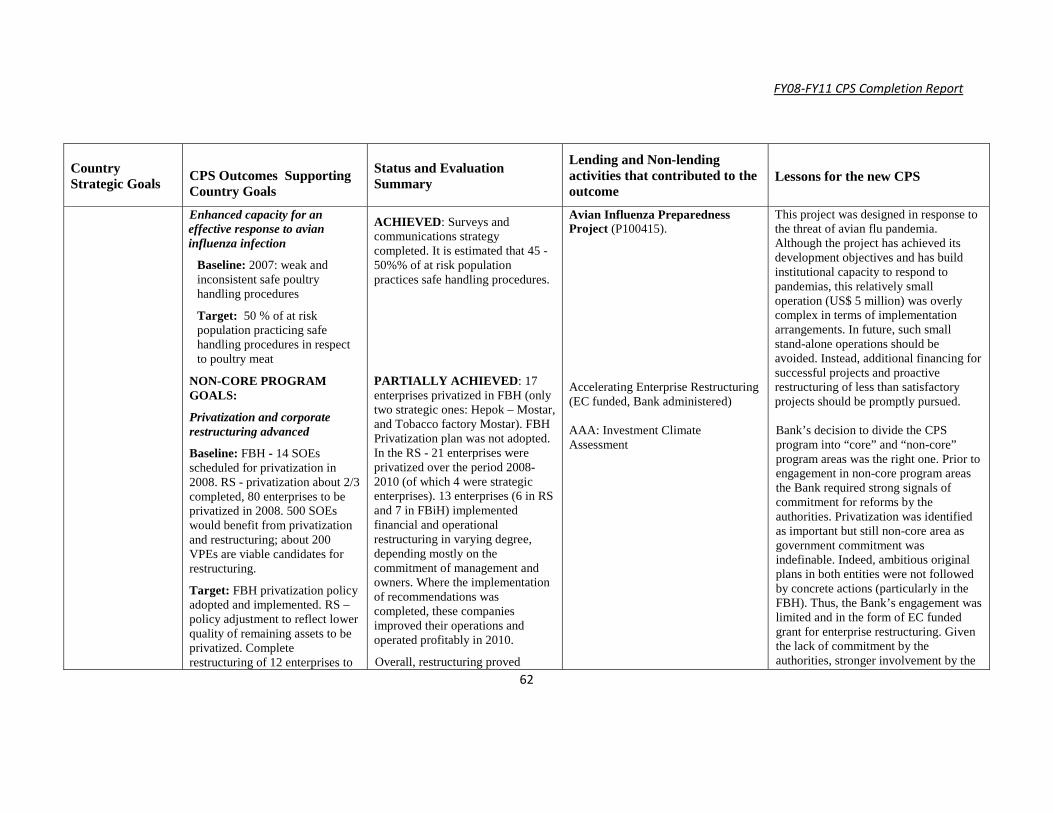
FY08-FY11 CPS Completion Report
62
Country Strategic Goals CPS Outcomes Supporting
Country Goals
Status and Evaluation Summary
Lending and Non-lending activities that contributed to the outcome
Lessons for the new CPS
Enhanced capacity for an effective response to avianinfluenza infection
Baseline: 2007: weak and inconsistent safe poultry handling procedures
Target: 50 % of at risk population practicing safehandling procedures in respect to poultry meat
NON-CORE PROGRAM GOALS:
Privatization and corporate restructuring advanced
Baseline: FBH - 14 SOEs scheduled for privatization in 2008. RS - privatization about 2/3 completed, 80 enterprises to be privatized in 2008. 500 SOEs would benefit from privatization and restructuring; about 200 VPEs are viable candidates for restructuring.
Target: FBH privatization policy adopted and implemented. RS –policy adjustment to reflect lower quality of remaining assets to be privatized. Complete restructuring of 12 enterprises to
ACHIEVED: Surveys and communications strategy completed. It is estimated that 45 -50%% of at risk population practices safe handling procedures.
PARTIALLY ACHIEVED: 17enterprises privatized in FBH (only two strategic ones: Hepok – Mostar,and Tobacco factory Mostar). FBH Privatization plan was not adopted. In the RS - 21 enterprises were privatized over the period 2008-2010 (of which 4 were strategic enterprises). 13 enterprises (6 in RS and 7 in FBiH) implemented financial and operationalrestructuring in varying degree, depending mostly on the commitment of management and owners. Where the implementation of recommendations was completed, these companies improved their operations and operated profitably in 2010.
Overall, restructuring proved
Avian Influenza Preparedness Project (P100415).
Accelerating Enterprise Restructuring (EC funded, Bank administered)
AAA: Investment Climate Assessment
This project was designed in response to the threat of avian flu pandemia. Although the project has achieved its development objectives and has build institutional capacity to respond to pandemias, this relatively small operation (US$ 5 million) was overly complex in terms of implementation arrangements. In future, such small stand-alone operations should be avoided. Instead, additional financing for successful projects and proactive restructuring of less than satisfactory projects should be promptly pursued.
Bank’s decision to divide the CPS program into “core” and “non-core” program areas was the right one. Prior to engagement in non-core program areas the Bank required strong signals of commitment for reforms by the authorities. Privatization was identified as important but still non-core area as government commitment was indefinable. Indeed, ambitious original plans in both entities were not followed by concrete actions (particularly in the FBH). Thus, the Bank’s engagement was limited and in the form of EC funded grant for enterprise restructuring. Given the lack of commitment by the authorities, stronger involvement by the
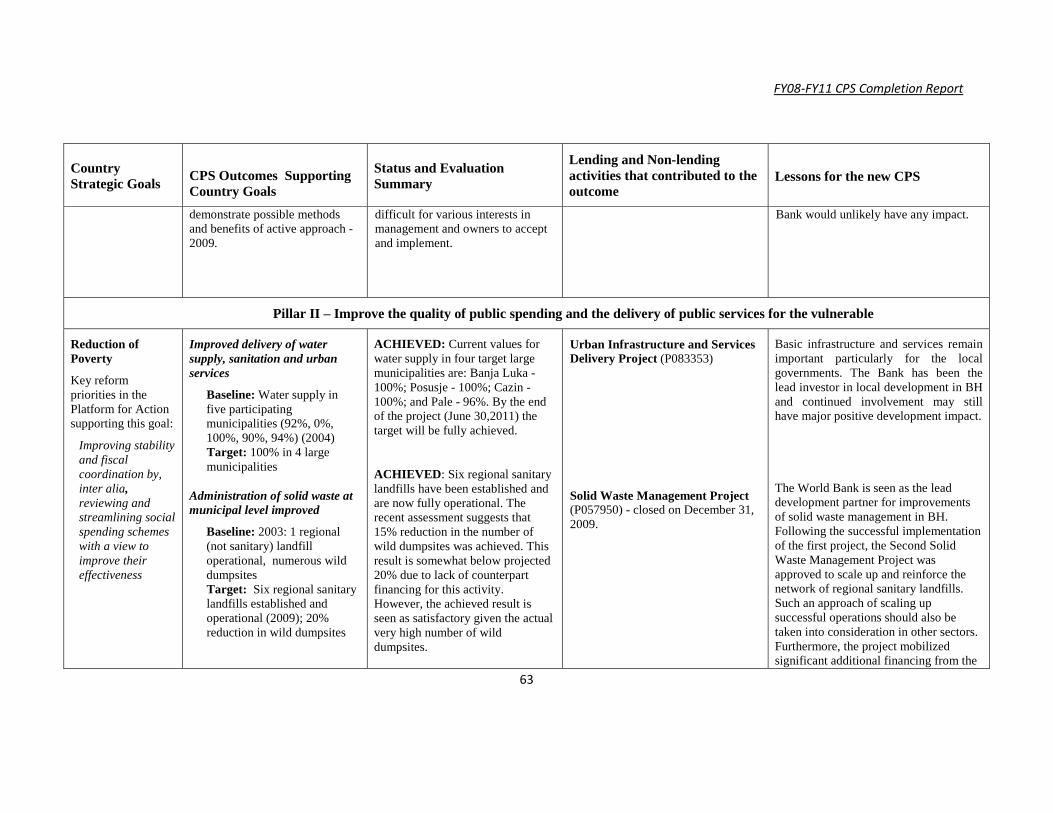
FY08-FY11 CPS Completion Report
63
Country Strategic Goals CPS Outcomes Supporting
Country Goals
Status and Evaluation Summary
Lending and Non-lending activities that contributed to the outcome
Lessons for the new CPS
demonstrate possible methods and benefits of active approach -2009.
difficult for various interests in management and owners to accept and implement.
Bank would unlikely have any impact.
Pillar II – Improve the quality of public spending and the delivery of public services for the vulnerable
Reduction of Poverty
Key reform priorities in the Platform for Action supporting this goal:
Improving stability and fiscal coordination by, inter alia,reviewing and streamlining social spending schemes with a view to improve their effectiveness
Improved delivery of water supply, sanitation and urban services
Baseline: Water supply in five participating municipalities (92%, 0%, 100%, 90%, 94%) (2004)Target: 100% in 4 large municipalities
Administration of solid waste at municipal level improved
Baseline: 2003: 1 regional (not sanitary) landfill operational, numerous wild dumpsitesTarget: Six regional sanitary landfills established and operational (2009); 20% reduction in wild dumpsites
ACHIEVED: Current values for water supply in four target large municipalities are: Banja Luka -100%; Posusje - 100%; Cazin -100%; and Pale - 96%. By the end of the project (June 30,2011) the target will be fully achieved.
ACHIEVED: Six regional sanitary landfills have been established and are now fully operational. The recent assessment suggests that 15% reduction in the number of wild dumpsites was achieved. This result is somewhat below projected 20% due to lack of counterpart financing for this activity. However, the achieved result is seen as satisfactory given the actual very high number of wild dumpsites.
Urban Infrastructure and Services Delivery Project (P083353)
Solid Waste Management Project(P057950) - closed on December 31, 2009.
Basic infrastructure and services remain important particularly for the local governments. The Bank has been the lead investor in local development in BH and continued involvement may still have major positive development impact.
The World Bank is seen as the lead development partner for improvements of solid waste management in BH. Following the successful implementation of the first project, the Second Solid Waste Management Project was approved to scale up and reinforce the network of regional sanitary landfills. Such an approach of scaling up successful operations should also be taken into consideration in other sectors. Furthermore, the project mobilized significant additional financing from the

FY08-FY11 CPS Completion Report
64
Country Strategic Goals CPS Outcomes Supporting
Country Goals
Status and Evaluation Summary
Lending and Non-lending activities that contributed to the outcome
Lessons for the new CPS
Sustainable mechanisms for municipal capital investments
Baseline: Weak citizen participation in decision making at local level (2007)Target: Improved participatory budgeting in 30 poor municipalities (2009)
Significant increase in utilization of family medicine in primary health care
Baseline: No. of first examinations by FM doctors (FBH: 582,716; RS: 572,876 -2005)Target: increase by 55% in FBH; by 15% in RS (2010)
Significant reduction in utilization of secondary and tertiary health services
Baseline: No. of referrals to specialists in locations where FM model was introduced
ACHIEVED: In 2009, 44 less developed municipalities (14 in FBH, and 30 in RS) use participatory budgeting practices (PBP) systematically.
ACHIEVED: 75% increase in the FBH with 1,020,014 first examinations by FM doctors. In the RS 4,238,848 first and control examinations were made. 15% increase is believed to have been achieved although the health MIS does not differentiate between first and control visits. Importantly, the percentage of the population registered with upgraded FM teams increased from about 5% to about 58% of the population
ACHIEVED: Over 10% decrease in the number of referrals was achieved in the FBH in locations where FM model was introduced (1,204,566 referrals in 2009). The RS has measured the number of referrals and referral rate in the
Community Development Project(P070995) - closed on August 31, 2009.
AAA: From Stability to Performance: Local Governance and Service Delivery in Bosnia and Herzegovina
Health Sector Enhancement Project (088663) - closing on June 30, 2011. Additional financing of US$ 10 million was approved in FY11.
Health Sector Enhancement Project(P088663)
EC - EUR 5.5 million (out of EUR 22.6 million approved for five Bank financed operations under IPA 2010). Overall, interventions supporting the EU agenda in close partnership with the EC will be the strategic priority in the new CPS.
Additional financing approach is the right way to scale-up effective practices, in this case to scale up the family medicine model.
Primary health care reform is well grounded focusing on education and human resources. However, investments in human resources will not lead to optimal outcomes if not matched with appropriate heath care financing arrangements. Future HSEP

FY08-FY11 CPS Completion Report
65
Country Strategic Goals CPS Outcomes Supporting
Country Goals
Status and Evaluation Summary
Lending and Non-lending activities that contributed to the outcome
Lessons for the new CPS
FBH: 1,513,241 (2005)RS: tbd* Target: FBH: decrease by 10% (2010); RS: tbd*
* This indicator was dropped. The information systems do not distinguish between first and control visits. The team is currently finalizing the new result framework as a part of HSEP additional financing package. New key indicators will monitor the expansion of FM through population registered by FM teams, and enhancement of the FM model through improved quality of service delivery. New key indicator will be incorporated in the result matrix of the new CPS.
Increase in marketable horticultural produce in poor southern BH areas
Baseline: 5% of farm production is marketed (2003)Target: 30 % of farm production marketed (2011)
Small-scale market integrated commercial agriculture further developed. Improve access to credit for agribusiness/ agri-processing and small farmers -
fully operational FM health center of Laktasi. The number of referralshas increased to 47,673 (2009) but so has the population registered with the Health Center. Laktasi Health Center has maintained good referral rate of 7.1% upon first examination and 20.3% including follow-up visits to specialists.
ACHIEVED: In southern parts of BH, marketable surplus of milk has doubled, area under vineyards has doubled, and area under horticulture has increased by 25%. Combined livestock figures grew by 30%.
ACHIEVED: US$4.4 million in long-term loans was disbursed to agri-businesses in the target area. US$ 11.5 million was disbursed by partner microcredit organizations to small farmers. While portfolio at
Small Scale Commercial Agriculture Development Project (P055434) - closed on March 31,2010.
Small Scale Commercial Agriculture Development Project (P055434)
implementation (additional financing credit) will thus focus on performance based contracts in the FBH and on intensive policy dialogue with the Health Insurance Fund to ensure that adequate financing arrangements are developed to support the FM model.
Small pilot projects with limited regional impact could be important to demonstrate successful approaches that can be scaled-up nationally. However, limited financing available in the new CPS should be used strategically and small stand-alone projects should be avoided.
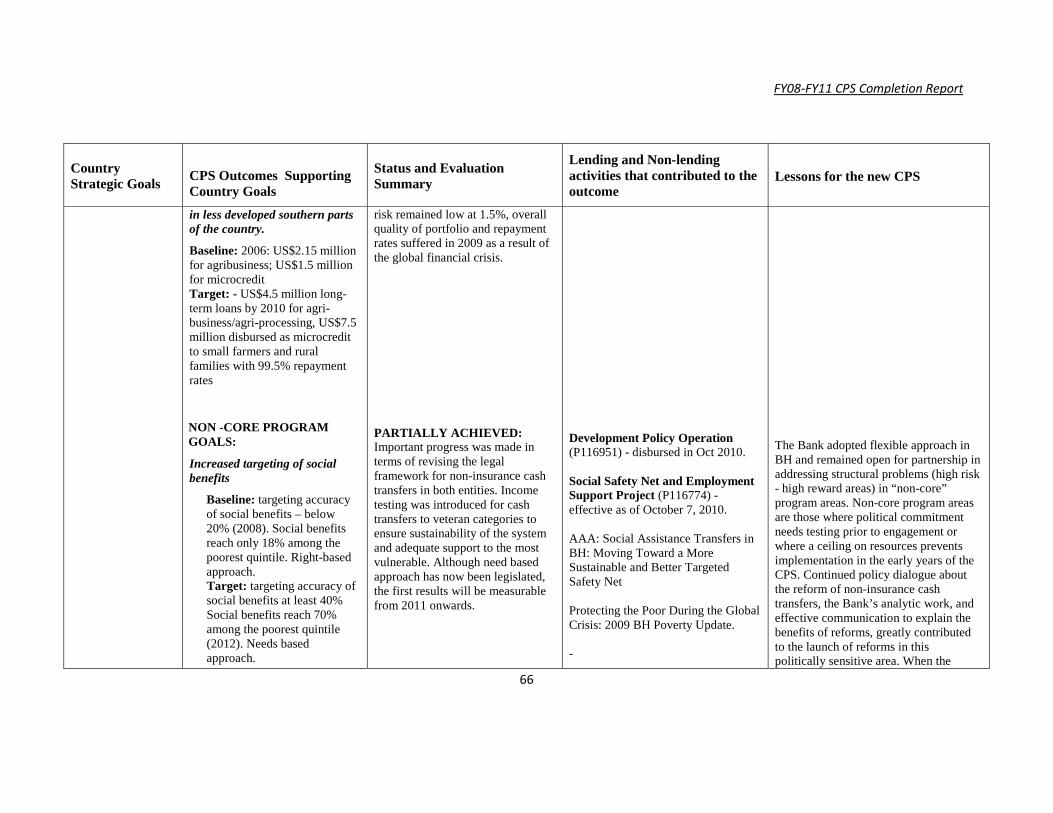
FY08-FY11 CPS Completion Report
66
Country Strategic Goals CPS Outcomes Supporting
Country Goals
Status and Evaluation Summary
Lending and Non-lending activities that contributed to the outcome
Lessons for the new CPS
in less developed southern parts of the country.
Baseline: 2006: US$2.15 million for agribusiness; US$1.5 million for microcreditTarget: - US$4.5 million long-term loans by 2010 for agri-business/agri-processing, US$7.5 million disbursed as microcredit to small farmers and rural families with 99.5% repayment rates
NON -CORE PROGRAM GOALS:
Increased targeting of social benefits
Baseline: targeting accuracy of social benefits – below 20% (2008). Social benefits reach only 18% among the poorest quintile. Right-based approach. Target: targeting accuracy of social benefits at least 40% Social benefits reach 70% among the poorest quintile (2012). Needs based approach.
risk remained low at 1.5%, overall quality of portfolio and repayment rates suffered in 2009 as a result of the global financial crisis.
PARTIALLY ACHIEVED: Important progress was made in terms of revising the legal framework for non-insurance cash transfers in both entities. Income testing was introduced for cash transfers to veteran categories to ensure sustainability of the system and adequate support to the most vulnerable. Although need based approach has now been legislated, the first results will be measurable from 2011 onwards.
Development Policy Operation(P116951) - disbursed in Oct 2010.
Social Safety Net and Employment Support Project (P116774) -effective as of October 7, 2010.
AAA: Social Assistance Transfers in BH: Moving Toward a More Sustainable and Better Targeted Safety Net
Protecting the Poor During the Global Crisis: 2009 BH Poverty Update.
-
The Bank adopted flexible approach in BH and remained open for partnership in addressing structural problems (high risk - high reward areas) in “non-core” program areas. Non-core program areas are those where political commitment needs testing prior to engagement or where a ceiling on resources prevents implementation in the early years of the CPS. Continued policy dialogue about the reform of non-insurance cash transfers, the Bank’s analytic work, and effective communication to explain the benefits of reforms, greatly contributed to the launch of reforms in this politically sensitive area. When the

FY08-FY11 CPS Completion Report
67
Country Strategic Goals CPS Outcomes Supporting
Country Goals
Status and Evaluation Summary
Lending and Non-lending activities that contributed to the outcome
Lessons for the new CPS
Reduce the burden of Government on the economy and strengthen fiscal coordination
Baseline: National Fiscal Council not established, and fiscal targets not well coordinated between different levels of government. Current expenditures equal to 41% of GDP (2007).Target: Fiscal Council established and functional. Sound fiscal framework maintained. The share of current expenditures in GDP lower by 2pp (2011).
Increase formal employment
Baseline: 687,445 employees (2007)Mid-term: 5% growth (2008)Target: 10.2% growth (2010)
PARTIALLY ACHIEVED: The state-level Fiscal Council Law was adopted in 2008 and the Fiscal Council (FC) was established. The FC agreed on the overall fiscal envelope for the state and the two entities for 2009 and 2010. These were an integral part of the Stand-by Agreement with the IMF and have largely been observed. However, given the October 2010 General Elections, the FC failed to adopt the overall fiscal envelope for 2011 as this decision was postponed for the incoming governments.
NOT ACHIEVED: Formal employment growth was positive up to 2008 was positive, but this trend was subsequently reversed in 2009 and 2010 as a result of impact of the global economic crisis on BH economy. 2008: 706,088 (2.7% growth compared to 2007)2009: 686,044 (-0.2% growth compared to 2007)2010: 681,332 (-0.9% growth compared to 2007)
global economic crisis made policy decisions to reform more urgent -commitment to reform was more evident. A DPO with realistic targets was designed in parallel with a capacity building operation (SSNESP) to support the reform efforts over the medium term. The main lesson is that important steps forward in reforms can be achieved also in a complex institutional environment such as the one in BH. However the Bank needs to be already engaged with analytical work and country dialogue to be effective. Also, reforms efforts in BH need to be supported over the medium term to build capacity and avoid policy reversals.

FY08-FY11 CPS Completion Report
68
Table 2: CPS Program FY08 - FY11 - Planned Lending Program and Actual Deliveries
MAXIMUM PLANNED LENDING ACTUAL LENDING
FY Project
Amounts (US$mil.)
Project
Amounts (US$mil.)
IDA IBRD GEF IDA IBRD GEF
FY08 Road Infrastructure and Safety 25 Road Infrastructure and Safety 25Solid Waste II 25 Solid Waste II - forwarded to FY09GEF Neretva and Trebisnjica Management 8 GEF Neretva and Trebisnjica Management 6GEF Forest and Prot. Areas (i) 4 GEF Forest and Mountain Protected Areas ) 3.4
Subtotal 25 25 12 Subtotal 25 9.4
FY09 Municipal Development 15 10 Municipal Development - forwarded to FY10 as Sarajevo Wastewater Management ProjectSava River Navigability - forwarded to FY12 15 25
Sava River Navigability 10 15
Subtotal 25 25 Subtotal 15 25
FY10 Pillar 1Investment ClimatePSDLand registration IIRegional Transport Corridor (Vc)Disaster ManagementPillar 2Public sector Admin. ReformSocial SectorsReadiness for IPA Accession FinancingRural/Agriculture
Subtotal
79
79
126
126
Sarajevo Wastewater Management ProjectSME Competitiveness and Access to CreditSocial Safety Net and Employment SupportPublic Expenditure Development Policy Operation
Subtotal
1566
81
3570
45
150
FY11 Health Sector Enhancement - Add. Financing
Subtotal
10
10
TOTAL 129 176 12 TOTAL 131 175 9.4
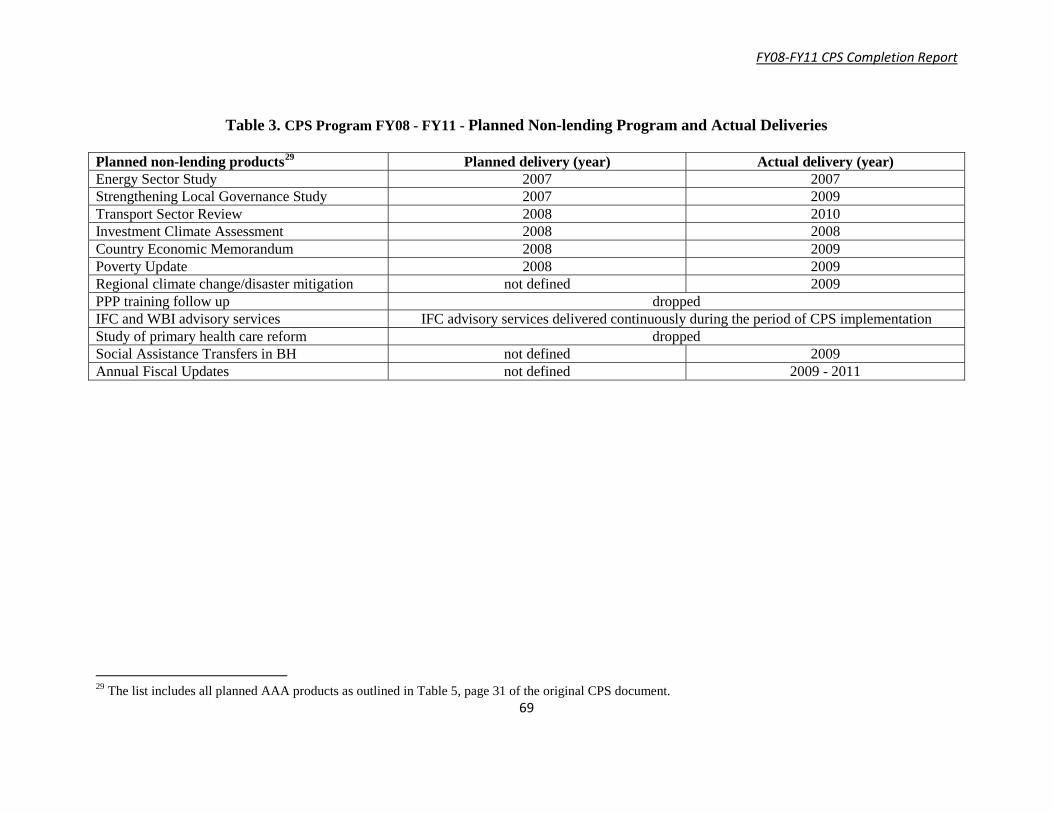
FY08-FY11 CPS Completion Report
69
Table 3. CPS Program FY08 - FY11 - Planned Non-lending Program and Actual Deliveries
Planned non-lending products29 Planned delivery (year) Actual delivery (year)Energy Sector Study 2007 2007Strengthening Local Governance Study 2007 2009Transport Sector Review 2008 2010Investment Climate Assessment 2008 2008Country Economic Memorandum 2008 2009Poverty Update 2008 2009Regional climate change/disaster mitigation not defined 2009PPP training follow up droppedIFC and WBI advisory services IFC advisory services delivered continuously during the period of CPS implementationStudy of primary health care reform droppedSocial Assistance Transfers in BH not defined 2009Annual Fiscal Updates not defined 2009 - 2011
29 The list includes all planned AAA products as outlined in Table 5, page 31 of the original CPS document.

70
Annex 3
:Active and Planned
Trust Funds in B
osnia and Herzegovina
AC
TIV
E T
RU
ST FU
ND
ST
F N
UM
BE
RT
RU
ST FU
ND
DO
NO
RC
LO
SING
FY
US$
000B
E/R
E*
TF090773A
griculture & R
ural Developm
entSID
AFY
126,036
RE
TF095054Integrated W
ater-Energy Developm
ent Study
Ministry of Foreign
Affairs of N
orway
FY12
416B
E
TF096591V
rbas Integrated Water -Energy Study
MD
TFFY
1295
BE
TF055265G
EF Water Q
uality ProtectionM
DTF
FY13
8,900R
E
TF091919G
EF Forest and Mountain Protected
Areas
MD
TFFY
133,400
RE
TF097617M
icrofinance Bosnia and H
erzegovina (IFC
)SEC
OFY
13800
BE
TF099516Strengthening C
onsumer Protection in
Banking and M
icrofinance Sectors M
TDF
FY13
239.95B
E
PLA
NN
ED
TR
UST
FUN
DS
TR
UST
FUN
DD
ON
OR
FY A
PPRO
VA
L
US$
000Sava R
iver Navigability (dem
ining, and feasibility study and design)
EU IPA
FY12
7,800.00
Solid Waste M
anagement II (Landfills in B
anja Luka, and M
ostar) EU
IPASigned w
ith EC
7,700.00
GEF W
ater Quality Protection (W
astewater treatm
ent -Zivinice)
EU IPA
FY12
2,100.00
GEF W
ater Quality Protection (W
astewater treatm
ent -M
ostar)-TF099534SID
AFY
12 3,500.00
Sarajevo Wastew
ater Project EU
IPAFY
12 11,200.00
GEF N
eretva and Trebisnjica (sewage system
-Ljubuski)
EU IPA
FY12
2,800.00
Business Environm
entSID
AFY
12 5,000.00
State and Peace Building Fund G
rant on Reform
ing V
eteran Benefits
MD
TFFY
12TB
D
Sarajevo Wastew
ater ProjectEU
IPA
2011-2013TB
D
Solid Waste M
anagement Project
EU IPA
2011-2013TB
D
Water Treatm
ent and Managem
entEU
IPA2011-2013
TBD
*BE: Bank Group Executed; RE: Recipient Executed

71
Annex 4: G
ender Assessm
ent
Com
parisons of selected indicators for which data are available for B
iH, the W
estern Balkans and
the EC
A region as a w
hole suggest that economic em
powerm
ent and political representation are tw
o major areas w
here wom
en achievements lag behind regional com
parators (Table 1).In term
s of labour m
arket indicators, wom
en’s performance partly reflects
structural problems of the country (high
unemploym
ent and low activity rates for both m
en and wom
en). The gap in labour market participation
between w
omen and m
en in Bosnia, how
ever, is more m
arked than in ECA
as a whole even if not as
pronounced as for other countries in the Western B
alkans. Other indicators such as the gender gap in life
expectancysuggest that w
omen are at least on par w
ith the region in terms of this sum
mary indicator of
life opportunity. In addition, fertility rates and the adolescent fertility rates suggest that wom
en have significantly m
ore control of their reproductive decisions than elsewhere in the region.
In terms of political representation
in Parliament, in 2007 (the year for w
hich comparative data w
as available) it w
as lower than both the W
estern Balkans and EC
A averages (14.3 percent) and
declined even further in 2008 w
hen wom
en constituted 10.5 percent of the delegates in the Parliament of BiH
(9.5 percent of representatives in the H
ouse of Representatives of B
iH and 13.3 percent in the H
ouse of Peoples of B
iH).
A decline w
as also seen between 2004 and 2008 in the participation of w
omen in the
Council of M
inisters in BiH
–from
10 percent to zero in 2008 at the ministerial level. R
epresentation at the level of deputy m
inistersstayed constant over the period (20 percent).30
Table 1. Selected gender Indicators: B
iH vs. W
estern Balkans vs. E
urope & C
entral Asia
(2007)
BiH
Western
Balkans
EC
AG
ender achievements
Adolescent fertility rate (births per 1,000 w
omen ages 15-19)
16.417.8
22.4Fertility rate, total (births per w
oman)
1.21.4
1.4Proportion of seats held by w
omen in national parliam
ents (%)
14.315.6
16.4L
abor force participation rate, female (%
of female population ages
15+)54.9
4750.7
Unem
ployment, fem
ale (% of fem
ale labor force)33
28.510.4
Unem
ployment, youth fem
ale (% of fem
ale labor force ages 15-24)66.3
5320.9
Gender gaps
Life expectancy advantage (fem
ale-male)
5.3-0.1
5.3R
atio of female to m
ale secondary enrolment
101.91.05
96.1L
abor force participation (female to m
ale ratio)80
7197
Source: Harttgen, K
., &K
lasen,S (2010) based on World D
evelopment indicators (2008)
Focusing on national data provides an opportunity to look more closely at other differences betw
een w
omen and m
en. Poverty data do not capture significant differences across genders given that these indicators are constructed on a household basis. R
estricting the focus on female versus m
ale headed 30
Agency for Statistics of B
iH. (2009). W
omen and M
en in Bosnia and Herzegovina, Them
atic Bulletin N
o. 03. Sarajevo.

72
households shows that, as it is often the case, fem
ale headed households are not poorer than male headed
ones.
Looking at differentaccess to factors of production shows how
ever a more interesting story. A
s far as labour m
arket performance is concerned, the LFS 2010 show
s that the relative equality between m
en and w
omen in term
s of labour market participation is really the result of a
low participation rates for both
sexes (57 percent for men and 33 percent for w
omen). 31
Disaggregating
by age cohort shows that the age
profile of the employm
ent rate for wom
en and men is quite sim
ilar so that, with the exception of w
orkers 65+ and older, w
omen’s em
ployment rate is alw
ays around 55-60 percent of men’s. Further, w
hile unem
ployment rates of different age groups are quite sim
ilar across gender, for young workers (15-24)
they are significantly higher for wom
en than for men (68 percent vs. 59 percent). In line w
ith these findings recent w
ork by Hartgen and K
lasen (2010) contrasting the levels of the unemploym
ent rate as w
ell as the ratio of the unemploym
ent rate between m
en and wom
en disaggregating by welfare group,
area of residence and genderof the household head using MIC
S data concluded that “the critical gender issue in B
osnia appears to be linked to low labor force participation and high unem
ployment for w
omen,
particularly poorer wom
en”.
The quality of jobs held by wom
en and men is also another im
portant dimension of the gender
disadvantage in Bosnia. C
ertainly there is a perception that “wom
en suffer discrimination in the
workplace -receiving low
er salaries than men for the sam
e type of work and earning
promotions far less
frequently”32. B
ut also in terms of type of jobs that w
omen can access in the first place there are
differences between w
omen and m
en. While roughly ¾
of wom
en and men w
orkers are employees, m
en are m
ore likely to be in self-employm
ent than wom
en and almost none of them
(against 11 percent of w
omen) w
orks in unpaid employm
ent. Looking more closely at segm
ents of the labour markets w
hich are typically sources of good jobs, such as the civil service and large firm
s, shows how
ever that there is a lot of heterogeneity across w
omen. In the civil service w
omen’s representation appears to be alm
ost equal to m
en’s (48 percent in 2008). 33
Gaps in education are im
portant determinants of w
omen’s perform
ance in the labour market, as w
ell as of the heterogeneity betw
een different groups of wom
en workers. W
hile 59% of m
en of working age have
completed secondary education, only 40 percent of w
omen are in a sim
ilar position. For tertiary education the gaps are m
uch more contained (9 versus 7.4 percent). N
ote however that w
hile the unemploym
ent rate of those w
ith primary education exhibits
a less than 1 percentage point gap, for secondary education it is m
uch higher for wom
en than for men (36 versus 29 percent).
Similarly, evidence from
the Business Enterprise Surveys (B
EEPS), show
s that Bosnia does not lag behind the EC
A average according to indicators typically used to assess
the extent of female participation in large firm
s (firms w
ith female participation in ow
nership, percentageof full tim
e female w
orkers), though it scores below average in term
s of firms w
ith female top m
anager.
If differences in the labour market perform
ance for men and w
omen can be w
ell documented, there is at
least some evidence on differences in access to other factors of production. A
nalysis from the B
EEPS 2009 suggests significant differences in the perceived access to credit in firm
s depending on the gender of the ow
ner and top managem
ent. The Bosnian data show
a large gender gap in the percentage of firms
which consider access to credit a serious obstacle (45 percent for firm
s where the top m
anager and the
31N
ote that these data result in a lower ratio of w
omen to m
en participation rates than those reported in the WD
I. the tw
o are not directly comparable as the W
DI indicators have been standardized for international com
parisons, unlike the LFS 2010 ones.
32 Bosnia background study for A
ssessing Land Adm
inistration Project’s Gender Im
pacts in the Western B
alkans 33W
omen and m
en in Bosnia, B
HA
S, 2009
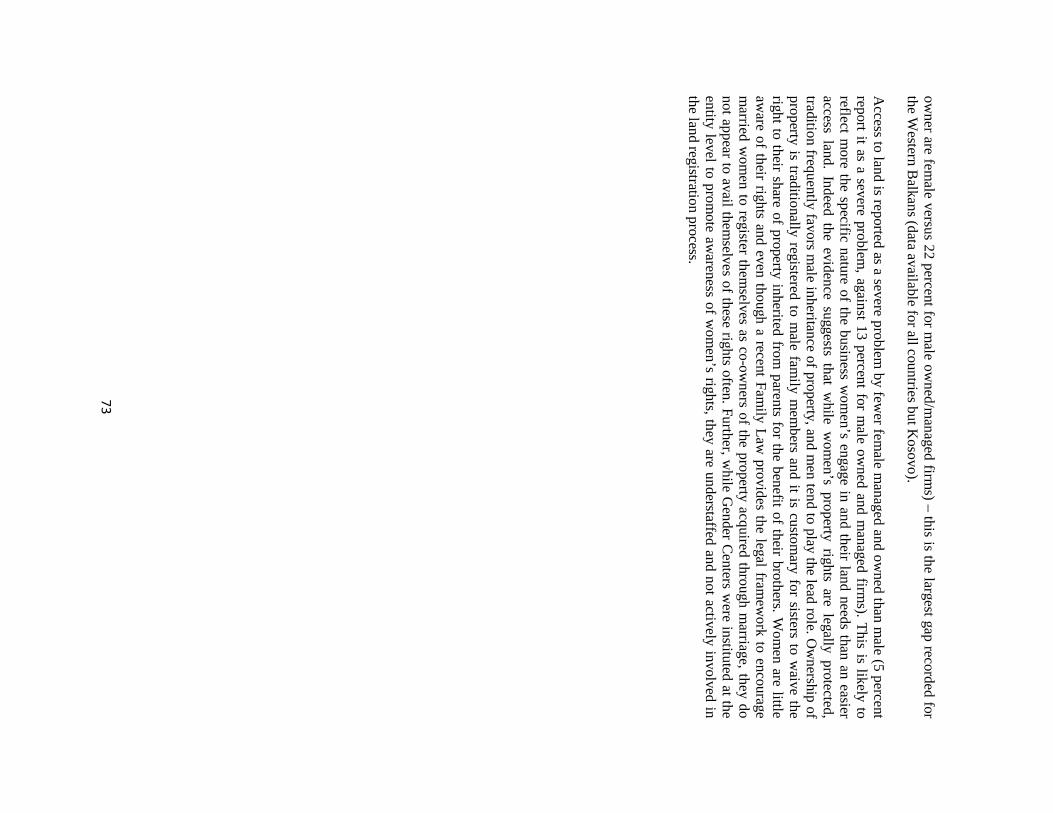
73
owner are fem
ale versus 22 percent for male ow
ned/managed firm
s) –this is the largest gap recorded for
the Western B
alkans (data available for all countries but Kosovo).
Access to land is reported as a severe problem
by fewer fem
ale managed and ow
ned than male (5 percent
report it as a severe problem, against 13 percent for m
ale owned and m
anaged firms). This is likely to
reflect more the specific nature of the business w
omen’s engage in and their land needs than an easier
access land. Indeed the evidence suggests that while w
omen’s property rights are legally protected,
tradition frequently favors male inheritance of property, and m
en tend to play the lead role. Ow
nership of property is traditionally registered to m
ale family m
embers and it is custom
ary for sisters to waive the
right to their share of property inherited from parents for the benefit of their brothers. W
omen are little
aware of their rights and even though a recent Fam
ily Lawprovides the legal fram
ework to encourage
married w
omen to register them
selves as co-owners of the property acquired through m
arriage, they do not appear to avail them
selves of these rights often. Further, while G
ender Centers w
ere instituted at the entity level to prom
ote awareness of w
omen’s rights, they are understaffed and not actively involved in
the land registration process.

74
Annex 5: Progress T
owards M
DG
s
Goal/Target/Indicator
Baseline 2000/
2001 2007
2009 or latest
available data
2015 Targets M
DG
s
Progress tow
ards 2015
Targets
Targets as in
PRSP D
ata Achieved
MD
G 1: To eradicate extrem
e poverty and hunger
1.1.Percentage of population living bellow
absolute poverty line 19.1
16 14
14.0 (2007) 9
Likely
1.8. U
nemploym
ent rate in %
ILOdefinitio
22.9
22 29
24.1 (2009); 29.9 (2010)
22 U
nlikely
Registered
43.4
30 44.1
42.7 30
Unlikely
1.12. Unem
ploymentrate of the 15-
24age group -%
34.8 (A
ge group 19-24) 30
58.4 47.5
12 U
nlikely
MD
G 2: To achieve universal prim
ary education
2.1. Primary school net enrolm
entrate in %
b1) 97 b2) 95
b3) 92.8 b4) 98.9
95 98.4 (2005/6)
98.3 (m) 98.6 (f)
96 100
Potentially /Likely
2.4.Secondary school enrolmentrate %
b1) 56.8 b2) 72.6 b3) 68.3
75 79.3 (2005/06)
77.9 (m) 81.1 (f)
77 85
Potentially
2.5.Higher education enrolm
entrate b1) 19.8 b2) 24.2 b3) 23.0
25 d1) 25 (2004) d2)
33.5 (2007) e1) 34
(2008) e2) 50 (2009)
35 Likely
MD
G 3: To prom
ote gender equality and empow
er wom
en
3.3. Share of w
omen in w
age em
ploymentin the non-agricultural
sector %
39.2 40
33.8 34.9
45 U
nlikely
3.4. Percentage of wom
en representatives in Parliam
entof BiH
14.3 16
10.5 (2008) 10.5 (2008)
25 Potentially
MD
G 4: To reduce child m
ortality
4.1. U
nder-five mortality rate, per 1000
live births b1) 17
b2) 10.3 b3) 11.2
9.3 d1) 14 d2) 7.9
15 (2008) 7
Potentially
4.2. Infantmortality (under one year of
age) per 1000 live births b1) 14
b2) 8.5 b3) 7.6
7 d1)13 d2)6.6
e1)12,7 e2)6.9 (2008)
5 Likely
MD
G 5: To im
prove maternal health
5.1. Maternal deaths (per 100,000 live
births) 5.2. Percentage of assistedchildbirths (%
) 5.3. Contraception prevalence rate
5.05 b1) 99 b2) 99.6 49 (2001)
4.0 100 55 3(2006) 1(2007) 99.5 35.7 (2006)
1(2007) 99.9 35.7
(2006)
2.5 100.0 65
Achieved
Achieved
Potentially
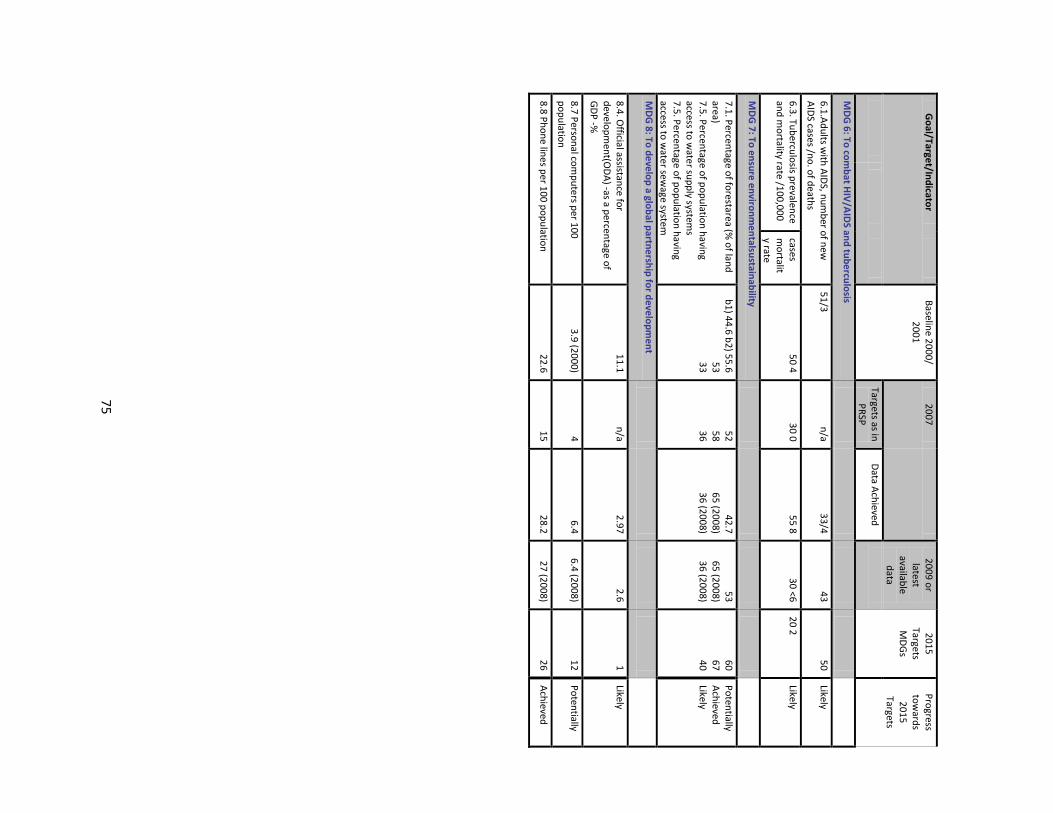
75
Goal/Target/Indicator
Baseline 2000/
2001 2007
2009 or latest
available data
2015 Targets M
DG
s
Progress tow
ards 2015
Targets
Targets as in
PRSP D
ata Achieved
MD
G 6: To com
bat HIV
/AID
S and tuberculosis
6.1.Adults w
ith AID
S, number of new
A
IDS cases /no. of deaths
51/3 n/a
33/4 43
50 Likely
6.3. Tuberculosis prevalence and m
ortality rate /100,000 cases m
ortality rate
50 4 30 0
55 8 30 <6
20 2 Likely
MD
G 7: To ensure environm
entalsustainability
7.1. Percentage of forestarea (% of land
area) 7.5. Percentage of population having access to w
ater supply systems
7.5. Percentage of population having access to w
ater sewage system
b1) 44.6 b2) 55.6 53 33
52 58 36
42.7 65 (2008) 36 (2008)
53 65 (2008) 36 (2008)
60 67 40
Potentially A
chieved Likely
MD
G 8: To develop a global partnership for developm
ent
8.4. Official assistance for
development(O
DA
) -as a percentage of G
DP -%
11.1 n/a
2.97 2.6
1 Likely
8.7 Personal computers per 100
population 3.9 (2000)
4 6.4
6.4 (2008) 12
Potentially
8.8 Phone lines per 100 population 22.6
15 28.2
27 (2008) 26
Achieved

76
Annex A
2: Bosnia and H
erzegovina at a Glance
Bo
snia
Eu
rop
e &
Up
pe
rKK
ey D
eve
lop
me
nt In
dica
tors
an
dC
en
tral
mid
dle
He
rzeg
ovin
aA
siain
com
e(2009)
Po
pu
latio
n, m
id-ye
ar (m
illion
s)3
.84
03
99
3S
urfa
ce a
rea
(tho
usa
nd
sq. km
)51
23
,54
94
8,6
59
Po
pu
latio
n g
row
th (%
)-0
.20
.30
.9U
rba
n p
op
ula
tion
(% o
f tota
l po
pu
latio
n)
48
64
75
GN
I (Atla
s me
tho
d, U
S$
billio
ns)
17
.72
,77
27
,36
3G
NI p
er ca
pita
(Atla
s me
tho
d, U
S$
)4
,70
06
,88
07
,41
5G
NI p
er ca
pita
(PP
P, in
tern
atio
na
l $)
8,6
80
13
,29
71
2,8
00
GD
P g
row
th (%
)-2
.94
.04
.1G
DP
pe
r cap
ita g
row
th (%
)-2
.73
.63
.2
(most recent estim
ate, 2003–2008)
Po
verty h
ea
dco
un
t ratio
at $
1.2
5 a
da
y (PP
P, %
)<
24
..P
ove
rty he
ad
cou
nt ra
tio a
t $2
.00
a d
ay (P
PP
, %)
<2
9..
Life
exp
ecta
ncy a
t birth
(yea
rs)7
56
97
1In
fan
t mo
rtality (p
er 1
,00
0 live
birth
s)1
32
02
0C
hild
ma
lnu
trition
(% o
f child
ren
un
de
r 5)
2..
..
Ad
ult lite
racy, m
ale
(% o
f ag
es 1
5 a
nd
old
er)
99
99
95
Ad
ult lite
racy, fe
ma
le (%
of a
ge
s 15
an
d o
lde
r)9
69
79
2G
ross p
rima
ry en
rollm
en
t, ma
le (%
of a
ge
gro
up
)1
09
10
01
11
Gro
ss prim
ary e
nro
llme
nt, fe
ma
le (%
of a
ge
gro
up
)1
10
98
11
0
Acce
ss to a
n im
pro
ved
wa
ter so
urce
(% o
f po
pu
latio
n)
99
95
95
Acce
ss to im
pro
ved
san
itatio
n fa
cilities (%
of p
op
ula
tion
)9
58
98
4
Ne
t Aid
Flo
ws
19
80
19
90
20
00
20
09
a
(US
$ millions)
Ne
t OD
A a
nd
officia
l aid
..10
73
74
82
Top 3 donors (in 2007):
Eu
rop
ea
n C
om
missio
n..
01
96
10
5 G
erm
an
y..
09
24
7 S
pa
in..
03
54
2
Aid
(% o
f GN
I)..
..1
2.1
2.5
Aid
pe
r cap
ita (U
S$
)..
21
99
12
8
LLo
ng
-Te
rm E
con
om
ic Tre
nd
s
Co
nsu
me
r price
s (an
nu
al %
cha
ng
e)
....
5.0
0.0
GD
P im
plicit d
efla
tor (a
nn
ua
l % ch
an
ge
)..
..2
8.8
0.0
Exch
an
ge
rate
(an
nu
al a
vera
ge
, loca
l pe
r US
$)
....
2.1
1.4
Te
rms o
f trad
e in
de
x (20
00
= 1
00
)..
....
..1 1
98
0–
90
119
90
–2
00
022
00
0–
09
Po
pu
latio
n, m
id-ye
ar (m
illion
s)3
.94
.33
.73
.81
.0-1
.50
.2G
DP
(US
$ m
illion
s)..
..5
,50
61
7,0
42
..28.5
5.0
Ag
ricultu
re..
..1
0.6
8.0
..5.1
4.9
Ind
ustry
....
23
.02
8.1
..22.8
6.8
Ma
nu
factu
ring
....
10
.11
2.9
..9.0
7.6
Se
rvices
....
66
.46
3.9
..34.1
4.4
Ho
use
ho
ld fin
al co
nsu
mp
tion
exp
en
ditu
re..
..1
03
.57
9.6
....
..G
en
era
l go
v't fina
l con
sum
ptio
n e
xpe
nd
iture
....
24
.52
2.9
....
..G
ross ca
pita
l form
atio
n
....
20
.62
2.1
..21.7
5.3
Exp
orts o
f go
od
s an
d se
rvices
....
28
.73
3.4
..41.8
9.0
Imp
orts o
f go
od
s an
d se
rvices
....
75
.55
8.0
..21.5
2.6
Gro
ss savin
gs
....
13
.41
7.1
No
te: F
igu
res in
italics a
re fo
r yea
rs oth
er th
an
tho
se sp
ecifie
d. 2
00
9 d
ata
are
pre
limin
ary. .. in
dica
tes d
ata
are
no
t ava
ilab
le.
a. A
id d
ata
are
for 2
00
8.
De
velo
pm
en
t Eco
no
mics, D
eve
lop
me
nt D
ata
Gro
up
(DE
CD
G).
(average annual growth %
)
(% of G
DP
)
64
20
24
6
0-4
15
-19
30
-34
45
-49
60
-64
75
-79
percent of total population
Ag
e distrib
utio
n, 2009
Male
Fem
ale
0 10
20
30
40
50
60
19
90
19
95
20
00
20
08
Bo
sn
ia a
nd
He
rzeg
ov
ina
Eu
rop
e &
Ce
ntra
l As
ia
Un
der-5 m
ortality rate (p
er 1,000)
0 20
40
60
80
10
0
95
05
GD
PG
DP
pe
r ca
pita
Gro
wth
of G
DP
and
GD
P p
er capita (%
)

77
BBalance of P
ayments and T
rade2000
2009
(US
$ millions)
Total m
erchandise exports (fob)1,130
4,254T
otal merchandise im
ports (cif)4,166
9,862N
et trade in goods and services-2,577
-4,028
Current account balance
-396-1,346
as a % of G
DP
-7.2-7.9
Workers' rem
ittances and com
pensation of employees (receipts)
1,6072,081
Reserves, including gold
4866,269
CCentral G
overnment F
inance
(% of G
DP
)C
urrent revenue (including grants)39.0
42.7 T
ax revenue21.1
37.0C
urrent expenditure42.8
43.6T T
echnology and Infrastructure2000
2008O
verall surplus/deficit-5.8
-6.6P
aved roads (% of total)
52.352.3
Highest m
arginal tax rate (%)
Fixed line and m
obile phone Individual
....
subscribers (per 100 people)24
112 C
orporate..
10H
igh technology exports (%
of manufactured exports)
..3.9
EExternal D
ebt and Resource F
lows
Environm
ent(U
S$ m
illions)T
otal debt outstanding and disbursed2,773
9,583A
gricultural land (% of land area)
4242
Total debt service
318646
Forest area (%
of land area)42.7
42.7D
ebt relief (HIP
C, M
DR
I)–
–T
errestrial protected areas (% of surface area)
..0.8
Total debt (%
of GD
P)
50.456.2
Freshw
ater resources per capita (cu. meters)
9,4019,409
Total debt service (%
of exports)9.9
6.9F
reshwater w
ithdrawal (billion cubic m
eters)..
..
Foreign direct investm
ent (net inflows)
146235
CO
2 emissions per capita (m
t)6.1
7.7P
ortfolio equity (net inflows)
00
GD
P per unit of energy use
(2005 PP
P $ per kg of oil equivalent)
4.34.8
Energy use per capita (kg of oil equivalent)
1,1801,483
World B
ank Group portfolio
20002009
(US
$ millions)
IBR
D T
otal debt outstanding and disbursed562
417 D
isbursements
00
Principal repaym
ents0
25 Interest paym
ents33
17
IDA
Total debt outstanding and disbursed
3981,102
Disbursem
ents44
33P
rivate Sector D
evelopment
20002009
Total debt service
323
Tim
e required to start a business (days)–
60 IF
C (fiscal year)
Cost to start a business (%
of GN
I per capita)–
15.8 T
otal disbursed and outstanding portfolio30
139T
ime required to register property (days)
–84
of which IF
C ow
n account30
139 D
isbursements for IF
C ow
n account5
35R
anked as a major constraint to business
220002009
Portfolio sales, prepaym
ents and (%
of managers surveyed w
ho agreed) repaym
ents for IFC
own account
115
Access to/cost of financing
..34.9
Econom
ic and regulatory policy uncertainty..
33.3 M
IGA
Gross exposure
21127
Stock m
arket capitalization (% of G
DP
)..
.. N
ew guarantees
2126
Bank capital to asset ratio (%
)20.1
13.1
Note: F
igures in italics are for years other than those specified. 2009 data are preliminary.
2/25/11.. indicates data are not available. – indicates observation is not applicable.
Developm
ent Econom
ics, Developm
ent Data G
roup (DE
CD
G).
025
5075
100
Control of corruption
Rule of law
Reg
ulatory quality
Political stability
Voice and accountability
Country's percentile rank (0-100)higher values im
ply better ratings2009
2000
Go
vernan
ce ind
icators, 2000 an
d 2009
Source: K
aufmann-K
raay-Mastruzzi, W
orld Bank
IBR
D, 417
IDA
, 1,102
IMF, 286
Other m
ulti-lateral, 678
Bilateral, 845
Private, 4,578
Short-term
, 1,677
Co
mp
ositio
n o
f total extern
al deb
t, 2009
US
$ millions

78
Mille
nniu
m D
eve
lopm
ent G
oals
With selected targets to achieve b
etween 1990 and 2015
(estimate closest to date show
n, +/- 2 years)
GGoal 1:
halve the rates for extreme poverty and m
alnutrition1990
19952000
2008 P
overty headcount ratio at $1.25 a day (PP
P, %
of population)..
..<2
<2 P
overty headcount ratio at national poverty line (% of population)
....
19.5..
Share of incom
e or consumption to the poorest qunitile (%
)..
..9.1
6.7 P
revalence of malnutrition (%
of children under 5)..
..4.2
1.6
GGoal 2:
ensure that children are able to complete prim
ary schooling P
rimary school enrollm
ent (net, %)
....
....
Prim
ary completion rate (%
of relevant age group)..
....
.. S
econdary school enrollment (gross, %
)..
....
90 Y
outh literacy rate (% of people ages 15-24)
....
10099
GGoal 3:
eliminate gender disparity in education and em
power w
omen
Ratio of girls to boys in prim
ary and secondary education (%)
....
..102
Wom
en employed in the nonagricultural sector (%
of nonagricultural employm
ent)..
....
35 P
roportion of seats held by wom
en in national parliament (%
)..
..29
12
GGoal 4:
reduce under-5 mortality by tw
o-thirds U
nder-5 mortality rate (per 1,000)
2321
1715
Infant mortality rate (per 1,000 live births)
2119
1413
Measles im
munization (proportion of one-year olds im
munized, %
)52
5380
84
GGoal 5:
reduce maternal m
ortality by three-fourths M
aternal mortality ratio (m
odeled estimate, per 100,000 live births)
1815
119
Births attended by skilled health staff (%
of total)97
..100
100 C
ontraceptive prevalence (% of w
omen ages 15-49)
....
4836
GGoal 6:
halt and begin to reverse the spread of HIV
/AID
S and other m
ajor diseases P
revalence of HIV
(% of population ages 15-49)
....
..0.1
Incidence of tuberculosis (per 100,000 people)94
8463
51 T
uberculosis case detection rate (%, all form
s)100
76110
90
GGoal 7:
halve the proportion of people without sustainable access to basic needs
Access to an im
proved water source (%
of population)..
9797
99 A
ccess to improved sanitation facilities (%
of population)..
9595
95 F
orest area (% of total land area)
43.142.9
42.742.7
Terrestrial protected areas (%
of surface area)..
....
0.8 C
O2 em
issions (metric tons per capita)
1.61.3
6.17.7
GD
P per unit of energy use (constant 2005 P
PP
$ per kg of oil equivalent)..
3.64.3
4.8
GGoal 8:
develop a global partnership for development
Telephone m
ainlines (per 100 people)15.3
7.121.1
27.3 M
obile phone subscribers (per 100 people)0.0
0.02.5
84.3 Internet users (per 100 people)
0.00.0
1.134.7
Personal com
puters (per 100 people)..
..3.8
6.4
Note: F
igures in italics are for years other than those specified. .. indicates data are not available.2/25/11
Developm
ent Econom
ics, Developm
ent Data G
roup (DE
CD
G).
BBosnia and H
erzegovina
0 25 50 75
100
125
20002002
20042006
2008
Prim
ary net enrollment ratio (..)
Ratio of girls to boys in prim
ary & secondary
education
Ed
ucatio
n in
dicato
rs (%)
0 20 40 60 80
100
120
20002002
20042006
2008
Fixed + mobile subscribers
Internet users
ICT
ind
icators (p
er 100 peo
ple)
0 25 50 75
100
19901995
20002008
Bosnia and H
erzegovina
Europe &
Central A
sia
Measles im
mu
nizatio
n (%
of 1-year
old
s)
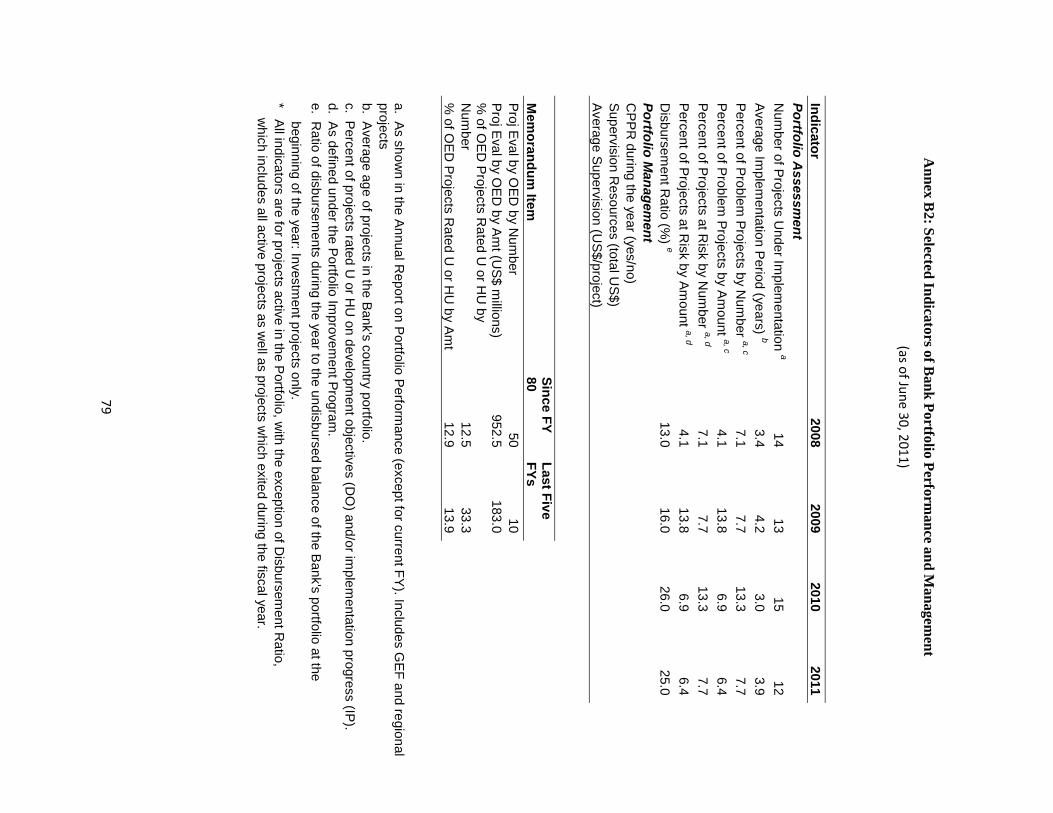
79
Annex B
2: Selected Indicators of Bank Portfolio Perform
ance and Managem
ent
(as of June 30, 2011)
Indicator2008
20092010
2011Portfolio A
ssessment
Num
ber of Projects Under Im
plementation a
1413
1512
Average Implem
entation Period (years) b
3.44.2
3.03.9
Percent of Problem Projects by N
umber a, c
7.17.7
13.37.7
Percent of Problem Projects by Am
ount a, c4.1
13.86.9
6.4Percent of Projects at R
isk by Num
ber a, d7.1
7.713.3
7.7Percent of Projects at R
isk by Amount a, d
4.113.8
6.96.4
Disbursem
ent Ratio (%
) e13.0
16.026.0
25.0Portfolio M
anagement
CPP
R during the year (yes/no)
Supervision Resources (total U
S$)Average Supervision (U
S$/project)
Mem
orandum Item
Since FY 80
Last Five FYs
Proj Eval by O
ED by N
umber
5010
Proj Eval by O
ED by Am
t (US$ m
illions)952.5
183.0%
of OED
Projects R
ated U or H
U by
Num
ber12.5
33.3%
of OED
Projects R
ated U or H
U by A
mt
12.913.9
a. As shown in the Annual R
eport onPortfolio Perform
ance (except for current FY).Includes G
EF and regional projectsb. A
verage age of projects in the Bank's country portfolio.c. Percent of projects rated U
or HU
on development objectives (D
O) and/or im
plementation progress (IP).
d. As defined under the Portfolio Improvem
ent Program.
e. Ratio of disbursem
ents during the year to the undisbursed balance of the Bank's portfolio at the
beginning of the year: Investment projects only.
* All indicators are for projects active in the P
ortfolio, with the exception of D
isbursement R
atio,w
hich includes all active projects as well as projects w
hich exited during the fiscal year.
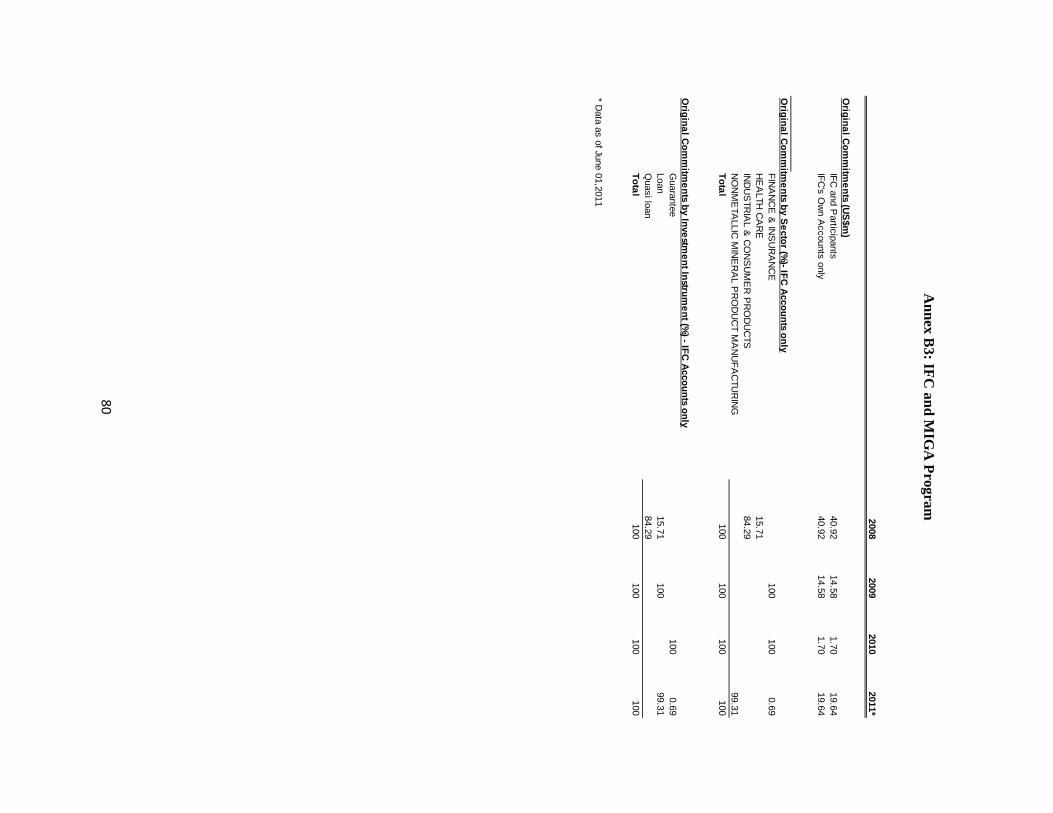
80
Annex B
3: IFC and M
IGA
Program
20082009
20102011*
Original C
omm
itments (U
S$m
)IFC
and Participants
40.9214.58
1.7019.64
IFC's O
wn A
ccounts only40.92
14.581.70
19.64
Original C
omm
itments by S
ector (%)- IFC
Accounts only
FINA
NC
E &
INS
UR
AN
CE
100100
0.69H
EA
LTH C
AR
E15.71
IND
US
TRIA
L & C
ON
SU
ME
R P
RO
DU
CTS
84.29N
ON
ME
TALLIC
MIN
ER
AL P
RO
DU
CT M
AN
UFA
CTU
RIN
G99.31
Total100
100100
100
Original C
omm
itments by Investm
ent Instrument (%
) - IFC A
ccounts onlyG
uarantee100
0.69Loan
15.71100
99.31Q
uasi loan84.29
Total100
100100
100
* Data as of June 01,2011

81
Annex B
3: Indicative IBR
D/ID
A/G
EF
LendingProgram
by FY
(as of June 30, 2011)
Fiscal yearP
roj IDU
S$(M
)S
trategic Rew
ards b (H
/M/L)
Implem
entation b R
isks (H/M
/L)
2012B
osnia DP
O2
100.0H
MIrrigation D
evelopment P
roject40.0
HL
Disaster M
anagement C
RIF
5.0H
LR
esult145.0
2013B
osnia DP
O3*
100.0H
HLand R
egistrationII
30.0H
LS
ava Waterw
ay Rehabilitation P
roject31.0
HL
Result
161.0
2014-2015S
ector Investment O
perations**42.0
Regional Flood C
ontrol GE
F**
Result
42.0
Overall R
esult348.0
The 3rdD
PO is presented here as the last in the program
matic series, but w
ill depend on the availability of IBR
D financing, along w
ith sustained sound m
acroeconomic fram
ework.
The Num
ber and volume of investm
ent operations in FY14 and FY
15 will be revisited in C
PS Progress Report and w
ill depend on the progress in consolidating the portfolio as w
ell as IBR
D financing capacity.

82
Annex B
4: Summ
ary of Non-L
ending Services
Product
Com
pletion FYA
udiencea
Objective
b
Recent com
pletionsAnnual Fiscal U
pdatesFY11
G,B
KG, P
SPolicy R
oundtablesFY11
G,B
KG, P
STransport Sector R
eviewFY11
G,B
KG, P
S
Underw
ayVrbas Integrated W
ater Sector Study
FY11K,D
,BKG
,PS
Western Balkans R
EPAR
ISFY11-14
G,B
KG, P
SW
estern Balkans Programm
atic Financial S
ector Dev
FY11-14
G,D
,BK
G, P
SW
B Public Financial Managem
entFY11-14
G,D
,BKG
, PS
Pension TAFY12
G,B
KG, P
SPublic Expenditure R
eviewFY12
G,B,PD
KG,PD
,PS
PlannedPEFA
FY12-13G
,B,PDKG
,PD,P
SEducation
FY13G
,BKG
, PS
WB Program
matic G
ender M
onitoringFY
13-15G
,BK
G, P
SW
B Programm
atic Poverty Assessm
entFY13-15
G,B
KG, P
S
Energy StrategyFY14
G,B
KG, P
SO
n demand
FY13-15
TBD
TBD
____________a. G
overnment, donor, B
ank, public dissemination.
b. Know
ledge generation, public debate, problem-solving.