
*Anne Mather and Martin Stokes
31
University of Plymouth PEARL https://pearl.plymouth.ac.uk 01 University of Plymouth Research Outputs University of Plymouth Research Outputs 2016-08-30 Extracting palaeoflood data from coarse-grained Pleistocene river terrace archives: an example from SE Spain Mather, A http://hdl.handle.net/10026.1/6672 10.1002/esp.4001 Earth Surface Processes and Landforms Wiley All content in PEARL is protected by copyright law. Author manuscripts are made available in accordance with publisher policies. Please cite only the published version using the details provided on the item record or document. In the absence of an open licence (e.g. Creative Commons), permissions for further reuse of content should be sought from the publisher or author.
Transcript of *Anne Mather and Martin Stokes

University of Plymouth
PEARL https://pearl.plymouth.ac.uk
01 University of Plymouth Research Outputs University of Plymouth Research Outputs
2016-08-30
Extracting palaeoflood data from
coarse-grained Pleistocene river terrace
archives: an example from SE Spain
Mather, A
http://hdl.handle.net/10026.1/6672
10.1002/esp.4001
Earth Surface Processes and Landforms
Wiley
All content in PEARL is protected by copyright law. Author manuscripts are made available in accordance with
publisher policies. Please cite only the published version using the details provided on the item record or
document. In the absence of an open licence (e.g. Creative Commons), permissions for further reuse of content
should be sought from the publisher or author.
This is an accepted manuscript of an article published by Wiley in Earth Surface
Processes and Landforms available at: 10.1002/esp.4001 *Anne Mather and Martin Stokes School of geography, Earth and Environmental Sciences, Plymouth University, Drake Circus, Plymouth, PL4 8AA *[email protected] Abstract Field based palaeoflood event reconstruction has the potential to contribute to the development of our understanding of longterm landscape evolution. However the reconstruction of past flow event histories (magnitude and frequency) over long-term (Quaternary) timescales is fraught with difficulties. Here we make a preliminary exploration of some of the practicalities of flood reconstruction from fluvial terrace archives using commonly available sedimentological and geomorphological observations from a field perspective. We utilize Manning and palaeostage indicators to reconstruct historic events that can be used as benchmarks for a lesser used competence based approach (Clarke 1996), which is applied to coarse-grained strath terrace deposits. We evaluate the results against gauged records for extreme and catastrophic events that affected the same region in 1973 and 2012. The findings suggest that the competence approach is most effectively applied to terrace deposits if the channel geometry is taken into account when sampling both in cross section and in longitudinal section and calibrated against the sedimentology for palaeo-flow depth. Problems can arise where constrictive channel geometries allow boulder jams to develop, acting as sediment traps for the coarsest material and leading to downstream ‘boulder starvation’. Useful sites to target for palaeoflood reconstruction, therefore, would be upstream of such constrictive reaches where the coarsest transportable bedload has been effectively trapped. Sites to avoid would be downflow, where the deposited material would poorly represent palaeoflood competence. Underestimation from maximum boulder preservation and limited section exposure issues would appear to outweigh possible overestimation concerns related to fluid density and unsteady flow characteristics such as instantaneous acceleration forces. Flood data derived from river terrace deposits suggests that basal terrace geometries and coarse boulder lags common to many terrace sequences are likely the result of extreme flow events which are subsequently filled by lesser magnitude flood events, in this environmental setting.
Introduction There is a need to extend our knowledge of flood magnitude and frequency over longer (104-105 year) time scales than is hitherto common (historical to Holocene, Fig. 1). Reasons for this include: 1) flood hazard – where engineering and land use planning together with public response to local flooding would benefit from better informed strategies to increase resilience of communities to flood events; 2) climate change - to better inform our knowledge of flooding response to climate change and thus enhance future flood predictions and 3) to assist in the calibration and critical testing of numerical Landscape Evolution Models (LEMs) which can be used to explore past and future response of landscapes to environmental change at appropriate scales. One of the challenges is to understand the higher magnitude, lower frequency events that occur beyond the human record. Recent research initiatives have attempted to address this challenge by applying meta-analysis (Jones et al., 2015) to large databases of better dated (typically using 14C and Optically Stimulated Luminescence techniques) flood deposits at catchment scale and beyond (e.g. Benito et al., 2015). However these databases are mainly restricted to Holocene sequences associated with slack water, flood plain, delta plain and lake deposits. Thus, whilst progress is being made, what is clearly still lacking are the longer timescale, quantitative, more continuous, catchment scale data (Martin & Church 2004; Briant et al., this volume) that pre-date any significant human occupation of sites. These data are locked within a variety of fluvial-related archives (Fig. 1) and the time range that these archives can be extended to is continually improving (e.g. Gázquez et. al. 2014). Within terrace archives it is rare to be able to trace an individual flood event across a fragmentary terrace record. Thus our best hope is to aim to reconstruct the ‘mean’ peak discharge preserved within the terrace record at each suitable site, giving us the range of probable maximum floods preserved for a specific terrace archive level. There is some significant debate as to which flood events (the higher magnitude, low frequency or lesser magnitude higher frequency) are preserved within ancient fluvial depositional sequences (see for example Sambrook Smith et al 2010). The data from this study will be able to contribute to that debate. Thus, whilst it is impossible to accurately document each individual flood event, fluvial terraces are ubiquitous fluvial archives that can provide some degree of quantification for long term (Quaternary) landscape modeling that can be framed to assist in understanding environmental change. This paper aims to explore appropriate field-based approaches for extracting quantitative flood information preserved within coarse grained fluvial terrace archives on a Pleistocene time scale by using a well studied catchment in SE Spain, the Río Aguas river catchment (Fig. 2). Palaeoflood reconstruction and analysis Palaeofloods are defined as ‘past or ancient floods that occurred without direct observation or recording by humans’ (Baker 2006, p162), although there is some inconsistency in the use of the terms ‘palaeoflood’ and ‘historical flood’ in the literature (i.e. floods occurring within the historically documented time period have been deemed palaeofloods where they have been subsequently reconstructed see Herget at al., 2014). Palaeoflood reconstruction of ancient (Pleistocene and older) records is less common and can be highly dependent on the approach used, highlighting a need to develop more standardized approaches for such records (e.g. Davidson & Hartley 2010; Stokes et al.,
2012). In the current study, in order to explore the ways in which this can be achieved, we will be examining both historical (a catastrophic event in 1973 and a moderate event in 2012) and ancient (>200 ka) flood events for the same field area using two established methodologies in order to evaluate the validity of the results. For the most recent events we will use established engineering approaches that utilize geomorphology based on palaeostage markers (trash lines, slack water deposits) and compare these with data derived from sedimentary evidence (competence based approaches using maximum boulder size) which can most easily be applied to coarse grained sedimentary deposits, at the same sites. The sites have been selected to replicate those associated with preserved Pleistocene coarse-grained strath terrace deposits within the same area. The competence approach will then be applied to a Pleistocene example and the results calibrated against the historical events in order to attempt to validate the plausibility of the results. Current Climate and associated flood record The SE of Spain is the driest part of continental Europe (excepting the Caspian Sea). This part of Iberia is sheltered by mountain ranges (~2000 m elevation) from humid Atlantic fronts and the average regional rainfall is <300 mm (Machado et al., 2011). Within this sector, Almería is the driest province with rainfall less than 150 mm/yr. Mean yearly rainfall is very irregular with an inter-annual variation of some 40% and total annual precipitation totals can be significantly affected by individual atmospheric perturbations (Machado et al., 2011). Rainfall occurs mainly in autumn and early winter with the most intense precipitation events being associated with meso-scale convective cells (Machado et al., 2011). Whilst the western Mediterranean inter-annual variability of precipitation and thus riverflow is related to the North Atlantic Oscillation, the Mediterranean rivers of eastern Spain are influenced by southward migration of westerlies (Benito et al., 2015). In the last 40 years 3 significant events have affected the Almería area – 1973, 1989 and 2012 (Benito et al., 2012). We will examine two of these in the vicinity of Sorbas, Almería Province, SE Spain (Fig. 2). The 19th October 1973 flood event The 1973 event is considered to be the 1 in 1000 year event (Benito et al., 2010, Stokes et al., 2012 and references therein) and was produced from a severe storm related to an intense cold, low-pressure cell that affected many catchments simultaneously in the region. The maximum rainfall recorded was 600 mm in 24 hrs at Zurgena (Capel-Molina 1974) and generated discharges of 5,600 m3/s in the Río Almanzora (Fig. 2) with 18 m depth of flow reported downstream of the Santa Barbara road bridge (Thornes, 1974). Single peak hydrographs were common (Fig. 3e) with steep rising limbs, high magnitude peaks and base flow durations of less than 2 days. (López-Bermúdez et al., 2002). The signature of the event remains clearly preserved in the landscape today by sediments close to cave roof height in the gypsum karst system of Sorbas (Fig. 2) indicating that these subsurface systems were filled to capacity, and by cliff collapse at the Rambla Cinta Blanca site (Fig. 2) due to undercutting and intense rainfall. The event generated the largest specific peak discharges (SPQ) from the smallest catchments, most notably up to 22 m3/s per km2 for the Río Albuñol which drains to the coastal town of La Rabita (Figs 2 and 3) and has a catchment area of 120 km2. These catchments supplied high discharges of sediment with ~40% sediment by volume reported for the Rambla Nogalte, draining into

Puerta Lumbreras (Fig. 2), and Rambla Ugijar in the Sierra Nevada, some 85 km west of our study area, (Lopez Bermudez et al., 2002; Griffiths et al., 2012 and references therein) indicating the hyper-concentrated nature of the flows (sensu Costa 1988) which were capable of temporarily suspending very coarse sediment load (Fig. 3a). Sediment accumulation from the Río Albuñol, which had a water discharge of 2580 m3/s, extended some 200 m offshore from the river mouth (Romero Cordon et al., 2003; Liquete et al., 2005) and Fig. 3b,c,d. The 28th September 2012 flood event The 28th September 2012 flood varied spatially from a moderate to extreme event (Benito et al., 2012; Hooke 2016 and references therein) with precipitation and discharges generally less than half that of the 1973 event (Benito et al., 2012). The maximum amount of precipitation was observed in Almería Province (more than 313mm in 24 hrs) from several mesoscale convective systems (Riesco Martin et al., 2014). This rainfall shifted to the NE during the day. Precipitation recorded was 219 mm for the Huércal-Overa area and 212 mm in Puerto Lumbreras (Fig. 2) over 12 hours with rainfall intensities of 84 mm hr-1 and 119 mm hr-1 (Benito et al., 2012). In the Río Guadalentin catchment (Fig. 2) it was mainly the minor tributaries and alluvial fans that were activated, with up to 1 m of alluvial deposition on channel beds (e.g. Benito et al., 2012, Hooke 2016). The peak river flow, estimated from stage readings, was 2500 m3/s for the Río Nogalte (Puerto Lumbreras), with a recurrence interval for the event of >50 years and a peak velocity of ~4.7 ms-1 (Hooke 2016). In the Río Antas (25km NE of our study area, Fig.2) flow depths of 2.3 m were reported (Benito et al., 2012). River terrace climate and associated flood record The Quaternary fluvial incision stage of drainage evolution of SE Spain is well documented by a series of climate-related inset, coarse-grained strath river terraces that typically aggraded during global glacials especially during glacial-to-interglacial transitions (Harvey et al., 2014). During glacial stages in this region effective frost action in the mountain source areas would likely have increased sediment supply. In more basinal areas palynological data suggests prolonged dry periods that tended to support herbaceous shrubs and steppe vegetation (Schulte et al., 2008). Thus whilst glacial periods were drier (i.e. less effective rainfall, Hodge et al., 2008), the lower frequency rainstorms that did occur would have generated more effective run-off as a result of the sparse vegetation cover (e.g. Harvey, et al., 2014 and references therein) and would have been carrying significant sediment loads. For the river terrace example used here (terrace B of Harvey & Wells 1987), aggradation had ceased, and soil development commenced by at least 207 ± 11 ka based on U-Series dating and associated soil characteristics (Harvey et al., 1995, Candy et al., 2005). Thus, allowing for soil abandonment and soil formation on the terrace level within the regional Quaternary framework of aggradation, this would suggest terrace B sedimentation most likely occurred during MOIS 8/7 (Harvey et al., 2014). This terrace level was deposited prior to a well established river capture event that affected the area, rerouting more than 70% of the original Sorbas Basin drainage to the east (Mather 2000; Stokes et al., 2002). This becomes significant for reconstructing any palaeohydrology for the region, demonstrating the need to thoroughly understand the fluvial terrace record context within the landscape.

Approach Stokes et al., (2012) utilised a range of palaeoflood estimation techniques on conglomeratic river terraces in a transverse reach of the Río Almanzora SE Spain (Fig. 2). Results from these analyses were compared with the modern flood record of the same river (Fig. 4). The findings indicated that from the range of palaeoflood data generated, the greatest consistency was obtained between a competence based approach using the maximum boulder size method of Clarke (1997) and the standard geomorphological technique of Manning (Fig. 4). These two methods will thus form the main approach for the current paper. Field surveys (Figs 5 to 8) were undertaken by the authors in March/April of 2013/2014 using a Trupulse Rangefinder 360® and Trimble GeoXH® to provide data for the 2 standard engineering approaches listed above that will be used for the modern flood reconstruction detailed below. Erosional river reaches Flood events recorded in erosional river reaches (i.e. those dominated by peak flood scour, and limited falling limb deposition e.g. Fig. 6b) can be reconstructed using palaeostage indicators (Fig. 6c,d) using the empirical Manning equation. This approach assumes Q = A . R 2/3.S ½. n−1 (1) Where Q is the discharge (m3/s), A is the cross-sectional area (m2) of the flood event, R is the hydraulic radius for the flood level (that is A divided by wetted perimeter in m), S is the energy line slope (gradient) and n is the Manning hydraulic roughness coefficient. Equation 1 provides a somewhat simplistic model of uniform one-dimensional steady flow. However, given the limited data often available for past floods, this approach is more appropriate than more sophisticated approaches that may appear at face value to be more applicable (e.g. two or three dimensional models for unsteady flow) but which do not necessarily add to the accuracy of results. Herget et al., (2014) explored the use of Manning in more detail in relation to the reconstruction of historical floods on large river systems such as the Rhine and found the accuracy ranged from -28 to -4% (averaging some -11%) when compared to gauged data. This technique thus makes a useful ‘benchmark’ to compare the historical floods and the competence approach outlined below. Aggradational river reaches The Clarke (1996) approach for estimating peak floods will be used for flood reconstruction from aggradational (alluvial) channel areas (e.g. Fig. 6b). It assumes that tractive competence (the largest particle that can be moved by the flow) is dependent upon velocity and that associated flow depth is a function of velocity. Combined with channel cross-section data such as width and slope, this is then used to calculate a variety of flow parameters, and ultimately a discharge (Table 1). The approach enables variables such as clast density and fluid density to be taken into account when processing the flood data. This is particularly pertinent for floods carrying high sediment load which then impacts on
the flow rheology (Costa 1988 and Table 2). The latter can be determined from observations and measurement of recent flows and the sedimentology of ancient deposits. The approach is ideally suited to coarse-grained and conglomeratic terrace deposits where we can constrain the maximum flow width from preserved abandoned meanders and channel slope from terrace bases. Field measurements required are 1) boulder size - A (major axis in m), B (intermediate axis in m) and C (minor axis in m) of the largest transportable clast, 2) channel width (m) and 3) bed slope (degrees). Flood reconstructions The 2012 flood was reconstructed using Manning to provide a benchmark to compare with Clarke (1996), performed on the same river reaches. Where Clarke (1996) has been applied (historic and ancient palaeofloods) fluid density used for the flood reconstructions includes both normal water conditions based on water flow in canyons (1150kg/m3, after Clarke 1996, and references therein) and hyperconcentrated flows (based on Table 2 and observations and measurements from the 1973 event) to provide a possible discharge range. These flow reconstructions are further compared with flow discharges based on Specific Peak Discharge (SPQ – discharge/catchment area) relations observed during the 1973 and 2012 events (see Tables 3 -6). The historic flood reconstruction Reconstruction of the historic events (1973 and 2012) was undertaken using Manning (Equation 1) and Clarke 1996 (Table 1) over 4 cross sections (Fig. 5, Tables 3,4 and 5) at two main sites (Cinta Blanca and Aguas, Fig.2). The Rambla Cinta Blanca site is a mixed (alluvial and bedrock) 600 m long reach developed across an incipient nick-point which is migrating headward in a well cemented calcarenite lithology. Maximum flow widths at the site are ~60 m. The site has no additional tributaries contributing flow over the studied reach. To establish consistency of results this is compared to the Río Aguas Site (Figs 2 and 6c), which is a wider (100 m) alluvial reach 5 km downstream. These sites have been selected to cover the range of environments developed during terrace formation. Cinta Blanca is a site that is currently spatially transitioning between aggradation–incision-aggradation (Figs 5a,b and 6a) and is a good representation of the basal terrace environments developing during the transition from erosion to aggradation. The Río Aguas site is more representative of the main terrace aggradation body. Thus, by laws of superposition, these sites reflect the suite of river terrace environments found vertically within a single terrace sequence. The ephemeral nature of the channels in this environment means that the full channel width in each case is only occupied by catastrophic flood events such as the 1973 event. The moderate-extreme event of 2012 did not occupy the entire width (Fig. 5a). Both the Cinta Blanca and Aguas sites also include a series of ‘nested’ erosional channels that reflect frequency of flow use (the deepest, smallest and narrowest reflecting the most frequent flow events that occur every couple of winters, Figs 5 and 7). Both sites contain imbricated outsize clasts relating to the catastrophic (1973) flood (Fig.7c) which can be used to reconstruct this event, and both sites contain clear evidence of the 2012 flood with well-defined palaeostage markers (Fig. 6) that were used for a series of surveys in March/April of 2013 and 2014 by the authors.

The terrace flood reconstruction Terrace level B in the transverse section of the Sierra Cabrera known as the Rambla de los Feos, was selected for flood reconstruction at 2 sites (Feos 1 and 2, Fig. 2 and 8) to compare with the historic data. This reach was selected as the mountain range is composed of black mica-schists which are clearly distinguishable from fluvial sediment throughput in the palaeovalley by lithology. The site also contains an abandoned meander (Fig. 8a) that facilitates the reconstruction of bed slope (taken as the measured down valley slope of the base of the terrace base over ~60 m) and probable maximum flood width (valley width) within the landscape context for the site. The largest clasts at two of the best outcropping sections for terrace level B were used with Clarke (1996 and Table 1 this paper) to reconstruct the palaeohydrology using the boulder data and morphology of the meander reach (valley width and slope for terrace B, Table 6). The terraces are composed of coarse-grained material which is well exposed and there is lack of space for floodplain development, meaning that flood reconstructions based on bedload are more likely to return meaningful results as the deposits are channel deposits from a bedload (and transport limited) system and more likely to reflect competence of the flow, in phase with the actual flood event. The two sites are typical of the river terrace sequences for terrace B (Harvey & Wells 1987) and the coarse conglomerates at the base are clearly rounded, outsize, erratic fluvial clasts (Fig. 8) that have been transported from across the basement-transverse river reach from upstream. Sedimentology of the preserved terrace B deposits is dominated by the coarsest material in the lower units of the sections exposed within the transverse reach of the Rambla de los Feos (Fig. 8). The well-cemented conglomerates are clast to matrix supported and may show a weak imbrication (Fig. 8). Lithology of the clasts comprise a mixture of metamorphic lithologies such as amphibole-mica-schist, augen gneiss, metacarbonates together with orange/yellow sandstone and white reef carbonates which are re-worked from the conglomerate, sandstone and carbonate units of the sedimentary sequences of the southern Sorbas basin which lies upstream of the site. In the abandoned meander these deposits comprise a lower unit up to 4 m thick that sits unconformably above deformed black basement schists (Fig. 8a). This fines upwards into a further 4 m of yellow gravel, sands and silts that may locally show weak, low angle bedding. These are then truncated by darker gravels some 6 m thick and sourced from the local hillslopes (Fig. 8a). We interpret the coarse lag at the base of the sequence as reflecting the channel flow through the section, and the relatively finer units to reflect abandonment facies and alluvial fan infilling of the then abandoned meander. The second section (Feos 2, Fig. 2) is located 0.75 km downstream on the faulted mountain front at the southern end of the transverse reach. Here the well cemented section lies unconformably on a tectonically tilted calcarenite unit. The terrace is coarsest at the base and shows a crude fining upwards to gravels and coarse sands over several metres of thickness (Fig. 8b,c). Some imbrication is evident. This sequence is interpreted as comprising main river channel gravels.

Discussion of observations Before assessing the flood data we should briefly consider the nature of ephemeral channel flow events in arid environments. It is common for catchments in dryland areas to yield more water per km2 in a rainstorm event that other environments (e.g. Griffiths et al., 2012) and this should be taken into account when evaluating reconstructions of paleohydrological data in such areas. It is known that for catchments <100 km2 the annual peak flood commonly correlates with catchment area but that this relationship becomes non linear above this catchment size due to the increasing likelihood of storms not covering the entire catchment area, the increasing significance of partial area contribution and the poor linkage between sources and sinks (Griffiths 1983). This is reflected in the relationship between Specific Peak Discharge (SPQ, m3/km2) and catchment area in Fig. 10 for the measured 2012 and 1973 events. There will also be variability in rainfall intensities associated with convective rainstorms that commonly generate the catchment runoff that can result in inter-catchment variability, though this should be more consistent for the spatially largest (extreme and catastrophic) regional storm events such as the 2012 and 1973 events. The floods generated are often associated with extreme scour on the rising limb and aggradation on the falling limb and mobile bedload forms much of the sediment load (Griffiths et al., 2012). This is clearly observed in images from the 1973 event (Fig. 3). Typically in water flows with low to high sediment concentration (Table 2) the flow acts as a Newtonian fluid and there is a linear relationship between shear stress and rate of strain (flow). However, a small amount of finite shear stress can occur once sediment is introduced. As sediment load increases the flow and fluid properties will begin to change. Turbidity and fall velocities will be reduced and viscosity increases (Table 2). Once flows become hyperconcentrated with sediment (typically >40% by weight, or 20% by volume, Costa 1983, Table 2) the shear strength and fluid density will increase (Table 2) such that larger clasts may be moved by shallower flow depths, as observed by Cronin et al., (1997) in lahar flows. Thus, transport rates are higher for hyperconcentrated flows than more normal water floods. The transition to hyperconcentrated flow occurs when the concentration of suspended fines reaches 3-10% volume, depending on grain size, and starts to possess a yield strength and becomes capable of transporting large amounts of coarser solid material in suspension (Pierson 2005). The images and flow data for the 1973 event suggests, therefore, that smaller catchments in the study area produced hyperconcentrated flows during the 1973 event (Fig. 3). The 2012 flood reconstructions based on Manning display consistency of results between sections (Table 3) with a peak discharge of 70-90 m3/s for Cinta Blanca and 150 m3/s for the Aguas section with a larger contributing catchment. Compared to these data the Clarke (1996) reconstructions for discharge (Table 4) suggest an upper limit to the flow (based on normal water flow) of 90-110 m3/s, excluding section 2. Manning assumes normal water flow, and thus is likely to agree with the upper value as modeled for Clarke (1996) in this study. Field evidence also suggests that flow was turbulent, producing some scour (Fig. 6b) and in the river reaches examined was probably not hyperconcentrated in nature as sedimentation was limited. Compared to measured flood data for the 2012 event SPQ values for the catchment size would appear greatly underestimated. However this is more likely to be due to the spatial variability of the rainstorm event (see for example the highly localized exceptional discharges reported by Benito et. al (2012) for the Antas

catchment), as no field evidence could be found to support flows of >1,000 m3/s as indicated in Tables 3 and 4. For section 2 it is apparent that the canyon constriction played an important role in both constricting the flow depth through the section, such that a flow depth to recreate discharge based on competence would be severely underestimated, and also as a function of the ‘filtering’ of coarse sediment down the reach, with boulder bottlenecks (jams) at the head of the canyon section leading to ‘boulder starvation’ downstream (Fig. 5 and 7a,b). This again meant that flow competence was a poor indicator of flow depth downstream of these boulder jams. If, however, the flow depth from field palaeostage markers is used with the velocities derived from competence, then a more consistent picture of the discharge emerges, suggesting discharge was around 90 m3/s though the Cinta Blanca section and 150 m3/sec in the downstream Aguas section (Fig. 9). A further interesting observation with regard to the boulder jams is that these are located at the head of the incipient bedrock nick-point (Fig. 5) which in time will cut through the section to produce a fining upwards conglomerate sequence with a very coarse bedload lag. This same architecture is observed in many of the vertical river terrace sequences within the region. The Aguas section (section 4) also indicates the sensitivity of the approach to the flow depth modeled from the competence approach. For example, for the 2012 event clasts were selected from within a narrow scour and on the more extensive channel floor (Table 4 and Fig. 5f). As the narrow scour enhanced local velocities and thus competence, the unrepresentative flow depth generated from the larger clasts was then used by the Clarke approach to overestimate the total channel discharge (and the contrary occurred for the wider, shallower depth) leading to potential misrepresentation of flow data by ~±30% compared to the more reliable calculations for the same section from Manning. This has ramifications for sampling approaches for coarse lags in fluvial terraces and paleochannels in the rock record with sharply undulous bases in order to provide more meaningful results. Data for the 1973 flood event suggests much greater consistency for the Clarke (1996) reconstructions and the regional SPQ data for sections 1-2 and 4 (Table 5 and Fig. 10). Data for sections 2 and 3, however, are some 6 times lower for Clarke compared to SPQ for the same reach (Table 5). Again this would appear to reflect the ‘filtering’ effect of the canyon reach, as most of the big clasts for the 1973 event were wedged at the upper canyon end and thus would have been spatially segregated and unavailable for transport for the area downstream of the canyon section (Fig. 5). The wide, open nature of the Aguas section allows for movement of large clasts, subject to availability. The upper end of the flow range for the Clarke (1996) reconstruction is within ±10% of the discharge based on catchment area for the same event (Table 5, Fig. 10), which would appear to imply that either the flow behaved more as a normal water flow in this study catchment (rather than hyperconcentrated, as discussed above) or that a suitable sediment supply of coarse clasts was not available for transport and thus that the flow is underestimated at the lower end of the fluid density range. The terrace palaeohydrology based on Clarke (1996) would appear to suggest deposition from an event similar to the 2012 event (Fig. 10). Catchment areas used for the sites are based on pre-capture scenarios that can be regionally constrained (e.g. Mather 2000; Mather et al., 2002) to reflect the time of deposition of the terrace sediments. Plotting up
the ranges for the terrace reconstructions with the historic flood data (Fig. 10) would suggest that the upper end of the terrace reconstructions is more consistent with the envelope for the peak extreme and catastrophic floods to have affected the area in recent times. The sedimentology of the terraces, which is mostly clast supported, would imply that the sediment deposition within the terraces was rapid, and from a tractional two phase flow, again more typical of a more normal water flood (Table 1) and not hyper-concentrated in nature (sensu Costa 1988). Thus, this may suggest that the terrace deposits were from more normal water floods. So do the palaeoflood reconstructions from the terrace records signify a true representation of the peak floods in the former Aguas/Feos catchment? They do appear to be of similar magnitude to extreme flood events to affect the region, implying that the terrace record (or at least the basal strath geometry and boulder lag) is recording the higher magnitude events. Evidence from the 1973 (1 in 1000 year) flood event in SE Spain suggests the catchment record prior to 1976 was largely destroyed in many catchments by the event (e.g. Bull et al., 1999) which may imply that terrace records (or at least the channel dimensions) may reflect the highest magnitude events to pass through the site, although the sediment which fills these channels may well reflect lesser (but still high) magnitude flood events. This would appear in part to contradict a study on the South Saskatchewan River, Canada, where the 1 in 40 year flood, which reworked the entire braidplain, did not leave a distinct signature behind in the sediments (Sambrook Smith et al., 2010). However the authors attributed this to the presence of a floodplain which enabled more rapid width than depth expansion of the cross-section, thereby reducing the rate of increase of channel-bed shear stress. This does not apply in the SE Spain terrace example where we have a dry climate and valley constrained bedload channels with no floodplain. Indeed, the modern SE Spain reconstructions presented here imply flood peaks are more likely to be underestimated based on competence, especially below canyon sections as a result of boulder jams acting as bedload traps for the coarser material. This may also be the case for terraces located in confined valleys where similar underestimates have been suggested (Stokes et al., 2012). This, together with preservation and exposure issues, underlines the need to survey as wide an area as possible to locate the largest clasts and minimize the underestimates. Also whilst the competence approach should theoretically work well for coarse-grained strath terraces in confined valleys, it does not work for catchments sourced from multigeneration conglomerates that simply do not have the large clasts sizes available for transport by peak flood events (e.g. Mather & Hartley 2005). Thus overall, although it may be argued that palaeoflood reconstructions may overestimate flow, particularly in unsteady flow settings (such as flash floods), the observation from this study (and Herget et al., 2014, Stokes et al., 2012) suggests that these tendencies are generally outweighed by the tendency for the approaches to underestimate. In the case of competence-based approaches, instantaneous flow acceleration in unsteady flow conditions, together with fluctuating fluid densities relating to sediment discharge can mobilise clasts at lower critical velocities than those modeled. However in practice the observations from this study would appear to imply that these are outweighed by the tendency to underestimate, based on maximum clast size availability and preservation and exposure issues within terrace/sediment records. Further study should enable us to more effectively place error bars on applications, and also, particularly

when examining terrace levels, design more effective sampling strategies. In the latter cases it is the relative rather than absolute changes in discharge that may be the most informative, due to the inaccuracies inherent in any of the chosen approaches. Conclusions This study has highlighted some points significant to our understanding of terrace formation and extraction of palaeoflood data using competence based approaches from coarse-grained strath terraces deposited in predominantly dry climate, ephemeral conditions. Firstly any sampling strategies of such deposits need to take into account channel geometries in cross-section and long profile (e.g. coarse basal terrace sediments at the start of valley constrictions are ideal locations for competence based approaches, downstream are not as a function of ‘boulder starvation’). Identifying such locations should be possible for terrace reconstructions although it would be more challenging for the rock record where information on channel morphology may be more limited, underlining the need to sample a range of exposed sections. Secondly the base of terraces, or beds in the rock record, which are composed of undulose channels/terrace bases should be examined using a number of the largest clast sizes to gain a representative palaeoflood estimate if no independent palaeodepth indicators can be obtained from the sedimentology (e.g. channel dimensions, bedforms). In order to ascertain the plausibility of values generated from Quaternary and older rock records evaluation against gauged records for similar environments is important. Of particular value here is comparison with the SPQ of recent events. Whilst knowing the size of former catchment areas may be challenging where the landscape has undergone modification (for example via river capture), careful landscape reconstruction can place reasonable constraints. For the more ancient rock record this constraint may be possible from knowledge of the provenance of the material and also by reconstruction of former catchment areas using morphometrics for distributive fluvial systems (e.g. Mather et al 2000). Despite the capacity to overestimate flood events using competence approaches, e.g. as a result of the impact of fluid density and acceleration forces in unsteady flow conditions, in reality this is outweighed by a tendency to underestimate based on preservation and exposure limitations, and an assumption that the maximum clast size is available for transport, especially for the largest flood events. This may limit the application of competence approaches in some environments, and suggests that in the rock record we are likely to be underestimating peak flows. Above all we must be realistic about the potential significance of results. At best we can examine relative changes between peak flood events deposited between terrace levels or stratigraphic sections in the rock record, but these deposits are unlikely to actually be the peak flood events even in an environment dominated by large magnitude, low frequency events such as in arid, ephemeral channel systems. The largest events may determine the channel geometry but the infilling sediments may reflect lesser magnitude events. The preliminary findings of this and other studies suggest that in arid, ephemeral river settings it is the extreme events that are creating the strath terrace geometries (or major channel

erosion surfaces in the rock record) and associated boulder lags at the base, but the conglomeratic fining upwards sequences preserved above likely preserve lesser magnitude events that later fill these larger channel geometries. In reality we are missing more than we are preserving. Acknowledgements The authors would like to thank Plymouth University SoGEES for support for the fieldwork element of this project, Jamie Quinn for redrafting figures 1, 3 and 4 and the valuable input of 2 referees (Ken Adams and an anonymous referee) in improving the clarity and appeal of the manuscript.
References Baker V. 2006. Palaeoflood hydrology in a global context. Catena 66: 161-168. Benito G, Rico M. Sánchez-Moya Y, Sopeña A. Thorndycraft VR, Barriendos M. 2010. The impact of late Holocene climatic variability and land use change on the flood hydrology of the Guadalentín River, southeast Spain, Global and Planetary Change 70: 53-63. Benito, G., Machado, M.J., Rodríguez Lloveras, X. 2012. Las crecidas del 28 de Septiembre de 2012 en el SE de España: Cómo un evento “moderado” puede causar un impacto extremo. Enseñanza de las Ciencias de la Tierra, 2012 (20.3), 299-302 Benito G, Macklin MG, Zielhofer C, Jones AF, Machado MJ. 2015. Holocene flooding and climate change in the Mediterranean. Catena 130: 13-33. Bull LJ, Kirkby MJ, Shannon J, Hooke JM. 1999. Then impact of rainstorms on floods in ephemeral channels in southeast Spain. Catena 38: 191-209 Capel, J., 1974. Génesis de las inundaciones de Octubre de 1973 en el Sureste de la Península Ibérica. Cuadernos Geográficos 4: 149-166. Briant RM, Cohen, KM, Cordier S. Demoulin A, Macklin MG, Maddy D, Mather A, Rixhon G., Veldkamp A, Wainwright J, Whittaker A, Wittmann H. 2015. Changing fieldwork practice to enable effective field-model comparison of fluvial landscape evolution - a framework from the FACSIMILE network working group 2. Earth Surface Processes and Landforms. This volume Candy I, Black S, Sellwood BW. 2005. U-series isochron dating of immature and mature calcretes as a basis for constructing Quaternary landform chronologies. Quatern Res 64:100–111. Cazatormentas. 2015. Recuerdos de una ríada - MEGAREPORTAJE FOTOGRÁFICO - 19-10-1973 accessed at http://www.cazatormentas.net/foro/reportajes-de-meteorologa-extrema/recuerdos-de-una-riada-megareportaje-fotografico-19-10-1973 CEDEX 2011. Mapa de caudales máximos. Memoria Técnica. Madrid. 67pp. Clarke AO. 1996. Estimating probable maximum floods in the upper Santa Ana basin, Southern California, from stream boulder size. Geological Society of America 2: 165-182 Costa J.E. 1988. Rheologic, geomorphic, and sedimentologic differentiation of water floods, hyperconcentrated flows, and debris flows, in Baker, V.R., Kochel, R.C., and Patten, P.C. (eds) Flood Geomorphology: Wiley-Intersciences, New York, p. 113-122 Cronin SJ, Neall, VE, Lecointre JA, Palmer AS. 1997. Changes in Whangaehu River lahar characteristics during the 1995 eruption sequence, Ruapehu volcano, New Zealand. Journal of Volcanology and Geothermal Research 76: 47-61 Davidson SK, Hartley AJ. 2010. Towards a Quantitative Method for Estimating Paleohydrology from Clast Size and Comparison with Modern Rivers. Journal of Sedimentary Research 80:688-702 Gázquez F, Calaforra JM, Forti P, Stoll H, Ghaleb B, Delgado-Huertas A. 2014. Paleoflood

events recorded by speleothems in caves. Earth Surf. Process. Landforms 39: 1345–1353 Geach M, Viveen W, Mather AE, Telfer MW, Fletcher WJ, Stokes M. 2015. An integrated field and numerical modelling study of controls on Late Quaternary fluvial landscape development (Tabernas, SE Spain). Earth Surf. Process. Landforms 40(14): 1907-1926. DOI: 10.1002/esp.3768 Griffiths JS, Fookes PG, Goudie AS., Stokes M. Engineering Group Working Party. 2012. Processes and landforms in deserts. In Walker, M.J. (ed.) Hot Deserts: Engineering, Geology and Geomorphology – Engineering Group Party Report. Geological Society London. Engineering Geology Special Publications 25: 33-95. Griffiths JS. 1983. A geomorphological approach to flood estimation in drylands for highway engineering purposes. Journal of the Geological Society, 140: 970. Harvey AM, Wells SG 1987. Response of Quaternary fluvial systems to differential epeirogenic uplift: Aguas and Feos river systems, southeast Spain. Geology 15:689–693 Harvey AM, Miller SY, Wells SG. 1995. Quaternary soil and river terrace sequences in the Aguas/Feos river systems: Sorbas basin, SE Spain. In: Lewin J, Macklin MG, Woodward JC (eds) Mediterranean Quaternary river environments. Balkema, Rotterdam, pp 263–282 Harvey AM, Whitfield (nee Maher) E, Stokes M, Mather A. 2014. The Late Neogene to Quaternary Drainage Evolution of the Uplifted Neogene Sedimentary Basins of Almería, Betic Chain. In F. Gutiérrez and M. Gutiérrez (eds.), Landscapes and Landforms of Spain, World Geomorphological Landscapes,Springer 37-61 Herget J, Roggenkamp T, Krell M. 2014. Estimation of peak discharges of historical floods. Hydrology and Earth System Sciences 18: 4029-4037. Hodge EJ, Richards, DA, Smart PL, Andreo B, Hoffmann DL., Mattey DP., González-Ramón, A., 2008. Effective precipitation in southern Spain ( 266 to 46 ka) based on a speleothem stable carbon isotope record. Quaternary Research 69: 447–457. Hooke, J.M. 2016. Geomorphological impacts of an extreme flood in SE Spain. Geomorphology 263: 19-38 Jones AF, Macklin MG, Benito G. 2015. Meta-analysis of Holocene fluvial sedimentary archives: A methodological primer. Catena 130: 3-12. Liquete C, Arnau P, Canals M, Colas S. 2005. Mediterranean river systems of Andalusia, southern Spain, and associated deltas: a source to sink approach. Marine Geology 222-223: 471-495 Lopéz-Bermúdez F, Conesa-Garcia C, Alonso-Sarriá F. 2002. Floods: magnitude and frequency in ephemeral streams of the Spanish Mediterranean region. In Dryland Rivers. Hydrology and Geomorphology of Semi-arid Channels, Bull LJ, Kirkby MJ (eds). John Wiley & Sons, Ltd, Chichester; 329–350. Machado MJ, Benito G, Barriendos M, Rodrigo FS. 2011. 500 years of rainfall variability and extreme hydrological events in southeastern Spain drylands. Journal of Arid Environments 75: 1244-1253
Mather AE. 2000. Adjustment of a drainage network to capture induced base-level change. Geomorphology 34: 271-289 Mather A, Hartley AJ. 2005. Flow Events on a hyper-arid alluvial fan: Quebrada Tambores, Salar de Atacama, northern Chile. In: Harvey, A.M., Mather, A.E. & Stokes, M. (eds) Alluvial Fans: Geomorphology, Sedimentology, Dynamics. Geology Society Special Publication 251, London, 9-29 Mather AE, Stokes M, Griffiths JG. 2002. Quaternary landscape evolution: a framework for understanding contemporary erosion, Southeast Spain. Land Degradation and Development 13: 89-109 Mather AE, Harvey AM & Stokes M. 2000. Quantifying long term catchment changes of alluvial fan systems. Geological Society of America Bulletin 112, Number 12: 1825-1833 Riesco Martín J, Mora García M, de Pablo Dávila F, Rivas Soriano L. 2014. Regimes of intense precipitation in the Spanish Mediterranean area. Atmospheric Research 137: 66-79. Martin Y, Church M. 2004. Numerical modelling of landscape evolution: geomorphological perspectives. Progress in Physical Geography 28: 317-339 Pierson TC. 2005. Hyperconcentrated flow-transitional process between water flow and debris flow. In: Jakob, M & Hungr, O. Debris-flow Hazards and related phenomena. Springer Berlin Heidelberg, 159-202 Romero Cordón E, Alvarez Vigil L, Garrido Perez F, De Las Heras M, Duran Valsero JJ, Madrid García R. 2003. The catastrophic flood event of the 18th of October, 1973, in the Rambla of Albuñol (La Rabita, Granada, Spain). In: Thorndycraft, V. R., Benito, G., Barriendos, M. & Llasat, M. C. (eds) Palaeofloods, Historical Floods and Climatic Variability: Applications in Flood Risk Assessment. Proceedings of the PHEFRA Workshop, Barcelona, Spain, 16–19 October 2002. CSIC, Madrid, 327–332. Sambrook Smith GH, Best JL, Ashworth PJ, Lane N, Parker NO, Lunt IA, Thomas RE, Simpson CJ. 2010. Can we distinguish flood frequency and magnitude in the sedimentological record of rivers?. Geology 38: 579-582. Schulte L, Julià R, Burjachs F, Hilgers A. 2008. Middle Pleistocene to Holocene geochronology of the River Aguas terrace sequence (Iberian Peninsula): fluvial response to Mediterranean environmental change. Geomorphology 98: 13–33. Stokes M, Mather AE, Harvey AM. 2002. Quantification of river-capture-induced base-level changes and landscape development, Sorbas Basin, SE Spain. Geological Society, London, Special Publications 191: 23-35 Stokes M, Griffiths JS, Mather AE. 2012. Palaeoflood estimates of Pleistocene coarse grained river terrace landforms (Río Almanzora, SE Spain). Geomorphology 149: 11-26. Thornes JB. 1974. The rain in Spain. Geographical Magazine 46 (7): 339–343.

Table 1. Clarke (1996) approach using an example calculation. Fluid densities for the calculations were based on 1150 kg/m3 for turbid flow in canyons (after Clarke 1996, from Graf 1979, cited therein) and 1800 kg/m3 for the upper limit for hyperconcentrated flows (after Costa 1988). Example provided using fluid density for hyperconcentrated flow. Property Formula Example calculation A – boulder major axis (m) B – boulder major axis (m) C – boulder major axis (m) σ – boulder’s density (kg/m3) w – channel width (m) β – bed slope angle (radians/degrees)
Basic concepts: ρ – fluid density = 1,800 kg/m3 µ – coefficient of sliding for a cubic boulder = 0.675 µ – coefficient of sliding for a round boulder = 0.225 g – acceleration due to gravity (9.81 m/s2)
A = 1.1 m B = 0.6 m C = 0.35 m σ = 2,700 kg/m3 β = 0.007 radians (0.4 degrees) w = 120 m
Nominal diameter of boulder (D) D= (A B C) 0.33 D = (1.1 x 0.35 x 0.6) 0.33 = 0.614m
Mass of a cubic boulder (MB) MB = σ D3 MB = 624kg Mass of a spherical boulder (MB) MB = σ [( π/6) D3] MB = 327kg Resisting force in Newtons (FR) FR = MB [(σ – ρ)/σ]g {{[cos β]µ}
– [sin β]} FR = 1362 for a cubic boulder FR = 233 for a round boulder
The critical force is the minimum force that can be applied to the boulder in the direction of stream flow that will initiate movement (FC)
Set FC = FR (i.e. the critical force is assumed to be equal to the resisting force)
The drag force is dependent on the flow conditions and the shape of the boulder (FD). It is a function of the lift (CL) and drag (CD) coefficients of the boulder
FD = (CDFC)/(CL + CD) CL = 0.178 for the cubic boulder and 0.20 for the round boulder CD = 1.18 for the cubic boulder and 0.20 for the round boulder
FD = 1184 Newtons for the cubic boulder and 116 Newtons for the round boulder
The critical velocity (VC) is equivalent to the competent bottom velocity at a height of about 1/3 of a particle diameter above the bed at the condition of incipient movement (m/s)
VC = {2[(FD / CD)/ρ] /AB} 0.5 AB = cross sectional area of the boulder
AB = 0.376 m2 for a cubic boulder and 0.296 m2 for a round boulder VC = 1.72 m/s for a cubic boulder and 1.48 m/s for a round boulder The average VC = 1.60 m/s for both forms
The average velocity of stream flow, Vavg, is 1.2 x VC (Costa, 1983)
Vavg, = 1.2 VC Vavg = 1.92 m/s
Manning roughness coefficient, ‘n’, as a function of channel slope (in degrees)
n = 0.295 ( tan β ) 0.377
n = 0.0454
Mean flow depth: for channel flows with high width to depth ratio hydraulic radius is approximately equal to mean flow depth, i.e. d = R (m), and Manning’s equation can be used to calculate mean flow depth
d = {[( Vavg n)/ (tan β)0.5 ] 0.5 }3
d = 1.07 m
Discharge, Q (m3/s) Q = w d Vavg, Q=(120 x 1.07 x 1.92) = 247 m3/s

Table 2. Rheologic classification of water and sediment flow in channels based on a silt and clay content of <10%, after Costa 1988. Note that the 1973 flood lies at the upper end of hyperconcentrated in terms of sediment concentration. Characteristic Water flow Hyperconcentrated
flow Debris flow
Sediment concentration by weight (%)
1-40 40-70 70-90
Sediment concentration by volume (%)
0.4-20 20-47 47-77
Bulk density (kg/m3)
1010-1330 1330-1800 1800-2300
Shear strength (dyne/cm2)
0-100 100-400 >400
Fluid type Newtonian Non-Newtonian? Viscoplastic? Main sediment support mechanism
• Electrostatic forces
• turbulence
• Bouyancy • dispersive stress • turbulence
• Cohesion • Bouyancy • Dispersive stress • Structural support
Viscosity (poise) 0.01-20 20-≥200 >>200 Fall velocity (% of clear water)
100-33 33-0 0
Sediment concentration profile
Non-uniform Non-uniform to uniform
uniform
Main flow type turbulent Turbulent to laminar laminar
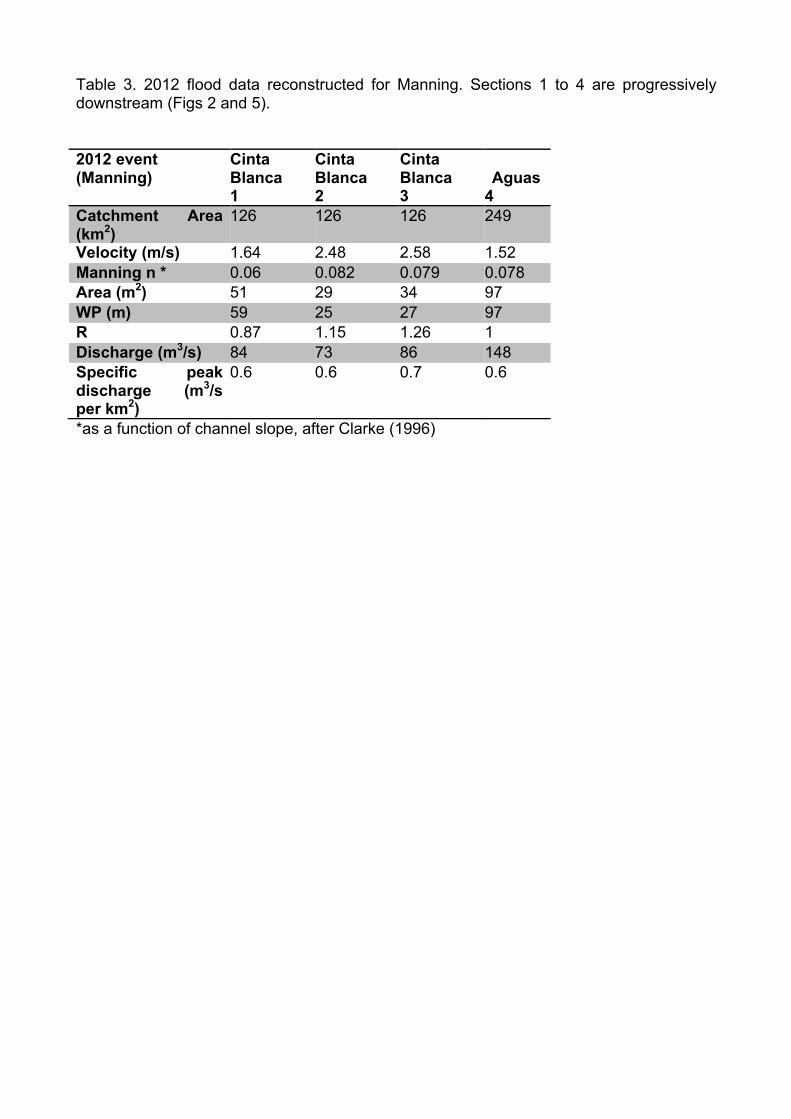
Table 3. 2012 flood data reconstructed for Manning. Sections 1 to 4 are progressively downstream (Figs 2 and 5). 2012 event (Manning)
Cinta Blanca 1
Cinta Blanca 2
Cinta Blanca 3
Aguas
4 Catchment Area (km2)
126 126 126 249
Velocity (m/s) 1.64 2.48 2.58 1.52 Manning n * 0.06 0.082 0.079 0.078 Area (m2) 51 29 34 97 WP (m) 59 25 27 97 R 0.87 1.15 1.26 1 Discharge (m3/s) 84 73 86 148 Specific peak discharge (m3/s per km2)
0.6 0.6 0.7 0.6
*as a function of channel slope, after Clarke (1996)

Table 4. 2012 flood data reconstructed using Clarke (1996). Sections 1 to 4 are progressively downstream (Figs 2 and 5). Range for flow depth, velocity and discharge for Clarke (1996) reconstruction based on upper and lower fluid densities for turbid flow in rapids (1150 kg/m3, Clarke 1996) and hyperconcrentrated flows (1800 kg/m3, Table 2). 2012 event (Clarke 1996)
Cinta Blanca 1
Cinta Blanca 2
Cinta Blanca 3
Aguas 4 shallow1
Aguas 4 deep2
Catchment Area (km2) 126 126 126 249 249 A axis (m) 0.41 0.35 0.44 0.34 0.52 B axis (m) 0.26 0.2 0.26 0.18 0.23 C axis (m) 0.15 0.08 0.06 0.07 0.1 Slope (m/m) 0.012 0.034 0.031 0.014 0.014 width (m) 54 14 26 99 99 mean modelled flow depth (m)
0.49-1.03
0.29-0.62
0.32-0.67
0.34-0.6 0.44-0.98
observed flow depth (m) 0.8 4 0.4 0.4 1.2 average velocity of flow (m/s)
1.22-2 0.99-1.63
1.03-1.69
0.98-1.57
1.16-2.17
Discharge (m3/s) 32-111 4-14 9-97 33-93 51-208 Specific peak discharge (m3/s per km2)
0.25-0.88
0.03-0.11
0.07-0.77
0.13-0.37
1.76-0.84
Discharge (m3/s) based on SPQ (m3/s per km2) 2012 event3
1121 (8.9)
1121 (8.9)
1121 (8.9)
1021(4.1)
1021(4.1)
1max boulder size on base main channel (Fig. 5f) 2max boulder size within the base of the frequent flow scour channel in central section (Fig. 5f) 3 based on relationship from 2012 data (Fig. 10) y=2142.5x-1.133 (R2=0.89). Calculated SPQ in italics.
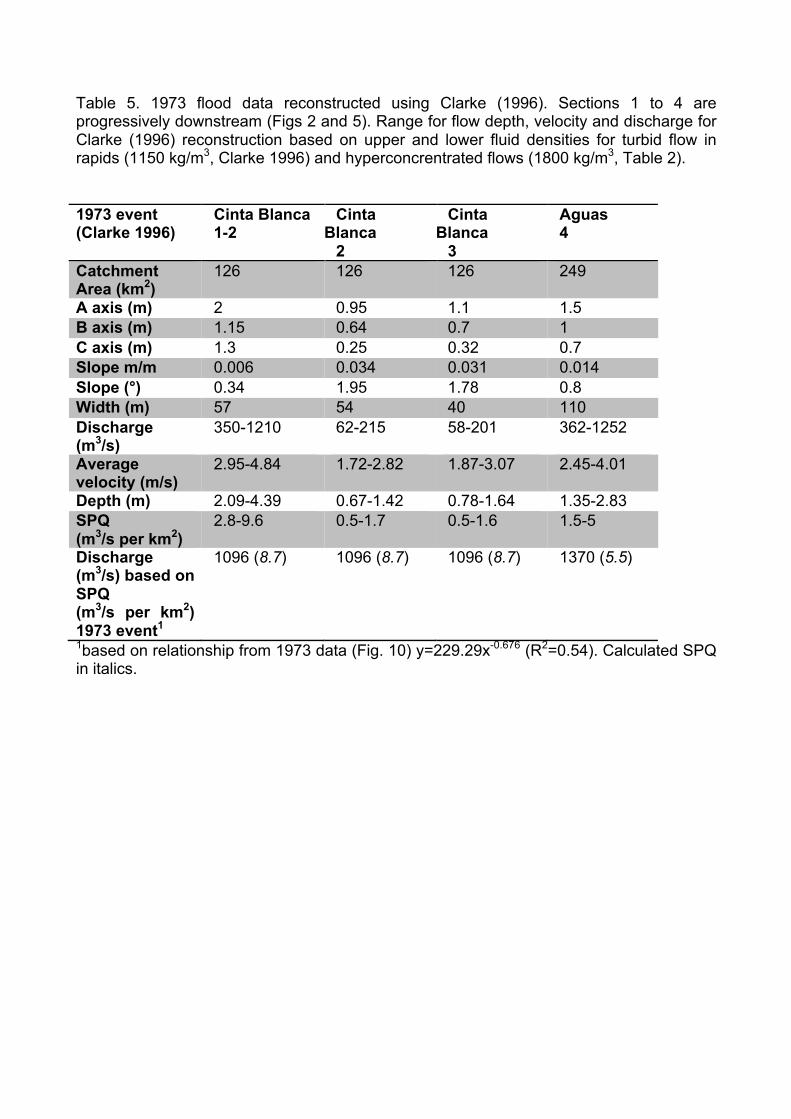
Table 5. 1973 flood data reconstructed using Clarke (1996). Sections 1 to 4 are progressively downstream (Figs 2 and 5). Range for flow depth, velocity and discharge for Clarke (1996) reconstruction based on upper and lower fluid densities for turbid flow in rapids (1150 kg/m3, Clarke 1996) and hyperconcrentrated flows (1800 kg/m3, Table 2). 1973 event (Clarke 1996)
Cinta Blanca 1-2
Cinta Blanca
2
Cinta Blanca
3
Aguas 4
Catchment Area (km2)
126 126 126 249
A axis (m) 2 0.95 1.1 1.5 B axis (m) 1.15 0.64 0.7 1 C axis (m) 1.3 0.25 0.32 0.7 Slope m/m 0.006 0.034 0.031 0.014 Slope (°) 0.34 1.95 1.78 0.8 Width (m) 57 54 40 110 Discharge (m3/s)
350-1210 62-215 58-201 362-1252
Average velocity (m/s)
2.95-4.84 1.72-2.82 1.87-3.07 2.45-4.01
Depth (m) 2.09-4.39 0.67-1.42 0.78-1.64 1.35-2.83 SPQ (m3/s per km2)
2.8-9.6 0.5-1.7 0.5-1.6 1.5-5
Discharge (m3/s) based on SPQ (m3/s per km2) 1973 event1
1096 (8.7) 1096 (8.7) 1096 (8.7) 1370 (5.5)
1based on relationship from 1973 data (Fig. 10) y=229.29x-0.676 (R2=0.54). Calculated SPQ in italics.

Table 6. Terrace B (>200 ka) flood data reconstructed using Clarke (1996). Sections 1 and 2 are progressively downstream (Fig. 2). Range for flow depth, velocity and discharge for Clarke (1996) reconstruction based on upper and lower fluid densities for turbid flow in rapids (1150 kg/m3, Clarke 1996) and hyperconcrentrated flows (1800 kg/m3, Table 2). Terrace B (>200 ka) (Clarke 1996)
Feos 1
Feos 2
Catchment Area (km2) * 314 324 A axis (m) 1.05 0.7 B axis (m) 0.75 0.44 C axis (m) 0.38 0.25 Slope m/m 0.034 0.031 Slope (°) 2.92 1.7 Width (m) 79 79 Discharge (m3/s) 105-361 72-248 Average Velocity (m/s) 1.87-3.07 1.54-2.53 Depth (m) 0.71-1.49 0.59-1.24 SPQ (m3/s per km2) 0.33-1.15 0.22-0.77 Discharge (m3/s) based on SPQ (m3/s per km2) 1973 event1
1476 (4.7) 1490(4.6)
Discharge (m3/s) based on SPQ (m3/s per km2) 2012 event2
1005 (3.2) 995 (3.07)
* Reconstructed pre-capture, Mather et al., (2002)
1based on relationship from 1973 data (Fig. 10) y=229.29x-0.676 (R2=0.54). Calculated SPQ in italics. 2based on relationship from 2012 data (Fig. 10) y=2142.5x-1.133 (R2=0.89). Calculated SPQ in italics.
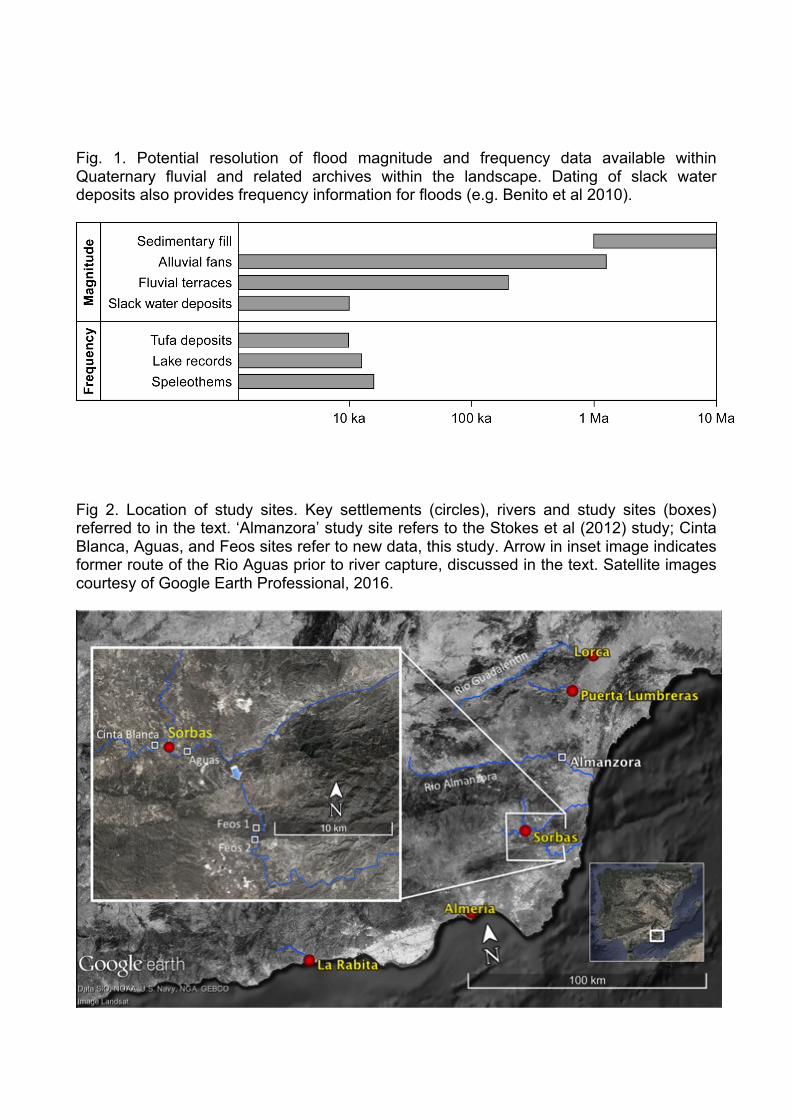
Fig. 1. Potential resolution of flood magnitude and frequency data available within Quaternary fluvial and related archives within the landscape. Dating of slack water deposits also provides frequency information for floods (e.g. Benito et al 2010).
Fig 2. Location of study sites. Key settlements (circles), rivers and study sites (boxes) referred to in the text. ‘Almanzora’ study site refers to the Stokes et al (2012) study; Cinta Blanca, Aguas, and Feos sites refer to new data, this study. Arrow in inset image indicates former route of the Rio Aguas prior to river capture, discussed in the text. Satellite images courtesy of Google Earth Professional, 2016.

Fig. 3. Impact of the 1973 flood at La Rabita (Fig. 2) at the mouth of the Rio Albuñol (peak discharge 2580 m3/s), demonstrating the impact of the high sediment load. a) the hyperconcentrated nature of the flow (~40% sediment by volume) enabled temporary suspension of large bedload; b) the extended fan area; c) destroyed bridge; d) extensive deposition of coarse material and e) example of a typical storm hydrograph for the event (in this case taken from a similar sized catchment, Rambla Nogalte, Puerta Lumbreras, Fig 2. After Lopéz-Bermúdez 2002). Photographs courtesy of Cazatormentas 2015.

Fig. 4. A comparison of reconstructed and measured flood peak discharge for the Rio Almanzora (Fig. 2). a) measured records (1963-2009) and the palaeoflood range generated from coarse grained terrace records in the same area (adapted from Stokes et al 2012). b) comparison of the reconstructed palaeoflood data from the Stokes et al (2012) terrace levels. Approaches are explained in Stokes et al (2012). SS denotes shear stress and SP denotes stream power in the table. Numbers in table indicate the maximum discharges (m3/s).

Fig.5. Surveyed field sites for 2012 and 1973 flood reconstructions. See also Fig 2 for general location. a) 600m long Cinta Blanca reach. Circle indicates location of imbricated 1973 deposits (Fig. 7c). Flow left to right. Image courtesy of Google Earth Professional. Image date (2013) postdates the 2012 flood; b) long profile surveyed through study reach depicted in (a); c), d), e) surveyed sections located on (a); f) Surveyed section in Rio Aguas, Arrows A and B indicate locations of sampled boulders for Clarke (1996) reconstruction in the scour utilised by most frequent flows (arrow B) and upper surface (arrow A). For discussion see text. All sections drawn looking downstream. Horizontal scale tick every 5m, vertical scale tick every metre. Dashed horizontal line indicates level of 2012 flood event based on palaeostage indicators (Fig. 6).

Fig.6. Field images of surveyed sections. a) Cinta Blanca, showing the transition from bedrock (light coloured, Sorbas Member sediments) to alluvial reach at the top of the surveyed section (Fig. 5). With future incsion and groundwater cementation this represents a future terrace; b) example of an erosional section (Section 1) from the 2012 flood event with some scour (arrowed A) into the bed and minor downstream deposition from that scour (arrowed B); c) example of palaeostage indicators from the trash lines of the 2012 flood (arrowed), section 4, Rio Aguas Section (Fig. 2) and b) 2012 slack water deposits (arrowed) at Section 3 Cinta Blanca (Fig. 5).

Fig.7. Field images of surveyed sections from the Cinta Blanca study reach (Fig 5). a) Cinta Blanca, top end of canyon section (looking upstream, canyon ~4m deep) showing how the coarser part of the bedload forms boulder jams in the head of the canyon section; b) within the canyon section downstream of the boulder jam (looking upstream) the sediment deposited in the canyon is much finer and forms pronounced alternate bars that are picked up on the long profile survey as undulations (Fig. 5b). Person (arrowed) for scale and c) example of imbricated boulders from the 1973 flood at the head of the bedrock insipient incision, flow left to right.

Fig.8. Field images of surveyed terrace B sections from the Rambla de los Feos (Fig. 2). a) Feos 1 looking upstream into the axis of the abandoned meander fill. Inset (bottom right) shows relative position in meander (arrowed). Palaeoflow from N to S. Line indicates ridge crest above meander. Image (2011) courtesy of Google Earth Professional. Terrace units are described in the text; b) and c) Sedimentology of Feos 2 terrace deposits, sitting unconformably on Tortonian calcarenites and showing weakly imbricated coarse clasts near the base of the terrace. Palaeoflow right to left.
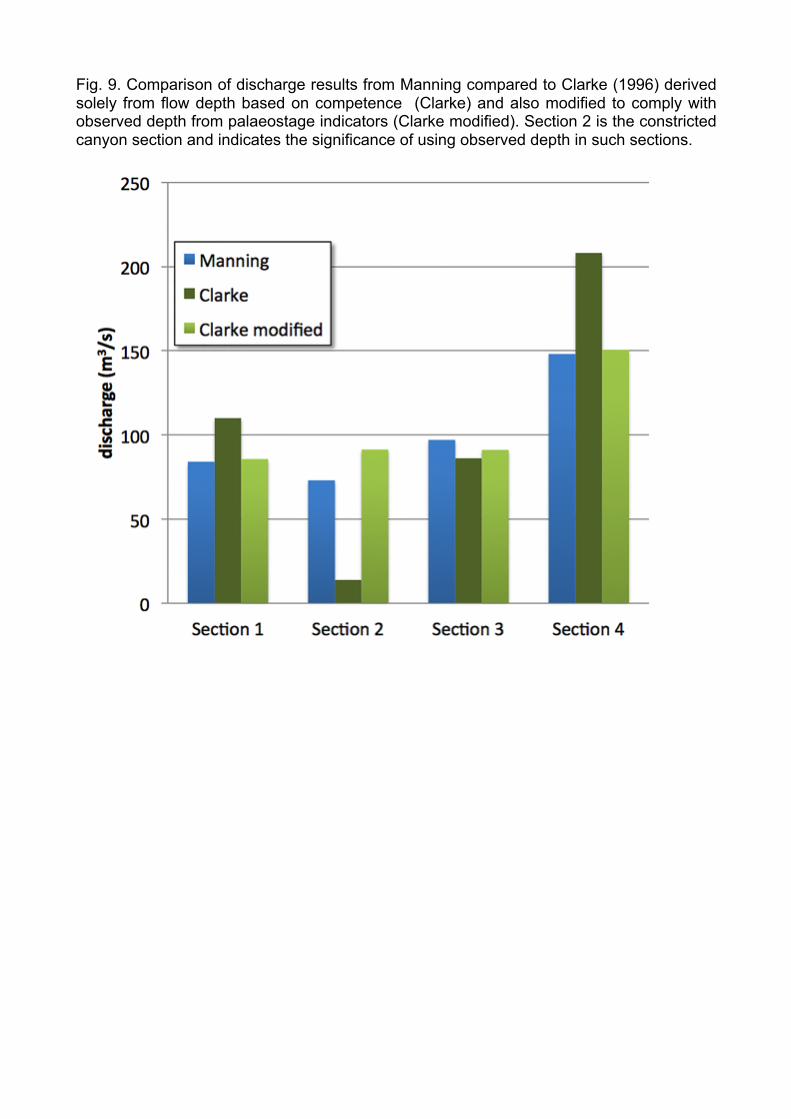
Fig. 9. Comparison of discharge results from Manning compared to Clarke (1996) derived solely from flow depth based on competence (Clarke) and also modified to comply with observed depth from palaeostage indicators (Clarke modified). Section 2 is the constricted canyon section and indicates the significance of using observed depth in such sections.
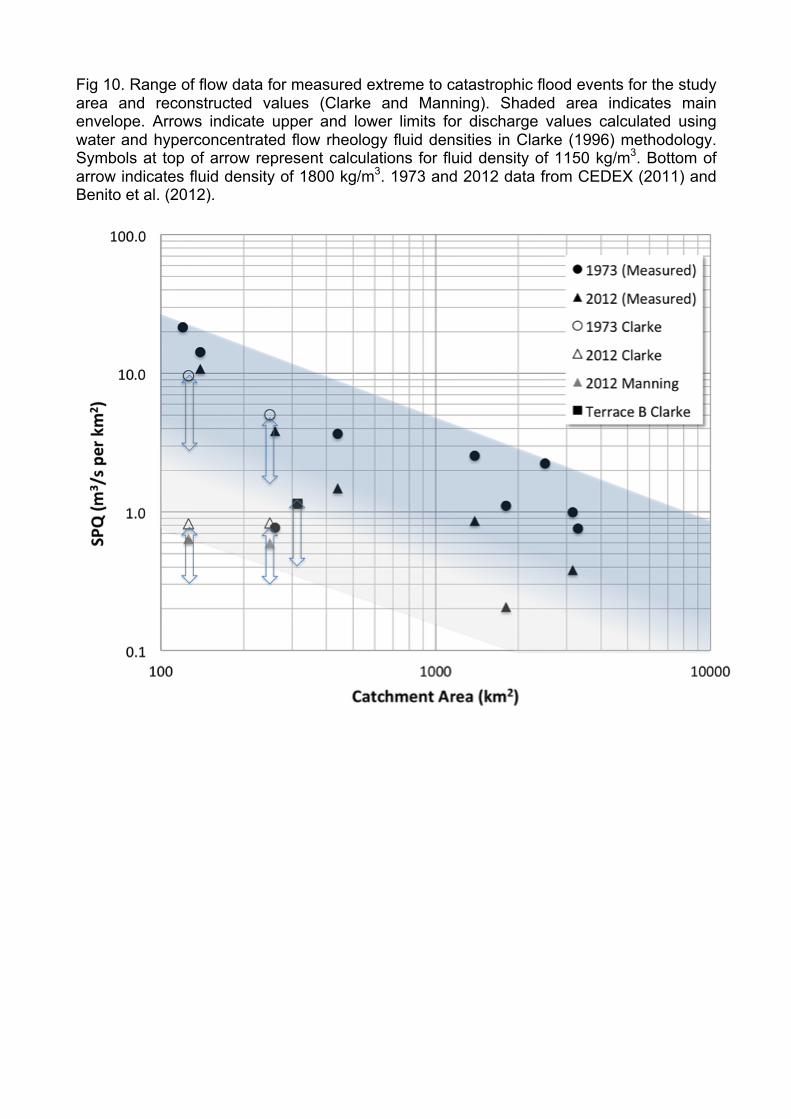
Fig 10. Range of flow data for measured extreme to catastrophic flood events for the study area and reconstructed values (Clarke and Manning). Shaded area indicates main envelope. Arrows indicate upper and lower limits for discharge values calculated using water and hyperconcentrated flow rheology fluid densities in Clarke (1996) methodology. Symbols at top of arrow represent calculations for fluid density of 1150 kg/m3. Bottom of arrow indicates fluid density of 1800 kg/m3. 1973 and 2012 data from CEDEX (2011) and Benito et al. (2012).

![DERBYSHIRE PARISH REGISTERS - Nottinghampsadb1/brailsford.pdf · William Francis, of Derby, & Anne Mather, of ... John Hibbit & Anne Bates, ... 14 May ,,] Derbyshire Parish Registers](https://static.fdocuments.net/doc/165x107/5aae0ad87f8b9a07498b92e9/derbyshire-parish-registers-psadb1brailsfordpdfwilliam-francis-of-derby-anne.jpg)