
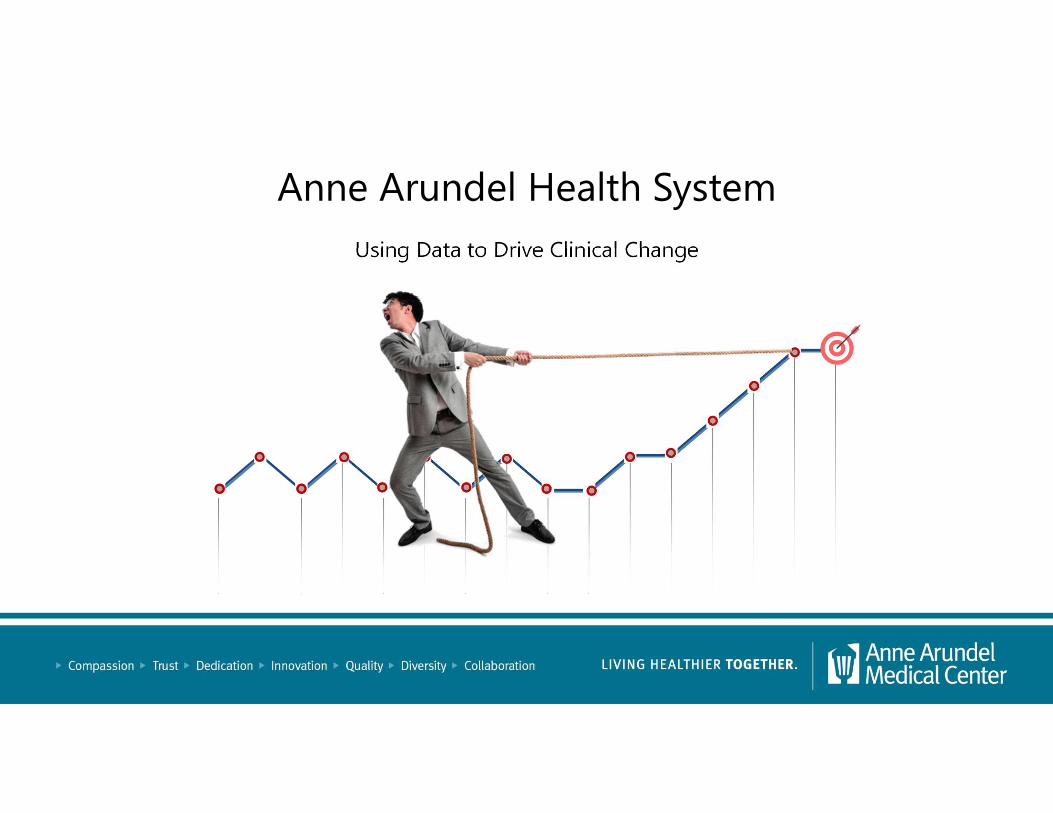
Anne Arundel Health System
41
3 4 3 4 3 4 3 4 3 3 4 4 5 6 7 7 1 2 3 4 5 6 7 8 9 10 11 12 13 14 15 16 CHART TITLE Anne Arundel Health System Using Data to Drive Clinical Change
Transcript of Anne Arundel Health System
3
4
3
4
3
4
3
4
3 3
4 4
5
6
7 7
1 2 3 4 5 6 7 8 9 10 11 12 13 14 15 16
CHART TITLE
Anne Arundel Health System
Using Data to Drive Clinical Change
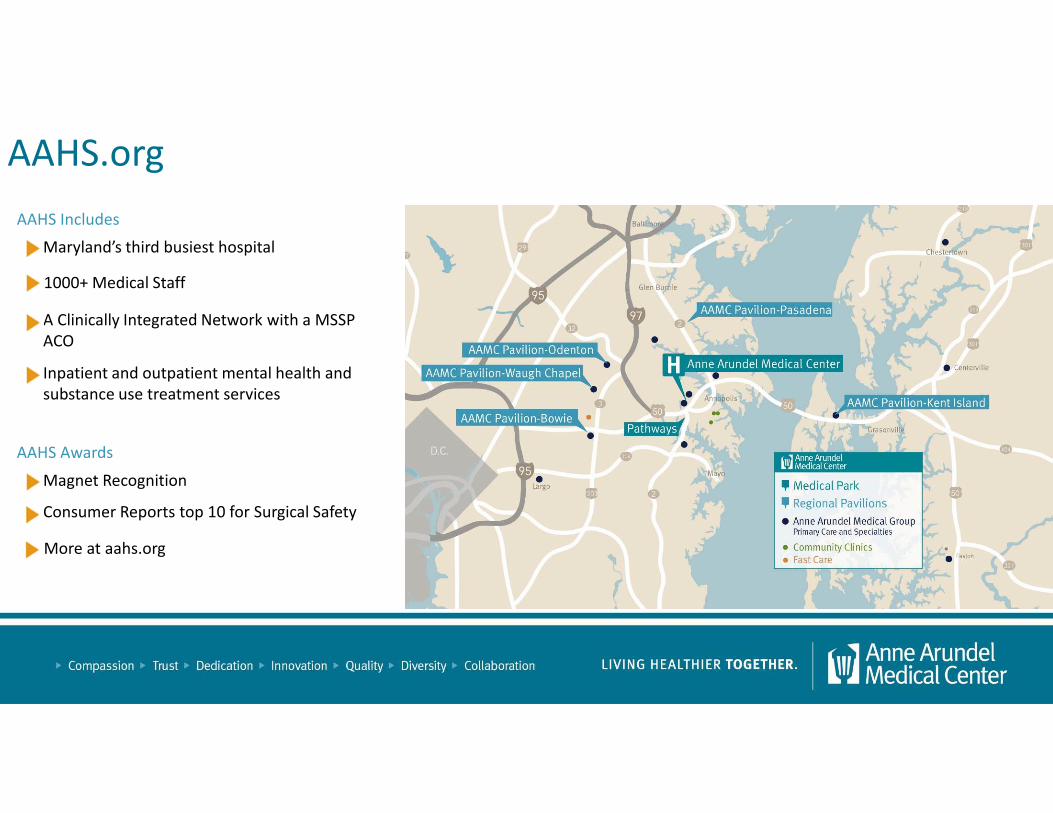
AAHS Includes
Maryland’s third busiest hospital
A Clinically Integrated Network with a MSSP
ACO
1000+ Medical Staff
Inpatient and outpatient mental health and
substance use treatment services
AAHS Awards
Magnet Recognition
Consumer Reports top 10 for Surgical Safety
AAHS.org
More at aahs.org
Data Driven Performance Improvement Results
Before we dive into the how, here’s what the end result can look like
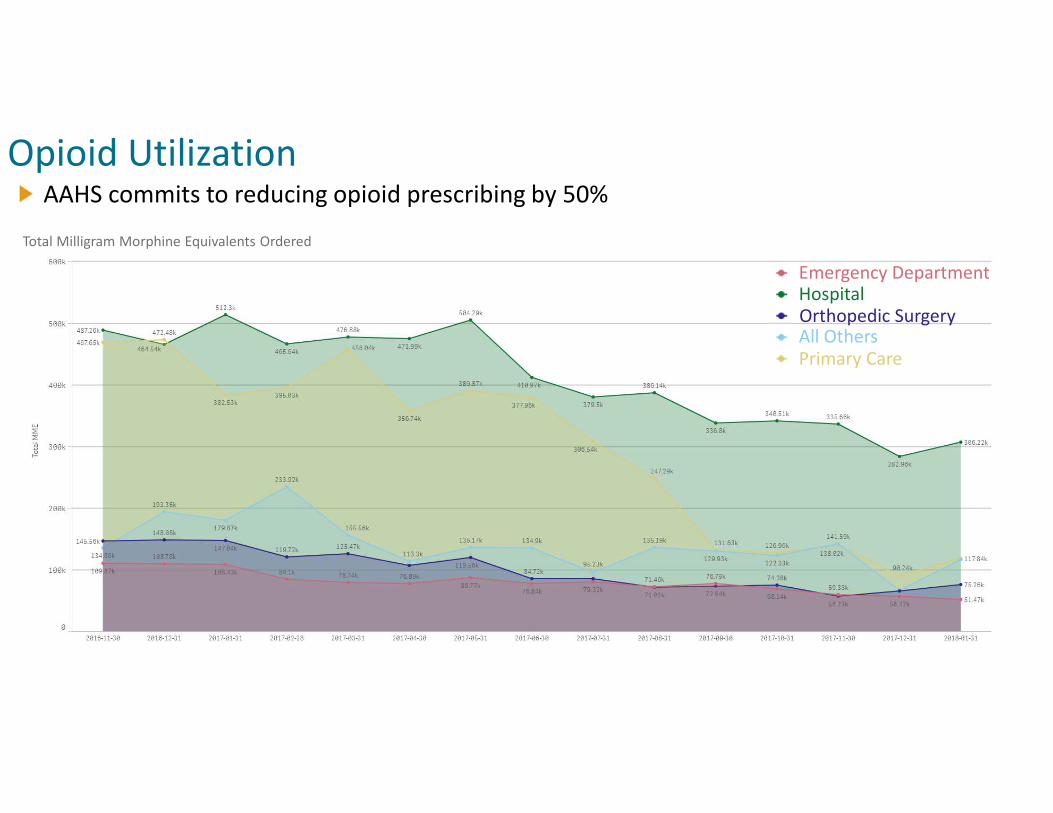
AAHS commits to reducing opioid prescribing by 50%
Opioid Utilization
Total Milligram Morphine Equivalents Ordered
Emergency DepartmentHospitalOrthopedic SurgeryAll Others
Primary Care
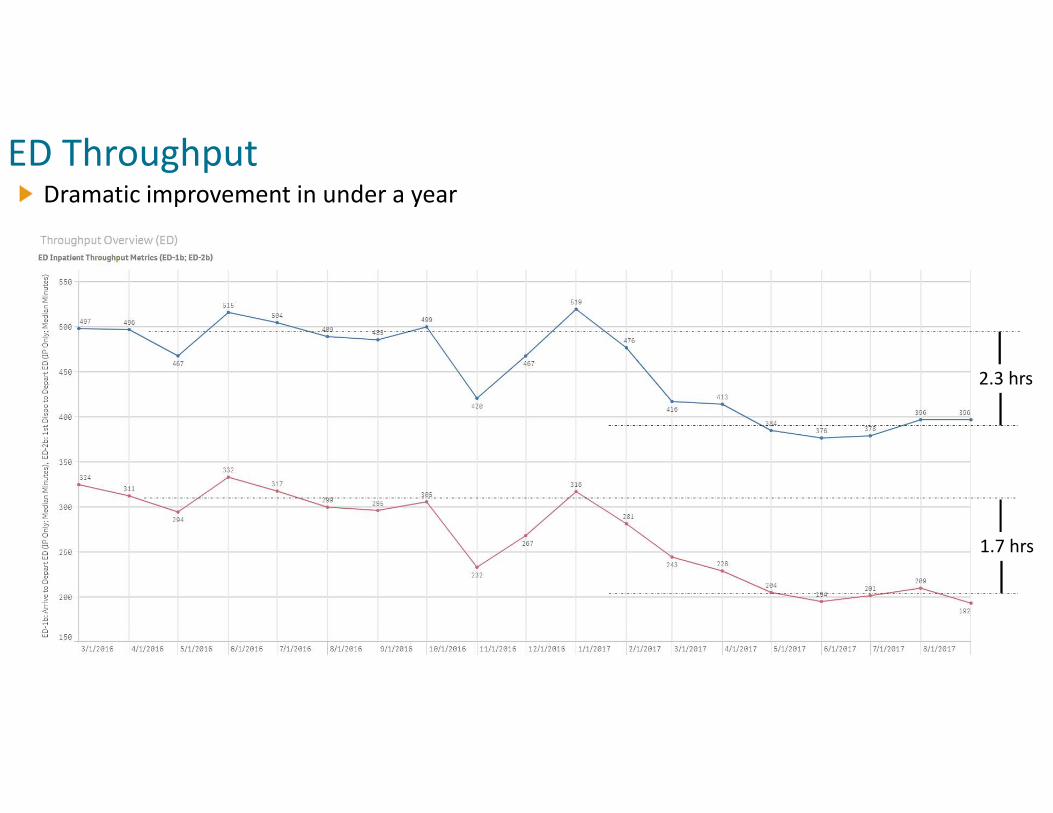
Dramatic improvement in under a year
ED Throughput
2.3 hrs
1.7 hrs

Getting Data Into the Right Hands
Why is it so hard to get data at work?


How do we get information when we’re not at work?
Which country has the most people?
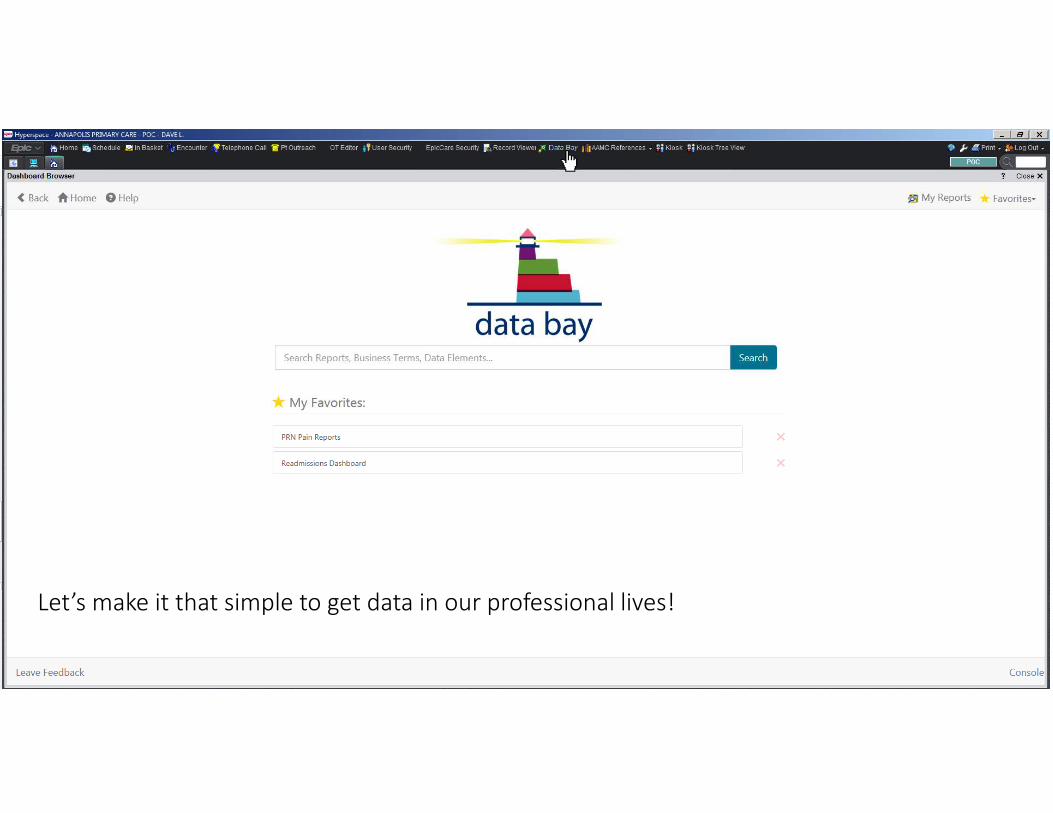
Let’s make it that simple to get data in our professional lives!
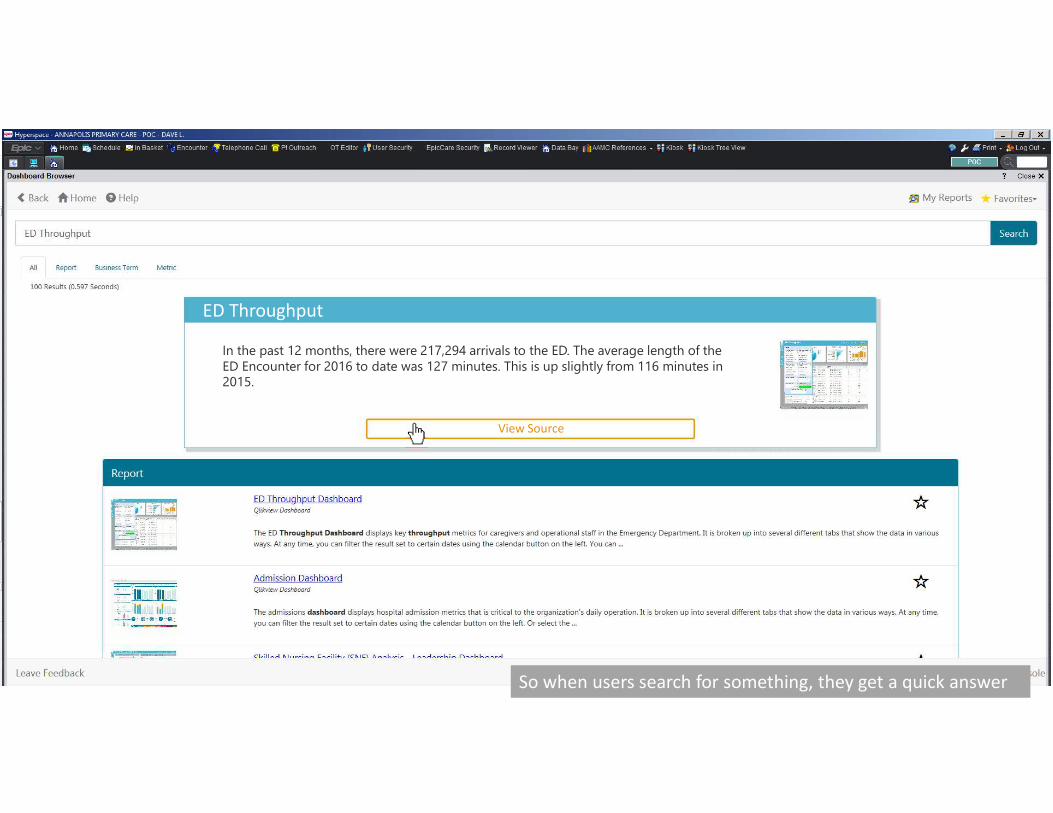
ED Throughput
In the past 12 months, there were 217,294 arrivals to the ED. The average length of the ED Encounter for 2016 to date was 127 minutes. This is up slightly from 116 minutes in 2015.
View Source
So when users search for something, they get a quick answerSo when users search for something, they get a quick answer
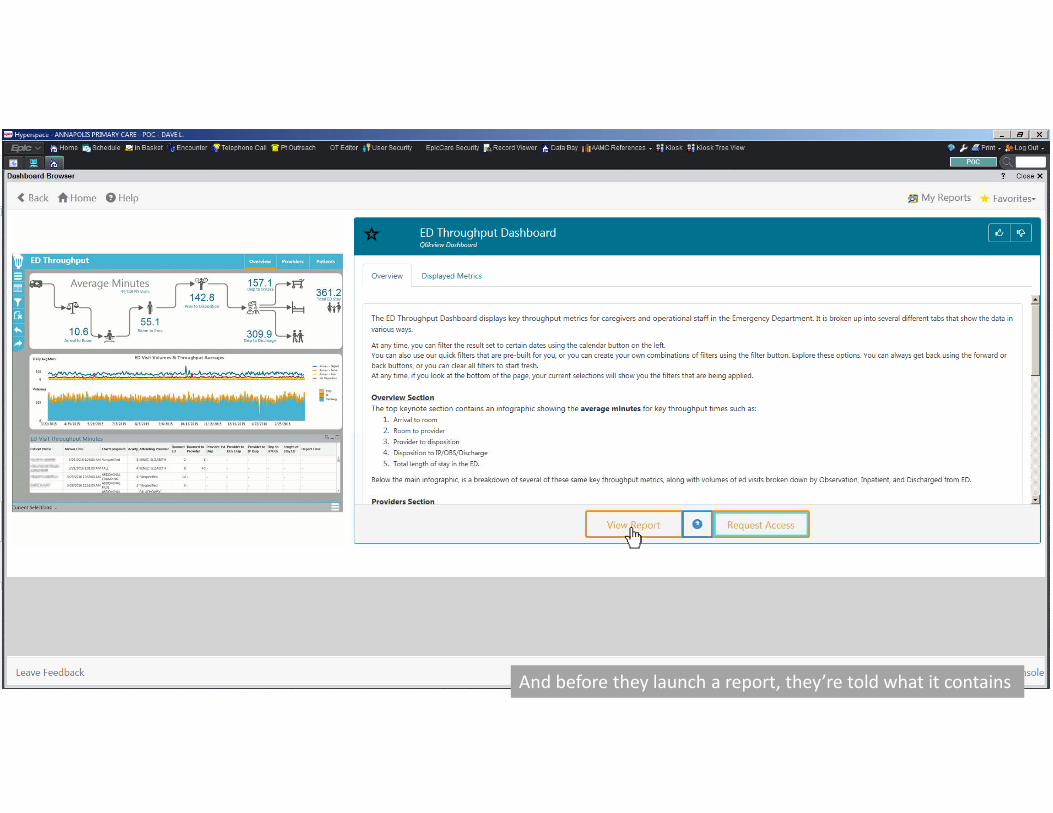
And before they launch a report, they’re told what it containsAnd before they launch a report, they’re told what it contains
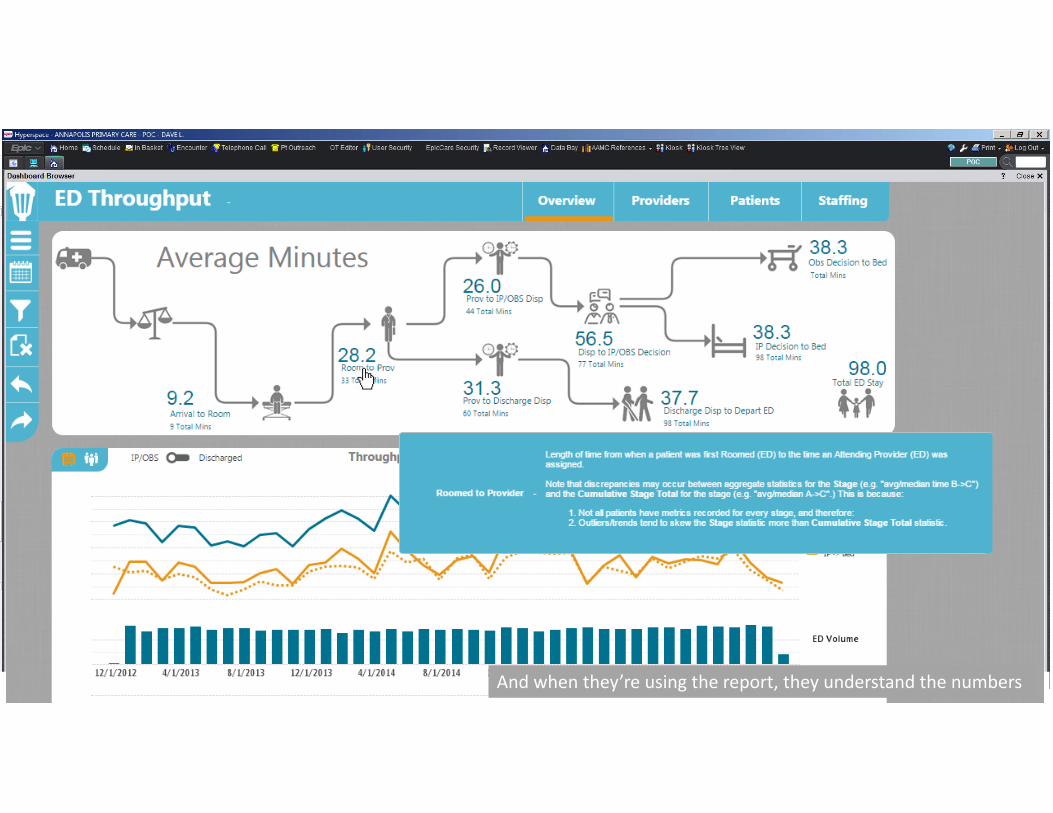
And when they’re using the report, they understand the numbersAnd when they’re using the report, they understand the numbers
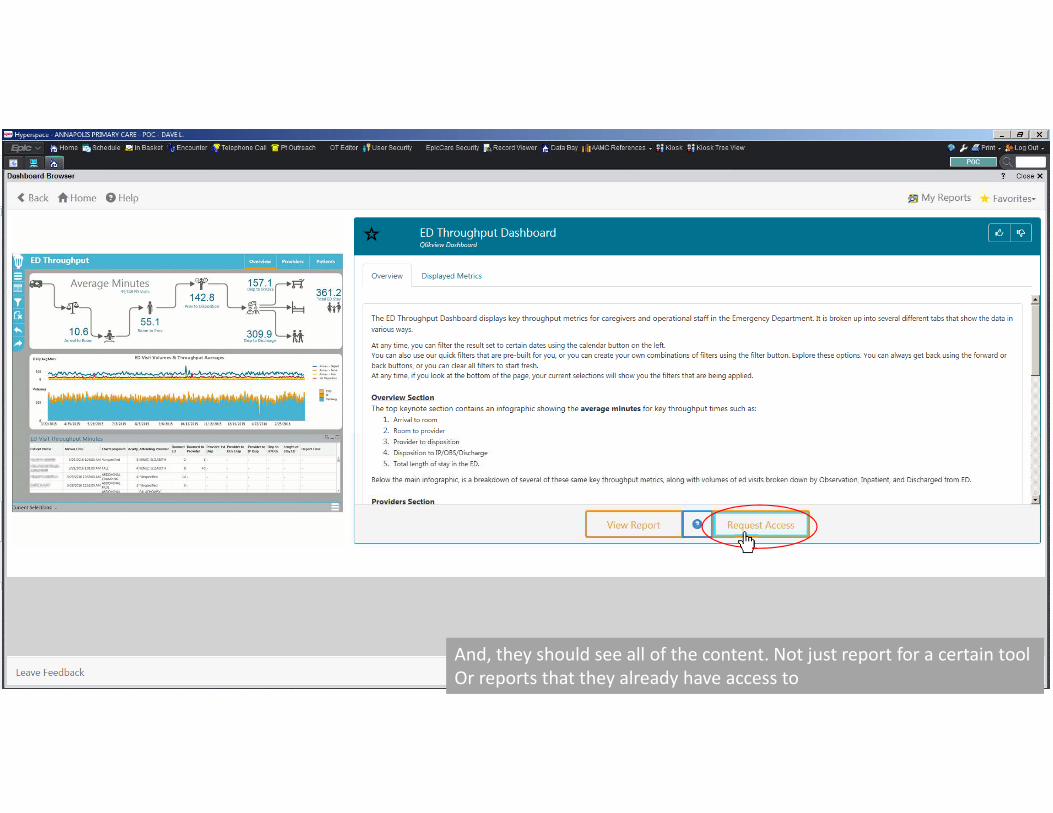
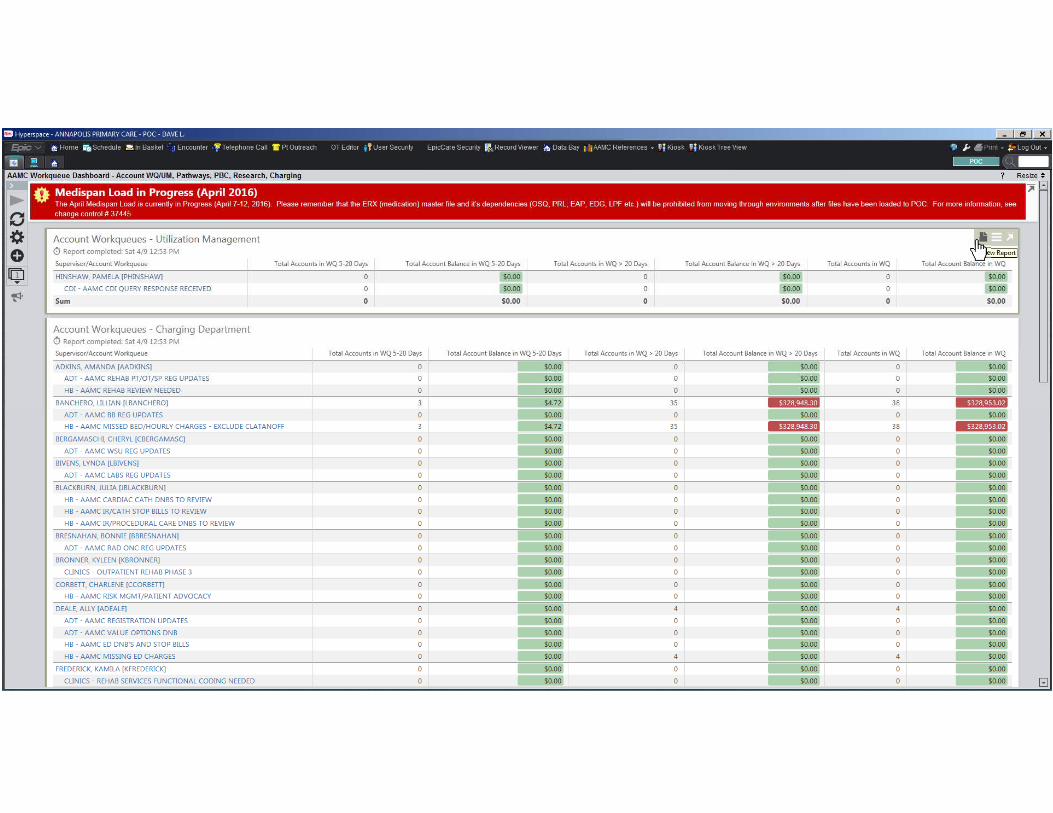
And, they should see all of the content. Not just report for a certain tool
Or reports that they already have access to
And, they should see all of the content. Not just report for a certain tool
Or reports that they already have access to
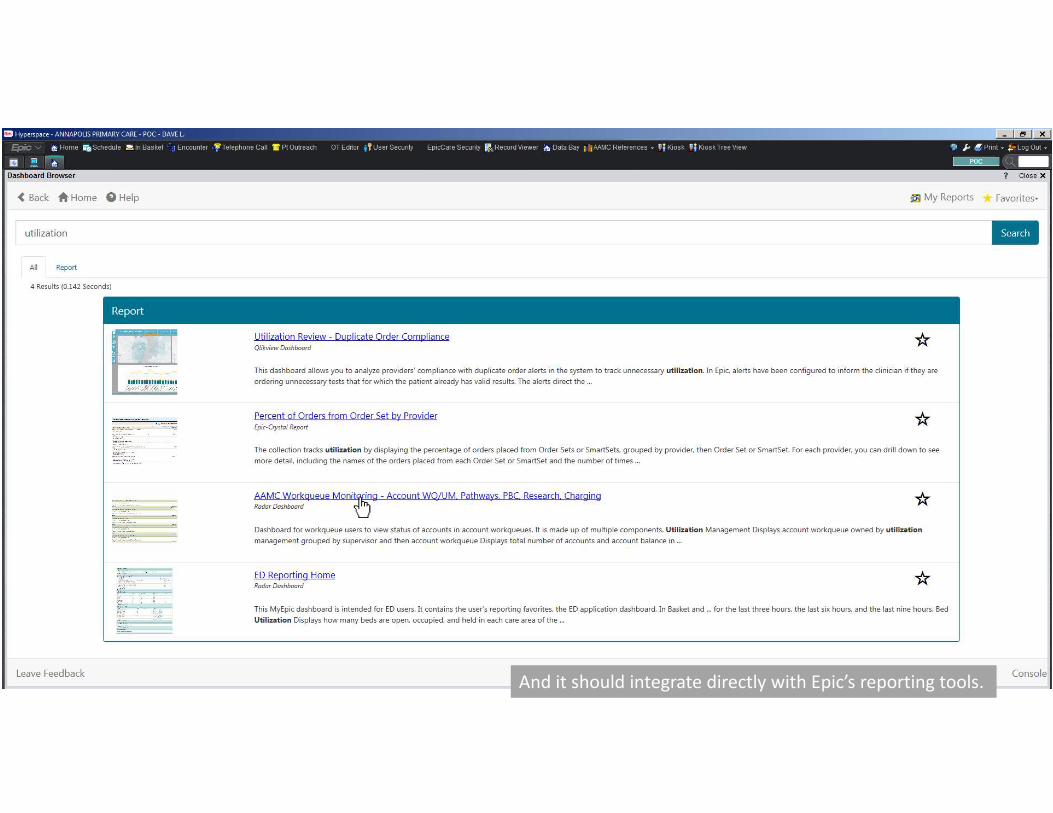
And it should integrate directly with Epic’s reporting tools.And it should integrate directly with Epic’s reporting tools.
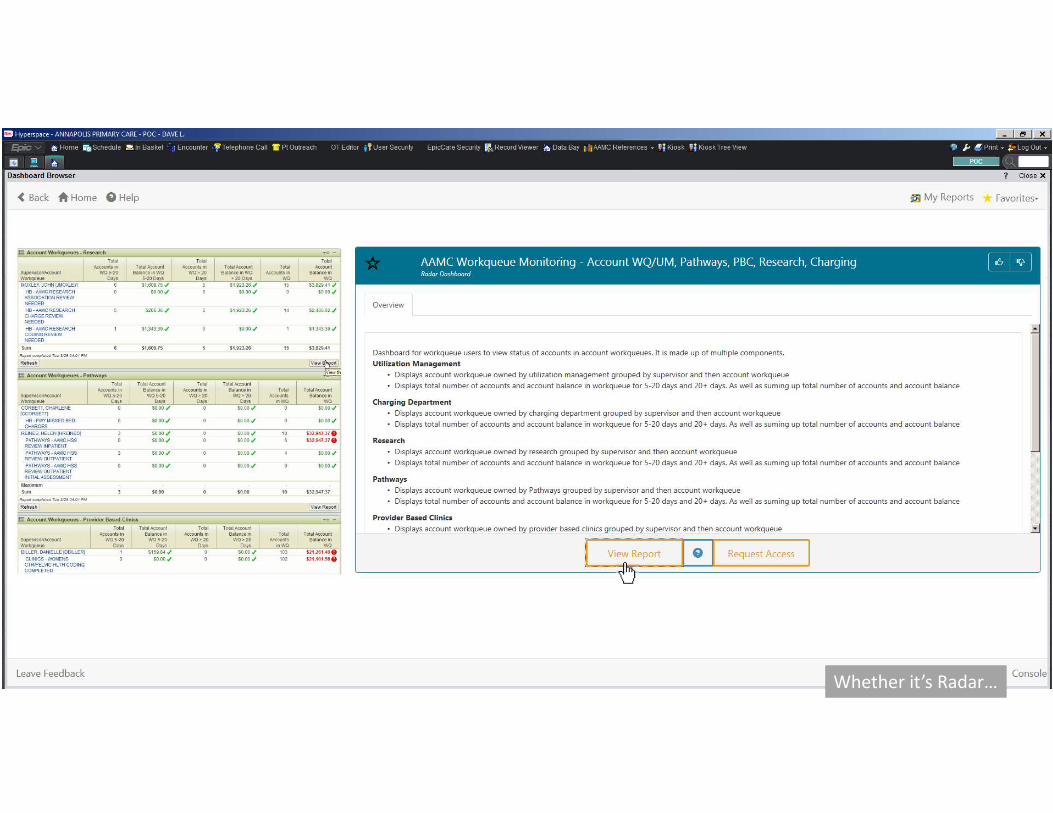
Whether it’s Radar…Whether it’s Radar…
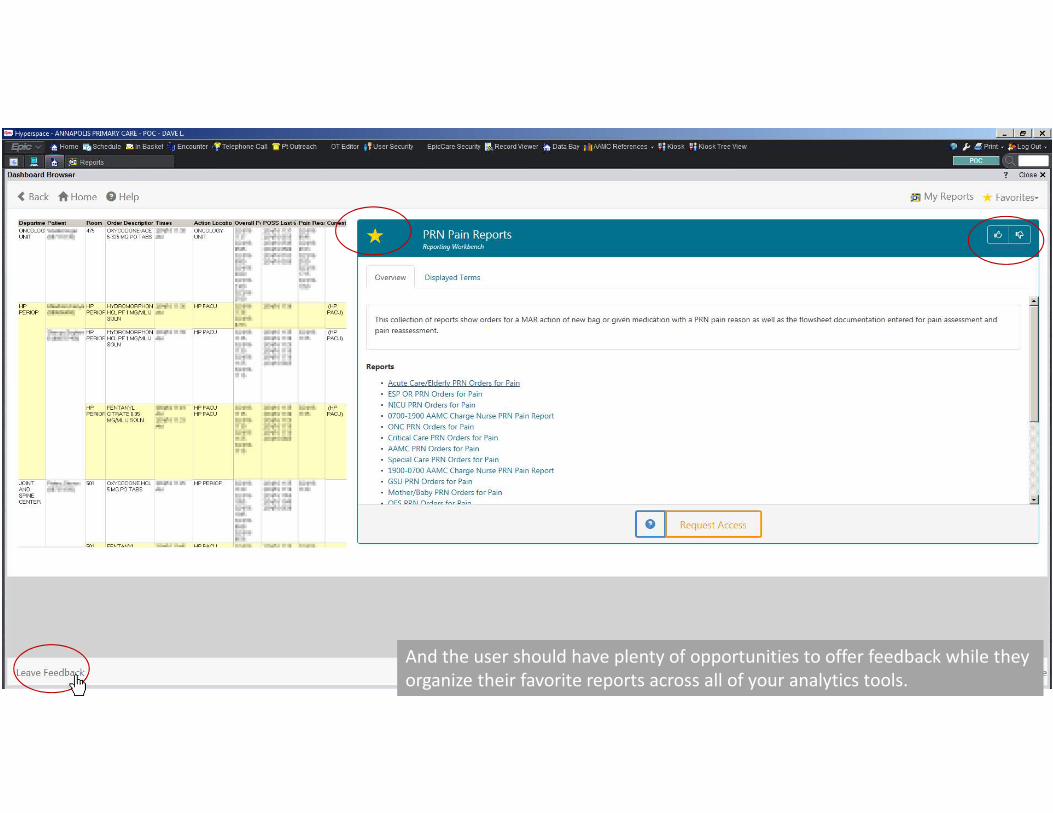
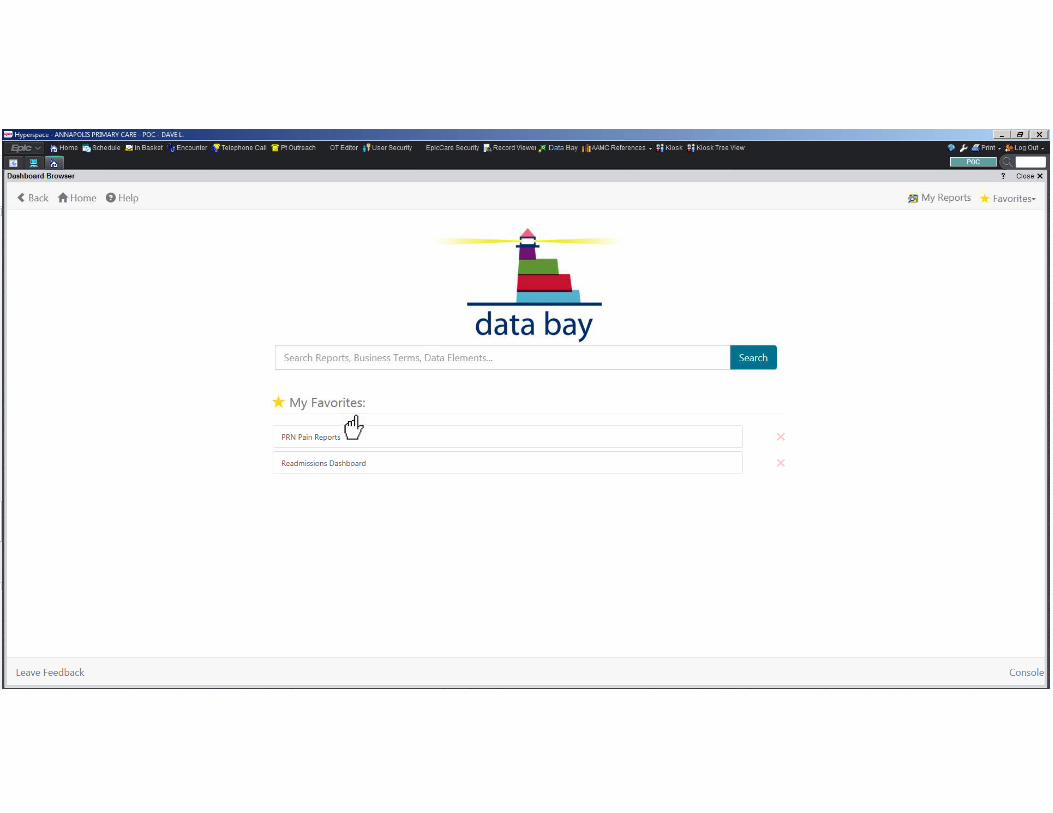
And the user should have plenty of opportunities to offer feedback while they
organize their favorite reports across all of your analytics tools.
And the user should have plenty of opportunities to offer feedback while they
organize their favorite reports across all of your analytics tools.

How do you get doctors to act on data they don’t know about?
Information Dissemination
Tackling ED Throughput
How we took the data into action in the ED

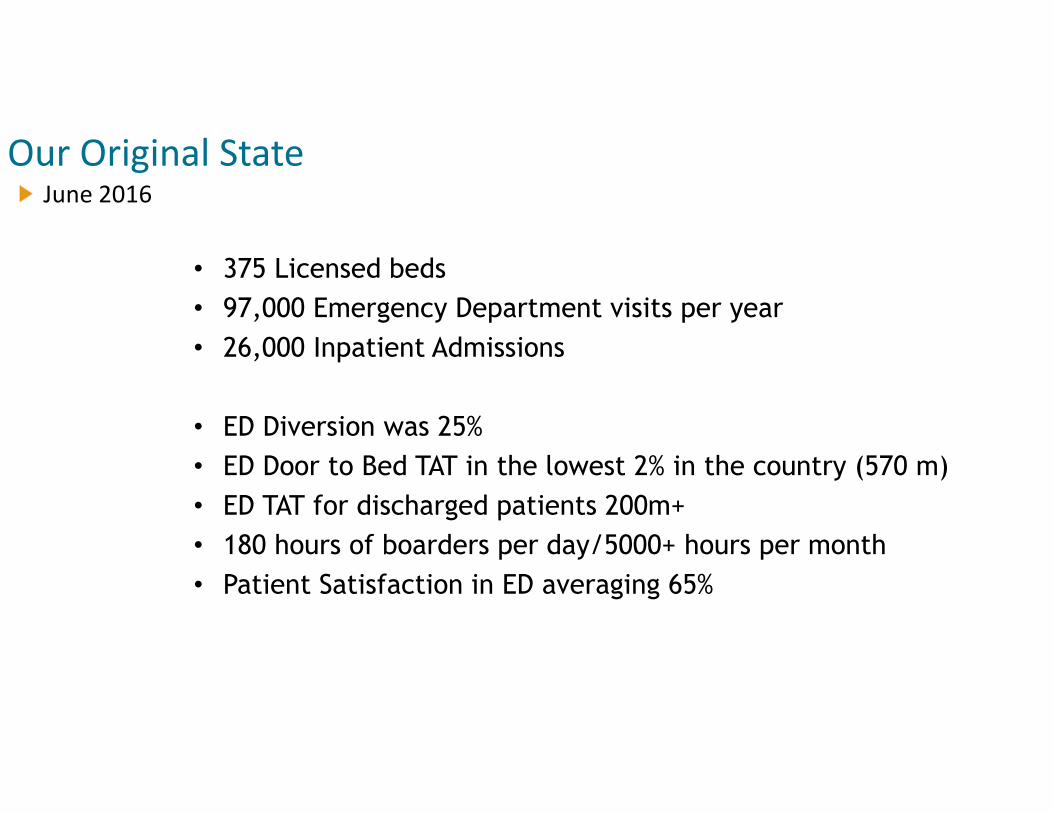
June 2016
Our Original State
• 375 Licensed beds
• 97,000 Emergency Department visits per year
• 26,000 Inpatient Admissions
• ED Diversion was 25%
• ED Door to Bed TAT in the lowest 2% in the country (570 m)
• ED TAT for discharged patients 200m+
• 180 hours of boarders per day/5000+ hours per month
• Patient Satisfaction in ED averaging 65%
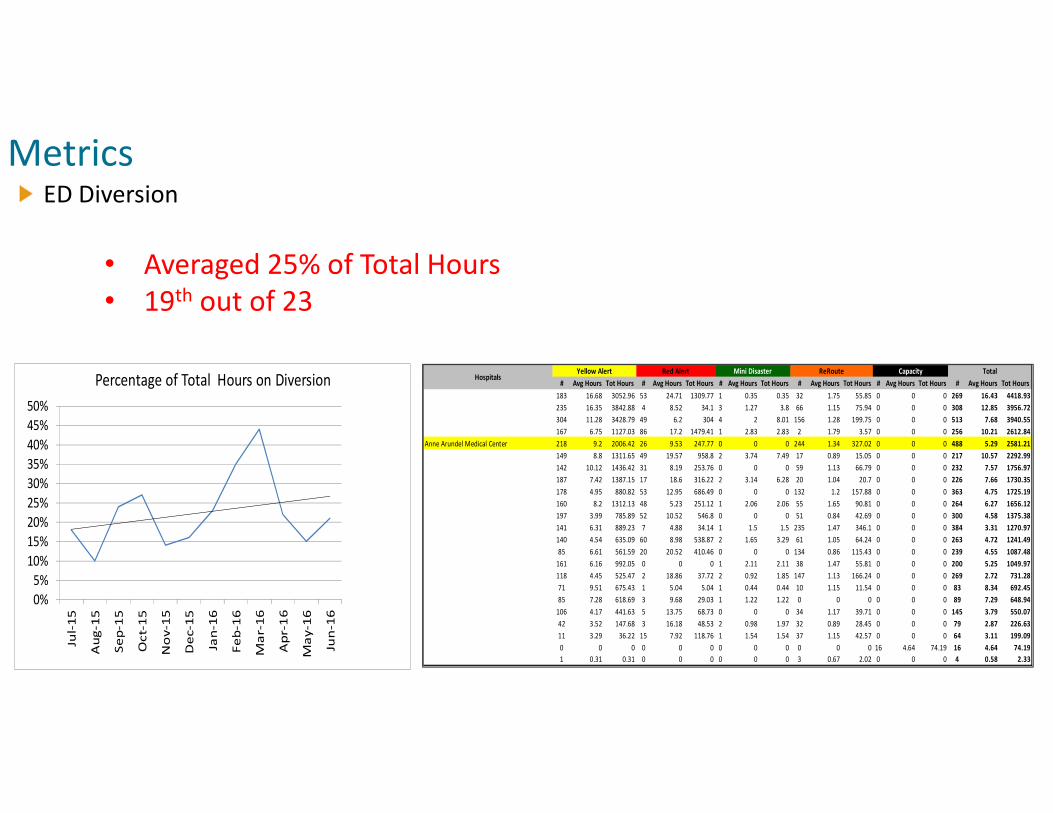
ED Diversion
Metrics
0%
5%
10%
15%
20%
25%
30%
35%
40%
45%
50%
Jul-
15
Au
g-1
5
Se
p-1
5
Oct-
15
No
v-1
5
De
c-1
5
Jan
-16
Fe
b-1
6
Ma
r-1
6
Ap
r-1
6
Ma
y-1
6
Jun
-16
Percentage of Total Hours on Diversion
• Averaged 25% of Total Hours
• 19th out of 23
# Avg Hours Tot Hours # Avg Hours Tot Hours # Avg Hours Tot Hours # Avg Hours Tot Hours # Avg Hours Tot Hours # Avg Hours Tot Hours
183 16.68 3052.96 53 24.71 1309.77 1 0.35 0.35 32 1.75 55.85 0 0 0 269 16.43 4418.93
235 16.35 3842.88 4 8.52 34.1 3 1.27 3.8 66 1.15 75.94 0 0 0 308 12.85 3956.72
304 11.28 3428.79 49 6.2 304 4 2 8.01 156 1.28 199.75 0 0 0 513 7.68 3940.55
167 6.75 1127.03 86 17.2 1479.41 1 2.83 2.83 2 1.79 3.57 0 0 0 256 10.21 2612.84
Anne Arundel Medical Center 218 9.2 2006.42 26 9.53 247.77 0 0 0 244 1.34 327.02 0 0 0 488 5.29 2581.21
149 8.8 1311.65 49 19.57 958.8 2 3.74 7.49 17 0.89 15.05 0 0 0 217 10.57 2292.99
142 10.12 1436.42 31 8.19 253.76 0 0 0 59 1.13 66.79 0 0 0 232 7.57 1756.97
187 7.42 1387.15 17 18.6 316.22 2 3.14 6.28 20 1.04 20.7 0 0 0 226 7.66 1730.35
178 4.95 880.82 53 12.95 686.49 0 0 0 132 1.2 157.88 0 0 0 363 4.75 1725.19
160 8.2 1312.13 48 5.23 251.12 1 2.06 2.06 55 1.65 90.81 0 0 0 264 6.27 1656.12
197 3.99 785.89 52 10.52 546.8 0 0 0 51 0.84 42.69 0 0 0 300 4.58 1375.38
141 6.31 889.23 7 4.88 34.14 1 1.5 1.5 235 1.47 346.1 0 0 0 384 3.31 1270.97
140 4.54 635.09 60 8.98 538.87 2 1.65 3.29 61 1.05 64.24 0 0 0 263 4.72 1241.49
85 6.61 561.59 20 20.52 410.46 0 0 0 134 0.86 115.43 0 0 0 239 4.55 1087.48
161 6.16 992.05 0 0 0 1 2.11 2.11 38 1.47 55.81 0 0 0 200 5.25 1049.97
118 4.45 525.47 2 18.86 37.72 2 0.92 1.85 147 1.13 166.24 0 0 0 269 2.72 731.28
71 9.51 675.43 1 5.04 5.04 1 0.44 0.44 10 1.15 11.54 0 0 0 83 8.34 692.45
85 7.28 618.69 3 9.68 29.03 1 1.22 1.22 0 0 0 0 0 0 89 7.29 648.94
106 4.17 441.63 5 13.75 68.73 0 0 0 34 1.17 39.71 0 0 0 145 3.79 550.07
42 3.52 147.68 3 16.18 48.53 2 0.98 1.97 32 0.89 28.45 0 0 0 79 2.87 226.63
11 3.29 36.22 15 7.92 118.76 1 1.54 1.54 37 1.15 42.57 0 0 0 64 3.11 199.09
0 0 0 0 0 0 0 0 0 0 0 0 16 4.64 74.19 16 4.64 74.19
1 0.31 0.31 0 0 0 0 0 0 3 0.67 2.02 0 0 0 4 0.58 2.33
TotalHospitals
Yellow Alert Red Alert Mini Disaster ReRoute Capacity
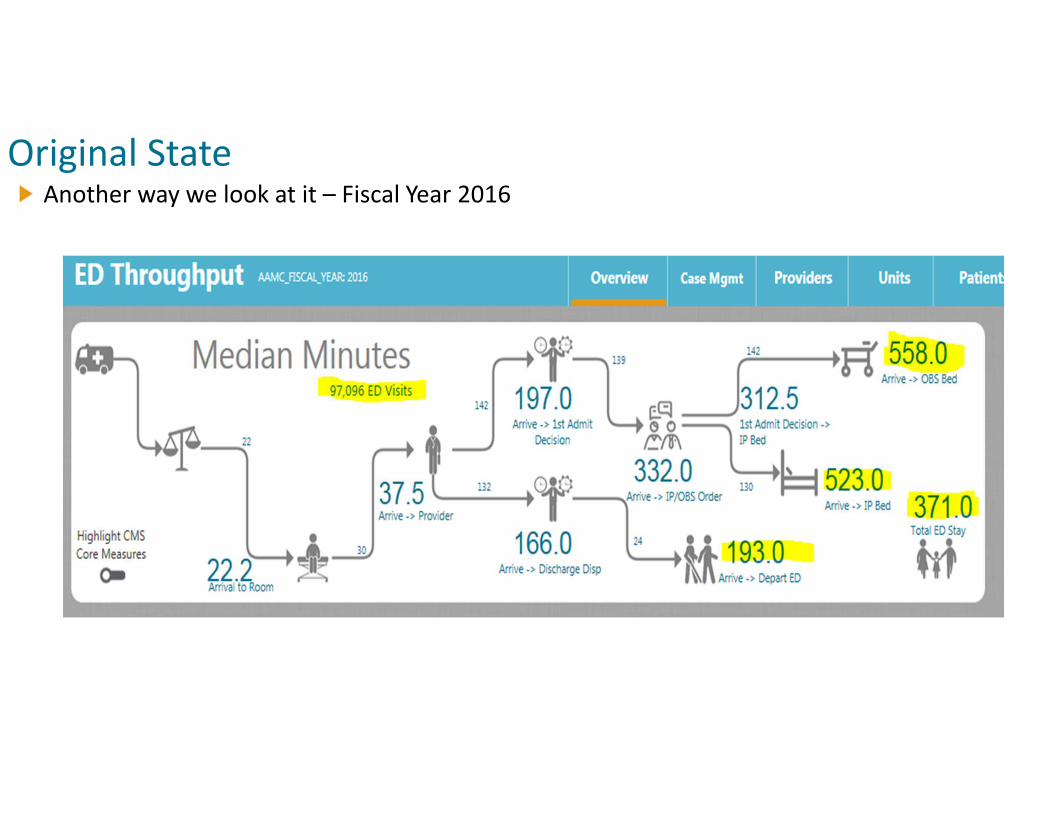
Another way we look at it – Fiscal Year 2016
Original State

A patient story
How did we start the work?
• Meet Auntie Esther
• ED throughput improvement became a True North Objective

What were the gaps?
• Lack of standard work throughout
• Inpatient bed alignment
• Not aligned with patient demand
• Many “rules” governing placement
• Variability in pulling patients to open beds from ED
• Variability in right patient status
• Inefficient use of ED space
• Too much patient movement
• Flow and siloes prohibited team based approach to care
• Variable workflow and volumes led to traffic jams
• Boarding patients stretched resources
• Data Rich-Information Poor
• Staffing Schedules and Structure Misaligned
The Puzzle Pieces
Solutions
• Mix of leadership driven projects and PDSA
• Acute Care Pavilion bed alignment and flow improvements• Right sized our Observation, Medical and IMC beds
• Increased inpatient bed capacity
• Reduced rules to a medical bed (Cardizem drip process)
• Focused on pulling patient out of ED
• Focused on earlier discharges
• Redesign Observation hourly flow redesignCare Management Processes (Impact on Throughput and Denials)
• Inpatient CM/Physician Pairing
• ED CM to drive appropriate placement
• CM workflow
• ED Value Stream based process improvement
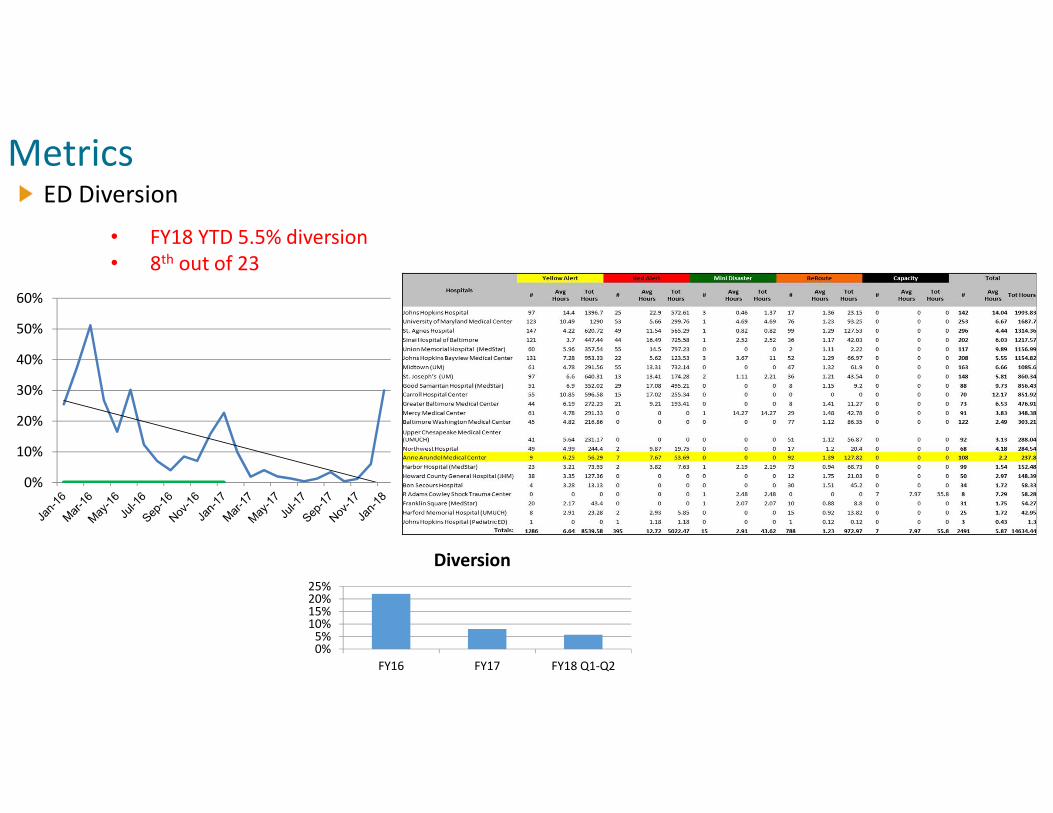
ED Diversion
Metrics
0%5%
10%15%20%25%
FY16 FY17 FY18 Q1-Q2
Diversion
0%
10%
20%
30%
40%
50%
60%
• FY18 YTD 5.5% diversion
• 8th out of 23
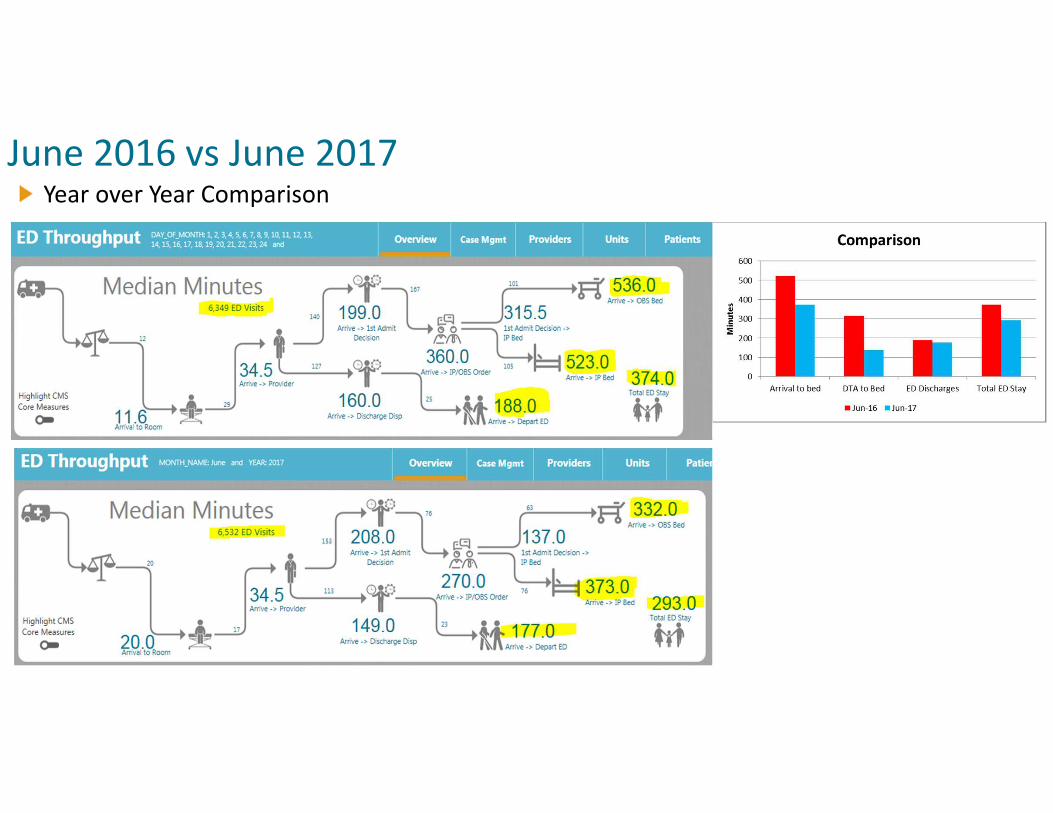
Year over Year Comparison
June 2016 vs June 2017
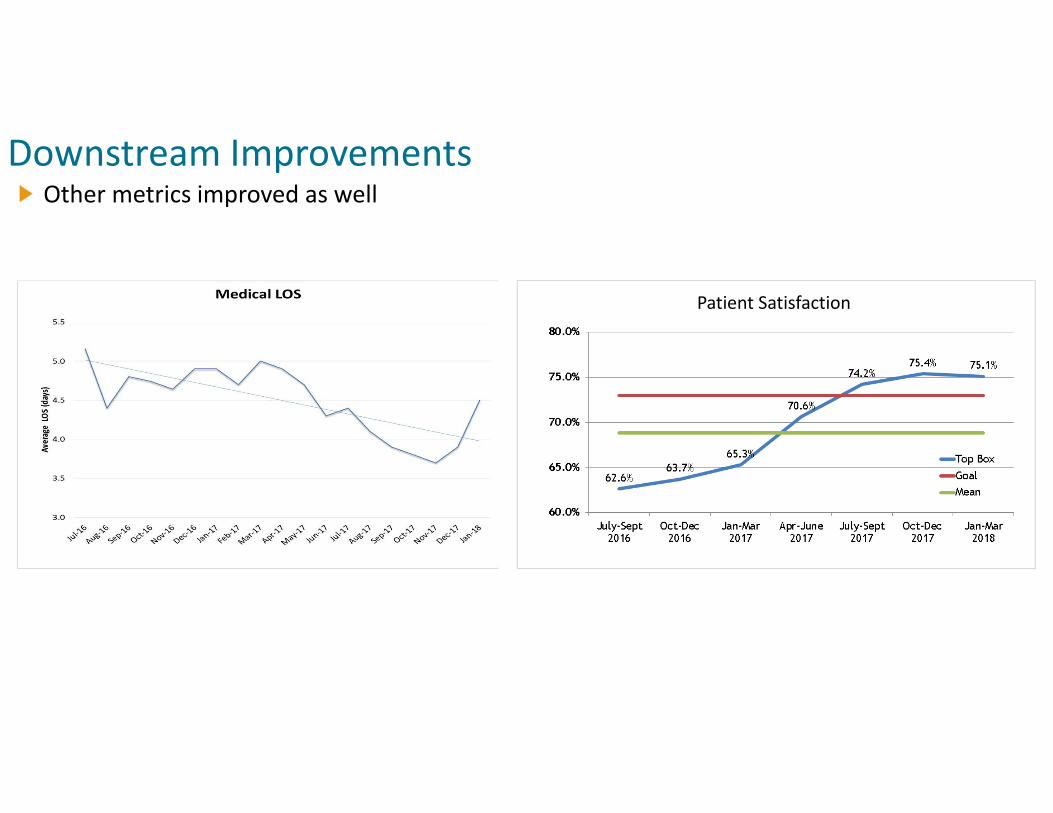
Other metrics improved as well
Downstream Improvements
Patient Satisfaction

Tackling Opioids
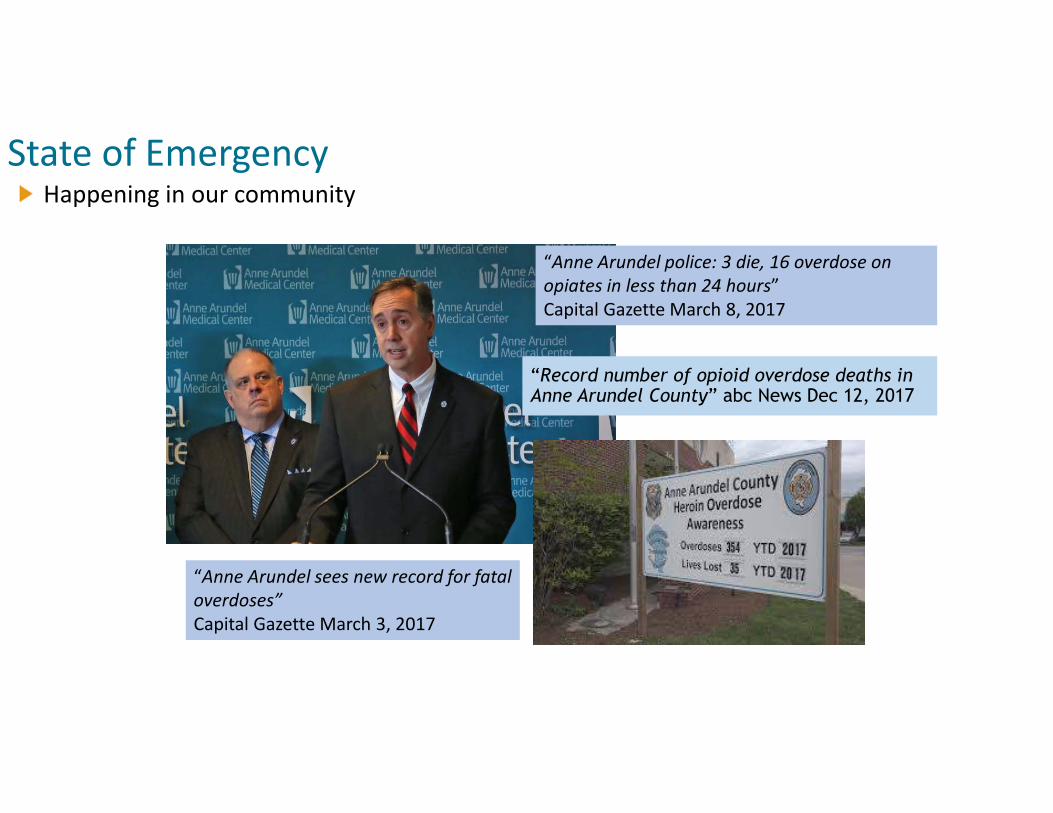
Happening in our community
State of Emergency
“Anne Arundel sees new record for fatal
overdoses”
Capital Gazette March 3, 2017
“Record number of opioid overdose deaths in Anne Arundel County” abc News Dec 12, 2017
“Anne Arundel police: 3 die, 16 overdose on
opiates in less than 24 hours”
Capital Gazette March 8, 2017

Concentration of Opioid Related Overdoses
State of Emergency
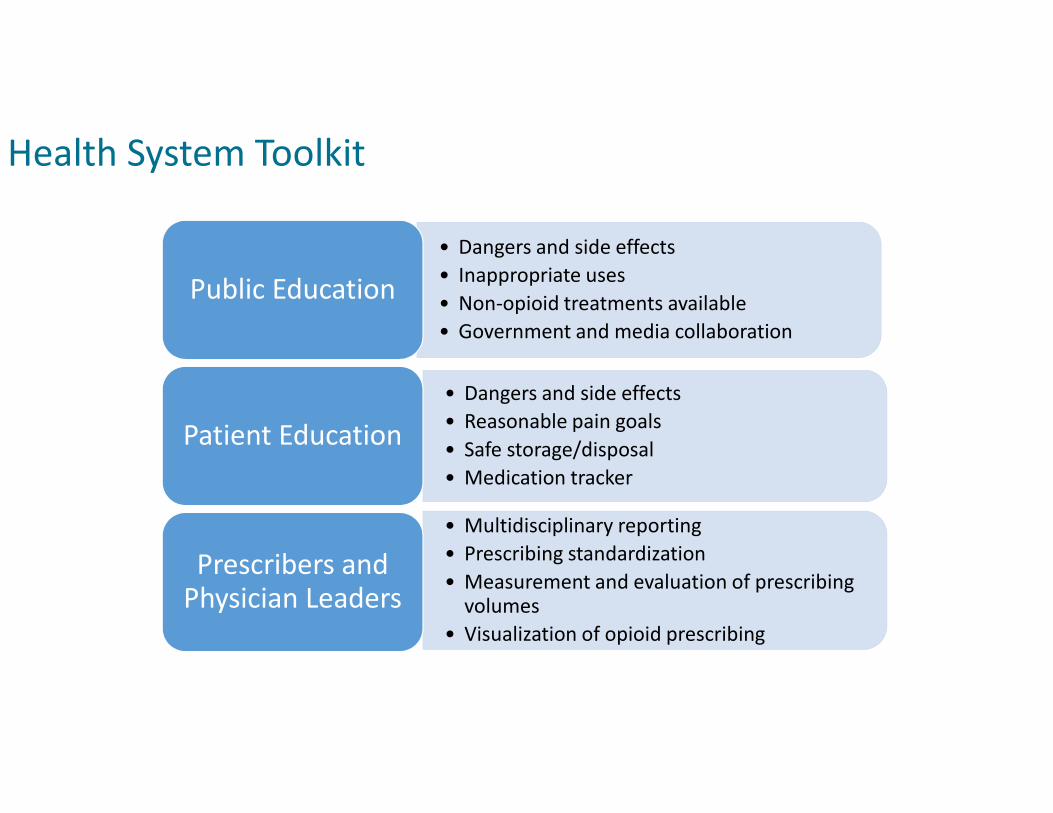
Health System Toolkit
• Dangers and side effects
• Inappropriate uses
• Non-opioid treatments available
• Government and media collaboration
Public Education
• Dangers and side effects
• Reasonable pain goals
• Safe storage/disposal
• Medication tracker
Patient Education
• Multidisciplinary reporting
• Prescribing standardization
• Measurement and evaluation of prescribing volumes
• Visualization of opioid prescribing
Prescribers and Physician Leaders
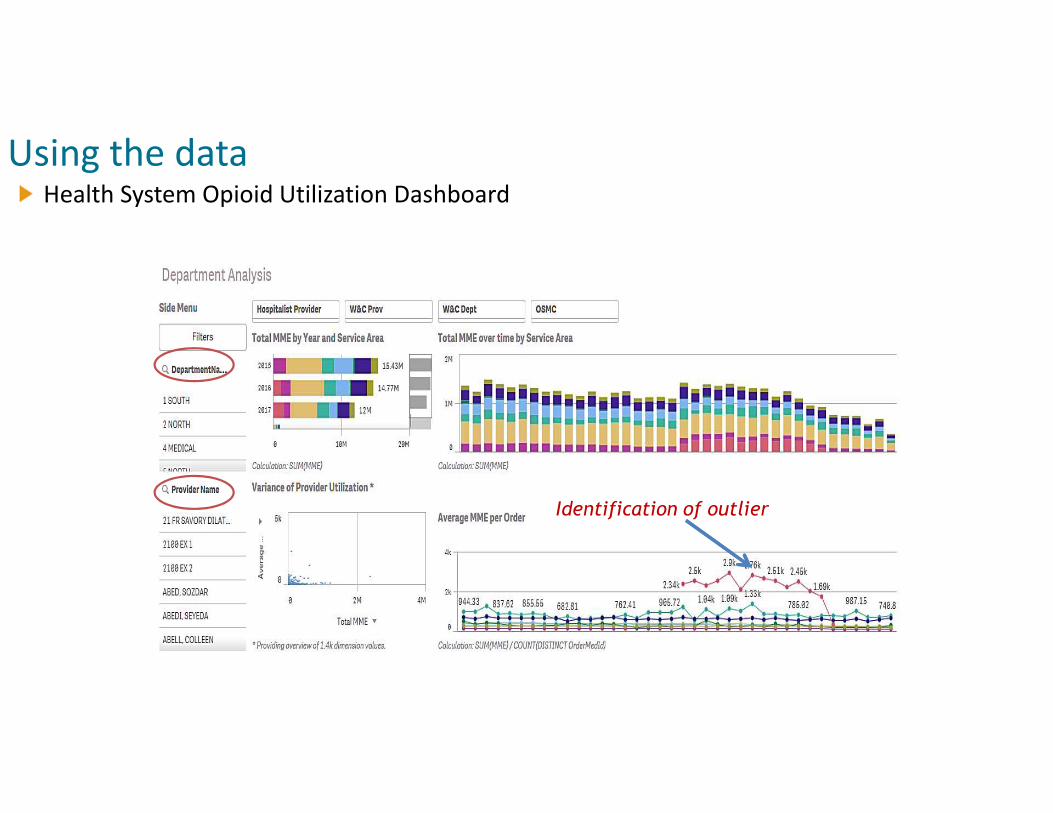
Health System Opioid Utilization Dashboard
Using the data
Identification of outlier
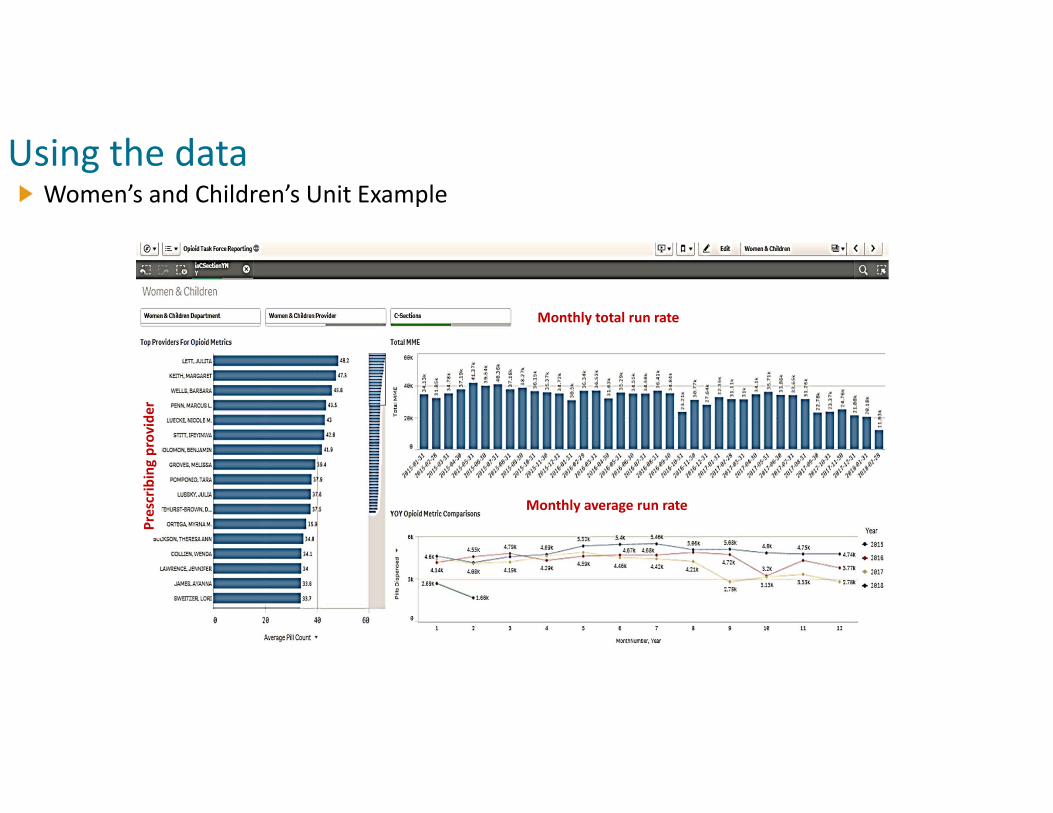
Women’s and Children’s Unit Example
Using the dataP
resc
rib
ing
pro
vid
er
Monthly average run rate
Monthly total run rate
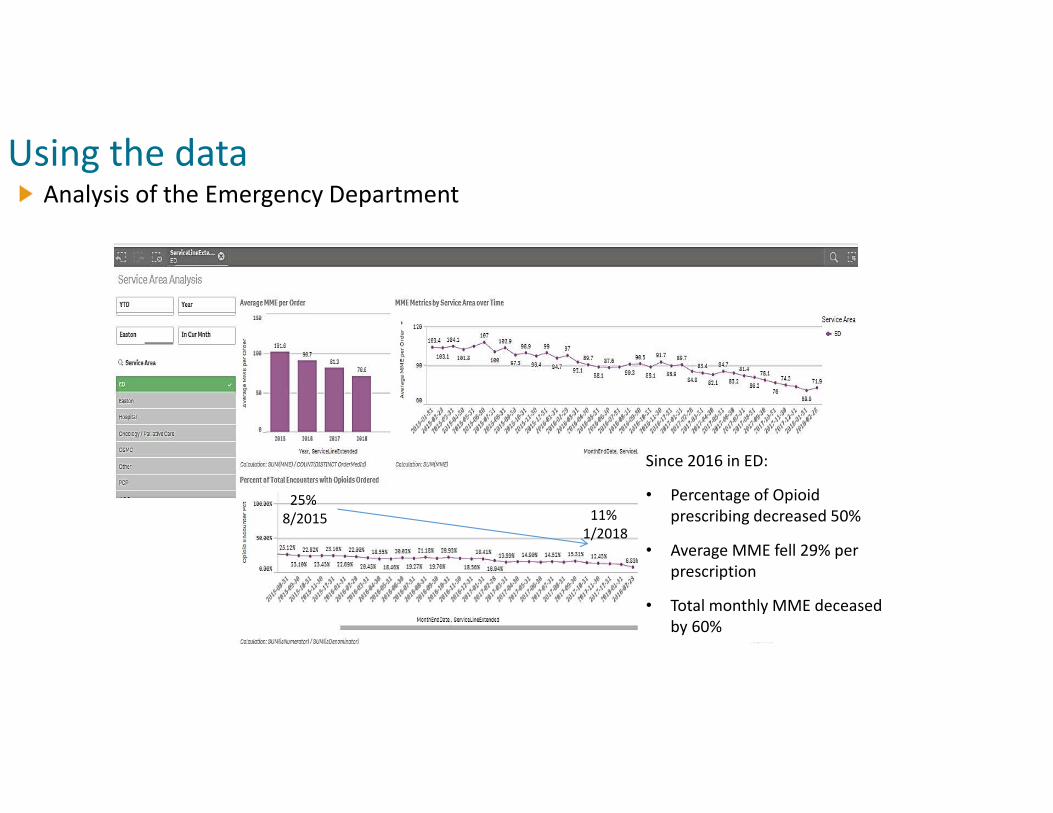
Analysis of the Emergency Department
Using the data
25%
8/2015 11%
1/2018
Since 2016 in ED:
• Percentage of Opioid
prescribing decreased 50%
• Average MME fell 29% per
prescription
• Total monthly MME deceased
by 60%
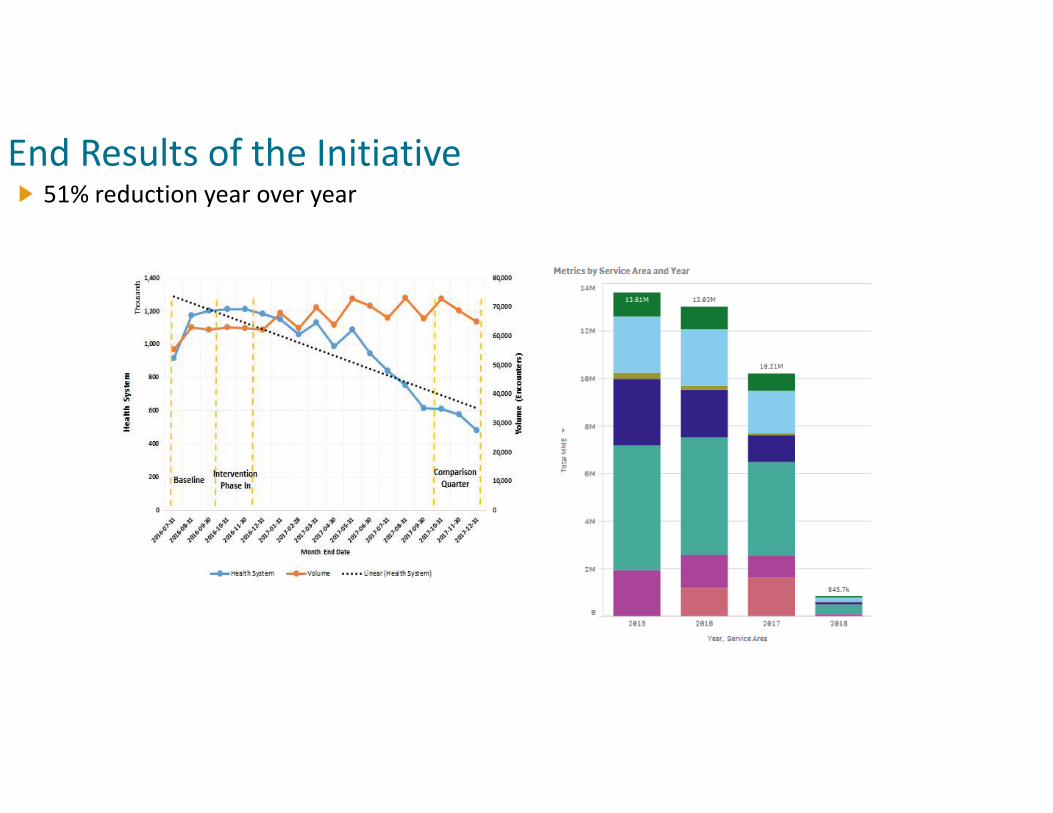
51% reduction year over year
End Results of the Initiative

Takeaways for Your Organization
Things you should do…

From ED Throughput
Take Home Learning Points
• There is a need to break down silos
• Culture building
• Organization wide accountability – true north

Thank You
Mitch Schwartz, M.D.
CMO
Barb Jacobs
CNO
Dave Lehr
CIO
Yuki Uchino
Analytics Director