Academy of Romanian Scientists Annals Series on Biological ...

Annals of the National Academy of Medical Sciences (India)
JUN BE ID LL EO E
GVolume 51, No. 4Oct-Dec, 2015
ISSN 0379 - 038X
Annals of the National Academy of Medical Sciences (India)-: A quarterly Journal :-
Editor
Dr. Sanjeev Misra
Associate EditorsDr. V Mohan KumarDr. Kuldeep Singh
Assistant EditorDr. Mohan Kameswaran
Editorial Board Editorial Associates
Members of the Advisory Board
Dr. Snehalata Deshmukh Dr. W Selvamurthy Dr. J N Pande Dr. Prema Ramachandran Dr. H S Sandhu Dr. Lalita S Kothari Dr. Vinod Paul Dr. Sanjay Wadhwa
Dr. M V Padma SrivastavaDr. R K ChaddaDr. Deep N SrivastavaDr. Promila BajajDr. N R JagannathanDr. Subrata SinhaDr. Ravinder GoswamiDr. (Brig) Velu Nair
Dr. P K MisraDr. M Berry Air Marshal Dr. M S Boparai Dr. Y K Chawla Dr. P K Dave Dr. Amod Gupta Dr. Ravi Kant Dr. Balram AiranDr. Saroj Chooramani Gopal
Dr. Rajeshwar DayalDr. C S SaimbiDr. R MadanDr. Raj KumarDr. Mukund S JoshiDr. Kamal BucksheeDr. Haribhai L PatelDr. I C VermaDr. Geeta K Vemuganti
Emeritus Editor: Prof. J.S. Bajaj
Annual Subscription Rates
InlandForeign
Single Copy
Rs. 500.00$ 30.00£ 15.00Rs. 150.00
CorrespondenceAll correspondence concerning the Journal should be addressed to:
Honorary SecretaryNational Academy of Medical Sciences (India)
NAMS House, Ansari Nagar, Mahatma Gandhi Marg, New Delhi-110029Tel.: 011-26589289 Email: [email protected]
Website: www.nams-india.in

Vol 51, No 4 (2015) Table of Contents Editorial J S Bajaj
PDF i-ii
ARTICLES
Gene discovery in glioma in the context of molecular reclassification of tumors Khushboo Irshad, Akansha Jalota, Kunzang Chosdol, Subrata Sinha
PDF 125-139
Understanding the Pathophysiology of Spinocerebellar Ataxias through genetics, neurophysiology, structural and functional neuroimaging Pramod Kumar Pal
PDF 140-155
Assessment in Medical Education: Time to Move Ahead Piyush Gupta
PDF 156-165
From Research to Policy to Programme: Success Story of Seven State Iodine Deficiency Disorders (IDD) Survey in India Chandrakant S Pandav
PDF 166-177
Diagnosis of Childhood Leprosy – Changing Trends Rajeshwar Dayal
PDF 178-193
Instructions to Authors
Instructions to Authors

Editorial
Research and consultation with senior physicians are important issues. William Osler provided a combination of research stating that in Montreal General Hospital there were admitted from Dec. 14, 1873, to July 21, 1875, 260 cases of smallpox. Of these, 24 or 9.23 percent died of the haemorrhagic variety. He also consulted Dr. Howard, the leading practitioner who confirmed the diagnosis. He demonstrated research and need for consultation with a senior physician.
The physician is supposed to satisfy the patient in a holistic manner or in other words, win the trust (1).
What is more important are the events associated with one of the patients. I quote verbatim from Osler's biography (2).
In the autumn of 1875, he chanced to meet an attractive English young man, who was visiting Montreal on business. One evening, observing that he appeared ill, Osler questioned him, and suspicious of the symptoms, advised him to go to his room where the following morning, the diagnosis of haemorrhagic smallpox was evident. The young man died after an illness of three days.
As there was no other relation or friend of the patient, Osler arranged and participated in the last rites of the patient and wrote a letter to the father of the deceased. It is a letter I have read several times in my professional career, and each time I have discovered a new dimension of the professional values. Let me share it with you :
“My dear Sir, No doubt before this, the sorrowful intelligence of your son's death has reached you, and now, when the first shock has perhaps to a slight extent passed away, some further particulars of his last illness may be satisfactory. On the evening of Thursday 22nd & on the following day, I discovered unmistakable evidence of the nature of his disease. On Saturday in consultation with Dr. Howard – the leading practitioner of our city, his removal to the smallpox Hospital was decided upon. I secured a private ward & took him there in the evening.
He was easier on Sunday morning, but well aware of his dangerous state. He spoke to me of his home & his mother and asked me to read the 43rd chapter of Isaiah, which she had marked in his Bible. I spent the greater part of the morning talking and reading with him.
(i)

(ii)
After 11.00 PM he began to sink rapidly & asked me not to leave him. He did not speak much but turned round at intervals to see if I were still by him. About 12 O'clock I heard him muttering some prayers, but could not catch distinctly what they were. Shortly after this he turned round and held out his hand, which I took, & he said quite plainly, 'Oh thanks'. These were the last words the poor fellow spoke. From 12.30 he was unconscious, and at 1.25 AM passed away, without a groan or struggle. Such my dear sir, as briefly as I can give them, are the facts relating to your son's death.”
Thirty years almost to the day after this letter was written, the newly appointed Regius Professor of Medicine in Oxford chanced to meet at dinner a Lady S___, who, attracted by his name, said that she once had a young brother who had gone out to Montreal and been cared for during a fatal illness by a doctor named Osler, who had sent a sympathetic letter that had been the greatest possible solace to her parents : that her mother, who was still living in the south of England, had always hoped she might see and talk with the man who had written it. Later, on his way to Cornwall, Osler paid a visit to this bereaved mother, taking with him a photograph of her boy's grave, the request for which he had sent to Montreal to obtain.
Above narrative illustrates how a good physician combines excellence in clinical research, and a profound skill of communication.
Emeritus Editor
References:
1. Gupta P (2015). Assessment in Medical Education : Time to Move Ahead. Ann Natl Acad Med Sci (India) 51(4) : 156-165.
2. Biography of Sir William Osler by Harvey Cushing. Vol. I, p. 136.

Ann Natl Acad Med Sci (India), 51(4): 125-139, 2015
Gene discovery in glioma in the context of molecular reclassification of tumors
Conventional classification of tumors, especially in terms of staging and grading is of immense importance for both prognostication as well as management strategies. However it is not a perfect system and there are many instances where tumor behaviour does not correspond to what is expected. In addition, with the onset of targeted therapy, the identification of the distinct molecular target in a subset of tumors becomes a marker of tumor behaviour as well as a target of therapy. This leads to the concept of molecular subclassification of tumors where molecular markers further refine and in some cases, alter conventional classification. We would be presenting this concept in relation to glial tumors, especially in the context of molecular markers discovered in our laboratory.
Key words : Glioma, histology, molecular markers, WHO grade, TCGA.
Correspondence : Prof. Subrata Sinha, Director, National Brain Research Centre (NBRC), Near NSG Campus, Nainwal Mode, Manesar, Gurgaon, Haryana-122050. Phone +91-124-2338929 Fax: +91-124-2338928, Email: [email protected] / [email protected].
DR. V. R. KHANOLKAR ORATION delivered during NAMSCON 2014 at the All-India Institute of Medical Sciences, Rishikesh.
1 1 1 2Khushboo Irshad , Akansha Jalota , Kunzang Chosdol , Subrata Sinha1Department of Biochemistry, All India Institute of Medical Sciences, New Delhi2National Brain Research Centre (NBRC), Manesar, Gurgaon, Haryana-122050.
SUMMARY

126Gene discovery in glioma in the context of molecular reclassification of tumors
Diagnosis and grading of gliomas :
Malignant gliomas are one of the lethal central nervous system (CNS) cancers with high mortality rate. The molecular and genetic changes observed in the development and progression of gliomas are becoming better understood but are far from complete and many more molecular markers need to be identified and analyzed. For establishing a diagnosis of CNS cancers histologic examination of the biopsied tissue sample is the gold standard along with radiological analysis to highlight the location of the tumor as well as to correlate the clinical symptoms.
G l i o m a s a r e c l a s s i f i e d histologically, using the grading system mainly based on the St. Anne/Mayo criteria, on the basis of cell type and the degree of differentiation, into different grades like WHO (World Health Organization) grade-I, WHO grade-II and so on (1). On the basis of the origin of cells, WHO classifies gliomas into astrocytomas, oligodendrogliomas, e p e n d y m o m a s a n d m i x e d oligoastrocytomas (1, 2). And on the basis of the degree of cellular differentiation astrocytoma is graded into four WHO grades (WHO grade I-IV). WHO grading of astrocytomas is one of the most important prognostic factors in predicting patient outcome, with WHO grade-I having low proliferative potential and non progression to higher grades. They are more likely to be cured following surgery. Grade II exhibit marked potential for subsequent progression towards grade III and grade IV with fatal outcome (1).
The conventional mode of treatment is surgery followed by chemo- and radio-therapy, based on histological tumor grades. However, histological grading of gliomas can be difficult and subject to inter-observer variation (3 ) as well as influenced by the biases of treating physician and institutional practice patterns (4). With the advancement in the understanding of the tumor development and involvement of different oncoproteins a n d t u m o r s u p p r e s s o r s , immunohistochemistry (IHC) has been e m p l o y e d t o i d e n t i f y p r o t e i n s (immunomarkers) that are involved or affected in the process of tumorigenesis with implications in diagnosis and prognosis. For example, overexpression of p53 protein has been used to differentiate astrocytic tumors from oligodendrogliomas as well as to determine the histological grading of astrocytic tumors (5). Similarly, other proteins like EGFR, PDGFR, CD44, OLIG2 etc. have been demonstrated as biomarkers for diagnosis and prognosis of gliomas.
Molecular genetic analysis and gene expression profiling further helped in tumor subclassification and are found to correlate better with prognosis than histology. In glioma, the molecular tumor subgroups formed on the basis of differential gene expression have been found to associate with distinct patterns of genetic changes in terms of LOH (loss-of-heterozygosity), gene amplification and mutations etc. Some of the well studied markers helping in the diagnosis and prognosis of gliomas are LOH of 1p/19q,

loss of 17p and 10q, amplification of EGFR and mutations of IDH1/IDH2 etc. (3). Glioblastomas (WHO grade IV) are of t w o t y p e s , d e n o v o ( p r i m a r y g l i o b l a s t o m a s ) a n d s e c o n d a r y glioblastomas (progression from low-grade gliomas). Primary glioblastomas develop in older patients and are characterized by EGFR overexpression, PTEN mutations, p16 deletions, and occasionally, MDM2 amplification whereas secondary glioblastomas develop in younger patients and typically have TP53 mutations(6). These subtypes constitute distinct molecular features that evolve via different genetic pathways and show different prognosis and response to therapy.
It is now increasingly apparent that epigenetic changes such as DNA methylation and histone modification affect gene expression in a significant way so as to affect cancer phenotype and treatment response (7). Hypermethylation is associated with heterochromatization and reduced target gene expression. In glioma hypermethylation of O(6) methylguanine-DNA methyltransferase (MGMT) gene promoter is an indicator of better response to temozolomide (TMZ) (8). MGMT is a DNA repair enzyme (demethylating DNA bases) and protect cells from cell death. Temozolomide (TMZ) ki l ls cel ls by increased methylation of purine bases of DNA, hence, hypermethylated MGMT (low expression) is an indicator of better TMZ response (9). The 1p/19q co-deletion or MGMT methylation status are being implicated in clinical practice to stratify or select patients with diffuse glioma for
further management.
Similarly, the recently discovered non coding RNAs which get processed into miRNAs are found to target mRNA sequences and induce their degradation or translational silencing. Role of miR-21 in down-regulating expression of tumor suppressor PDCD4 is well known in gliomas (10) and other tumors (11, 12, 13 ). The tumor suppressor p53 was found to be a positive regulator of miR-34a expression and miR-125b as a negative regulator of p53 (14, 15). These are few examples of the functional relationship between mRNA & miRNA and their role in tumor progression. These genetic and m o l e c u l a r c h a n g e s ( D N A / epigenetic/RNA) are being considered as biomarkers, helping in improved diagnostics, prognostication and therapeutic outcomes. The hybrid terminology for the combination of diagnostics and therapy in a single molecule recently has been coined as 'theranostics' (16). Use of these molecular markers in routine clinical practices has helped in grading and classifying gliomas in more objective manner than with the use of histology alone.
Another important marker type identified is the cancer stem cell (CSC) markers. They are considered to be important predictor of prognosis and recurrence of tumors but currently no CSC markers are in clinical use. Recently, a study showed the significance of Nestin expression and its association with short progression-free survival (PFS) in WHO grade II tumors (17).
127 Subrata Sinha

128
Molecular markers predictive of tumor behaviour used in clinical practice :
Molecular phenotyping is being increasingly used nowadays as a means of diagnosis as well as prognostication in glioma patients. Mutations in IDH1 occur mostly in patients with secondary GBMs and have been associated with an increase in overall survival (18). In primary GBM tumors, simultaneous mutations in p53 and EGFR amplification were found to be significantly associated with worse survival (19). Methylation of DNA repair g e n e O ( 6 ) - m e t h y l g u a n i n e - D N A methyltransferase (MGMT) promoter and high PTEN protein expression have been shown as favorable factors for prolonged survival in GBM patients treated with temozolomide (20, 21 ). 1p/19q co-deletion has been shown to correlate with b e t t e r o u t c o m e i n a n a p l a s t i c ol igoastrocytoma and anaplast ic oligodendroglioma patients (22).
Molecular subtyping of histologically similar tumors: TCGA Classification of tumors :
Recently, there have been global efforts on the process of classifying tumors based on pooling of high throughput data from several centres. A major initiative by the National Cancer Institute (NCI), the National Human Genome Research Institute (NHGRI), and 27 institutes/centers of the National Institute of Health (NIH) have established the Cancer Genome Atlas (TCGA) Research Network (2008) which has generated a vast, comprehensive
catalogue of genomic abnormalities underlying tumorigenesis in more than 20 types of cancers (23, 24). With respect to GBM, the repository provides detailed genomic changes in a cohort containing over 500 patient samples (25). Computational analyses of the TCGA data have identified four molecular subtype p r o f i l e s o f G B M : C l a s s i c a l , Mesenchymal, Proneural, and Neural; based on the expression of signature genes (23) . The Class ica l subtype i s characterized by EGFR amplification, homozygous deletion of Ink4a/ARF locus, and chromosome 7 amplifications and chromosome 10 deletions. The Mesenchymal subtype shows high frequency of NF1 mutation/deletion with low NF1 mRNA expression and high expression of CHI3L1 and MET. The Proneural subtype is associated with PDGFRA abnormalities and mutations in IDH1 and TP53, while the Neural subtype GBMs are confirmed by the expression of neuron markers like NEFL, GABRA1, SYT1 and SLC12A5. The gene expression signatures found in the Neural subtype are suggestive of neural, astrocytic and oligodendrocytic cellular phenotype. Although morphologically indistinguishable, these subtypes exhibit distinct molecular profiles, survival length as well as treatment response.
It is expected that this and similar approaches of combining high throughput analysis of tumor types will result in a molecular classification of tumors – as a further refinement of histological grading, that would enable prognostication and treatment strategies based on specific
Gene discovery in glioma in the context of molecular reclassification of tumors

129
molecular alterations in the tumors. Hence, there has been extensive research based on both high throughput as well as conventional analysis to identify molecular features that would predict behaviour as well as identify susceptible points in a tumor cell that could be used for individualized therapeutic intervention.
Experimental markers in diagnosis and therapy :
Several genetic alterations define subclasses in GBM that describe differing diagnosis as well as response to targeted therapies. Coexpression of EGFR variant III and PTEN by GBM cells is associated with responsiveness to EGFR kinase inhibitors (26). Another therapeutic inhibitor, bevacizumab, is an anti-VEGF-A monoclonal antibody that targets the very hallmark of GBM pathogenesis, i.e. angiogenesis. It received FDA's approval for recurrent glioblastoma in May 2009, based on the significant response rate and clinical benefits demonstrated by randomized phase II studies. A subsequent meta-analysis of 15 studies published from 2005 to 2009, involving 548 patients, has shown similar efficacy benchmarks as those in the phase II studies (27).
Recent reports also suggest miRNA expression profiles as more effective in tumor classification than protein-coding gene expression profiles. The advantages of miRNAs as biomarkers include a less extensive miRNA expression data (1000 miRNAs as opposed to >40,000 protein-coding
genes). Further, miRNAs are less subjected to degradation and more easily retrieved from formalin-fixed, paraffin-embedded tissues (28, 29, 30, 31 ). miRNA signatures have been identified as independent predictors for determining high risk of unfavorable outcome in GBM patients (28). Li et al have analyzed miRNA signature in five subtypes [Classical, Mesenchymal, Neural, Proneural-CpG island methylator phenotype (G-CIMP) and Proneural-non G-CIMP] of GBM in the TCGA dataset (32). They identified a prognostic miR signature in Mesenchymal subtype that may help in sub-stratification of the patients for personalized treatment and management.
Our approaches to gene discovery in glioma markers :
Our laboratory identified a novel gene 'FAT1' by employing RAPD (random amplification of polymorphic DNA)-PCR technique in astrocytic tumors of WHO grade II and IV (33). RAPD-PCR is a locus non-selective DNA fingerprinting technique that detects alterations by scanning the entire genome. Scoring of alterations [loss/gain/change in the intensity of band(s)] is done by comparing the band pattern of tumor DNA with that of normal leucocytes DNA (Fig. 1a). Since the technique is not restricted to a defined locus, it enables identification of genomic regions that have not yet been published or have not been obvious immediately after analysis of sequences. With the use of RAPD primer 80/07, loss of a 500bp band was detected in 33%
Subrata Sinha

80/01
B T
70/04
B T
70/01 60/31
B T B T(a) (b)
(c)
A1B T B T T B B T
A2 A3 A4
(i) 500bp
(ii) 500bp
1 kb
0.7 kb
A1M B T B T
A2
80/07
Figure 1: (a) Representative RAPD gel profile showing alterations (arrows) in the form of loss/gain/change in intensity of band(s) in tumor (T) as compared to normal leucocyte DNA (B) of the same patient, with different primers (primer nos. 80/01, 70/04, 70/01, 60/31). (b-i) RAPD gel profile of primer no. 80/07 indicating the frequent loss of a 500 bp band (arrow) in astrocytic tumors (T) as compared to the corresponding normal leucocyte DNA (B). (b-ii) Southern blot of the same RAPD profile, Southern hybridization was done to confirm the altered fragment with a radiolabeled probe prepared from 500 bp altered band eluted from the RAPD profile of normal DNA from another gel. (c) Amplification of normal (B) and tumor (T) DNA with loss of 500 bp band with specific primer pair designed to amplify the FAT gene corresponding to the altered band along with 100 bp on either side. Bands were eluted from the gel and sequenced to look for deletion(s)/mutation(s) at RAPD primer binding sites. M represents molecular marker (Source: Chosdol et al BMC Cancer 2009; Creative Commons Attribution License 4.0).
(4/12) of the grade II astrocytic tumors studied (Fig. 1b). The high frequency of the alteration suggested its association w i t h t u m o r i g e n e s i s . F u r t h e r characterization of the corresponding band in normal DNA was carried out by
Southern hybridization, cloning and sequencing followed by BLAST search in the public domain genome database which showed 100% homology to FAT1 at exon2-intron2 junction on chromosome 4q34-q35 locus.
130Gene discovery in glioma in the context of molecular reclassification of tumors

131 Subrata Sinha
Figure 2: Simultaneous knockdown of FAT1 and PDCD4 reverses the effects of FAT1 knockdown. (a) FAT1 and PDCD4 mRNA expression was analyzed by q–PCR in U87MG cells treated with siFAT1 and siPDCD4 alone, as well as both the siRNAs treated simultaneously. Treatment with siFAT1+siControl was found to upregulate PDCD4 expression, whereas treatment with siFAT1+siPDCD4 downregulated the PDCD4 expression to the level of siControl-treated cells alone. (b, c) Simultaneous knockdown of FAT1 and PDCD4 in U87MG cells restored their migratory and invasive properties comparable to that of siControl-treated cells. There was significant increase in cell migration and invasion in U87MG cells treated with
3.5
3
2.5
2
1.5
1
0.5
0FAT1/18S PDCD4/18S
sicontrol
siFAT1+sicontrol
siPDCD4+sicontrol
siFAT1+siPDCD4
sicontrol
siFAT1+sicontrol
siPDCD4+sicontrol
siFAT1+siPDCD4
siControl siFAT1+siControl siPDCD4+siControl siFAT1+siPDCD4
Fold Migration Fold Invasion
Fo
ld E
xp
ressio
n
1.4
1.2
1
0.8
0.6
0.4
0.2
0
P<0.001P<0.001
a b
Mig
rati
on
c
Invasio
n
d 2.0
1.5
1.0
0.5
0.0
Re
lati
ve
AP
1 l
uc
ife
ras
e
ac
tiv
ity
(%
)
PGL3 siControl siFAT1 siPDCD4 siFAT1
siControl siControl siPDCD4+ + +
Fo
ld E
xp
res
sio
n
2.50
2.00
1.50
1.00
0.50
0.00
P<0.01 e sicontrol
siFAT1+sicontrol
siPDCD4+sicontrol
siFAT1+siPDCD4
MMP3 VEGF PLAU COX2 IL6 IL1ß
siControl
siFAT1
siPDCD4
PDCD460, 60
p-c-Jun, 43
VEGF-C, 47
COX-2, 74
ß-actin, 43
+
-
-
+
+
-
+
-
+
-
+
+

Available literature on FAT1 shows its dual role in human cancers. FAT1 has been demonstrated as an oncogene in breast carcinoma, leukemia and oral squamous cell carcinoma (34, 35, 36).However, other reports have suggested its tumor suppressor role in oral cancer and Mayer-Rokitansky-Küster-Hauser (MRKH) syndrome (37, 38).
Initial report from our laboratory had shown LOH at FAT1 locus in 50% of grade II and IV astrocytic tumors (n=40) analyzed by microsatellite (intragenic) and by SNP markers; and low mRNA expression of FAT1 in glial tumors (9 grade II and 9 grade IV tumors), implying the possibility of a tumor suppressive role (33). However, a functional analysis carr ied out by s iRNA-mediated knockdown of FAT1 revealed its oncogenic role in glioma, whereby
downregulation of FAT1 expression led to decrease in migration and invasion in GBM cell lines (39). Following FAT1 k n o c k d o w n , i n c r e a s e d P D C D 4 (programmed cell death 4, a tumor suppressor gene) expression was seen to reduce phospho-c-Jun which is required for AP-1 transcriptional activity. Hence, decreased FAT1 expression diminished AP-1 dependent transcription of downstream genes like extra cellular matrix (ECM)-remodeling molecules (MMP3, PLAU and VEGF-C) and pro-inflammatory markers (COX-2, IL1β and IL-6) (Fig. 2). This process was reversed by simultaneous knockdown of FAT1 and PDCD4, thereby, confirming the link between the two for regulation of cellular motility, invasiveness and inflammatory microenvironment in glioma (Fig. 2 & 3).
132Gene discovery in glioma in the context of molecular reclassification of tumors
siFAT1+siPDCD4 as compared with cells treated with siFAT1+siControl. Cells were counted in five different fields. Each value is mean±s.d. Experiment was put up in triplicate and repeated twice. (d) AP-1 luciferase activity significantly increased after PDCD4 knockdown in U87MGsiFAT1 cells. The luciferase activity with siControl is designated as 100%. There was a significant increase in AP-1 luciferase activity in U87MG cells treated with siFAT1+siPDCD4 as compared with siFAT1+siControl. And the luciferase activity in cells treated with siFAT1+siPDCD4 is comparable to siControl-treated cells. The experiment was repeated thrice following each of three independent transfections and representative data are shown. Results are expressed as mean±s.d. (e) The mRNA expression of AP-1-target genes increased in U87MG cells treated with siFAT1+siPDCD4 as compared with siFAT1+siControl. 18S was used as internal control and experiments were done in triplicate. (f) PDCD4 knockdown in U87MGsiFAT1 cells revert back the protein expression of p-c-Jun, VEGF-C and COX-2 comparable to siControl-treated cells alone. Lysates from indicated cells were probed with respective antibodies. β-actin was used as control antibody (Source: Dikshit et al Oncogene 2013; Creative Commons Attribution 3.0 Unported License).

133 Subrata Sinha
The mRNA expression of FAT1, PDCD4, COX-2 and IL-6 was analyzed in a set of 35 primary human GBM tumors and subjected to quartile analysis. The expression of PDCD4 was found to be inversely correla ted with FAT1 expression, with a significant difference of PDCD4 expression (P=0.0145) across the highest and lowest FAT1 GBM quartiles (Table 1). Similar comparison of expression of COX-2 and IL-6 depicted their positive correlation with FAT1 expression.
Essentially, the functional studies on the role of FAT1 in tumorigenesis are still very few. It is possible that FAT1 acts
via different signaling cascades and cellular processes in different contexts wh ich s t i l l n eed c l a r i f i c a t i on . Nevertheless, a pro-inflammatory environment plays a favourable role in tumor pathogenesis and has been discussed as one of the emerging hallmarks of solid tumors, including glioblastoma (40). The study carried out by Dikshit et al highlights the importance of FAT1 in induction of expression of pro-inflammatory molecules, apart from aiding cell migration and invasion in glioma. Our discovery of FAT1 as an oncogene in glioma makes it a prospective candidate for diagnosis and prognosis in future.
Figure 3: The proposed signaling pathway downstream of FAT1 regulating AP-1-dependent transcription. Knockdown of FAT1expression releases its inhibitory effect on PDCD4 and increase the expression of PDCD4. Increased PDCD4 expression in turn inhibits the phosphorylation of c-Jun, thus decreasing phospho-c-Jun levels. Because phospho-c-Jun is required for AP-1-dependent transcription, there was inhibition of AP-1 transcriptional activity and downregulation of target genes like COX-2, MMP3, VEGF-C, PLAU, IL-6 and IL-1b (Source: Dikshit et al Oncogene 2013; Creative Commons Attribution 3.0 Unported License).
FAT1
PDCD4
c-Jun c-JunP
AP1
COX2, VEGF,PLAUMMP3,IL-6, IL-1ß
Cell membrane

134Gene discovery in glioma in the context of molecular reclassification of tumors
Tumor histology
(collection of different molecular pathologies)
Anti-apoptoticmarkers
Oncogenes,tumor suppressors
and DNA repair genes
Signalingpathwaymolecules
Long, non-codingRNAs/miRNAs
Markers related toinvasion and metastasis
Cell cycle,pro-proliferative
markers
genetic changes / epigenetic changes
Prognosis
Diagnosis
Therapy
BIOINFORMATICS(gene discovery and identification of pointssusceptible to inhibition in a cancerous cell)
Figure 4: A schematic diagram showing the variety of molecules used as biomarkers for purposes of diagnostics, prognostication and therapy. These are genes involved in cellular processes like apoptosis, cell cycle, DNA repair, signal transduction, cell invasion and metastasis; and undergo genetic changes at DNA or RNA level (eg. mutation, deletion/LOH, amplification, translocation, overexpression, variation in splicing, etc.) or epigenetic changes (eg. DNA methylation and histone modification). In our case, the use of bioinformatics approaches has led to the discovery of FAT1 gene in glioma as an oncogene which is a prospective candidate as a prognostic or diagnostic marker. It will also aid further identification of related molecules in the downstream signaling pathway as points of therapeutic intervention in patients.
The interesting concept about FAT1 is that its overexpression identifies a subset of human glioblastoma which have a high degree of proinflammatory cytokines and COX-2 expression. Hence it too may have a place as a “theranostic” –identifying a subset of tumors as well as suggesting (e.g. through agonist of COX-2 and IL6), a means for therapeutic i n t e r v e n t i o n . T h e s e t u m o r s overexpressing FAT1 have very similar histological features as to those that do not overexpress the gene. This is a form of molecular subclassification within the
same histological grade that we are now trying to establish further.
The overall progress in the identification and application of m o l e c u l a r m a r k e r s i n g l i o m a classifications and sub-classifications have tremendously been improved over the decades due to intense clinical research, improved bioinformatics and innovative research techniques being developed. Figure 4 schematically summarized the overall progress in the glioma diagnosis, prediction of prognosis

135 Subrata Sinha
Table 1: Expression analysis of FAT1, PDCD4, COX-2 and IL-6 in human GBM samples by q-PCR
Group Samples FAT1/18S
PDCD4/18S
COX-2/18S
IL-6/18S
Group A GBM10GBM35GBM11GBM8
GBM24GBM30GBM25GBM6GBM5
70.56034.84419.99019.49013.99013.7078.1385.9805.290
3.1600.7740.4380.4300.0040.0560.0020.3030.112
1.7656.8218.1681.9052.3460.0060.387
14.9290.337
80.17118.1895.1520.0203.2380.0671.597
12.8621.834
Group B
GBM1GBM23GBM21GBM34GBM4
GBM13GBM3
GBM22
0.0340.0070.0060.0060.0030.0030.0020.002
0.0000.0030.0010.0020.0000.0000.0000.002
0.0140.0020.0010.0100.0070.7020.6110.010
1.2790.003
74.02873.2623.4944.3323.3990.081
GBM12GBM7
GBM31GBM33GBM2
GBM32GBM29GBM28GBM27
4.7004.6604.0003.9492.4791.5481.5001.3001.200
0.55510.7540.1760.2900.1000.195
134.8091.3720.333
0.7421.7780.0560.1430.1000.1580.0010.0011.892
25.0204.3020.0340.1550.3720.5093.3400.9632.514
Group C
GBM9GBM14GBM15GBM16GBM17GBM18GBM19GBM20GBM26
0.0010.0010.0010.0010.0010.0010.0010.0010.001
0.0000.0000.000
43.63340.818
106.91282.12469.487
143.998
1.3470.0300.0040.1200.0580.7430.0090.1400.288
0.2328.5450.8380.0410.0070.2260.0040.0090.017
Group D

136Gene discovery in glioma in the context of molecular reclassification of tumors
and finally for the personalised therapy. It is necessary to fully understand the “omics” signatures of each glioma patient that may further help in development of individualized management plan that may lead to complete disease cure or at least aid the conversion of a lethal cancer to a chronic disease.
Acknowledgements :
The authors acknowledge all the collaborators who have been joint participants in the scientific journey that has led to the refining of the concepts that guide the work. Financial support from DBT, DST, CSIR, DRDO, ICMR and AIIMS for the research in the authors' laboratories is gratefully acknowledged. AIIMS and NBRC have provided the institutional platforms for the work. The patients, who form the basis for the studies are foremost in our acknowledgements. SS is thankful to NAMS for recognising the work by the Dr. V R Khanolkar Oration award.
The figures and tables from BMC Cancer and Oncogene, from the authors' work published earlier are gratefully acknowledged. They are published on the basis of a Creative Commons licence which permits their publication.
REFERENCES :
1. Louis DN, Ohgaki H, Wiestler OD, et al . (2007). The 2007 WHO classification of tumours of the central nervous system. Acta Neuropathol 114: 97-109.
2. Sarkar C, Jain A, Suri V (2009). Current concepts in the pathology and genetics of gliomas. Indian J Cancer 46: 108-119.
3. Gravendeel LA, Kouwenhoven MC, Gevaert O, et al. (2009). Intrinsic gene expression profiles of gliomas are a better predictor of survival than histology. Cancer Res 69: 9065-9072.
Abbreviations: GBM glioblastoma multiforme; q-PCR, quantitative PCR. samples were divided into four groups (groups A, B, C and D) based on quartiles showing decreasing FAT1 expression. The PDCD4 expression (mean±s.d.) in the groups A and D were calculated (0.586±0.998 and 60.856±50.209, respectively) and the difference in the two groups were found to be statistically significant (P=0.0145). Similarly, on comparing the expression of COX-2 in groups A and D, there was a significant positive correlation between FAT1 and the COX-2 expression, with the mean±s.d. of groups A and D being 4.99±4.074 and 0.248±0.174, respectively (P=0.048). For IL-6, there was a similar positive trend between group A and D, however, it was not statistically significant (P=0.146) (Source: Dikshit et al Oncogene 2013; Creative Commons Attribution 3.0 Unported License).

137 Subrata Sinha
4. Gupta T, Sarin R, Jalali R, et al. ( 2 0 0 9 ) . A p r a g m a t i c c l i n i c o p a t h o b i o l o g i c a l grouping/staging system for gliomas: proposal of the Indian TNM subcommittee on brain tumors. Neurol India 57: 247-251.
5. Nayak A, Ralte AM, Sharma MC, et al. (2004). p53 protein alterations in adul t as t rocyt ic tumors and oligodendrogliomas. Neurol India 52: 228-232.
6. Kleihues P, Ohgaki H (1999). P r i m a r y a n d s e c o n d a r y glioblastomas: from concept to clinical diagnosis. Neuro Oncol 1: 44-51.
7. Taby R, Issa JP (2010). Cancer epigenetics. CA Cancer J Clin 60: 376-392.
8. Thon N, Kreth S, Kreth FW (2013). Personalized treatment strategies in glioblastoma: MGMT promoter methylation status. Onco Targets Ther 6: 1363-1372.
9. Dunn J, Baborie A, Alam F, et al. (2009). Extent of MGMT promoter methylation correlates with outcome i n g l i o b l a s t o m a s g i v e n temozolomide and radiotherapy. Br J Cancer 101: 124-131.
10. Gaur AB, Holbeck SL, Colburn NH, Israel MA (2011). Downregulation of Pdcd4 by mir-21 facilitates glioblastoma proliferation in vivo. Neuro Oncol 13: 580-590.
11. Li X, Xin S, He Z, et al. (2014). MicroRNA-21 (miR-21) Post-Transcriptionally Downregulates Tumor Suppressor PDCD4 and Promotes Cell Transformation, Proliferation, and Metastasis in Renal Cell Carcinoma. Cell Physiol Biochem 33: 1631-1642.
12. Qiu X, Dong S, Qiao F, et al. (2013). HBx-mediated miR-21 upregulation represses tumor-suppressor function of PDCD4 in hepatocellular carcinoma. Oncogene 32: 3296-3305.
13. Wang Y, Gao X, Wei F, et al. (2014). Diagnostic and prognostic value of circulating miR-21 for cancer: a systematic review and meta-analysis. Gene 533: 389-397.
14. Okada N, Lin CP, Ribeiro MC, et al. (2014). A positive feedback between p53 and miR-34 miRNAs mediates tumor suppression. Genes Dev 28: 438-450.
15. Le MT, Teh C, Shyh-Chang N, et al. (2009). MicroRNA-125b is a novel negative regulator of p53. Genes Dev 23: 862-876.
16. Nicolaides NC, O'Shannessy DJ, Albone E, Grasso L (2014). Co-development of diagnostic vectors to support targeted therapies and theranostics: essential tools in personalized cancer therapy. Front Oncol 4: 141.

138Gene discovery in glioma in the context of molecular reclassification of tumors
17. Dahlrot RH, Hansen S, Jensen SS, et al. (2014). Clinical value of CD133 and nestin in patients with glioma: a population-based study. Int J Clin Exp Pathol 7: 3739-3751.
18. Parsons DW, Jones S, Zhang X, et al. (2008). An integrated genomic analysis of human glioblastoma multiforme. Science 321: 1807-1812.
19. Ruano Y, Ribalta T, de Lope AR, et al. (2009). Worse outcome in primary glioblastoma multiforme with concurrent epidermal growth factor receptor and p53 alteration. Am J Clin Pathol 131: 257-263.
20. Das P, Puri T, Jha P, et al. (2011). A clinicopathological and molecular analysis of glioblastoma multiforme with long-term survival. J Clin Neurosci 18: 66-70.
21. Cao VT, Jung TY, Jung S, et al. (2009). The correlation and prognostic significance of MGMT promoter methylation and MGMT p r o t e i n i n g l i o b l a s t o m a s . Neurosurgery 65: 866-875.
22. Takahashi Y, Nakamura H, Makino K, et al. (2013). Prognostic value of isocitrate dehydrogenase 1, O6-m e t h y l g u a n i n e - D N A m e t h y l t r a n s f e r a s e p r o m o t e r methylation, and 1p19q co-deletion in Japanese malignant glioma patients. World J Surg Oncol 11: 284.
23. Guo Y, Sheng Q, Li J, et al. (2013). Large scale comparison of gene expression levels by microarrays and RNAseq using TCGA data. PLoS One 8: e71462.
24. Verhaak RG, Hoadley KA, Purdom E, et al. (2010). Integrated genomic analysis identifies clinically relevant s u b t y p e s o f g l i o b l a s t o m a characterized by abnormalities in PDGFRA, IDH1, EGFR, and NF1. Cancer Cell 17: 98-110.
25. Yan Y, Zhang L, Xu T, et al. (2013). SAMSN1 is highly expressed and associated with a poor survival in glioblastoma multiforme. PLoS One 8: e81905.
26. Mellinghoff IK, Wang MY, Vivanco I , et a l . (2005) . Molecular determinants of the response of glioblastomas to EGFR kinase inhibitors. N Engl J Med 353: 2012-2024.
27. Wong ET, Gautam S, Malchow C, et al . (2011). Bevacizumab for recurrent glioblastoma multiforme: a meta-analysis. J Natl Compr Canc Netw 9: 403-407.
28. Zhang W, Zhang J, Yan W, et al. (2013). Whole-genome microRNA expression profiling identifies a 5-microRNA signature as a prognostic biomarker in Chinese patients with primary glioblastoma multiforme. Cancer 119: 814-824.

139 Subrata Sinha
29. Volinia S, Calin GA, Liu CG, et al. (2006). A microRNA expression signature of human solid tumors defines cancer gene targets. Proc Natl Acad Sci U S A 103: 2257-2261.
30. Calin GA, Croce CM (2006). MicroRNA signatures in human cancers. Nat Rev Cancer 6: 857-866.
31. Lim LP, Lau NC, Garrett-Engele P, et al. (2005). Microarray analysis shows that some microRNAs downregulate large numbers of target mRNAs. Nature 433: 769-773.
32. Li R, Gao K, Luo H, et al. (2014). Identification of intrinsic subtype-specific prognostic microRNAs in primary glioblastoma. J Exp Clin Cancer Res 33: 9.
33. Chosdol K, Misra A, Puri S, et al. ( 2 0 0 9 ) . F r e q u e n t l o s s o f h e t e r o z y g o s i t y a n d a l t e r e d expression of the candidate tumor suppressor gene 'FAT' in human astrocytic tumors. BMC Cancer 9: 5.
34. Kwaepila N, Burns G, Leong AS (2006 ) . Immunoh i s to log i ca l localisation of human FAT1 (hFAT) protein in 326 breast cancers. Does this adhesion molecule have a role in pathogenesis? Pathology 38: 125-131.
35. de Bock CE, Ardjmand A, Molloy TJ, et al. (2011). The Fat1 cadherin is
overexpressed and an independent prognostic factor for survival in paired diagnosis-relapse samples of precursor B-cell acute lymphoblastic leukemia. Leukemia 26: 918-926.
36. Nishikawa Y, Miyazaki T, Nakashiro K, et al. (2011). Human FAT1 cadherin controls cell migration and invasion of oral squamous cell carcinoma through the localization of beta-catenin. Oncol Rep 26: 587-592.
37. Nakaya K, Yamagata HD, Arita N, et al . (2007). Identif ication of homozygous deletions of tumor suppressor gene FAT in oral cancer using CGH-array. Oncogene 26: 5300-5308.
38. Bendavid C, Pasquier L, Watrin T, et al. (2007). Phenotypic variability of a 4q34-->qter inherited deletion: MRKH syndrome in the daughter, cardiac defect and Fallopian tube cancer in the mother. Eur J Med Genet 50: 66-72.
39. Dikshit B, Irshad K, Madan E, et al. (2013). FAT1 acts as an upstream regula tor o f oncogenic and inflammatory pathways, via PDCD4, in glioma cells. Oncogene 32: 3798-3808.
40. Hanahan D, Weinberg RA (2011). Hallmarks of cancer: the next generation. Cell 144: 646-674.

Understanding the Pathophysiology of Spinocerebellar Ataxias through genetics, neurophysiology,
structural and functional neuroimaging
Over the past 10 years a large cohort of 656 index patients with clinically suspected degenerative ataxias were clinically evaluated under various research projects. Of these, 625 index patients underwent genetic tests for the clinically suspected most probable diagnosis. A diagnosis could be achieved in 218 patients (34.9%). Among these 218 index patients, 82 each were SCA1 and SCA2, 32 were SCA3, 4 were SCA12, and 18 were Friedreich's Ataxia. Thus among the Autosomal Dominant Ataxias (SCAs) there was equal prevalence of SCA1 and SCA2 (41% each) followed by SCA3 (16%) and SCA12 (2%). This high prevalence of SCA1 is in contrast to the available National and International literature. The rate of clinical disease progression, especially in SCA2, was dependent on the CAG repeat size, and may commence linearly from birth.
Apart from cerebellar involvement, a comprehensive evaluation of the neuroaxis in various subsets of this genetically proved cohort showed subclinical involvement of the cerebral cortex, central motor and sensory pathways, peripheral nervous system and autonomic nervous system. Important findings include: (a) A mixed sensorimotor and pure sensory neuropathy was seen in all the three subtypes of SCAs, while pure motor neuropathy was uncommon; (b) There was reduced cortical excitability and prolonged central motor conduction time, most evident in SCA1 and least in SCA2; (c) Cardiac autonomic dysfunction, predominantly parasympathetic, was seen in SCA, and the severity correlated with the duration of illness in SCA1; (d) In SCA1 there was a global impairment of balance, with greater instability in anterior–posterior than
Pramod Kumar PalProfessor of Neurology
Movement Disorder Specialist, Department of NeurologyNational Institute of Mental Health & Neurosciences (NIMHANS), Bangalore.
SUMMARY
Ann Natl Acad Med Sci (India), 51(4): 140-155, 2015
Correspondence : Dr. Pramod Kumar Pal, Professor of Neurology, Movement Disorder Specialist, Department of Neurology, National Institute of Mental Health & Neurosciences (NIMHANS), Bangalore-560029.
DR. S. JANAKI MEMORIAL ORATION delivered during NAMSCON 2014 at the All-India Institute of Medical Sciences, Rishikesh.

Spinocerebellar ataxias (SCA) are genetically mediated autosomal dominant neurodegenerative disorders. The burden of SCAs in India is large and diverse ethnicity of Indian population has led to different types of SCAs in different parts of India. Documentation of the geneotypic-phenotypic correlation and understanding the pathophysiology of SCAs are crucial in management of these patients.
Though in the past 2 decades there has been significant understanding in the genetics of Hereditary Ataxias, in particular SCAs (autosomal dominant ataxias), it is disturbing that there are very few Indian Research Centres which are dedicated to research in the field of Hereditary Ataxias. One of the primary reasons behind this is the lack of understanding of the pathophysiology and lack of any specific treatment for SCAs.
Twenty-five years back, when I joined the National Institute of Mental Health & Neurosciences (NIMHANS), as
a student in DM Neurology, I developed interest in Neurodegenerative Disorders, especially the Ataxias. Pursuing my dissertation in Cerebellar Ataxias, I systematically studied the clinical, neuropsychological, electrophysiologic and imaging aspects of patients with Friedreich 's Ataxia , Early-onset Cerebellar Ataxia with Retained Tendon Reflexes and Olivopontocerebellar Atrophies, based on the classification prevalent at that time. The results of this study have been published in several National and International journals (1-5). Over the next decade, rapid genetic discoveries in the field of Autosomal Dominant Ataxias, later designated as Spinocerebellar Ataxias (SCAs), mandated a new look at the Hereditary Ataxias in India along with genetic studies.
I was fortunate to get a second opportunity to pursue my research interest in Cerebellar Ataxias when I joined NIMHANS as a Faculty in the Department of Neurology in 2000. In
141
medio–lateral directions; (e) In all the three SCAs there was a significant loss of gray matter in both cerebellar hemispheres and vermis. Vermian atrophy was more pronounced in SCA3, while SCA1 and SCA2 had significant white matter atrophy. Pontine white matter atrophy was more pronounced in SCA2; (f) Cerebellar activity was largely absent with additional activity in contralateral cortices and in thalami in patients with SCA1; increased thalamic function could be one of the causes for disinhibition of the motor cortex contributing to uncoordinated movements.
Studies on larger cohort of each subtype of SCAs to validate the above findings, follow-up studies to determine the rate and nature of progression of neurodegeneration and evaluation of pre-symptomatic genetically confirmed SCAs will help understand the pathophysiology of the SCAs.
Pramod Kumar Pal

collaboration with Dr. Mitali Mukherjee of the Institute of Genomics and Integrative Biology (IGIB), New Delhi and Prof. Sanjeev Jain at Genetic Laboratory of NIMHANS, we started a prospective study (2003) on “Phenotypic-genotypic correlation of Spinocerebellar Ataxias in Southern India”, funded by a research grant from Indian Council of Medical Research (ICMR), New Delhi. This was the beginning of a large ongoing prospective research study on Hereditary Ataxias. In the next 10 years, two more research grants from ICMR and several dissertations of students pursuing DM in Neurology helped us in establishing a large cohort of patients with hereditary ataxias.
The objectives of our study was to (i) establish a clinical and genetic database of hereditary ataxias with emphasis on epidemiology of hereditary ataxias in India, (ii) try to achieve phenotypic-genotypic correlation, (iii) clinical, radiological, electrophysiological characterization of genetically proven patients with hereditary ataxias, (iv) comparison of genetically proven patients from Southern and Northern India.
The results of our research in ataxias have been published in 22 articles in various National and International journals in the past one decade. Clinical data is still being analyzed and several projects are ongoing. A large section of the cohort of our patients still do not have a genetic diagnosis and future genetic studies are required to identify the uncommon and novel genes. Various
imaging and electrophysiological investigations have been done only in subsets of patients with genetically proven SCAs. Presented below are the salient findings in genetically proven cohort of SCAs.
Methods :
Cohort :
Over the past 10 years a large cohort of 656 index patients with clinically suspected degenerative ataxias were clinically evaluated under various research projects supervised by me. Most of the patients were examined by me. The patients were mainly from Southern India (Karnataka, Andhra Pradesh, Tamil Nadu and Kerala) and a considerable number of patients were also present from other parts of India, especially West Bengal, Bihar, Jharkhand, Assam, Orissa, Maharashtra, etc. Some patients were evaluated in their respective States by Neurologists, and we cannot be certain if they were genetically evaluated by their treating physicians.
Blood sample was taken after written informed consent from the 656 index patients and ~367 relatives (total samples~1023) and genetic studies of were done initially at IGIB and later at NIMHANS initially for the clinically suspected types of ataxias (viz. SCA1, SCA2, SCA3 , SCA 12, and Friedreich's ataxia). When negative, further genetic tests in some samples were done for other types of ataxias in India (SCA6, SCA7, SCA8 and DRPLA, episodic ataxias, etc.) at IGIB.
142Understanding the Pathophysiology of Spinocerebellar Ataxias
143
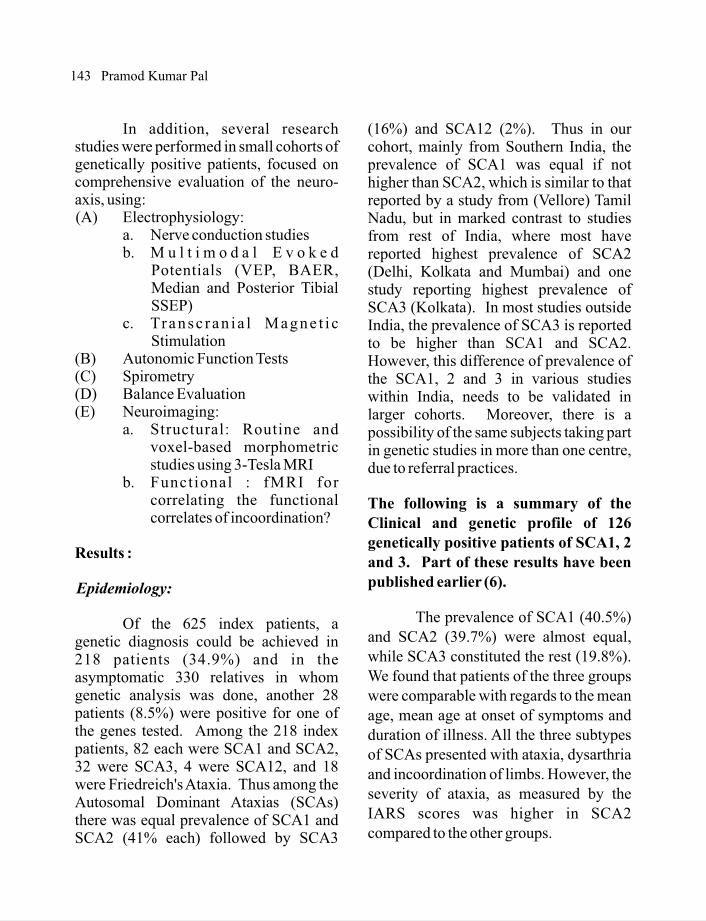
In addition, several research studies were performed in small cohorts of genetically positive patients, focused on comprehensive evaluation of the neuro-axis, using: (A) Electrophysiology:
a. Nerve conduction studiesb. M u l t i m o d a l E v o k e d
Potentials (VEP, BAER, Median and Posterior Tibial SSEP)
c. Transc ran ia l Magne t i c Stimulation
(B) Autonomic Function Tests(C) Spirometry(D) Balance Evaluation(E) Neuroimaging:
a. Structural: Routine and voxel-based morphometric studies using 3-Tesla MRI
b. Functional : fMRI for correlating the functional correlates of incoordination?
Results :
Epidemiology:
Of the 625 index patients, a genetic diagnosis could be achieved in 218 patients (34.9%) and in the asymptomatic 330 relatives in whom genetic analysis was done, another 28 patients (8.5%) were positive for one of the genes tested. Among the 218 index patients, 82 each were SCA1 and SCA2, 32 were SCA3, 4 were SCA12, and 18 were Friedreich's Ataxia. Thus among the Autosomal Dominant Ataxias (SCAs) there was equal prevalence of SCA1 and SCA2 (41% each) followed by SCA3
(16%) and SCA12 (2%). Thus in our cohort, mainly from Southern India, the prevalence of SCA1 was equal if not higher than SCA2, which is similar to that reported by a study from (Vellore) Tamil Nadu, but in marked contrast to studies from rest of India, where most have reported highest prevalence of SCA2 (Delhi, Kolkata and Mumbai) and one study reporting highest prevalence of SCA3 (Kolkata). In most studies outside India, the prevalence of SCA3 is reported to be higher than SCA1 and SCA2. However, this difference of prevalence of the SCA1, 2 and 3 in various studies within India, needs to be validated in larger cohorts. Moreover, there is a possibility of the same subjects taking part in genetic studies in more than one centre, due to referral practices.
The following is a summary of the Clinical and genetic profile of 126 genetically positive patients of SCA1, 2 and 3. Part of these results have been published earlier (6).
The prevalence of SCA1 (40.5%) and SCA2 (39.7%) were almost equal, while SCA3 constituted the rest (19.8%). We found that patients of the three groups were comparable with regards to the mean age, mean age at onset of symptoms and duration of illness. All the three subtypes of SCAs presented with ataxia, dysarthria and incoordination of limbs. However, the severity of ataxia, as measured by the IARS scores was higher in SCA2 compared to the other groups.
Pramod Kumar Pal

144
Age at presentation and gender distribution:
The mean age of the patients at the time of presentation was in the fourth decade in all three groups. The mean age of patients of SCA1 was 34.1±10.7 years (range: 13-59 years). The mean age of patients of SCA2 was 32.9±12.8 years (range: 7-70 years). The mean age of patients of SCA3 was 36.8±12.2 years (range: 8-55 years). There was no statistical significant difference between the three groups.
There was a male preponderance in all the three groups. There were 37 males (72.5%) in SCA1, 39 (78%) in SCA2 and 13 (52%) in SCA3. There was no statistical significance in the gender distribution.
Age of onset and duration of illness:
The mean age of onset of illness was 29.8±9.9 years (range: 10-54 years) in SCA1, 27.6±12.2 years (range: 3-65 years) in SCA2 and 32.8±12.4 years (range: 4-53 years) in SCA3, which was not statistically significant.
The mean duration of illness was 4.7 ±4.1 yrs in SCA1 (range: 0.3-20 years), 5.3 ±4.3 years (range: 0.5-15 years) in SCA2 and 4.1 ±2.8 years (range: 0.5-10 years) in SCA3. The statistical analysis for age of onset of illness and duration of illness did not reach statistically significant difference.
Family history:
There was a positive family history present in a total of 101 patients (80.2%). Out of these patients an au tosomal dominant pa t te rn of inheritance could be discerned in 43 patients (84.3%) of SCA1, 38 patients (76%) of SCA2 and 20 patients (80%) of SCA3. The rest of the patients with a positive family history had affected siblings but a history of affection of parents was not forthcoming and since the parents were not examined, the pattern of inheritance could not be determined. There were a total of 7 patients with negative family history (i.e. sporadic inheritance): 4 patients of SCA1 (7.8%), one patient of SCA2 (2%) and 2 patients of SCA3 (8%).
CAG Repeat length:
The CAG repeat lengths were available in 118 patients. The mean CAG repeat length was 29.43 ±2.18 (range of 39-72) for SCA1, 22.24 ±1.07 (38-66) for SCA2 and 21.88 ±5.82 (43-79) for SCA3.
Clinical Features:
1. Skeletal abnormalities were most commonly observed in SCA3(40%), followed by SCA2 (30%) and SCA1 (21.6%).
2. All the three groups presented with unsteadiness of gait, dysarthria and incoordination of limbs as the commonest presenting symptoms.
Understanding the Pathophysiology of Spinocerebellar Ataxias

22
3. The mean International Ataxia Rating Scale (IARS) scores significantly differed among the three groups with SCA2 patients having the greatest severity [SCA1: 32.3±13.7 (range: 8-63), SCA2: 41.1±17.1 (range: 14-94) and SCA3: 31.1±21.2 (range: 10-94)].
4. Cognitive disturbances were commonest in SCA1(15.7%) followed by SCA2 (6%) and SCA3 (4%).
5. Slow saccades were commonest in SCA2 (88%) followed by SCA1 (49%) and SCA3 (40%). Nystagmus was more often observed in SCA3 (80%) than in SCA1 (19.6%) and SCA2 (10%).
6. Spasticity was seen more often in SCA1 (29.4%) compared to SCA2 (16%) and SCA3 (8%). However, hypotonia was more in SCA3 (36%), followed by SCA2 (34%) and SCA1 (23.5%).
7. Vibration sensation loss in the lower limbs was more commonly seen in SCA2 (20%) compared to SCA1 (9.8%) and SCA3 (4%).
8. SCA1 had more hyperreflexia (58.8%) compared to SCA3 (52%) and SCA2 (14%), while SCA2 had more of hyporeflexia (22%) compared to SCA1 (7.8%) and SCA3 (0%).
9. Extensor plantars were more commonly seen in SCA1 (52.9%) than in SCA3 (48%) and SCA2 (32%).
10. Exptrapyramidal signs (EPS) (7, 8):
We specifically analyzed the prevalence of EPS in 85 patients of the above cohort who had genetically confirmed SCA (SCA1 = 40, SCA2 = 28, SCA3 = 17). Forty-one SCA patients (48.2%) had one or more types of EPS. The prevalence of EPS was 60.7% in SCA2, 52.9% in SCA3, and 37.5% in SCA1. Among the SCA2 patients, bradykinesia was most frequent (35.3%), followed by reduced facial expression, postural tremor and dystonia (29.4% each), rest tremor, titubation and rigidity (23.5% each), and lip/jaw tremor and chorea (11.8% each). In SCA3 the common EPS were bradykinesia (44.4%), staring look, postural tremor and dystonia (33.3% each), and reduced facial expression and rigidity (22.2% each). In SCA1, staring look was the most common (53.3%), followed by dystonia and bradykinesia (33.3% each), and postural tremor (26.7%). In all the three groups, there was no significant difference in the mean length of repeat of the abnormal allele between those with and without EPS.
In summary, bradykinesia, staring
look, dystonia and postural tremor were the most frequent EPS observed in SCA. In SCA1, these signs were seen more often in younger patients with early onset of symptoms.
145 Pramod Kumar Pal

Electrophysiology assessment of the peripheral and central motor and sensory pathways and structures:
(a) Nerve conduction studies (9) :
Subclinical neuropathy is an important feature of spinocerebellar ataxias (SCA) but the true prevalence and electrophysiological characteristics in genetically proven patients of SCA 1, 2 and 3 are largely unknown. There are no large comparative studies among SCA1, 2 and 3.
We prospectively compared the electrophysiological characteristics of neuropathy in 61 genetically confirmed cases of SCA (SCA1=28, SCA2=16 and SCA3=17) of the above cohort. Nerve conduction studies were performed in at least one sensory and one motor nerve, in right upper and lower limb using standard methods.
The mean age of patients and duration of illness were comparable among SCA groups; mean age (years): SCA1=34.1±12.7, SCA2=35.2±13.9 and SCA3=38.1±11.3; mean duration (years): SCA1=5.4, SCA2=6.1, and SCA3=4.4). Electrophysiological evidence of neuropathy was highest in SCA1 (96.4%), followed by SCA3 (94.1%) and SCA2 (87.5%). A mixed sensorimotor neuropathy was commonly observed in all t h e s u b g r o u p s ( S C A 1 = 7 8 . 6 % , SCA2=50%, and SCA3=41.2%). Pure sensory neuropathy was most common in SCA3 (55.9%), followed by 31.3% in
SCA2 and 17.9% in SCA1. Pure motor neuropathy was uncommon (6.3% in SCA2 and none in SCA1 and SCA3).
In summary, electrophysiological evidence of mixed sensorimotor and pure sensory neuropathy was seen in all the three subtypes of SCAs, while pure motor neuropathy is distinctly uncommon. Electrophysiological profile revealed h ighe r abnorma l i t i e s o f mo to r conductions in both upper and lower limbs in SCA1 compared to the other two groups. However, the sensory conductions were more often abnormal in SCA2 and SCA1 in upper limbs and were almost comparable among the three groups in the lower limbs. The abnormalities of sensory nerves were more often observed in the upper limbs than in the lower limbs in all the three groups of SCAs, which points in favour of a non-length dependent sensory neuropathy in the SCAs.
(b) Evoked potentials (10) :
Multimodal evoked potential studies are useful tools to determine the integrity of the central pathways, viz. visual, auditory and somatosensory. Clinical sensory symptoms are usually uncommon in SCAs, and therefore it is of utmost importance to determine subclinical involvement, especially in the early disease, to devise symptomatic therapeutic strategies, prognostication, and determine the efficacy of therapeutic interventions. In SCAs, BAER was the most common abnormality among the
146Understanding the Pathophysiology of Spinocerebellar Ataxias

147
evoked potentials studied. SCA1 patients had more often abnormalities of VEP abnormality, SCA2 of BAER, and SCA3 of median SSEP.
In this study, we evaluated 43 genetically proven SCA (SCA1= 19, SCA2=13, SCA3=11) with median somatosensory evoked potent ia l (mSSEP), visual evoked potential (VEP) and brainstem auditory evoked response (BAER) by standard procedures and compared with normative laboratory data. The aims were to determine the pattern and prevalence of abnormalities of EPs in each type of SCA and additionally evaluate if EP can be used to differentiate between them.
The most common abnormality was of BAER (86.1%) followed by VEP (34.9%) and mSSEP (30.2%). The degree of abnormality in VEP, mSSEP, BAER among patients with SCA1 was 42.1%, 41.2 % and 73.3% respectively; among patients with SCA2 was 38.5%, 27.3% and 100% respectively; among patients with SCA 3 was 18.2%, 37.5% and 88.9% respectively. The differences between the subgroups of SCAs were not statistically significant.
I n s u m m a r y, s u b c l i n i c a l involvement of the visual, auditory and somatosensory pathways was very common in SCAs. BAER was the most frequent abnormality in SCA types 1, 2 and 3; abnormalities of mSSEP were comparable in the three SCAs whereas abnormality of VEP was less often noted in SCA3.
(c) T r a n s c r a n i a l M a g n e t i c Stimulation (11) :
T r a n s c r a n i a l M a g n e t i c Stimulation (TMS) is a useful non-invasive tool to state the changes of cortical excitability changes in neuro-psychiatric disorders. The prevalence of changes in the cortical excitability and central motor conduction time (CMCT) in these disorders is largely unknown, and there are few studies which have compared these findings in the subtypes of SCA.
The objectives of this study were to measure the cortical resting motor threshold (RMT) and CMCT using transcranial magnetic stimulation in patients with SCA1, SCA2, and SCA3. Thirty-two genetically confirmed patients with SCA (SCA1=15, SCA2 =11, SCA3 = 6) were studied. TMS was performed using a figure-of-eight coil attached to Magstim 200 stimulator. Motor evoked potentials were recorded from first dorsal interosseous at rest. RMT was determined using standard techniques and the CMCT by 'F' wave method. Comparison was made with data from 32 healthy controls.
We found that compared to controls, the patients with SCA had significantly higher mean RMT as well as CMCT (RMT: 49.9±9.1 vs. 41.5± 6.6, p < 0.0001; CMCT: 7.7±2.3 ms vs. 4.8±0.6 ms; p < 0.0001). When compared separately with the controls, while all the three subtypes of SCAs had significantly
Pramod Kumar Pal

prolonged CMCT, only SCA1 and SCA3, but not SCA2 had significantly greater RMT. RMT and CMCT between patients with SCA2 and SCA3, and between SCA1 and SCA3 did not differ significantly, while SCA1 had significantly higher RMT and CMCT than SCA2.
In summary, we found that patients with SCA have reduced cortical excitability and prolonged central motor conduction time, which was most evident in SCA1 and least in SCA2.
Autonomic functions (12):
Progressive cerebellar ataxia because of neurodegeneration is seen in autosomal dominant spinocerebellar ataxias (SCA), autosomal recessive ataxias, idiopathic late onset ataxias and multiple system atrophy of cerebellar type (MSA-C). In these disorders, apart from progressive gait and limb ataxia, there are varying degrees of abnormalities of ocular m o v e m e n t s , p y r a m i d a l s i g n s , propioceptive loss and autonomic dysfunction. Autonomic dysfunction in these progressive ataxias result from degeneration of central autonomic neurons as well as degeneration of rostral fastigial nucleus of cerebellum which actively participates in regulation of orthostatic homeostasis and other autonomic control mechanisms. While au tonomic dys func t ion i s we l l documented in MSA-C, there is sparse information of its nature and prevalence in idiopathic late onset ataxia not fulfilling the criteria of MSA-C, and in SCAs apart
from SCA3 ⁄Machado-Joseph disease (MJD). Among the various manifestations of autonomic dysfunction, cardiac autonomic dysfunction may be an important cause of morbidity and mortality and therefore merits early detection.
Keeping the above in mind, we did a comparative evaluation of cardiac dysautonomia in SCA and idiopathic sporadic ataxias (IA) not fulfilling the criteria of multiple system atrophy. Cardiac autonomic functions were evaluated in 14 SCA (SCA1 = 6, SCA2 = 5 and SCA3 = 3) and 10 IA patients, comparable for age, age at onset, duration and severity of illness. The results were categorized as early, definitive, or severe autonomic involvement (EI, DI and SI respectively) based on the degree of abnormalities on tests of parasympathetic and sympathetic pathways.
It was found that cardiac autonomic dysfunction was present in all (EI = 25.0%, DI = 41.7% and SI = 33.3%), parasympathetic dysfunction being an early feature. SI was most often present in SCA3 (100%), followed by those with SCA1 (66.7%), and SCA2 (20%) and none in IA (12).
Therefore, cardiac dysautonomia was common in both SCA and IA, although the severity was greater in SCA. Among SCAs, the severity was greatest in SCA3, followed by SCA2 and least in SCA1.
148Understanding the Pathophysiology of Spinocerebellar Ataxias

149
In another study (13) we studied the cardiac autonomic function by using analysis of heart rate variability in 22 genotypically proven SCA patients (SCA1 = 11, SCA2 = 6 and SCA3 = 5) and compared with that of age- and gender- matched controls. Consecutive RR intervals were analyzed for time- and frequency- domain parameters.
There was a reduction in the standard deviation of RR interval (RR_SD) in 72.7% of SCA patients. There w a s a r e d u c t i o n i n b o t h t h e parasympathetic and sympathetic parameters in SCA without any change in the ratio of low- to high- frequency power. In SCA1, there was a significant negative correlation between RR_SD and duration of illness but not with the CAG repeat lengths of the abnormal allele. Small sample size of SCA2 and SCA3 precluded similar comparison.
This study showed that cardiac autonomic dysfunction, predominantly parasympathetic, was seen in SCA, and the severity correlated with the duration of illness in SCA1.
The above information is of p a r a m o u n t i m p o r t a n c e f o r prognostication of SCAs and also cautions when using drugs in SCA which can cause autonomic dysfunction, especially cardiac, even in those patients who do not have clinical autonomic dysfunction. The SCA3 patients are more likely to have the maximum severity of cardiac dysautonomia.
Spirometry:
The presence of cerebellar and brain stem atrophy has been reported in SCA, and imaging and pathological studies suggest degeneration of certain neurons and their pathways in the olivopontocerebellar system. Because of the proximity of the respiratory neurons with these areas, it is logical to expect dysfunction in the respiratory control mechanisms which may manifest as altered pulmonary function tests (PFTs). Similar pulmonary dysfunction has been studied in other degenerative neurological disorders such as amyotrophic lateral sclerosis (ALS), Parkinson's disease, ataxia telangiectasia and multiple system atrophy. However, to the best of our knowledge, there are no large studies which have specifically evaluated pulmonary dysfunction in SCA. Therefore we undertook this study to look for evidence of pulmonary dysfunction in SCA and if present, determine its nature, extent and correlation, if any, with the clinical characteristics such as functional disability, duration of illness and type of genetic abnormality.
Thirty patients (F:M = 7:23;age: 35.0±11.3 years; SCA1=13, SCA2=9 and SCA3= 8) without clinical manifestations of respiratory dysfunction and 30 controls underwent pulmonary function tests (14). It was observed that there was subclinical restrictive type of pulmonary dysfunction in all the SCA subtypes, though SCA1 and SCA2 patients appeared to be more affected than SCA3. In addition, there was a possible presence of upper airway
Pramod Kumar Pal

o b s t r u c t i o n . T h e r e f o r e c h e s t physiotherapy and breathing exercises should be introduced early in management of SCA. Patients with early morning fatigue, reduced cognition should be carefully evaluated for sleep apnea as a result of upper airway obstruction.
Balance assessment:
Evalua t ion of ba lance in degenerative ataxias is often clinical and subject to bias. Very few studies have attempted to determine the characteristics of abnormal balance in SCA, quantify the degree of impairment, and compare with balance characteristics of healthy subjects. Such information is essential to plan balance rehabilitation strategies, determine the effectiveness of therapeutic interventions and to prognosticate ataxic disorders.
We undertook this study to determine the prevalence, nature, and degree of balance impairment in patients of genetically proven SCA1, using Biodex balance measurement system (15). The findings were compared with age and gender matched controls. We also attempted to correlate the balance indices with age, body weight, and clinical severity of symptoms, age of onset, duration of symptoms and the size of CAG repeat.
The subjects were 20 patients (males: 14, females: 6) with genetically positive SCA1 and 20 age and gender
matched healthy subjects. Ataxia was rated using the International Cooperative Ataxia Rating Scale (ICARS). Balance was assessed by dynamic posturography (Biodex, USA) which included: (a) ability to control balance in all directions (overall balance index, OBI), front to back (anterior–posterior index, API) and side-to-side (medio–lateral index, MLI); and (b) the limits of stability (LOS) in all directions. Balance index was considered abnormal if the actual value exceeded the predictive value.
Impaired balance was found in 80% of patients (all indices in 35%, OBI + API in 25%, only OBI in 15%, and OBI + MLI in 5%). Compared to controls, SCA1 patients had significantly higher balance indices and lower LOS scores. Unlike in controls, the mean value of API was significantly higher than MLI in SCA1. LOS was found to the best predictor of balance abnormality. In patients, all balance indices had significant positive correlations with ICARS, static score of ICARS, body weight, severity and duration of illness, but not with the CAG repeat length.
In summary, patients with SCA1 had global impairment of balance, with greater instability in anterior–posterior than medio–lateral directions. Apart from severity and duration of illness, body weight was detriment to maintenance of balance in SCA1. This information may be use fu l in p lann ing ba lance rehabilitation in SCA.
150Understanding the Pathophysiology of Spinocerebellar Ataxias

151
Neuroimaging:
Routine imaging:
On MRI study, SCA2 patients had more severe cerebellar atrophy, hot-cross bun sign and inferior pontine atrophy compared to other two groups. SCA3 patients had milder cerebellar atrophy compared to the other two groups.
Voxel-based Morphometry :
T h e r e a r e n o u n i q u e distinguishing features on routine neuroimaging to distinguish between SCA1, 2 and 3. Therefore we undertook a r e c e n t l y i n t r o d u c e d a d v a n c e d neuroimaging technique-Voxel-based morphometry (VBM), to study the pattern and degree of brain atrophy in patients with genetically proved SCA. VBM provides an automated unbiased analysis of structural MRI scans and gives a comprehensive assessment of anatomical differences throughout the brain. Our aims were to characterize the patterns of atrophy in SCA1, SCA2 and SCA3, determine if any unique pattern of atrophy can differentiate these three most commonly prevalent SCAs and finally to ascertain if a relationship exists between the morphometric measures and the CAG repeat lengths and other attributes of the disease.
We studied 31 genetically confirmed patients suffering from SCA (SCA1=12, SCA2= 9, and SCA3=10) (16). High resolution T1-weighted 3-
Dimensional MRI Images were analyzed using the optimized VBM procedure. We found a significant loss of gray matter in both cerebellar hemispheres and vermis in all the three SCAs. SCA3 patients had more pronounced vermin atrophy, whereas SCA1 and SCA2 patients had significant white matter atrophy. Pontine white matter atrophy was more pronounced in SCA2.
Interestingly, only in SCA1 we could find a strong positive correlation with the severity of ataxia (as measured by International Cooperative Ataxia Rating Scale) and the degree of gray matter atrophy in cerebellar hemispheres. However, in all the 3 subtypes of SCAs, the duration of symptoms and lengths of CAG repeats had no correlation with the degree of atrophy.
In summary, this unique study showed that different subtypes of SCAs may have morphometric differences in the ce rebe l lum, b ra ins t em and the supratentorial structures. It is required to serially follow up these patients with VBM to see if the rate of progression of disease correlate with rate of brain atrophy.
Functional imaging :
Functional magnetic resonance imaging (fMRI) of the entire brain was used to study the neural (blood oxygenation level dependent) correlates of motor coordination of both hands in adult right-handed volunteers and 7
Pramod Kumar Pal

152
patients with SCA1 (17). The subjects performed 5 sets of alternate pronation and supination tasks using either hand in a prescribed sequence as the active phase followed by a period of rest. The motor network consisting of sensorimotor cortex, supplementary motor area, cingulate motor area, putamina and cerebellum, was identified during the task in healthy volunteers. However, in SCA1 group the cerebellar activity was largely absent. In addition there were activities in contralateral cortices and in thalami. This apparent decoupling of sensorimotor cortical and cerebellar areas during coordinated movement in patients with SCA1, suggests malfunctioning of the corticocerebellar loops. Therefore the basis of incoordination in SCA1 was the dysfunctional activity of the striatal and the cerebellar structures resulting in abnormal motor network coordination. (Jayakumar et al, 2008).
Therapeutics:
The treatment options for improving the balance in degenerative cerebellar ataxias are very few. The primary management for SCAs is gait and balance therapy. However Ayurvedic texts have described diverse treatment regimens for this disease. Therefore we undertook an open labeled pilot study using Ayurvedic therapy to determine if this therapy can improve balance indices measured by dynamic posturography (Biodex Balance System, USA).
Ten patients with progressive degenerative cerebellar ataxia (3 women, 7 men; SCA1=2, SCA2=2, SCA3=1; rest of the patients were negative for SCA1,2 and 3) participated in this study (18). The patients were treated over a period of one month. Treatment consisted of Shirobasti (therapeutic retention of medicament over the scalp) in male patients and Shirodhara (pouring of a steady stream of medicament on the forehead) in female patients with Dhanvantaram tailam (medicated oil) for 45 minutes daily, followed by Abhyanga (methodical massage) with Dhanvantaram tailam and Bhashpa sweda (steam bath), for 14 days. In addition, the treatment also consisted Abhyantara aushadha (oral medicines) of Maharasnadi kashayam 15 ml thrice daily, Dhanvantaram capsules 101 two capsules thrice daily, and Ashwagandha tablet 500 mg one tablet thrice daily, for one month. The patients were assessed on the Biodex balance system before and after the treatment.
All patients tolerated the treatment well without any adverse events and reported subjective improvement in walking. There was a statistically significant improvement in the overall and anteroposterior balance indices of dynamic stability. Thus, over the short period of the present study, Ayurvedic therapy was found to be safe and, showed improvement in the balance in patients with progressive degenerative cerebellar ataxia. However, further randomized placebo-control double blind studies are needed to validate the results.
Understanding the Pathophysiology of Spinocerebellar Ataxias

153
Disease Progression:
Neurodegenerative disorders show a variable rate of disease progression depending on the nature of underlying genetic defect, sites of nervous system involvement, and age of onset. In addition, for the same disease there may be difference in the phenotypic expression, severity and progression of illness among different individuals, even belonging to the same family. It is important to know the rate of disease progression to prognosticate the illness, and to monitor the efficacy of therapeutic measures for symptomatic treatment or disease modification.
We attempted to determine whether there is any correlation between the clinical rate of disease progression at presentation and the CAG repeat size in 71 patients with SCA (SCA1=31, SCA2=25, and SCA3=15) (19). The severity of ataxia was measured using the International Cooperative Ataxia Rating Scale (IARS) in all the patients and the rate of disease progression at presentation was measured by the age adjusted IARS (IARS/Age). For each SCA, correlations of age at onset of symptoms, raw scores of IARS, age adjusted IARS and duration adjusted IARS (IARS/Duration) with the CAG repeat size were determined.
In this cohort, the number of CAG repeats of the abnormal allele ranged from 42 to 67 in SCA1, 38 to 66 in SCA2, and
69 to 79 in SCA3. In all the three types of SCAs, there were significant inverse correlations of AAO with CAG repeat size (SCA1: r = −0.9, p<0.0001; SCA2: r = −0.7, p<0.0001; SCA3:−0.8, p=0.0003) and significant positive correlations of IARS/Age with CAG repeat size (SCA1: r = 0.6, p=0.0015; SCA2: r = 0.9, p<0.0001; SCA3: r = 0.7, p=0.0057). However, the raw IARS scores and the duration adjusted IARS scores d id no t cor re la te significantly with the CAG repeat sizes.
Therefore, our data suggested that
the rate of clinical disease progression at
presentation, especially in SCA2, is
dependent on the CAG repeat size, and
may commence linearly from birth.
Advanced genetics in Ataxias:
Comparison between North and South
Indian populations:
Ancestral origin of the hereditary
ataxias and comparison between cohorts
from North and South India has been done
in collaboration with IGIB, New Delhi.
Details of the findings in SCA (20) and
Friedreich's ataxia (21) have been
published.
We are currently following up this
cohort of ataxias at NIMHANS and also
studying other changes of sleep pattern in
ataxias. A patient with sleep benefit in
episodic ataxia has been reported by us
(22).
Pramod Kumar Pal

REFERENCES :
1. Pal P, Taly AB, Nagaraja D, Jayakumar PN (1995). Early onset cerebellar ataxia with retained tendon reflexes (EOCA): A clinical, electrophysiological and computed tomographic study. Journal of Association of Physicians of India (JAPI) 43: 608-613.
2. Pal PK, Rao Shobhini L, Jamuna N, Taly AB, Nagaraja D, Jayakumar PN (1995). Olivopontocerebellar atrophy and early onset cerebellar ataxia with retained tendon reflexes: A neuropsychological evaluation. NIMHANS Journal 13(2): 101-109.
3. Pal PK, Taly AB, Nagaraja D, Rao S (1996). Early onset cerebellar ataxia with retained tendon reflexes (EOCA): An electromyographic study. Electromyography and Clinical Neurophysiology 36: 287-293.
4. Pal PK, Taly AB, Nagaraja D (1997). Early onset cerebellar ataxia with retained tendon reflexes (EOCA) and comparison with Friedreich's ataxia and olivopontocerebellar atrophy: An evoked potential study. Neurology India 45: 9-13.
5. Pal PK, Taly AB, Jayakumar PN, Nagaraja D (1999). Early onset cerebellar ataxia with retained tendon r e f l e x e s ( E O C A ) a n d o l ivopontocerebel lar a t rophy (OPCA): A computed tomography study. Neurology India 47: 276-281.
6. Krishna N, Mohan S, Yashavantha BS, et al. (2007). SCA 1, SCA 2 & SCA 3/MJD mutations in ataxia syndromes in southern India. Indian J Med Res 126(5):465-470.
7. Bhalsing KS, Sowmya V, Netravathi M, Ja in S , Pa l PK (2013) . Spinocerebellar Ataxia (SCA) type 2 presenting with chorea. Parkinsonism Relat Discord 19:1171-1172.
8. Ketan Jhunjhunwala, Netravathi M, Purushottam M, Jain S, Pal PK (2014). Profile of extrapyramidal manifestations in 85 patients with Spinocerebellar Ataxias. J Clinical Neurosciences 21:1002-1006.
9. Yadav R, Pal PK, Krishna N, Amar BR, Jain S, Purushottam M (2012). Electrophysiological evaluation of Spinocerebellar Ataxias 1, 2 and 3. J Neurological Sciences 312 (1-2): 142-145.
10. Chandran V, Jhunjhunwala K, Purushottam M, Jain S, Pal PK (2014). Multimodal evoked potentials in spinocerebellar ataxia types 1, 2, and 3. Ann Indian Acad Neurol 17(3) : 321-324.
11. Jhunjhunwala K, Prashanth DK, Netravathi M, Jain S, Purushottam M, Pal PK (2013). Alteration in cortical exciability and central motor conduction time in spinocerebellar ataxias 1, 2 and 3: a comparative study. Parkinsonism Relat Disord 19(3):360-311.
154Understanding the Pathophysiology of Spinocerebellar Ataxias

155
12. Netravathi M, Sathyaprabha TN, Jayalaxmi K, Datta P, Nirmala M, Pal PK (2009). A comparative study of cardiac dysautonomia in autosomal dominant spinocerebellar ataxias and idiopathic sporadic ataxias. Acta Neurol Scand 120(3):204-209.
13. Pradhan C, Yashavantha BS, Pal PK, S a t h y a p r a b h a T N ( 2 0 0 8 ) . Spinocerebellar ataxias type 1, 2 and 3: a study of heart rate variability. Acta Neurol Scand 117(5) : 337-342.
14. Sriranjini SJ, Pal PK, Krishna N, Sathyaprabha TN (2010). Subclinical p u l m o n a r y d y s f u n c t i o n i n spinocerebellar ataxias 1, 2 and 3. Acta Neurol Scand 122 (5) : 323-328.
15. Mohan G, Pal PK, Sendhil KR, Thennarasu K, Usha BR (2009). Quantitative evaluation of balance in patients with spinocerebellar ataxia type 1 : A case control study. Parkinsonism Relat Disord 15(6) :435-439.
16. Goel G, Pal PK, Ravishankar S, et al. (2011). Gray matter volume deficits in spinocerebellar ataxia: An optimized voxel based morphometric study. Parkinsonism Relat Disord 17(7) :521-527.
17. Jayakumar PN, Desai S, Pal PK, Balivada S, Ellika S, Kalladala D (2008). Functional correlates of incoordination in patients with sp inoce rebe l l a r a t ax ia 1 : A preliminary fMRI study. J Clin Neurosci 15(3):269-277.
18. Sriranjini SJ, Pal PK, Devidas KV,
Ganpathy S (2009). Improvement of
balance in progressive degenerative
cerebellar ataxias after Ayurvedic
therapy: a preliminary report. Neurol
India 57(2) : 166-171.
19. Netravathi M, Pal PK, Purushottam
M, Thennarasu K, Mukherjee M, Jain
S (2009). Spinocerebellar ataxias
types 1,2 and 3: age adjusted clinical
severity of disease at presentation
correlates with size of CAG repeat
lengths. J Neurol Sci 277(1-2) : 83-86.
20. Mittal U, Sharma S, Chopra R
Dheeraj K, Pal PK, Srivastava AK,
Mukerji M (2005). Insights into the
mutational history and prevalence of
SCA1 in the Indian population
through anchored polymorphisms.
Human Genetics 118:107-14.
21. Singh I, Faruq M, Mukherjee O, et al.
(2010). North and South Indian
populations share a common
ancestral origin of Friedreich's ataxia
but vary in age of GAA repeat
expansion. Ann Hum Genet 74(3) :
202-210.
22. Nagappa M, Mundlamuri RC,
Satishchandra P, Pal PK (2012). Sleep
Benef i t in Episodic Ataxia .
Parkinsonism and Related Disorders
18 (5) : 662-663.
Pramod Kumar Pal

Correspondence : Dr. Piyush Gupta, Block R6A, Dilshad Garden, Delhi 110 095, India. Email: [email protected]; Tel: 011-22592149; Mobile: 919811597172.
DR. K.L. WIG ORATION delivered during NAMSCON 2014 at the All-India Institute of Medical Sciences, Rishikesh.
Ann Natl Acad Med Sci (India), 51(4): 156-165, 2015
Assessment in Medical Education: Time to Move Ahead
Assessment is an integral part of the curriculum. However, the assessment tools, devised more than a century ago, have not kept up with changing scenario of health care and demand of the consumers. In the present scenario, what is tested is a one-time assessment at the exit examination as a surrogate marker for real and observable competence. Most Indian medical schools employ the traditional assessment tools that hardly permit testing of most competencies desirable of a physician; i.e., skills in communication, management, collaboration, professionalism, medical knowledge, health promotion, and counseling. Also, the competencies are not assessed in real time situations. A few medical schools have tried to bridge the gap by introducing the second generation tools, yet the overall approach and methodology is fraught with major drawback of fragmentation and non-contextualization. The physician is supposed to satisfy the patient in a holistic manner or in other words, win the trust. It is this trust primarily what needs to be assessed. The present article stresses on the need of a global assessment conducted on an ongoing/periodic basis, with adequate weightage given to the opinion/assessment of the consumer. Utility of some newer tools including mini clinical evaluation exercise (mini-CEX), direct observation of procedural skills (DOPS), multisource (360º), and portfolio based assessment is discussed. Finally, we introduce the reader to the concept of assessment of entrustable professional activities (EPAs). The concept of EPA helps integrate the theoretical concepts of individual competencies into a measurable parameter of Trust.
Piyush GuptaProfessor of Pediatrics,
University College of Medical Sciences, Delhi, India
SUMMARY

INTRODUCTION
In any field of study, assessment is an integral part of the curriculum. It determines the success and failures of its recipients; and that is its accepted role. But, is it so, especially in the medical field? In the United States, medical students are assessed on the ACGME (Accreditation Council for Graduate Medical Education) Model that outlines 6 major competencies, desirable of a physician. These include medical knowledge , communica t ion and interpersonal skills, patient care, system based practice and procedural skills (Fig. 1) (1, 2). These also encompass other interrelated minor/soft competencies including: quality of care, patient safety, documentation of care, team work, population health, health policy, and organization of health services. If we look
at the current curriculum of undergraduate medical education in Indian universities, there is hardly any emphasis on assessment of professional competencies. It is a known fact that students learn only what is assessed (3). Resultantly, what they gain is bookish knowledge. And, internship – supposedly the golden period for acquiring psychomotor skills – is wasted in preparing for postgraduate entrance examination. Ironically, a bachelor of medicine and surgery (MBBS), after getting through the final summative exams, cannot write a prescription to a child with diarrhea, administer an intradermal vaccine, put in an intravenous line, or conduct a normal vaginal delivery – few of the very basic skills needed of a fresh medical graduate. Medical Council of India (MCI), the custodian of medical education in India is concerned more with accreditation of
157
Figure 1: ACGME Model of Competencies
Piyush Gupta
Professionalism
Medical Knowledge
Communication & interpersonal skills
Patient Care
System based practice
Procedural skills

Institutions(that too, on outdated criteria) rather than concentrating on their output i.e. the medical graduate. Some efforts were made culminating in a “Vision 2015” document (4); the exercise is still cocooned in futility!
Role of Faculty :
Faculty is confused because they are supposed to be multi-tasking, tangled-in the webs of administration, patient-care, and research. Education, by and large, always takes a backseat. Their promotion hangs by the thread of 'number of published papers'. They have less time available for studying and teaching. The problem is more acute in institutions where the faculty members also have a private practice. Clearly, teaching by most faculty members in a medical school setting in India remains a secondary outcome of their activities; the primary motive may differ as to patient care, research, administration, or even politics. The end result is that students are taught by those who have their primary interests, elsewhere. Assessment tools, devised more than a century ago, have not kept up with changing scenario of health care and demand of the consumers. The policymakers, administrators, and the faculty have no time to revise or update them.
Competency-based Medical Training :
A doctor needs to be competent enough to satisfy the patients, their relatives, and the community he/she
serves (5). Competence for physicians, as perceived by the general public- consists of skills in communication, management, collaboration, professionalism, medical knowledge, health promotion, and counseling (6). Most importantly, these competencies need to be carried on life-long in a real life situation (5, 6). In the present scenario, what is tested is a one-time assessment at the exit examination as a surrogate marker for real and observable competence.
Most Indian medical schools employ the traditional (first generation) assessment tools (Table 1) that hardly permit testing of most competencies desirable of a physician. A few universities and medical schools have tried to bridge the gap by introducing the second generation tools, such as objective structured clinical/practical examination (OSCE/OSPE), specifically aimed at testing skills related to medical practice and communication (7). These tools do p e r m i t e v a l u a t i o n o f c e r t a i n competencies, yet the overall approach and methodology is fraught with major drawback of fragmentation and non-contextualization. Let's understand what I mean. For this we first need to know what are the expectations of a physician.
What is Required of a Physician?
Put yourself in a patient's shoes, or merely traverse through your experiences to a time when you were a patient. Now ask yourself: what does a patient need, or expect of his doctor?
158Assessment in Medical Education: Time to Move Ahead

159
D i s c o u n t i n g t h e o u t s i d e environment of a doctor's room to be outside the doctor's control, the first stage comes when the patient comes into direct contact with the doctor. That first impression, or the 'vibes' the patient gets from the doctor consist of a plethora of sub-factors: body language, appearance, mannerisms, attentiveness, cleanliness, the first greeting, etc. The patient, more
often than not, relates these to professionalism, and forms a part of his opinion on the doctor's proficiency. Next is communication, perhaps the single-most important factor on the 'feel-good' antenna for the patient. Other than being coherent and considerate of the patient's limitations of comprehending medical jargon, the doctor also needs to be compassionate, patient, a good listener,
Piyush Gupta
Table 1: Assessment in Medical Education
1st Generation Tools
· Theory: Essay type question unstructured
· Practical: long case, short case, spotting
· Oral examination: Viva-voce
· Log-books
2nd Generation Tools
· Theory: Multiple choice question (MCQ)
o
Modified essay question (MEQ)
o
Short answer question (SAQ)
o Structured essay question (SEQ) · Practical: Objective structured clinical examination (OSCE)
o
Objective structured practical examination (OSPE)
o
Objective structured long examination record (OSLER)
3rd Generation Tools
· DOPS
(direct observation of practical skills)
· Mini CEX (clinical evaluation exercise)
· Portfolio-based assessment
· 360º (multisource) assessment
EPA (entrustable professional activities)assessment·

empathetic and not judgmental. Thirdly, how does the doctor handle the patient physically? How does he examine him? Is the patient's privacy and comfort a priority in the doctor's mind? Before he does something that may induce pain, does he prepare the patient for it? After this comes the diagnosis-more importantly, the right diagnosis. This depends on the knowledge, experience and skills of the doctor. In the current system of evaluation of medical graduate students, this is the only factor a doctor's ability is gauged upon. As can be seen, it is just one of the many considerations a patient values.
Then comes the way a doctor treats the patient. Besides offering a rational evidence based therapy, the physician also has to be mindful of functional parameters like legibility and clear instructions of the prescription; as well as more indistinct constraints like the patient's income. And if a procedure is advised, is the physician competent enough to handle not only the intervention, but also its complications, if the need arises. The next stage would be to counsel the patients on all the possible courses of action and helping/advising them to choose between them. The doctor has to do his possible best in helping the patient make an informed decision in an evidence-based manner.Cure from a disease is not just another part of satisfying the patient; it is the most crucial one and needs to be handled appropriately. It is important to develop that bond of trust between the doctor and the patient.
Trust implies that the patient thinks of the doctor as part of the family, is not hesitant in calling him up for advice in the related field of expertise.
Assessment Needs to be Global :
The physician is supposed to satisfy the patient in a holistic manner (8). Or in other words, win the trust. It is this trust primarily which needs to be assessed. It will not do good to be proficient in one competency and a failure in others. Competencies, however, can be categorized as “must have”, “good to have” and “desirable”. Experts (those devising the curriculum) can draw strict boundaries between the three categories as most of them would agree on the content of each compartment. In real life context, the consumers (patients) differ in what they perceive as “must have”, “good to have”, and “nice to have” competency for their physician. For example whereas for one patient, the professionalism of the physician is more important, for the other, the communication skills matter more. Another patient may be more impressed or at least /satisfied only if the physician is a competent scholar. Most of the time, it is the overall satisfaction, that keeps a patient to the physician. Individual competencies of a physician in different areas become redundant. That's why at times the assessment needs to be 'global' (2). The second generation assessment tools rely primarily on fragmented assessment, and evaluate only one or two competencies at a time.
160Assessment in Medical Education: Time to Move Ahead

Imbibes in practice (real-time context) ≠
Does (in assessment mode)
Does ≠
Shows how
Shows how
≠
Knows how
Knows how
≠
Knows
Knows
Aim
Imbibe in Practice
Figure 2 : Miller Pyramid: 'Does' is also not the ultimate.
161
Assessment needs to be Contextual :
In the current scenario, the assessment of competency takes place in a simulated/artificial environment created especially for the purpose of examination. Competencies are not assessed in the real context where they are going to be practiced. And the assessment is also not being done by the ultimate end-user. Two issues are raised: Where to assess? And who should assess?
Where to assess?
Miller's pyramid of assessment is a hierarchical frame work of assessment (9), where 'doing' a task is ahead of 'showing how to do', 'knowing how to do', and 'knowing', in that sequence. Top of the pyramid consists of 'doing'; however, it
fails to mention the contextual relevance of this 'doing', which is more important.
Can I trust a student who is proficient in the top level of Miller's Pyramid with the life of a newborn infant? A student may 'do' a resuscitation process on a manikin in a copybook manner and score 100%, but may start perspiring or develop slippery palms, when faced with an asphyxiated newborn in the delivery room. Or can I trust a would be physician to be as polite and a thorough gentleman in dealing with patients in a busy OPD, in the same way he/she has demonstrated in a OSCE station during assessment; on a simulated patient. Assessment therefore needs to be done in the context where the competency is to be practiced (10). We thus propose to add another story to the Miller Pyramid, i.e., “imbibed in
Piyush Gupta

1. Use a variety of methods in different environments and context2. Assess on a repeated and ongoing basis3. Assess with a mix of real life situations with focused assessment of
knowledge, attitude, and practice4. Assess by directly observing the behavior5. Use appropriate standards for pass-fail and provide feedback for further
improvement
Box 1: How to Assess ?
Adapted from: Epstein RM. Assessment in Medical Education. NEJM 2007; 356:394.
practice.” (Fig. 2). This is possible only when the competencies are performed “in Context.”
Who should assess would-be doctors?
Akin to most professions where regular assessment is carried out, medicine also employs its experienced members to measure the caliber of their newer counterparts. The proof of a doctor's proficiency, however, can't just be the theoretical or practical knowledge. At the risk of sounding morally naïve, it isn't the mere curing of disease that makes a doctor; because the entire function of a doctor isn't only the elimination of disease, but the overall satisfaction of the patient. It is the reason why the patient is in a unique position of ascertaining whether a doctor is fulfilling his/her purpose or not.
In the current scenario of the
assessment of doctors, much like is the case with a broken car and a mechanic, the
patient is treated as someone to be fixed, and the doctor's ability lies in his effectively fixing the patient. Unlike the car, though, a patient is capable of experiencing and expressing emotions; also, the patient's mental calm is part of their health, which the doctor aims to restore. It is but natural that their view be taken into account.
Still, in today's assessment of a medical graduate, there is no provision for the patient's opinion or satisfaction. The assessment, which ideally should be consumer-driven, is actually provider-driven. It is done by medical teachers, and even if they wanted to gauge the patient's opinion, there are no defined, well-known factors to do so.
What needs to be Done?
We have seen above that it is essential that competencies be assessed in an integrated and contextualized manner. To be declared as being proficient, a given
162Assessment in Medical Education: Time to Move Ahead

163
task has to be done in professional manner, communicated well, thought well, executed well and finally appreciated by the consumer. Also, competencies are dynamic and not static (5) and therefore need to be assessed on an ongoing/periodic basis rather than a one-time assessment (11).
Many more third generation assessment tools have been developed specifically to test the competencies. In a mini clinical evaluation exercise (mini-CEX), the observer assesses a trainee on history-taking and physical examination over 10-15 minutes, followed by discussion on the diagnosis and management, in a structured format (12). Direct observation of procedural skills (DOPS) aims to specifically assess procedural competencies. Multisource (360º) assessment is probably the only tool that dwells on evaluation by the peers, patients, and self. A number of such evaluations are needed and will require some modifications to be of utility for a summative examination (13). The process also includes generation of a portfolio that covers domains of all aspects of competence and serves as a display project for review. Portfolio is a window for self-reflection and also includes plans for future learning. Portfolios demonstrate the development and professional capacity of the student (14, 15). Close monitoring is a necessary pre-requisite for portfolio to be effective in assessment and further learning (16).
Assessment of entrustable professional activities (EPAs) :
If we can depend on someone to do a task, he/she can said to be 'entrustable'. We want physicians who can be entrusted to take care of us, our family, the community, and the society at large. However, their competency in treating an illness is only one pillar on which 'Trust' is based. Other pillars, of this “trust-building” involve their body language, c o m m u n i c a t i o n s k i l l , m e d i c a l professionalism, and confidence. We would entrust a doctor who, when in dilemma and time in favor, prefers to obtain a second opinion, rather than plunging into a hasty and risky decision on his/her own. Of the two students, whom you ask to order a set of investigation for diagnosing a patient, the first one writes all the 5 tests that can help in diagnosis; the second student also knows that there are 5 tests but will order only the first two (the most reliable ones)-whom are you going to trust more. Both know the subject well, thus both are competent; however their “professional activities” differ. It is up to you whom do you trust more? Competence thus may not necessarily translate into entrustable professional activities (EPA).
The concept of EPA has been conceived to facilitate the transition of individual competencies as outlined in ACGME model into a framework that defines the overall professional qualities of a physician. The concept helps integrate the theoretical concepts of individual competencies into a measurable
Piyush Gupta

parameter of Trust. Olle ten cate has defined EPA as “unit of professional p r a c t i c e d e f i n e d a s t a s k s o r responsibilities to be entrusted to the unsupervised execution by a trainee once he or she has attained sufficient specific competence. EPAs are independently executable, observable, and measurable in their process and outcome, and therefore suitable for entrustment decisions. Sequencing EPAs of increasing difficulty, risk, or sophistication can serve as a backbone for graduate medica l education” (17). Assessment of EPA, though subject to variability of student, examiner, context, and the activity itself, can be defined and utilized for graduate medical education program. EPA has emerged as the vital link between competencies and clinical practice (18). This can serve as a useful tool in reforming medical education in India. Box 1 summarizes the most important tips needed to bring out a change in the current assessment practices.
Lay public, i.e. the consumers, the sole beneficiary of medical education is hardly a stakeholder in planning of making a doctor. Abraham Flexner, more than a century ago released a report in US (19), primarily addressed to public that fueled the change and changed the face of medical education in America. Similar situation is prevailing in India at present, with mediocre quality of most medical schools, profit motive of many such institutions in private domain, inadequate facilities at many state-run schools, stress on postgraduate admission, and unfocussed faculty and student. It's time
for the consumers to get up from slumber and play a pro-active role, demand what they need, create what they desire, and d i sca rd wha t they don ' t wan t . Government, experts, and regulatory bodies have not been able to do this on their own. The people of India need to exercise their mandate for a healthy nation. Competing interests: None stated.
Funding: None.
REFERENCES :
1. Batalden P, Leach D, Swing S, Dreyfus H, Dreyfus S (2002). General competencies and accreditation in graduate medical education. Health Aff (Millwood) 21:103-111.
2. Farrell SE (2005). Evaluation of student performance: clinical and professional performance. Acad Emerg Med. 12:302e6-10.
3. Cooke M, Irby DM, Sullivan W, Ludmerer KM (2006). American medical education 100 years after the Flexner report. N Engl J Med 355:1339-1344.
4. Medical Council of India. Vision 2 0 1 5 . A v a i l a b l e f r o m : http://www.mciindia.org/tools/announ c e m e n t / M C I _ b o o k l e t . p d f . Accessed 15 June,2014.
5. Epstein RM (2007). Assessment in medical education. N Engl J Med 356:387-396.
164Assessment in Medical Education: Time to Move Ahead

165
6. Ten Cate O (2011). Competency-based med ica l t r a in ing and e v a l u a t i o n . D e f i n i t i o n s a n d correlations with real clinical practice. Revista Argentina de Cardiologia 79:405-407.
7. Gupta P, Dewan P, Singh T (2010). Objective Structured Clinical Examination (OSCE) revisited. Indian Pediatr 47: 911-920.
8. Te n C a t e O ( 2 0 0 6 ) . T r u s t , competence, and the supervisor's role in postgraduate training. BMJ 333: 748-751.
9. Miller GE (1990). The assessment of c l i n i c a l s k i l l s / c o m p e t e n c e / performance. Acad Med 65(9 Suppl):S63-S67.
10. Klass D (2000). Reevaluation of clinical competency. Am J Phys Med Rehabil 79:481-486.
11. Leach DC (2002). Competence is a habit. JAMA 287:243-244.
12. Norcini JJ, Blank LL, Duffy FD, Fortna GS (2003). The mini-CEX: a method for assessing clinical skills. Ann Intern Med 138:476-481.
13. Dannefer EF, Henson LC, Bierer SB, et al. (2005). Peer assessment of professional competence. Med Educ 39:713-722.
14. Mathers NJ, Challis MC, Howe AC, Field NJ (1999). Portfolios in continuing medical education--effective and efficient? Med Educ 33: 521-530.
15. Challis M (2001). Portfolios and assessment: meeting the challenge. Med Teach 23:437-440.
16. Challis M (1993). Introducing Apel. London: Routledge.
17. Ten Cate O (2013). Competency-based educat ion, ent rus table professional activities, and the power of language. J Grad Med Educ 5:6-7.
18. Ten Cate O (2013). Nuts and bolts of entrustable professional activities. J Grad Med Educ 5:157-158
19. Flexner A (1910). Medical education in the United States and Canada. A Report to the Carnegie Foundation for the Advancement of Teaching. New York: Carnegie Foundation for the Advancement of Teaching.
Piyush Gupta

Iodine Deficiency Disorders (IDD) constitute the single largest cause of preventable brain damage worldwide. In India the entire population is prone to IDD due to deficiency of iodine in the soil of the subcontinent and consequently the food derived from it. Of these, an estimated 350 million people are at higher risk of IDDs as they consume salt with inadequate iodine. Every year nine million pregnant women and eight million newborns are at risk of IDD in India.
On September 13, 2000, the Government of India lifted the ban at the national level on the sale of non-iodized salt (India Gazette 2000). Scientists, civil society, international agencies and other stakeholders joined ranks to fight against this retrograde step by the government of India. The four pronged approach to fight the removal of ban on non-iodized salt comprised of writing advocacy documents, meeting with stakeholders, media campaign and tracking of Universal Salt Iodization (USI) in states by state iodine status surveys.
But effective advocacy and media campaign were hampered by lack of scientific data substantiating the magnitude of Iodine Deficiency disorders (IDD) in India. To address this lacuna, state level Iodine status surveys were planned in seven states of India and were executed over next five years in collaboration with various national and international stakeholders.
Chandrakant S PandavProfessor and Head
Centre for Community Medicine All-India Institute of Medical Sciences, New Delhi.
SUMMARY
Ann Natl Acad Med Sci (India), 51(4): 166-177, 2015
From Research to Policy to Programme: Success Storyof Seven State Iodine Deficiency Disorders (IDD)
Survey in India
Correspondence : Dr. Chandrakant S Pandav, Room No-29, Centre for Community Medicine, Old OT Block, All- India Institute of Medical Sciences, New Delhi-110029, Phone no- +91-11-26588522, Fax : +91-11-26588522, E-mail : [email protected].
DR. R.V. RAJAM ORATION delivered during NAMSCON 2012 at the Anna Centenary Library Convention Centre, Kotturpuram, Chennai.

State level IDD surveys were carried out in seven states (Kerala, Tamil Nadu, Orissa, Rajasthan, Bihar, Goa and Jharkhand) from 2000 to 2006 by International Council for Control of Iodine Deficiency Disorders (ICCIDD) in collaboration with state medical colleges, Micronutrient Initiative (MI) and UNICEF. The surveys were carried as per the recommended guidelines of WHO/UNICEF/ICCIDD and used 30 cluster into 40 children sampling methodology. Children in the age group of 6-12 years, women in the household, retail shop keepers and other community stakeholders constituted the study population. All three indicators viz. Total Goiter Rate (TGR), Urinary Iodine (UI) concentration and iodine content of salt (household and retail shop) were studied. TGR ranged from 0.9% in Jharkhand to 14.7% in Goa. The median urinary iodine excretion ranged from 76 µg/L in Goa to 173.2 µg/L in Jharkhand. The household level consumption of adequately iodized salt ( ≥ 15 ppm) ranged from 18.2% in Tamil Nadu to 91.9% in Goa. These state level IDD surveys are the only sub-national (state) level IDD surveys in India where all three indicators viz. iodized salt coverage, urinary iodine and TGR were assessed concurrently.
These surveys provided valuable reliable scientific data to back up the need of urgency to re-instate the ban and aided in convincing wider scientific community and policy makers regarding the need for the same. These surveys also aided in capacity building at state level which will provide necessary impetus to sustain USI. The ban on sale of non-iodized salt was finally re-instated in May, 2005.
Purpose of the study : To understand the complex policy environment in which National Health Programmes in India are operating.
Basic Procedures : A case study approach applying the criteria of policy formulation and policy implementation to National Iodine Deficiency Disorders Control Programme (NIDDCP).
Main Findings : The major limiting factor in the implementation of NIDDCP was that the community perceptions about IDD and iodized salt and their interests and beliefs (Values) were not explicitly considered as part of the implementation process. Addressing the values through sustained advocacy, development of partnerships among stakeholders, supply and demand side interventions and more research based on the programme needs helped in achieving sustainability in elimination of IDD.
Conclusion : In formulating National Health Programmes in a policy environment, scientific inputs, political will and institutional structure for decision making are
167 Chandrakant S Pandav

INTRODUCTION
E v e r y g o v e r n m e n t h a s a responsibility to protect the health of its population. Governments achieve this by formulation of policy and programmes. Policies and programmes are formulated in the light of available evidence regarding the public health importance of a health problem. Formulation of policy and programmes based on available evidence is an iterative process (1). Generation of evidence about problem and intervention leads to formulation of a policy and that translates into programme through development of institutional structures and mechanisms of monitoring and surveillance. Results of evaluation of programme determine future research agenda. However, establishing an effective and efficient programme is a continuing and a complex challenge and is subject to many competing factors besides the science of it.
There have been many examples of successful implementation of National Health Programmes in India and other developing countries. But one of the major stumbling blocks has been ensuring “sustainability” of the programmes once the pre-set goals and targets have been
achieved after initial intensive phase. The challenges for ensuring “sustainability” can be much more complex and daunting as compared to the program initiation phase.
The dynamic evolution of National Iodine Deficiency Disorders Control Programme (NIDDCP) in India provides a unique opportunity to study the interaction between research, policy, programme and decision making process and to identify solutions for the future. This also helps in understanding the complex policy environment in which National Health Programmes operate and to identify key enabling and impeding factors. The development over last decade of NIDDCP provides exce l len t opportunities to understand the issues related to “ensuring” sustainability of the national health programs.
Case study :
Problem Statement :
Iodine Deficiency Disorders (IDD) is the most common cause of preventable irreversible brain damage worldwide. IDD comprise of a spectrum
168Success Story of Seven State Iodine Deficiency Disorders (IDD) Survey in India
necessary but not sufficient. Pro-active recognition values of key stakeholders, continuous and dynamic generation of scientific information and development of partnerships are critical for sustainability of the National Health Programmes.
Keywords : Policy, Values, National Iodine Deficiency Disorders Control Programme, Sustainability, India.

169
of diseases including goiter, cretinism, hypothyroidism, brain damage, abortion, s t i l l b i r th , men ta l r e t a rda t ion , psychomotor defects and hearing and speech impairment. Iodine Deficiency causes a reduction of 13.5 IQ points in children and may lead to major learning disabilities (2). Globally 1.88 billion people are at risk of iodine deficiency disorders due to insufficient iodine intake (3). In India, Iodine Deficiency Disorder is endemic, defined as prevalence of more than 10%, in 303 districts out of 365 districts surveyed (4). An estimated 350 million people are at risk of IDD in India.
Intervention :
Universal Salt Iodization is considered as cornerstone in the control of iodine deficiency disorders. In 1994, a special session of the WHO and UNICEF Joint Committee on Health Policy recommended Universal Salt Iodization as a safe, cost-effective, and sustainable strategy to ensure sufficient intake of iodine by all individuals (5). Salt iodization which costs 0.05 US$ per persons per year and has a benefit- cost ratio of 81 has been identified as a priority area for targeting hunger and malnutrition by Copenhagen Consensus Statement 2012 (6).
In India, effectiveness of salt iodization to control Iodine Deficiency Disorder was established in a landmark study in the Kangra valley in Himachal Pradesh from 1956 to 1972 (7). This lead
to establishment of National Goiter Control Programme (NGCP) in 1962 (8). Promotion of consumption of iodized salt in the endemic areas was one of the key features of NGCP. In the face of emerging evidences, the programme was modified and renamed as National Iodine Deficiency Disorders Control Programme (NIDDCP) in 1992. In the same year, pursuant to the advice of Central Committee for Food Standards, Government of India advised all states to ensure mandatory salt iodization for direct human consumption under the provisions of Prevention of Food Adulteration (PFA) Act, 1954. For the sake of uniformity in implementation of legislation throughout the country, further amendment was done in PFA Act in 1997 to ban sale of non-iodized salt for direct human consumption throughout the country (9). However, in year 2000, ban on sale of non-iodized salt for direct human consumption was lifted (10), which was reinstated again in 2005 after sustained advocacy (11). Recently, in year 2011, the Supreme Court of India and a committee established under its direction upheld the scientific basis of mandatory salt iodization for control of Iodine Deficiency Disorders (12). In the same year, regulations under Food Safety and Standards Act, 2006, which has replaced PFA Act 1954, were notified banning sale of non-iodized salt for direct human consumption (13).
Control of Iodine Deficiency Disorders in India can be divided into four phases:
Chandrakant S Pandav

Phase 1: Scientific research leading to program (1956-1983) :
Based on the success of the Kangra Valley study, the Government of India established the National Goiter Control Program (NGCP) in 1962 at the end of the second Five-Year Plan (8). The NGCP was focused on highly endemic areas like Himalayan goiter belt. During this period only 12 salt iodization plants were established with actual production of 0.2 million tons/year, which was estimated to be 15% of the need. Due to area specific approach and recognition of IDD as a mild cosmetic problem restricted to a particular region, NGCP remained a low priority health programme.
Phase 2: Influencing institutional decision making leading to policy change (1983-2000) :
During this phase new scientific evidence that emerged both from across the world and from India, showed significant impact of iodine deficiency on early brain development, cognition and learning abilities of children (14, 15, 16). Evidence also emerged regarding very h i g h p r e v a l e n c e o f n e o n a t a l hypothyroidism in some parts of the country (17). New evidence also established that the whole country is prone to IDD (18). This led to programme being modified and renamed as National Iodine Deficiency Disorders Control Programme in 1992 with increased focus on Universal Salt Iodization.
The linking of iodine deficiency with problems in learning and its consequent effect on achievement of the goal of “Education for All” convinced the political leadership of the critical importance of the problem and helped in securing the high level of political commitment. In 1983 in the Annual Meeting of Central Council of Health, it was decided that all edible salt in India would be iodised by year 1992 and the private sector was allowed to set up salt iodization units (19). After sustained advocacy, Government of India notified a national level ban on sale of non-iodised edible salt in year 1997 (9). These measures caused an increase in production of iodized salt from 0.2 million tons in 1986 to 4.4 million tons in 2000 (20). This also led to an increase household consumption in iodized salt with 49% households consuming adequately iodized salt (≥ 15 Parts per million (PPM) (21).
Phase 3: “Values” affecting program and policy (2000-2005) :
The ban on the sale of non-iodized salt or human consumption was lifted in September 2000 (10). Some of the factors responsible for this action could have been price differential in iodized and non-iodized salt, IDD being viewed as a problem affecting only a small section of the society, difficulties faced by salt producers under Prevention of Food Adulteration Act, 1954, politics and economics of liberalization in terms of the programme being labeled as run by multinational aid agencies and companies
170Success Story of Seven State Iodine Deficiency Disorders (IDD) Survey in India

171
and principles of choice. It was reasoned that “Matters of public health should be left to the informed choice, and not enforced through compulsion”. This led to a decline in iodized salt production to 4.1 million tons in 2003 and resulted in a major drop in the household coverage of iodized salt. Another survey done in the year 2002-03 reported a household coverage of 30% (22). According to the third round of National Family Health survey conducted in 2005-06, household coverage with adequately iodized salt was marginally increased to 51% (23).
The lifting of ban spurred the scientific community in conducting more research to generate scientifically valid information to address this challenge. A research conducted by International Council for Control of Iodine Deficiency Disorder (ICCIDD) in seven states during the period 2000-2006 reported that Iodine Deficiency Disorders remained endemic in these states (24). Studies conducted by National IDD Cell and other government agencies found that 263 out of 324 districts surveyed were endemic for IDD. None of the states or Union Territories was found to be free of IDD. Intense advocacy countering the claims made against the policy of Universal Salt Iodization viz. iodization leading to only marginal increase of price of salt up to 20 paisa per year, every individual being at risk of IDD as it is a disease of soil, and the fact that all the salt in India is produced, iodized, packaged and sold by national companies and most of the salt in India is produced by small and medium scale producers. Various stakeholders were engaged in informed debate.
Phase 4: Addressing “values”, focus on sustainability (Since 2005) :
In the face of sustained advocacy and generation of evidence, Core Advisory Group on Public Health and Human Rights of National Human Rights Commission was asked in 2004 to critically examine the public health consequence of lifting of ban on mandatory salt iodization for human consumption. The Core Advisory Group suggested that the Universal Salt Iodization is a public health need which should be implemented throughout the country without nay relaxation in the ban on sale of non-iodized salt for human consumption. Consequent to this, the ban on sale of non-iodized salt was reinstated in 2005 (11).
There was also an attempt among various stakeholders to develop partnership for sustained advocacy and pushing the agenda of sustainable elimination of IDD. National Coalition for Sustained Iodine Intake (NCSII) was established with various stakeholders like government departments, office of the Salt Commissioner of India, academic institutions, research organizations, salt producers, bilateral and multilateral developmental organizations and civil society group. Efforts were also made to engage small and medium scale salt producers in ensuring the quality of iodized salt. Various innovative business models including introduction of iodized salt in Public Distribution System is also being implemented to increase coverage with iodized salt. This multipronged
Chandrakant S Pandav

approach with supply and demand side intervention led to a quantum jump in the household coverage with adequately iodized salt in India. Coverage Evaluation Survey (CES) 2009 reported that 71 % households are consuming adequately iodized salt with another 20% consuming salt with some iodine (25). The iodized salt production also increased to 6.2 million tons in the year 2010-11 (26).
However, a recent survey done in rural areas of 8 states with less coverage with adequately iodized salt shows, it remains low at 35.4 % to 64.1%. In these states, only 58.7% households were aware of iodised salt and only 35.4 % respondents knew that iodine deficiency causes “less mental development and diminished intelligence” (27). This led to more sustained advocacy, research in the reasons for low coverage in rural areas, and renewed focus on obstacles in achieving Universal Salt Iodization.
Contextual frameworks of policy making environment :
Decision making process in formulation of policy and programmes is based primarily on the recognition of a problem as a “social or public health problem” and availability of an effective and efficient intervention, and decision making input. The success of IDD control
172
Health Issue/Problem
Information
Institutional structure for decision making
Policies
Figure 1: Environment in which policies are made
Figure 2: Environment in which policies should be made
Health Issue/Problem
Information
Institutional structure for decision making
Policies
Values
Figure 3: Values in the
context of salt iodization
Core Values - Ideologies
• Salt as symbol of freedom struggle• Globalization and Liberalization
Beliefs- Casual Assumptions
• Iodine and impurity
Interests
• Iodine & Import• Loose Vs Packaged• National Vs Multinational• Small Vs Big Producers
Success Story of Seven State Iodine Deficiency Disorders (IDD) Survey in India

173
p r o g r a m m e d u r i n g 1 9 8 3 - 2 0 0 0 demonstrated the importance of decision making input. The recognition of IDD as a health problem and its solution existed since 1962. However, the programme got boost after got political support and dec i s ion making s t ruc tu re was institutionalized. Fig. 1 represents the environment in which policies were made. However, the reversal of ban on non-iodized salt in 2000 established the centrality of “values” in influencing the formulation of policies in a democratic set up (Fig. 2).
Values can be defined as “broad preferences concerning appropriate courses of action or outcomes”. They operate at three different levels, namely core values or ideologies, beliefs and interests (Fig. 3). It was felt that the lack of focus on influencing the values of important s takeholders and the community at large was one of the major failures of NIDDCP. The core values relevant to the context were recognition of salt as a symbol of freedom struggle, and its positioning in the present day milieu as a fight between globalization and nationalization. The irrational belief of associating addition of iodine to salt as impurity further aggravated the negative value regarding iodized salt. The interest of salt producers and traders whose immediate benefits were associated with sale of non-iodized salt promoted the negative influence of core values and beliefs. However, once these values were addressed in right earnest, the programme faced least obstacle in implementation and
has performed well. It was learnt that values should form an important input in policy formulation and programme implementation along with inputs like problem identification and scientific evidence for sustainability of policies.
Apart from addressing the values, development of enduring partnership among stakeholders is an important prerequisite for achieving sustainability. Regular Supply and demand side interventions are another prerequisite for achieving sustainability. Supply side interventions could be in the form of technical support, economic support or social support; demand side interventions could be in the form of altering community perception through sustained advocacy and legislations. Sustained political commitment and availability of regular and reliable scientific data is another requirement for achieving sustainability.
Discussion :
The case study of NIDDCP highlights the role of values, development of partnerships, and availability of reliable scientific data, sustained advocacy and political commitment in successful implementation of health programmes. The dynamic process involved in evolution and implementation of NIDDCP clearly delineated that health issues have social, economical and political ramifications. In the formulation of policy in a democratic environment, in addition to identification of the health
Chandrakant S Pandav

problem/issue, information in the form of evidence based data on effective and efficient intervention to eliminate the problem and formal and informal networks; there is a need to factor in “values”. Neglect of values by the policy makers may lead to serious setback to the programme implementation as seen in case of NIDDCP.
This case study reinforced the need to carry out stakeholder analysis prior to development of any health policy and programme implementation. Stakeholder analysis is a process of systematically gathering and analyzing qualitative information to determine whose interests should be taken into account when developing and /or implementing a policy or a programme (28). Stakeholders include persons or organizations, which have a vested interest in the policy that is being promoted. Knowing who the key actors are, their knowledge, interests, positions, alliances and importance related to policy allows policy makers to interact more effectively with key stakeholders and increase support for a policy and programme.
The findings of the case study provided an understanding of a complex issue. The findings provided support to the conceptual framework put forward by us. Though the broad facts related to the study hypothesis were known before, this case study provided systematic evidence for the same. The findings of the study are relevant to the implementation of other
health programmes in the country or even to other programmes related to social sector where people are important stakeholders. The findings can be generalized to other countries as well.
However, further research is warranted to understand the process of generation of “values” identified in the study. Systematic qualitative studies should be carried out to identify the determinants of these “values” and to develop appropriate interventions to modify them to aid the successful implementation of policy and programme.
Conclusion :
The major limiting factor in the implementation of NIDDCP was that the community perceptions about IDD and iodized salt and their values were not explicitly considered as part of implementation process. However, the programme performed much better when values of the stakeholders were addressed appropriately. In the formulation of a policy in a democratic set up, “Values” of the stakeholders play a vital role and should be incorporated as integral inputs into the process of policy making and programme implementation. However, development of partnerships, availability of reliable scientific data, sustained advocacy and political commitment is important for achieving sustainability of the programme.
Conflict of Interest : None
174Success Story of Seven State Iodine Deficiency Disorders (IDD) Survey in India

175
Acknowledgement :
I acknowledge the help of Prof. M. G. Karmarkar, Senior Advisor, International Council for Control of Iodine Deficiency Disorders, Dr. Kapil Yadav, Assistant Professor, Centre for Community Medicine, All-India Institute of Medical Sciences, New Delhi & Dr. Rakesh Kumar, Senior Programme Officer, Indian Coalition for Control of Iodine Defic iency Disorders in preparation of this manuscript.
REFERENCES :
1. Tugwell P, Bennett KJ, Sackett DL, Haynes RB (1985). The measurement iterative loop: a framework for the critical appraisal of need, benefits and costs of health interventions. J Chronic Dis 38(4):339-351.
2. Bleichrodt N, Born MP (1994). A meta-analysis of research on iodine and its relationship to cognitive development. In : The damaged brain of iodine deficiency–Cognitive behavioral, neuromotor, educative aspects. Stanbury JB (ed), New York: C o g n i z a n t C o m m u n i c a t i o n Corporation:195-200.
3. Andersson M, Karumbunathan V, Zimmermann MB (2012). Global iodine status in 2011 and trends over the past decade. J Nutr 142:744-750.
4. IDD and Nutrition Cell, Directorate General of Health Services, Ministry of Health and Family Welfare, India (personal communication).
5. World Summit for Children – Mid D e c a d e G o a l : I o d i n e Def ic iencyDisorders (1994) . UNICEF–WHO Joint Committee on Health Policy. Geneva, United Nations Children's Fund, World H e a l t h O r g a n i z a t i o n (JCHPSS/94/2.7).
6. Hoddinott J, Rosegrant M, Torero M (2012). Challenge Paper: Hunger and M a l n u t r i t i o n . C o p e n h a g e n Consensus Centre. Copenhagen. ( A v a i l a b l e a t U R L ht tp: / /www.coenhagenconsens us.com/Projects/CC12/Research/Hunger Malnutrition.aspx [accessed on 04.11.2012]
7. Sooch SS, Deo MG, Karmarkar MG, Kochupillai N, Ramchandran K, R a m l i n g a s w a m y V ( 1 9 7 3 ) . Prevention of endemic goitre with iodized salt (1973). Bull World Health Org 49:307-312.
8. Pandav CS , Kochup i l l a i N , Karmarkar MG, Nath LM (1986). Iodine Deficiency Disorders in India: review of control measures. Indian Pediatr 23:325-329.
9. Gazette of India. Ministry of Health and Family Welfare. GSR 670 (E) 1997. New Delhi. 27 November, 1997.
Chandrakant S Pandav

10. Gazette of India. Ministry of Health and Family Welfare. GSR 716(E) 2000. New Delhi. 13 September, 2000.
11. Gazette of India. Ministry of Health and Family Welfare. GSR 670(E) 2005. New Delhi. 17 November, 2005.
12. Supreme Court of India. Civil Writ Petition No. 80/2006 (2011). Academy of Nutrition Improvement and Ors.Vs. Union of India (Available a t URL h t tp : / / jud i s .n ic . in / supremecourt /Case Res1.aspx [accessed on 25.10.2012]
13. Food Safety and Standards Authority of India (2011). Food Safety and S t a n d a r d s ( P r o h i b i t i o n a n d Restriction on sales) Regulation, 2011; New Delhi.
14. Qian M, Wang D, Watkins WE, et al. (2005). The effects of iodine on intelligence in children: a meta-analysis of studies conducted in China. Asia Pac J Clin Nutr 14:32-42.
15. Mehta M, Pandav CS, Kochupillai N (1987). Intellectual assessment of school children from severely iodine deficient villages. Indian Pediatr 24:467-473.
16. Upadhyay SK, Agarwal KN, Rani A, Cherian S, Tripathi AM, Agarwal DK (1983). Developmental lag in preschool children of goitrous mothers. Indian Pediatr 20:259-263.
17. Kochupillai N, Pandav CS, Godbole
MM, Mehta M, Ahuja MM (1986).
Iodine deficiency and neonatal
hypothyroidism. Bull World Health
Organ 64:547-551.
18. Gopalan C (1981). National Goitre
Control Programme. NFI Bulletin.
19. Pandav CS, Kochupillai N, Nath LM
(1984). National policy on endemic
goitre--harbinger of national policy
on nutrition. Indian J Pediatr 51:277-
282.
20. Salt Commissioner of India (2001).
Annual Report 2000-2001, Office of
the Salt Commissioner of India. Salt
Department, Ministry of Commerce
and Industry, Government of India,
Jaipur.
21. International Institute for Population
Sciences (2000).National Family
Health Survey (NFHS-2) 1998-99:
India. Mumbai: IIPS; 2000.
22. International Institute for Population
Sciences (IIPS). District Level
Household Survey (DLHS-2), 2002-
04: India. Mumbai: IIPS; 2006.
23. International Institute for Population
Sciences (2007).National Family
Health Survey (NFHS-3) 2005-06:
India. Mumbai: IIPS; 2007.
176Success Story of Seven State Iodine Deficiency Disorders (IDD) Survey in India

177
24. Indian Coalition for Control of Iodine deficiency Disorders (2006). Tr a c k i n g P r o g r e s s To w a r d s Sustaining Elimination of IDD in Seven States 1999-2005. ICCIDD, New Delhi. (Available at URL: http://www.iqplusin.org/Reports.htm [Accessed on 1.7.2011].
25. U N I C E F ( 2 0 1 0 ) . C o v e r a g e Evaluation Survey 2009, All India Report. Ministry of Health and Family Welfare, Government of India; New Delhi. (Available at URL: http://www.unicef.org/india/health.html [Accessed on 26.10.2012].
26. Salt Commissioner of India (2011). Annual Report 2010-2011, Office of
Chandrakant S Pandav
the Salt Commissioner of India. Salt Department, Ministry of Commerce and Industry, Government of India; Jaipur.
27. Micronutrient Initiative, ICCIDD, Nie lsen , Off ice of the Sa l t commissioner. Iodised salt coverage study 2010: Conducted across eight states in India. Micronutrient Initiative; 2010. (Available at URL: http://www.micronutrient.org/CMFiles / india-sa l t -coverage-repor t - 2010.pdf [Accessed on 10.07.2012].
28. Schmeer, Kammi (1999). Guidelines for conducting a stakeholder analysis. Bethseda, MD: partnerships for Health reform, Abt Associates Inc.

Rajeshwar DayalProfessor and Head, Dept. of Pediatrics
S. N. Medical College, Agra.
SUMMARY
Ann Natl Acad Med Sci (India), 51(4): 178-193, 2015
Diagnosis of Childhood Leprosy – Changing Trends
Leprosy, a chronic infectious disease caused by mycobacterium leprae, mainly involves the skin, respiratory mucosa and the peripheral nervous system. Leprosy continues to remain a public health problem. In 2011, the global new case detection was 219075 and in India it was 127295. Thus, India accounts for > 58% of total cases of leprosy worldwide. Pediatric leprosy accounts for around 10% of the total disease burden.
The main source of transmission of leprosy is from the untreated lepromatous patients and the most common route is through the nasal secretions. From the nasal mucosa, the bacteria spreads by hematogenous route to skin and the peripheral nerves. The disease has a long incubation period of 3-5 yrs (can be upto 20 yrs).
After infection, the child first develops indeterminate leprosy which can either get cured spontaneously or on treatment or it can progress to one of the several clinical forms (tuberculoid, borderline or lepromatous). The clinical spectrum varies from tuberculoid, where there are a few, large, anesthetic skin patches with thickened peripheral nerves and no detectable bacilli to lepromatous type where there are multiple, small skin lesions with intact sensation and high bacillary load. In our study spanning over 20 years, we have observed no significant change in the clinical profile.
Early diagnosis of leprosy requires a high index of suspicion on the part of the clinician. It is based on detection of 2 of the following features, namely, characteristic skin lesion, loss of sensation and thickened peripheral nerves or the detection of AFB in skin or nasal smear.
Correspondence : Dr. Rajeshwar Dayal, Professor and Head, Dept. of Pediatrics, S. N. Medical College, Agra – 282002.
DR. PRAN NATH CHHUTTANI ORATION delivered during NAMSCON 2013 at the All-India Institute of Medical Sciences, Jodhpur.

We conducted a number of studies, evaluating various newer techniques for early detection of the disease. In one study, we found the FLA-ABS and Lepromin tests, to be of immense value for identification of "at risk" population in the community and for detecting subclinical infection. We also studied antibody response against 35k Da antigen by SACT and found that nearly 50% smear negative, 42% lepromin +ve and 70% lepromin -ve cases showed positive antibody response with no false positive response.
Gene probes developed at our institute were tried on 100 patients. AII smear +ve cases, lepromin +ve cases and majority of smear- ve cases were detected by this method. 9 cases (4 indeterminate & 5 nonspecific) with inconclusive histopathology were also detected.
In another study on 22 children, in-situ hybridization technique helped in diagnosing the children with negative skin smear and non specific histopathology. It also permitted the concomitant study of tissue pathology.
Again, in our pioneer study, evaluation of the in-situ PCR technique revealed that histopathology detected 45% of total cases, in-situ PCR detected as much as 60% of the total cases. Thus, In-situ PCR offered excellent structural correlation permitting concomitant study of tissue pathology. As contamination by foreign DNA/RNA does not exist, it is a valuable tool for diagnosis of childhood leprosy.
RLEP based PCR is yet another useful tool to detect cases where skin smears are -ve and skin biopsy is not feasible. In our study involving 73 patients, Z-N staining for AFB was positive in 17/73 (23.28%) cases and RLEP PCR in 56/73 (76.71%) cases. All 30 controls showed negative results. RLEP PCR technique had a significantly greater positivity (especially in early stages of leprosy) than ZN staining (p< 0.001).
Suggested algorithm for diagnosis, whenever there is clinical suspicion, we can either go for smear for AFB or histology to confirm the diagnosis. A positive smear for AFB is confirmatory. If it is negative then, we can subject the specimen for gene probes or PCR/In-Situ PCR/RLEP PCR. If the result is positive, it is diagnostic of leprosy. On the other hand, if histology shows characteristic features then it is confirmatory; if it is not characteristic, we can go for in-situ hybridization. A positive in-situ hybridization is diagnostic of leprosy; if it is negative then we can opt for in-situ PCR.
To conclude, leprosy often poses a diagnostic dilemma. It is important that after a good clinical assessment, new diagnostic tests be used to diagnose the condition at an early stage & prevent complications/ deformities.
179 Rajeshwar Dayal

180
INTRODUCTION
Leprosy is an ancient disease, earliest described in Asia (India & China) around 6th century B.C. It was described as Kustha-Roga (in Sanskrit it means eating away) by Susruth Samhita (600 B.C) (1). In 1873 Dr. Gerhard Henrik Armaeur Hansen of Norway discovered M. leprae as the causative agent of leprosy (2).
Etiology :
M. leprae i s an ob l iga te intracellular bacillus (0.3–1 m wide and 1–8 m long) that is confined to humans and armadillos. The organism is acid-fast, indistinguishable microscopically from other mycobacteria, and ideally detected
in tissue sections by a modified Fite stain. The bacilli has an extremely slow dividing time (once every 2 weeks); the incubation period ranges from 6 months to more than 40 years and averages from2 to 5 years (3).
Epidemiology :
Leprosy is almost exclusively a disease of the developing world, affecting areas of Asia, Africa, Latin America, and the Pacific. While Africa has the highest disease prevalence, Asia has the most cases. More than 80% of the world's cases occur in a few countries: India, China, Myanmar, Indonesia, Brazil, Nigeria, Madagascar, and Nepal. Countrywise, maximum number of cases of leprosy reside in India (4) (Table 1).
Table 1 : Trends in the detection of new cases of leprosy, by WHO Region, 2008–2011
WHO Region No. of new cases detected 2008 2009 2010 2011
Global 249007 244796 228474 219 075India 134184 133717 126800 127 295
Table 2 : Leprosy situation in India first quarter 2012 (WHO)
RegisteredPrevalence
No. ofnew cases
detected
(2011)
No. ofnew cases
of MB
leprosy
No. offemales
among
new cases
No. ofnew cases
among
children–
No. of newcases with
grade-2
disabilities
No. ofrelapses
(2011)
Cure rate (%)
PB MB
83 187 127 295
63 562
47 111
12 305
3 834
690
95.28 90.56
Diagnosis of Childhood Leprosy – Changing Trends

181
Clinical Manifestations :
The cardinal features of leprosy are a skin patch with sensory loss, nerve
enlargement, and acid-fast bacilli in the skin (5). The clinical features are summarized in Table 3.
Table 3 : Clinical Classification of Leprosy (1)
Features TT BT BB BL LLNumber of lesions
Single usually
Single or few
Several
Many
Very many
Site of lesions
Variable
Variable
Variable
Variable
Small
Surface of lesions
Very dry, sometimes scaly
Dry
Slightly
Shiny
Shiny
Sensations in lesions
Absent
Markedly diminished
Moderately diminished
slightly
diminished Not affected
Hair growth Absent Markedly diminished
Moderately diminished
Moderately diminished
Not affected
AFB in lesions
Nil Nil or scanty Moderate number
Many Very many(plusglobi)
AFB in nasal scrapping /in nose blows
Nil
Nil
Nil
Usually nil
Very many(plus globi)
Lepromin test
Strongly positive(+++)
Weakly positive(+ or ++)
Negative
Negative
Negative
After inoculation of M.Leprae, there will be either no disease with complete resistance or there will be clinical disease developing through indeterminate leprosy. Indeterminate leprosy, is an early form of the disease that features only a small number of skin lesions and no nerve involvement. It is a very early form of leprosy and may either be cured or progress to one of the other forms of leprosy depending on their immune status (6, 7). Within each type of
leprosy, patient may remain in that stage, improve to a less debilitating form or worsen to a more debilitating form depending on their immune state. The polar forms of leprosy, tuberculoid leprosy and lepromatous leprosy, are immunologically stable, whereas the intermediate forms, including borderline tuberculoid leprosy, borderline leprosy, and borderline lepromatous leprosy, are immunologically unstable and lead to either a gradual decline toward the
Rajeshwar Dayal

182
lepromatous pole or upgrading 'reversal reactions' toward the tuberculoid pole (8).
T u b e r c u l o i d l e p r o s y i s characterized by a vigorous cellular immune response and limited humoral immune responses to M. leprae, usually involving the skin and nerves and resulting in few skin lesions. Lepromatous leprosy, on the other hand, is characterized by a minimal cellular immune response and a vigorous humoral immune response and, consequently, extensive skin involvement.
Patients with overt disease form just the tip of iceberg. It is extremely important to identify the at risk population in the community to bring down the disease burden.
Diagnosis of Leprosy :
Clinical diagnosis :
It is diagnosed by the presence of at least two of the following three cardinal signs or the last one independently (5): (i) Loss/impairment of cutaneous
sensation,(ii) Thickened nerves,(iii) Presence of AFB.
Slit skin Smear for AFB procedure:
Demonstration of M.Leprae in slit skin smears by Z-N staining method is considered as confirmatory.
Histopathology:
T h e h i s t o p a t h o l o g i c a l examination of skin biopsy can help in confirming the diagnosis, classification of the disease and assessment of bacterial load. In early stage of the disease the diagnostic value of histopathology is limited. The earliest histological response appears in the form of a lymphocytic infiltrate, a non- specific feature, which heralds the onset of almost all chronic dermatoses. A definitive histological diagnosis of leprosy at this early stage requires:
(a) The presence of infiltration within dermal nerves, and
(b) The presence of Acid Fast Bacilli (AFB).
These defining features are, however, not always seen early in the evolution of the disease, and confirmation of diagnosis is often not possible. To add to this, in the pediatric age group it is difficult to elicit impairment of cutaneous sensation and finding of thickened nerves. Majority of cases in children are paucibacillary and demonstration of AFB is very low, making the diagnosis of leprosy even more difficult (9).
With this background, we conducted many studies in our department to find out tests for early and quick identification of leprosy in children. A brief overview of those studies is as follows:-
Diagnosis of Childhood Leprosy – Changing Trends

183
1. Fluorescent leprosy antibody absorption test (FLA-ABS):
This technique is highly sensitive in detecting the antibodies against M. Leprae antigen by immune fluorescent technique and is useful in identifying healthy contacts of patients who are at risk of developing disease (10) (Table 4).
We conducted a study of healthy children who were close contacts of leprosy patients and followed them for 5 years (from1986-1990) (11) in order to:
1. Detect subclinical infection and observe the development of overt disease by using the Fluorescent Leprosy Antibody Absorption Test (FLA-ABS) and the lepromin test which assesses the humoral and cell-mediated immunity (CM1), respectively;
2. Evaluate the efficacy of dapsone as a chemoprophylactic agent in the 'at risk' contacts.
455 healthy contacts were studied. Majority of the contacts of multibacillary patients (303) were FLA-ABS positive (75 per cent) and lepromin negative (55 per cent) showing that although most of them had been infected, the lepromin status was negative (P < 0.01). On the other hand, the majority of the contacts of paucibacillary patients (152) were lepromin positive (57 per cent) (P<0.05)
indicating a good cell mediated immune response. Furthermore, only 61 per cent of contacts of paucibacillary patients were FLA-ABS positive as compared to 75percent of contacts of multibacillary patients demonstrating that the former had been exposed to a lesser quantum of infection (P<0.05).On the basis of results of FLA-ABS and lepromin tests, these 455 contacts were classified into four groups, viz. Group I comprising children who were FLA-ABS positive and lepromin positive; Group II, who were FLA-ASS positive and lepromin negative; Group III, who were FLA-ABS negative and lepromin positive; and Group IV who were FLA-ABS negative and lepromin negative. During the follow- up period of 5 years, only two out of 155 children in Group I developed the disease showing that their good CMI had been able to contain the disease. Out of 166 contacts in Group II, 18 developed the disease mainly of the tuberculoid type. Most of these children were contacts of multibacillary patients. None of the children in Groups III and IV developed the disease. These findings were statistically significant (P <0.01) (Table 4, 5).
Out of the 166 children in Group II (the 'at risk' group), 70 were treated as controls while 96 were put on prophylaxis with dapsone which was continued for 3 years after the contact with the source patient had ceased, or for 3 years after the
Rajeshwar Dayal

184
source patient became non-infective. The incidence of disease was significantly lower among children who received chemoprophylaxis (P<0.05).
Our study demonstrates the value of the FLA-ABS and lepromin tests in detecting sub-clinical infection and for identifying the 'at risk' contacts of leprosy patients in the community. It clearly
establishes the chemoprophylactic value of dapsone for the 'at risk' contacts, particularly for those in the 'high risk' ca t egory. In pur suance o f ou r Government's policies under the National Leprosy Eradication programme, this study suggests the need to carry out surveillance surveys in the endemic population to identify, follow, and offer chemoprophylaxis to those at risk (12).
Table 4 : Development of Disease in contacts during 5 years follow-up
GROUPS STATUS
NO. OF CONTACTS
INCID -ENCE (%)
RELA -TIVE RISK
FLA -ABS
LEPR -OMIN
TOTAL
DEVELOP DISEASE
I
II(AT RISK)
IIIIV
+
+
-
-
+
-
+
-
155
2
12
1.29
17.14
1:77.51
1:9.2 -
-
166
68
66
70 (CONT.)
96 (DDS.P.) 6 6.25 -
-
-
-
TOTAL 455 20 4.4 1:22.75
STATISTICAL GROUP II Vs I : z=3.705, p<0.01 SIGNIFICANCE GROUP II Vs III: z=4.493, p<0.01
GROUP II Vs IV: z=4.493, p<0.01
AT RISK CONTACTS HIGH RISK GROUP LOW RISK GROUP
< 5 YEARS AGE >5 YEARS AGE
MALES FEMALE
l BACT. +VE PATIENTS BACT –VE PATIENTSl
l
Diagnosis of Childhood Leprosy – Changing Trends

185
Table 5 : Effect of Chemoprophylaxis in 'At Risk' Contacts
GROUPS CONTROL GROUP
D.D.S. GROUP EFFICACY RATE (%)
P VALUE
CONT -ACTS
INCID -ENCE (%)
CONT -
ACTS
INCID -ENCE (%)
HIGH RISK
< 5 YRS.
25
8 (32.00)
60
1
(1.67)
94.78
<0.01
MALES
30
8 (26.67)
45
2 (4.44)
83.35
<0.05
BACT. +VE
32
9 (28.13)
49
2 (4.08)
85.50
<0.05
LOW RISK
> 5 YRS.
45
4 (8.89)
36
5 (13.88)
NIL
>0.05
FEMALES
40
4 (10.00)
51
4 (7.84)
21.60
>0.05
BACT. –VE
38 3 (7.89)
47 4 (8.51)
NI L >0.05
2. Gene Probes :
DNA targeting probes :
Synthetic oligonucleotides are used as probes. A number of such probes are now available for the detection and identification of M. leprae gene sequences.
DNA targeting probes :
They have not been found to be useful for identifying active disease both because of their poor sensitivity in PB cases and also because of persistence of signals for quite some time after bacterial death.
Rajeshwar Dayal

186
RNA targeting probes:
Targeting of RNA has special importance. RNA is a much more unstable molecule than DNA. As RNA degrades faster after death, their demonstration or quantification is likely to correlate better with the presence of live bacteria in the lesions. rRNA has become a popular target choice for probe development, because of evolutionary conserved as well as variable stretches in rRNA gene region, presence of large copy number and better correlation with viability. A number of rRNA targeting probe for detection of M.leprae have been developed. These probes have been observed to be sensitive enough to detect up to 100 - 1000 live cells directly without amplification. Further assays for quantitative measurement of these signals have been developed. These probes have been found to be useful for confirming active disease, monitoring the course of treatment and also diagnosing a relapse (13). This strategy of targeting rRNA has been observed to 10-100 folds more sensitive than DNA detection in biopsy specimens from leprosy cases. These probes appear to have potential role in diagnosis of MB relapse and also some of the PB leprosy relapses. These rRNA probes has been used by in-situ hybridization to demonstrate M. leprae specific RNA for this signifies the presence of active infection.
We conducted this study from
1992-94 (14) on 651 patients & 40
controls .Children less than 16 yrs age
group were selected. History, clinical &
smear exam was done in all cases.
Majority of cases were of borderline
tuberculoid type 291/651. As the age
increased the skin lesions also increased.
Majority of patients had macular
hypopigmented les ions/ impaired
sensation, with nerve thickening. Nerve
thickening was seen in 301 cases, BT =
44.7% cases; BB= 23.5% cases. Lepromin
test, skin biopsy, gene probe studies were
done in 100 patients & all controls.75/100
cases were positive in probe 1 & 61/100
cases were positive in probe 2.We also
studied a correlation of histopathology
with probe test (Table 6 & 7).
Results of gene probes :
A total of 87 cases were positive
by gene probes (P < 0.05).57 cases were
detected by both the probes, 22 additional
cases were detected by P1 only and 8
additional cases were detected by p2 only.
13 cases were left undetected which may
be due to decreased bacterial load or
inadequate sample. From the above
results it is clear that p1 was better than p2.
All smear +ve cases, lepromin +ve cases
and majority of smear –ve cases were
detected by this method. 9 cases (4
indeterminate & 5 nonspecific) with
inconclusive histopathology were also
detected by this method (Table 8).
Diagnosis of Childhood Leprosy – Changing Trends

187
Table 6 : Age & Sex Distribution
Age(Yrs.)
Type of DiseaseTotal
I TT BT BB BL LL
0-5 9 9 - 9 - - 27
6-10 - 9 99 27 9 - 144
11 -16 54 9 192 117 81 27 480
Total 63 27 291 153 90 27 651
2X = 6.308, df = 4, P < 0.05, Male = 522, Female = 129
Table 7 : Correlation : Smear status with Probe Tests
SMEAR STATUS
NO. OF CASES
PROBE 1 PROBE 2
+ - + -
POSITIVE 38 35 3 30 8
NEGATIVE 62 40 22 31 31 TOTAL 100 75 25 61 39
2 2P :X = 9.564, df = 1, p < 0.05, P :X = 8.299, df = 1, p<0.051 2
Table 8 : Correlation : Histopathology with Probe Tests
TYPE OF DISEASE
NO. OF CASES
PROBE 1
PROBE 2
+
+
-
+
+
-
I 4 3 - 1 1 - 3
TT 2 2 - - 2 - -
BT 6 3 3 - 3 - 3 BB 4
2
-
2 2
-
2
BL 6
6
-
- -
2
4
LL 3
3
-
-
3
-
-
NON SPEC
5
5
-
-
5
-
Total 30 24 4 3 16 2 12
2 2P :X =34.667, df=12, p<0.01; P :X =33.497, df=12, p<0.011 2
Rajeshwar Dayal

188
3. Enzyme -linked immunosorbent assay (ELISA) :
We assessed the antibody response against 35 kDa antigen by Serum Antibody Competition Test (SACT). Nearly 50% smear negative cases, 42% Lepromin positive cases & 70% Lepromin negative cases showed positive antibody response. No control had a positive response.
4. In-situ Hybridization :
In-situ hybridization uses a labeled complementary DNA/RNA strand to localize specific DNA/RNA in a portion of section of tissue. In-situ hybridization significantly enhances the diagnosis in early cases (15).
We evaluated a correlation of clinical, histopathological, in-situ hybridization and PCR features on 22 patients in 2007. Skin smears for AFB were positive in 2/22 cases, histopathology confirmed diagnosis in 6/22 cases and non-
specific histopathology was observed in 16/22 cases. In-situ hybridization was positive in 10/ 22 cases (Table 9).
PCR was done in 15 cases and was positive in 10/15 cases. Out of these 15 cases, 1 child had a positive smear; histopathology was positive in only 4 cases (Table 10).
Thus, PCR and IN SITU HYBRIDISATION significantly improved the diagnostic yield in early cases and in those with non specific histopathology.
In-situ hybridization offers excellent structural correlation and permits the concomitant study of tissue pathology. However, this method needs further evaluation on a larger sample size. Therefore, we can conclude that till the potential of in-situ hybridization to diagnose leprosy is fully explored, PCR can be used as a diagnostic method in cases of early leprosy where clinical diagnosis is doubtful and histopathology is nonspecific.
Table 9 : Correlation of Clinical Histopathological, In-situ Hybridization and PCR features of cases
Clinical type
No. tested
Skin Smear for AFB
Histopath. Dx confirmed
Histopath. Dx nonspecific
In -situ hybridization
PCR
+ve
-ve
+ve
-ve
+ve -veI 1 0 1 1 0 1 0 0/1 1/1BT 6 0 6 2 4 2 4 BB 10
0
10
1
9
3
7
6/9 3/9
BL 5
2
3
2
3
4
1
1/1 0/9
Total 22 2 20 6 16 10 12 10/15 5/15
Comparison : Skin smear & in-situ hybridization - p value < 0.05, z value = 3.269Comparison : Skin smear & PCR – p value < 0.05, z value = 2.967
Comparison : PCR & Histopathology - p value < 0.05, z value = 4.236Comparison : PCR & in-situ hybridization - p value > 0.05, z value = 1.960
3/4 1/4
Diagnosis of Childhood Leprosy – Changing Trends

189
Table 10 : Correlation of Clinical, Histopathological and PCR Features
Clinical types No tested Positive skin smear for AFB
Confirmatory histopathological diagnosis
Positive PCR signals
I 1 0 1 0 BT 4 0 1 3 BB 9 0 1 6 BL 1
1
1
1
TOTAL 15 1 4 10
Comparison of skin smear with PCR (1/15 vs 10/15) p value <0.05,z = 3.410.Comparison of histopathology with PCR (4/15 vs 10/15) p value
<0.05, z = 2.196.
5. In-situ PCR : In-situ PCR, also called slide
PCR, is a method to run PCR directly on
small tissue samples, tissue microarrays
(TMA), or other small cell samples, rather
than extracting DNA or RNA first and
then performing PCR, RTPCR, or q PCR
from the extracted material.
In this pioneer work, conducted in
our department in 2004, we evaluated a
correlation of clinical f indings,
histopathological features and in-situ
PCR on 20 patients. Skin smear for AFB
was positive in 2/20 cases (10%),
histopathology for AFB was positive in
9 /20 (45%) cases . Nonspec i f ic
histopathology was observed 11/20
(77.7%) cases. In situ PCR was positive in
12/20 (60%) (Table 11).
Results of in situ PCR with nonspecific
histopathology :
His topa tho logy d iagnosed
9/20(45%) cases. In situ PCR done in
patients with non specific histopathology
was positive in 4/11 (36.3%). Cases
conf i rmed by in-s i tu PCR and
histopathology was 13/20(65%).
Histopathology confirmed the clinical
diagnosis in 45% of total cases. In situ
PCR confirmed the diagnosis in 60% of
total cases, thus enhancing the diagnostic
yield (16) (Table 12).
Keeping in mind that In-situ PCR
offer excellent structural correlation
permitting concomitant study of tissue
pathology & contamination by foreign
DNA/RNA does not exist, it is a valuable
tool for diagnosis of childhood leprosy.
Rajeshwar Dayal

190
Table 11 : Correlation of Clinical, Histopathological and in-situ PCR features of Cases
Clini -cal Type
No.
Skin Smear
for AFB
+ _
Histopath. Dx +ve
AFB+
Histopath Dx
non -sp
In -situ
PCR
+ _
I 3 0 3 1 0 2 2 1 BT 4 0 4 2 1 1 2 2 BB 9 0 9 2 1 6 4 5 BL 4
2
2
2
0
2
4
0 Total 20
2
(10%)18
(90%)9(45%)
2
(10%)11 (77.7%)
12 (60%)8(40%)
Comparison : Skin smear with histopathology : Z = 2.694, p<0.05Comparison : Skin smear with in-situ PCR : Z = 3.91, p<0.05
Table 12 : Results of in-situ PCR in cases with nonspecific histopathology
Clini -cal Type
No.
Histopath. Dx +ve
+ _
In -situ PCR in cases with nonspecific histopathology
+ _
Cases confirmed by histopath. + in-situ PCR
I 3 1 2 1 1 2
BT 4 3 1 0 1 3 BB 9 3 6 1 5 4 BL 4 2 2 2 0 4 Total 20
9/20
11/20
4/11
7/11
13/20
Percen -tage
(100%)
(45%)
(55%)
(36.3%)
(63.6%)
(65%)
Controls All 20 samples were negative
2
X :20.810, P < 0.001, df: 1
Diagnosis of Childhood Leprosy – Changing Trends

191
6. RLEP PCR :
RLEP PCR detects nucleic acid sequence specific to the pathogen & can be used for definitive diagnosis of leprosy. Due to large size, amplicons of most of the PCR based methods like 65kDa, 18kDa, 36kDa undergo damage/fragmentation during the procedure. This does not occur with RLEP PCR. Donoghue et al found RLEP primer to be 1000 fold more sensitive than 36kDa primers. Higher sensitivity of RLEP PCR than slit skin smear for AFB is due to repetition of RLEP sequence 28 times in M. leprae chromosome. RLEP based PCR on skin smears can be a useful tool to confirm early cases of leprosy, where skin smears are negative and skin biopsy is not feasible. Very few studies are available in the world literature on the diagnostic value of RLEP PCR in childhood leprosy.
With th is background we
conducted this study from 2007 to 2008 & 2010- 2012. 73 cases of either sex, < 18
years of age, with hypopigmented / e ry thema tous l e s ions showing partial/total loss of sensation and/or presence of thickened nerves were studied. 30 healthy children were taken as controls. After clinical examination & categorization (TT, BT, BB, BL, LL) two skin smears were taken, one for Z-N staining for AFB & another for RLEP PCR. Af te r DNA ext rac t ion & amplification, electrophoresis was done & presence of 129bp fragments was considered as positive result. Z-N staining for AFB was positive in 17/73 (23.28%) cases and RLEP PCR in 56/73 (76.71%) cases. All controls showed negative results. RLEP PCR technique had a significantly greater positivity (especially early stages) than ZN staining (p< 0.001) (Table 13).
Thus, RLEP PCR on skin smears can be a useful tool to confirm early cases of leprosy, where skin smears are negative and skin biopsy is not feasible.
Table 13 : Correlation: skin smear for AFB vs. RLEP based PCR
Clinical Type
No. of cases
Smear positive RLEP PCR positive
T 3
NIL
1
BT 27 NIL 21
BB 31 10 25 BL 11 6 8 LL 1 1 1 Total 73
17
56
% 100 23.28% 76.71%2X -39.570 ; P < 0.001 D.F. =1
Rajeshwar Dayal

192
Suggested Algorithm :
On the basis of our 20 years experience with leprosy patients, we propose the following algorithm for diagnosis.
Whenever there is clinical suspicion, we can either go for smear for AFB or histology to confirm the diagnosis. A positive smear for AFB is
confirmatory. If it is negative then, we can subject the specimen for gene probes or PCR/In-Situ PCR/RLEP PCR. If the result is positive, it is diagnostic of leprosy. On the other hand, if histology shows characteristic features then it is confirmatory; if it is not characteristic, we can go for in-situ hybridization. A positive in-situ hybridization is diagnostic of leprosy; if it is negative then we can opt for in-situ PCR.
REFERENCES : 1. Text Book of Leprosy by Indian
Association of Leprosy. Leprosy in children . HK Kar Bhushan Kumar, Jaypee Brothers (2009).
2. IAP Text Book of Pediatrics. A. Parthasarathy. Jaypee Brothers/New Delhi.2013:5.29:291-295.
3. Dayal R (1996). Leprosy in Children. Malaysian Journal of Child Health 8: 86-87.
4. Dayal R, Rai SK (2002). Leprosy in children. Asian Oceanian Journal of Pediatrics & Child Health 1: 79-88.
5. Dharmendra and Chaterjee SN (1978). The cardinal signs of leprosy.
Diagnosis of Childhood Leprosy – Changing Trends
SUGGESTED ALGORITHM
CLINICAL SUSPICION
SMEAR
AFB+ AFB-
GENE PROBES
PCR/IN SITU PCR/
RLEP PCR
HISTOLOGY
CHARACTERISTICNON
CHARACTERISTIC
ISH
IN SITU PCR
-ve+ve

193
In: Leprosy vol .1. Dharmendra (Ed). Kothari Medical Publishing House, Mumbai. 246-249.
6. Red Book (2009). Report of the Committee on Infectious Diseases of American Academy of Pediatrics. Leprosy. Larry K. Pickering. American Academy of Pediatrics (2009).
7. Dayal R (1991) . A c l in ico-immunological Profile of leprosy in Children. Ann Natl Acad Med Sci 26: 47-49.
8. Recent Advances in Pediatrics. Leprosy in Childhood. Suraj Gupte. Jaypee Brothers/New Delhi (1991).
9. Dayal R (1991). Early detection of Leprosy in Children: J Trop Pediatr 37: 310-313.
10. Dayal R, Bharadwaj VP (1995). Prevention and early detection of Leprosy in Children. J Trop Paediatr 41:132-138.
11. Dayal R, Hashmi NA, Mathur PP, et al. (1990). Leprosy in children. Indian J Pediatr 27:170-180.
12. Dayal R (1997). Leprosy in children, Prevention is better than cure. Journal of Pediatrics & Child Health 33:64-65.
13. Kamal R, Dayal R, Katoch VM, Katoch K (2006). Analysis of gene probes and gene amplification techniques for diagnosis and monitoring of treatment in childhood leprosy. Leprosy Review 77(2):141-146.
14. Dayal R, Agarwal PK, Kalra K, Bharadwaj VP, Katoch VM, Katoch K (1994). Diagnostic value of gene probes and its correlation with clinical profile of leprosy in children. Indian Pediatrics 31: 1521-1529.
15. Dayal R, Agarwal M, Natrajan M, et al . (2007). PCR and In-situ Hybridization for Diagnosis of Leprosy. Indian J Pediatr 74: 49-52.
16. Dayal R, Singh SP, Mathur PP, Katoch VM, Katoch K, Natrajan M (2005). Diagnostic value of In -Situ PCR in Leprosy. Indian J Pediatr 72: 1043-1046.
Rajeshwar Dayal

The Annals of the National Academy of Medical Sciences (India), appearing quarterly welcomes the submission of original contributions in all topics of biomedical sciences. Submission of a manuscript for publication in this journal implies that it has not been published and is not under consideration for publication elsewhere.
Review articles will be featured only by invitation. In the case of a multi-author submission, the contribution of each author must be clearly stated. The authors must declare conflict of interest, if any.
Three copies of the manuscript and a CD containing the manuscript complete with tables and figures should be submitted to: The Editor. Annals of the National Academy of Medical Sciences (India), NAMS House, Ansari Nagar, Mahatma Gandhi Marg, New Delhi-110 029.
Preparation of Manuscript
Type the manuscript on one side of bond paper of standard size with 2.5 cm margin all around in double spacing throughout, including the title page, text, acknowledgement, references, tables and legends to illustrations.
Title
The title page should carry (1)the title of the article; (2) a short running title of not more than 40 characters;(3) name of each author: first name, middle initial and
surname: (4) name of the department(s) and institution(s) to which the work is attributed; (5) name and address of the author responsible for correspondence.
Text
The second page should carry an abstract of not more than 150 words and should state the purpose of study, basic procedures main findings and the principal conclusions. Below the summary three to ten key words or short phrases that will assist indexers should be provided. The third page should begin with the main text which should usually, but not necessarily, be divided into sections with headings: Introduction, Methods, Results and Discussion. In Discussion, emphasis should be given to the new and important aspects of the study and conclusions. The data given in the Results should not be repeated. The Di scus s ion shou ld i nc lude the implications of the findings and their limitation and observations should be related to other relevant studies. Conclusions should be linked with the goals of the study but unqualified s ta tements and conclusions not completely supported by the data should be avoided. At the end of the text under Acknowledgement(s), persons who have made substantial contributions to the study may be acknowledged.
A running title of 10-12 words should be given.
Ann Natl Acad Med Sci (India)
Instructions to Authors

References
References to literature cited should be numbered by arabic numerals in parenthesis in the text. At the end of the text on a new page the list of references by numbers as cited in the text should be provided. The style of the examples as given below should be used. The title of the journals should be abbreviated according to the style used in Index Medicus and printed in its January issue each year. Some examples are given below:
Journals
Standard journal article
List all authors when six or less; when seven or more, list only first three and add et al. You CH, Lee KY, Chey WY a n d M e n g u y R ( 1 9 8 0 ) . Electrogastrographic study of patients with unexplained nausea, bloating and vomiting. Gastroenterology 78: 311-314.
Corporate author
The Royal Marsden Hospital Bone- Marrow Transplantation Team (1977). Failure of syngeneic bone-marrow graft without preconditioning in post hepatitis marrow aplasia. Lancet 2: 242-244.
No author given
Anonymous (1981). Coffee drinking and cancer of the pancreas (Editorial). Br Med J 283: 628
Books and Monographs
Personal author(s)
Eisen HN (1974). Immunology: An Introduction to Molecular and Cellular
thPrinciples of the Immune Response. 5 cd. New York: Harper and Row, 406-416.
Editor, compiler, chairman as author Dausset J and Colombani J eds.
(1973).Histocompatibility Testing 1972Copenhagen: Munksgaard, 12-18.
Chapter in a book Weinstein L and Swartz MN (1974).
Pathogenic properties of invading microorganisms, in: Pathologic Physiology: Mechanisms of Disease. Sodeman WA Jr and Sodeman WA (eds), Philadelphia: WB Saunders. 457-472.
Legends for Illustrations
Type legends of illustrations and figures double spaced, starting on a separate page, with arabic numerals corresponding to the illustrations. When symbols, arrows, numbers, or letters are used to identify parts of the illustration, identify and explain each one clearly in the legend. Explain internal scale and identify method of staining in photomicrographs.
Off Prints: A maximum of twenty-five offprints of the article will be provided free of charge on request if there is only one author. If the article has two or more authors, maximum of fifty off prints will be provided on request free of charge. Request for further copies should be sent to the Editor, Annals of the NAMS (India).

Printed and Published by Dr. Sanjay Wadhwa, Honorary Secretary, National Academy of Medical Sciences (India), New Delhi. Tel. 011-26589289 & Printed at Kalakalp, 104, First Floor, AdeshwarTower, Chopasni Road, Jodhpur - 342 003 Tel. : 0291-2640400, Mobile : 09414128128
(Regd. No. R.N. 10690/65)