Anna Maria Pinna - UB...Anna Maria Pinna University of Cagliari, CRENoS [email protected] Abstract...
46
WP2/02 SEARCH WORKING PAPER Is the EU the best trade partner for its Anna Maria Pinna January 2013 neighbors?
Transcript of Anna Maria Pinna - UB...Anna Maria Pinna University of Cagliari, CRENoS [email protected] Abstract...

WP2/02 SEARCH WORKING PAPER
Is the EU the best trade partner for its
Anna Maria Pinna
January 2013
neighbors?
-1-
DELIVERABLE 2.1
Working paper 2/02���
Is the EU the best trade partner for its neighbors?
Anna Maria Pinna
University of Cagliari, CRENoS
Abstract
The main goal of this paper is to examine in depth the bilateral trade relationships between the EU and its
neighbouring countries over the last fifteen years in order to identify whether trade patterns have changed
over time, mainly since the introduction of the European Neighborhood Policy (ENP) in 2004. The European
Neighbouring Countries are developing countries (middle-low income countries) which, thanks to their
proximity to European borders, have close relations with the EU and aspire to become member states.
To achieve the main objective we have explored trade flows between the EU and the ENCs by acting in
different ways. We split ENCs into four different sub-regions in order to understand regional performance.
We have taken into account ENCs trade flows from and to emerging economies and the major world
partners so as to determine whether Europe is losing its key role and whether its main competitors are
gaining market share in the Europe’s neighbouring countries. We have considered trade flows for different
types of products so as to gain an insight into the quality of the trade relationship. Lastly we have examined
geographical and sectorial concentration in trade flows in order to analyse to what extent ENCs’ trade
structure is vulnerable to shocks.
Keywords: European Neighbouring Policy; Trade flows; Export concentration
JEL Classification: F13-F14
� The research was supported by the Project Sharing KnowledgE Assets: InteRregionally Cohesive NeigHborhoods (SEARCH) within
the 7th European Community Framework Programme FP7-SSH-2010.2.2-1 (266834) European Commission.
� The author wishes to thank participants at the 2nd SEARCH meeting in Cagliari for helpful suggestions on a first draft of this paper,
and Vania Licio for excellent research assistance.

-2-
1. INTRODUCTION
Theoretically, the easiest market access for goods exchanged in the international markets should be in
geographically close countries. Other things constant, we know that the reducing force imposed by trade
costs is weaker over smaller distances. Also when one country is much richer than the other, proximity
trade is potentially mutually beneficial, because the rich country will usually offer a wider variety of goods
with superior quality while the poorer one will offer lower prices (and attractive productive locations).
Accordingly, import and export flows will start from both sides. Regional trade agreements, which normally
involve adjacent countries, are strongly based on this argument; overcoming national borders is meant to
create larger economic spaces for exploiting economies of scale, thereby reducing costs.
This paper aims to describe the position in the international markets for those countries neighbouring the
enlarged EU. According to various suggestions from the theory of international trade, we should expect the
EU member countries to be the most important trade partners of the European Neighbouring Countries
(ENCs). Proximity, short distance and historical ties would point for this result. Also, a pragmatic political
agenda calls for the European Union to build an environment of security, stability and prosperity with
neighbors to the south and to the east. As a proof of facts EU documents and policy reports on EU trade
policy (2011, 2012) record as a hard fact that most of our neighbors rely on the EU both as their primary
export market and as their primary source of imports. How far is this true? Are recent developments in the
international arena introducing further developments to this ‘broad’ picture? The first aim of this paper is
to provide recent qualified evidence on the international trade links between EU member states and
countries at the borders of Europe. In answering this question we examine whether differences in the
origin and destination trade structure of neighboring countries can be attributed to their geographical
position in the wider EU area map.
The novelty of our analysis relies on the distinction between different types of products. Manufacturing
products can be demanded by final consumers (consumption goods) or by firms (it is the case of capital and
primary products, which are also called intermediate goods because they are used as input in the
production process of another good). Consumption, capital and primary products are final (finished)
products apt for final demand. There are also semi-finished goods (the industrial classification by end of use
calls also them intermediate) i.e. goods that require further processing or parts and components to be
assembled in order to compose a final good. In the last fifteen years the relative weight of intermediate
goods in total exports of low-middle income countries (all neighboring countries but Israel belong to this
income group) has been increasing. In 2010 semi-finished goods are 40% of total exports of all countries in
the group, while capital products represent now 20% of total exports (they were only 8% in 1995). In fact
the increasing role of exchanges of unfinished, capital and, recently, also primary products, is one chief
characteristic of the globalization wave of the last 30 years (Miroudot, S., R. Lanz and A. Ragoussis (2009).
-3-
This report provides an analysis of trade flows across the EU27 and its neighbouring countries,
distinguishing between the Old (EU15) and New (EU12) European economies and three sub-regions in the
neighbouring area (Eastern, Southern and Middle-East where Israel, the only rich country in the whole
group, will be treated as an outlier). The descriptive work will answer different questions addressed in
separate sections of the report.
In section 2 we will describe EU trade policy in the neighborhood area. In this report we take the protection
structure of EU external good market as given, we know flows are influenced by trade barriers but we do
not measure them. In this section we describe agreements on the movement of goods between Europe and
its neighbors.
Section 3 will look at total imports and exports trying to address several questions on the relative
importance of EU with respect to alternative trade partners: how important are neighboring countries in
EU trade? Has trade between the EU and its neighboring countries increased in time? How does it compare
with the world’s emerging economies (BRICs)?
Section 4 will look at origin and destination of trade flows. What is the world geographic structure of flows
entering and exiting the EU neighboring economies? Is this pattern common across the neighboring sub-
regions?
Section 5 will investigate the differences according to the type of good. How important are consumption
goods with respect to other products? Does the importance of capital, primary and intermediate goods
shares differ in the numerous sub-regions?
In section 6 we will move the analysis to the country level. This part of the work is aimed at providing some
evidence as to the degree of diversification of EU neighbors’ trade. After Imbs and Wacziarg (2003) work
uncovering a non-monotonic relationship between production diversification and level of wealth, several
works have looked at the issue in trade flows. As recently shown by Easterly, Reshef and Schwenkenberg
(2009) exports are typically much more concentrated than production. The dependence of a country trade
on what they call the ‘big hit’ (a product in one particular destination) increases the vulnerability of its
entire trade structure.
In this part of the report we will address several questions: What’s the best trade partner in world trade
and within the EU27 for the 15 neighboring countries focused of our project? How has this evolved in time?
Is there any evidence of any geographic ‘concentration’?
Section 6 will integrate both country and sector analysis. What are the driving sectors in trade flows at the
country level? How does it compare the ENCs’ performance in terms of concentration in the world market
with the EU27 and the market created by the 5 emerging economies? How does the picture change when
we look at the best trade partner, whether in the world or in the EU27 group?
The last section of this report will provide some concluding remarks.

-4-
2. THE EU TRADE POLICY IN ITS NEIGHBOURING REGION
As stated in the literature review by Wesselink E. and Boschma R. (2011, 2012), trade between the EU and
its neighboring countries is regulated by the presence of relevant barriers. In fact the ENP promises access
to the free internal market to the partner countries in exchange for political and economic reforms. None
of the existing reports or projects on trade and FDI in the ENP space do actually measure the state of
integration at the moment1
We keep in the background that trade agreements regulate trade between the EU and its border countries,
and introduce elements of differentiation in the level of integration with the several countries interested by
the ENP.
. This report describes the evolution in the last 15 years of trade integration
between the 27 EU countries and those economies adjacent or very near to its borders. We do not measure
trade barriers, we take the protection structure of EU external good market as given but we are aware that
recorded flows are influenced by the presence of barriers.
To better analyze EU trade policy in the neighboring regions we must consider two main categories: MED
(Algeria, Egypt, Morocco, Tunisia, Jordan, Lebanon, Libya, Syria, Israel) and South Caucasus (Armenia,
Azerbaijan, Georgia). Belarus, Moldova and Ukraine are not included in a trade partnership, but have with
the EU a bilateral relationship.
2.1 Euro-Mediterranean relationship
Current trade relationship between the EU and the MED countries is run by the provisions of the
Association Agreements (also known as Euro-Mediterranean Agreements) which include the dismantling of
tariffs on industrial products under the Free Trade Agreements (FTAs).
The Association Agreements promote overall trade and establish the conditions for the gradual
liberalization of trade in goods, services and capital. They set up a Free Trade Area between MED countries
and the EU with the elimination of tariffs on industrial products, with significant concessions on agricultural
products and removing barriers to trade and investment between both the EU and Southern
Mediterranean countries and between the Southern Mediterranean countries themselves.
Euro-Mediterranean Association Agreements are in force with most of the partners, not all Mediterranean
countries have subscribed it. Tunisia in 1995 has been the first one, followed by Morocco (2000), Jordan
(2002), Egypt (2004), Algeria (2005), Lebanon (2006). Libya and Syria have not yet signed a Free Trade
Agreement with the EU. Following the events in early 2011 in Libya, negotiations for a Framework
Agreement between the European Union and Libya were suspended. The ongoing internal repression in
1 Other projects do attempt to measure the actual level of integration in order to find out whether reform policies actually reach
their goal. Through a FEMISE project Neaime (13, 2005) for instance analyzes to what extent neighbouring Mediterranean and
Middle Eastern countries – many of which are part of the southern ENP policy – are integrated. He uses a model in which co-
integration is examined by checking to what extent macro-economic variables between countries exhibit co-fluctuations

-5-
Syria, instead, has led to restrictive measures by the EU and has a significant impact on bilateral trade.
Today EU-Syria relationship is still managed by the Cooperation Agreement, a bilateral agreement signed by
the EU and Syria in 1977. The object of this agreement is to promote overall cooperation with a view to
contributing to the economic and social development of Syria and helping to strengthen relations between
the Parties adopting and implementing provisions measures in the fields of economic, technical and
financial cooperation and of trade.
The Euro-Mediterranean Agreements cover trade in goods and are complemented with a number of
additional ongoing negotiations and preparations for future negotiations: to open up additional agricultural
trade, to liberalize trade in services and investment, to negotiate agreements on accreditation and
acceptance of industrial products, to establish deep and comprehensive free trade areas.
The EU supports the strengthening of trade relations amongst Southern Mediterranean countries. The
Agadir Agreement between Tunisia, Morocco, Jordan, and Egypt, in force since 2007, remains open to
other Arab Mediterranean countries. Israel and Jordan have signed a Free Trade Agreement. Egypt, Israel,
Jordan, Lebanon, Morocco, the Palestinian Territories, Syria and Tunisia have signed bilateral agreements
with Turkey. Negotiations are underway between other Mediterranean countries to establish similar
agreements. The EU works closely with each of its Southern Mediterranean partners to support economic
and social transition and reform, taking into account each country’s specific needs and characteristics.
These programs are funded under the European Neighbourhood Policy.
2.2 The EU-South Caucasus relationship
The existing relationship between the EU and the South Caucasus countries is run by the Partnership and
Cooperation Agreements, entered into force with each of them in 1999. It promotes trade, investment and
harmonious economic relations between them.
It includes measures of: a) non-preferential trade (it prohibits each party to impose discriminatory tariffs on
each other or to restrict the quantity of goods traded between them), b) limited preference for trade in
services and c) gradual alignment of the partner country's legislation and procedures to the EU's and
international main trade related laws and standards (in order to further deepen the partner's trade and
economic integration with the EU, including a better practical access for its products to EU markets).
The Partnership and cooperation Agreement regulates bilateral relation between the EU and Ukraine too; it
has been signed by Ukraine in 1998.
Armenia is negotiating an Association Agreement with the EU; it will replace the current Partnership and
Cooperation Agreement deepening Armenia’s political association and economic integration with the EU
and establishing a Deep and Comprehensive Free Trade Area (DCFTA).
The future Agreement is expected to improve economic governance as well as Armenia's ability to attract
investment.

-6-
Each South Caucasus country has an action plan under the European Neighbourhood Policy (ENP).
Through the European Neighbourhood Policy and its Easter Partnership dimension, the EU supports closer
trade and economic integration with the EU. Among other things it has been designed to facilitate trade
and economic integration with the EU by gradual regulatory alignment. The implementation of the action
plans should also enable the countries to progressively become ready to negotiate, implement and sustain
an ambitious deep and comprehensive free trade area with the EU. However, so far the three countries
have made only limited progress in fulfilling their respective action plans, particularly in implementing the
laws they have adopted.
The new EU Eastern Partnership (EaP) started in 2009 builds upon the ENP and aims at enhancing the EU
relations with the Eastern ENP countries. The EaP has brought in particular a perspective of new enhanced
bilateral framework agreements (Association Agreements) between the EU and its Eastern Neighbours, and
definitely set in possible future bilateral deep and comprehensive free trade areas in this framework.
Through the ENPI (European Neighbourhood and Partnership Instruments), the EU provides substantial
financial and technical assistance to support the regulatory alignment of the partners' trade and investment
related laws and procedures.
Georgia and Armenia have been WTO members since 2000 and 2003 respectively. Azerbaijan applied for
membership to the World Trade Organisation in 1997 and the process is ongoing.
With a view to supporting Azerbaijan's future WTO membership and subsequent eventual bilateral Deep
and Comprehensive FTA, negotiations on upgrading the existing trade related provisions of the Partnership
and Cooperation Agreement (non-preferential trade and investment agreement) were launched in 2010.
Azerbaijan is receiving technical assistance from the EU to help it to prepare for WTO membership.
All three South Caucasus countries benefit from the EU's Generalised Scheme of Preferences (GSP). Under
the current GSP Regulation, applying from 2009, all qualify for the special incentive arrangement for
sustainable development and good governance (GSP+), offering advantageous access to the EU market.
The South Caucasus region plays an important role both in supplying energy to the EU and as a transit route
for it. Azerbaijan is a major supplier of oil and gas to the EU. Its special strategic importance is recognized in
the EU-Azerbaijan memorandum of understanding on energy signed in 2006.
All three South Caucasus countries participate in the Baku Energy Initiative.
2.3 Other bilateral relationships
As said above, Belarus, Moldova and Ukraine have an individual relationship with the EU.
Since Belarus' lack of commitment to democracy and political and civil rights, the EU has not yet ratified the
bilateral Partnership and Cooperation Agreement concluded with Belarus in 1995 and the bilateral trade
and economic relations therefore remain covered by the Trade and Cooperation Agreement concluded by
the European Community with the Soviet Union in 1989 and subsequently endorsed by Belarus.

-7-
Furthermore, in 2007 the EU withdrew its trade preferences to Belarus under the Generalised Scheme of
Preferences, in response to Belarus' violations of the core principles of the International Labour
Organisation.
The EU is negotiating a new Association Agreement with Moldova since January 2010. The negotiations on
the trade part of this agreement (Deep and Comprehensive Free Trade Area - DCFTA) started in February
2012.
The EU has negotiated with Ukraine a Deep and Comprehensive Free Trade Agreement (DCFTA), it will be
part of a future Association Agreement, which will replace the present Partnership and Cooperation
Agreement between the EU and Ukraine (which dates from 1998).
The Deep and Comprehensive Free Trade Area is underpinned by regulatory approximation leading to
convergence with EU laws and standards. Its main objective would be the progressive integration of the
economies into the EU single market by dropping the customs duties, improving the customs procedures,
increasing the protection of intellectual property, applying the EU sanitary and phytosanitary rules,
updating rules on public procurement and competition, removing the technical obstacles to trade.
The DCFTA negotiations are in progress with Armenia, Georgia, Jordan, and Morocco too.

-8-

-9-
Tabl
e 1:
Bila
tera
l tra
de r
elat
ions
bet
wee
n U
E an
d EN
Cs
Su
b-re
gion
in E
NCs
gr
oup
Regi
on in
trad
e ar
ea
Bila
tera
l tra
de re
gula
tion
wit
h EU
O
ther
trad
etie
s W
TO m
embe
rshi
p
Alg
eria
So
uthe
rn
Med
iterr
anea
n A
ssoc
iatio
n A
gree
men
t (20
05)
enjo
ys tr
ade
pref
eren
ces
with
the
EU u
nder
the
impo
rt re
gim
e G
SP
acce
ssio
n in
pro
gres
s
Arm
enia
Ea
ster
n So
uth
Cauc
asus
Pa
rtne
rshi
p an
d co
oper
atio
n A
gree
men
t (19
99)
Ass
ocia
tion
Agr
eem
ent (
nego
tiatio
n in
pro
gres
s)
D
CFTA
(neg
otia
tion
in p
rogr
ess)
incl
uded
in th
e Eu
rope
an N
eigh
bour
hood
Pol
icy
Bak
u En
ergy
Initi
ativ
e
be
nefit
s fr
om E
U's
Gen
eral
ised
Sch
eme
of P
refe
renc
es (G
SP)
sinc
e 20
03
Aze
rbai
jan
East
ern
Sout
h Ca
ucas
us
Part
ners
hip
and
coop
erat
ion
Agr
eem
ent (
1999
)
no
n-pr
efer
entia
l tra
de a
nd in
vest
men
t agr
eem
ent (
nego
tiatio
n in
pr
ogre
ss)
mem
oran
dum
of u
nder
stan
ding
on
ener
gy (
2006
)
Baku
Ene
rgy
Initi
ativ
e
be
nefit
s fr
om E
U's
Gen
eral
ised
Sch
eme
of P
refe
renc
es (G
SP)
acce
ssio
n in
pro
gres
s
Bela
rus
East
ern
Tr
ade
and
Coop
erat
ion
Agr
eem
ent (
1989
with
Sov
iet U
nion
) be
caus
e B
elar
us' v
iola
tions
of t
he c
ore
prin
cipl
es o
f the
Inte
rnat
iona
l La
bour
Org
anis
atio
n, in
200
7 th
e EU
with
drew
its
trad
e pr
efer
ence
s to
Be
laru
s un
der t
he G
SP
acce
ssio
n in
pro
gres
s
Egyp
t So
uthe
rn
Med
iterr
anea
n A
ssoc
iatio
n A
gree
men
t (20
04)
A
gree
men
t on
agric
ultu
ral,
proc
esse
d ag
ricul
tura
l and
fish
erie
s pr
oduc
ts
(201
0)
in 2
010
EU a
nd E
gypt
sig
ned
a pr
otoc
ol e
stab
lishi
ng a
dis
pute
set
tlem
ent
mec
hani
sm a
pplic
able
to d
ispu
tes
unde
r the
trad
e pr
ovis
ions
of t
he
Ass
ocia
tion
Agr
eem
ent
sinc
e 19
95
Geo
rgia
Ea
ster
n So
uth
Cauc
asus
Pa
rtne
rshi
p an
d co
oper
atio
n A
gree
men
t (19
99)
DCF
TA (n
egot
iatio
n in
pro
gres
s)
Ba
ku E
nerg
y In
itiat
ive
bene
fits
from
EU
's G
ener
alis
ed S
chem
e of
Pre
fere
nces
(GSP
) si
nce
2000
Isra
el
Mid
dle-
East
M
edite
rran
ean
Ass
ocia
tion
Agr
eem
ent (
2000
)
Agr
eem
ent o
n ag
ricul
tura
l, pr
oces
sed
agric
ultu
ral a
nd fi
sher
ies
prod
ucts
(2
010)
A
CAA
(201
0)
sinc
e 19
95
Jord
an
Mid
dle-
East
M
edite
rran
ean
Ass
ocia
tion
Agr
eem
ent (
2002
)
Libe
ralis
atio
n of
agr
icul
tura
l pro
duct
s (2
005)
DCF
TA (n
egot
iatio
n in
pro
gres
s)
incl
uded
in th
e Eu
rope
an N
eigh
bour
hood
Pol
icy
ACA
A (n
egot
iatio
n in
pro
gres
s)
si
nce
2000
Leba
non
Mid
dle-
East
M
edite
rran
ean
Ass
ocia
tion
Agr
eem
ent (
2006
) no
t yet
sig
ned
the
Regi
onal
Con
vent
ion
on p
an-E
uro-
Med
iterr
anea
n pr
efer
entia
l rul
es o
f ori
gin
acce
ssio
n in
pro
gres
s
Liby
a So
uthe
rn
Med
iterr
anea
n no
Fre
e Tr
ade
Agr
eem
ent w
ith th
e EU
fo
llow
ing
the
even
ts in
ear
ly 2
011,
neg
otia
tions
for a
Fra
mew
ork
Agr
eem
ent w
ere
susp
ende
d in
Feb
ruar
y 20
11.
acce
ssio
n in
pro
gres
s
Mol
dova
Ea
ster
n
Ass
ocia
tion
Agr
eem
ent (
nego
tiatio
n in
pro
gres
s)
D
CFTA
(neg
otia
tion
in p
rogr
ess)
in
clud
ed in
the
Euro
pean
Nei
ghbo
urho
od P
olic
y
no
n-pr
efer
entia
l Par
tner
ship
and
Co-
oper
atio
n A
gree
men
t with
EU
si
nce
2001
Mor
occo
So
uthe
rn
Med
iterr
anea
n
Ass
ocia
tion
Agr
eem
ent (
2000
)
DCF
TA (n
egot
iatio
n in
pro
gres
s)
Agr
eem
ent o
n ag
ricul
tura
l, pr
oces
sed
agric
ultu
ral a
nd fi
sher
ies
prod
ucts
(2
012)
A p
roto
col o
n D
ispu
te S
ettle
men
t Mec
hani
sm w
as s
igne
d an
d is
aw
aitin
g ra
tific
atio
n. N
egot
iatio
ns w
ith M
oroc
co o
n a
Prot
ocol
on
Serv
ices
and
In
vest
men
ts a
re o
n-go
ing
sinc
e 19
95
Syri
a M
iddl
e-Ea
st
Med
iterr
anea
n no
Fre
e Tr
ade
Agr
eem
ent w
ith th
e EU
Coop
erat
ion
Agr
eem
ent (
sinc
e 19
77)
beca
use
the
viol
ent i
nter
nal r
epre
ssio
n, in
201
1 th
e EU
ado
pted
a
num
ber o
f res
tric
tive
mea
sure
s to
war
ds S
yria
ac
cess
ion
in p
rogr
ess
Tuni
sia
Sout
hern
M
edite
rran
ean
Ass
ocia
tion
Agr
eem
ent (
1995
) in
200
9 th
e EU
sig
ned
a bi
late
ral p
roto
col w
ith T
unis
ia o
n th
e es
tabl
ishm
ent o
f a d
ispu
te s
ettle
men
t mec
hani
sm
sinc
e 19
95
Ukr
aine
Ea
ster
n
Par
tner
ship
and
Coo
pera
tion
Agr
eem
ent (
1998
)
D
CFTA
(neg
otia
tion
in p
rogr
ess)
th
e fu
ture
Fre
e Tr
ade
Agr
eem
ent E
U-U
krai
ne w
ill c
over
all
trad
e-re
late
d ar
eas
and
also
tack
ling
the
"bey
ond
the
bord
er"
obst
acle
s si
nce
2008
Sour
ce: h
ttp:
//ec
.eur
opa.
eu/t
rade
/cre
atin
g-op
port
uniti
es/b
ilate
ral-r
elat
ions
/

-10-
3. ENCs TRADE WITH EU27
To analyze trade flows between the ENCs and the EU and between the ENCs and the rest of world countries
we used BACI2
The most exhaustive version of BACI provides values and quantities at the 6-digit level of the first HS
classi�������� �������� �������������������������� on the analysis of trade values.
Database. BACI is a detailed international trade database at the product level, which
includes more than 200 countries and 5,000 products. In order to reconcile data reported by over 150
countries to the United Nations Statistics Division, which spreads them via their COMTRADE database, new
approaches have been developed.
We used BACI Dataset in a fifteen years period, from 1995 to 2010. Data from 1980 to 1994 are available
too, but we focused our study from the second half of Nineties because most of Eastern neighboring
Countries were included in the ex-Soviet Union, thus for this countries earlier data are missing. It's
important to point out that our analysis don't include Palestine because it is absent in BACI Database,
therefore we consider 15 European Neighboring Countries out of 16.
We begin our analysis starting from EU-ENCs trade relationship.
3.1 How important are ENCs in EU27 trade?
European Neighbouring Countries (hereafter ENCs) don't play a key role in European trade. Table 2 shows
the most important EU27 export partner and ENCs’ position in 2006 and 2010. In the top ten we find both
European and non-European countries. First place is occupied by the USA and we can notice the high gap
between the first and the second position of China.
China, Switzerland and Russia exchange second, third and fourth position. Turkey, Japan, Norway, India and
U.A. Emirates are in the second half of the top ten. Brazil has strongly improved his position: from 18th in
2006 to 9th in 2011. ENCs are not in the top ten, but some of them occupy anyway an important position.
Ukraine is the most important EU27 partner; Armenia, instead, is the less important. Algeria, Israel,
Morocco and Egypt are in the top 25 of all EU27 partners.
To say it shortly ENCs are not some of the most important European partners. When looking at best trade
partners the gravity explains that the economic size matters, and ENCs are smaller when compared with
the integrated EU economic space. Distance matters as well, and that’s the reason why we would expect a
better role for countries which are sharing borders and seashores with Europe. Anyway some ENCs, even if
they are not in the top 10, play still an important role in European trade because they are in the top 20 or in
top 30.
2 BACI is the World trade database developed by the CEPII at a high level of product disaggregation. BACI is developed using an
original procedure that reconciles the declarations of the exporter and the importer. Original data are provided by the United
Nations Statistical Division (COMTRADE database). The harmonization procedure enables to extend considerably the number of
countries for which trade data are available, as compared to the original dataset (http://www.cepii.fr/anglaisgraph/bdd/baci.htm).

-11-
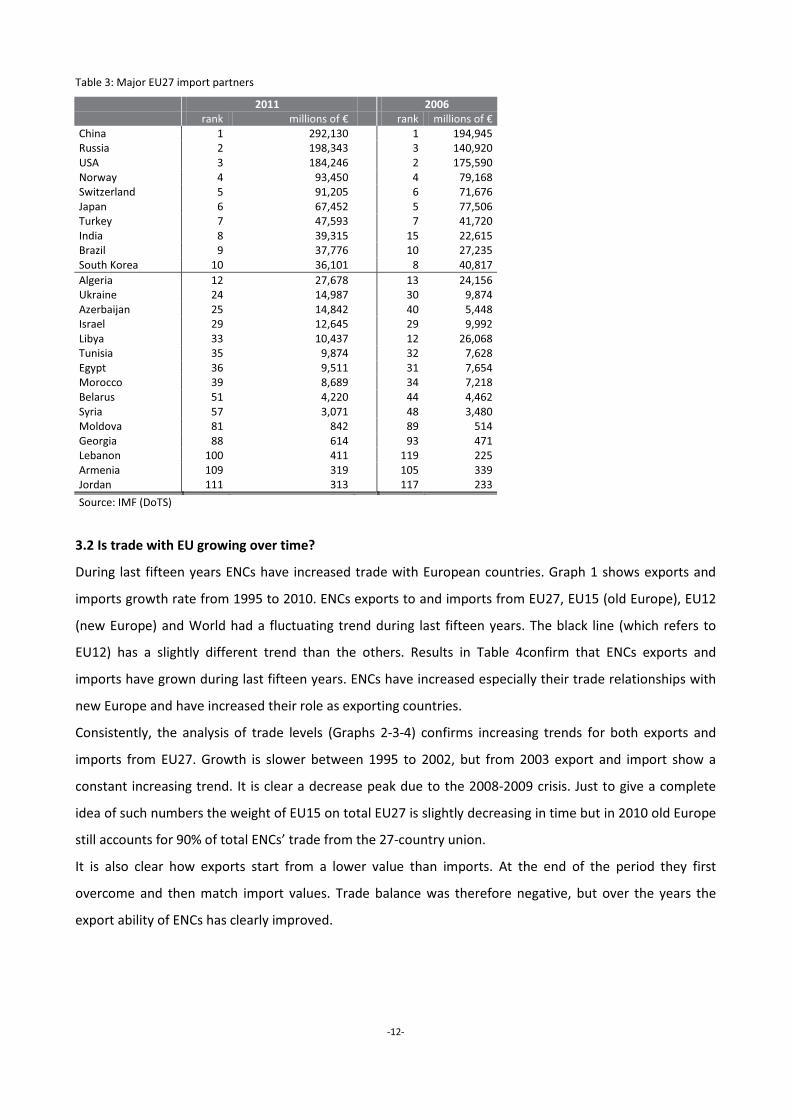
When looking at imports (Table 3) the major EU27 import partners are the same countries that we have
found in Table 2, but in this case China occupies the first position. The gap between the first and the second
place is high, but not so high like the gap existing between the first and the second export partner. In the
top ten we don't find U.A. Emirates, but we have South Korea.
Although ENCs are not in the top ten, they take up a relevant place: Algeria is the 12th import partner for
EU27. We can notice that Libya lost many positions: down from 12th to 33th. In the top thirty we find
Ukraine, Azerbaijan and Israel. Jordan, Armenia and Lebanon are not relevant EU27 import partners.
In the last part of the paper we investigate on the best destination and origin for ENCs flows in world trade.
Only in some cases the best partner of European neighbors is a member of the 27-country’s union.
Table 2: Major EU27 export partners
2011 2006 rank millions of € rank millions of € USA 1 260,553 1 269,147 China 2 136,222 4 63,795 Switzerland 3 121,671 2 87,792 Russia 4 108,434 3 72,340 Turkey 5 72,671 5 50,039 Japan 6 48,968 6 44,772 Norway 7 46,529 7 38,498 India 8 40,425 10 24,394 Brazil 9 35,729 18 17,739 U.A.Emirates 10 32,615 9 25,269 Ukraine 19 21,196 17 18,268 Algeria 21 17,205 26 9,968 Israel 22 16,836 20 13,972 Morocco 24 15,168 24 10,473 Egypt 25 13,944 28 9,081 Tunisia 31 10,931 30 8,719 Belarus 33 8,486 35 5,793 Lebanon 38 7,218 40 4,393 Jordan 43 5,267 47 3,198 Syria 55 3,258 55 2,677 Azerbaijan 60 2,862 58 1,955 Libya 65 2,066 44 3,676 Moldova 67 1,858 75 1,183 Georgia 72 1,588 83 926 Armenia 107 641 106 478
Source: IMF (DoTS)
-12-
Table 3: Major EU27 import partners
2011 2006 rank millions of € rank millions of € China 1 292,130 1 194,945 Russia 2 198,343 3 140,920 USA 3 184,246 2 175,590 Norway 4 93,450 4 79,168 Switzerland 5 91,205 6 71,676 Japan 6 67,452 5 77,506 Turkey 7 47,593 7 41,720 India 8 39,315 15 22,615 Brazil 9 37,776 10 27,235 South Korea 10 36,101 8 40,817 Algeria 12 27,678 13 24,156 Ukraine 24 14,987 30 9,874 Azerbaijan 25 14,842 40 5,448 Israel 29 12,645 29 9,992 Libya 33 10,437 12 26,068 Tunisia 35 9,874 32 7,628 Egypt 36 9,511 31 7,654 Morocco 39 8,689 34 7,218 Belarus 51 4,220 44 4,462 Syria 57 3,071 48 3,480 Moldova 81 842 89 514 Georgia 88 614 93 471 Lebanon 100 411 119 225 Armenia 109 319 105 339 Jordan 111 313 117 233
Source: IMF (DoTS)
3.2 Is trade with EU growing over time?
During last fifteen years ENCs have increased trade with European countries. Graph 1 shows exports and
imports growth rate from 1995 to 2010. ENCs exports to and imports from EU27, EU15 (old Europe), EU12
(new Europe) and World had a fluctuating trend during last fifteen years. The black line (which refers to
EU12) has a slightly different trend than the others. Results in Table 4confirm that ENCs exports and
imports have grown during last fifteen years. ENCs have increased especially their trade relationships with
new Europe and have increased their role as exporting countries.
Consistently, the analysis of trade levels (Graphs 2-3-4) confirms increasing trends for both exports and
imports from EU27. Growth is slower between 1995 to 2002, but from 2003 export and import show a
constant increasing trend. It is clear a decrease peak due to the 2008-2009 crisis. Just to give a complete
idea of such numbers the weight of EU15 on total EU27 is slightly decreasing in time but in 2010 old Europe
still accounts for 90% of total ENCs’ trade from the 27-country union.
It is also clear how exports start from a lower value than imports. At the end of the period they first
overcome and then match import values. Trade balance was therefore negative, but over the years the
export ability of ENCs has clearly improved.

-13-
Graph 1: ENCs exports and import growth rates (1995-2010)
-50
0
50
1995 2000 2005 2010year
EU27 WORLD EU15 EU12
exports
-50
0
50
1995 2000 2005 2010year
EU27 WORLD EU15 EU12
imports
Source: Own elaborations on CEPII - BACI DataBase (2012)
European Neighbouring Countries (ENCs) growth rates
Graph 2: ENCs exports and imports to and from EU27 (1995-2010)
17.5
1818
.519
19.5
log_v
alues
1995 2000 2005 2010
ENCs exports to EU27
17.5
1818
.519
19.5
log_v
alues
1995 2000 2005 2010
ENCs imports from EU27
Source: Own elaborations on CEPII - BACI DataBase (2012)

-14-
Graph 3: ENCs exports and imports to and from EU15 (1995-2010)
17.5
1818
.519
log_v
alues
1995 2000 2005 2010
ENCs exports to EU15
17.5
1818
.519
log_v
alues
1995 2000 2005 2010
ENCs imports from EU15
Source: Own elaborations on CEPII - BACI DataBase (2012)
Graph 4: ENCs exports and imports to and from EU12 (1995-2010)
1515
.516
16.5
17log
_valu
es
1995 2000 2005 2010
ENCs exports to EU12
1515
.516
16.5
17log
_valu
es
1995 2000 2005 2010
ENCs imports from EU12
Source: Own elaborations on CEPII - BACI DataBase (2012)
Things don't change when we concentrate on the old Europe (EU15): exports and imports values have
increased in the last fifteen years and exports values have reached and overcame imports values (graph 3);
in other words, while at the beginning of the period they were mainly importers, at the end they became
exporters. In trade with EU12 the reverse is true.

-15-
Table 4: ENCs exports and imports average yearly growth rates in 3 sub-periods
1995-1999 2000-2004 2005-2010
E M E M E M
EU27 3% 0.4% 11% 11% 11% 11%
EU15 3% 1% 10% 10% 10% 10%
EU12 3% -4% 17% 17% 15% 20%
BRICS 46% 45% 14% 22% 19% 19%
USA 10% 2% 12% 1% 8% 13%
REST OF WORLD 8% 8% 14% 12% 16% 15%
Source: Own elaborations on CEPII - BACI DataBase (2012)
Main facts:
� Regardless their proximity position ENCs are not in the group of most important
European partners. It is not their relative smaller size the main explanation that can be
offered. Size is not an issue for other countries which shares borders with the EU, such
as Norway and Switzerland. Anyway some of them (Ukraine, Algeria, Israel and
Morocco) take up a place ;
� ENCs exports to and imports from EU27 have grown over time particularly after 2003;
� In the EU15 market, at the end of the period, ENCs are net exporters while in EU12
market are net importers;
� Growth rates trends reveal an increasing role for BRICS and Rest of the World countries
both for goods in entrance and exit from the ENCs.
4. GEOGRAPHIC TRADE STRUCTURE OF ENCs
4.1 ENCs sub-regions trade
In the following part we consider 3 sub-regions in the ENCs area: Eastern (Armenia, Azerbaijan, Belarus,
Georgia, Moldova, Ukraine) and Southern (Algeria, Egypt, Libya, Morocco, Tunisia) countries (a distinction
which is followed by the EU) but we also separate out Middle East (Jordan, Lebanon, Syria) and inside this
group we consider Israel as an outlier, since its belonging to the group of rich economies.

-16-
Graph 5: ENCs sub-regions exports and imports to and from EU15 (1995-2010)
13.5
14.5
15.5
16.5
17.5
18.5
log_v
alues
1995 2000 2005 2010
EASTERN exports
13.5
14.5
15.5
16.5
17.5
18.5
1995 2000 2005 2010
Israel exports
13.5
14.5
15.5
16.5
17.5
18.5
1995 2000 2005 2010
MIDDLE-EAST exports
13.5
14.5
15.5
16.5
17.5
18.5
1995 2000 2005 2010
SOUTHERN exports
14.5
15.5
16.5
17.5
18.5
1995 2000 2005 2010
EASTERN imports
14.5
15.5
16.5
17.5
18.5
1995 2000 2005 2010
Israel imports
14.5
15.5
16.5
17.5
18.5
1995 2000 2005 2010
MIDDLE-EAST imports
14.5
15.5
16.5
17.5
18.5
1995 2000 2005 2010
SOUTHERN imports
Source: Own elaborations on CEPII - BACI DataBase (2012)
ENCs sub-regions exports and imports vs EU15
Graph 6: ENCs sub-regions exports and imports to and from EU12 (1995-2010)
1011
1213
1415
1617
log_v
alues
1995 2000 2005 2010
EASTERN exports
1011
1213
1415
1617
1995 2000 2005 2010
Israel exports
1011
1213
1415
1617
1995 2000 2005 2010
MIDDLE-EAST exports
1011
1213
1415
1617
1995 2000 2005 2010
SOUTHERN exports
12.5
13.5
14.5
15.5
16.5
1995 2000 2005 2010
EASTERN imports
12.5
13.5
14.5
15.5
16.5
1995 2000 2005 2010
Israel imports
12.5
13.5
14.5
15.5
16.5
1995 2000 2005 2010
MIDDLE-EAST imports
12.5
13.5
14.5
15.5
16.5
1995 2000 2005 2010
SOUTHERN imports
Source: Own elaborations on CEPII - BACI DataBase (2012)
ENCs sub-regions exports and imports vs EU12
Differences across the subgroups reflect clearly the heterogeneous economic size. Each region has
increased its exports during the last fifteen years. Southern ENCs export a higher volume than the others.
Looking at the trend in time all regions have recorded growing exports; the Eastern group shows the fastest
growth; the middle-east group, instead, has experienced the worst (though positive) growth. Looking at
levels, instead, at the beginning of the period Southern countries and Israel import more than the others,
but in the second half of 2000s Eastern ENCs imports exceed Israel imports.
When looking at EU12 market a more fluctuating trend is evident. Eastern countries and Israel have
increased their exports. Southern countries start with a decreasing trend, but at the beginning of 2000s
exports begin to grow. Middle-east countries imports go up and down during the period.

-17-
For imports to New Europe we noticed a growing trend for all sub-regions, too. Eastern ENCs import much
more from EU12, Southern, Middle-East and Israel less.
Table 5: ENCs sub-regions exports and imports. Average yearly growth rates
1995-1999 2000-2004 2005-2010
E I E I E I
Eastern
EU27
9% 3% 23% 24% 16% 14%
Southern 2% 2% 10% 11% 10% 12%
Middle-East 2% -2% 3% 11% 10% 9%
Israel 7% -1% 3% 2% 6% 4%
Eastern
EU15
10% 7% 25% 25% 17% 12%
Southern 2% 2% 10% 11% 10% 12%
Middle-East 2% -1% 3% 11% 11% 8%
Israel 7% -1% 3% 2% 5% 3%
Eastern
EU12
7% -3% 20% 21% 15% 19%
Southern -9% -3% 8% 10% 19% 20%
Middle-East -3% -6% 18% 16% 1% 25%
Israel 8% -1% 6% 13% 12% 21%
Eastern
BRICS
137% 454% 15% 22% 17% 18%
Southern 15% 6% 11% 23% 22% 23%
Middle-East 21% 10% 20% 29% 25% 18%
Israel 10% 18% 16% 14% 20% 13%
Eastern
USA
14% 29% 22% 7% 41% 22%
Southern 4% -2% 27% 0.2% 10% 18%
Middle-East 17% -3% 50% 8% -4% 19%
Israel 13% 7% 4% 0.5% 6% 3%
Eastern
REST OF WORLD
33% 75% 24% 19% 16% 17%
Southern 6% 6% 12% 9% 20% 20%
Middle-East 8% 7% 24% 23% 15% 11%
Israel 3% 6% 4% 8% 11% 6%
Source: Own elaborations on CEPII - BACI DataBase (2012)
Eastern ENCs have experienced the highest growth of exports and imports with EU15 and EU12. When we
look to exports and imports between Israel and EU15, we see that it has the lowest growth rate.
Main facts:
� Eastern and Southern ENCs have experienced the highest exports and imports growth
both in EU15 and EU12 market;
� Southern countries export and import more than others sub-regions when we look at
the most important market: the EU15;
� Eastern neighboring economies have been increasing their trade shares with important
EU competitors: the BRICS, the US and the Rest of the World;
� The BRICS, the US and the other countries are gaining presence also in the other
subregions.
-18-
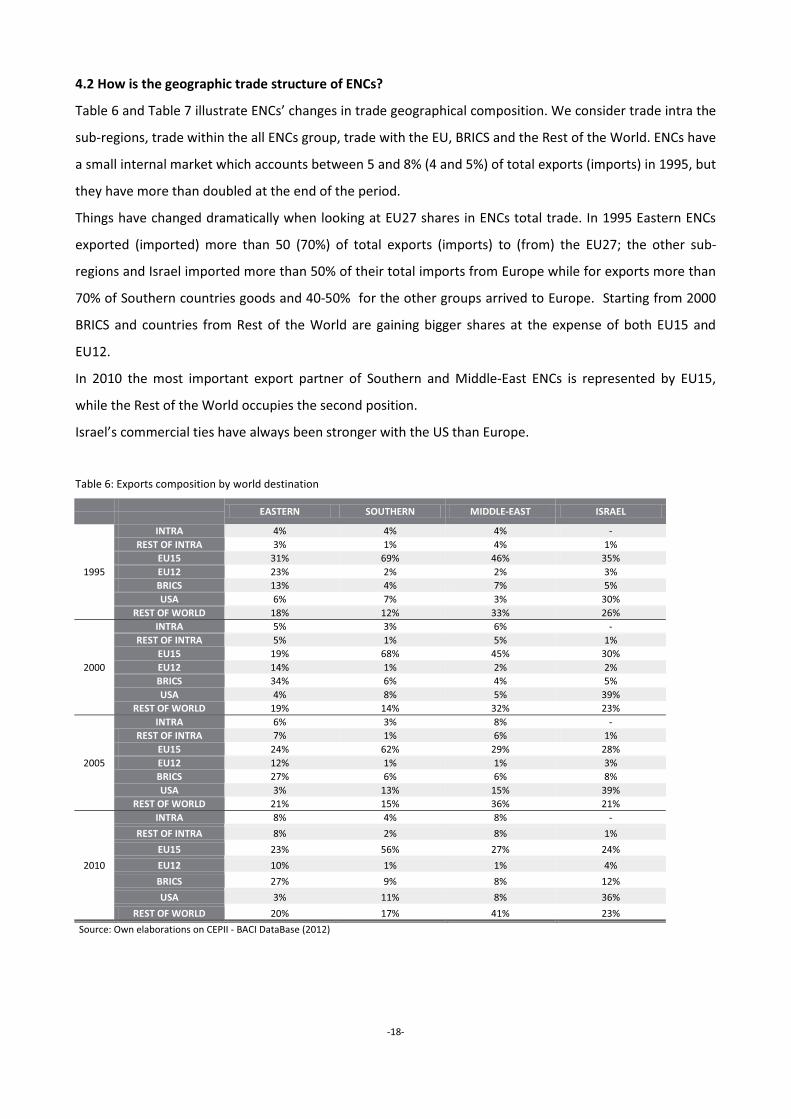
4.2 How is the geographic trade structure of ENCs?
Table 6 and Table 7 illustrate ENCs’ changes in trade geographical composition. We consider trade intra the
sub-regions, trade within the all ENCs group, trade with the EU, BRICS and the Rest of the World. ENCs have
a small internal market which accounts between 5 and 8% (4 and 5%) of total exports (imports) in 1995, but
they have more than doubled at the end of the period.
Things have changed dramatically when looking at EU27 shares in ENCs total trade. In 1995 Eastern ENCs
exported (imported) more than 50 (70%) of total exports (imports) to (from) the EU27; the other sub-
regions and Israel imported more than 50% of their total imports from Europe while for exports more than
70% of Southern countries goods and 40-50% for the other groups arrived to Europe. Starting from 2000
BRICS and countries from Rest of the World are gaining bigger shares at the expense of both EU15 and
EU12.
In 2010 the most important export partner of Southern and Middle-East ENCs is represented by EU15,
while the Rest of the World occupies the second position.
Israel’s commercial ties have always been stronger with the US than Europe.
Table 6: Exports composition by world destination
EASTERN SOUTHERN MIDDLE-EAST ISRAEL
1995
INTRA 4% 4% 4% - REST OF INTRA 3% 1% 4% 1%
EU15 31% 69% 46% 35% EU12 23% 2% 2% 3% BRICS 13% 4% 7% 5% USA 6% 7% 3% 30%
REST OF WORLD 18% 12% 33% 26%
2000
INTRA 5% 3% 6% - REST OF INTRA 5% 1% 5% 1%
EU15 19% 68% 45% 30% EU12 14% 1% 2% 2% BRICS 34% 6% 4% 5% USA 4% 8% 5% 39%
REST OF WORLD 19% 14% 32% 23%
2005
INTRA 6% 3% 8% - REST OF INTRA 7% 1% 6% 1%
EU15 24% 62% 29% 28% EU12 12% 1% 1% 3% BRICS 27% 6% 6% 8% USA 3% 13% 15% 39%
REST OF WORLD 21% 15% 36% 21%
2010
INTRA 8% 4% 8% -
REST OF INTRA 8% 2% 8% 1%
EU15 23% 56% 27% 24%
EU12 10% 1% 1% 4%
BRICS 27% 9% 8% 12%
USA 3% 11% 8% 36%
REST OF WORLD 20% 17% 41% 23%
Source: Own elaborations on CEPII - BACI DataBase (2012)

-19-
Table 7: Imports composition by world origin
EASTERN SOUTHERN MIDDLE-EAST ISRAEL
1995
INTRA 4% 3% 2% - REST OF INTRA 1% 1% 2% 1%
EU15 44% 56% 47% 54% EU12 32% 3% 5% 1% BRICS 5% 6% 7% 4% USA 4% 11% 9% 20%
REST OF WORLD 9% 20% 29% 20%
2000
INTRA 5% 3% 3% - REST OF INTRA 1% 2% 5% 2%
EU15 22% 53% 41% 45% EU12 10% 2% 3% 1% BRICS 43% 7% 10% 8% USA 4% 10% 8% 21%
REST OF WORLD 15% 22% 30% 22%
2005
INTRA 6% 4% 3% - REST OF INTRA 1% 4% 9% 2%
EU15 24% 49% 30% 41% EU12 11% 2% 3% 2% BRICS 40% 12% 14% 14% USA 2% 6% 4% 15%
REST OF WORLD 16% 23% 36% 42%
2010
INTRA 8% 4% 3% -
REST OF INTRA 1% 3% 11% 5%
EU15 20% 43% 26% 36%
EU12 12% 3% 3% 3%
BRICS 44% 16% 18% 18%
USA 2% 6% 6% 13%
REST OF WORLD 14% 25% 34% 25%
Source: Own elaborations on CEPII - BACI DataBase (2012)
Main facts:
� Trade within the ENCs group has been increasing in time, in some cases (Eastern and
Middle East) it doubled its share;
� The erosion of Europe shares in ENCs trade is evident:
� In 1995 most important partner for Eastern countries was EU15, but starting from 2000
BRICS countries started their path to become their main export and import partner
� Southern countries have always referred to countries from the ‘Old Europe’ as their
main export and import partner. Starting from 2005 BRICS are gaining position
particularly for imports.
� In the Middle-East region the erosion of the EU15 position has to be coupled with the
increasing role of the Rest of the World group; looking at imports also the emerging
economies are gaining shares.
� In Israel’s trade there is no reverse of position in last fifteen years: the US and the rest of
the world have reinforced their position; the EU15 is still the most important source of
but the Old Europe and the US are losing their role in favor of the 5 emerging economies
and the rest of the world group.

-20-
5. TRADE STRUCTURE OF ENCs BY TYPE OF PRODUCT
Goods are not the same. First of all they can be demanded by consumers or firms. Furthermore, they can
be final (finished) products apt for consumption or intermediate goods, i.e. goods that require further
processing or parts and components to be assembled in order to compose a final good. The relative weight
of intermediate goods has been increasing in total exports of low middle income countries (moving from
38% to 40%), in fact the increasing role of exchanges of intermediates is one chief characteristic of the
globalization wave of the last 30 years.
The classification of Broad Economic Categories (BEC) separates out, within final goods, consumption
goods, capital goods (machinery and equipment that is used for producing other goods and industrial
transport equipment); and primary products (raw materials and resources used in the productive process).
We also know since decades that countries and regions may build on their strengths by progressively
developing specialization in certain fields. Trading different types of goods is not therefore neutral in the
capability to promote development and sustainable and stable growth. The analysis of trade by type of
product has the aim to provide important information on the ENCs’ specialization structure. We already
know that some of the countries in our group have a comparative advantage on their natural resources’
exploitation3
Trade in capital goods, instead, has been recognized an important role in spreading the benefits of
technological advances (Eaton and Kortum, 2000). Their weight in total exports of low-middle income
countries has increased in recent years enormously arriving to account for 20% of total exports (it was 9%
in 1995). The increased importance of intermediate products in world trade is another indication of the
multi-country nature of products. If the chain value is dependent on the action of many countries
international ties become more important.
. As reported by the World Trade Report (2010) an important feature of natural resources is
the dominant position of this sector in many national economies. Another crucial one is the presence of
negative externalities arising from the extraction and consumption of resources and the extreme, though
not permanent, price volatility of their products.
All together, these arguments are saying that in order to determine the nature and the quality of trade
relationships, the analysis of trade by type of product is very relevant. This section is devoted to
understanding where, in the world, ENCs trade different types of product.
5.1 What's trade structure between final and intermediate products? How capital and primary goods
perform?
3 A definition of natural resources can be quite controversial. We refer here to stocks of materials that exist in the natural
environment that are both scarce and economically useful in production or consumption, either in their raw state or after a
minimal amount of processing.

-21-
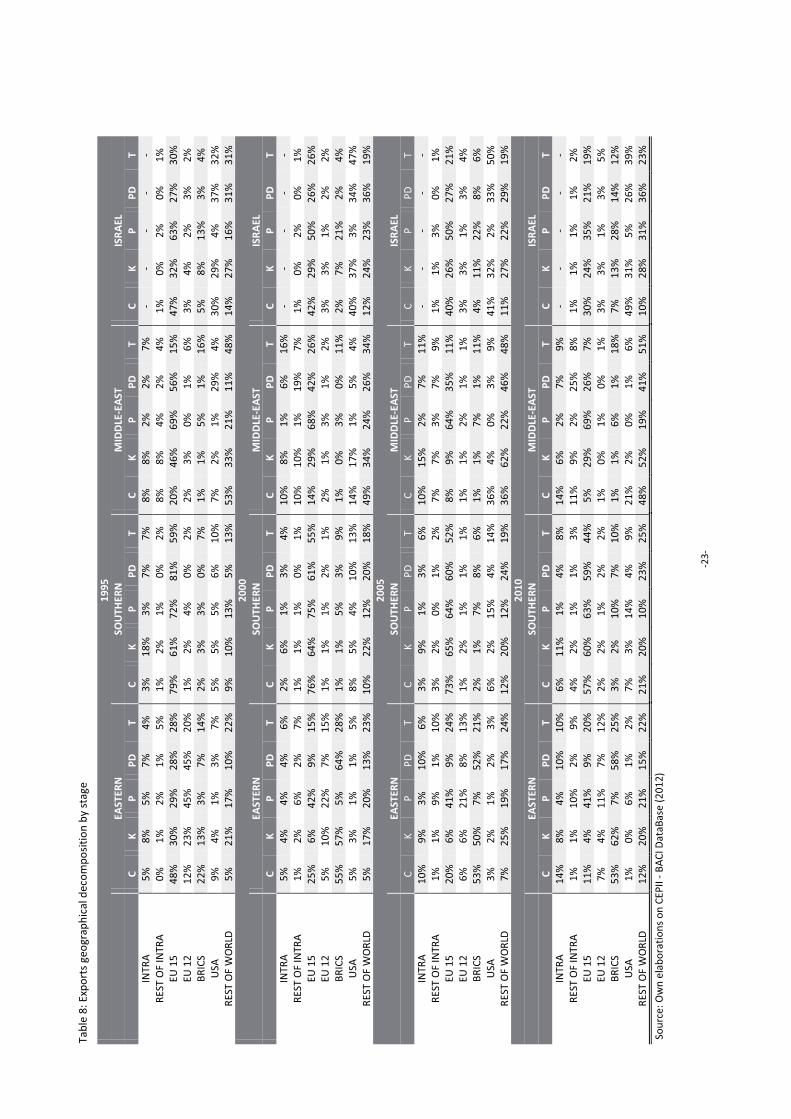
The geographical trade composition for our sub-regions is presented in both Table 8 (exports) and Table 9
(imports). Changes in time are reported for consumption (C), capital (K), primary (P) products, and for two
types of intermediates (parts and components, PD and processed goods, T). Computing average yearly
growth rates (Table A1 and Table A2 in the Appendix) by type of good and stage of production allows to
infer on how the production structure of the ENCs economy is evolving.
In 1995 in all sub regions the EU27 was the most important export destination for all types of products. In
the last year of our analysis the situation has changed substantially for all sub regions. The most extreme
case is Eastern neighboring economies: over the years, EU27 has lost its position and the BRICS have
become principal Eastern ENCs destination and origin. They shifted to the emerging economies their
exports of consumption, capital and intermediate products while Europe is the main destination of their
primary products (which the sectorial analysis reveals is made up mainly of energy products). When looking
at imports, shares are more balanced between EU15 and BRICS, but the erosion of the EU27 position
though slower is still present and it embraces also primary products.
The case is similar for Middle East economies where trade for all products types, except for primary goods,
has moved to the Rest of the World. As Eastern economies the EU15 still maintain a prominent position in
sourcing capital goods and parts and components.
Southern neighboring economies are the ones where the old Europe still plays an important role both in
exports and imports. The EU relative presence has been anyhow reducing in time. Emerging economies still
do not have a role in Southern trade. Old Europe is an important demand for consumption, primary goods
and parts & accessories while is quite important in offering parts and accessories.
In Israel the US hold and reinforce their position of best partner where the EU follows, but their distance is
increasing. From 2005 BRICS start to play a role particularly in Israeli imports.
Main facts:
� The importance of EU in its neighbors’ trade has witness a strong erosion in time in favor
of the 5 emerging economies and other countries in the heterogeneous group of rest of
the world.
� The EU is the main destination for primary products commodities, this is particularly
true when looking at its east borders.
� Capital goods, i.e. products which are more likely to embody knowledge, are still traded
primarily from the Old European countries but when looking at exports the rise in
importance for the emerging economies is clear.
� The geographical map appropriate for understanding the creation of value for products
which need further processing or assembly include Europe whose role is anyhow more
important when selling rather than buying.

-22-
-23-
Tabl
e 8:
Exp
orts
geo
grap
hica
l dec
ompo
sitio
n by
sta
ge
1995
EAST
ERN
SO
UTH
ERN
M
IDD
LE-E
AST
IS
RAEL
C K
P PD
T
C K
P PD
T
C K
P PD
T
C K
P PD
T
INTR
A 5%
8%
5%
7%
4%
3%
18
%
3%
7%
7%
8%
8%
2%
2%
7%
- -
- -
- RE
ST O
F IN
TRA
0%
1%
2%
1%
5%
1%
2%
1%
0%
2%
8%
8%
4%
2%
4%
1%
0%
2%
0%
1%
EU 1
5 48
%
30%
29
%
28%
28
%
79%
61
%
72%
81
%
59%
20
%
46%
69
%
56%
15
%
47%
32
%
63%
27
%
30%
EU
12
12%
23
%
45%
45
%
20%
1%
2%
4%
0%
2%
2%
3%
0%
1%
6%
3%
4%
2%
3%
2%
BR
ICS
22%
13
%
3%
7%
14%
2%
3%
3%
0%
7%
1%
1%
5%
1%
16
%
5%
8%
13%
3%
4%
U
SA
9%
4%
1%
3%
7%
5%
5%
5%
6%
10%
7%
2%
1%
29
%
4%
30%
29
%
4%
37%
32
%
REST
OF
WO
RLD
5%
21
%
17%
10
%
22%
9%
10
%
13%
5%
13
%
53%
33
%
21%
11
%
48%
14
%
27%
16
%
31%
31
%
2000
EAST
ERN
SO
UTH
ERN
M
IDD
LE-E
AST
IS
RAEL
C K
P PD
T
C K
P PD
T
C K
P PD
T
C K
P PD
T
INTR
A 5%
4%
4%
4%
6%
2%
6%
1%
3%
4%
10
%
8%
1%
6%
16%
-
- -
- -
REST
OF
INTR
A 1%
2%
6%
2%
7%
1%
1%
1%
0%
1%
10
%
10%
1%
19
%
7%
1%
0%
2%
0%
1%
EU 1
5 25
%
6%
42%
9%
15
%
76%
64
%
75%
61
%
55%
14
%
29%
68
%
42%
26
%
42%
29
%
50%
26
%
26%
EU
12
5%
10%
22
%
7%
15%
1%
1%
1%
2%
1%
2%
1%
3%
1%
2%
3%
3%
1%
2%
2%
BR
ICS
55%
57
%
5%
64%
28
%
1%
1%
5%
3%
9%
1%
0%
3%
0%
11%
2%
7%
21
%
2%
4%
USA
5%
3%
1%
1%
5%
8%
5%
4%
10
%
13%
14
%
17%
1%
5%
4%
40
%
37%
3%
34
%
47%
RE
ST O
F W
ORL
D
5%
17%
20
%
13%
23
%
10%
22
%
12%
20
%
18%
49
%
34%
24
%
26%
34
%
12%
24
%
23%
36
%
19%
20
05
EA
STER
N
SOU
THER
N
MID
DLE
-EA
ST
ISRA
EL
C
K P
PD
T C
K P
PD
T C
K P
PD
T C
K P
PD
T IN
TRA
10%
9%
3%
10
%
6%
3%
9%
1%
3%
6%
10%
15
%
2%
7%
11%
-
- -
- -
REST
OF
INTR
A 1%
1%
9%
1%
10
%
3%
2%
0%
1%
2%
7%
7%
3%
7%
9%
1%
1%
3%
0%
1%
EU 1
5 20
%
6%
41%
9%
24
%
73%
65
%
64%
60
%
52%
8%
9%
64
%
35%
11
%
40%
26
%
50%
27
%
21%
EU
12
6%
6%
21%
8%
13
%
1%
2%
1%
1%
1%
1%
1%
2%
1%
1%
3%
3%
1%
3%
4%
BRIC
S 53
%
50%
7%
52
%
21%
2%
1%
7%
8%
6%
1%
1%
7%
1%
11
%
4%
11%
22
%
8%
6%
USA
3%
2%
1%
2%
3%
6%
2%
15
%
4%
14%
36
%
4%
0%
3%
9%
41%
32
%
2%
33%
50
%
REST
OF
WO
RLD
7%
25
%
19%
17
%
24%
12
%
20%
12
%
24%
19
%
36%
62
%
22%
46
%
48%
11
%
27%
22
%
29%
19
%
2010
EAST
ERN
SO
UTH
ERN
M
IDD
LE-E
AST
IS
RAEL
C K
P PD
T
C K
P PD
T
C K
P PD
T
C K
P PD
T
INTR
A 14
%
8%
4%
10%
10
%
6%
11%
1%
4%
8%
14
%
6%
2%
7%
9%
- -
- -
- RE
ST O
F IN
TRA
1%
1%
10%
2%
9%
4%
2%
1%
1%
3%
11
%
9%
2%
25%
8%
1%
1%
1%
1%
2%
EU
15
11%
4%
41
%
9%
20%
57
%
60%
63
%
59%
44
%
5%
29%
69
%
26%
7%
30
%
24%
35
%
21%
19
%
EU 1
2 7%
4%
11
%
7%
12%
2%
2%
1%
2%
2%
1%
0%
1%
0%
1%
3%
3%
1%
3%
5%
BR
ICS
53%
62
%
7%
58%
25
%
3%
2%
10%
7%
10
%
1%
1%
6%
1%
18%
7%
13
%
28%
14
%
12%
U
SA
1%
0%
6%
1%
2%
7%
3%
14%
4%
9%
21
%
2%
0%
1%
6%
49%
31
%
5%
26%
39
%
REST
OF
WO
RLD
12
%
20%
21
%
15%
22
%
21%
20
%
10%
23
%
25%
48
%
52%
19
%
41%
51
%
10%
28
%
31%
36
%
23%
Sour
ce: O
wn
elab
orat
ions
on
CEPI
I - B
ACI
Dat
aBas
e (2
012)

-24-
Tabl
e 9:
Impo
rts
geog
raph
ical
dec
ompo
sitio
n by
sta
ge
1995
EAST
ERN
SO
UTH
ERN
M
IDD
LE-E
AST
IS
RAEL
C K
P PD
T
C K
P PD
T
C K
P PD
T
C K
P PD
T
INTR
A 2%
1%
7%
1%
7%
3%
1%
6%
1%
4%
2%
0%
3%
0%
2%
-
- -
- -
REST
OF
INTR
A 1%
1%
3%
0%
1%
1%
0%
2%
0%
1%
2%
0%
1%
0%
4%
0%
0%
3%
0%
1%
EU
15
44%
63
%
23%
50
%
40%
60
%
64%
22
%
67%
59
%
49%
59
%
15%
61
%
45%
51
%
48%
63
%
46%
58
%
EU 1
2 35
%
19%
43
%
28%
34
%
2%
2%
4%
2%
4%
3%
4%
7%
2%
7%
1%
0%
1%
1%
3%
BRIC
S 3%
1%
15
%
4%
7%
7%
2%
6%
3%
8%
6%
3%
9%
6%
8%
3%
1%
5%
1%
7%
USA
2%
6%
6%
7%
4%
5%
13
%
30%
13
%
6%
11%
8%
23
%
12%
4%
16
%
32%
9%
37
%
14%
RE
ST O
F W
ORL
D
13%
9%
3%
8%
8%
23
%
18%
31
%
15%
17
%
26%
25
%
43%
19
%
31%
29
%
18%
19
%
16%
17
%
2000
EAST
ERN
SO
UTH
ERN
M
IDD
LE-E
AST
IS
RAEL
C K
P PD
T
C K
P PD
T
C K
P PD
T
C K
P PD
T
INTR
A 4%
3%
2%
3%
11
%
2%
0%
4%
1%
4%
3%
1%
2%
0%
4%
- -
- -
- RE
ST O
F IN
TRA
1%
1%
1%
0%
0%
1%
1%
1%
1%
4%
4%
1%
3%
1%
9%
1%
0%
5%
0%
2%
EU 1
5 32
%
41%
4%
30
%
24%
56
%
61%
21
%
64%
56
%
44%
52
%
26%
51
%
35%
47
%
44%
54
%
37%
44
%
EU 1
2 18
%
10%
3%
11
%
13%
2%
1%
2%
2%
3%
4%
2%
5%
2%
3%
1%
2%
1%
1%
2%
BR
ICS
19%
24
%
69%
41
%
37%
11
%
3%
8%
5%
8%
9%
7%
21%
8%
11
%
7%
2%
14%
2%
14
%
USA
6%
10
%
1%
5%
2%
3%
17%
24
%
13%
4%
8%
9%
18
%
14%
3%
13
%
33%
7%
40
%
15%
RE
ST O
F W
ORL
D
20%
11
%
20%
9%
12
%
24%
17
%
40%
15
%
21%
27
%
27%
24
%
25%
34
%
31%
19
%
19%
21
%
22%
20
05
EA
STER
N
SOU
THER
N
MID
DLE
-EA
ST
ISRA
EL
C
K P
PD
T C
K P
PD
T C
K P
PD
T C
K P
PD
T IN
TRA
6%
5%
2%
5%
10%
3%
1%
5%
1%
6%
6%
2%
2%
1%
3%
-
- -
- -
REST
OF
INTR
A 1%
0%
1%
0%
0%
2%
0%
4%
0%
7%
6%
2%
9%
1%
15
%
1%
0%
3%
0%
3%
EU 1
5 28
%
50%
3%
31
%
25%
49
%
63%
17
%
63%
50
%
33%
46
%
8%
45%
26
%
39%
46
%
48%
43
%
35%
EU
12
15%
11
%
2%
14%
15
%
2%
2%
3%
2%
3%
2%
3%
4%
2%
3%
2%
1%
0%
2%
3%
BRIC
S 28
%
21%
71
%
29%
35
%
16%
9%
17
%
8%
11%
14
%
15%
10
%
15%
15
%
13%
6%
12
%
4%
22%
U
SA
3%
4%
1%
4%
1%
2%
9%
11%
10
%
3%
6%
5%
7%
10%
2%
9%
27
%
4%
30%
15
%
REST
OF
WO
RLD
19
%
9%
21%
18
%
12%
26
%
16%
43
%
16%
21
%
33%
27
%
59%
27
%
36%
36
%
20%
33
%
22%
21
%
2010
EAST
ERN
SO
UTH
ERN
M
IDD
LE-E
AST
IS
RAEL
C K
P PD
T
C K
P PD
T
C K
P PD
T
C K
P PD
T
INTR
A 7%
4%
4%
5%
13
%
5%
1%
5%
1%
6%
5%
1%
2%
1%
3%
- -
- -
- RE
ST O
F IN
TRA
1%
1%
0%
0%
0%
2%
1%
5%
1%
4%
6%
1%
14%
1%
18
%
1%
0%
27%
0%
2%
EU
15
26%
39
%
2%
30%
19
%
40%
49
%
22%
57
%
43%
27
%
38%
9%
46
%
22%
34
%
48%
29
%
40%
33
%
EU 1
2 15
%
14%
2%
16
%
15%
3%
2%
1%
3%
4%
2%
3%
3%
2%
3%
6%
3%
2%
2%
3%
BR
ICS
28%
27
%
80%
33
%
36%
21
%
19%
17
%
12%
14
%
17%
27
%
12%
16
%
17%
17
%
12%
17
%
9%
24%
U
SA
3%
4%
2%
3%
1%
3%
7%
14%
7%
5%
6%
5%
12
%
10%
5%
8%
18
%
4%
23%
15
%
REST
OF
WO
RLD
20
%
12%
10
%
12%
14
%
27%
22
%
35%
20
%
24%
37
%
24%
47
%
25%
32
%
34%
19
%
22%
25
%
23%
Sour
ce: O
wn
elab
orat
ions
on
CEPI
I - B
ACI
Dat
aBas
e (2
012)

-25-
6. GEOGRAPHICAL AND SECTORAL DIFFERENTIATION
Moving from the classic trade theories developed since Smith (1776) and Ricardo (1817), based on the
concepts of comparative advantage, specialization, and international labor division, already in the 50s the
prevailing idea was that in order to stabilize export earnings, boost income growth, and upgrade value
added, developing countries had to increase the variety of their export basket. The main concept is that
specialization in a narrow group of export products exposes a country to increased instability in export
earnings which can be made worse when concerned products are subject to secular declining terms of
trade. There is also a growing consensus that patterns of economic development is associated with
structural change in exports and increased export diversification. In virtually all regions of the world, the
patterns of trade have been changing from primary exports to manufactured exports of labor intensive
types and subsequently to more resource intensive manufactures.
Export diversification is variously defined as the change in the composition of a country’s existing export
product mix or export destination (Ali, Alwang and Siegel, 1991), or as the spread of production over many
sectors (Berthelemy and Chauvin, 2000)4
In this part we provide some analysis on the degree of the ENCs trade differentiation by looking at the
geographical and sectorial concentration of both exports and imports. In a globalized set-up where goods
are produced by using imported inputs, materials and intermediates the degree of export differentiation
has to be studied jointly with the degree of differentiation in import flows.
. There are well known risks (political and economic, Collin, 2002)
in concentrating exports in a few primary commodities; it exposes a country to the negative effects of
unfavorable characteristics of world demand and negative supply side features of these primary products.
Also concentrating the whole export activity in a few destinations imposes risks for the continuity of the
exporting activity.
The analysis will look at individual neighboring countries.
6.1 Which is the best destination and the best origin in world market and in EU27 market for each ENCs?
How much are ENCs geographical diversified?
We start by studying which is the best partner for each EU neighbor. We look at both the world and the
EU27 market. We do expect the geographical location to be important here and therefore Europe to be
quite important. We also calculated shares of total trade which is accounted by the best bilateral relation.
As reported in Table 10, even if we look at the world market, 8 out of 15 best ENCs export partners are big
EU15 countries, like Germany, France and Italy. Other ENCs reveal as main export destination one sharing
border country or an economy which is quite near (Russia, Turkey, Iraq and Saudi Arabia); Israel trades
mainly with USA. Looking at EU27 market best partners concentrate mainly in the old Europe, just Romania
4 When measuring export diversification while horizontal diversification entails the adding of new products to the existing export
bundle, vertical differentiation entails a shift from the primary to the secondary or tertiary sector.

-26-
and Bulgaria appear in the table. Looking at countries shares is glaring that some destination matter for
over 40% in ENCs exports.
In some cases there is no change in the best export partner during the time considered; Algeria, Armenia,
Azerbaijan, Belarus, Lebanon and Ukraine, instead, have changed their best export destination from 1995
to 2010.
When looking at imports (Table 11) the picture surprisingly changes: in the world market ENCs import
mainly from the US; in the EU27 market it's Germany, on average, the best origin. The situation is quite
stable in time. As for exports, Romania is the only EU12 with which ENCs trade. In terms of shares, instead,
best import partners weight less than best export partners.
The Herfindahl index is one of the trade concentration indicators used in the literature. It lies between 0
and 1, where being close to 0 indicates well diversified flows5 Table 12 . Overall indicates that ENCs exports
are somehow geographical diversified and for some countries diversification has increased over the years.
In 1995, in both world and EU market, Armenia and Libya exported in a less diversified way than other
ENCs, in other words they focus their exports just to one or few countries. If we look at world market we
have to add Georgia (whose exports are less concentrated in EU), while Morocco has a higher geographical
concentration in Europe than the world. On the other side, Ukraine is the most geographical diversified
country in both markets. Over the years there have been changes: Egypt in the world market and Israel in
the restricted EU27 group have become the most diversified exporting countries.
Looking at import flows, Table 12 allows us to say that ENCs imports are more diversified than ENCs
exports. Looking at world market, in 1995, Jordan and Syria had the more diversified imports, after fifteen
years, in 2010, the most diversified is Egypt. Looking at just Europe, in 1995, Ukraine imported in the most
diversified way, in 2010 is Armenia the most diversified importing country.
Main facts:
� Most important export and import partner for ENCs are represented by old Europe
countries;
� Geographical concentration of ENCs trade flows is higher in exports than imports.
5 As point out by Cadot, Carrère and Strauss-Kahn (2007) the Herfindahl index measure concentration rather than diversification,
but some papers have applied this and other concentration indexes (Gini, Theil) to export diversification, thus they reviewed these
measures applying them to imports.

-27-
Table 10: Best export destination in world and EU27 market
world market 1995 2010 Best destination Country share Best destination Country share
Algeria Italy 19% Usa & Puerto Rico 23% Armenia Benelux 41% Russia 15% Azerbaijan Turkey 18% Italy 28% Belarus Germany 26% Russia 38% Egypt Italy 17% Italy 8% Georgia Turkey 48% Turkey 11% Israel USA & Puerto Rico 30% Usa & Puerto Rico 36% Jordan Iraq 17% Iraq 15% Lebanon Saudi Arabia 18% Switzerland& Liechtenstein 14% Libya Italy 41% Italy 33% Moldova Russia 42% Russia 25% Morocco France 34% France 20% Syria Germany 19% Germany 18% Tunisia France 27% France 27% Ukraine Turkey 13% Russia 25%
EU27 market Algeria Italy 29% Italy 33% Armenia Benelux 58% Bulgaria 29% Azerbaijan Italy 25% Italy 55% Belarus Germany 31% Netherlands 36% Egypt Italy 29% Italy 25% Georgia Italy 23% Bulgaria 26% Israel UK 17% Benelux 16% Jordan Italy 21% Italy 27% Lebanon France 25% France 42% Libya Italy 49% Italy 42% Moldova Romania 36% Romania 29% Morocco France 47% France 33% Syria Germany 27% Germany 32% Tunisia France 32% France 36% Ukraine Italy 25% Italy 19%
Source: Own elaborations on CEPII - BACI DataBase (2012)

-28-
Table 11: Best export origin in world and EU27 market
world market 1995 2010 Best origin Country share Best origin Country share
Algeria France 26% France 16% Armenia Usa & Puerto Rico 29% Russia 20% Azerbaijan Turkey 39% Russia 15% Belarus Germany 31% Russia 51% Egypt Usa & Puerto Rico 19% Usa & Puerto Rico 9% Georgia Turkey 20% Turkey 16% Israel Usa & Puerto Rico 20% Usa & Puerto Rico 13% Jordan Usa & Puerto Rico 10% Saudi Arabia 16% Lebanon Italy 17% Usa & Puerto Rico 10% Libya Italy 22% Italy 18% Moldova Russia 27% Ukraine 17% Morocco France 23% France 15% Syria Italy 13% China 15% Tunisia France 25% France 19% Ukraine Germany 18% Russia 35%
EU27 market Algeria France 41% France 32% Armenia Germany 21% Germany 17% Azerbaijan Germany 27% Germany 32% Belarus Germany 34% Germany 29% Egypt Germany 21% Germany 19% Georgia Romania 28% Germany 22% Israel Benelux 23% Benelux 18% Jordan Germany 19% Germany 29% Lebanon Italy 27% Italy 21% Libya Italy 33% Italy 41% Moldova Germany 23% Romania 24% Morocco France 36% France 30% Syria Italy 23% Italy 33% Tunisia France 34% France 30% Ukraine Germany 23% Germany 24%
Source: Own elaborations on CEPII - BACI DataBase (2012)

-29-
Table 12: Export Herfindahl index (geographical diversification)
WORLD MARKET EU27 MARKET
1995 2010 1995 2010
Algeria 0.0933 0.1006 0.1286 0.1648
Armenia 0.2714 0.0854 0.3975 0.1795
Azerbaijan 0.0906 0.1032 0.1138 0.3174
Belarus 0.1074 0.1700 0.1173 0.1501
Egypt 0.0584 0.0302 0.1025 0.1087
Georgia 0.2507 0.0536 0.1118 0.0951
Israel 0.1126 0.1390 0.0832 0.0663
Jordan 0.0680 0.0759 0.1005 0.1167
Lebanon 0.0805 0.0509 0.0957 0.1872
Libya 0.2121 0.1542 0.2789 0.2015
Moldova 0.2008 0.1032 0.1526 0.1338
Morocco 0.1393 0.0798 0.2357 0.1870
Syria 0.1092 0.0882 0.1573 0.1998
Tunisia 0.1414 0.1176 0.1796 0.1796
Ukraine 0.0579 0.0731 0.0814 0.0514
Source: Own elaborations on CEPII - BACI DataBase (2012)
Table 13: Import Herfindahl index (geographical diversification)
WORLD MARKET EU27 MARKET
1995 2010 1995 2010
Algeria 0.1018 0.0599 0.1958 0.1328
Armenia 0.1381 0.0665 0.0932 0.0481
Azerbaijan 0.1795 0.0680 0.0927 0.1255
Belarus 0.1368 0.2683 0.1308 0.1002
Egypt 0.0641 0.0352 0.0837 0.0713
Georgia 0.1168 0.0590 0.1092 0.0569
Israel 0.0841 0.0480 0.1068 0.0739
Jordan 0.0384 0.0532 0.0808 0.1020
Lebanon 0.0690 0.0398 0.1055 0.0957
Libya 0.0848 0.0739 0.1377 0.1905
Moldova 0.1420 0.0752 0.0836 0.0850
Morocco 0.0803 0.0586 0.1515 0.1353
Syria 0.0514 0.0579 0.0916 0.1277
Tunisia 0.1071 0.0861 0.1653 0.1689
Ukraine 0.0679 0.1389 0.0673 0.0730
Source: Own elaborations on CEPII - BACI DataBase (2012)
6.2 Which is the best sector in the best partner? How much are ENCs diversified by sector?
In this section we study export and import concentration looking at trade by sector. We use disaggregation
at the 3-digit level of the ISIC classification of manufacturing activities. Also, we merge the analysis by
sector with the ones just discussed on the best trade partner. The point that can be made is quite intuitive.

-30-
If one country concentrates its flows in few destinations and on top of this only some sectors are
interested, the vulnerability of the whole trade system increases.
In fact a good number of ENCs, especially Southern countries (Algeria, Egypt, Libya and Syria) export in the
country where they export more (in values) across all countries in the world or in Europe, petroleum and
natural gas; this sector matters for about 80% of their export in their best destination. Eastern ENCs
countries export more machinery or agriculture products. Middle-East and Israel have not a predominant
export sector, it depends on its destination. In general (Table 14) at the world level, even when the first
destination does not have a big share, in 7 out of 15 countries, the first exporting sector accounts for more
than 50% of total exports in the country. When concentrating in the EU27 market, in 8 out of 15 cases the
best exporting industry accounts for more than 80% of total exports. When the best partner in the world
and EU market is not the same, shares are normally lower in the destination outside the EU. Sectorial
shares are smaller than 40% in Egypt, Morocco and Tunisia (Southern group), in Israel in the Middle East
and Moldova for the Eastern countries.
It is evident some dynamics in time: sometimes the change concerns the best exporting destination without
a change in the main goods which are exported. This is the case all times the first products exported are in
primary energy sector (oil and gas). I some other cases (which one?) the main exporting sectors changes,
and some of them, such as Morocco and Tunisia suggest, the shift make think to an upgrading linked to the
foreign firms presence in the country.
Why are these numbers so important? When such a sectorial concentration is revealed in the destination
where exports are higher, the presence of export differentiation in other destinations has a smaller weight.
We can expect the degree of export differentiation of an economy to be quite low.
In Table 15, we can evaluate the degree of sectorial concentration in total world exports. In Algeria,
Azerbaijan and Libya concentration has increased. In Syria it has decreased but is still higher than the other
ENCs. When we calculate the same index in the EU27 market, all countries but Israel reveal an higher
export concentration. This is even stronger for Algeria, Azerbaijan and Libya. When considering the 5
emerging economies it is also clear the degree of sectorial concentration is even higher in the total BRICS
market. Except for Egypt, Jordan, Lebanon, Morocco and Tunisia diversification in the best BRICS export
destination is higher than in the best EU destination.
Moving to imports (Table 16) manufacture of machinery and textile products predominates. Percentage are
not so high as those seen in Table 14, this leads us to say that imports are more diversified than exports;
ENCs imports from their most solid origin shows a wider variety of products. As seen for exports there is no
correlation between different import partner across the years and different best sector.
Greater sector diversification is supported by results in Table 17: Herfindahl index values are closer to 0. As
seen for geographical diversification, that ENCs experienced a less sector diversification from their best
origin partner. Looking at BRICS things don't change: ENCs imports from BRICS are more diversified than
-31-
exports to BRICS; in the BRICS best origin too, with no surprise, Herfindahl index values are less than those
referring to the whole BRICS market.
Main facts:
� ENCs export mainly petroleum and natural gas products to their best destination, but
import especially from their best origin manufacture of machinery and of textile
products;
� ENCs exports are less diversified by sector than imports;
� No correlation between changes in trade partner and sector over the years;
� ENCs trade, in the best destination or origin, is less diversified when the partner is
located in Europe rather than outside Europe.

-32-
Tabl
e 14
: Bes
t sec
tor
in th
e be
st d
estin
atio
n
wor
ld m
arke
t
1995
2010
Be
st d
esti
nati
on
Best
sec
tor
in t
he b
est
dest
inat
ion
Best
sec
tor
shar
e Be
st d
esti
nati
on
Best
sec
tor
in t
he b
est
dest
inat
ion
Best
sec
tor
shar
e A
lger
ia
Ital
y Cr
ude
Petr
oleu
m a
nd N
atur
al G
as P
rodu
ctio
n 75
%
Usa
& P
uert
o Ri
co
Crud
e Pe
trol
eum
and
Nat
ural
Gas
Pro
duct
ion
74%
A
rmen
ia
Bene
lux
Oth
er M
anuf
actu
ring
Indu
stri
es
79%
Ru
ssia
Be
vera
gein
dust
ries
55
%
Aze
rbai
jan
Turk
ey
Man
ufac
ture
of t
extil
es
27%
It
aly
Crud
e Pe
trol
eum
and
Nat
ural
Gas
Pro
duct
ion
99%
Be
laru
s G
erm
any
Man
ufac
ture
of i
ndus
tria
l che
mic
als
29%
Ru
ssia
Fo
od m
anuf
actu
ring
26
%
Egyp
t It
aly
Crud
e Pe
trol
eum
and
Nat
ural
Gas
Pro
duct
ion
51%
It
aly
Crud
e Pe
trol
eum
and
Nat
ural
Gas
Pro
duct
ion
34%
G
eorg
ia
Turk
ey
Iron
and
ste
el b
asic
indu
strie
s 82
%
Turk
ey
Iron
and
ste
el b
asic
indu
strie
s 50
%
Isra
el
USA
& P
uert
o Ri
co
Oth
er M
anuf
actu
ring
Indu
stri
es
41%
U
sa &
Pue
rto
Rico
O
ther
Man
ufac
turin
g In
dust
ries
37
%
Jord
an
Iraq
Fo
od m
anuf
actu
ring
72
%
Iraq
Fo
od m
anuf
actu
ring
17
%
Leba
non
Saud
i Ara
bia
Agr
icul
ture
and
live
stoc
k pr
oduc
tion
34
%
Switz
erla
nd&
Lie
chte
nste
in
Non
-fer
rous
met
al b
asic
indu
stri
es
74%
Li
bya
Ital
y Cr
ude
Petr
oleu
m a
nd N
atur
al G
as P
rodu
ctio
n 81
%
Ital
y Cr
ude
Petr
oleu
m a
nd N
atur
al G
as P
rodu
ctio
n 87
%
Mol
dova
Ru
ssia
Be
vera
gein
dust
ries
40
%
Russ
ia
Agr
icul
ture
and
live
stoc
k pr
oduc
tion
24
%
Mor
occo
Fr
ance
M
anuf
actu
re o
f wea
ring
app
arel
, exc
ept f
ootw
ear
39%
Fr
ance
M
anuf
actu
re o
f ele
ctri
cal m
achi
nery
app
arat
us…
25
%
Syri
a G
erm
any
Cr
ude
Petr
oleu
m a
nd N
atur
al G
as P
rodu
ctio
n 87
%
Ger
man
y
Crud
e Pe
trol
eum
and
Nat
ural
Gas
Pro
duct
ion
91%
Tu
nisi
a Fr
ance
M
anuf
actu
re o
f wea
ring
app
arel
, exc
ept f
ootw
ear
55%
Fr
ance
M
anuf
actu
re o
f ele
ctri
cal m
achi
nery
app
arat
us…
38
%
Ukr
aine
Tu
rkey
Ir
on a
nd s
teel
bas
ic in
dust
ries
38%
Ru
ssia
M
anuf
actu
re o
f tra
nspo
rteq
uipm
ent
21%
EU
27 m
arke
t 19
95
20
10
Be
st d
esti
nati
on
Best
sec
tor
in t
he b
est
dest
inat
ion
Best
sec
tor
shar
e Be
st d
esti
nati
on
Best
sec
tor
in t
he b
est
dest
inat
ion
Best
sec
tor
shar
e A
lger
ia
Ital
y Cr
ude
Petr
oleu
m a
nd N
atur
al G
as P
rodu
ctio
n 75
%
Ital
y Cr
ude
Petr
oleu
m a
nd N
atur
al G
as P
rodu
ctio
n 91
%
Arm
enia
Be
nelu
x
Oth
er M
anuf
actu
ring
Indu
stri
es
79%
Bu
lgar
ia
Met
al O
re M
inin
g 10
0%
Aze
rbai
jan
Ital
y A
gric
ultu
re a
nd li
vest
ock
prod
ucti
on
57%
It
aly
Crud
e Pe
trol
eum
and
Nat
ural
Gas
Pro
duct
ion
99%
Be
laru
s G
erm
any
M
anuf
actu
re o
f ind
ustr
ial c
hem
ical
s 29
%
Net
herla
nds
Pe
trol
eum
refin
erie
s 98
%
Egyp
t It
aly
Crud
e Pe
trol
eum
and
Nat
ural
Gas
Pro
duct
ion
51%
It
aly
Crud
e Pe
trol
eum
and
Nat
ural
Gas
Pro
duct
ion
34%
G
eorg
ia
Ital
y Ir
on a
nd s
teel
bas
ic in
dust
ries
59%
Bu
lgar
ia
Met
al O
re M
inin
g 92
%
Isra
el
UK
O
ther
Min
ing
15%
Be
nelu
x
Oth
erM
inin
g 40
%
Jord
an
Ital
y O
ther
Min
ing
29%
It
aly
Non
-fer
rous
met
al b
asic
indu
stri
es
50%
Le
bano
n Fr
ance
M
anuf
actu
re o
f wea
ring
app
arel
, exc
ept f
ootw
ear
31%
Fr
ance
M
anuf
actu
re o
f mac
hine
ry e
xcep
t ele
ctri
cal
84%
Li
bya
Ital
y Cr
ude
Petr
oleu
m a
nd N
atur
al G
as P
rodu
ctio
n 81
%
Ital
y Cr
ude
Petr
oleu
m a
nd N
atur
al G
as P
rodu
ctio
n 87
%
Mol
dova
Ro
man
ia
Food
man
ufac
turi
ng
53%
Ro
man
ia
Man
ufac
ture
of e
lect
rica
l mac
hine
ry a
ppar
atus
…
34%
M
oroc
co
Fran
ce
Man
ufac
ture
of w
eari
ng a
ppar
el, e
xcep
t foo
twea
r 39
%
Fran
ce
Man
ufac
ture
of e
lect
rica
l mac
hine
ry a
ppar
atus
…
25%
Sy
ria
Ger
man
y
Crud
e Pe
trol
eum
and
Nat
ural
Gas
Pro
duct
ion
87%
G
erm
any
Cr
ude
Petr
oleu
m a
nd N
atur
al G
as P
rodu
ctio
n 91
%
Tuni
sia
Fran
ce
Man
ufac
ture
of w
eari
ng a
ppar
el, e
xcep
t foo
twea
r 55
%
Fran
ce
Man
ufac
ture
of e
lect
rica
l mac
hine
ry a
ppar
atus
…
38%
U
krai
ne
Ital
y Ir
on a
nd s
teel
bas
ic in
dust
ries
34%
It
aly
Iron
and
ste
el b
asic
indu
strie
s 61
%
Sour
ce: O
wn
elab
orat
ions
on
CEPI
I - B
ACI D
ataB
ase
(201
2)

-33-
Table 15: Export Herfindahl index (sectorial diversification)
1995
world market EU27 market BRICS market best world destination best EU27 destination best BRICS destination
Algeria 0.4735 0.5741 0.2575 0.5853 0.5853 0.4977
Armenia 0.1924 0.2770 0.7704 0.6519 0.6519 1.0000
Azerbaijan 0.1889 0.2101 0.8437 0.1836 0.4510 1.0000
Belarus 0.1313 0.1346 0.1217 0.1566 0.1566 0.1172
Egypt 0.1449 0.1802 0.3510 0.2764 0.2764 0.8515
Georgia 0.3392 0.1439 0.1916 0.6676 0.4217 0.2544
Israel 0.0974 0.0564 0.0922 0.1921 0.0601 0.0900
Jordan 0.1271 0.1245 0.4731 0.5602 0.2062 0.4831
Lebanon 0.0631 0.0472 0.1504 0.1461 0.1272 0.2744
Libya 0.6267 0.6799 0.7200 0.6693 0.6693 0.9993
Moldova 0.1324 0.1628 0.2320 0.2334 0.2780 0.2334
Morocco 0.1087 0.1422 0.6715 0.1913 0.1913 0.8563
Syria 0.4167 0.5517 0.5692 0.7518 0.7518 0.6816
Tunisia 0.1753 0.2439 0.8993 0.3108 0.3108 0.9854
Ukraine 0.1022 0.0658 0.4908 0.2289 0.1471 0.4007
2010
world market EU27 market BRICS market best world destination best EU27 destination best BRICS destination
Algeria 0.5587 0.6471 0.4571 0.6015 0.8298 0.7937
Armenia 0.1220 0.2167 0.2091 0.3086 0.9956 0.3086
Azerbaijan 0.7987 0.9548 0.3472 0.9789 0.9789 0.2207
Belarus 0.1126 0.4034 0.0898 0.0962 0.9508 0.0962
Egypt 0.0674 0.1195 0.1747 0.1488 0.1488 0.4838
Georgia 0.0756 0.1374 0.1221 0.2584 0.8503 0.2403
Israel 0.0870 0.0599 0.1193 0.2031 0.1829 0.1690
Jordan 0.0842 0.1052 0.5406 0.0774 0.3048 0.5052
Lebanon 0.0724 0.1735 0.8288 0.6016 0.6942 0.9649
Libya 0.7872 0.8223 0.9695 0.7620 0.7620 0.9757
Moldova 0.0743 0.0874 0.0874 0.0950 0.1388 0.0950
Morocco 0.0891 0.1060 0.3340 0.1371 0.1371 0.7278
Syria 0.2730 0.7550 0.1480 0.8274 0.8274 0.7797
Tunisia 0.0875 0.1216 0.3619 0.1761 0.1761 0.8116
Ukraine 0.0833 0.0761 0.0661 0.0782 0.3743 0.0782
Source: Own elaborations on CEPII - BACI DataBase (2012)

-34-
Tabl
e 16
: Bes
t sec
tor
in th
e be
st o
rigin
wor
ld m
arke
t
1995
2010
Be
st o
rigi
n Be
st s
ecto
r in
the
bes
t or
igin
Be
st s
ecto
r sh
are
Best
ori
gin
Best
sec
tor
in t
he b
est
orig
in
Best
sec
tor
shar
e A
lger
ia
Fran
ce
Man
ufac
ture
of t
rans
port
equi
pmen
t 17
%
Fran
ce
Man
ufac
ture
of t
rans
port
equi
pmen
t 17
%
Arm
enia
U
sa &
Pue
rto
Rico
A
gric
ultu
re a
nd li
vest
ock
prod
ucti
on
69%
Ru
ssia
Cr
ude
Petr
oleu
m a
nd N
atur
al G
as P
rodu
ctio
n 31
%
Aze
rbai
jan
Turk
ey
Food
man
ufac
turi
ng
45%
Ru
ssia
M
anuf
actu
re o
f tra
nspo
rteq
uipm
ent
14%
Be
laru
s G
erm
any
M
anuf
actu
re o
f mac
hine
ry e
xcep
t ele
ctri
cal
18%
Ru
ssia
Cr
ude
Petr
oleu
m a
nd N
atur
al G
as P
rodu
ctio
n 53
%
Egyp
t U
sa &
Pue
rto
Rico
A
gric
ultu
re a
nd li
vest
ock
prod
ucti
on
43%
U
sa &
Pue
rto
Rico
A
gric
ultu
re a
nd li
vest
ock
prod
ucti
on
29%
G
eorg
ia
Turk
ey
Food
man
ufac
turi
ng
54%
Tu
rkey
M
anuf
actu
re o
f oth
er c
hem
ical
pro
duct
s 11
%
Isra
el
Usa
& P
uert
o Ri
co
Man
ufac
ture
of e
lect
rica
l mac
hine
ry a
ppar
atus
…
22%
U
sa &
Pue
rto
Rico
M
anuf
actu
re o
f mac
hine
ry e
xcep
t ele
ctri
cal
17%
Jo
rdan
U
sa &
Pue
rto
Rico
A
gric
ultu
re a
nd li
vest
ock
prod
ucti
on
36%
Sa
udi A
rabi
a
Crud
e Pe
trol
eum
and
Nat
ural
Gas
Pro
duct
ion
54%
Le
bano
n It
aly
Man
ufac
ture
of m
achi
nery
exc
ept e
lect
rica
l 15
%
Usa
& P
uert
o Ri
co
Petr
oleu
mre
finer
ies
41%
Li
bya
Ital
y Pe
trol
eum
refin
erie
s 19
%
Ital
y Pe
trol
eum
refin
erie
s 37
%
Mol
dova
Ru
ssia
Cr
ude
Petr
oleu
m a
nd N
atur
al G
as P
rodu
ctio
n 35
%
Ukr
aine
Fo
od m
anuf
actu
ring
19
%
Mor
occo
Fr
ance
M
anuf
actu
re o
f tex
tiles
14
%
Fran
ce
Man
ufac
ture
of t
rans
port
equi
pmen
t 15
%
Syri
a It
aly
Man
ufac
ture
of m
achi
nery
exc
ept e
lect
rica
l 43
%
Chin
a
M
anuf
actu
re o
f mac
hine
ry e
xcep
t ele
ctri
cal
16%
Tu
nisi
a Fr
ance
M
anuf
actu
re o
f tex
tiles
18
%
Fran
ce
Man
ufac
ture
of e
lect
rica
l mac
hine
ry a
ppar
atus
…
19%
U
krai
ne
Ger
man
y
Man
ufac
ture
of m
achi
nery
exc
ept e
lect
rica
l 23
%
Russ
ia
Crud
e Pe
trol
eum
and
Nat
ural
Gas
Pro
duct
ion
53%
EU
27 m
arke
t 19
95
20
10
Be
st o
rigi
n Be
st s
ecto
r in
the
bes
t or
igin
Be
st s
ecto
r sh
are
Best
ori
gin
Best
sec
tor
in t
he b
est
orig
in
Best
sec
tor
shar
e A
lger
ia
Fran
ce
Man
ufac
ture
of t
rans
port
equi
pmen
t 17
%
Fran
ce
Man
ufac
ture
of t
rans
port
equi
pmen
t 17
%
Arm
enia
G
erm
any
N
on-f
erro
us m
etal
bas
ic in
dust
ries
46
%
Ger
man
y
Man
ufac
ture
of m
achi
nery
exc
ept e
lect
rica
l 27
%
Aze
rbai
jan
Ger
man
y
Food
man
ufac
turi
ng
20%
G
erm
any
M
anuf
actu
re o
f tra
nspo
rteq
uipm
ent
31%
Be
laru
s G
erm
any
M
anuf
actu
re o
f mac
hine
ry e
xcep
t ele
ctri
cal
18%
G
erm
any
M
anuf
actu
re o
f mac
hine
ry e
xcep
t ele
ctri
cal
34%
Eg
ypt
Ger
man
y
Man
ufac
ture
of m
achi
nery
exc
ept e
lect
rica
l 27
%
Ger
man
y
Man
ufac
ture
of m
achi
nery
exc
ept e
lect
rica
l 27
%
Geo
rgia
Ro
man
ia
Petr
oleu
mre
finer
ies
98%
G
erm
any
M
anuf
actu
re o
f tra
nspo
rteq
uipm
ent
31%
Is
rael
Be
nelu
x
Oth
erM
inin
g 70
%
Bene
lux
O
ther
Min
ing
38%
Jo
rdan
G
erm
any
M
anuf
actu
re o
f mac
hine
ry e
xcep
t ele
ctri
cal
22%
G
erm
any
M
anuf
actu
re o
f mac
hine
ry e
xcep
t ele
ctri
cal
34%
Le
bano
n It
aly
Man
ufac
ture
of m
achi
nery
exc
ept e
lect
rica
l 15
%
Ital
y Pe
trol
eum
refin
erie
s 35
%
Liby
a It
aly
Petr
oleu
mre
finer
ies
19%
It
aly
Petr
oleu
mre
finer
ies
37%
M
oldo
va
Ger
man
y
Man
ufac
ture
of m
achi
nery
exc
ept e
lect
rica
l 24
%
Rom
ania
Pe
trol
eum
refin
erie
s 43
%
Mor
occo
Fr
ance
M
anuf
actu
re o
f tex
tiles
14
%
Fran
ce
Man
ufac
ture
of t
rans
port
equi
pmen
t 15
%
Syri
a It
aly
Man
ufac
ture
of m
achi
nery
exc
ept e
lect
rica
l 43
%
Ital
y Pe
trol
eum
refin
erie
s 47
%
Tuni
sia
Fran
ce
Man
ufac
ture
of t
extil
es
18%
Fr
ance
M
anuf
actu
re o
f ele
ctri
cal m
achi
nery
app
arat
us…
19
%
Ukr
aine
G
erm
any
M
anuf
actu
re o
f mac
hine
ry e
xcep
t ele
ctri
cal
23%
G
erm
any
M
anuf
actu
re o
f mac
hine
ry e
xcep
t ele
ctri
cal
19%
Sour
ce: O
wn
elab
orat
ions
on
CEPI
I - B
ACI D
ataB
ase
(201
2)

-35-
Table 17: Import Herfindahl index (sectorial diversification)
1995
world market EU27 market BRICS market best world origin best EU27 origin best BRICS origin
Algeria 0.0699 0.0687 0.0844 0.0894 0.0894 0.0937
Armenia 0.1728 0.1199 0.2358 0.5308 0.3177 0.2719
Azerbaijan 0.1369 0.1301 0.2466 0.2088 0.0881 0.3594
Belarus 0.0482 0.0483 0.1197 0.0748 0.0748 0.1416
Egypt 0.0582 0.0663 0.0590 0.2220 0.1130 0.0483
Georgia 0.1724 0.1696 0.2630 0.3299 0.9591 0.4676
Israel 0.0556 0.0636 0.0753 0.0974 0.4845 0.1070
Jordan 0.0448 0.0636 0.0816 0.1618 0.0959 0.0536
Lebanon 0.0344 0.0374 0.0843 0.0487 0.0487 0.0714
Libya 0.0563 0.0688 0.2155 0.0833 0.0833 0.4458
Moldova 0.0510 0.0529 0.1679 0.1709 0.1004 0.1709
Morocco 0.0429 0.0561 0.0804 0.0647 0.0647 0.1825
Syria 0.0692 0.0949 0.0723 0.1900 0.1900 0.1256
Tunisia 0.0503 0.0687 0.0738 0.0696 0.0696 0.1499
Ukraine 0.0428 0.0436 0.0855 0.0811 0.0811 0.1034
2010
world market EU27 market BRICS market best world origin best EU27 origin best BRICS origin
Algeria 0.0704 0.0714 0.0810 0.0943 0.0943 0.0925
Armenia 0.0333 0.0555 0.0596 0.1190 0.1077 0.1190
Azerbaijan 0.0509 0.0894 0.0543 0.0561 0.1552 0.0561
Belarus 0.1041 0.0969 0.2264 0.2805 0.1519 0.2805
Egypt 0.0463 0.0655 0.0493 0.1160 0.1153 0.0643
Georgia 0.0463 0.0881 0.0564 0.0419 0.1313 0.0615
Israel 0.0440 0.0568 0.0534 0.0696 0.1879 0.0579
Jordan 0.0444 0.0765 0.0454 0.3137 0.1699 0.0701
Lebanon 0.0520 0.0730 0.0398 0.2205 0.1290 0.0613
Libya 0.0581 0.0886 0.0542 0.1684 0.1684 0.0734
Moldova 0.0353 0.0489 0.0894 0.0621 0.1871 0.2242
Morocco 0.0441 0.0507 0.0596 0.0671 0.0671 0.1271
Syria 0.0490 0.0756 0.0507 0.0682 0.2461 0.0682
Tunisia 0.0491 0.0556 0.0753 0.0785 0.0785 0.1686
Ukraine 0.0556 0.0514 0.1693 0.2866 0.0743 0.2866
Source: Own elaborations on CEPII - BACI DataBase (2012)
7. CONCLUSIONS
The patterns of economic interaction between EU and its neighboring countries (ENCs) in terms of trade
have changed during last fifteen years. Certainly, an essential role has been played by the European
Neighborhood Policy (ENP), which has been introduced starting from 2004. Almost all fifteen ENCs have
signed or are going to conclude an association agreement with the EU and are deepening their trade
relationships in order to open up extra agricultural trade, to liberalize trade in services and investment, to
negotiate agreements on accreditation and acceptance of industrial products, to create deep and
comprehensive free trade areas.

-36-
The point is that despite all these efforts the ENCs don't play a key role in European trade. They are smaller
than EU members but other small countries, such as Norway and Switzerland, are among the 10 best EU
partners. They are poorer than Europe, but they also have all the advantages from proximity. Therefore we
say unexpectedly Europe is losing its primary position in neighboring’s' markets.
The ENCs export to EU27 have grown over the years, especially starting from 2004 when, as mentioned
above, the bilateral relationships between the EU and its neighboring countries were strengthened. With
respect to the EU15, the ENCs switched from a net importers role to a net exporters position; looking at
EU12 market, the ENCs have always been importers. Data show that the BRICs are gaining strength over
Europe and are expanding into those regions where EU27 had the primacy.
Splitting neighboring countries into sub-regions helped us to investigate ENCs regional performance and
how trade dynamics are deployed. We distinguished Eastern from Southern countries, but we took
considered separately the Middle-East and within this group Israel.
Over the fifteen years the ENCs have increased their intra-regional trade: while at the beginning of the
period trade among the sub-regions was almost non-existent, over the years it has grown steadily and for
Eastern and Middle-East countries it has doubled. Eastern and, inter alia, Southern countries have
experienced the highest exports and imports growth in both EU15 and EU12 market; looking at levels it is
the Southern countries which export and import more than the other sub-regions in the old EU member
states.
Despite such clear increasing trends the EU has to face important competitors in the world arena. BRICS,
USA and the Rest of World group are gaining shares undermining European importance. The EU continues
to be the main destination largely for primary products commodities and this is particularly true when
looking at its east borders. Capital goods, i.e. products which are more likely to embody knowledge, are still
imported primarily from the Old European countries but ENCs are exporting them mainly to the emerging
economies. When looking at semi-finished products, the geographical map appropriate for understanding
the creation of value (i.e. products which need further processing or assembly) include Europe. Anyway,
European countries tend to sell more than buy semi-finished goods.
The final part of the report looks at the concentration in trade flows. There are well known risks (political
and economic, Collier, 2002) in concentrating exports on a few primary commodities; it exposes a country
to the negative effects of the unfavorable characteristics of world demand and negative supply side
features of these primary products. Also concentrating the entire export activity to a few destinations
imposes risks for its continuity.
We have analyzed both geographical and sectorial diversification, putting together the two important
pieces of information. We know which are the best EU27 and world partners for all the 15 countries
bordering the European Union. Little has changed over time and most of countries continue to trade firstly

-37-
with a EU member state. But the degree of concentration where energy is the main export product, is very
high and normally EU neighbors show better export differentiation in markets other than the EU.

-38-
REFERENCES
Ali R., Alwang J.R. and Siegel P. B. (1991), Is export diversification the best way to achieve export growth
and stability? A look at three African Countries, World Bank Working Papers No. 729, 1991
Berthelemy J.C. and Chauvin S. (2000), Structural changes in Asia and growth prospects after the crisis,
CEPII Working papers ,No. 00-09, 2000
Cadot O., Carrère C. and Strauss-Khan V. (2007), Export diversification: what's behind the hump?, Working
Paper 200724, CERDI
Collier P. (2002), Primary commodity dependence and Africa’s future, Annual Bank Conference on
Development Economics, Proceedings 2002, edited by B. Pleskovic and N. Stern. New York: OUP.
Eaton J. and Kortum S. (2000), Trade in capital goods, European Economic Review, Vol. 45, No. 1, 2001, pp.
1195-1235
Easterly W., Reshef A. and Schwenkenberg J. (2009), The power of exports, policy research, Working Paper
Series 5081, The World Bank
Imbs J. and Wacziarg R. (2003), Stages of diversification, American Economic Review, American Economic
Association, Vol. 93(1), pp. 63-86, March
Miroudot, S., Lanz R. and Ragoussis A. (2009), Trade in intermediate goods and services, OECD Trade
Policy Papers, No. 93, OECD Publishing.
Montero Luque I. and Peeters M. (2009), Euro-Mediterranean process - Union for the Mediterranean:
Macroeconomic and financial developments during the global crisis at the southern rim of the
Mediterranean, MPRA Paper 23858, University Library of Munich, Germany, revised July 2010
Ricardo D. (1817) Principles of political economy and taxation, ed. R.M. Hartwell, Penguin, Hammondsport,
1971
Smith A. (1776), The wealth of nations, ed. E. Cannan, 2 vols, Methuen, London
Stehrer R., Ali-Yrkkö J., Hanzl-Weiss D., Foster N., Rouvinen P., Seppälä T., Stöllinger R. and Ylä-Anttila P.
(2011), Trade in intermediate products and EU manufacturing supply chains, wiiw Research Reports 369,
The Vienna Institute for International Economic Studies, wiiw
Wesselink E. and Boschma R. (2011), Taking Stock of Research Projects on the European Neighbourhood
Policy, WP1/01 SEARCH WORKING PAPER
Wesselink E. and Boschma R. (2012), Overview of the European Neighbourhood Policy: Its History,
Structure, and Implemented Policy Measures, , WP1/04 SEARCH WORKING PAPER
WTO (2010), World Trade Report 2010, World Trade Organization, Geneva
WEBSITES
http://ec.europa.eu/trade/creating-opportunities/bilateral-relations/
http://trade.ec.europa.eu/doclib/docs/2006/december/tradoc_118238.pdf

-39-
APPENDIX

-40-
Graph A1 ENCs sub-regions exports to EU15 by stage
81012141618
81012141618
1995 2000 2005 2010 1995 2000 2005 2010 1995 2000 2005 2010
1995 2000 2005 2010 1995 2000 2005 2010
C K P
PD T
log_
valu
es
EASTERN Exports
81012141618
81012141618
1995 2000 2005 2010 1995 2000 2005 2010 1995 2000 2005 2010
1995 2000 2005 2010 1995 2000 2005 2010
C K P
PD T
log_
valu
es
SOUTHERN exports
81012141618
81012141618
1995 2000 2005 2010 1995 2000 2005 2010 1995 2000 2005 2010
1995 2000 2005 2010 1995 2000 2005 2010
C K P
PD T
log_
valu
es
MIDDLE-EAST exports
81012141618
81012141618
1995 2000 2005 2010 1995 2000 2005 2010 1995 2000 2005 2010
1995 2000 2005 2010 1995 2000 2005 2010
C K P
PD T
log_
valu
es
Israel exports
Source: Own elaborations on CEPII - BACI DataBase (2012)
ENCs sub-regions exports to EU15
Graph A2 Sub-regions ENC exports to EU12 by stage
68
1012141618
68
1012141618
1995 2000 2005 2010 1995 2000 2005 2010 1995 2000 2005 2010
1995 2000 2005 2010 1995 2000 2005 2010
C K P
PD T
log_
valu
es
EASTERN exports
68
1012141618
68
1012141618
1995 2000 2005 2010 1995 2000 2005 2010 1995 2000 2005 2010
1995 2000 2005 2010 1995 2000 2005 2010
C K P
PD T
log_
valu
es
SOUTHERN exports
68
1012141618
68
1012141618
1995 2000 2005 2010 1995 2000 2005 2010 1995 2000 2005 2010
1995 2000 2005 2010 1995 2000 2005 2010
C K P
PD T
log_
valu
es
MIDDLE-EAST exports
68
1012141618
68
1012141618
1995 2000 2005 2010 1995 2000 2005 2010 1995 2000 2005 2010
1995 2000 2005 2010 1995 2000 2005 2010
C K P
PD T
log_
valu
es
Israel exports
Source: Own elaborations on CEPII - BACI DataBase (2012)
ENCs sub-regions exports to EU12

-41-
Graph A3 ENCs sub-regions imports from EU15 by stage
12141618
12141618
1995 2000 2005 2010 1995 2000 2005 2010 1995 2000 2005 2010
1995 2000 2005 2010 1995 2000 2005 2010
C K P
PD T
log_
valu
es
EASTERN imports
12141618
12141618
1995 2000 2005 2010 1995 2000 2005 2010 1995 2000 2005 2010
1995 2000 2005 2010 1995 2000 2005 2010
C K P
PD T
log_
valu
es
SOUTHERN imports
12141618
12141618
1995 2000 2005 2010 1995 2000 2005 2010 1995 2000 2005 2010
1995 2000 2005 2010 1995 2000 2005 2010
C K P
PD T
log_
valu
es
MIDDLE-EAST imports
12141618
12141618
1995 2000 2005 2010 1995 2000 2005 2010 1995 2000 2005 2010
1995 2000 2005 2010 1995 2000 2005 2010
C K P
PD T
log_
valu
es
Israel imports
Source: Own elaborations on CEPII - BACI DataBase (2012)
ENCs sub-regions imports from EU15
Graph A4 ENCs sub-regions imports from EU12 by stage
10111213141516
10111213141516
1995 2000 2005 2010 1995 2000 2005 2010 1995 2000 2005 2010
1995 2000 2005 2010 1995 2000 2005 2010
C K P
PD T
log_
valu
es
EASTERN Imports
10111213141516
10111213141516
1995 2000 2005 2010 1995 2000 2005 2010 1995 2000 2005 2010
1995 2000 2005 2010 1995 2000 2005 2010
C K P
PD T
log_
valu
es
SOUTHERN imports
10111213141516
10111213141516
1995 2000 2005 2010 1995 2000 2005 2010 1995 2000 2005 2010
1995 2000 2005 2010 1995 2000 2005 2010
C K P
PD T
log_
valu
es
MIDDLE-EAST imports
10111213141516
10111213141516
1995 2000 2005 2010 1995 2000 2005 2010 1995 2000 2005 2010
1995 2000 2005 2010 1995 2000 2005 2010
C K P
PD T
log_
valu
es
Israel imports
Source: Own elaborations on CEPII - BACI DataBase (2012)
ENCs sub-regions imports from EU12

-42-

-43-
Tabl
e A1
: EN
Cs s
ub-r
egio
ns s
tage
exp
orts
yea
rly
grow
th r
ates
in 3
sub
-per
iods
: 199
5-19
99; 2
000-
2004
; 200
5-20
10
1995
-199
9 20
00-2
004
2005
-201
0
C K
P PD
T
C K
P PD
T
C K
P PD
T
East
ern
EU27
8%
26%
15
%
20%
5%
18
%
29%
14
%
30%
27
%
4%
7%
37%
10
%
7%
Sout
hern
3%
12
%
3%
12%
1%
11
%
12%
12
%
16%
8%
4%
13
%
13%
7%
10
%
Mid
dle-
East
6%
7%
3%
2%
4%
14
%
21%
2%
25
%
7%
-4%
67
%
11%
15
%
14%
Isra
el
4%
10%
4%
16
%
5%
8%
-3%
7%
-2
%
4%
9%
6%
3%
6%
6%
East
ern
EU15
8%
25%
30
%
27%
4%
18
%
52%
10
%
26%
34
%
-1%
3%
41
%
10%
6%
Sout
hern
3%
12
%
3%
11%
1%
11
%
13%
12
%
17%
8%
4%
13
%
13%
7%
9%
Mid
dle-
East
6%
9%
3%
0%
11
%
15%
23
%
1%
26%
7%
-4
%
71%
11
%
15%
15
%
Isra
el
4%
9%
4%
16%
5%
8%
-3
%
8%
-2%
4%
9%
5%
3%
5%
5%
East
ern
EU12
6%
31%
2%
16
%
9%
20%
27
%
20%
39
%
21%
17
%
14%
28
%
11%
11
%
Sout
hern
4%
11
%
-13%
81
%
-7%
21
%
33%
6%
2%
21
%
17%
36
%
14%
31
%
26%
Mid
dle-
East
8%
9%
74
%
161%
-1
3%
6%
11%
27
%
36%
14
%
-5%
17
%
7%
23%
6%
Isra
el
3%
18%
6%
11
%
4%
11%
-4
%
2%
7%
12%
15
%
11%
-1
%
15%
14
%
East
ern
BRIC
S
142%
58
7%
125%
17
21%
90
%
18%
17
%
23%
9%
15
%
13%
25
%
67%
16
%
14%
Sout
hern
-1
%
1%
25%
11
0%
14%
22
%
50%
28
%
39%
-4
%
28%
21
8%
18%
5%
35
%
Mid
dle-
East
11
%
31%
40
%
20%
18
%
18%
13
7%
35%
51
1%
11%
22
%
40%
15
%
64%
35
%
Isra
el
-17%
3%
34
%
7%
12%
19
%
12%
12
%
34%
19
%
30%
11
%
8%
23%
31
%
East
ern
USA
10%
48
%
67%
31
%
15%
11
%
14%
22
%
257%
15
%
-10%
-1
0%
164%
13
%
41%
Sout
hern
12
%
8%
-4%
25
%
6%
4%
9%
59%
-2
%
12%
13
%
32%
13
%
13%
4%
Mid
dle-
East
7%
15
2%
19%
22
42%
13
2%
68%
-1
9%
51%
18
%
32%
-6
%
5%
147%
-1
2%
31%
Isra
el
7%
15%
6%
7%
16
%
7%
-6%
3%
-4
%
8%
19%
7%
33
%
12%
3%
East
ern
REST
OF
WO
RLD
85%
83
%
29%
20
9%
28%
30
%
35%
20
%
36%
24
%
26%
8%
43
%
9%
12%
Sout
hern
4%
24
%
3%
37%
11
%
6%
17%
21
%
18%
5%
27
%
16%
10
%
8%
29%
Mid
dle-
East
15
%
106%
3%
38
%
11%
18
%
42%
12
%
76%
42
%
19%
17
%
11%
30
%
16%
Isra
el
-1%
11
%
21%
13
%
-4%
6%
7%
10
%
-4%
7%
14
%
7%
21%
15
%
10%
Sour
ce: O
wn
elab
orat
ions
on
CEPI
I - B
ACI D
ataB
ase
(201
2)

-44-
Tabl
e A2
EN
Cs s
ub-r
egio
ns s
tage
impo
rts
year
ly g
row
th r
ates
in 3
sub
-per
iods
: 199
5-19
99; 2
000-
2004
; 200
5-20
10
1995
-199
9 20
00-2
004
2005
-201
0
C K
P PD
T
C K
P PD
T
C K
P PD
T
East
ern
EU27
-5%
7%
-8
%
6%
11%
24
%
31%
7%
32
%
20%
16
%
13%
10
%
13%
15
%
Sout
hern
3%
5%
-2
%
5%
-2%
11
%
12%
7%
13
%
11%
10
%
10%
24
%
12%
14
%
Mid
dle-
East
1%
-1
%
10%
-5
%
-5%
7%
24
%
4%
9%
12%
10
%
5%
14%
11
%
12%
Isra
el
1%
3%
3%
1%
-6%
-2
%
3%
4%
0%
6%
11%
7%
-6
%
4%
5%
East
ern
EU15
-4%
9%
8%
10
%
16%
25
%
33%
10
%
30%
20
%
16%
10
%
8%
9%
11%
Sout
hern
3%
6%
-3
%
5%
-1%
11
%
12%
6%
13
%
11%
10
%
10%
27
%
12%
14
%
Mid
dle-
East
1%
0%
15
%
-5%
-3
%
8%
23%
-1
%
9%
11%
10
%
4%
15%
11
%
9%
Isra
el
1%
3%
3%
1%
-6%
-2
%
3%
4%
0%
5%
8%
6%
-7%
4%
5%
East
ern
EU12
-6%
1%
-1
9%
-1%
5%
22
%
24%
6%
35
%
19%
17
%
22%
15
%
22%
20
%
Sout
hern
1%
0%
3%
14
%
-8%
16
%
20%
24
%
9%
7%
21%
19
%
3%
21%
28
%
Mid
dle-
East
9%
-8
%
-8%
8%
-1
3%
1%
36%
26
%
16%
21
%
15%
14
%
49%
14
%
37%
Isra
el
7%
9%
16%
10
%
-7%
16
%
11%
-4
%
12%
23
%
38%
24
%
33%
18
%
12%
East
ern
BRIC
S
99%
76
6%
1027
%
383%
22
5%
38%
29
%
19%
27
%
22%
19
%
24%
16
%
17%
23
%
Sout
hern
16
%
17%
8%
21
%
-1%
19
%
39%
35
%
23%
18
%
21%
33
%
18%
23
%
24%
Mid
dle-
East
20
%
26%
-1
%
20%
7%
27
%
50%
1%
27
%
34%
18
%
22%
31
%
14%
18
%
Isra
el
19%
14
%
21%
36
%
18%
15
%
28%
11
%
19%
14
%
18%
22
%
12%
24
%
11%
East
ern
USA
67%
31
%
10%
13
%
17%
16
%
4%
16%
24
%
7%
22%
18
%
80%
3%
15
%
Sout
hern
6%
7%
-5
%
6%
-4%
-3
%
-3%
2%
4%
7%
25
%
10%
31
%
7%
29%
Mid
dle-
East
-2
%
3%
-5%
2%
2%
5%
10
%
19%
2%
10
%
16%
10
%
24%
19
%
41%
Isra
el
-1%
14
%
0%
12%
1%
-5
%
0%
7%
-1%
8%
9%
-1
%
5%
0%
8%
East
ern
REST
OF
WO
RLD
21%
30
%
1496
%
38%
66
%
22%
22
%
17%
23
%
21%
25
%
22%
8%
7%
24
%
Sout
hern
10
%
10%
1%
6%
5%
11
%
18%
2%
11
%
9%
16%
23
%
19%
20
%
23%
Mid
dle-
East
7%
6%
48
%
8%
9%
18%
22
%
66%
11
%
22%
17
%
5%
6%
10%
12
%
Isra
el
4%
4%
8%
10%
7%
7%
4%
27
%
0%
9%
11%
7%
-2
%
9%
10%
Sour
ce: O
wn
elab
orat
ions
on
CEPI
I - B
ACI D
ataB
ase
(201
2)