A Quantitative Overview to Gene Expression Profiling in Animal Genetics


Animal Cell Technology:From Biopharmaceuticalsto Gene Therapy


Animal Cell Technology:From Biopharmaceuticalsto Gene Therapy
Edited by
Leda R. CastilhoCell Culture Engineering Laboratory, Chemical EngineeringProgram – COPPE, Federal University of Rio de Janeiro, Brazil
Angela Maria MoraesSchool of Chemical Engineering, Department ofBiotechnological Processes, State University of Campinas, Brazil
Elisabeth F.P. AugustoInstitute of Technological Research of the State of Sao Paulo,Brazil
and
Michael ButlerDepartment of Microbiology, University of Manitoba, Canada

Published by:
Taylor & Francis Group
In US: 270 Madison AvenueNew York, N Y 10016
In UK: 2 Park Square, Milton ParkAbingdon, OX14 4RN
# 2008 by Taylor & Francis Group
ISBN: 978-0-415-42304-5
This book contains information obtained from authentic and highly regarded sources. Reprinted material isquoted with permission, and sources are indicated. A wide variety of references are listed. Reasonable effortshave been made to publish reliable data and information, but the author and the publisher cannot assumeresponsibility for the validity of all materials or for the consequences of their use.
All rights reserved. No part of this book may be reprinted, reproduced, transmitted, or utilized in any formby any electronic, mechanical, or other means, now known or hereafter invented, including photocopying,microfilming, and recording, or in any information storage or retrieval system, without written permissionfrom the publishers.
A catalog record for this book is available from the British Library.
Library of Congress Cataloging-in-Publication Data
Library of Congress Cataloging-in-Publication DataAnimal cell technology : from biopharmaceuticals to gene therapy / edited by Leda R. Castilho ... [et al.].p. ; cm.Includes bibliographical references and index.ISBN 978-0-415-42304-5 (alk. paper)1. Animal cell biotechnology. I. Castilho, Leda dos Reis.[DNLM: 1. Cells, Cultured. 2. Animals. 3. Biotechnology. 4. Cell Culture Techniques–veterinary. QU 300A598 2008]TP248.27.A53A5453 2008660.6–dc22
2007042273
Senior Editor: Elizabeth OwenEditorial Assistant: Kirsty LyonsSenior Production Editor: Simon Hill
10 9 8 7 6 5 4 3 2 1
Taylor & Francis Group, an informa business Visit our web site at http://www.garlandscience.com
This edition published in the Taylor & Francis e-Library, 2008.
“To purchase your own copy of this or any of Taylor & Francis or Routledge’s
collection of thousands of eBooks please go to www.eBookstore.tandf.co.uk.”
ISBN 0-203-89516-9 Master e-book ISBN

Contents
Contributors xiv
Abbreviations xvi
Foreword xxxv
1 Introduction to animal cell technology 1Paula Marques Alves, Manuel Jose Teixeira Carrondo, and Pedro EstilitaCruz1.1 Landmarks in the culture of animal cells 11.2 Types of animal cell cultures 31.3 Use of animal cells in commercial production 5
1.3.1 Animal cell proteins in human diagnosis and therapy 51.3.2 Cell therapy 71.3.3 Tissue engineering 81.3.4 Gene therapy and DNA vaccines 91.3.5 Applications of animal cells in the development of new products 9
1.4 Conclusions 10References 11
2 Animal cells: basic concepts 13Patrıcia Leo, Adriana Lages Lima Galesi, Claudio Alberto Torres Suazo, andAngela Maria Moraes2.1 Introduction 132.2 Typical structure of an animal cell 13
2.2.1 Plasma membrane 142.2.2 Cytoplasm 152.2.3 Endoplasmic reticulum 152.2.4 Ribosome 162.2.5 Golgi complex 162.2.6 Mitochondria 162.2.7 Lysosome 162.2.8 Peroxisome 172.2.9 Nucleus 17
2.3 Cell culture 172.3.1 Establishing a cell line 172.3.2 Cell line maintenance 20
2.4 Cell growth phases 212.5 Influence of environmental conditions on animal cell culture 24
2.5.1 pH 242.5.2 Osmolality 252.5.3 Temperature 262.5.4 Oxygen supply 26

2.5.5 Composition and nature of the substratum for cell adhesion 272.6 Cryopreservation and storage of cell lines 282.7 Culture quality control and laboratory safety 292.8 Characteristics of the main cell lines employed industrially 302.9 Culture of insect cells 312.10 Use of animal cell culture in cytotoxicity assays 32
2.10.1 Culture methods 332.10.2 Exposure time and active agent concentrations 342.10.3 Recovery time 352.10.4 Cytotoxicity evaluation methods 35
References 36
3 Cloning and expression of heterologous proteins in animalcells 39Mariela Bollati-Fogolın and Marcelo A. Comini3.1 Introduction 393.2 The flow of genetic information and molecular cloning 393.3 Elements required for gene expression in eukaryotic cells 40
3.3.1 Transcriptional control elements 403.3.2 Translational control elements 42
3.4 Systems for heterologous expression in animal cells 443.4.1 Viral vectors 443.4.2 Baculoviruses 483.4.3 Plasmid vectors 50
3.5 Cell lines and biotechnological processes 543.6 Expression in animal cells 54
3.6.1 Transient expression 553.6.2 Stable expression 56
3.7 Introduction of DNA into mammalian cells 583.7.1 Calcium phosphate co-precipitation method 583.7.2 Cationic polymers 593.7.3 Lipid-mediated gene transfer (lipofection) 603.7.4 Electroporation 60
3.8 Selection markers 613.8.1 Morphological changes 613.8.2 Biochemical markers and gene amplification 613.8.3 Reporter markers 64
3.9 Screening, quantitation, and bioassay methods 663.10 Optimizing the initial stage of an animal cell-based bioprocess 66
References 67
4 Cell metabolism and its control in culture 75Paola Amable and Michael Butler4.1 Introduction 754.2 Energy sources 76
4.2.1 Glucose 764.2.2 Glutamine 844.2.3 Amino acids 874.2.4 Lipids 91
vi Animal Cell Technology

4.3 Metabolic byproducts 954.3.1 Lactate 954.3.2 Ammonia 96
4.4 Factors affecting cell metabolism 1014.4.1 Oxygen requirements 1024.4.2 Carbon dioxide 1034.4.3 Temperature 1034.4.4 pH 104
4.5 Conclusions 104References 104
5 Culture media for animal cells 111Angela Maria Moraes, Ronaldo Zucatelli Mendonca, and Claudio AlbertoTorres Suazo5.1 Introduction 1115.2 Main components of animal cell culture media 114
5.2.1. Water 1145.2.2 Glucose 1155.2.3 Amino acids 1165.2.4 Vitamins 1175.2.5 Salts 1175.2.6 Serum 1175.2.7 Other components necessary for cell culture 118
5.3 Advantages and limitations of the use of media supplemented with animalserum 121
5.4 Strategies to formulate serum-free culture media 122References 125
6 Post-translational modification of recombinant proteins 129Michael Butler6.1 Introduction 1296.2 Glycan structures attached to proteins 130
6.2.1 N-glycans 1306.2.2 O-linked glycans 1336.2.3 Patterns of glycosylation in nonmammalian cells 1346.2.4 Glycosylation in animal cells: the effect of the host cell line 1376.2.5 Culture parameters that may affect glycosylation 137
6.3 Other forms of post-translational modification 1386.3.1 Deamidation 1386.3.2 Deamination 1396.3.3 Glycation 1396.3.4 Gamma-carboxylation 1406.3.5 C-terminal modifications 1426.3.6 Hydroxylation 142
6.4 Conclusions 142Acknowledgments 143References 143
Contents vii

7 Mechanisms of cell proliferation and cell death in animal cell culture in vitro 147Maıra Peixoto Pellegrini, Rodrigo Coelho Ventura Pinto, and Leda dos ReisCastilho7.1 Introduction 1477.2 Cell proliferation mechanisms 1477.3 Cell death mechanisms: apoptosis and necrosis 1517.4 Influence of environmental conditions on the induction of cell death 152
7.4.1 Depletion of nutrients and growth factors 1527.4.2 Oxygen limitation 1547.4.3 Susceptibility to shear stress 1547.4.4 Osmolality 155
7.5 Methods of detection of cell death by apoptosis 1557.5.1 DNA fragmentation 1567.5.2 Morphological changes 1577.5.3 Membrane asymmetry 1587.5.4 Apoptotic proteins 1587.5.5 Cytochrome C release 159
7.6 Apoptosis suppression by molecular techniques 1597.6.1 Molecular basis of apoptotic cell death 1597.6.2 Molecular strategies for apoptosis control 171
7.7 Conclusions and perspectives 173References 173
8 Mathematical models for growth and product synthesis in animal cell culture 181Elisabeth F.P. Augusto, Manuel F. Barral, and Rosane A.M. Piccoli8.1 Introduction 1818.2 Kinetic analysis of bioprocesses 185
8.2.1 Characteristic kinetic variables 1868.2.2 Data treatment 1908.2.3 Phenomena identification 191
8.3 Unstructured and nonsegregated models 1928.3.1 Classical formulas for cell growth, substrate consumption, and
product synthesis 1928.3.2 Kinetic models for animal cells 1998.3.3 Parameter fitting in models 2098.3.4 Model validation 213
8.4 Structured and nonsegregated models 2148.5 Unstructured and segregated models 215References 218
9 Bioreactors for animal cells 221Ernesto Chico Veliz, Gryssell Rodrıguez, and Alvio Figueredo Cardero9.1 Introduction 2219.2 Inoculum propagation and small-scale culture systems 2219.3 Types of bioreactors 224
9.3.1 Homogeneous bioreactors 2259.3.2 Heterogeneous bioreactors 228
9.4 Modes of operation of bioreactors 2349.4.1 Batch cultivation 235
viii Animal Cell Technology

9.4.2 Fed-batch cultivation 2379.4.3 Continuous cultivation 2409.4.4 Continuous cultivation with cell retention (perfusion) 242
9.5 Aeration and agitation 2469.6 Scale-up 2509.7 Economic aspects relevant to bioreactor selection: the productivity factor 252References 255
10 Monitoring and control of cell cultures 259Aldo Tonso10.1 Introduction 25910.2 Monitoring and control: basic concepts 25910.3 Particular characteristics of cell cultures 26110.4 Main bioprocess variables 261
10.4.1 Temperature 26110.4.2 pH 26210.4.3 Dissolved oxygen 26310.4.4 Cell concentration 26510.4.5 Other variables of interest 267
10.5 Strategies of control 26810.5.1 Traditional control 26810.5.2 Advanced control 270
References 270
11 Animal cell separation 273Leda dos Reis Castilho and Ricardo de Andrade Medronho11.1 Introduction 27311.2 Separation efficiency 27411.3 Gravity settling 28011.4 Centrifugation 28111.5 Hydrocyclones 28311.6 Filtration 285
11.6.1 Tangential flow filtration with membranes 28511.6.2 Dynamic filters 28711.6.3 Spin-filters 288
11.7 Ultrasonic separation 289References 291
12 Product purification processes 295Angela Maria Moraes, Leda dos Reis Castilho, and Sonia Maria Alves Bueno12.1 Introduction 29512.2 Basic considerations 295
12.2.1 Final application of product 29612.2.2 Selection of the protein source 29712.2.3 Protein properties and manipulation 298
12.3 Cell disruption 29812.4 Protein purification methods 300
12.4.1 Separation processes based on solubility 30112.4.2 Separation processes based on differences in molar mass 304
Contents ix

12.4.3 Separation processes based on differences in electrical charge 30912.4.4 Separation processes based on differences in hydrophobicity 31312.4.5 Separation processes based on specificity of ligands 31412.4.6 Other developments 319
12.5 Conclusions 323References 324
13 Quality control of biotechnological products 329Marina Etcheverrigaray and Ricardo Kratje13.1 Introduction 32913.2 Production of recombinant proteins 331
13.2.1 Control of starting materials 33113.2.2 Quality control of cell banks 333
13.3 Control of the production process 33413.3.1 Cultures 33413.3.2 Purification 335
13.4 Product control 33513.4.1 Characterization and specification 33513.4.2 Protein content 33613.4.3 Amino acids analysis (identification and/or protein content) 33613.4.4 Protein sequencing (identification) 33713.4.5 Peptide mapping 33713.4.6 Electrophoresis 33713.4.7 Carbohydrate determination 34013.4.8 Potential impurities and contaminants of biotechnological products 340
13.5 Bioassays 34113.5.1 Bioassay types 34213.5.2 In vitro bioassays 34313.5.3 Experimental design 34413.5.4 Statistical analysis 345
References 345
14 Regulatory aspects 349Maria Teresa Alves Rodrigues and Ana Maria Moro14.1 Introduction 34914.2 Good Manufacturing Practices and quality assurance 35014.3 Regulatory agencies 35114.4 Harmonization 35214.5 Premises 353
14.5.1 Clean rooms 35314.5.2 Biosafety 354
14.6 Cell banks 35514.6.1 Cell bank qualification 355
14.7 Validation 35814.7.1 General aspects 35814.7.2 Biological products 360
14.8 Stability 36214.9 Clinical trials 362
14.9.1 Preclinical studies 363
x Animal Cell Technology

14.9.2 Clinical studies 36414.10 Biogenerics or biosimilars 365References 367
15 Intellectual property 373Ana Cristina Almeida Muller and Leila Costa Duarte Longa15.1 Introduction 37315.2 The biotechnology sector 37315.3 Ethical and moral aspects of research involving genetic engineering 37415.4 Basic concepts of patentability 376
15.4.1 Discovery versus invention 37615.4.2 Requirements for the patentability of inventions 377
15.5 Patentable materials 38215.6 Industrial property and technology transfer offices 38415.7 Patent and technology transfer specialists 38615.8 Conclusions 388References 388
16 Recombinant therapeutic proteins 389Maria Candida Maia Mellado and Leda dos Reis Castilho16.1 Introduction 38916.2 Main therapeutic proteins 389
16.2.1 Cytokines 39016.2.2 Hematopoietic growth factors 39216.2.3 Growth factors 39216.2.4 Hormones 39316.2.5 Therapeutic enzymes 39316.2.6 Blood coagulation factors 39816.2.7 Antibodies 399
16.3 Economic aspects 40016.4 Challenges and future perspectives 402
16.4.1 Formulation and delivery of biopharmaceuticals 40216.4.2 Characterization of biopharmaceuticals 40416.4.3 Alternative expression systems 40416.4.4 Second-generation biopharmaceuticals 405
References 406
17 Monoclonal antibodies 409Wirla M.S.C. Tamashiro and Elisabeth F.P. Augusto17.1 Introduction 40917.2 Antibodies 41117.3 Production of monoclonal antibodies 415
17.3.1 Step 1: Immunization 41517.3.2 Step 2: Fusion and selection of secreting hybridomas 41617.3.3 Step 3: Hybridoma cloning 41717.3.4 Step 4: Definition of the isotype of monoclonal
antibodies obtained 41717.3.5 Step 5: Follow-up/later developments 417
17.4 Production of recombinant antibodies 418
Contents xi

17.4.1 Humanized antibodies 42017.4.2 Human antibodies 421
17.5 Production systems 42517.5.1 Cell lines 42617.5.2 Basic conditions for in vitro cultivation 42717.5.3 Cell metabolism 42817.5.4 Bioreactors and operation mode 429
References 430
18 Viral vaccines: concepts, principles, and bioprocesses 435Isabel Maria Vicente Guedes de Carvalho Mello, Mateus Meneghesso daConceicao, Soraia Attie Calil Jorge, Pedro Estilita Cruz, Paula MariaMarques Alves, Manuel Jose Teixeira Carrondo, and Carlos Augusto Pereira18.1 Introduction 43518.2 Viral replication 436
18.2.1 Adsorption 43718.2.2 Internalizing and unwrapping the viral particle 43718.2.3 Structure and organization of viral genomes 43718.2.4 Production and maturation of viral particles 442
18.3 Production of viral particles by cell culture 44218.4 Strategies for the production of virus-like particles 447
18.4.1 Advantages of VLPs 44818.4.2 VLP production technology 44818.4.3 VLP composition 44918.4.4 VLP production processes 450
18.5 Development of viruses for DNA vaccines 45118.6 Perspectives for the evolution of viral vaccine production 452References 455
19 Bioinsecticides 459Marcia Regina da Silva Pedrini and Ronaldo Zucatelli Mendonca19.1 Introduction 45919.2 Baculovirus as a bioinsecticide: mechanism of action 46019.3 Animal cell cultures for baculovirus production 46319.4 Effect of culture medium, cell line, and virus isolate on biopesticide
production 46319.5 Polyhedra virulence and characteristics 46619.6 Production of viral mutants in cell culture 467References 470
20 Cell therapies and stem cells 475Hamilton da Silva Jr and Radovan Borojevic20.1 Introduction 47520.2 Primary material 476
20.2.1 Stem and mature cells 47720.2.2 Tissue environment and specific niches 484
20.3 Applications 48520.3.1 Bioexpansion and biostorage 48520.3.2 Bioengineering 486
xii Animal Cell Technology

20.4 Conclusions and perspectives 487References 487
21 Gene therapy 489Celio Lopes Silva, Karla de Melo Lima, Sandra Aparecida dos Santos, andJose Maciel Rodrigues Jr21.1 Introduction 48921.2 Gene therapy 48921.3 Vectors used in gene therapy 491
21.3.1 Viral vectors 49121.3.2 Synthetic vectors: plasmid DNA 493
21.4 Principles of gene therapy 49721.4.1 Replacement or correction of a mutant gene 49721.4.2 Introduction of a heterologous gene 49821.4.3 Gene inactivation 498
21.5 Gene therapy and clinical studies 49821.5.1 The first gene therapy product 501
21.6 Perspectives 502References 502
Appendix 505Case study: Mathematical modeling of the monoclonalantibody anti-TNP (trinitrophenyl) 505
Index 507
Contents xiii

Contributors
Paula Marques Alves, Instituto de Biologia Experimental e Tecnologica (IBET-ITQB),Portugal
Paola Amable, Cell Culture Engineering Laboratory, PEQ/COPPE, Federal University ofRio de Janeiro, Brazil
Elisabeth de Fatima Pires Augusto, Institute of Technological Research of the State of SaoPaulo, Brazil
Manuel Filgueira Barral, Fundacao Santo Andre, Brazil
Mariela Bollati-Fogolın, Cell Biology Unit, Institut Pasteur de Montevideo, Uruguay
Radovan Borojevic, Institute for Biomedical Sciences, Federal University of Rio deJaneiro, Brazil
Sonia Maria Alves Bueno, Department of Biotechnological Processes, School of ChemicalEngineering, State University of Campinas, Brazil
Michael Butler, Department of Microbiology, University of Manitoba, Canada
Manuel Jose Teixeira Carrondo, Instituto de Biologia Experimental e Tecnologica (IBET-ITQB), Portugal
Leda dos Reis Castilho, Cell Culture Engineering Laboratory, PEQ/COPPE, FederalUniversity of Rio de Janeiro, Brazil
Mateus Meneghesso da Conceicao, Laboratory of Viral Immunology, Butantan Institute,Brazil
Ernesto Chico, Center of Molecular Immunology, Cuba
Marcelo A. Comini, Centre of Biochemistry, Heidelberg University, Germany
Pedro Cruz, Instituto de Biologia Experimental e Tecnologica (IBET-ITQB), Portugal
Marina Etcheverrigaray, Facultad de Bioquımica y Ciencias Biologicas, UniversidadNacional del Litoral, Argentina
Alvio Figueredo, Center of Molecular Immunology, Cuba
Adriana Lages Lima Galesi, Department of Biotechnological Processes, School of Chemi-cal Engineering, State University of Campinas, Brazil
Soraia Attie Calil Jorge, Laboratory of Viral Immunology, Butantan Institute, Brazil
Ricardo Kratje, Facultad de Bioquımica y Ciencias Biologicas, Universidad Nacional delLitoral, Argentina
Patrıcia Leo, Institute of Technological Research of the State of Sao Paulo, Brazil
Karla de Melo Lima, Nanocore Biotecnologia Ltda, Brazil
Leila Costa Duarte Longa, Fundacao Oswaldo Cruz, Brazil
Ricardo de Andrade Medronho, Chemical Engineering Department, School of Chemistry,Federal University of Rio de Janeiro, Brazil

Maria Candida Maia Mellado, Instituto de Biologia Experimental e Tecnologica (IBET-ITQB), Portugal
Isabel Maria Vicente Guedes de Carvalho Mello, Laboratory of Viral Immunology,Butantan Institute, Brazil
Ronaldo Zucatelli Mendonca, Laboratory of Viral Immunology, Butantan Institute,Brazil
Angela Maria Moraes, Department of Biotechnological Processes, School of ChemicalEngineering, State University of Campinas, Brazil
Ana Maria Moro, Laboratory for Biopharmaceuticals in Animal Cells, Butantan Institute,Brazil
Ana Cristina Almeida Muller, Carminatti Schulz Propriedade Intelectual, Brazil
Marcia Regina da Silva Pedrini, Federal University of Rio Grande do Norte, Brazil
Maıra Peixoto Pellegrini, Cell Culture Engineering Laboratory, PEQ/COPPE, FederalUniversity of Rio de Janeiro, Brazil
Carlos Augusto Pereira, Laboratory of Viral Immunology, Butantan Institute, Brazil
Rosane Aparecida Moniz Piccoli, Institute of Technological Research of the State of SaoPaulo, Brazil
Rodrigo Coelho Ventura Pinto, Cell Culture Engineering Laboratory, PEQ/COPPE,Federal University of Rio de Janeiro, Brazil
Maria Teresa Alves Rodrigues, Laboratory of Biopharmaceuticals in Animal Cells,Butantan Institute, Brazil
Jose Maciel Rodrigues Jr, Nanocore Biotecnologia Ltda, Brazil
Gryssell Rodrıguez, Center of Molecular Immunology, Cuba
Sandra Aparecida dos Santos, Nanocore Biotecnologia Ltda, Brazil
Celio Lopes Silva, University of Sao Paulo, Brazil
Hamilton da Silva Jr, Institute of Biomedical Sciences, Federal University of Rio deJaneiro, Brazil
Claudio Alberto Torres Suazo, Department of Chemical Engineering, Federal Universityof Sao Carlos, Brazil
Wirla Maria S. C. Tamashiro, Institute of Biology, State University of Campinas, Brazil
Aldo Tonso, Department of Chemical Engineering, University of Sao Paulo, Brazil
Contributors xv

Abbreviations and Symbols ListChapter 1
ADA adenosine deaminase deficiencyBEVS baculovirus expression vector systemBHK baby hamster kidney cell lineCHO Chinese hamster ovary cell lineELISA enzyme linked immuno sorbent assaymAb monoclonal antibodiesMDCK Madin-Darby canine kidney epithelial cellsMMR measles, mumps, rubellaSCID severe combined immunodeficiencytPA plasminogen activatorVLP virus-like particle
Chapter 2
ATP adenosine triphosphateEDTA ethylenediaminetetraacetic acidDMSO DimethylsulfoxideBHK baby hamster kidney cell lineCHO Chinese hamster ovary cell lineHEPES N-(2-hydroxyethyl)piperazine-N9-(2-ethanesulphonic acid)mAbs monoclonal antibodies� specific cell growth rate�max maximum specific cell growth rateMTT (3-(4,5-dimethyl-2-thiazolyl)-2,5-diphenyl-2H tetrazolium bromide)PEG polyethylene glycolRNA ribonucleic acidt cell culture timetd cell doubling timeWHO World Health OrganizationX cell concentration
Chapter 3
�-gal beta-galactosidaseAAV adeno-associated virusAP alkaline phosphataseARE elements rich in adenosine and uridine nucleotides (AU-rich elements)BHK baby hamster kidney cellsbp base pairsBPV bovine papilloma virusCAT chloramphenicol acetyl transferasecDNA complementary deoxyribonucleic acidCHO Chinese hamster ovary cell lineCMV cytomegalovirus

COS African green monkey kidney cells (CV1 cells transformed with adefective mutant of SV40)
Cre recombinase (cyclization recombination)CV1 African green monkey kidney cellsDEAE-dextran diethylaminoethyl-dextranDHFR dihydrofolate reductaseDMSO dimethylsulfoxideDNA deoxyribonucleic acidDOPE dioleoylphosphatidyl ethanolamineDOSPA 2,3-dioleoyloxy-N-[2(sperminecarbox-amido)ethyl]-N,N-dimethyl-1-
propane-aminium-trifluoracetateDOTMA N-[2,3-(dioleyloxy) propyl]-N,N,N-trimethyl ammonium chlorideE. coli Escherichia coliE erythromycine operon/repressorEBV Epstein-Barr virusECFP enhanced cyan fluorescence proteinECV extracellular viral particlesEGFP enhanced green fluorescence proteinELISA enzyme-linked immunosorbent assayEYFP enhanced yellow fluorescence proteinFACS fluorescence-activated cell sorterFdG fluorescein di-�-D-galactopyranosideFH2 dihydrofolateFH4 tetrahydrofolateFK506 human immunophilinsFLP native recombinase isolated from the 2�m plasmid from Saccharomyces
cerevisiaeFRAP rapamycin-induced immunophilinsFRT FLP recombination targetG418 geneticingDNA genomic DNAGFP green fluorescence proteinGS glutamine synthetaseGST glutathione S-transferaseHAT hypoxanthine aminopterin thymidineHBK hybrid cell line generated from the fusion of Burkitt lymphoma and
HEK-293 cellsHEK-293 human embryonic kidney cellshGH human growth hormoneHigh-Five TM BTI-TN-5B1-4 (cell line derived from the insect Trichoplusia ni)hsp70 heat shock protein 70HSV herpes simplex virusIPTG isopropyl 1-thio-ß-D-galactopyranosideIRES internal ribosomal entry sitekb kilobasesLac lactose operon/repressorLCR locus control regionLoxP locus of crossover of P1LUC luciferase isolated from fireflyMCS multiple cloning site
Abbreviations and Symbols List xvii

mRNA messenger RNAMSX methionine sulfoximineMTX methotrexateNSONS0 murine myeloma cell lineONPG o-nitrophenyl-�-D-galactosideORF open reading frameOV occluded viral particlespCMV cytomegalovirus promoterPCR polymerase chain reactionPEI polyethyleneiminePIP pristinamycinepolyA polyadenylation signalpSV40 early promoter of SV40 virusRIA radioimmuno assayRNA ribonucleic acidRU486 mifepristoneSAR scaffold attached regionSEAP secreted alkaline phosphataseSf-21 cell line originated from the ovary of the insect Spodoptera frugiperdaSf-9 clone derived from the Sf-21 cell lineSp2/0 mouse myeloma cell lineSV40 simian virus 40Tet tetracycline operon/repressorTEV catalytic domain of the nuclear inclusion a (NIa) from the tobacco etch
virusTK thymidine kinaseTn-368 cell line originated from the ovary of the insect Trichoplusia niTn7 transposon 7tPA tissue plasminogen activatortRNA transfer ribonucleic acidUTR untranslated regionsX-gal 5-bromo-4-chloro-3-indolyl-ß-D-galactosideYACs yeast artificial chromosomes
Chapter 4
Acetyl-CoA acetyl-coenzyme AADP adenosine diphosphateAla alanineAMP adenosine monophosphateATP adenosine triphosphateBHK baby hamster kidney cell lineCC9C10 hybridoma cell lineCHO Chinese hamster ovary cell lineCHSE Chinook salmon embryo cell lineCMP-NANA cytosine monophosphate-N-acetylneuraminic acidCoQ coenzyme QCoQH2 dihydroubiquinoneDNA deoxyribonucleic acid
xviii Animal Cell Technology

EPO erythropoietinFAD flavin adenine dinucleotideFADH2 1,5-dihydro- flavin adenine dinucleotideFruc 6-P fructose-6-phosphateGDP guanosine 59-diphosphateGlc-6-P glucose-6-phosphateGlcN 6 P glucosamine-6-phosphateGlcNAc-1-P N-acetylglucosamine-1-phosphateGlcNAc-6-P N-acetylglucosamine-6-phosphateGln glutamineGly glycineGP1 immunoadhesin glycoproteinGTP guanosine 59-triphosphateHL-60 human promyelocytic leukaemic cell lineIgG immunoglobulin GIMDM Iscove9s Modified Dulbecco9s MediumLLC-PK(1) porcine kidney cell linemAb monoclonal antibodyManNAc6P mannose-N-acetyl-6-phosphateMDCK Madin-Darby canine kidney cell lineMGH-U1 human bladder cancer cell lineMN12 mouse-mouse hybridoma cell lineNADþ nicotinamide adenine dinucleotideNADH reduced NADNADP nicotinamide adenine dinucleotide phosphateNADPH reduced NADPNANA N-acetylneuraminic acidNeuNAc N-acetylneuraminic acidOK opossum kidney cell lineOMP orotidine monophosphateP phosphateP/O ratio molar ratio of ATP synthesis and oxygen consumptionPER.C6 human retina-derived cell linePP pyrophosphatePPC pentose phosphate cyclePQXB1/2 murine B-lymphocyte hybridoma cell lineRNA ribonucleic acidS I sugar nucleoside transport system IS II sugar nucleoside transport system IISf9 insect cell line (Spodoptera frugiperda)SP2/0 mouse myeloma cell lineSP2/0-Ag14 mouse myeloma cell lineTCA tricarboxylic acid cycleTNFR-IgG tumor necrosis factor receptor-IgGtPA tissue plasminogen activatorUDP uridine diphosphateUDP uridine diphosphateUDP-GalNAc UDP-N-acetylgalactosamineUDP-GlcNAC UDP-N-acetylglucosamineUDP-NANA uridine diphosphate N-acetylneuraminic acid
Abbreviations and Symbols List xix

UDP-N-GNAc UDP-N-acetyl-hexosamineUMP uridine monophosphateUTP uridine triphosphateVO 203 hybridoma cell lineWI-38 Wistar Institute-38; human embryonic lung tissue cell line
Chapter 5
bFGF basic fibroblast growth factorECGF endothelial growth factorECM extracellular matrixEGF epidermal growth factorFDA food and drug administrationFGF fibroblast growth factorIGF-1 insulin-like growth factor-1IGF-2 insulin-like growth factor-2IL-1 interleukin-1IL-6 interleukin-6NGF nerve growth factorPDGF platelet-derived growth factorPW purified waterTGF transforming growth factorWFI water for injection
Chapter 6
AGE advanced glycation end productsBHK baby hamster kidney cell lineCHO Chinese hamster ovary cell lineDO dissolved oxygenER endoplasmic reticulumFVIII blood coagulation factor eightFX blood coagulation factor tenG2 digalactosylated glycansGla gamma-carboxyglutamic acidGlcNAc N-acetyl glucosamineHEK human embryonic kidney cellsHIF hypoxia-inducible factorIgG immunoglobulinOST oligosaccharyltransferase enzymet-PA tissue-type plasminogen activatorXyl xylose
Chapter 7
14-3-3 cytosolic protein that binds to phosphorylated Bad, inactivating itA-1 anti-apoptotic member of Bcl-2 familyAIF apoptosis-inducing factorAkt serine/threonine kinaseALG-2 apoptosis-linked gene-2
xx Animal Cell Technology

ANT adenine nucleotide translocatorAO acridine orangeApaf-1 apoptosis protease activating factor-1Apo-I apoptosis antigen-I (also known as Fas and CD95, a member of the TNF
receptor family)ATP adenosine triphosphateBad Bcl-XL/Bcl-2 associated death promoter, pro-apoptotic member of Bcl-2
familyBak Bcl-2 antagonist/killer, pro-apoptotic member of Bcl-2 familyBax Bcl-2 associated x protein, pro-apoptotic member of Bcl-2 familyBcl-2 B-cell lymphoma 2, anti-apoptotic member of Bcl-2 familyBcl-w anti-apoptotic member of Bcl-2 familyBcl-XL long form of Bcl-X, anti-apoptotic member of Bcl-2 familyBcl-XS short form of Bcl-X, pro-apoptotic member of Bcl-2 familyBH1 Bcl-2 homolog domain 1BH2 Bcl-2 homolog domain 2BH3 Bcl-2 homolog domain 3BH4 Bcl-2 homolog domain 4BHK baby hamster kidney cell lineBHRF1 Epstein-Barr virus Bcl-2 homologBid BH-3 interacting domain death agonist, pro-apoptotic member of Bcl-2
familyBik Bcl-2 interacting killer, pro-apoptotic member of Bcl-2 familyBim Bcl-2 interacting mediator of cell death, pro-apoptotic member of Bcl-2
familyBIR baculovirus IAP repeatBmf Bcl-2 modifying factor, pro-apoptotic member of Bcl-2 familyBoo Bcl-2 homolog of ovary, anti-apoptotic member of Bcl-2 familyCAD caspase-activated DNAseCARD caspase recruitment domainCDK cyclin dependent kinaseCHO Chinese hamster ovary cell lineCHOP C/EBP-homologous proteincIAP1 cellular inhibitor of apoptosis protein 1cIAP2 cellular inhibitor of apoptosis protein 2c-jun cellular homolog of v-Jun avian sarcoma virus 17 oncogenec-myc cellular homolog of the oncogene v-myc of avian myelocytomatosis virus
strain 29CO2 carbon dioxideCOS simian fibroblasts (CV-1 cells) transformed by SV40, deficient in the
origin of replication regionCrmA cytokine response modifier ADAPI 49,69-diamidino-2-phenylindole (a fluorescent dye)dATP deoxy-adenosine triphosphateDD death domainDED death effector domainDFF40 DNA fragmentation factor of 40 kDaDIABLO direct inhibition of apoptosis protein IAP binding protein with low pIDISC death inducing signaling complexDNA deoxyribonucleic acid
Abbreviations and Symbols List xxi

E1B-19kDa adenovirus Bcl-2 homologueEB ethidium bromideFADD Fas associated death domainFAK focal adhesion kinaseFas cell surface receptor, member of the TNF receptor family that promotes
apoptosis (also known as CD95 and APO-1)FasL Fas ligandFITC fluorescein isothiocyanateG0 cell cycle Gap 0 phaseG1 cell cycle Gap 1 phaseG2 cell cycle Gap 2 phaseGADD153 growth arrest and DNA damage-inducible gene 153HEK 293 human embryonic kidney cell lineHeLa human cervical adenocarcinoma cell lineHMW-DNA high molar mass DNAHRK harakiri, pro-apoptotic member of Bcl-2 familyHSP heat shock proteinsIAP inhibitor of apoptosis proteinsICAD inhibitor of caspase-activated DNAseIGF-1 insulin-like growth factor 1JNK c-Jun N-terminal kinaseKSBcl-2 Kaposi’s sarcoma-associated herpesvirus Bcl-2 homologLMW-DNA low molar mass DNAM cell cycle mitosis phaseMcl-1 myeloid cell leukemia 1, anti-apoptotic member of Bcl-2 familyM-CSF macrophage colony stimulating factorMEKK1 Map/Erk kinase kinase 1NBD nucleotide-binding domainNEC necrotic cellNFkB nuclear factor of immunoglobulin kappa locus in B cellsNGF nerve growth factorNoxa pro-apoptotic member of Bcl-2 familyNS0 myeloma cell lineNVA non-viable apoptotic cellOmi/HtrA2 high temperature requirement protein A2p15 15 kDa protein, truncated Bidp53 53 kDa protein, tumor suppressor gene product that promotes apoptosis
and is involved in the cell cycle controlPAK2 p21-activated kinase 2PARP poly (ADP ribose) polymerasePLK polo-like kinasesPTP permeability transition porePuma p53 upregulated modulator of apoptosis, pro-apoptotic member of Bcl-2
familyRNA ribonucleic acidS cell cycle synthesis phaseSAPK stress-activated protein kinaseSf9 insect cell line derived from Spodoptera frugiperdaSmac second mitochondrial activator of caspasesTB/C3 hybridoma cell line
xxii Animal Cell Technology

td doubling timeTNF tumor necrosis factorTNF-R1 tumor necrosis factor receptor 1TRADD TNF receptor I associated death domainTRAF2 TNF receptor associated factor 2TRAIL-R1 TNF-related apoptosis-inducing ligand receptor 1TRAIL-R2 TNF-related apoptosis-inducing ligand receptor 2TUNEL nuclear terminal deoxynucleotidyl transferase-mediated dUTP nick-end-
labelingUPR unfolded protein responseVA viable apoptotic cellVDAC voltage-dependent anion channelVNA viable nonapoptotic cellWD-40 repeats repeated sequence of approximately 40 amino acids, usually tryptophan
(W) and aspartate (D) residuesx-dUTP deoxyuridine triphosfatase; x ¼ biotin, DIG or fluoresceinXIAP X-linked inhibitor of apoptosis protein, member of IAP family that
inhibits apoptosis˜łm inner mitochondrial membrane potential
Chapter 8
In the definitions below, M, L and T are basic units of mass, length and time, respectively.
D specific feed rate (T�1)DPer specific perfusion rate (T�1)GLC glucose concentration (M � L�3)GLC� glucose concentration under substrate limitation (M � L�3)GLCthres threshold glucose concentration (M � L�3)GLN glutamine concentration (M � L�3)GLN� glutamine concentration under substrate limitation (M � L�3)K first order constant for glutamine decomposition (T�1)kd specific cell death rate (T�1)kd,max maximum specific cell death rate (T�1)kd,min minimum specific cell death rate (T�1)
kGLC glucose limitation constant to growth (M � L�3)
kdGLC glucose limitation constant to death (M � L�3)
kLACGLC glucose limitation constant for lactate synthesis (M � L�3)
kGLN glutamine limitation constant to growth (M � L�3)
kMAbGLN glutamine limitation constant for monoclonal synthesis (M � L�3)
kLACGLN glutamine limitation constant for lactate synthesis (M � L�3)
kNH3
GLN glutamine limitation constant for ammonia synthesis (M � L�3)
kdi,GLC glucose inhibition constant for death (M � L�3)
kMAbi,GLC glucose inhibition constant for monoclonal synthesis (M � L�3)
kdi,GLN glutamine inhibition constant for death (M � L�3)
ki,LAC lactate inhibition constant for growth (M � L�3)
ki,NH3ammonia inhibition constant for growth (M � L�3)
Abbreviations and Symbols List xxiii

ki,NHþ4
ammonium inhibition constant for growth (M � L�3)
ki,P product inhibition constant for growth (M � L�3)
kpi,P product inhibition constant for product synthesis (M � L�3)
ki,S substrate inhibition constant for growth (M � L�3)
kdLAC lactate limitation constant for death (M � L�3)
kdNH3
ammonia limitation constant for death (M � L�3)
kdNHþ
4ammonium limitation constant for death (M � L�3)
kS substrate limitation constant for growth (M � L�3)
kPS substrate limitation constant for product synthesis (M � L�3)
kSS substrate limitation constant for substrate uptake (M � L�3)LAC lactate concentration (M � L�3)MAb monoclonal antibody concentration (M � L�3)mS specific substrate uptake rate for maintenance, or maintenance coefficient
(M � M�1 � T�1 or M � Cel�1 � T�1)NH3 ammonia concentration (M � L�3)NHþ
4 ammonium concentration (M � L�3)OF objective functionP product concentration (M � L�3)rP product synthesis rate (M � L�3 � T�1)rS substrate consumption rate (M � L�3 � T�1)rX cell growth rate (M � L�3 � T�1 or Cel � L�3 � T�1)S substrate concentration (M � L�3)S� substrate concentration under substrate limitation (M � L�3)t time (T)X cell concentration (M � L�3or Cel � L�3)Xd dead cell concentration (M � L�3or Cel � L�3)Xt total cell concentration (M � L�3or Cel � L�3)XV viable cell concentration (M � L�3or Cel � L�3)YLAC=GLC glucose-to-lactate yield coefficient (M � M�1)YNHþ
4 =GLN glutamine-to-ammonium yield coefficient (M � M�1)YP=S substrate-to-product yield coefficient (or factor) (M � M�1)YX=S substrate-to-cells yield coefficient (or factor) (M � M�1 or Cel � M�1)
YmaxX=S maximum substrate-to-cells yield coefficient (or factor) (M � M�1 or
Cel � M�1)YXV=GLC glucose-to-viable cells yield coefficient (M � M�1 or Cel � M�1)YXV=GLN glutamine-to-viable cells yield coefficient (M � M�1 or Cel � M�1)Æ constant for growth-associated production (M � M�1 or M � Cel�1)� constant for non-growth-associated production (M � M�1 � T�1 or
M � Cel�1 � T�1)˜i variation of element i in the time interval ˜t (M � L�3 or Cel � L�3)˜t time interval (T)�LAC specific lactate synthesis rate (M � M�1 � T�1 or M � Cel�1 � T�1)�MAb specific monoclonal synthesis rate (M � M�1 � T�1 or M � Cel�1 � T�1)�NH3 specific ammonia synthesis rate (M � M�1 � T�1 or M � Cel�1 � T�1)�P specific product synthesis rate (M � M�1 � T�1 or M � Cel�1 � T�1)�P,max maximum specific product synthesis rate (M � M�1 � T�1 or
M � Cel�1 � T�1)
xxiv Animal Cell Technology

�S specific substrate consumption rate (M � M�1 � T�1 or M � Cel�1 � T�1)�S� specific substrate uptake rate under substrate limitation conditions
(M � M�1 � T�1 or M � Cel�1 � T�1)�X specific cell growth rate (T�1)�X,max maximum specific cell growth rate (T�1)�X,min minimum specific cell growth rate (T�1)
�apX apparent specific growth rate (T�1)
Other parameters . . . b1, b2, b3, C1, C2, d0, d1, F1, F2, h1, h2, K, kLAC#GLC , kNH3#
GLN , k9i,NH3, kMAb9
i,GLC,
kd#LAC, kd#NH3
, k9S, kS#S , k�, Pm, P9m, Æ0, Æ1, Æ2, Æ3, Æ4, �0, �1, �2, �m, �*, �, º,˜�max
S ,˜�maxP .
Chapter 9
The units defined for the variables listed below are given in the MLT unit system, except incases where cell concentration (given as cell number) is involved. M represents mass, Llength and T time.
a interfacial gas-liquid area per volume of bioreactor (L2 L-3)CHO Chinese hamster ovary cell lineD dilution rate (T-1)Dwash-out dilution rate at wash-out conditions (T-1)DO* equilibrium dissolved oxygen concentration (M L-3)DO dissolved oxygen concentration (M L-3)ECS extracapillary spaceICS intracapillary spaceF bioreactor volumetric feed flow rate (L3 T-1)HO2 Henry’s constant (T2 L-2)kL global oxygen transfer coefficient (L3 L-2 T-1)kLa volumetric oxygen transfer coefficient (T-1)NS0 myeloma cell lineP product concentration (M L-3)PA annual production obtained in a bioreactor (M)Pacc amount of product accumulated throughout a bioreactor run (M)PO2 partial oxygen pressure (M L-1 T-2)PV volumetric productivity of a bioreactor (M L-3 T-1)qO2 specific oxygen consumption rate (M cells-1 T-1)qP specific product formation rate (M cells-1 T-1)qS specific substrate consumption rate (M cells-1 T-1)rGLC glucose consumption rate (M T-1)rO2 oxygen consumption rate (M T-1)S substrate concentration (M L-3)SA substrate concentration in the bioreactor feed (M L-3)t culture time (T)tgrowth time needed for cells to grow up to the concentration desired for the
process (T)twork number of working days per year (T)tprep time required for the preparation of the bioreactor (includes cleaning and
sterilization) (T)tproc process time (T)tprod duration of the production phase (T)
Abbreviations and Symbols List xxv

V bioreactor working volume (L3)XV,PERFUSATE viable cell concentration in the perfusate stream (cel T-1)Xv viable cell concentration (cells L-3)Æ cell passage factor in perfusion processes ( – )� turbulence eddy dissipation (L2 T-3)º Kolmogorov eddy length (microscale of turbulence) (L)� specific growth rate (T-1)�MAX maximum specific growth rate (T-1)� kinematic viscosity (L2 T-1)
Chapter 10
C concentration of dissolved oxygenCS concentration of dissolved oxygen in equilibrium with the gas phaseFACS fluorescence activated cell sorterFIA flow injection analysiskLa volumetric oxygen transfer coefficientpCO2 partial pressure of dissolved carbon dioxide gasP-I-D proportional-integral-derivative controllerQO2 specific respiration rate
Chapter 11
In the definitions below, M, L, and T are basic units of mass, length, and time, respectively.
Amin minimum settling area (L2)b force field intensity (L T-2)cv volumetric concentration (dimensionless)d particle (or cell) diameter (L)d50 cut size (L)d’50 reduced cut size (L)D perfusion rate (T-1)E total separation efficiency (dimensionless)E’ reduced total separation efficiency (dimensionless)g acceleration of gravity (L T-2)G grade efficiency (dimensionless)G’ reduced grade efficiency (dimensionless)Q feed flow rate (L3 T-1)QC concentrated stream (underflow) flow rate (L3 T-1)QD diluted stream (overflow) flow rate (L3 T-1)r radial position of the particle (L)R centrifuge radius (L)R f flow ratio (dimensionless)u ascending velocity of the liquid in the settler (L T-1)V bioreactor volume (L3)v t terminal velocity of the particle at low concentrations (L T-1)v tc terminal velocity of the particle at a concentration cv (L T-1)x particle size frequency in the feed suspension (dimensionless)X cell concentration, in number, in the feed suspension (L-3)XC cell concentration, in number, in the concentrated suspension (L-3)
xxvi Animal Cell Technology

XD cell concentration, in number, in the diluted suspension (L-3)Xd concentration of cells with diameter d, in number, in the feed suspension
(L-3)XdC concentration of cells with diameter d, in number, in the concentrated
suspension (L-3)XdD concentration of cells with diameter d, in number, in the diluted
suspension (L-3)y cumulative particle size distribution (undersize) of the feed suspension
(dimensionless)yC cumulative particle size distribution (undersize) of the concentrated
suspension (dimensionless)yD cumulative particle size distribution (undersize) of the diluted suspension
(dimensionless)z cumulative particle size distribution (oversize) of the feed suspension
(dimensionless)� specific cell growth rate (T-1)�ap apparent specific cell growth rate (T-1)�L liquid viscosity (M L-1 T-1)r density of the liquid (M L-3)rs density of the particles or cells (M L-3)ø angular velocity (T-1)
Chapter 12
AE AminoethylC CarboxyC1 MethylC8 OctylC18 OctyldecylCM CarboxymethylDEAE DiethylaminoethylDS-2 Drosophila melanogaster schneider-2DTE 1,4-dithioerythritolDTT 1,4-dithiothreitolEBA expanded bed adsorptionEDTA ethylenediaminetetraacetic acidH height of the expanded bedH0 height of the packed bedHBsAg hepatitis B virus surface antigenHIC hydrophobic interaction chromatographyK partitioning coefficientKA association constantKav alternative distribution coefficientKd distribution coefficientKD dissociation constantL LigandMWCO molecular weight cut-offP ProteinPEG polyethylene glycolpI isoelectric point
Abbreviations and Symbols List xxvii

PL reversible complex ptotein-ligandPVC poly vinyl chlorideQ quaternary amineRPC reverse phase chromatographyS SulfonateSM SulfomethylSP SulfopropylSDS sodium dodecyl sulphateSDS-PAGE sodium dodecyl sulphate – polyacrylamide gel electrophoresisTEAE TriethylaminoethylTAM TrimethylaminomethylVe elution volumeVo interstitial volume of the porous matrixVs total solvent volume within the poresVt total column volumex solute concentration in the original solutiony solute concentration in the extract
Chapter 13
CPE Cytopathic effectDNA Deoxyribonucleic acidGMP Good manufacturing practiseHad hemadsorptionHPCE High performance capillary electrophoresisHPLC High performance liquid chromatograpyHPSEC High-performance size-exclusion chromatographyIEF Isoelectric focusingmAbs Monoclonal antibodiesMCB Master cell bankmRNA Messenger RNAPCR Polymerase chain reactionpI Isoelectric pointPMA Production of monoclonal antibodiesPVDF Polyvinylidene fluoriderDNA Recombinant DNARNA Ribonucleic acidSDS sodium dodecyl sulphateSDS-PAGE sodium dodecyl sulphate – polyacrylamide gel electrophoresisUV Ultra violetWCB Working cell bankWHO World Health Organization
Chapter 14
ANVISA Agencia Nacional de Vigilancia Sanitaria (Brazilian National Agency forSanitary Vigilance)
BL biosafety levelBLA Biologics License Application
xxviii Animal Cell Technology

BSE bovine spongiform encephalopathyCBER Center for Biologics Evaluation and ResearchCDER Center for Drug Evaluation and ResearchcGMP current good manufacturing practicesCHO Chinese hamster ovary cell lineCNS Conselho Nacional de Saude (Brazilian National Health Council)CPMP Committee for Proprietary Medicinal ProductsCTNBio Comissao Tecnica Nacional de Biosseguranca (Brazilian National
Biosafety Technical Commission)EC European CommissionEMEA European Medicines AgencyFDA Food and Drug AdministrationGCP good clinical practicesGMO genetically modified organismsHAP hamster antibody productionHEPA high efficiency particulate airHIV human immunodeficiency virusHTLV human T-Cell leukemia virusICH International Conference on Harmonization of Technical Requirements
for Registration of Pharmaceuticals for Human UseLSBL large-scale biosafety levelMAP mouse antibody productionMCB master cell bankNDA new drug applicationNIH National Institutes of HealthPPC post-production cellsPTC points to considerQA quality assuranceQC quality controlRAP rat antibody productionWCB working cell bankWCP well-characterized productWHO World Health Organization
Chapter 15
ADR alternative dispute resolutionAUTM Association of University Technology ManagersEPC European Patent ConventionIDA irnationally recognized depositary authorityIFN-alpha Interferon-alphaINPI Brazilian National Institute of Industrial PropertymAb Monoclonal antibody
Chapter 16
BLA Biologics License ApplicationCG chorionic gonadotrophinCHO Chinese hamster ovary cell lineCSF colony-stimulating factor
Abbreviations and Symbols List xxix

EGF epidermal growth factorEMEA European Medicines AgencyEPO erythropoietinFDA Food and Drug AdministrationFIX blood coagulation factor IXFSH follicle-stimulating hormoneFVII blood coagulation factor VIIFVIII blood coagulation factor VIIIG-CSF granulocyte colony-stimulation factorGM-CSF granulocyte-macrophage colony-stimulation factorIFN interferonIGF insulin-like growth factorIgG immunoglobulin GIL interleukinIND investigational new drug applicationLH luteinising hormonemAb monoclonal antibodyM-CSF macrophage colony-stimulation factorPDGF platelet-derived growth factorPEG polyethylene glycolTGF transforming growth factorTNF tumor necrosis factorTNKase tenecteplase (commercial second-generation tPA)tPA tissue plasminogen activatorVEGF vascular endothelial growth factor
Chapter 17
ATP Adenosine triphosphateBHK baby hamster kidney cell lineCD cluster of differentiationcDNA complementary DNACDR Complementarity determining regionsCHO Chinese hamster ovary cell lineCMC carboximethylcelluloseDMSO DimethylsulfoxideDNA Deoxyribonucleic acidDO dissolved oxygenELISA enzyme linked immunosorbent assaysFc functional fragmentsFv variable fragmentsHACA Human Anti-Chimeric AntibodyHAMA Human Anti-Murine AntibodyHAT aminopterin, hypoxanthine, and thymidineHEK-93 human embryonic kidney cell lineHGPRT hypoxanthine phosphoribosyl transferaseIg ImmunoglobinIgA Immunoglobin class AIgD Immunoglobin class D
xxx Animal Cell Technology

IgE Immunoglobin class EIgG Immunoglobin class GIgM Immunoglobin class MIL InterleukinKLa Volumetric oxygen transfer coefficientKLH keyhole limpet haemocyaninmAb Monoclonal antibodyPEG polyethylene glycolS-S Disulfide bridgeTK thymidine kinasetRNA transcript of the RNA
Chapter 18
BTV Blue tongue viruscccDNA Covalently closed circular DNACLPs Core-like particlesCTL Cytotoxic T-lymphocytesdDNA Double-strand DNAdRNA Double-strand RNAHBsAg hepatitis B virus surface antigenHBV Hepatitis B virusmRNA Messenger rNA+mRNA Positive strand messenger RNAPPV Porcine parvovirusRNA- Complementary negative RNA strandRNA+ Genomic RNA-sRNA Negative single-strand RNA+sRNA Positive strand RNARNAs Genomic RNAssRNA Single-stranded RNAMOI Multiplicity of infectionTOI Time of infectionVLPs Virus-like particlesVP1 Viral protein 1VP2 Viral protein 2VP3 Viral protein 3VP4 Viral protein 4VP5 Viral protein 5VP6 Viral protein 6VP7 Viral protein 7
Chapter 19
AcMNPV Autographa californicaNPVAfMNPV Anagrapha falcifera nucleopoliedrovirusBmMNPV Bombyx mori NPVBV budded virusDIP Defectives Interfering Particles mutantsDNA Deoxyribonucleic acid
Abbreviations and Symbols List xxxi
EMBRAPA Brazilian Agricultural Research CorporationFBS fetal bovine serumFP Few Polyedra mutantsGmMNPV Galleria mellonellaNPVGMO genetically modified organismsGV GranulovirusHaSNPV Helicoverpa armigera NPVHzSNPV Helicoverpa zea nucleopoliedrovirusIEA Institute of AgricultureLdMNPV Lymantria dispar nucleopoliedrovirusMNPV multiple NPV typeMOI multiplicity of infectionNPV NucleopolyedrovirusOB occlusion bodyODV occlusion-derived virusOpMNPV Orgyia pseudotsugataNPVSf9 and Sf21 Spodoptera frugiperda cell lineSfMNPV Spodoptera frugiperdaNPVSNPV simple NPV typeTN-368 Trichoplusia ni cell lineTnMNPV Trichoplusia niNPV
Chapter 20
3G5 membrane ganglioside related to pericytes identificationBMP-12R receptor to bone morphogenetic protein isoform 12Brachyury transcription factor related to embryo mesoderm determinationCBF core-binding factor; protein family involved in cell differentiation
processesCD3/cCD3 protein complex tyrosine kinase associated with T cell receptor (TCR);
detected on cell surface or intracytoplasm (c)CD4 TCR co-receptor; binds to MHC-II (major histocompatibility complex –
class II)CD7 transmembrane protein linked to PI-3 (phosphoinositol-3) kinase;
cellular function not thoroughly clarifiedCD8 TCR co-receptor; binds to MHC-ICD10 metalloproteinase Zn-boundCD11b integrin ÆM; associated with CD18 (integrin �2); CD54 ligand; binds
complement system iC3b and ECM (extracellular matrix) proteins; alsoknown as Mac-1
CD11c integrin ÆX; associated with CD18; fibrinogen ligand; also known asMac-3
CD13 aminopeptidase N (metalloproteinase Zn-bound)CD14 LPS (lipopolysaccharide) receptorCD16/32 FcªRII/III (receptor II/III to Fcª)CD19 B cell receptor co-receptor linked to PI-3 kinase; forms complex ligands
with CD21 (C3b receptor) and CD81CD25 IL-2 Æ chain receptorCD29 �1 integrin ; forms a complex with CD49/Æ-integrinCD31 PECAM/platelet-endothelial cell adhesion molecule
xxxii Animal Cell Technology

CD33 gp67/glycoprotein 67 expressed by myelomonocytic progenitors;function not thoroughly yet defined
CD34 gp105-120; binds to CD62L (L-selectina); antigen essential to identifyhuman stem cells; function not yet completely known
CD35 C1 and C4b complement protein system receptorCD38 NAD glycohydrolase; expression related to cell proliferation increaseCD41 integrin/gpIIb ÆIIb chain; works with CD61 (gpIIIa), binding to
fibrinogen, vWF and trombospondinCD44 H-CAM (Hermes cell adhesion molecule); binds to hialuronic acid and
promotes mild leukocyte interactionCD45 LCA/leukocyte common antigen; tyrosine phosphatase that reinforces T
and B lymphocyte receptor signalingCD45RA isoform of CD45 containing the exon A; expressed on naıve T, B cells
and monocyte subpopulationsCD49 Æ chain integrin; involved in cell interactionsCD54 ICAM-1 (intercellular adhesion molecule); this binds to CD11a-b/CD18
complexCD56 NCAM (neural cell adhesion molecule); good marker for NK cellsCD60 9-O-acetyl GD3; surface ganglioside involved in receptor complexes
during cell signalingCD62L L selectin; related to co-binding with CD34 and interactions to
endotheliaCD64 FcªR1/receptor 1 to Fc gammaCD66a BGP (biliary glycoprotein); member of carcino-embryonary antigen
(CEA) familyCD71 receptor to transferrinCD73 ecto-5’-nucleotidase; involved on nucleotide dephosphorylationCD81 TAPA-1 (TAPA-1 – target for antiproliferative antigen-1); associated
with CD19 and CD21CD87 plasminogen receptor activatorCD90 also known Thy-1; T-lymphocyte marker involved in cellular adhesionCD100 semaphorin subtype; function not completely definedCD104 �4 integrin chain; associated with CD49 and binds to lamininCD105 endoglin; TGF-� co-factorCD106 VCAM-1 (vascular cell adhesion molecule); this binds to VLA-4 (very
late antigen)CD110 trombospondin receptorCD117 SCF (stromal or stem cell factor) receptor; mostly known as cKitCD122 �-chain of IL-2receptorCD123 Æ-chain of IL-3 receptorCD125 Æ-chain of IL-5 receptorCD127 Æ-chain of IL-7 receptorCD135 FLT-3/Flk-2; also known as Flt-3L (fms-related tyrosine kinase ligand)
receptorCD144 VE-cadherin; adhesion molecule related to endothelial cellsCD146 MCAM (mesenchymal cell adhesion molecule); also known as MUC-18,
S-endo or MEL-CAMCD166 gp37; molecule involved in adhesion between lymphocytes and thymic
epithelial cells
Abbreviations and Symbols List xxxiii

CD203c ecto-enzyme ectonucleotide pyrophosphatase/phosphodiesterase 3 (E-NPP3); mostly expressed in basofiles
CD235a glycophorin A; membrane protein expressed in red blood cellsCol collagencTn cardiac throponinCXCR4 chemokine receptor CXC 4EPO-R receptor of erythropoietinF4/80 membrane glycoprotein related to macrophage activityFGF-R fibroblast growth factor receptorGM-1 membrane ganglioside related to nervous cellsGM-CSFR granulocyte/monocyte - colony stimulation factor receptorGr-1 membrane antigen expressed mainly on granulocytesHLA-DR human leukocyte antigen – DR; analogous to mice MHCHLA-II HLA class IIIgE-R immunoglobulin E receptorIL-5R receptor of IL-5KDR also known as flk-1 and VEGF-R2 (vascular/endothelial growth factor
receptor 2)Lin abbreviation for lineage; related to hematopoietic cell lineages, namely:
CD3/4/8/11b/19/56, Gr-1 and Ter 119 (mice) ou CD235a (human)LPL L lipoproteinM-CSFR monocyte - colony stimulation factor receptorMHC myosin heavy chainMHC-II MHC class IIMMCP mouse mast cell proteaseMMP metalloproteinaseNG2 proteoglycan heparan-sulfate related to pericytes activityPDGF platelet-derived growth factorPPAR peroxisome proliferator-activated receptor gammaRANK receptor activator of NF-kappa �Sca-1 stem cell antigen 1SM22 smooth cell protein; structurally related to calponin, both actin and
tropomyosin ligandsSMA smooth muscle actinSSEA-I stage-specific embryonic antigen; characterized as a glycosphingolipid
similar to Ii (MHC invariant chain)Stro-1 stromal cell surface antigen, called stromal antigen 1Ter-119 mice red blood cell markerTie-2 receptor tyrosine kinase related to endothelial cells activityVEGF-R1 receptor 1 of VEGFVEGF-R3 receptor 3 of VEGFvWF Von Willebrand factor. Protein factor involved in hemostasis
Chapter 21
DNA deoxyribonucleic acidRNA ribonucleic acidiRNA interference RNAAAV adeno-associated virusHSV herpes simplex virus
xxxiv Animal Cell Technology

Foreword
In vitro culture of animal cells originated towards the end of the nineteenth century as acollection of experimental procedures used to isolate and maintain viable cells from organsof diverse animals, at least for a few days. From these modest origins, and throughout alittle more than 100 years, animal cell culture has evolved into a modern technology basedon scientific and engineering principles. As a result of such developments, animal cellculture is nowadays used successfully for the production of vaccines and recombinantglycoproteins. In addition, applications of animal cell culture now underpin new andfascinating fields, such as organ transplants, cell and gene therapy, in vitro toxicology andphysiology, tissue analogs, production of biopesticides, bioelectromechanical devices, andnanobiotechnology. Interestingly, of the more than 500 biopharmaceutical products thatare being evaluated in clinical trials, about half are produced by animal cell culture. Suchfacts underline the importance of this technology. Furthermore, the products derived fromanimal cells have an annual market of more than ten thousand million dollars withimpressive growth rates. Nonetheless, far more important than their economic value is theimpact that such products have made on human health, increasing the quality of life.
The first therapeutic product generated by animal cells, tPA, was approved in 1986. In1987, the first therapeutic monoclonal antibody, OKT3, was also approved, although thisprotein was obtained from the ascites fluid produced in vivo. It is notable that in merelytwo decades, close to 50 products produced by in vitro animal cell culture have now beenapproved. From these, approximately 60% are monoclonal antibodies. Such an achieve-ment was the result, to a large extent, of the extraordinary advances that animal cell culturetechnology has experienced since the 1980s. Since then, cell and product concentrationshave increased between one to two orders of magnitude, yielding bioprocesses that canroutinely attain more than 50 x 106 cell/mL and 5 g/L of product. Likewise, due toadvances in cell line selection and new expression systems, specific cell productivities above100 pg/cell-d are now a reality. The problem of cell fragility, that drew the attention ofresearchers during the 1980s and 90s, was adequately overcome. During the last twodecades, an important effort was focused on cell metabolism and physiology. Such under-standing allowed, among other things, a better definition of culture media. Consequently, itwas possible to eliminate undefined and undesirable components, such as fetal bovineserum, and chemically defined media became widely used. Knowledge of cell deathprocesses resulted in novel culture schemes and molecular strategies to contend with thisproblem. With the improvement in analytical methods and comprehension of protein post-translational modifications, a considerable advancement was possible in understanding therelation between the bioprocess and the quality of the glycoproteins produced. All thesedevelopments permitted the practical, efficient, and robust culture of animal cells inbioreactors at scales larger than 10 m3 for consistently producing safe and effectivebiopharmaceuticals.
In the present book, Animal Cell Technology: From Biopharmaceuticals to GeneTherapy, editors Drs Leda R. Castilho, Angela M. Moraes, Elisabeth F. Pires Augusto andMichael Butler have integrated the background knowledge and developments of the last 20years that have converted the culture of animal cells into a vigorous and important scientificfield. Accordingly, basic themes are reviewed in the book, including cloning and expression
Foreword xxxv

of heterologous proteins, culture media, metabolism, cell growth and death. Technologicalaspects are also examined, including the design, monitoring and control of bioreactors, andprocesses for separation of cells and products. Topics of major relevance, such as thequality control of products, regulatory issues and intellectual property, are included inseveral chapters. Finally, some of the most important products and applications of animalcell culture, including recombinant glycoproteins, monoclonal antibodies, viral vaccines,bioinsecticides, and gene and cell therapies, are reviewed in detail.
This book includes contributions of distinguished researchers from Canada and Ibero-America, in particular, from Brazil, Argentina, Cuba, Portugal and Uruguay. These authorsimpart a special character to the book, since it reflects the global impact that the disciplinehas acquired, and provides the vision and topics that are of interest to countries of thisregion. It also represents an additional effort, started in 2004 by Drs Leda R. Castilho andRicardo Medronho during the ‘‘first Latin-American Seminar on Cell Culture Technol-ogy’’, to strengthen the relationship between Ibero-American technologists and scientistsworking in animal cell culture.
The reader of the present book will be able to recognize that there still exist majortechnological and scientific challenges, as well as promising opportunities, in the field ofanimal cell culture. It is possible to anticipate important changes in paradigms that willdetermine the future of the field. Twenty years after the first products were approved,many patents are now starting to expire. This has brought to a central stage the discussionof the concept of biogenerics, not only from a commercial perspective, but also from atechnical and regulatory standpoint. Such a topic should be dealt with from a scientificapproach and particularly supported by detailed analytical characterization of the mole-cules and their therapeutic efficacy, aspects in which there has been outstanding recentprogress. Progress in this area will certainly contribute to defeat dogmas such as ‘‘theprocess determines the product’’, which in turn will open new possibilities for developingimproved and novel bioprocesses that efficiently yield safe biopharmaceuticals at accessibleprices to a larger number of patients. Advances in genomics and proteomics shouldcontribute in bringing to the market an increasingly large number of products, derivedfrom animal cell culture, for treating an increasing number of diseases. Again, new techno-logical, medical and regulatory paradigms will most likely be seen with the advent of celland gene therapies. Monoclonal antibodies, that are required in very large amounts, arefinally fulfilling the therapeutic promises generated in the mid-70s, and with this, newmanufacturing challenges can be foreseen. The race to develop bioprocesses that can yieldconcentrations above 10 g/L has started. It is likely that, by integrating the knowledgegenerated in the field during the last two decades, such a goal will be reached in a shorttime. A few examples that will contribute to reaching such a goal include novel operationand control systems, new culture media supplemented with hydrolyzed proteins from plantor yeast, and metabolic engineering of novel cell lines. New paradigms will also beestablished in the purification of biopharmaceuticals. Accordingly, it is likely that soon wewill see the application of unit operations that are presently uncommon for the field, suchas precipitation, crystallization, and extraction, whereas the importance of common butcostly methods used nowadays, such as chromatography, will diminish in large-scaleoperations. This should bring a simplification and cost reduction of bioprocessing. On theother hand, regulatory requirements will most likely affect and define the future of animalcell culture. A clear example of this is the trend to use disposable equipment andinstrumentation, which should represent a fertile area for innovation.
It is clear that animal cell culture will remain an exciting and highly dynamic field in theyears to come, and that the products generated by this technology will benefit an increasingnumber of people. Accordingly, the book Animal Cell Technology: From Biopharmaceu-
xxxvi Animal Cell Technology

ticals to Gene Therapy should be an important ally for technologists and scientistsinterested in the topic.
Octavio T. RamırezInstituto de Biotecnologıa, UNAM
Cuernavaca, Mexico
Cover Photo Acknowledgement
Photo 1
Clumps of suspension-adapted CHO cells stained with ethidium bromide and acridineorange, observed under a fluorescence microscope. Photo taken by Dr. Rodrigo C. V.Pinto, Cell Culture Engnieering Laboratory, Federal University of Rio de Janeiro, Brazil.
Photo 2
Adherent CHO cells. Photo taken by Dr. Rodrigo C. V. Pinto, Cell Culture EngnieeringLaboratory, Federal University of Rio de Janeiro, Brazil.
Photo 3
Laboratory-scale stirred-tank bioreactor for animal cell cultiavaion. Photo taken by Dr.Rodrigo C. V. Pinto, Cell Culture Engnieering Laboratory, Federal University of Rio deJaneiro, Brazil.
Photo 4
Inner surface of an industrial-scale stirred-tank bioreactor for animal cell cultivation. Phototaken by Dr. Ernesto Chico, Center of molecular Immunology, Cuba.
Foreword xxxvii


1Introduction to animal celltechnologyPaula Marques Alves, Manuel Jose Teixeira Carrondo, andPedro Estilita Cruz
1.1 Landmarks in the culture of animal cells
Despite the dominance of animal cell culture in the production ofbiopharmaceuticals in recent times, this technology was not consolidatedinto standardized large-scale bioprocesses until the 1990s. Nevertheless,the first experience with animal cell culture can be traced back to thebeginning of the 20th century. By the use of the hanging drop techniqueand frog heart lymph, Ross Harrison, at Yale, tried between 1906 and 1910to elucidate how the nervous fiber is originated (Witkowski, 1979). Heconsidered three hypotheses: (i) in situ formation from the nerve sheath;(ii) preformed protoplasmic bridges; or (iii) as a result of the nerve cellgrowth itself. When Harrison demonstrated the validity of the thirdhypothesis, he also confirmed the cell as the primary developing unit ofmulticellular organisms.
An early pioneer of cell culture was the French surgeon Alexis Carrel,who won the Nobel prize in Medicine in 1912 for his research at theRockefeller Institute (Spier, 2000). Harrison was, above all, the inventor ofanalytical solutions, while Carrel, with his extensive clinical practiceexperience, sterility concerns, and capacity to develop appropriate culturemedia and culture flasks, created the change in the technological paradigmthat led to the start up of animal cell technology. By careful manipulation,Carrel insured the maintenance of chicken embryo cells for several decadesin culture.
Spier (2000) lists some essential differences between cells in an organism(in vivo) and cells in culture (in vitro), particularly the following;
(i) Tissues are three-dimensional, while cell cultures are of zero dimen-sion (monodispersed in suspension culture) or two-dimensional(monolayer growth). However, some culture techniques exploitthree-dimensional systems (Alves et al., 1996; Powers et al., 2002).
(ii) In tissues, cells are subject to tension and compression, but not whenin culture, with the exception of artificial organs.
(iii) In tissues, lymphokines and chemokines vary in proportion andconcentration to allow fluctuations of short (cardiac rhythm), med-ium (daily), and long duration (life cycle). However, in culture theseparameters normally do not vary.
(iv) The mechanisms for cellular differentiation control in tissues and inculture are distinct.

The need to deal with some of these differences demands enormousefforts for the development of culture media (chemical environment) orshear, mixing, viscosity and bubbling conditions (physical environment),which should be optimized to result in an industrial process that can bevalidated. Requirements to avoid contamination have led to the formula-tion of serum-free media or even of protein-free, chemically defined mediafor the production of biopharmaceuticals (Griffiths, 1988).
The range of culture flasks and reactor types employed is quite wide,both for suspension and adherent cultures, from small Carrel’s or Roux’sflasks to roller bottles. Fixed- and fluidized-bed bioreactors, air-liftreactors and even stirred and aerated tanks with capacities up to 15 m3 arecommon in large plants producing monoclonal antibodies (mAbs) foranticancer therapies (Adams and Weiner, 2005; Griffiths, 1988).
One of the main purposes of animal cell culture development was thesearch for viral vaccines, initiated during the Second World War (1939–1945), particularly for poliomyelitis. The names of Enders, Syverton, andSalk are undoubtedly associated with the production of the inactivatedpolio vaccine, approved in the USA in 1955 and produced on a large scalein primary monkey kidney cells. Later, after a dispute between HilaryKaprowski and Albert Sabin, the attenuated vaccine against poliomyelitiswas licensed in 1962. At the end of this period, at the Wistar Institute,Hayflick developed a cell line from embryonic tissue capable of replicatingmore than 50-fold before becoming senescent (Hayflick and Moorhead,1961). The cell was diploid, easy to freeze and to reactivate and did notshow any evidence of contamination by the viruses normally found inmonkey primary kidney cells. This cell line (WI-38) turned into the basisfor the production of human viral vaccines against poliomyelitis andMMR (measles, mumps, rubella), while other cell lines were evaluated forthe production of veterinary vaccines, such as BHK (baby hamster kidney)in the case of the vaccine against foot-and-mouth disease.
After this period, there was an accelerated use of animal cells. Namalwacells (Finter et al., 1991) were used to produce alpha-interferon by Well-come in 1986. Vero cells (a cell line derived from monkey) were used foranti-rabies vaccine. Hybridomas were considered acceptable for mAbproduction and the use of genetically modified CHO (Chinese hamsterovary) cells was authorized for the production of tissue plasminogenactivator (tPA) by Genentech in 1986.
Finally, three relevant aspects should be mentioned to clarify thescientific, technological, and industrial position of biopharmaceuticals andanimal cells.
(i) Complex biopharmaceuticals, such as proteins, virus or virus-likeparticles (VLPs), among others, produced by cellular and/or recombi-nant technologies are characterized/defined by their own productionprocesses. This means that analytical, biological and immunologicalcharacterization assays are usually not considered sufficient for pro-duct marketing, given the complexity of the molecules. Therefore,product licensing is based on the specific production process, whichcannot be altered. Process changes may require new licensing proce-
2 Animal Cell Technology

dures, and this makes the introduction of biosimilars in the marketmore difficult.
(ii) Some of these proteins (for therapy) or VLPs (for vaccines such ashepatitis B) can be produced by yeast or even by Escherichia colibecause of the limited requirement for post-translational modification(see Chapter 6). The total market value of biopharmaceuticals pro-duced by E. coli or yeast was surpassed by those produced by animalcells only around 1996. In the last few years, market dominance infavor of animal cells has increased significantly.
(iii) Considering the complexity and instability of biopharmaceuticals, theproduction process from animal cells has to be designed, modeled,and optimized in an integrated form, taking into account the culture,extraction, and separation (Cruz et al., 2002). This may be differentfrom what is normal in the production of simple biological com-pounds such as antibiotics or vitamins.
The number of biological processes has increased tremendously in thelast 15 years. This has resulted in high expectation for an improvement ofquality of life and an increase in the volume of business related to productsobtained from animal cell culture technology, with the broad potential useof these products for disease diagnostics, prevention, therapy, and cure.Table 1.1 indicates some examples of approved therapeutic productsobtained through animal cell culture.
1.2 Types of animal cell cultures
The methods developed for obtaining and maintaining primary culturespaved the way for animal cell technology. However, the huge growth andexpansion of this technology was possible only because new cell typeswere established, namely diploid cells, hybridomas, and other continuouscell lines. Animal cells in culture can be classified, according to their origin
Table 1.1 Examples of approved products obtained through animal cell culture
Product Protein Use Cell Approval year
Avonex1
�-Interferon Multiple sclerosis CHO 1996BeneFix
1Factor IX Hemophilia B CHO 1997
Epogen1
Erythropoietin Anemia CHO 1989Gonal-f
1Follicle-stimulatinghormone
Female infertility CHO 1995
Herceptin1/
trastuzumabmAb Breast cancer CHO 1998
Kogenate1
Factor VIII Hemophilia A BHK 1993Simulect
1/
basiliximabmAb Acute transplanted
kidney rejectionMurine myeloma 1998
Campath1/
alemtuzumabHumanized mAb Leukemia CHO 2001
Xolair1/
omalizumabHumanized mAb Asthma CHO 2003
Avastin1/
bevacizumabHumanized mAb Colon or rectum
carcinomaCHO 2004
Introduction to animal cell technology 3

and biology, into primary cultures and cell lines (nomenclature mostfrequently employed in textbooks). However, depending on their applica-tions, animal cells can also be grouped as follows.
(i) Cells producing proteins employed in the production of complextherapeutics, subunit vaccines, and diagnostic products, such asCHO, BHK, HEK-293, WI-38, MRC-5, SP2/0, NS0, and insect cells.
(ii) Cells producing viruses used in gene therapy and viral gene vaccines(for instance, Vero, HEK-293, and PER.C6
1cells).
(iii) Normal cells, tumor cells, and stem cells used in research anddevelopment, specifically in the discovery of new products and for invitro study and toxicology models (e.g. nerve cells, fibroblasts, Caco-2, MRC-5, and endothelial cells).
(iv) Human cells for subsequent use in cell therapy and regenerativemedicine (e.g. embryonic and adult stem cells).
Primary cells are isolated directly from organs or tissues. Primary cellsare normally heterogeneous and better represent the tissue from whichthey originate. These cells have a finite growth capacity and can besubcultured for only a limited number of passages. Subcultured cells,which have been selected to form a population of cells of a single type, aredesignated cell lines, and can be finite or continuous. Finite cell lines (cellscapable of a limited number of generations before proliferation ceases) aswell as continuous cell lines can be propagated and expanded for theproduction of well characterized cell banks, where they are preserved byemploying cryopreservation techniques (Doyle et al., 1994).
A normal tissue usually provides finite cultures, while cultures obtainedfrom tumors can result in continuous cell lines (immortal). Nevertheless,there are many examples of continuous cell lines that are obtained fromnormal tissues and are not tumorigenic, such as BHK 21 (baby hamsterkidney fibroblasts), MDCK (Madin-Darby canine kidney epithelial cells),and 3T3 fibroblasts (Freshney, 1994, 2000). Immortal cell lines can occurspontaneously (rarely) or after a transformation process (more often),which can be induced by carcinogenic chemical agents, by viral infection,or by the introduction in the cell genome of a viral gene or an oncogenecapable of overcoming senescence. Several of the differences betweennormal and neoplastic or tumor cells are analogous to the differencesbetween finite and continuous cell lines, since immortalization is animportant component of the cell transformation process.
The main advantages of continuous cell lines are: (i) faster cell growth,achieving high cell densities in culture, particularly in bioreactors; (ii) thepossible use of defined culture media available in the market, mainlyserum-free and protein-free media; and (iii) the potential to be cultured insuspension, in large-scale bioreactors.
The major disadvantages of these cultures are the accentuated chromo-somal instability, the larger phenotype variation in relation to the donortissue, and the disappearance of specific and characteristic tissue markers(Freshney, 1994).
Many examples of immortalization methodologies and techniques toobtain continuous cell lines are described in the literature (Land et al., 1983;
4 Animal Cell Technology

MacDonald, 1990; Ruley, 1983), including those involving transfection orinfection with viral genes (for instance, the E6 and E7 genes of humanpapilloma virus, and the SV40T simian virus 40 large T-antigen gene) orvirus (such as Epstein–Barr virus and retroviruses). Another strategy is tocreate hybrid cells resulting from the fusion of a cell with a limited lifespanwith a continuous cell. This is the strategy used to obtain hydridomasfor antibody production, as discussed below (see also Chapter 17).
The hybridomas were, to a large extent, responsible for the biotechnol-ogy ‘‘explosion’’ towards the end of the 1970s, opening perspectives forremarkable advances in both the immunotherapy and diagnostic areas. In1975, Kohler and Milstein demonstrated that, despite the impossibility ofcultivating differentiated B lymphocytes in vitro, it was possible after theirfusion with immortal myeloma cells. The hybrid cell lines (hybridomas)can grow continuously and produce and secrete immunoglobulins. Sinceall the immunoglobulin produced derives from a single type of cell, theantibody is monoclonal and is directed against only one epitope. Althoughthe initial studies performed by Kohler and Milstein were restricted to theproduction of mouse mAbs, soon thereafter the production of antibodiesfrom other species, including human, became possible.
As mentioned before, another relevant key development for the progressof animal cell culture technology was the WI-38 human diploid cell lineobtained by Hayflick and Moorhead in 1961, since previously the optionswere the use of primary cultures or of heteroploid cell lines (derived fromtumors or from cells that acquired tumor-like characteristics in culture).Because of that, heteroploid cells were not acceptable for the productionof compounds for human applications, and therefore primary culturesfrom other species were employed (such as primary monkey kidney cells).
After the development of diploid cell lines, i.e. with a diploid karyotype,a new concept of cell line emerged, since these cells are considered‘normal’ cells. They undergo senescence and die in culture after a finitenumber of generations (around 50 generations for WI-38 cells). Thedisadvantages of these cells in culture are that they grow slowly, notreaching high cell densities, present relatively low productivity, are highlydependent on support adhesion for growth, and consequently are noteasily cultured in suspension. Nowadays, the diploid cell line mostfrequently employed is MRC-5, and its use is particularly important forthe study of cell aging mechanisms.
The animal cell lines mentioned above are more extensively discussed inChapters 2, 17, 18, 20, and 21.
1.3 Use of animal cells in commercial production
1.3.1. Animal cell proteins in human diagnosis and therapy
mAbs are currently the most important class of pharmaceutical proteins interms of market volume. Given their enormous biological specificity it isnot surprising that their first clinical applications were the so-calledimmunoassays, such as the ELISA-type assays, for in vitro diagnosis. After1980, however, mAbs also started to be used in association with radio-
Introduction to animal cell technology 5

active markers, in imaging methods, such as immunoscintillography. Inaddition, with higher doses of the radioactive agent used for tumordetection, it became possible to treat cancer. This is the ‘magic bullet’concept initially proposed by Paul Ehrlich at the end of the 19th century.In this application, the antibody directs the radioactive product only tocancer cells, which express large amounts of surface tumor antigens.Instead of radioactive compounds, lymphokines or toxins can also beassociated to the antibodies to cause the death of tumor cells.
The first therapeutic antibody approved (Orthoclone1
OKT-31
orMuromonab CD3, 1986) was indicated not for cancer treatment, but forcontrolling acute rejection of transplanted organs (kidney, heart, andliver). Nowadays, other clinical indications such as asthma, rheumatoidarthritis, psoriasis, and Crohn’s disease are treated with mAbs (seeChapter 17) (Antibody Engineering and Manufacture, 2005; MonoclonalAntibodies and Therapies, 2004; Hot Drugs, 2004; Walsh, 2004).
Many recombinant proteins that are not antibodies are also on themarket for distinct applications (see Chapter 16). Examples are factor VIIIfor hemophilia A treatment (Bayer, 1993, produced from BHK cells),erythropoietin as an anti-anemic agent (Amgen, 1989, produced fromCHO cells) and �-interferon for the treatment of multiple sclerosis(Biogen and Serono, 1996, produced from CHO cells).
Nevertheless, in the last 20 years, the relevance of clinical diagnosis hasincreased significantly, forming the basis for the pharmaceutical strategyknown as pharmacogenomics, which could in the future enable a completecustomization/individualization of pharmaceuticals. A direct connectionbetween diagnosis and treatment could make it possible to introduceindividualized products that were eliminated for general use due to sideeffects that were severe, but occurred only in a limited number of patients.This would be acceptable provided that unequivocal diagnostics can bedeveloped to identify these patients. This process has already been adoptedsometime ago, for instance, to guarantee that patients who are allergic toan antibiotic, such as penicillin, are not treated with it. However, indivi-dualized medical treatment may become more and more frequent to insurethat expensive biopharmaceuticals are administered only to patients whocan benefit from them and avoiding excessive health expenses. Oneexample is the biopharmaceutical ‘trastuzumab’ (Herceptin
1, Genentech),
used for the treatment of a very aggressive breast tumor type that over-expresses the epidermal growth factor receptor type 2 (HER2). Thissituation occurs in only about 25% of breast cancer cases, so only thesepatients are treated with trastuzumab.
The value of therapeutic mAbs marketed in 2004 was above US$ 13billion. At the same time, the market value for the many presentationforms of erythropoietin exceeded US$ 8 billion, and the global biopharma-ceutical market surpassed US$ 50 billion.
It is worth emphasizing that all biopharmaceuticals mentioned here areproduced from mammalian cell culture. The protein production systembased on insect cells known as BEVS (baculovirus expression vectorsystem) is widely employed for the expression of a wide range of proteins,but, due to regulatory issues, biopharmaceuticals produced by insect cellsare not yet in the market. However, some of them are being evaluated,
6 Animal Cell Technology

particularly where supramolecular structures designated VLPs are pro-duced (see Chapter 18).
1.3.2 Cell therapy
In the last two decades, the knowledge about stem cells and, specifically,their expansion and differentiation capabilities has grown significantly.These properties (expansion and differentiation) make stem cells uniquetools for the treatment of a wide range of diseases, for which traditionaltherapies have failed or do not exist. Some of the current applications ofstem cells are listed in Table 1.2.
However, to use these cells in clinical protocols, it is necessary tounderstand the nature and properties of stem cells originating from differ-ent tissues, as well as the mechanisms that make them differentiate intomature, functional cells (Mayhall et al., 2004).
The use of hematopoietic stem cells in bone marrow transplants haspaved the way for other therapies, including transplants of skin, pancrea-tic, and brain cells (Bonner-Weir and Weir, 2005; Laflamme and Murry,2005). The fact that stem cells have been identified both in systems withhigh (e.g. blood and skin) and reduced (e.g. brain) regeneration capacitysuggests that specific stem cells could also be found in many other organsand tissues. The isolation, expansion, and differentiation of these cells,which could in the future make the treatment of degenerative monocellulardisorders (e.g. Parkinson’s disease) possible, provides a great challenge forthe field of animal cell culture.
As an alternative to adult stem cells, embryonic stem cells can be used.These are totipotent and can be obtained from the internal blastocyst cellmass. Because of the capacity of these cells to generate any type offunctional cell, their manipulation and differentiation have gained insignificance. In spite of recent advances (Daley, 2003; Hwang et al., 2004),knowledge on the control of their differentiation and proliferation is stilllacking, but will be necessary to make the exploitation of all theirtherapeutic potential turn into reality. Further discussion on cell therapycan be found in Chapter 20.
Table 1.2 Examples of current applications of stem cells
Source Cell type Applications
Bone marrow Hematopoietic CancerImmunodeficienciesMetabolic diseasesHemoglobinopathiesMyocardial infarction
Neuronal embryonic tissue Neuronal Parkinson’s disease
Skin Epithelial BurnsUlcersGenetic skin diseases
Pancreas Pancreatic Diabetes
Introduction to animal cell technology 7

1.3.3 Tissue engineering
Tissue engineering is a recent discipline that is closely related to celltherapy, but combines knowledge of molecular and cell biology withtraditional concepts from biomaterials engineering, bioreactors, biomecha-nics, and controlled drug release, aiming at the development of newtissues.
The success of tissue engineering depends on the combination of differ-ent factors (Heath, 2000). The first one is to have cells that are capable ofregenerating and, if necessary, an adequate supporting matrix. Recentdevelopments indicate that it may be possible that the cells themselvesmanage to build the tissue structure, without the need for an externalmatrix. Another requirement is an environment that is appropriate for cellgrowth, differentiation, and eventual integration into the surroundingtissue. Since cells are a critical factor, the source from which they originatedeserves special attention. Obtaining a sufficient amount of the appropri-ate cells is of extreme relevance for the regeneration of damaged tissues,particularly in cases when the tissue does not have the ability to self-regenerate or when the native regeneration mechanisms are not sufficient.
There are different cell sources for use in tissue engineering, each ofthem presenting advantages and disadvantages. The best source, in princi-ple, is the patient. The autologous cells so obtained are expanded in vitrofor a later transplant, with no risk of immune reaction. However, theamount of cells obtained from the patient is frequently very limited,especially in cases when cell collection may cause death or in the case ofelderly patients. An alternative is the use of stem cells, particularly thosethat already present some degree of differentiation, but still retain somepluripotency. Although rare, such cells can be propagated and can be usedlater for reconstituting and repairing the damaged tissue.
The first tissue engineering product to be approved targeted the treat-ment of burns and consisted of keratinocytes cultivated in vitro, whichform a tissue that is later transplanted to the patient. Beyond this product,others are already being commercialized for a wide range of applications.Examples are Carticel
1(marketed by Genzyme), which consists of chon-
drocytes employed in the treatment of cartilaginous defects caused byacute or repetitive traumas; Apligraf
1(Novartis), used in the treatment of
venous ulcer; and DACS1SC (Dendreon), utilized for reconstitution of
the immune system after chemotherapy.In terms of the in vitro cell culture techniques required to obtain tissues,
the greatest challenges are somehow similar to those of cell therapy,particularly when cells that are not completely differentiated are used. Thechallenges include the isolation of progenitor cells from the tissue ofinterest, the expansion of pure cultures, and the understanding of thesignals necessary to direct differentiation of a specific cell type, in order toaccelerate the process of repairing the tissue. Also in tissue engineering theuse of embryonic stem cells is possible, but the control of differentiation isequally an area where a deeper knowledge is still required. It is necessaryto assure that the cells introduced into the patient are completely differ-entiated, since even a small percentage of undifferentiated cells in a tissuecan evolve to produce teratomas.
8 Animal Cell Technology

1.3.4 Gene therapy and DNA vaccines
The introduction and expression of recombinant genes in somatic cells, orgene therapy, is also an important application of animal cell culture. Thecells employed in this case may be used at two different levels: in theproduction of vectors that will be later utilized ex vivo or in vivo or asalready transformed cells, which are used directly in vivo in the therapy ofdiseases.
The transfer of genes has been demonstrated both for viral vectors(such as retrovirus, adenovirus, and lentivirus) and nonviral vectors(plasmid DNA and liposomes). Animal cells are used mainly in theproduction of viral vectors, which present a much larger integrationefficacy than non-viral vectors. In this case, the situation is quite similarto the production of proteins. The cells can produce a virus constitu-tively (retrovirus and lentivirus) (Merten et al., 2001) or serve as a hostfor their production (adenovirus and adeno-associated virus) (Ferreira etal., 2005). The production of viral vectors for gene therapy usuallyrequires significant genetic modifications of the cells, since these vectorsmust not be self-replicating, so as not to infect the patient upon therapy.Thus, the producing cells have the genetic information coding for allelements necessary for the construction of the virus, but the vector justcontains the information necessary for the transfer of the therapeuticgene to the target cell. The vectors produced can later be used in vivo,for instance in the treatment of tumors (Shah et al., 2003) or ex vivo forthe transformation of cells that will later be introduced into the patient(Aiuti et al., 2003).
From a prophylactic perspective, the same viral vectors can be utilizedto transfer a gene coding for an immunogenic protein of a given patho-genic agent (viral or bacterial). This is the case of the so-called DNAvaccines, where an immunogenic protein begins to be produced by thehost organism and, thus, a situation similar to the case of an infectionoccurs (Whalen, 1996). This type of vaccine is discussed more extensivelyin Chapter 18.
For gene therapy, hematopoietic stem cells are the most common targetsdue to their capacity for expansion and differentiation. The currentapplications focus essentially on diseases caused by a localized geneticdeficiency. Excellent candidates for gene therapy are those targeting severecombined immunodeficiency (SCID) (Cavazzana-Calvo et al., 2000) andadenosine deaminase deficiency (ADA) (Aiuti et al., 2003), since bothaffect blood cells and are usually treated through bone marrow transplants(Noguchi et al., 1993). In these cases, the progenitor cells transformedwith the respective functional genes complement the immune system ofpatients. See Chapter 21 for a more extensive discussion on gene therapy.
1.3.5 Applications of animal cells in the development of newproducts
The majority of the products currently in use are formed by chemicalagents that can be potentially dangerous for human health. About 80% ofcancer cases are attributed to chemical products found in the environment
Introduction to animal cell technology 9

(industrial chemicals, cosmetics, food additives, drugs, dyes, etc.). Everyyear thousands of new products are developed, which need to be ade-quately tested for toxicity. In February 2001, the European Commissionadopted a ‘White Book’ defining a European strategy for chemicalproducts. One of the aims refers to tests that do not use animals.
Nowadays, the field of toxicology uses different in vivo models (mouse,rat, rabbit, among others) to evaluate the toxic potential of chemicalcompounds. These classical tests using animals present significant limit-ations regarding the applicability of the results to the case of humans, andpose ethical problems due to the use of animals. The application of thecurrent European law implies the sacrifice of 12 million animals, corre-sponding to A 20 billion by 2012.
The development of tests that use cells cultured in vitro instead ofanimals could thus represent an important alternative in this area. Further-more, the use of cell lines and primary tumor cells allows the evaluation ofthe potential of anti-tumor compounds with no need for inducing tumorsin animals. The current protocols are well established for a variety oftumors, for instance in the National Cancer Institute of the USA.
Confidence in in vitro tests represents one of the greatest challenges. Inthis type of test, the use of human cells in culture is especially promisingfor the evaluation of acute and chronic toxicity. Current tests are based onthe growth-inhibiting potential of the chemical compound, as brieflypresented in Chapter 2. The current methods include the determination ofproteins or ATP, or the incorporation of an indicator (neutral red), andthese analyses can be combined with an evaluation of cell morphology.More recently, efforts have been made to use specific cells and incorporategene expression analysis in order to have a more precise determination ofsublethal toxicity to specific organs. At the same time, the development ofhigh-throughput systems has contributed to even greater possibilities forthis type of assay.
The sequencing of the human genome has allowed an increase in thenumber of therapeutic targets from around 500 to about 1000, paving theway for a qualitative improvement not only in the development of newcandidate products, but also in the efficacy of the therapeutic product.Recent advances in areas such as genomics and proteomics allow theassociation of the genetic information to new proteins. Thus, the under-standing of disease mechanisms and their relation to the genes involvedcould be used to predict the possibility of acquiring diseases and also tooffer possible therapies. In this respect, it is expected that new technologiesand strategies involving animal cells will be developed, allowing thedetermination of the security and efficacy of new products with greateraccuracy. These will include tests for the bioavailability of products, theireventual genomic impact and the regulation of target genes, among others,with applications to research and the development of new pharmaceuti-cals, nutraceuticals, or cosmetic products.
1.4 Conclusions
A significant number of industrial cell lines (CHO, BHK, NS2/0) arenowadays well characterized, forming the basis for mature technologies
10 Animal Cell Technology

for the production of recombinant proteins, for both therapeutic anddiagnostic purposes.
Other uses for obtaining more complex products, such as viruses forvaccines, are also well established. However, the use of animal celltechnology for applications such as viral vectors for gene therapy, anti-cancer vaccines, cell therapy, or regenerative medicine (organ and tissueengineering), is in a much more initial phase, since more scientific work isneeded to provide improved technologies and respond to complex regula-tory and ethical questions.
Finally, the most recent ‘stars’ of this area, the stem cells, are still intheir infancy, due to the greater biological complexity that they represent.Their potential uses are so promising, however, that this will assure a greatand continuous effort to determine the controlled conditions needed forexpansion, complete differentiation, and storage, probably in hospitalenvironments.
If we add to all these applications and challenges the dominant positionof animal cell technology in the discovery and development phases of newpharmaceuticals, it is easy to predict two or three decades of continuedexpansion in this field of knowledge and technology.
References
Adams GP, Weiner LM (2005), Monoclonal antibody therapy of cancer, Nat. Biotech-nol. 23:1147–1157.
Aiuti A, Ficara F, Cattaneo F, Bordignon C, Roncarolo MG (2003), Gene therapy foradenosine deaminase deficiency, Curr. Opin. Allergy Clin. Immunol. 3:461–466.
Alves PM, Moreira JL, Rodrigues JM, Aunins JG, Carrondo MJT (1996), Twodimensional versus three dimensional cultures systems: effects on growth andproductivity of BHK cells, Biotechnol. Bioeng. 52:429–432.
Antibody Engineering and Manufacture (2005), Special issue Nat. Biotechnol., vol. 23.Bonner-Weir S, Weir GC (2005), New sources of pancreatic beta-cells, Nat. Biotech-
nol. 23:857–861.Cavazzana-Calvo M, Hacein-Bey S, Basile GS, Gross F, Yvon E, Nusbaum P, Selz F,
Hue C, Certain S, Casanova J-L, Bousso P, Le Deist F, Fisher A (2000), Genetherapy of human severe combined immunodeficiency (SCID)-X1 disease, Science288:669–672.
Cruz PE, Maranga L, Carrondo MJT (2002), Integrated process optimisation: lessonsfrom retrovirus and virus like production, J. Biotechnol. 99:199–214.
Daley GQ (2003), From embryos to embryoid bodies: generating blood from embryo-nic stem cells, Ann. Acad. Sci. 996:122–131.
Doyle A, Griffiths JB, Newel DG (1994), Cell & Tissue Culture: LaboratoryProcedures, John Wiley and Sons, New York, pp. 3:01–3:03.
Ferreira TB, Alves PM, Aunins JG, Carrondo MJT (2005), Use of adenoviral vectors asveterinary vaccines, Gene Ther. 12: S73–S83.
Finter NB, Chapman S, Dowd P, Johnston JM, Manna V, Sarantis N, Sheron N, ScottG, Phua S, Tatum PB (1991), The use of interferon-alpha in virus infections,Drugs 42:749–765.
Freshney RI (1994), Culture of Animal Cells. A Manual of Basic Techniques, 3rd Ed.,John Wiley and Sons, New York, pp. 9–16.
Freshney RI (2000), Introduction to basic principles, In: Masters JRW (Ed.), AnimalCell Culture: A Practical Approach, Oxford University Press, New York, pp.1–16.
Introduction to animal cell technology 11

Griffiths JB (1988), Cell products: an overview, In: Spier RE, Griffiths JB (Eds),Animal Cell Biotechnology, Vol. 3, Academic Press, London, pp. 179–221.
Hayflick L, Moorhead PS (1961), The serial cultivation of human diploid cell strains,Exp. Cell Res. 25:585–621.
Heath CA (2000), Cells for tissue engineering, Trends Biotechnol. 18:17–19.Hot Drugs (2004), Nat. Rev. Drug Discov., Suppl. Vol. 3.Hwang WS, Ryu YJ, Park JH, Park ES, Lee E, Koo, JM, Jeon HY, Lee BC, Kang SK,
Kim SJ, Ahn C, Hwang JH, Park KY, Cibelli JB, Moon SY (2004), Evidence of apluripotent human embryonic stem cell line derived from a cloned blastocyst,Science 303:1669–1674.
Kohler G, Milstein C (1975), Continuous cultures of fused cells secreting antibody ofpredefined specificity, Nature 256:495–497.
Laflamme MA, Murry CE (2005), Regenerating the heart, Nat. Biotechnol. 23:845–856.
Land H, Parada LF, Weinberg RA (1983), Tumorigenic conversion of primaryfibroblasts requires at least two co-operating oncogenes, Nature 304:596–602.
MacDonald C (1990), Development of new cell lines for animal cell biotechnology,CRC Crit. Rev. Biotechnol. 10:155–178.
Mayhall EA, Paffett-Lugassy N, Zon LI (2004), The clinical potential of stem cells,Curr. Opin. Cell Biol. 16:713–720.
Merten O-W, Cruz PE, Rochette C, Geny-Fiamma C, Bouquet C, Goncalves D,Danos O, Carrondo MJT (2001), Comparison of different bioreactor systems forthe production of high titer retroviral vectors, Biotechnol. Prog. 17:326–335.
Monoclonal antibodies and therapies (2004), Supplement to Nature Publishing Group,http://www.nature.com/focus/antibodies/index.html, accessed in February 2006.
Noguchi M, Yi H, Rosenblatt HM, Filipovich AH, Adelstein S, Modi WS, McBridgeOW, Leonard WJ (1993), Interleukin-2 receptor gamma chain mutation results inX-linked severe combined immunodeficiency in humans, Cell 73:147–157.
Powers MJ, Janigian DM, Wack KE, Baker CS, Beer Stolz D, Griffith LG (2002),Functional behavior of primary rat liver cells in a three-dimensional perfusedmicroarray bioreactor, Tissue Eng. 8:499–513.
Ruley HE (1983), Adenovirus early region 1A enables viral and cellular genes totransform primary cell in culture, Nature 304:602–606.
Shah AC, Benos D, Gillespie GY, Markert JM (2003), Oncolytic viruses: clinicalapplications as vectors for the treatment of malignant gliomas, J. Neurooncol.65:203–226.
Spier RE (2000), History of animal cell technology, In: Spier RE (Ed.), Encyclopediaof Cell Technology, John Wiley & Sons, New York, v. 2, pp. 853–872.
Walsh G (2004), Modern antibody based therapeutics, BioPharm. International,December, 18–25.
Whalen, R.G. 1996. DNA vaccines for emerging infectious diseases: What if? Emerg.Infect. Dis. 2: 168-175.
Witkowski JA (1979), Alexis Carrel and the mysticism of tissue culture. Med. Hist.23:279–296.
12 Animal Cell Technology
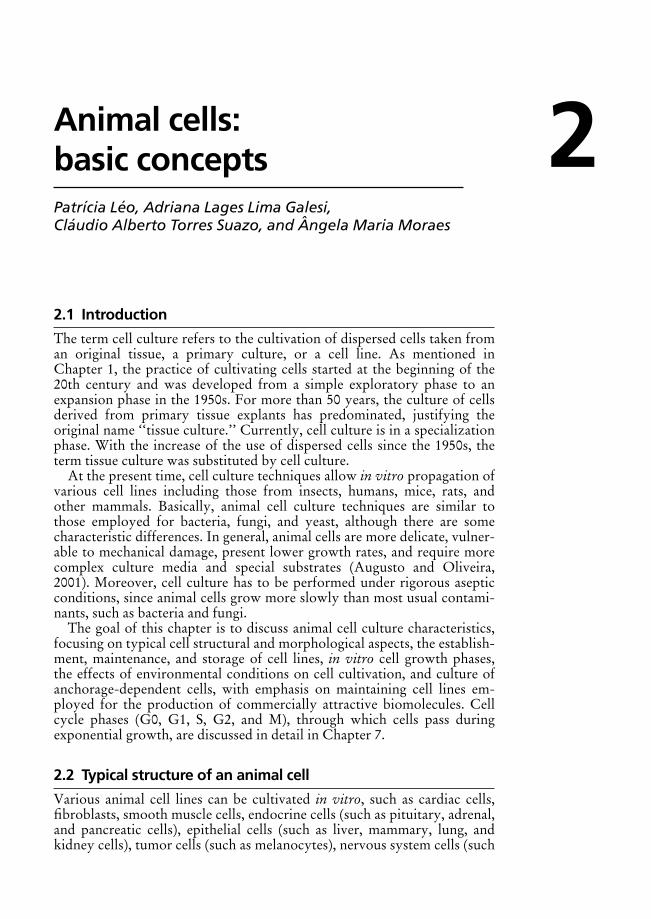
2Animal cells:basic conceptsPatrıcia Leo, Adriana Lages Lima Galesi,Claudio Alberto Torres Suazo, and Angela Maria Moraes
2.1 Introduction
The term cell culture refers to the cultivation of dispersed cells taken froman original tissue, a primary culture, or a cell line. As mentioned inChapter 1, the practice of cultivating cells started at the beginning of the20th century and was developed from a simple exploratory phase to anexpansion phase in the 1950s. For more than 50 years, the culture of cellsderived from primary tissue explants has predominated, justifying theoriginal name ‘‘tissue culture.’’ Currently, cell culture is in a specializationphase. With the increase of the use of dispersed cells since the 1950s, theterm tissue culture was substituted by cell culture.
At the present time, cell culture techniques allow in vitro propagation ofvarious cell lines including those from insects, humans, mice, rats, andother mammals. Basically, animal cell culture techniques are similar tothose employed for bacteria, fungi, and yeast, although there are somecharacteristic differences. In general, animal cells are more delicate, vulner-able to mechanical damage, present lower growth rates, and require morecomplex culture media and special substrates (Augusto and Oliveira,2001). Moreover, cell culture has to be performed under rigorous asepticconditions, since animal cells grow more slowly than most usual contami-nants, such as bacteria and fungi.
The goal of this chapter is to discuss animal cell culture characteristics,focusing on typical cell structural and morphological aspects, the establish-ment, maintenance, and storage of cell lines, in vitro cell growth phases,the effects of environmental conditions on cell cultivation, and culture ofanchorage-dependent cells, with emphasis on maintaining cell lines em-ployed for the production of commercially attractive biomolecules. Cellcycle phases (G0, G1, S, G2, and M), through which cells pass duringexponential growth, are discussed in detail in Chapter 7.
2.2 Typical structure of an animal cell
Various animal cell lines can be cultivated in vitro, such as cardiac cells,fibroblasts, smooth muscle cells, endocrine cells (such as pituitary, adrenal,and pancreatic cells), epithelial cells (such as liver, mammary, lung, andkidney cells), tumor cells (such as melanocytes), nervous system cells (such

as glial cells and neurons), as well as hybridomas. Although these cellshave different origins and functions, they all show a typical structurerepresented in Figure 2.1.
Animal cells have two very distinct compartments, the cytoplasm andthe nucleus, with a constant flow of distinct chemical compounds betweenthem. While the cytoplasm is enclosed in a plasma membrane, the nucleusis enclosed by a nuclear envelope. The different organelles of the cell areimmersed in the cytoplasm. Each of these cellular components has specificcharacteristics and functions that will be discussed below.
2.2.1 Plasma membrane
The cell membrane, also called the plasma membrane, surrounds thecytoplasm and physically separates the intracellular components from theextracellular environment. It has a thickness around 7.5–10 nm andcontrols the flux of molecules between the cytosol and the extracellularenvironment. The plasma membrane is composed of a lipid bilayer, inwhich the polar groups are exposed to the internal and external cellaqueous medium, protecting the embedded hydrophobic tails. Variousproteins with distinct functions can be found partially or totally immersedin this bilayer.
The lipid bilayer has two important properties. First, its interior hydro-phobic environment acts as an impermeable barrier that prevents the
endosome
mitochondria
peroxisomes
plasma
membrane
free
polyribosomes
15 mµ
rough endoplasmic
reticulum with membrane-
bound polyribosomes
nucleus
Golgi complex
lysosome
cytosol
Figure 2.1
Main intracellular compartments of an animal cell. Cytosol, endoplasmicreticulum, Golgi complex, nucleus, mitochondria, endosome, lysosome, andperoxisome are distinct compartments that are isolated from the rest of the cell byat least one selective membrane.
14 Animal Cell Technology

diffusion of hydrophilic solutes through the membrane. This imperme-ability is selectively modulated by the presence of membrane proteins,which mediate the transport of specific molecules through the plasmamembrane. The second bilayer property is its structural stability, main-tained by hydrophobic and van der Waals interactions formed betweenthe lipid chains. Even if the external aqueous environment varies withrespect to ionic strength and pH, the lipid bilayer has the capacity tomaintain its characteristic architecture.
2.2.2 Cytoplasm
The eukaryotic cell cytoplasm consists of the cytosol, which is the matrixthat presents no visible structure even when observed by electron micro-scopy. Organelles and inclusion bodies are immersed in the cytosol. Theorganelles are responsible for intense metabolic activity and include themitochondria, Golgi complex, lysosome, and endoplasmic reticulum (Fig-ure 2.1). Inclusion bodies are less frequent and consist of lipid, carbo-hydrate, and pigment-storing structures.
The cytoplasm usually has a thin peripheral area in contact with cellmembrane, termed the ectoplasm. This area has few organelles and inclu-sion bodies, which tend to be located in the central part of the cytoplasm,named the endoplasm.
Although the basic architecture of all eukaryotic cells is formed bymembranes, organelles, and cytosol, each cell type exhibits a distinctmorphology defined by cell shape and localization of organelles. Thestructural basis of the characteristic morphology of each cell type is thecytoskeleton, a dense network of three classes of filamentous proteins thatpermeate the cytosol and support the cell membrane.
2.2.3 Endoplasmic reticulum
This is an interconnected network of flattened or spherical vesicles andtubules found in the cytoplasm of eukaryotic cells. These structures areenveloped by a membrane that separates the endoplasmic reticulumcavities or cisternae. The cisternae constitute a network of channels that gothrough the cytoplasm and regulate the transport of various cell products,generally to the exterior environment. In some cells the cisternae also serveas a storage area. There are two types of endoplasmic reticulum: granular(or rough) and smooth.
The rough endoplasmic reticulum contains ribosomes on the surfaces, acell structure that will be discussed in the next section. The system formedby endoplasmic reticulum and ribosomes is associated with protein synth-esis. The endoplasmic reticulum also participates in lipid biosynthesis. Indifferent types of eukaryotic cells, the endoplasmic reticulum has differentforms and functions. In muscle cells, in which Ca2þ stimulates contraction,the endoplasmic reticulum participates in the relaxation process, reabsorb-ing Ca2þ ions.
The smooth endoplasmic reticulum also consists of a network of tubulesthat is considerably developed in certain types of special cells, such asthose that secrete steroid hormones.
Animal cells: basic concepts 15

2.2.4 Ribosome
Ribosomes are spherical cell structures enriched with ribonucleoproteinand with a diameter of 15–20 nm. Each ribosome is formed by twosubunits of different sizes, only visible through high resolution electronmicroscopy. Ribosomes connected to the rough endoplasmic reticulumare involved in the biosynthesis of proteins that are temporarily stored ortransported to the cell’s outer environment. Proteins synthesized byribosomes connected to membranes accumulate in the cisternae beforepassage to the plasma membrane for secretion.
2.2.5 Golgi complex
This organelle is also known as the Golgi or Golgi apparatus and is namedafter the Italian cytologist Camilo Golgi, who was one of the first to studyit.
The Golgi has distinct forms in different cell types. The most character-istic arrangement is a stack of circular flattened vesicles, with variablesizes, each one held by a single membrane in which can be found smallerspherical vesicles that bud off from the larger ones. In many cells, theGolgi complex is situated near the cell nucleus but in other cells, it isdispersed in the cytoplasm.
The Golgi complex receives products from the endoplasmic reticulumand packs them in secretory vesicles, which are conducted and fused to theexternal cell membrane. In this process, termed exocytosis, the vesiclecontent is secreted into the outer environment.
2.2.6 Mitochondria
Mitochondria are spherical or, more frequently, elongated bodies, consist-ing of two membrane units. The inner one is folded in the form of tubulesor shelves, named cristae.
Mitochondria are enzyme-rich structures that catalyze the oxidation oforganic nutrients by oxygen molecules, producing carbon dioxide andwater. Some of these enzymes are located in the matrix and some in theinternal membranes. Chemical energy is released during these oxidationprocesses and is used to generate adenosine triphosphate (ATP), the mostimportant cell energy carrier molecule. ATP synthesized by mitochondriadiffuses throughout the cell and is utilized for many cellular functions.
The mitochondria also contain small quantities of DNA, as well asRNA and ribosomes. Mitochondrial DNA encodes the synthesis of cer-tain specific inner cell membrane proteins. Mitochondria can also divideduring cell replication.
2.2.7 Lysosome
Lysosomes are spherical organelles, enveloped by a membrane and con-taining several hydrolytic enzymes that present maximal activity at acidicpH. These enzymes are synthesized in the rough endoplasmic reticulum.Lysosomes are reservoirs of different enzymes capable of degrading
16 Animal Cell Technology

macromolecules by hydrolysis such as proteins, polysaccharides, andlipids. As these enzymes may be harmful to other cell components, theyremain segregated in the lysosomes. Proteins and other components to bedegraded are selectively transported to the lysosomes and are then hydro-lyzed to their fundamental units, which are afterwards secreted into thecytoplasm.
2.2.8 Peroxisome
Peroxisomes or microbodies are spherical organelles that are 0.3–1.5 �min diameter. Each peroxisome is enveloped by a single external membrane,and its interior is full of proteins, frequently in crystalline form. Peroxi-somes are characterized by the presence of various oxidative enzymes,which have variable functions dependent upon the origin of the peroxi-some. These enzymes generate and utilize hydrogen peroxide (H2O2),hence the name peroxisome. This compound is very toxic for cells and isdecomposed by the enzyme catalase to water and oxygen.
2.2.9 Nucleus
The nucleus of eukaryotic cells is a very complex structure, containingvarious components. It is separated from the rest of the cell by twomembranes named the nuclear envelope. At regular intervals, the twomembranes of the nuclear envelope form pores with a diameter of around90 nm. These pores regulate flux of macromolecules to and from thecytoplasm. Inside the nucleus is located the nucleolus, which acts toproduce ribonucleic acid (RNA), which is the first step for ribosomesynthesis.
Chromatin occupies the remaining part of the nucleus and consists ofDNA, RNA, and specialized proteins. Between cell divisions, chromatinis dispersed in the nucleus but, immediately before cell division, chromatinis arranged in granular bodies named chromosomes. After replication,daughter chromosomes are separated and distributed to daughter cellsduring the mitosis process, after which the chromatin is dispersed again.
2.3 Cell culture
2.3.1 Establishing a cell line
Cells can be cultivated in vitro after a tissue is dissected and totally orpartially disaggregated by enzymic treatment. Cell, explants, or organcultures can be established depending on the degree of disaggregation ofthe tissue, as shown in Figure 2.2.
Primary cultures are those obtained directly from organ or tissuefragments, following enzymic or mechanical disaggregation. For enzymictreatment, trypsin or collagenase may be used and may be mixed withEDTA (ethylenediaminetetraacetic acid). Primary cultures can originatefrom animal or human tissue. A culture is considered a primary culture upto its first subculture or passage; after that it is named a cell line. Figure 2.3
Animal cells: basic concepts 17

Cell
culture
Dissection
Adult Egg
Enzymatic
digestion
Finely chopped
tissue
Further
dissection
Primary
explant
Organ
culture
Embryo
Figure 2.2
In vitro culture types of animal cells (adapted from Freshney, 2000, 2005).
6
8
10
12
14
16
18
20
The
oret
ical
cel
l yie
ld(L
og [c
ell n
umbe
r])
0 4 8 12 16 20Culture time (weeks)
Primary
cultureFinite cell line
Continuous cell line
1S
ubcu
lture
st 2S
ubcu
lture
nd
TRANSFORMATION
Subculture
intervalSerial
passages
SENESCENCE
AND DEATH
Figure 2.3
Typical evolution of a cell line (adapted from Freshney, 2000, 2005).
18 Animal Cell Technology

shows a schematic diagram of the sequence of events associated withsubculture of a normal primary cell culture.
Primary cultures are initially heterogeneous, but fibroblasts may be-come predominant after some growth. Obtaining primary cultures islaborious and cells can be maintained in vitro for only a limited period.During this period, cells generally maintain the differentiated character-istics of the original tissue from which they were harvested.
During primary culture, cells may be subjected to considerable stress.For instance, the enzymatic dissociation of organ fragments or adherentcells breaks cell–cell or cell–surface interactions. Dissociated cells gener-ally change their shape, becoming rounded and losing their phenotypicpolarity, modifying protein distribution in cell membrane.
Certainly not all cells survive cell manipulation but those that surviveshould be able to correct any injuries and adapt to environmental changes.Culture adaptation is time-consuming and is influenced by culture condi-tions. Cells condition their environment through the release of substancesinto culture medium, such as growth factors, which promote cell adher-ence and proliferation. Some cell lines can adapt, proliferate, and differ-entiate faster if culture medium is previously conditioned by cells in activegrowth. Environmental conditioning can also be achieved by adding cellsto medium already inoculated with a non-mitotic viable cell population,named feeder cells. These cells can be prepared from 3T3 fibroblastic cellsexposed to gamma radiation or treated with mitomicin C (Rheinwald,1989).
After successive subcultures of a very heterogeneous primary culture,containing many cell types of the original tissue, a more homogeneous cellline with a higher growth rate may arise. A cell line can be seriallypropagated in culture, usually for only a limited number of cell divisions.Finite cell lines are generally diploid and maintain some degree ofdifferentiation. Nevertheless, these cell lines die after a limited number ofgenerations, the Hayflick limit, which is usually about 30–50 divisioncycles depending on the origin of the cells (Hayflick and Moorhead, 1961).
The immortalization of a cell line can be accomplished as a spontaneousprocess, by an oncogene or virus or by chemical treatment. This can leadto a continuous cell line that can be propagated for an undeterminedperiod. If such changes occur with an affect on cell cycle control, the cellline can be designated a transformed cell line.
According to Freshney (2000), the main characteristics of transformedcell lines are: (i) altered cell morphology (smaller, less adherent, or morerounded cells, with a higher nucleus to cytoplasm ratio); (ii) higher growthrate (duplication times decrease from 36–48 hours to 12–36 hours); (iii)less dependency on blood serum or selected growth factors; (iv) increasein cloning efficiency; (v) increase in heteroploidy (chromosomal variationbetween cells) and in aneuploidy (divergence from the original diploidnumber); (vi) increase in tumorigenicity. Some of these characteristics areassociated with malignant transformations. The main advantage of trans-formed cells for cell culture is the almost unlimited cell supply. However,a disadvantage is that the cells generally maintain few characteristics oftheir original tissue.
Animal cells: basic concepts 19

2.3.2 Cell line maintenance
When a primary culture or a cell line is initiated, a periodic change ofculture medium is necessary, followed by subculture if the cells areproliferating. Culture medium changes should be performed even incultures showing no cell proliferation, since cells can metabolize anddeplete nutrients from the medium. Also, some nutrients may degradespontaneously. Intervals between medium changes and subcultures mayvary depending on the cell line, growth rate, and metabolism. An increasein cell density, pH decrease, nutrient depletion in the medium, or altera-tion in cell morphology indicate the need for culture medium replacement.
Animal cells may be anchorage-dependent. Cells that depend on a solidsubstratum for growth are named adherent cells. These cells normallyproliferate in monolayers and show contact inhibition, with the maximumcell yield generally limited by the available surface of the culture vessel.The yield of cells in suspension is not dependent on a solid substratum.
Table 2.1 shows some adherent and suspension cell lines that arecommonly cultured. Cell shape usually reflects their origin. Blood cells(such as those derived from lymphomas) generally grow in suspension,while cells derived from solid tissues (such as kidney and liver) areadherent cells. Typical morphologies of different cell types are shown inFigure 2.4 (see color section).
Since adherent cells proliferate only after cell surface adhesion, anunderstanding of the steps of this process is very important. The first stepconsists of the adsorption of adhesion factors to the substratum, such as
Table 2.1 Adherent and suspension cell lines commonly employed in animalcell culture
Name Cell type and tissue origin Morphology
Adherent cellsMRC-5 Human lung FibroblastHeLa Human cervix EpithelialVero African green monkey kidney EpithelialNIH 3T3 Mouse embryo FibroblastL929 Mouse connective tissue FibroblastCHO Chinese hamster ovary FibroblastBHK-21 Syrian hamster kidney FibroblastHEK-293 Human kidney EpithelialHEPG2 Human liver EpithelialBAE-1 Bovine aorta Endothelial
Suspension cellsNS0 Mouse myeloma Lymphoblastoid-likeU937 Human hystiocytic lymphoma LymphoblastoidNamalwa Human lymphoma LymphoblastoidHL60 Human leukemia Lymphoblastoid-likeWEHI 231 Mouse B-cell lymphoma LymphoblastoidYAC 1 Mouse lymphoma LymphoblastoidU 266B1 Human myeloma LymphoblastoidSH-SY5Y Human neuroblastoma Neuroblast
Adapted from ECACC Handbook, 2005.
20 Animal Cell Technology

vitronectin and/or fibronectin glycoproteins and often associated to Ca2þions. These factors can be derived from serum or can be produced by thecells themselves. The second step consists of contact of the cell with thesurface, while in the third step, cells attach to the covered surface,producing multivalent heparin sulfate proteoglycans, which bind to cellmembrane glycoproteins. In the fourth step, cell spreading over the solidsurface occurs.
As vertebrate cells have negative charges non-uniformly distributed overtheir external membrane surface, solid substrata with a hydrophilic surfaceare required, with an adequate distribution of the surface charge.
For the subculture of adherent cells, removal of culture medium and thedetachment of cells from the monolayer are necessary. This detachment isusually performed with trypsin, but other proteases, such as pronase,dispase, and collagenase, can be employed. In general, a chelating agent,such as EDTA, is also added to capture the Ca2þ ions involved in the celladhesion process. Some cell lines bind weakly to surfaces and, in small-scale cultures, can be removed mechanically by gently tapping or hittingthe culture flask by hand.
For cells growing continuously in suspension, the subculture processcan be performed similarly to the method used for microbial cultures.Trypsin treatment is not required and subculture is faster and lesstraumatic for the cells. Total medium exchange is not generally performedfor these cultures since it would require a centrifugation step. Culturemaintenance can be performed by dilution with fresh medium afteradequate cell growth.
Some cell lines can proliferate as semi-adherent cells, and the populationis a combination of suspended and adherent cells. To maintain the hetero-geneous nature of such cultures, both suspended and adherent cells shouldbe subcultured.
Suspension cultures present some advantages in comparison with adher-ent cell cultures. Large cell quantities can be attained without increasingthe superficial area of the substratum. Also, a steady state can be reached ifnutrients are continuously supplied and cell concentration is kept con-stant. This can rarely be achieved with a monolayer culture. Cells indifferent modes (adherent or suspension) behave differently with regard toproliferation, enzymatic activity, glycolysis, respiration, specialized pro-duct synthesis, and many other properties.
2.4 Cell growth phases
Normal cells in culture show a sigmoid pattern of proliferative activitythat reflects culture adaptation, environmental conditioning, nutrientavailability and, for adherent cells, available free adhesion surface.
Cell growth phases comprise lag phase, exponential or log growthphase, stationary or plateau phase, and senescence or death phase, asshown in Figure 2.5. Cell growth can be mathematically represented bythe following general equation:
dX
dt¼ �:X (1)
Animal cells: basic concepts 21

where � refers to specific cell growth rate, X is cell concentration and t isthe culture time.
The lag phase occurs after cell inoculation. In this phase, there is no celldivision or division takes place at low specific rates. It is an adaptationperiod in which adherent cells may resynthesize the glycocalyx elementslost during trypsinization, bind, and spread on the substratum. Duringspreading, the cytoskeleton reappears and new structural proteins aresynthesized (Freshney, 2005). The duration of the lag phase is dependenton at least two factors: the point in the growth phase from which cellswere taken in the previous culture and the inoculum concentration. Cellsoriginating from an actively growing culture have a shorter lag phase thanthose from a quiescent culture. Cultures initiated at low cell densitiescondition the culture medium more slowly and hence increase the dura-tion of the lag phase, which is not desirable.
Exponential or log phase is a period of active proliferation during whichthe cell number increases exponentially. In the log phase, the percentage ofcells in division can reach 90–100%, and cells are in their best physiologi-cal state, which is ideal for cell function studies. During the log phase,there is a kinetic profile typical of all cell lines. The cell doubling time (td)can be determined through the direct integration of equation 1, since � isconstant and, in this phase, attains a maximum value (�max), resulting in:
td ¼ ln 2
�max
(2)
D
Culture time
Log
(cel
l con
cent
ratio
n)
CBA
µ 0�
µ 0� µ 0�
µ � maxµ
Figure 2.5
Normal animal cell growth curve pattern, in which � is the specific cell growthrate. Lag phase (A) represents the culture adaptation period, followed by anexponential cell growth phase (B) until the attainment of a stationary or plateauphase (C), in which there is no increase in cell number. The culture reaches thesenescence phase (D) when the percentage of cells in division becomes lower thanthe percentage of cells dying.
22 Animal Cell Technology

Factors that influence the duration of the log phase are inoculumconcentration, cell growth rate, nutrient availability, and accumulationof inhibitory metabolites. For adherent cells, the end of the log phasemay also occur at confluence, when cells cover all the availablegrowth surface, at which point contact inhibition restricts furthergrowth.
During the stationary or plateau phase, cell growth rate is reduceddue to low nutrient concentrations and the accumulation of inhibitorymetabolites. In some cases, proliferation almost completely ceases. Dur-ing this phase, cell division is equilibrated with cell death, and thepercentage of cells in division is at most 10%. At confluence the growthof adherent cells is inhibited by cell to cell contact but a certain degreeof mitotic activity may still be observed. Cells occupy a smaller surfacearea, exposing less of their own membrane surface to the culturemedium. A relative increase in specialized protein synthesis (as opposedto structural proteins), as well as a change in cell surface compositionand charge modification may occur (Freshney, 2005). The stationaryphase may be prolonged if the culture medium is replenished with freshmedium. This is not a stable period for most cell lines, and they aremore susceptible to injuries.
The stationary phase is followed by a decline period in which cell deathis not compensated by cells in proliferation. Cell death can occur by twodistinct mechanisms, named necrosis and apoptosis. Necrosis occurs as aresult of an irreversible injury and normal homeostasis is lost. In vivo, thisform of death generally affects the neighboring cells and may result ininflammation. Autodestruction occurs by activation of hydrolases whenthere is a lack of nutrients and oxygen, followed by progressive disorgani-zation and complete disintegration of the cell.
Apoptosis, on the other hand, occurs through the activation of abiochemical program involving a cascade of cell components, which isinternally controlled, requiring energy and not involving inflammation invivo. The most frequently observed biochemical events during apoptosiscomprise caspase activation, mitochondrial membrane permeation, leakageof diverse molecules from the mitochondria, nuclease activation, cytoske-leton destabilization, externalization of phosphatidylserine to the outermembrane, and protein interconversion. This topic is discussed moreextensively in Chapter 7.
The determination of the cell growth profile is important to evaluate thespecific characteristics of a cell line culture. Cell behavior and biochemis-try are significantly altered in each growth phase. Hence, knowing thegrowth curve of each cell line is important for establishing the mostadequate inoculum concentration, prediction of the length of an experi-ment, and the most appropriate time intervals for sampling.
Cell concentration in suspension can be determined through an opticalmicroscope employing a hemocytometer for manual cell counting, or in asemi-automatic way using an electronic particle counter (such as a Coultercounter), as described in detail by Freshney (2005). Through dye exclusion(such as trypan blue), it is possible to determine viable cell concentration,that is the number of cells in a known sample volume capable ofproliferating in favorable culture conditions.
Animal cells: basic concepts 23

2.5 Influence of environmental conditions on animal cell culture
Cell culture systems must provide the physiological conditions for cellsurvival and proliferation. In vitro, animal cell growth is dependent onseveral factors, such as pH, temperature, osmolality, gas concentration(oxygen and CO2), available surface substrata, and state of the cells atinoculation (Freshney, 2005). Other factors that impact the culture aremedium composition, which can differ extensively between cell lines andis discussed in detail in Chapter 5, as well as susceptibility to hydrody-namic stress, as discussed in Chapter 7.
2.5.1 pH
pH control is fundamental for in vitro cell culture. Most mammalian celllines proliferate at pH 7.4. Although the optimal pH value for cell growthdoes not vary too much for different cell lines, some normal fibroblastsproliferate well at a pH range between 7.4 and 7.7, and transformed cellshave an optimal growth at a pH varying from 7.0 to 7.4. Insect cells showbetter proliferation at lower pH values, from 6.2 to 6.5.
It is possible to monitor pH variation by adding a pH indicator. Thecompound most used is phenol red, which is rose-colored at pH 7.8, red atpH 7.4, orange at pH 7.0, and yellow at pH 6.5. Nevertheless, it isconvenient to point out that most commercially available phenol redcontains impurities that could influence cell behavior. Also, this com-pound can interfere with the interpretation of experimental data obtainedby the use of fluorescence and absorbance techniques.
Culture medium needs to be buffered to compensate for CO2 and lacticacid derived from glucose metabolism. Most culture media employed foranimal cells are buffered with CO2 originating from the gaseous phase, inequilibrium with sodium bicarbonate (NaHCO3) added to the culturemedium, as described by the following equilibrium reaction:
CO2 þH2O $ H2CO3 $ Hþ þHCO3� (3)
NaHCO3 $ Naþ þHCO3� (4)
An increase in CO2 tends to increase Hþ and HCO3– in reaction (3),
consequently increasing medium acidity. In compensation, the increase inHCO3
– causes NaHCO3 formation through reaction (4), until an equili-brium is reached at pH 7.4. In summary, a medium pH decrease due to aCO2 increase in the gas phase is neutralized by the action of sodiumbicarbonate, with the pH stabilizing at 7.4. Traditionally, culture mediaare buffered with sodium bicarbonate at a final concentration of 24 mM.
When cells are growing at low densities or are in a lag phase, they donot produce CO2 in sufficient quantities to maintain the pH at an optimalvalue. Decreasing the CO2 content in the gaseous phase results in anincrease in the culture equilibrium pH. Therefore, the control of CO2
concentration allows appropriate maintenance of culture pH (Kilburn,1991).
This type of buffering is of low cost, non-toxic, and also provides otherchemical benefits for the cells. Each basal medium has its own bicarbonate
24 Animal Cell Technology

concentration and CO2 tension recommended to attain the correct pHand osmolality values. Table 2.2 indicates the recommended NaHCO3
and CO2 concentrations for a set of commonly employed basal media.The gas phase in contact with cell culture in an incubator is usuallyadjusted to 5–10% of CO2 in volume (90–95% air).
In some situations, the utilization of a system with a higher bufferingcapacity is needed. In this case, organic buffers can be employed, and inthis category, the most widely used is Hepes (N-2-hydroxyethylpipera-zine-N9-2-ethanesulfonic acid). Buffering with Hepes is most effective atthe 7.2–7.6 pH range, and this compound is more resistant to rapidalterations in culture conditions. When using Hepes, a controlled gaseousatmosphere for mammalian cell growth is not required. Some media areefficiently buffered by Hepes and bicarbonate mixtures. Nevertheless,Hepes is relatively expensive, and is toxic for cells in concentrations above100 mM.
For insect cells, culture medium is buffered with sodium phosphate, andthe use of CO2 or pH indicators is not required.
2.5.2 Osmolality
Most cell lines present a wide tolerance range to osmotic pressure. Giventhe osmolality of human plasma (290 mOsm/kg), it may be reasonable toassume that this is an optimal value for human cells cultivated in vitro,although it can be different for cells from other species. As a general rule,the optimal osmolality range for mammalian cells in culture is from 260 to320 mOsm/kg, while for insect cells higher values are optimal, from 340 to390 mOsm/kg.
In laboratory and industrial practice it is important to verify theosmolality of all culture media after alterations in their basic formulation
Table 2.2 Recommended values of NaHCO3 in the liquid phase and CO2
concentration in the gas phase to be employed with traditional basal media
Basal medium NaHCO3 concentrationin medium (mM)
CO2 percentage in gaseousphase
Mammalian cells culture mediaEagle MEM* 4 Atmospheric airIMDM 36 5TC199 26 5DMEM/Ham’s F12 29 5RPMI 1640 24 5Ham’s F12 14 5DMEM 44 10
Insect cells culture mediaGrace* 4 Atmospheric airIPL-41* 4 Atmospheric airTC100* 4 Atmospheric airSchneider* 4 Atmospheric air
From Davis, 2002.*With Hanks’s balanced salts solution.
Animal cells: basic concepts 25

due to the addition of salt solutions, supplements, pharmaceuticals, andhormones, or large quantities of buffering agents. Also, metabolic trans-formations that occur during cell culture can cause osmolality changes.
Culture medium osmolality can also increase due to evaporation, sinceculture flasks are generally not sealed so as to allow equilibrium be-tween culture medium and the CO2–air gas mixture. A slightly hypo-tonic culture medium can be more adequate for open cultures inmultiple well plates or in Petri dishes to compensate for evaporationduring incubation. To avoid large variations in osmolality duringculture, the relative humidity of the culture environment should bemaintained near to saturation.
2.5.3 Temperature
Temperature plays a very important role in cell culture. It has a criticalinfluence on cell growth and it affects the solubility of various mediumcomponents, especially of gases such as CO2 and O2, which have lowsolubilities. Most mammalian cells have optimal growth rates within therange of 35–378C. Insect cells grow at optimal temperatures of 26–288C,while cold-blooded vertebrate cells normally grow well at lower tempera-tures.
2.5.4 Oxygen supply
The most important components of the gaseous phase are oxygen andcarbon dioxide. Monitoring and controlling these gases in culture mediumare essential for in vitro animal cell culture.
Cultures vary significantly with respect to oxygen demand, but ingeneral, for most cells, oxygen partial pressure conditions slightly belowatmospheric pressure are preferred. Because of that, maintenance ofdissolved oxygen concentration at a range from 30 to 60% for mammaliancells is important.
Oxygen is frequently the first component to be limiting in high celldensities due to its low solubility in aqueous medium. Aeration should beperformed gently and can be done by the following methods, eitherdirectly or in an isolated vessel: surface aeration, gas bubbling, diffusionthrough membranes, increasing O2 partial pressure and atmosphericpressure.
For surface aeration of static cultures, in a closed system, a void volume10 times larger than the culture medium volume is necessary for adequateoxygen supply. In agitated cultures with surface aeration, oxygen transferis dependent on agitation rate and impeller geometry.
Gas bubbling is a simple and efficient way to transfer oxygen. Never-theless, this procedure can cause damage to animal cells due to bubbleformation. Alternatively, oxygen can be efficiently transferred to culturemedium through hydrophobic membranes (silicon tubes), but this meth-od is inconvenient, presents high cost, and is difficult to scale up, sincethe tube length for adequate oxygen supply in high capacity reactorsneeds to be very long. An increase in O2 partial pressure also increasesoxygen solubility and its diffusion rate, but it should be employed only
26 Animal Cell Technology

at high cell density, otherwise oxygen toxicity effects could occur.Although oxygen is essential for cell growth, it can be toxic in highconcentrations.
Nonstatic cultures of animal cells are common with agitation andaeration performed as associated operations. These processes, allied to thefact that animal cells do not possess a cell wall, can result in cell damage ifthey are intense, provoking effects that alter cell metabolism, cell cycle,DNA synthesis, and protein expression, and induce cell death by apoptosisor necrosis.
For suspension cultures, cell injury can occur due to the disruption ofascending bubbles or of those associated with the foam accumulated at thesurface. Many additives, such as serum and the surfactant Pluronic
1F68,
have been employed since the 1950s to protect cells from fluid-mechanicalforces.
Serum is known as a good cell protector agent (Cartwright, 1994), andthis effect is normally attributed to the increase in medium viscosity.However, since there is a strong tendency to eliminate serum from currenttechnological applications of animal cell cultures, the use of methylcellu-lose and carboxymethylcellulose as serum substitutes has shown verypromising results. For more complex cases, in which fluid-mechanicalprotection is required, as in bioreactors with intense agitation and bub-bling aeration, the use of Pluronic
1F68 at 0.1% (v/v) concentration can
result in an efficient cell-protecting effect.
2.5.5 Composition and nature of the substratum for cell adhesion
Adherent animal cells (anchorage-dependent) need a surface for adhesion,spreading, and proliferation. Glass and plastic are the most commonmaterials employed as a solid substratum.
For several decades, glass was the only substratum used for animal cellculture. As a consequence, the common term ‘‘in vitro’’ means ‘‘in glass.’’Animal cells present good adhesion on glass surfaces, especially borosili-cate surfaces, that have a high silica content. Glass is still used as a solidsubstratum on a small scale, but very rarely in cultures aiming at high cellquantities.
The use of plastic materials for routine cell culture on the laboratoryscale was introduced at the end of the 1960s, and some characteristics ofglass surface, such as hydrophobicity and negative charge, were main-tained in these materials. Polystyrene is the most widely used plasticmaterial for animal cell adhesion at present, because of its surface charac-teristics, its low cost, and also its transparency. For more demanding celllines, the surface has to be submitted to a treatment that involves coatingwith proteins such as poly-lysine, poly-ornithine, or extracellular matrix-derived proteins such as fibronectin, laminin, and collagens.
The use of microcarriers as substrates is recommended for adherent cellculture on larger scales. Microcarriers are generally spherical particles thatprovide a large effective area for cell adhesion, allowing adherent cellculture in homogeneous agitated systems. Microcarriers can be producedfrom a variety of materials such as glass, dextran, agarose, collagen, ormodified polymers, and are easily recovered. The same requirements to
Animal cells: basic concepts 27

obtain adequate cell adhesion and growth in culture flasks are applicable.Cell growth characteristics and animal cell culture applications on micro-carriers are further discussed in other chapters of this book.
2.6 Cryopreservation and storage of cell lines
Cells can be unstable when in culture for long periods, exhibiting altera-tions in their morphology, function, growth pattern, and karyotype. Ani-mal cells show in vitro changes related to age and some cultures can sufferspontaneous transformation, showing altered growth or changes in func-tional characteristics. When adequately frozen, cells can be preserved forlong periods without alterations in viability or in other characteristics.Thus, a cell bank, consisting of frozen and stored cell lines, makes itpossible to maintain the cultures as a renewable source. This procedureenables repeated cultures to be performed with cells having equivalentcharacteristics, with consistent passage numbers. Cells stock also mini-mizes the risk of losing a culture due to accidents such as contaminationby microorganisms or other cell lines, or due to failure of equipment suchas CO2 incubators.
Culture conditions influence the survival of cells submitted to cryopres-ervation. To be frozen, cells should be in an active growth phase, with aviability greater than 90% and free of contaminants. The optimal cryopres-ervation conditions are different for each cell line. When a cell is exposedto low temperatures, ice crystals are generally formed and can disrupt thecell membrane, causing death. Therefore, cells should be treated with acryoprotector to support the freezing and thawing processes.
The optimal cell concentration in a suspension of cryoprotector mediumdepends on the cell type and is determined empirically, but is generallywithin the range of 1 3 106 to 1 3 107 cells/ml. When added to medium atconcentrations between 5 and 10% (v/v), cryoprotectors such as glycerolor dimethylsulfoxide (DMSO) affect membrane permeability, allowingwater release from the cell interior during cooling. Cryoprotectors de-crease the freezing point, and ice crystals start to be formed at –58C: Waterefflux plays a key role in the freezing process. With cell dehydration,occurring at between –58C and –158C, ice crystals are formed around thecells and not inside them. The cooling velocity is also critical and shouldbe low (about 18C/min). Freezing conditions should minimize crystalformation in the cell interior, preventing lysis. For cells cultivated in thepresence of serum, the cryopreservation medium should also contain fetalbovine serum to protect cells from the stress associated with the freezingand thawing processes. Generally, serum is added at concentrations above20%, and can attain 90% of volume of the cryopreservation medium.
Frequently cells are stored immersed in liquid nitrogen at –1968C.However, storage in vapor phase liquid nitrogen (at –1408C to –1808C) isrecommended, avoiding possible contaminations or cell death in case ofcryotube rupture.
During cell thawing, the heating rate should be high. As a generalpractice, flasks containing frozen cells are immersed in water at 378C, andthawing occurs in about 90 seconds. Some cells are particularly susceptible
28 Animal Cell Technology

to osmotic shock during thawing and culture medium transfer processes.Routine protocols normally describe a dilution stage (1:10 to 1:20 v/v), inwhich fresh culture medium should be gradually added to the thawed cellsuspension. Alternatively, cells can be suspended initially in a solvent thatdoes not permeate the cells, equimolar to the cryoprotector, which wouldallow its diffusion from cell membrane before transferring the cells to anisotonic medium.
For cell line storage, a cell bank is generally established, with initiallythree to five flasks. One of these flasks is then thawed and the cellpopulation is expanded to produce a master bank with about 10 to 20flasks, depending on future requirements.
As a quality control, some flasks of this bank (about two or three)should be used to confirm that the cell bank concentration and viabilityare satisfactory and free of contaminants. Then, a flask of the bank shouldbe thawed and the cells cultured to obtain a working bank. The size of thisbank will depend on the future demand. At this stage it is important toconfirm that the master and the work banks are genetically identical.
Cell bank management insures the maintenance of the cell line originalcharacteristics, consistency, use of cells with the same passage number,and also the availability of the cells for culture when required.
2.7 Culture quality control and laboratory safety
Cell culture practice requires rigorous control with respect to the qualityof material and reagents, the origin and integrity of the cell lines, and theabsence of microbial contamination.
The culture system should be totally free of compounds that can causetoxic or inhibitory effects. High concentrations of a culture mediumcomponent in culture may be growth inhibitory, even if only by increasingthe osmolality. Contaminants in medium components and in the wateremployed for culture media formulation can also be toxic. Flasks that havenot been well rinsed can expose cells to significant quantities of detergentsor other components that are prejudicial for cell culture. Light (particu-larly short wavelength) can interact with certain culture medium compo-nents, such as riboflavin, tyrosine, and tryptophan, and generate toxicproducts.
Obtaining cell lines from known and safe sources is important toguarantee the use of well-characterized and authentic cells with respect toDNA profile, species of origin, and contaminants.
Microbial contamination is the most frequent problem in cell culture.The main contaminant types are bacteria, fungi, mycoplasmas, and viruses.Bacterial and fungal contamination is detected by a rapid increase inmedium turbidity or by a rapid pH change. After contamination, animalcells generally survive for a short period. Mycoplasma contamination isthe most difficult to detect and can cause a reduction in cell growth rate,morphological alterations, chromosomal aberrations, and changes in meta-bolism of amino acids and nucleic acids. Virus contamination causeschanges in cell growth rate, and fetal bovine serum is usually the mainsource of this kind of contaminant. Some cell lines are immortalizedemploying virus, but these cases are not considered as contaminations.
Animal cells: basic concepts 29

Another problem that is underestimated in animal cell culture is theroutine use of antibiotics. Continuous utilization of these compounds isnot advised because it favors the development of resistant microbial strainsthat become difficult to eradicate, requiring the need for potent antibioticsthat could be more toxic to the animal cells. Furthermore, the use of thesecompounds tends to mask contamination at reduced levels.
When contamination occurs, it is recommended to discard the cultureand continue working with contaminant-free stocks. If this is not possible,antibiotics could be used to try to eradicate the contamination. Neverthe-less, viral contaminations cannot be treated since viruses do not respond toantibiotics. Removing them by centrifugation or other separation techni-ques is not possible, since they are intracellular parasites. If virus-freestocks do not exist, a risk evaluation should be performed before continu-ing to work with the infected cell line.
A cell culture laboratory, in which activities are restricted to manipula-tion of established or pathogen-free derived cell lines, is a relatively safeworkplace. Major risks are related to potential injuries resulting fromliquid nitrogen manipulation or glassware accidents.
When developing activities involving cell lines carrying pathogens orprimary cultures derived from infected animals, there is a potential risk ofoperator infection. Viruses present the highest contamination risk, butmany bacteria, fungi, mycoplasmas and parasites can also be harmful tothe operator.
Continuous cell lines not derived from humans or primates and well-characterized diploid human cells lines with a finite lifespan, for exampleMRC-5 cells, are considered low risk cell lines. Poorly characterizedmammalian cell lines are classified as medium risk cells. Among high riskcell lines, are human and primate tissue cells, cell lines carrying endogen-ous pathogens, and cell lines manipulated after experimental infections.
2.8 Characteristics of the main cell lines employed industrially
The cell lines most commonly employed for production of biopharmaceu-ticals include CHO-K1, BHK-21, and Vero cells, besides various anti-body-secreting hybridomas. Other cell lines, such as NS0, HEK-293 andPER.C6
1, have also been employed for recombinant protein production.
The CHO-K1 (Chinese hamster ovary) cell line was established byPuck et al. (1958), and was isolated from a Chinese adult hamster. It wasone of the first mammalian cell lines developed with success for utilizationin recombinant protein production. The CHO-K1 cell line consists ofepithelial cells that can be adapted for suspension growth. These havebecome the major cell type employed for recombinant protein production.
The BHK-21 (baby hamster kidney) cell line consists of adherentfibroblasts, that can also be adapted to suspension culture, and was isolatedfrom five 1-day-old hamsters (McPherson and Stoker, 1962). These cellsare commonly used for virus propagation (polio, rabies, and foot-and-mouth disease) for production of veterinary vaccines.
Vero cells, isolated from adult African green monkey kidney, consistof adherent fibroblasts that show continuous growth (Yasumara and
30 Animal Cell Technology

Kawakita, 1963). This cell line is certified by the WHO (World HealthOrganization) and is usually employed for virus propagation (polio,rabies) for human vaccine production. Another important application ofthese cells is in cytotoxicity studies of biomaterials projected for repairingor reconstituting injured human tissues.
Hybridomas, described initially by Kohler and Milstein in 1975, areimmortal cells generated by the fusion of myeloma cells (immortal tumorlymphocytes that lose their capacity for producing antibodies) withnormal B lymphocytes commonly obtained from rodent spleen and thathave a limited life cycle before the fusion process. Among the majorfusion-promoting agents employed for hybridoma production are poly-ethylene glycol (PEG) and Sendai virus. Procedures for obtaining hybri-domas producing monoclonal antibodies (mAbs) are discussed in detail inChapter 17.
The NS0 cell line, derived from mouse myeloma cells, is one of the mostpopular for heterologous proteins expression on a large scale due to itscapacity for incorporating exogenous DNA and stably producing recom-binant proteins. This cell line grows in suspension in a highly dispersedform, without clump formation. NS0 cells show robust growth with theproduction of high levels of proteins in different types of culture media.Nevertheless, when used for recombinant antibody expression, these cellsmay incorporate an antigenic glycan residue into the immunoglobulinsthat in some cases can result in adverse immunogenicity from interactionwith about 1% of circulating antibodies in humans.
PER.C61cells have been used extensively for the production of gene
therapy vectors. This cell line was derived from the immortalization ofhuman embryonic retina cells through the use of adenovirus E1 gene(Fallaux et al., 1998). This cell line has been well characterized since itsestablishment, and no retroviruses or adventitious viruses have beendetected in it. This cell line is easily adapted to different growth conditionsand stably produces high levels of recombinant proteins.
HEK-293 cells, derived from human embryo kidney, were transformedwith human type 5 adenovirus (Graham et al., 1977). These cells exhibitepithelial morphology and can be adapted to suspension growth in serum-free media. In addition, this cell line is easily transfected and has beenexplored for viral vector production for gene therapy and for obtaininghuman recombinant proteins with normal glycosylation profiles.
The MRC-5 cell line, derived in 1966 from normal human lung tissue(Jacobs et al., 1970), is adherent and shows a fibroblast morphology. Thesecells are well known owing to their susceptibility to several virus types,being employed in assays related to viral transfection, in cytotoxicityevaluation, and in vaccine production.
2.9 Culture of insect cells
Insect cell culture was started in 1915 but no cell line capable of replicatingindefinitely was established until 1962. In that year Grace showed theability of the insect cell line Antheraea eucalypti to replicate indefinitely in
Animal cells: basic concepts 31

vitro (Brooks and Kurtti, 1971). The insect cell lines most frequentlycultured in vitro are Sf-9, High-FiveTM, and S2.
Sf-9 cells are derived from the IPLBSF-21 cell line, isolated by Vaughnet al. (1977) from pupal ovarian tissue of the fall armyworm Spodopterafrugiperda. This cell line is commonly used for bioproduct expressionemploying baculovirus as vectors, similarly to the High-FiveTM cell line.
High-FiveTM cells (BTI-TN-5BI-4) are derived from Trichoplusia nicells and are frequently employed due to their capacity to express highprotein levels when compared with other insect cell lines, such as Sf-9 cells(Rhiel et al., 1997). This cell line shows high growth rates in adherentculture, and can easily be adapted to grow in suspension and in serum-freemedia.
The S2 cell line, isolated from late stage fruit fly Drosophila melanoga-ster embryos, was established in 1969 by Schneider, from hundreds of20–24-hour-old embryos (Schneider, 1972). This cell line can be geneti-cally modified and is capable of stably expressing heterologous proteins,being easily adapted to suspension growth.
A comparison between insect and mammalian cell culture technologyshows various similarities and differences. Due to the fact that insect celllines typically derive from specific organs or non-differentiated embryonictissues, the same cell line can proliferate in suspension or in adherentmanner (in monolayer). This versatility in growth mode, which contrastswith most mammalian cell lines, increases the choices of bioreactor typesand culture strategies for production. Contact inhibition shown by variousmammalian cell lines is low or absent for insect cells, and they tend toaggregate in suspension or in adherent cultures.
Adherent insect cell release from solid surfaces generally does notrequire trypsinization, unlike anchorage-dependent mammalian cells. In-sect cells, like mammalian cells, need rigorous aseptic manipulation duringcell transfer, inoculation, and propagation in bioreactors. A minimalinoculum density is required for both cell types. Typically, insect andmammalian cell cultures are initiated with inocula of 1–2 3 105 cells permilliliter of liquid medium (Agathos, 1991). Table 2.3 summarizes themajor differences and similarities between these cells.
2.10 Use of animal cell culture in cytotoxicity assays
Besides their utilization in the production of many compounds withtherapeutic, diagnostic, and immunizing applications, animal cell cultureshave undoubted utility in the performance of in vitro cytotoxicity tests.They can be used for the evaluation of potential anti-neoplastic agents andassessment of the safety of various products, such as pharmaceuticals,cosmetics, alimentary additives, pesticides, and industrial chemical pro-ducts. Cell culture systems are frequently employed in the cancer chemo-therapy field, in which their potential value for viability and cytotoxicitytests is largely accepted. Animal models play an important role in toxicitytesting, but the pressure to adopt in vitro tests is growing since theypresent considerable economical advantages over in vivo tests. The use ofanimal models is limited to human metabolism studies, and there are
32 Animal Cell Technology
ethical considerations for their use in experiments (Freshney, 1992). Whenassays with animals are inevitable, in vitro cytotoxicity tests can be usefulto plan in vivo experiments, contributing to a rational selection of typesand concentrations of active agents to be tested in animals.
The evaluation of different chemicals involves: identification of poten-tial active agents and the mechanisms by which they present their toxiceffect, prediction of effective pharmaceutical cytotoxicity for treatment ofpatients with cancer, evaluation of the activity range of the studied com-pound, identification of a target cell population and of the toxic concentra-tion range, and the relation between pharmaceutical concentration andexposure period to reach a desired activity. The chosen assay systemshould provide a reproducible dose-response curve with low variabilityover a concentration range that includes in vivo exposure. In addition, theselected response criterion should present a linear relationship with cellnumber, and the information obtained with a dose-response curve shouldbe related to the in vivo effect of the same active agent or drug.
The choice of the assay to be performed depends on the context inwhich it will be used, the origin of the target cells, and the nature of thetested compounds. Among different assays, the parameters that vary are:cell culture method, exposure time and concentrations, recovery time afterexposure, and the method used to quantify the pharmaceutical effect. Thistopic is briefly covered in this chapter and is discussed in detail byFreshney (2005).
2.10.1 Culture methods
The choice of cell culture method for cytotoxicity studies for a certainsubstance depends on the target cells and assay duration. Organ, spher-oids, suspension cells, flask surface, and multi-well plate monolayers, aswell as agar surface cultures can be employed.
Table 2.3 Comparison of insect and mammalian cell cultures
Characteristics Insect cells Mammalian cells
Cell line maintenance Relatively easy More difficultSuspension and adherent versatility Yes NoImmortality Yes Only transformed cell
linesInhibition contact Mild or absent Yes, except for some
transformed andlymphoblastoid celllines
Release from solid surface Gentle agitation TrypsinizationSensibility to pH changes, dissolvedoxygen, temperature, and osmolality
Relatively low Relatively high
Inoculum concentration dependencyto grow
Yes Yes
Aseptic manipulation Required Required
Adapted from Agathos, 1991.
Animal cells: basic concepts 33

Organ cultures allow tissue integrity and intercellular relations to bemaintained, with a closer approximation to the in vivo situation, comparedwith other methods. Nevertheless, reliable quantification of the effectscaused by a pharmaceutical compound is more difficult because ofvariability between replicates.
Spheroids are formed through spontaneous aggregation of cells, andtheir use allows the analysis of the effects of three-dimensional distribu-tion of cells to test compounds, without the disadvantages presented byorgan culture. Parameters such as penetration barriers in non-vascularareas and metabolic and proliferation gradients can be studied by use ofthis model.
Short duration cultures (4–24 hours) can be performed to evaluate theeffects of pharmaceuticals on various cell types. When human tumor cellsare used, the advantages include: no requirement for growth, clone mini-mization, presence of fast growing stromal cells, and speed in obtainingresults. The disadvantage of a short duration assay is that it does not assessthe effect of long exposure to the tested drug. Also, it does not considerthe reversibility of the pharmacological effect or late cytotoxicity effects.Intermediate length cultures (4–7 days) are more adequate, for instance,for studies of chemical sensitivity to hematological cancer.
The monolayer culture technique is frequently employed in cytotoxicitytests with cancer lines and in studies of chemical sensitivity of differenttumor types. This method offers high flexibility with respect to drugexposure and recuperation conditions, as well as to the quantification ofany effect. Among all methods, cell culture in a monolayer requires alower cell number and allows the evaluation of multiple drugs in largeconcentration ranges.
Although the method of clone formation in monolayer can be appliedto cells directly cultivated from a tumor, cloning in suspension is morewidely employed to minimize anchorage-dependent stromal cell growth.For this, cells are inoculated into soft agar after drug exposure. This assayis more adequate for cell lines that present high plating efficiencies, and isparticularly suitable for solid tumors and patient effusions.
2.10.2 Exposure time and active agent concentrations
The choice of the concentration of the drug to be tested should considertherapeutic levels that could be attained with clinically employed doses. Inthe case of a compound under pre-clinical evaluation for a potential anti-tumor activity, a concentration limit of 100 �g/ml is recommended.Pharmacokinetic data are available for various anti-neoplastic clinicallyused drugs, with information about their maximum plasma concentration,concentration versus time, and pharmaceutical half-life in plasma. Whenthese data are not available, an approximation of plasma levels could beobtained by calculating the theoretical concentration obtained when theadministered dose is uniformly distributed throughout the body fluid.
Pharmacokinetic data show that maximum pharmaceutical exposureoccurs generally in the first hour after intravenous injection and, for thisreason, a test exposure period of 1 hour is commonly chosen. Neverthe-less, this period may not be sufficient for certain cells and drug absorption
34 Animal Cell Technology

rates may be a limiting factor when short exposure periods are employed.Therefore, establishing the drug exposure period is often a question of trialand error.
2.10.3 Recovery time
The recovery period after drug exposure is important for many reasons.This period permits the re-establishment of metabolic equilibrium wheninhibition is used as a pharmaceutical test. In addition, cells can recoverfrom sublethal damage or indicate effects of late cytotoxicity, which arenot revealed in alternative tests.
Depending on the nature of the drug and on the method of evaluation,the measurement of a recovery period could result in underestimation oroverestimation of any lethal effect on cells. It is important that therecovery period is not very long, since cell death could be masked by aresistant population growth.
2.10.4 Cytotoxicity evaluation methods
Cytotoxicity assays can be performed in various ways. In some cases,alterations of metabolic activities induced by drugs are measured. In othercases, structural integrity, which may or may not be directly related to celldeath, is evaluated. Alternatively, cell survival assays measuring the resultof each metabolic perturbation can be performed and used to evaluate cellrecovery or death.
Theoretically, the only conclusive signal of cell survival after drugexposure is the demonstration of reproductive integrity, which can beevaluated through plating efficiency and cell proliferation tests. Neverthe-less, metabolic parameters could also be employed as a survival measurewhen the cell population is submitted to a recovery period after drugexposure.
Some cytotoxicity assays, such as dye incorporation by dead cells or51Cr or fluorescein release by labeled cells, offer instantaneous results andare named viability tests. These tests are adequate for the identification ofdead cells, but can overestimate cell survival over longer periods. Most ofthem cause membrane rupture and cell death.
Other cytotoxicity assays, such as those based on the assessment ofmetabolic events, can be more reliable and sensitive. The assessment ofviability is less reliable since many forms of metabolic inhibition can bereversible.
Evaluation of membrane integrity is the most commonly used measure-ment of cell viability, indicating instantaneous or progressive damage overa few hours, and can be performed by 51Cr or specific enzymes release ora dye exclusion assay. These assays are particularly important for toxicagents that exert a primary effect on membrane integrity. Nevertheless,quantification can be difficult due to cell loss by surface detachment orautolysis.
Measurements of changes in respiration (O2 utilization) induced bydrugs or in glycolysis (CO2 production), as well as changes of dehydro-
Animal cells: basic concepts 35

genase activity or pH can also be used to evaluate the cytotoxicity ofcertain compounds.
The measurement of incorporation of radioactive metabolites is fre-quently used as a response to short and intermediate duration cytotoxicity.Measurements of [3H]-thymidine incorporation into DNA and [3H]-uridine incorporation into RNA are the two most common methods ofquantifying drug cytotoxicity. Furthermore, [125I]-iododesoxyuridine, aspecific and stable label for DNA synthesis, is also employed, as well asmeasurements of [32P]-phosphate release into medium or incorporationinto nucleotides, in addition to the incorporation of [14C]-glucose, [3H]-amino acid, and 45calcium.
Determination of protein content is a relatively simple method toestimate cell number. Cytotoxicity can be evaluated by this method froman alteration in protein accumulation over the time of culture.
In addition, there are several tests that quantify cell number through acolor development in the medium, including assays based on proteincontent, DNA content, lysosome and Golgi complex activity, enzymaticactivity, and MTT (3-(4,5-dimethyl-2-thiazolyl)-2,5-diphenyl-2H tetrazo-lium bromide) dye reduction.
References
Agathos SN (1991), Production scale insect cell culture, Biotechnol. Adv. 9:51–68.Augusto EFP, Oliveira MS (2001), Processos com Celulas Animais, In: Lima UA,
Aquarone E, Borzani W, Schmidell W (Eds), Biotecnologia Industrial, vol. 3,Processos Fermentativos e Enzimaticos, Edgard Bluncher, Sao Paulo, pp.547–582.
Brooks MA, Kurtti TJ (1971), Insect cell and tissue culture, Annu. Rev. Entomol.16:27–52.
Cartwright T (1994), Animal Cells as Bioreactors, Cambridge University Press, NewYork.
Davis JM (2002), Basic Cell Culture. A practical approach, 2nd ed., Oxford UniversityPress, New York.
ECACC Handbook (2005), Fundamental Techniques in Cell Culture. A LaboratoryHandbook. Available in http://www.sigmaaldrich.com/Area_of_Interest/Life_Science/Cell_Culture/Key_Resources/ECACC_Handbook.html (accessed May2005).
Fallaux FJ, Bout A, van der Wollenberg DJ, Hehir KM, Keegan J, Auger C, CramerSJ, van Ormondt H, van der Eb AJ, Valerio D, Hoeben RC (1998), New helpercells and matched early region 1-deleted adenovirus vectors prevent generation ofreplication-competent adenoviruses, Hum. Gene Ther. 9:1909–1917.
Freshney RI (1992), Animal Cell Culture – A Practical Approach, 2nd ed., IRL Press,Oxford.
Freshney RI (2000), Culture of Animal Cells. A Manual of Basic Technique, 4th:ed.,John Wiley & Sons, Inc., New York.
Freshney RI (2005), Culture of Animal Cells. A Manual of Basic Technique, 5th:ed.,John Wiley & Sons, Inc., Hoboken.
Graham FL, Smiley J, Russel WC, Nairn RJ (1977), Characteristic of a human cell linetransformed by DNA from human adenovirus type 5. Gen. Virol. 36:59–72.
Hayflick L, Moorhead PS (1961), The serial cultivation of human diploid cell strains,Exp. Cell Res. 25:585–621.
36 Animal Cell Technology

Jacobs JP, Jones CM, Baille JP (1970), Characteristics of a human diploid celldesignated MRC-5, Nature, 227:168–170.
Kilburn J (1991), Monitoring and control of bioreactors, In: Mammalian Cell Biotech-nology: A Practical Approach, Butler M (Ed.), Oxford University Press, NewYork, pp. 159–184.
Kohler G, Milstein C (1975), Continuous cultures of fused cells secreting antibody ofpredefined specificity, Nature 256:495–497.
Macpherson I, Stoker M (1962), Polyoma transformation of hamster cell clones-aninvestigation of genetic factors affecting cell competence. Virology 16:147-151,1962.
Puck TT, Cieciura SJ, Robinson A (1958), Genetics of somatic mammalian cells. III.Long-term cultivation of euploid cells from human and animal subjects, J. Exp.Med. 108:945–956.
Rheinwald JG (1989), Methods for clonal growth and serial cultivation of normalhuman epidermal keratinocytes and mesothelial cells, In: Baserga R (Ed.), CellGrowth and Division: A Practical Approach, IRL Press, Oxford, pp. 81–94.
Rhiel M, Mitchell-Logean CM, Murhammer DW (1997), Comparison of Trichoplusiani BTI-Tn-5B1-4 (High FiveTM) and Spodoptera frugiperda Sf-9 insect cell linemetabolism in suspension cultures, Biotechnol. Bioeng. 55:909–920.
Schneider I (1972), Cell lines derived from late embryonic stages of Drosophilamelanogaster, J. Embryol. Exp. Morphol. 27:353–365.
Vaughn JL, Goodwin RH, Tompkins GJ, McCawley P (1977), The establishment oftwo cell lines from the insect Spodoptera frugiperda (Lepidoptera; Noctuidae), InVitro 13:213–217.
Yasumura Y, Kawakita M (1963), The research for the SV40 by means of tissue culturetechnique, Nippon Rinsho 21:1201–1219.
Animal cells: basic concepts 37


3Cloning and expression ofheterologous proteins inanimal cellsMariela Bollati-Fogolın and Marcelo A. Comini
3.1 Introduction
Among the eukaryotic organisms, the animal cells are consolidated as basictools for the production of proteins with therapeutic applications. Thesteady progress in the design and generation of novel expression vectorsand cell lines, the remarkable improvements in the composition of theculture medium and in the area of process control, made feasible theproduction of recombinant proteins on a large scale. One of the pivotalfactors that determines the success of the first phase in a biotechnologicalprocess lies in the correct selection of the expression vector, host cell, andculture medium. Moreover, the genetic manipulation of the first two andthe choice of the appropriate method for transfection and genetic amplifi-cation may influence positively the specific cellular productivity. In thisrespect, this chapter presents the basic fundamentals and the practicalconcepts that have to be considered in the initial stage – cloning andexpression – of a biotechnological process based on animal cells.
3.2 The flow of genetic information and molecular cloning
In order to express a gene in a eukaryotic cell, it is not enough just to havethe sequence of deoxyribonucleic acid (DNA) encoding the polypeptideof interest. The presence of sequences that regulate gene expression isessential. A typical eukaryotic transcription unit contains the informationthat governs the transcription rate of a gene, namely the speed at whichthis DNA sequence is copied to ribonucleic acid (RNA). This primarytranscript or immature RNA carries the signals that determine the rate andnature of its processing into a mature messenger RNA (mRNA). In thecytoplasm, the codons of the mRNA are translated into an amino acidsequence that gives rise to a polypeptide. This amino acid sequencedictates the three-dimensional structure, stability, function, cellular locali-zation, post-translational processing (i.e. proteolytic cleavage, glycosyla-tion, etc.), and/or the secretion of the new protein.
The first step towards the heterologous expression of a gene consists inthe isolation of its sequence either from genomic DNA (gDNA) ormRNA. The sequence isolated from gDNA, in most of the cases, contains

the regulatory elements that control its expression (see below), while thatobtained from mRNA lacks many of them and requires their incorpora-tion to enable an efficient transcription-translation. Although a sequenceisolated from gDNA can be transferred directly to the host cell, thesuccess of its expression can be limited significantly because the regulatorysequences may not be recognized by the transcriptional/translationalmachinery of the host. gDNA sequences are large and this makes theirmanipulation difficult and considerably reduces the efficiency of transfec-tion. Such problems are generally overcome by cloning the exogenousgene into, and expressing it from a vector (plasmid, virus) that providesthe elements controlling the rate of generation, and the processing of thetranscript. For details about molecular biology methods and recombinantDNA technology, Sambrook et al. (2000) is recommended.
3.3 Elements required for gene expression in eukaryotic cells
In general, any animal cell is able to express foreign genes as long as thosegenes contain regulatory elements that can be functional in the host cell.A typical eukaryotic transcription unit consists of a gene flanked byupstream and downstream sequences. These flanking regions encode theinformation that dictates the rate of transcription, the processing, and thestability of the mRNA, as well as other properties of the polypeptide. Thesequence of a gene can exceptionally contain elements that may influenceits transcription-translation. The most relevant features of these elementsare described below and have been classified into two groups according tothe level at which they operate, transcriptional or translational, respec-tively.
3.3.1 Transcriptional control elements
In eukaryotic organisms, transcription regulation is a complex process thatdemands coordinated interaction of several genetic elements. The effi-ciency of this process mainly depends on the promoter/enhancer se-quences, the copy number of the gene, and the structure and elementspresent at the insertion site in the host9s chromatin. On the other hand,the co-transcriptional modifications (capping, splicing, polyadenylation,and transport to cytoplasm) on the primary transcript determine thestability, turnover rate, and translational capacity of the future mRNA.
Promoter, enhancer, and chromosomal elements
The promoter is the set of sequences located upstream from the beginningof the transcription, whose function is to regulate the rate limiting step ofthis process: the initiation of the transcription of the adjacent gene. Thebasic sequence of all promoters consists of the TATA-box, a region highlyconserved that serves as an anchorage signal for the complex that will startthe transcription. Other sequences that activate the transcription are theCCAAT- and GC-box, which are located about 40–110 bp upstream fromthe TATA-box. Depending on the promoter, additional sequences can
40 Animal Cell Technology

determine the type and specificity of the transcriptional activity (Novinaand Roy, 1996). For instance, there are promoters that carry out thetranscription in a constitutive, inducible, or tissue-specific mode, or thatare activated in particular stages of the cell development or cell cycle (seeSection 3.4.3).
The activity of the promoter can additionally be increased by enhancers.These elements increase the rate of transcription in a manner that isindependent of their orientation, position, and distance with respect to thegene to be expressed (Fromm and Berg, 1983). The enhancers have beensuggested to bind the transcriptional complex at the promoter sequence,facilitating the transcription by altering the local structure of the chroma-tin and/or stabilizing the complex (Szutorisz et al., 2005). Unlike promo-ters, enhancers do not present a conserved sequence, and hence, it isdifficult to predict if a certain transcription unit contains them or not.Although enhancers do not show specificity for promoter sequences, theiractivity is constrained to certain cellular types or developmental stages(Szutorisz et al., 2005). Specific mutations introduced into the enhancersequences allow an increase in their potency and the number of cell lineswhere they are active (Yaniv, 1982).
Certain structural domains of the chromatin, designated scaffold-attached-regions (SAR), locus-control-regions (LCR) and insulators, thatare intrinsically associated with transcriptionally active regions of thegenome, have recently been discovered. These elements induce the unfold-ing of the heterochromatin (transcriptionally inactive) and the separationof the DNA chains assisted by proteins of the internal matrix of thecellular nucleus. Thus, the RNA-polymerase and other transcriptionalfactors can gain access to this locus and, consequently, activate the expres-sion of the neighboring genes (Hauser, 1997). In contrast to SARs, theactivity of LCRs is cell-specific (Klehr et al., 1991). The insulators isolateloci by means of a steric effect (i.e. formation of hairpin loops) inhibitingthe recruitment of the enzyme histone-acetyltransferase and thus, prevent-ing the activation or repression of certain specific chromosomal regions(Gerasimova and Corces, 2001; West et al., 2002). The inclusion of theseelements in expression vectors represents a novel strategy to avoid thepositioning effect, common when vectors for chromosomal integration areused (discussed in Section 3.4.3).
Capping, introns, polyadenylation, and transcription-terminationsequences
Capping is a co-transcriptional process that consists of the addition of 7-methylguanosine to the 59 mRNA end, which protects the transcript fromdegradation and allows its further processing. In general, the promotersequence provides the capping signal. The removal of the 59 methylguano-sine and the 39 structures from the RNA constitute the critical steps thatdetermine the half-life of the transcript.
Introns are non-coding sequences that are excised from the precursormRNA by specific cleavage in a process known as splicing. It has beenpostulated that the presence of introns enhances the efficiency of tran-scription by stabilizing the RNA structure, and that splicing increases the
Cloning and expression of heterologous proteins in animal cells 41

rate of polyadenylation and the nuclear export of the mRNA (Mattaj,1990). The sequence of the introns is not conserved and the bases GU andAG in the 59 and 39 ends, respectively, are recognized as hallmarks ofalmost all introns (Petitclerc et al., 1995). Although there are genes that areefficiently expressed without the presence of introns, their inclusion inexpression vectors is generally recommended. They should be placed atthe 59 end of the transcription unit to avoid aberrant splicing as a result ofinactive or cryptic splicing sites present in the gene sequence (Huang andGorman, 1990).
Most mRNAs from eukaryotic cells contain in their 39 end an extensionof approximately 200 adenosine molecules, known as the polyA tail.Similar to capping and splicing, the polyadenylation of the primarytranscript is a co-transcriptional process. It occurs at the 39 end of theRNA and consists of a site-specific cleavage followed by polymerization(adenylation). The polyadenylation is essential for the formation, stability,and translatability of the mRNAs. The polyadenylation signal is composedof a highly conserved sequence (AATAAA) located about 10–30 nucleo-tides downstream from the stop codon, and positioned immediately up-stream of a T- or TG-rich region (T/G box; Munroe and Jacobson, 1990).In most cases, the initial step in mRNA degradation is the shortening ofthe polyA tail. This gradual aging of the mRNA takes place in thecytoplasm and is referred to as the ‘molecular clock9 of the RNA. Thepolyadenylation signals more commonly employed in expression vectorsare those derived from the bovine growth hormone, mouse �-globin, SV-40 early transcription unit, thymidine kinase (TK), herpes simplex virus(HSV), and hepatitis B antigen (Kaufman, 1990).
The sequence signaling the culmination of the transcription reaction islocalized between the polyadenylation signal and the 39 end of the matureRNA. Although the transcription termination region of several eukaryoticgenes has been identified – consensus sequence: ATCAAA(A/T)TAGGAAGA – the precise site of the termination is, in most of the cases,unknown. The termination signal is required to prevent the transcriptionalmachinery extending its activity to sequences located downstream of thegene that is being transcribed, a phenomenon known as ‘transcriptionalinterference.9 It has also been proposed that the introduction of termina-tion sequences abolishes or diminishes the transcription of the comple-mentary DNA chain, which would give rise to the formation of antisenseRNA, with the consequent suppression of the expression of the senseRNA (Izant and Weintraub, 1985). The expression vectors for animal cellsharbor the well-characterized transcription terminator sequences fromprokaryotes.
3.3.2 Translational control elements
In the cytoplasm the codons of mRNA are translated into amino acids viathe concerted action of the ribosomes, transfer RNA (tRNA), and a largeprotein complex. In addition to the mature RNA sequence (capped andpolyadenylated) other structural elements located in the 59 and 39 untrans-lated regions (UTRs) of the mRNA may influence its translation.
42 Animal Cell Technology

59 Untranslated region
The initiation of the translation constitutes the rate limiting step in thesynthesis of proteins. The start codon (AUG) embedded in the consensussequence GCC(A/G)CCAUGG, widely known as Kozak9s sequence,gives the appropriate context for an optimal beginning of the translation(Kozak, 2005). Specific purines in the Kozak9s sequence (underlined)provide an enhancer effect on translation. It has also been noted that theexistence of additional start codons in the 59 UTR impairs severely thetranslation (Grens and Scheffler, 1990). The formation of secondarystructures (i.e. hairpin loops) in this region may inhibit the binding and/orthe advance of the translational complex on the RNA strand due to a sterichindrance. Regions rich in G and C are prone to form structures of thistype, which are thermodynamically very stable (Grens and Scheffler,1990).
39 Untranslated region
In mammalian cells, the degradation of the mRNA is triggered after asignificant shortening of the polyA tail and is catalyzed by 39-59 exoribo-nuclease activity of a protein complex termed the exosome. Mechanismsinvolving exonuclease activity that are independent of the polyA ‘‘aging’’have also been described (Inacio and Liebhaber, 2003). In the 39 UTR ofthe mRNA there are sequences able to alter the stability of the transcript.For instance, motifs that have AU-rich elements (ARE) were found inhighly unstable mRNA. AREs were later shown to bind proteins with thecapacity to regulate either positively or negatively the decay rate of themRNA, that is, recruiting or blocking the exosome (Gray and Wickens,1998).
Termination codon and codon usage
The completion of the translational process requires the binding of the‘‘release factor’’ to the stop codon, which induces the disassociation of thetranslational complex and thus, the end of polypeptide synthesis.Although the presence of the stop codon is sufficient to interrupt thetranslation, exhaustive studies have demonstrated that the contiguous basecan influence significantly the efficiency of this process. For example, ithas been reported that purines (A or G) occupying this position constitutea much more effective termination signal than pyrimidines (C or U;McCaughan et al., 1995). Two models were proposed to explain the effectof the fourth base on the performance of the termination process: onesuggests that this base is recognized as a part of the stop codon and theother claims that this base constitutes an independent signal for therecruitment of the ‘‘release factor’’ (McCaughan et al., 1995).
It is worthwhile to mention that a considerable degree of preference forcertain codons has been observed for genes displaying high expressionlevels, which correlated with a higher abundance of the complementarytRNA in the cell (Fedorov et al., 2002). The optimization of codon usage
Cloning and expression of heterologous proteins in animal cells 43

can be achieved by site-directed mutagenesis to increase the expressionlevel of some genes (Makrides, 1999).
3.4 Systems for heterologous expression in animal cells
All expression systems consist of a vector and a host. The vector is definedas a molecule of DNA or RNA, which is genetically manipulated to carrya molecule of foreign DNA or RNA, with the aim of producing proteins(gene expression) or DNA (amplification, replication) once it is introducedinto a host cell. In the nucleus of the transfected cell the expression vectorcan exist: (i) as an independent replication unit, namely episome, or (ii)integrated to the host genome through a random or non-homologousrecombination process. In order to exist as an episome the vector musthave a signal (episomal replication origin) allowing for its autonomousmultiplication, non-linked to the replication of the host genome. Episomalvectors render high transient expression levels of recombinant protein(discussed below). However, the cytotoxicity generated by the highconcentration of exogenous DNA, the tendency to integrate into thecellular genome and to undergo rearrangements (mainly in long-termcultures) have been pointed out as the major obstacles inherent to its use(Sanders, 1990). As explained below, the clonal variation due to the‘‘positioning effect,’’ commonly observed for integrative vectors, does notoccur with episomal vectors.
The integration of the vector into the host’s genome takes place in arandom manner and the sequences/structures from either the vector or thesite of integration can affect the expression of the target gene. The fact thatnearly 95% of the genome from animal species consists of non-codingsequences and that the coding regions are frequently silenced (heterochro-matin) explains the low efficiency in obtaining highly productive clonesfrom vectors that integrate into the chromosomes. Possible rearrange-ments of the vector9s DNA giving rise to mutations, insertions or deletionsthat can alter the sequence or expression of the heterologous gene, maytake place when using this type of vector.
The expression systems available for the production of recombinantproteins in animal cells can be classified as mammalian cell/viral or plasmidvector, or insect cell/baculovirus.
3.4.1 Viral vectors
The first attempts to express foreign genes in mammalian cells werecarried out using viruses as vectors (Goff and Berg, 1976; Hamer et al.,1977). According to the nature of the viral nucleic acid, these vectors areclassified as DNA or RNA viruses, or chimeras. If the genetic material ofthe virus is surrounded by a protein envelope (capsid), it enters the cellby a mechanism called infection, which generally occurs with highefficiency. If the nucleic acid of the vector lacks a capsid (‘‘naked’’), itsincorporation to the cell is carried out by means of transfection techni-ques (discussed in Section 3.7). In a permissive cell, a viral vectordevelops a lytic cycle, in which the replication of the viral DNA and its
44 Animal Cell Technology

later encapsulation generates a large number of virions (progeny) thatwill finally cause cell lysis and death, thus precluding the establishmentof a stable cell line. Such limitations can be overcome by using: (i)nonpermissive cells, wherein the virus replicates as an independent entityintegrated into the host’s genome and induces only a morphologicaltransformation of the cells; (ii) defective viruses, whose genome has beenmodified in such a way that it cannot complete the lytic cycle anddepends for its propagation on either a helper virus or a specific cell linethat provides the absent elements/functions (i.e. COS cells/SV-40 virus,Section 3.6.1); or (iii) genetically modified permissive cells that allow theepisomal replication of the virus, increasing the productive yield whilepreventing the lytic cycle, although the high concentrations of extrachro-mosomal DNA can be cytotoxic (Sanders, 1990). The main advantageoffered by the viral systems is that tedious screening for high producingclones is not required as is the case when using integrative plasmidvectors. Some disadvantages displayed by viral vectors are: (i) thephysical limitations of the viral packaging restrict the size of the foreigngene; (ii) recombinant viruses are generally defective and must bepropagated with a helper virus or a specific cell line; (iii) stable recombi-nant cell lines cannot be established with a virus that presents a lyticcycle; (iv) the specificity of the virus to infect certain cell types restrainsthe selection of the expression host.
Vectors derived from DNA viruses
SV-40 and polyoma viruses belong to the group of the papovavirus(Family: Polyoma virus), both presenting a small ‘‘naked’’ genome (�5kb) that is able to replicate in primate and murine cells, respectively. SV-40is considered the pioneer vector in terms of heterologous expression inmammalian cells (Goff and Berg, 1976; Hamer et al., 1977), and ispreferred over polyoma viruses for production of recombinant proteinsdue to its higher replication rate and infection efficiency. The target geneis inserted in the early or late replication regions of the viral genome,producing a recombinant defective virus (Muller et al., 1983; Zhu et al.,1984). The advantages of employing SV-40 as an expression vector can besummarized in the higher expression levels and short time required toevaluate the production of recombinant protein. The drawbacks of thisexpression system are: (i) the DNA sequence to be inserted has a maxi-mum size of 2.5 kb; (ii) the host selection is limited because the viralinfection is cell-specific; and (iii) successful recombinant expression isvariable and unpredictable (Levinson, 1990).
Adenoviruses possess a genome of about 35 kb, which allows insertionof a larger heterologous sequence without affecting viral replication. Thisexpression system offers high expression levels since viral infection inhi-bits synthesis of cellular proteins and, in the case of type-2 adenoviruses,they allow the use of a wide range of host cells (i.e. human, primate,rodent). Owing to the reduced number of restriction sites available in theadenoviral genome, insertion of foreign sequences is performed by homo-logous recombination instead of molecular cloning. In this respect, theviral DNA is co-transfected with a plasmid containing the gene of interest
Cloning and expression of heterologous proteins in animal cells 45

flanked by the regions of the viral genome where recombination will takeplace. The frequency of recombination is variable and the generation ofstocks of recombinant virus requires purification of the viral progeny.Sequences up to 8 kb can be inserted into and expressed by adenoviruses.Heterologous promoters (from SV-40 or cytomegalovirus) have beensuccessfully used to express genes with this system (Sandig et al., 1997).The cell line HEK-293 has been generated to complement a region absentin recombinant adenoviruses, thus obviating the need for a helper virus tocomplete the viral cycle. The adenoviruses are reliable vectors for theproduction of recombinant proteins. The generation of novel adenoviralvectors is described in detail by Bourbeau et al. (2003).
The adeno-associated viruses (AAVs) belong to the Parvovirus family,contain a small genome (5 kb), and are not pathogenic. AAVs have abiphasic life cycle in the host cell. They can either integrate to the hostgenome or persist in an episomal form, both mechanisms leading to alatent infection in the absence of a helper virus. In the presence of ahelper virus (i.e. adenovirus or herpesvirus), AAVs undergo a productiveinfection. In addition to the lack of pathogenicity, these vectors presentother advantages such as high transfection efficiency, reduced cytotoxi-city at elevated multiplicity of infection, and a wide range of hosts. Themain limitation of these vectors lies in the size of the gene that can beexpressed (, 5 kb). Although the rate of integration of AAVs to the hostgenome is low, undesirable chromosomal mutations can be expectedwhen employing the helper virus approach (Xiao, 2003). The recentdiscovery of the minimal set of adenoviral genes required for efficientgeneration of progeny AAV particles (Matsushita et al., 1998) allows theproduction of recombinant AAVs without the need of adenoviral co-infection.
Epstein–Barr virus (EBV) is a member of the herpesvirus family thatbecame useful as an expression vector for mammalian cells. A peculiarityof this virus is that it can develop either a latent infection or a lytic cycle inthe host. The first leads to transformation/immortalization of the host cell,and the second to cell lysis. The identification of the elements necessaryfor EBV replication extends the range of permissive cells from human Blymphocytes to fibroblastic and epithelial cells of human, primate, andcanine origin (Sugden et al., 1985; Lutfalla et al., 1989). The use of thisvirus as an expression vector offers stable transfection and high levels ofgene expression, simplicity for the selection of highly producing clones,easy recovery of the episomal DNA, and the possibility to produceauthentic human glycoproteins if human cells are used as the host(Teshigawara and Katsura, 1992). Some disadvantages of the EBV-basedexpression systems are the need for a selection marker to assure thepersistence of the DNA in an extrachromosomal form, a certain degree ofvariability in the expression levels depending on the cell type, and theprobability of genomic integration with a consequent reduction in theexpression rate of the heterologous gene (Levinson, 1990).
Another member of this family is HSV (herpes simplex virus). HSV hasa genome size of 125 kb, although half of the genes are not essential forgrowth, allowing large molecular inserts. HSVs infect a wide range ofhosts and show a high infectivity. The relative simplicity of preparing large
46 Animal Cell Technology

stocks of recombinant virus is another advantage presented by HSV(Burton et al., 2003).
Papillomaviruses contain a genome of �8 kb, usually have a single hostand replicate episomally. Bovine papillomavirus (BPV) is a representativeof this family, which induces phenotypic changes in the host facilitatingthe identification and selection of transformants. Although BPV-basedvectors replicate episomally, the selection pressure achieved by the addi-tion of selection markers (i.e. neomycin or cadmium; see Section 3.8) hasbeen reported to induce a stable integration of multiple copies of the viralDNA into the host genome (Niwa et al., 1991). The susceptibility of thevirus to undergo rearrangements with the concomitant risk of altering thesequence of interest is perhaps its main drawback (Levinson, 1990). Theoptimization of the expression system based on papillomavirus has beenthwarted by the lack of progress in understanding the biology of the viralreplication and transcription.
Vaccinia virus is a representative of the Poxviruses. Members of thisfamily are unique among vertebrate viruses because they possess their owntranscription machinery encoded in a genome of 100–300 kb. The fact thatthe host metabolism is dispensable allows vaccinia to have a high rate ofreplication and protein biosynthesis, making it an excellent choice for theexpression of heterologous genes (Moss, 1996). Mammalian and avian cellsare suitable hosts for vaccinia. The viral genome can accept DNA frag-ments up to �25 kb, which are incorporated by homologous recombina-tion, where in general, the gene encoding for viral thymidine kinase (TK)is replaced and selection of recombinant virus is carried out in TK-deficient cells (Mackett et al., 1982). It is worthwhile to note that thetranscription mechanism of vaccinia is unable to perform splicing; there-fore, this vector allows only the expression of complementary DNA(cDNA) sequences (Moss, 1996). Poxvirus-based systems are commonlyused in eukaryotic cells due to the stability of the viral genome, the widerange of hosts, the ease of production and manipulation of the virus, andthe high expression levels (Carroll and Kovacs, 2003).
Vectors derived from RNA viruses
In retroviruses, the genetic information is encoded in the form of RNA(5–10 kb), which is retro-transcribed to DNA in the host cell by means ofa virus-specific reversed transcriptase enzyme. Since this intermediateDNA cannot integrate into the genome of the infected cell, retrovirusesare employed as transference and expression vectors (Holmes-Son et al.,2001). Several cell lines that enable the production of defective recombi-nant retroviruses have been generated to circumvent the use of helper virus(Cone and Mulligan, 1984). The use of retrovirus as an expression vectorpresents the following advantages: (i) it allows the expression of genes indifferent cell types and species; (ii) stable recombinant cell lines can beobtained since the genetic material of the virus integrates reliably andstably in the host genome, and the viral infection does not produce celldeath; (iii) it allows increased infectivity and higher viral titers; (iv) itallows high efficiency for introduction of foreign genes in animal cellswhen compared with the commonly used transfection methods. Two
Cloning and expression of heterologous proteins in animal cells 47

relevant points should be considered before employing retroviral vectors:(i) although they can express genomic sequences containing introns, theprogeny will not harbor them, only copies of the cDNA; (ii) polyadenyla-tion signals in the target sequence must be avoided because they induce apremature polyadenylation and the consequent absence of full mRNAs(Shimotohno and Temin, 1981). The acceptable yields obtained with retro-viral vectors are explained either by their capacity to integrate intotranscriptionally active loci or, once inserted, they trigger the activation ofthe loci (Kaufman, 1990). However, in terms of biotechnological applica-tions, retroviruses can hardly compete with other viral vectors and presentthe following limitations: the size of the foreign DNA to be expressed(, 6–7 kb), the moderate and variable expression level (one or few copiesof the retrovirus integrate into the chromosomes), and the incapacity toco-express two heterologous sequences from a single retrovirus due toepigenic effects (Emerman and Temin, 1984). Parolın and Palu (2003) haveprovided an excellent review on recent progress in the design and applica-tions of retroviral vectors.
Within the family of Togavirus, two members of the genus Alfavirus,namely Sindbis virus and Semliki Forest virus, stand out for their use inbiotechnology. They are very simple RNA viruses with a genome encod-ing for replication signals, structural proteins and for an RNA-dependentpolymerase. The main expression product of the infected cells is theheterologous gene, since the viral infection down-regulates the synthesisof host proteins (Strauss and Strauss, 1994). The generation and manipula-tion of these vectors is simple, and well-established methods exist for theproduction of recombinant proteins in different cell lines on a large scale(Blasey et al., 1997). Lundstrom (2003) has recently outlined the applica-tions of alfavirus as expression systems.
Among the single-strand RNA viruses, coronaviruses present thelargest genome allowing the insertion of large heterologous sequences(�27 kb). The virus replicates in the cellular cytoplasm and does notundergo an intermediate stage as DNA. Therefore, its integration into thehost genome is an unlikely phenomenon. A description of the differentstrategies available nowadays for the generation and use of coronavirusesas expression vectors has been published by Enjuanes et al. (2003).
3.4.2 Baculoviruses
Baculoviruses encompass a family of viruses that infect different species ofarthropod insects. The name derives from the fact that the DNA genome,with a size between 80 and 200 kb, is packed in nucleocapsids that acquirethe shape of a walking cane or baculo. A schematic representation of thelife cycle of the virus is shown in Figure 3.1. The polyhedrin gene is notessential for virus growth in cell cultures and, if deleted, extracellular viralparticles (ECVs) will be released from the cells. This constitutes the basisfor the use of baculovirus as an expression system: the polyhedrin gene isreplaced by the sequence of interest, whose transcription will, thus, beunder the control of the potent polyhedrin promoter. The recombinantexpression unit is transferred by homologous recombination to the locusof the polyhedrin gene of a wild-type virus.
48 Animal Cell Technology

There are three different approaches to insert genes in a baculovirusgenome: (i) by homologous recombination; (ii) by site-specific transposi-tion to a bacmid (a modified Escherichia coli that contains a copy of thebaculovirus genome) mediated by the transposon 7 (Tn7); or (iii) bymolecular cloning (Condreay and Kost, 2003). Transcriptional promotersthat operate in insect cells are not active in mammalian cells; therefore,baculovirus-based expression can only be achieved by replacing the poly-hedrin promoter with CMV or SV-40 promoter sequences (pCMV,pSV-40). These modified vectors display an extensive diversity of hosts(hematopoietic cells excepted) but an expression level that is cell line-dependent. Variability of expression is, at least partly, associated withtranscriptional silencing of the expression cassette as a result of itsincorporation into the nucleosomes in the genomic DNA (Condreay etal., 1999). Besides its application for the transient expression of recombi-nant proteins, it is also possible to obtain stable cell lines by adding to thevector a cassette with a biochemical marker (Merrihew et al., 2001). Thebaculovirus system offers: (i) versatility and diversity of hosts; (ii) absence
Fusion
Solubilization of
protein matrix
(insect gut)
IngestionSecondary
infection
Secondary
infection
Primary infection (insect)
Replication
Occlusion
Endocytosis
OV
ECV
Figure 3.1
Life cycle of baculoviruses. The infection of insect cells with baculovirus producestwo types of progeny, the extracellular (ECV) and occluded (OV) viral particles,which differ structurally and functionally. The nucleocapsid of ECVs is surroundedby a membrane envelope and these particles cause in vitro cell to cell infection butare not infective to insects. In contrast, the nucleocapsid of OVs is coated by aprotein matrix, formed by polyhedrin or granulin, for the nuclear polyhedrosis orgranulosis virus, respectively. OVs are responsible for de novo infection of insectsbut cannot infect cells cultivated in vitro. The matrix protects the particles againstenvironmental agents (e.g. UV light, drying), but is degraded at the alkaline pH ofthe insect gut. The removal of the protein coat enables the infection of the gutcells by the virus, which migrates to the nucleus to accomplish the replication andtranscription of its genetic material. At this stage the two viral progenies can beformed from the nucleocapsids: those accumulated in the nucleus and assembledto the polyhedrin or granulin give origin to OVs, while those emerging from thenucleus and cell membrane are ECVs.
Cloning and expression of heterologous proteins in animal cells 49

of cytotoxicity; (iii) transient or stable gene expression; (iv) integration asa single copy to the genome; (v) easy manipulation and scaling-up of theproduction; (vi) stability and conservation of the viral particles; (vii)capacity to accept large inserts (�40 kb); and (viii) high biosafety sincebaculovirus is only able to replicate in invertebrates (King and Possee,1992). The main limitations of this system are related to the use of insectcells as a platform for the production of recombinant proteins. In thisrespect, the expression is discontinuous (batch), because of cell lysis/death,and the glycosylation pattern is simpler than that of mammalian cells (withrelatively unbranched sugar chains) and with a high content of mannose.This is usually undesirable for some proteins with therapeutic application(see Chapter 6 and Luckow, 1995).
3.4.3 Plasmid vectors
The discovery and functional characterization of several of the elementsthat control the expression of genes in eukaryotic cells and viruses, inaddition to progress in the field of genetic engineering, allowed thegeneration of plasmid expression vectors. These types of vectors consist ofnaked DNA with a size between 2 and 20 kb. The genetic elements theycontain dictate whether they will exist as episomes or integrated into thehost genome. The basic structure of the plasmid employed for expressionin animal cells is made up of three cassettes: (i) an eukaryotic expressionunit; (ii) a biochemical marker; and (iii) a prokaryotic replication unit (seeFigure 3.2). The first cassette drives the expression of the exogenous gene.The biochemical marker allows for selection of clones that have stablyintegrated the plasmid DNA into their genome (see Section 3.8). In thiscassette, the expression of the selection gene is most preferably dictated bya weak promoter to increase the chances of isolating high producer celllines (Wurm, 2004). All the genetic manipulations required during theconstruction of the recombinant plasmids, as well as their amplification(replication) in sufficient amounts for future transfections, are routinelycarried out in E. coli. Thus, unlike the viral vectors, plasmids also containsequences controlling their replication and selection in a prokaryotic host.Some novel elements of plasmids, which have extended significantly therange of applications in the biotechnology area, are discussed below.
Inducible and specific promoters. The expression of a heterologousgene from a constitutive promoter is not recommended if the recombinantproduct is cytotoxic or affects cell growth. In such a case, it will benecessary to regulate the expression levels that can be achieved by meansof an inducible promoter. An ideal inducible system should meet thefollowing requirements. (i) Specificity: unresponsive to endogenous acti-vators and absence of interference with the host physiology. (ii) Efficiency:null to low expression levels in the non-induced state, and quick responseto activation or induction. (iii) Dose dependency: homogenous regulationof the expression levels. Several sequences and ligands that regulate posi-tively or negatively the transcriptional promoters of a large number ofanimal cells have been identified and incorporated into expression vectors.These elements can respond to different external stimuli such as heatshock, hormones, heavy metals, cytokines, or hypoxia. However, these
50 Animal Cell Technology

stimuli present pleiotropic effects in the host cells, compromising theirspecificity. To overcome this, regulatory elements of evolutionary distantspecies are preferred, the most common being the lactose- (Lac), tetracy-cline- (Tet) or erythromycin- (E; isolated from E. coli), streptogramin orpristinamycin-operon/repressor (PIP; originating from Streptomyces coeli-color or S. pristinaespiralis). Operators are DNA sequences that, bound tospecific molecules (polypeptides, metabolites, etc.), can diminish or in-crease the affinity of the RNA polymerase for the neighboring promoter,thus repressing or promoting the transcriptional activity of the adjacentgene. In the case of the lactose operon, the inducer is isopropyl 1-thio �-D-galactopyranoside (IPTG), which binds to the lactose repressor protein,alters its conformation, and results in the dissociation of the protein fromthe operon, thus de-repressing the expression of the contiguous gene. Oneof the disadvantages of this system is that IPTG is toxic at high concentra-tions (50 mM), restricting its application on a large scale (Makrides, 1999).Ward et al. (1995), using a recombinant vaccinia virus, designed a thermo-regulable variant of the lac repressor that showed a temperature-dependent
Eukaryotic expression cassetteEukaryotic
selection marker
Prokaryotic
cassette
polyA polyASV-40 ori SE*
Enh P TT TTP Neo Amp ColE1
5 UTR� 3 UTR�GCCGCC( )CCATGA/G G ts
TE
MCS
ORF
* PCS FUS
TAA( )A/G* *
Figure 3.2
Basic and optional components of an expression vector for animal cells. The basic structure of aplasmid vector can be divided into three cassettes: (1) a eukaryotic expression unit containing asbasic elements: promoter (p), enhancer (Enh), eukaryotic origin of replication (e.g. SV40 ori) if anepisomal replication is preferred, polyadenylation (polyA) and transcription termination signals (TT),and a multiple cloning site (MCS), where the sequence of interest (ORF) is inserted. Other additionalelements that can be included are: SARs or LCRs (structural elements, SE), targeting signal (ts),sequence encoding for a fusion protein or tag (FUS) and a protease cleavage site (PCS). The gene tobe expressed (ORF) should contain the Kozak sequence or translational enhancer (TE) and anappropriate stop codon (TAA); (2) a biochemical marker (e.g. Neo – neomycin-phosphotransferase)containing the basic elements that regulate its transcription; and (3) a prokaryotic replication unit,composed of a replication origin (ColE1) and a selection marker (Amp, ampicillin) that allows thegenetic manipulation of the vector in E. coli. Asterisks indicate optional elements.
Cloning and expression of heterologous proteins in animal cells 51

affinity for the operon. The benefit of this system is that the effector of theinduction is the culture temperature. A similar inducible system regulatedby tetracycline allows the expression of a gene by induction (Tet-On
1) or
repression (Tet-Off1) in the presence of tetracycline or derivatives. This is
accomplished by modifications in the repressor protein, such as mutationsand/or fusions to repressors or transactivators. This system has theadvantage of low toxicity. Pleiotropic effects are its major drawback,together with the loss of control in the repression (leakiness), evidencedby a basal synthesis of protein in the absence of inducer (Blau and Rossi,1999).
Other alternatives are based on mutated versions of endogenous ele-ments that have lost the capacity to respond to the endogenous inducers orto bind genomic sequences of animals, for example: (i) the systemsmodulated by receptors of the steroid hormones that are induced withmifepristone (RU486), an antagonist of progesterone; (ii) artificial chi-meras that respond to ecdysone, a hormone that regulates the moltingprocess in insects; or (iii) human immunophilins (FK506 or FRAP), whichcan be induced by rapamycin (Papadakis et al., 2004).
In some cases, it is preferable that the expression of the target geneoccurs in a predetermined phase of the cell cycle or growth and/or in aspecific cell type. The recent findings of promoters that fulfill theserequirements facilitated synchronizing the expression of recombinantproteins with the cell cycle, and enlarged the list of suitable expressionhosts (Blau and Rossi, 1999; Nettelbeck et al., 1999).
Targeting signal sequences and tags. Transport signals guide readilysynthesized proteins through the different intracellular trafficking routesand dictate their final location. The targeting signals appear in the form ofan N-terminal sequence (15–60 amino acids), which is generally removedwhen the polypeptide reaches its destiny, and/or as a three-dimensionalpeptide structure exposed on the surface of the mature protein. Theputative locations can be: the cytosol, peroxisomes, nucleus, mitochondria,endoplasmic reticulum, Golgi apparatus, secretory lysosomes, vesicles, orcellular surface. With regard to the production of recombinant proteins inanimal cells, it is preferred that the product is secreted to the culturemedium, thus simplifying its further isolation and purification. If the geneto be expressed lacks a signal peptide for secretion, this can be eitherintroduced by genetic engineering or incorporated into the expressionvector. Some examples of secretion signals are found in the N-terminalsequences of tissue plasminogen activator (tPA) and IgG1. The removal ofa targeting sequence from the gene of interest is only advisable: (i) if thissignal is not essential for the required post-translational processing of theprotein, since these modifications may affect the biological activity of theproduct; (ii) if the accumulation of the recombinant protein in a givencellular compartment may lead to toxicity or complicate its purification.
Tags comprise sequences that go from a few amino acids (His-, FLAG-or c-myc-tags) to large polypeptides (serum albumin, protein A or G,glutathione S-transferase, growth hormone, GFP, CAT, etc.). The purposeof a tag is to confer a novel property such as an increased expression,solubility, stability, and half-life (e.g. serum albumin, protein G, EBV-1antigen), a specific affinity to simplify its isolation and purification (e.g.
52 Animal Cell Technology

GST, calmodulin-binding peptide, His-, FLAG-tag, protein A, glycopro-tein D of HSV), or to enable its detection and/or selection, i.e. tags basedon protein-reporters (�-galactosidase, GFP, CAT, hGH) (Makrides,1999). Tags can be fused to N- or C-terminal ends of the protein and a sitefor proteolytic cleavage is commonly included to eliminate the tag uponexploitation of its functionality. The proteases most commonly used arethrombin, enterokinase, factor Xa, and TEV (catalytic domain of Nia, thenuclear inclusion protein from tobacco etch virus).
Positioning effect and site-directed chromosomal integration. Theterm ‘‘positioning effect’’ refers to the factors associated with the struct-ural organization of the chromatin that have an influence on the rate oftranscription of a heterologous gene (Zahn-Zabal et al., 2001). Thesefactors involve the condensation state of the chromatin, the direction andlocation of the foreign gene with respect to other genes, and the structuralelements in the chromosomes of the host cell (Wurm, 2004). It must beemphasized that nearly 95% of chromatin appears as heterochromatin,which is transcriptionally inactive. In contrast, the euchromatin is lesscondensed and transcriptionally active, wherein gene expression is influ-enced by structural elements (i.e. LCRs, SARs, insulators, boundaries) thatdetermine the transcription of the locus in a cell-specific and/or cell cycle-dependent manner (Bode et al., 2003). Given that chromosomal integrationof a heterologous gene is a random process, it becomes easy to understandwhy the chances for integration into a transcriptionally active region of thegenome are low and, hence, why the expression pattern of the recombinantproduct is heterogeneous and gives rise to clonal variation.
At present, there are three different alternatives to overcome thepositioning effect: (i) use of expression vectors containing elements such asinsulators, boundaries, SARs, and LCRs, and conserved anti-repressorelements whose function is to generate a transcriptionally favorableenvironment at the integration site (Zahn-Zabal et al., 2001); (ii) theaddition of butyrate or tricostatin to the culture, which block the deacety-lation of histones and induce a structural relaxation of the chromatin,making sites that were transcriptionally inactive accessible (Gorman et al.,1983); and (iii) site-directed chromosomal integration of the expressioncassette by means of the CRE/LoxP of bacteriophage P1 or FLP/FRTsystems (for details see Section 3.6.2).
Expression of multiple genes. In animal cells most of the mRNA ismonocistronic and encodes a single protein. In some circumstances, acoordinated expression of two or more heterologous genes may berequired. This is the case for the establishment of a stable cell line using aselection marker, for metabolic engineering, or for the expression ofprotein complexes (i.e. antibodies). Some of the strategies used with thataim include: (i) the expression from a single vector of multiple genes, eachone controlled by its own promoter; (ii) the creation of fusion proteins,where the genes are placed in tandem and separated by linkers, the expres-sion being controlled by a single promoter; (iii) the transfection withmultiple expression vectors, each one carrying a single and distinct geneand selection marker; (iv) the expression of large monocistronic transcriptscontaining the different cDNAs of each gene linked by sequences encod-ing protease cleavage sites, i.e. furine protease, which will subsequently
Cloning and expression of heterologous proteins in animal cells 53

allow each single polypeptide to be obtained; and (v) the use of IRES(internal ribosomal entry site) elements located upstream of the genesequence, which allow binding of the ribosomal complex and, therefore,the initiation of the translation of each individual open reading frame in acap-independent manner (Gurtu et al., 1996).
3.5 Cell lines and biotechnological processes
The choice of a suitable host cell line for recombinant protein productiondepends on many considerations. On one hand, the host cell must show ahigh transfectability, be able to transcribe, translate, fold, and process theprotein and, if possible, to secrete it to the culture medium. On the otherhand, it is advisable that the selected cell line grows in a serum-freemedium because recovery of the recombinant protein from culture mediawith a low protein content is simpler (Mather, 1990). An intrinsicresistance of the cells to shear forces and mechanical damage due toagitation, aeration, and bubbling processes is also desirable. Other aspectsto be considered are the post-translational modifications that the proteinof interest requires and the optimal culture conditions of the selected cellline (Andersen et al., 2000). In this regard, different studies have demon-strated that changes in the carbohydrate content can alter the antigenicity,stability, solubility, tertiary structure, biological activity, or in vivo half-life of the recombinant protein (Delente, 1985). Nowadays, cell linesdisplaying novel biochemical properties can be generated by means ofmetabolic engineering. These modifications aim: (i) to allow robust cellgrowth and/or inhibit apoptosis; (ii) to reduce the secretion of toxicproducts and/or the consumption of nutrients; (iii) to express glycosyl-transferases; and (iv) to control cell proliferation and direct energymetabolism towards protein synthesis (Sanders, 1990). Relevant informa-tion about metabolic engineering can be obtained from Kaufmann andFussenegger (2003).
Although numerous cell lines have been screened for their efficiency asa host system for recombinant protein production, only a few have shownfavorable properties for the expression of biopharmaceuticals (Hauser,1997). Regulatory and economic issues for large-scale production and theintended application of the recombinant protein (diagnosis, therapy, etc.)have to be carefully considered (Makrides and Prentice, 2003). Threemammalian cell lines are now commonly used by the pharmaceuticalindustry: Chinese hamster ovary (CHO) cells, the murine myeloma SP2/0and the NS0 cell line (see Table 3.1). These cell lines have been used toproduce 11 of 21 therapeutic products approved from 1996 to 2000 (Chuand Robinson, 2001).
3.6 Expression in animal cells
Once the DNA encoding the protein of interest is introduced into thecells, expression may be transitory over a period of days or weeks until theDNA is lost from the population. The ability to express the heterologousDNA during a short period of time is called ‘‘transient expression’’ (Kauf-
54 Animal Cell Technology

man, 2000). A few transfected cells may incorporate the exogenous DNAinto their genome by a recombination mechanism leading to the ‘‘stableexpression’’ of a gene (Kaufman, 1997). Figure 3.3 shows the differentphases involving the expression of a heterologous gene.
3.6.1 Transient expression
In general, transient expression allows fast production of a desired proteinto characterize it or to verify the integrity, functionality, and efficiency ofdifferent recombinant vectors. This represents a convenient means ofcomparing the performance of different vectors and ensuring their func-tionality before the more laborious procedure of isolating and characteriz-ing stably transfected cell clones (Kaufman, 1997; Makrides, 2003).Transient expression obviates the clonal variation commonly observed instable transfections. The production of large amounts of recombinantprotein has recently been reported for transient expression systems onlarge scales (Wurm and Bernard, 1999, 2001; Girard et al., 2002; Derouaziet al., 2004).
Different cell lines can be used for transient expression. These includeCOS, BHK, CHO, and two variants of genetically modified HEK-293cells: HEK-293 T (Kim et al., 1997) and HEK-293 EBNA (Cachianeset al., 1993). COS cells were generated by transfection of CV1 cells(African green monkey kidney cells) with a mutant of the SV-40 virus thathas a defective replication origin but encodes the T antigen, necessary toinitiate viral replication. Hence, only vectors defective in the T antigen andcontaining an SV-40 replication origin can multiply in these cells (Gluz-man, 1981). This host/vector system allows the amplification of the copynumber of plasmid DNA (approximately 10 000 copies per cell), yielding
Table 3.1 Cell lines commonly used in the biopharmaceutical industry
Cell line Source Applications
COS Monkey Transient expressionProduction of recombinant viruses
HEK-293 Human Transient and stable expressionProduction of recombinant viruses
BHK-21 Hamster Transient and stable expressionVaccine production
CHO.K1, CHO dhfr- Hamster Transient and stable expressionHybridomas, NS0, SP2/0 Mouse Stable expression
Monoclonal antibodies productionMDCK Dog Stable expression
Vaccines productionPer.C6TM Human Stable expression
Production of recombinant viruses andvaccines
Vero Monkey Vaccine productionSf9, Sf21 Insect Production of recombinant proteins and
baculovirusesTn-368, High-Five1
BTI-TN-5B1-4Insect Recombinant protein production
Cloning and expression of heterologous proteins in animal cells 55

a high protein expression that is followed by cell lysis a few days aftertransfection (Kaufman, 1997; Makrides, 2003). A novel cell line (namedHBK) showing high transient expression levels was recently generated(Cho et al., 2002). This is a somatic hybrid of two human cell lines, HEK-293 and Burkitt lymphoma cells, which combines high transfectability andcapacity for growth in suspension from each cell line, respectively.
3.6.2 Stable expression
In the case of stable transfections, the selection agent is added to thecultures approximately 2 days post-transfection. The selection phasenormally lasts days to weeks. Those cells surviving the selection pressureharbor the selection marker, grow as discrete colonies, and can eitherexpress or not the protein of interest. These transfectants are soon isolatedby means of traditional techniques, which include single cell cloning bycylinders, limiting dilution or soft agar. These methods have nowadaysbeen replaced at the industrial level by fully automated techniques that arefaster, less laborious, and enable high-throughput screening, for example,
Transfection Transient expression Selection Stable clones
Selection
medium
Integrated
stable
expression
Episomal stable
expression
Days: 0 1–3 3–14 7–14
Figure 3.3
Expression of a heterologous gene in mammalian cells. The transfection of hostcells with the recombinant vector can be performed by different methods (seeSection 3.7). During the initial phase, first to third day upon transfection, the cellsexpress the gene transiently. In the absence of selection agent, the DNA iseventually lost from the cell population. In a small proportion of transfected cells,the exogenous DNA is incorporated, by non-homologous recombination, leadingto the generation of cell lines that stably express the gene of interest. If the vectorcontains episomal replication elements, then a stable episomal expression of theexogenous gene takes place. If the vector integrates into the cell genome, then aprocess known as integrated stable expression occurs.
56 Animal Cell Technology

by flow cytometry and using robots (Wurm, 2004). It is important tostress that generally less than 1% of a cell population that transientlyexpresses a gene will give rise to stable cell lines (Jordan and Wurm, 2003).Table 3.2 compares the main advantages and disadvantages of transientand stable expressions.
An alternative and novel strategy for the efficient generation of stablecell lines uses the Cre/LoxP and the FLP/FRT recombination systems todrive a site-specific integration of the heterologous gene. The Cre (cycliza-tion recombination) recombinase from the P1 bacteriophage recombinesthe DNA in a 34 bp site, known as LoxP (locus of crossover of P1),whereas the FLP recombinase, isolated from the Saccharomyces cerevisiae2 �m plasmid, recognizes the FRT site (FLP recombination target), whosesize is 48 bp. The first phase of this method consists of selecting cell linesthat have randomly integrated a reporter gene flanked by LoxP or FLPsites into a transcriptionally active chromosomal locus. In a second phase,the reporter gene is replaced by the gene of interest through a recombina-tion process mediated by Cre or FLP recombinases (Makrides, 2003).Recently, Bode et al. (2003) have explored the potential of structuralelements located in the chromatin to direct a site-specific integration ofthe gene, and were able to isolate high producer cell lines. A host/vectorsystem that makes use of FLP/FRT elements and different modified celllines, containing a single FRT site in a transcriptionally active locus, iscommercially available (Flp-InTM expression vectors, Invitrogen).
The success of transfection, either stable or transient, depends on severalfactors that must be taken into account and can be summarized as follows:(i) the transfectability and physiology of the cell line; (ii) the characteristicof the genetic marker in the expression vector; (iii) the type of expressiondesired; (iv) the size of the expression cassette and the quality of the DNAto be introduced; (v) the compatibility of the transfection method and/orreagents with the cell line; (vi) the type of assay to be used for detection of
Table 3.2 Comparison of transient and stable expression
Transient expression Stable expression
Short time-frame for the generation ofthe product
Long time-frame for the generation of theproduct
Simple, does not require selectionmarker
Selection and/or amplification markersare required
No need to screen for recombinantclones
Tedious and time-consuming screeningof the recombinant clones
Expression levels are not influenced bythe ‘‘positioning effect’’
The expression levels are influenced bythe ‘‘positioning effect’’ and the genecopy number
Useful to confirm the integrity ofexpression vectors, convenient for high-throughput screening methods, e.g. tostudy different mutant genes
Once a stable expressing clone isidentified, it constitutes an unlimitedsource for protein production
Circular DNA is used The use of linearized or circular DNAdepends on the transfection method,but, in general, linearized DNA isadvisable
Cloning and expression of heterologous proteins in animal cells 57

the recombinant product; and (vii) the presence of fetal bovine serum and/or antibiotics in the culture medium. Additionally, the selection of anappropriate vector is as important as the selection of the cell line and/or ofthe transfection conditions.
3.7 Introduction of DNA into mammalian cells
A wide variety of methodologies and reagents are currently employed tointroduce different molecules into eukaryotic cells. The incorporation ofDNA can be achieved by two different mechanisms: infection or transfec-tion. The first consists of a biological process mediated by a virus (the viralinfection of cells is mediated by receptors), while the second makes use ofphysical or biochemical methods to incorporate the DNA into the cell.Although the virus-mediated methods are more efficient, they are morelaborious and time-consuming compared with transfection. Additionally,the nature of the infection process requires the presence of virus-specificreceptors in the host cell to allow viral penetration, which restricts thespectrum of possible host cells. Another limitation of viral infection as amethod for DNA transfer is that, unlike plasmid transfection, it is notpossible to simultaneously transfer multiple recombinant viruses into thecell (Wurm and Bernard, 1999).
In the next sections, the transfection methods most commonly used incell culture laboratories will be described. It is difficult to predict the bestmethod for transfection, so the expression vector, the cell type, and thefacilities of each laboratory should be taken into account before decidingwhich technique to apply (Wurm, 2004). For infection techniques, anupdated compilation can be obtained from Heiser (2004).
3.7.1 Calcium phosphate co-precipitation method
Although this technique was originally used to increase the infectivity ofadenoviral DNA (Graham and Van der Eb, 1973), it became more popularafter extending its application to plasmid DNA (Maitland and McDougall,1977; Wigler et al., 1977). Although the original method has been fre-quently modified to increase the transfection efficiency, it consists basi-cally of mixing purified DNA with calcium chloride and phosphate bufferat neutral pH, which results in the formation of a fine, visible precipitate.The precipitate (DNA–calcium phosphate complex), when added to thecells, is incorporated by phagocytosis. The complexes fuse to the phago-somes and are transported to different cellular organelles, including thenucleus (Chen and Okayama, 1991). For many cell lines, the transfectionefficiency can be further increased by means of short exposures of the cellsto chemical agents like glycerol or dimethyl sulfoxide (DMSO) in concen-trations between 10 and 20%. Variables such as pH, precipitate quality,incubation time with the precipitate, DNA concentration, cellular state,temperature, and concentrations of chemical agents, can influence thetransfection efficiency. This method is widely used because of its low cost,the lack of requirements for sophisticated infrastructure, and its applic-ability to a wide range of different adherent and suspension cell lines. On
58 Animal Cell Technology

the other hand, cytotoxicity, high mutation rates, and the need foroptimization and standardization of the transfection conditions are recog-nized as the major disadvantages of this method. The critical parameters toobtain an optimal precipitate were very well described by Chen andOkayama (1991) and Jordan et al. (1996). Girard et al. (2002) reported theestablishment of a large-scale transfection method (100 L bioreactor) forHEK-293 cells in suspension using calcium phosphate. More recently,Lindell et al. (2004) developed a new technique named calfection, whichconsists of the addition of a calcium chloride/DNA mixture to the culturemedium in agitation. Although this method presents good scale-up poten-tial, the mechanism by which the DNA is incorporated remains unknown,which complicates optimization of the process.
3.7.2 Cationic polymers
Several polycations with a good buffering capacity below physiologicalpH, such as lipopolyamines and polyamidoamine polymers, have provedto be efficient transfection agents (Boussif et al., 1995). Two of the mostpopular methods based on polycations are discussed below: diethylami-noethyl-dextran (DEAE-dextran) and polyethylenimine (PEI).
DEAE-dextran. Like the calcium phosphate co-precipitation method,the DEAE-dextran technique was originally developed to increase theviral infectivity of animal cells, and its application was later extended totransfection processes. Although it is simple, efficient, and appropriate fortransient expression, its use for stable transfections has not given satisfac-tory results. The transfection efficiency of this method can be increased bytreating cells with glycerol or DMSO. The DNA is incorporated byendocytosis, and thus exposed to extreme pH levels and cellular nucleases,which may explain, to a certain extent, the high frequency of mutationsobserved when transfecting by this method (Calos et al., 1983). Thistransfection technique can be applied to both adherent and suspension celllines. For detailed transfection protocols, the works by Keown et al.(1990) and Kaufman (1997, 2000) are recommended.
PEI. Boussif et al. (1995) reported for the first time the use of PEI as avehicle for gene delivery into cells and, since then, there has been agrowing interest in the in vitro and in vivo applications of this method toanimal cells. PEI is an organic polymer with a high density of aminogroups that can be protonated. At physiological pH, the polycationpresents a high affinity for binding DNA and can mediate the transfectionof eukaryotic cells (Boussif et al., 1995). PEI presents two types ofstructures, linear or branched, with variable molecular weights. Linear PEIwas reported to display a higher gene transfer efficiency under serum-freeconditions in CHO cells in comparison with branched PEI (Derouaziet al., 2004). Moreover, the linear form with a molecular weight of 25 kDashowed the highest level of recombinant protein expression while prevent-ing aggregation and attachment of cells grown in suspension. Although theprecise mechanism mediating gene transfer by PEI remains unknown(Bertschinger et al., 2004), it has been postulated that the buffer capacityof the polycation at the lysosomal level would protect the DNA:PEIparticles from nuclease degradation (Boussif et al., 1995). The critical
Cloning and expression of heterologous proteins in animal cells 59

parameters for PEI-mediated transfections are the amount of DNA, thePEI/DNA ratio, the cell density at the time of transfection, and the orderof addition of reagents. In fact, Boussif et al. (1995) described that thetransfection efficiency is one order of magnitude higher when the cationicpolymer is added to the plasmid solution rather than vice versa. Thismethod has been demonstrated to be effective for primary cultures and celllines, for adherent and suspension cells, and for serum-containing andserum-free media. In addition, the cost of the PEI-based method enablesits use in transient transfections on a large scale (Boussifet al., 1995; Derouazi et al., 2004).
3.7.3 Lipid-mediated gene transfer (lipofection)
Since the first work of Felgner et al. (1987), describing the use of asynthetic cationic lipid for transfection, more than a dozen cationicliposomes have been developed (Gao and Huang, 1995). Under optimalconditions, the cationic lipids form small unilamellar liposomes whenformulated in water. The surface of these liposomes is positively chargedand interacts with the phosphate backbone of the DNA, forming com-plexes that present high affinity for the negatively charged surface of thecell membrane. The uptake and delivery of lipid–DNA complexes intothe intracellular compartment is mediated by endocytosis. Normally,cationic liposomes contain an amphiphilic cationic lipid (DOSPA,DOTMA, etc.) and a neutral helper lipid, generally DOPE. DOPE isneeded in the case of cationic lipids that do not form bilayers in order tostabilize the formation of the cationic liposome (Gao and Huang, 1995).This innovative technology stands out as being easy to accomplish, and itsdiverse applications offer reproducible results associated with very goodyields. The large variety of formulations available has conferred tolipofection a great versatility of applications: stable cell lines and primarycultures, transient and stable transfections, adherent or suspension cells.Different formulations presenting high transfection efficiencies are com-mercialized by several companies. Unfortunately, the high cost of theseproducts precludes their use in large-scale processes. Multivalent cationiclipids present better transfection efficiencies than those composed ofmonovalent cationic lipids (Behr et al., 1989). For example,LipofectamineTM (composed of DOSPA:DOPE, i.e. a multivalent cationiclipid associated with a helper lipid) turned out to be more effective thanLipofectin (DOTMA:DOPE, a monovalent cationic lipid associated witha helper lipid). Both these formulations are commercialized by Invitrogen.Alternatively, the biopharmaceutical company Genentech reported theroutine use of a ‘‘home-made’’ cationic lipid for transient transfection ofCHO cells in a 5–10 L scale (Wurm and Bernard, 2001).
3.7.4 Electroporation
In this method, the delivery of DNA molecules to the cells is mediated byshort strong electrical pulses (Wong and Neumann, 1982). The exposureof the cells to an electrical field induces a potential difference across thecellular membranes that generates temporary pores through which the
60 Animal Cell Technology
DNA reaches the cytoplasm. Compared with other methods, such ascalcium phosphate co-precipitation and DEAE-dextran, electroporationpresents lower mutation frequencies (Bertling et al., 1987), perhapsbecause the DNA remains free in the cytoplasm and nucleoplasm. Severalcell types resistant to transfection by other procedures, including lympho-cytes (Potter et al., 1984), hematopoietic stem cells (Toneguzzo andKeating, 1986) and murine embryonic stem cells (Torres and Kuhn, 1997),have been successfully electroporated. Furthermore, this technique rendershigher efficiencies when linearized DNA is used (Sanders, 1990). Theadvantages of this technique include its simplicity, reproducibility, applic-ability for transient and stable transfections, for adherent and suspensioncells, and the possibility to control gene copy number in transfectants. Onthe other hand, the pulse time and the intensity of the electrical field raiseconcerns and must be determined empirically for each cell type, sincesuccesful transfection can be achieved in a very limited range of voltage. Anumber of electroporation devices are commercially available, which aresafe, easy to handle, and allow the control of different electroporationparameters. In addition to the physical properties of the electrical pulse,the type of buffer solution, and the quality and concentration of cells(exponentially growing cells, between 106 and 107 cells/ml) have to beconsidered. In particular, cell concentration has proved to be critical, sincelower cell densities reduce the transfection efficiency and higher celldensities favor cell fusion processes that have a detrimental effect ontransfection (Spencer, 1991).
3.8 Selection markers
Upon transfection, there are cells that incorporate the plasmid (trans-fected) and others that do not (wild-type). A selection system allows theseparation of these two cell populations. In this regard, the detection ofmorphologic changes or, more commonly, the use of some toxic metabo-lite for which the vector confers resistance (biochemical markers) havebecome the methods of choice to select positive transfectants.
3.8.1 Morphological changes
In general, cells transfected with DNA that contains transforming genes,derived from oncogenic viruses, lose the growth feature called ‘‘contactinhibition,’’ which limits their growth and proliferation. These transfec-tants can be visualized under the microscope and isolated as colonies.
3.8.2 Biochemical markers and gene amplification
Many genes that encode proteins causing biochemical tranformations inthe cells have been isolated, characterized, and employed in eukaryoticexpression systems. Among these biochemical markers, those conferringresistance to cytotoxic drugs are among the most commonly used. Theyallow the selection of stably transfected cells from a heterogeneous popu-lation cultured in the presence of toxic metabolites (Sanders, 1990). As
Cloning and expression of heterologous proteins in animal cells 61

previously described, plasmids employed for stable expression contain aselection cassette with a gene that will provide a new property to thetransfected cell. Both the sequence encoding the product and the selectiongene can be contained in the same plasmid or in individual vectors, andthis has no influence on the expression levels of the recombinant protein.When present in the same vector they can be expressed from a polycis-tronic mRNA (see Section 3.4.3). One strategy to increase the chances ofobtaining high producer cell lines consists of driving the expression of theresistance gene by a weak promoter. Although this approach significantlyreduces the efficiency of the transfection, the cells that survive the selectivepressure show higher yields of recombinant protein (Wurm, 2004). Theresistance to a drug can be recessive or dominant. Those genes providingrecessive resistance need a particular host, which must be deficient in theactivity by which it will be selected, whereas the genes confering dominantresistance can be used independently of the biochemical background ofthe cell (Keown et al., 1990). Use of the TK gene is one example ofselection employing a recessive biochemical marker. Mammalian cellsdisplay an absolute dependency on the TK enzyme when they arecultivated in the presence of aminopterin, which blocks the de novosynthesis of thymidine. The selection medium HAT, containing hypox-anthine, aminopterin, and thymidine, is used to rescue cells that expressTK. Obviously, this selection system requires cells that lack TK, alsoidentified as TK–. In this respect, TK– cell lines are available from humanand murine origin (Bacchetti and Graham, 1977; Maitland and McDougall,1977; Wigler et al., 1977).
The selection systems based on a dominant marker are based onresistance to antibiotics. A large number of drugs are used for this purpose:neomycin, hygromycin, puromycin, bleomycin, and zeocin, among others.However, two aminoglycoside phosphotransferases are most routinelyused, namely neomycin-phosphotransferase and hygromicin-B-phospho-transferase. Both confer resistance by phosphorylation-mediated inactiva-tion of the corresponding antibiotics. The toxic metabolites added to theculture medium are G418 (analog to gentamicin and also known asgeneticin) and hygromycin B, both of which inhibit protein synthesis(Gonzalez et al., 1978; Colbere-Garapin et al., 1981).
Another group of biochemical markers is characterized by promotingthe phenomenon of ‘‘gene amplification’’ and, hence, known as amplifica-tion markers. Various features have been shown for the gene amplificationprocess: (i) the amplification is obtained after treatment with increasingconcentrations of the selection agent; (ii) the amplified DNA showscertain instability; (iii) the size and structure of the amplified unit isvariable and temporary (Keown et al., 1990). Within the amplificationmarkers, the most commonly used are the enzymes dihydrofolate reduc-tase (DHFR), involved in the metabolism of nucleotides (Figure 3.4), andglutamine synthetase (GS). For DHFR, selection takes place in the absenceof hypoxanthine and thymidine, whereas for GS selection takes place inthe absence of glutamine. Although most of the ‘‘amplified’’ cells expresssignificant amounts of the recombinant protein, the increase in specificproductivity (usually 10–20-fold) varies from clone to clone (Wirth et al.,1988). In eukaryotic vectors, the DHFR gene is of prokaryote (E. coli) or
62 Animal Cell Technology

murine origin, the latter producing a protein with higher resistance againstMTX (Simonsen and Levinson, 1983). The extensive use of this system liesin the availability of CHO cells lacking the DHFR enzyme (Urlaub andChasin, 1980). The commonly used clones DUKX-B11 and DG44 can beobtained from Dr Lawrence Chasin (Columbia University, NY).
In the case of the GS, the enzyme catalyzes the synthesis of glutaminefrom glutamate and ammonium. Ammonia is an undesirable byproduct ofcellular metabolism that is released into culture medium. Thus, this systempresents a dual effect: on one hand, it reduces the ammonia levels in theculture medium and, on the other hand, it provides cells with a continuoussource of glutamine, which is an unstable amino acid. GS is specificallyand irreversibly inhibited by methionine sulfoximine (MSX), an analog ofglutamine. Therefore, cells overexpressing the enzyme are resistant to highdoses of MSX (Sanders and Wilson, 1984). Similarly to the DHFR system,the GS/MSX system has proved to be effective for gene amplification. Atypical example of this system is based on NS0 cells transfected with theGS gene and treated with 10–100 �M MSX, which allowed the isolation ofresistant clones containing several copies of the GS and the heterologousgene (Bebbington et al., 1992).
A
folic acid
folic acid
DHFR DHFR
DHFRDHFR
dihydrofolate (FH )2
dihydrofolate (FH )2
FH2
FH2
FH2
tetrahydrofolate (FH )4
tetrahydrofolate (FH )4
FH4
FH4
FH4
FH4
MTX MTX
serine �
glycine
TMP
B
dUMP
Figure 3.4
Gene amplification. (A) The DHFR enzyme catalyzes the conversion of folate totetrahydrofolate (FH4) via the intermediate product dihydrofolate (FH2). FH4 isessential for the biosynthesis of purine, glycine, and thymidine monophosphate(TMP) from deoxyuridine monophosphate (dUMP). (B) In the DHFR system, theexpression of recombinant protein is increased by exposing the cells to highmethotrexate (MTX) concentrations. MTX is an analog of folic acid that binds toDHFR, inhibiting the enzyme and causing cell death. Increasing concentrations ofMTX in the culture medium induce a selection pressure for cells with high levels ofDHFR and, concomitantly, the gene of interest is amplified. Highly resistant clonescommonly contain hundreds to thousands of copies of the plasmid integrated intheir chromosomes.
Cloning and expression of heterologous proteins in animal cells 63

Finally, it is worth emphasizing that the optimization of the selectionmethod must precede any attempt to obtain recombinant cell lines.Performing a dose-response assay is highly recommended to assess thelowest concentration of the antibiotic that kills the wild-type cells after agiven period of time.
3.8.3 Reporter markers
The advent of reporter markers has greatly contributed to a better under-standing of gene expression in eukaryotic cells. A reporter gene encodesfor a protein that can be monitored by simple and sensitive methods.Reporter genes are commonly used to: (i) optimize and monitor DNAdelivery methods; (ii) study a variety of promoters and regulatory ele-ments, since the expression levels of the reporter protein will reflect thetranscription activity; (iii) analyze the traffic and/or the cellular compart-mentalization of the studied protein; (iv) characterize transcription factorsand associated proteins, such as co-activators; (v) identify protein–proteininteractions; and (vi) develop high-throughput screening of compoundswith potential therapeutic effects. An ideal reporter gene should meet thefollowing characteristics: (i) to be absent or expressed in very low levels inthe cell; (ii) to be detected by a simple, sensitive, and reliable method; (iii)not to induce pleiotropic effects in the host cell. A significant number ofreporter genes are suitable for use in mammalian cells, whose expression isevidenced by colorimetric, fluorescence, or chemiluminescence methods.Some examples are described below.
Chloramphenicol acetyl transferase (CAT). This bacterial enzyme wasthe first reporter protein used for studying the transcriptional activity ofeukaryotic regulatory sequences (Gorman et al., 1982). CAT inactivateschloramphenicol, an inhibitor of prokaryotic protein synthesis, by con-verting it to the mono- or di-acetylated species. Measurement of CATactivity requires a 14C-radiolabeled chloramphenicol or acetyl-CoA and,therefore, an additional step is neccessary to separate the radio-labeledreactant from the product. Novel detection methods based on fluorescentsubstrates or ELISA assays, which do not use radiolabeled reagents, havebeen described more recently (Bullock and Gorman, 2000).
Beta-galactosidase (�-gal). The �-gal enzyme from E. coli is the mostfrequently used reporter marker in science, because it is functionally activeand well tolerated in a variety of cell lines. �-gal activity can be monitoredboth qualitatively, by in situ staining, and quantitatively, in cell lysates,without the need for sophisticated laboratory equipment. The enzymehydrolyzes many natural or synthetic �-D-galactopyranosides, whichallows the use of different detection methods (Serebriiskii and Golemis,2000). Because mammalian cells have endogenous �-gal activity, thisreporter gene should be used only in cells displaying a low endogenousactivity. In situ detection of �-gal requires cell fixation and addition of thecolorless substrate 5-bromo-4-chloro-3-indolyl-�-D-galactoside (X-Gal),which is converted into a blue precipitate by the enzyme action. On theother hand, determination of �-gal activity in cellular extracts is performedby a simple and fast assay based on the conversion of the colorless ortho-nitrophenyl-�-D-galactopyranoside (ONPG) into galactose and ortho-
64 Animal Cell Technology
nitrophenol, which is detected at 420 nm (Miller, 1972). Alternatively,�-gal activity can be assessed in vivo using the substrate FdG (fluoresceindi-�-D-galactopyranoside). Hydrolysis of this compound releases fluor-escein, which is retained intracellularly and can be measured by fluores-cent activated cell sorting or FACS (Rossi et al., 2000). Different �-galdetection protocols are reviewed by Alam and Cook (2003).
Luciferase. Luciferase and luciferin are a non-specific enzyme and itssubstrate, respectively, that upon reaction in the presence of ATP, Mg2þ,and O2 generate bioluminiscence. Different genes or cDNAs encodingluciferases have been isolated from different organisms, such as unicellularseaweed, marine bacteria, and fish. Due to the specificity of the reaction,many luciferases have been used as reporter proteins either in prokaryoticor eukaryotic cells (Greer and Szalay, 2002). Firefly luciferase (LUC) isone of the most widely used. The oxidation reaction produces oxylucifer-in, CO2, and a photon. The intensity of light emitted during the reaction ismeasured with a luminometer. Luciferase-based techniques are sensitive,simple, rapid, inexpensive, safe (organic solvent or radiolabeled com-pounds are not required for the test), and applicable to a wide range of celllines. One of the most recent advances constitutes the development ofhighly sensitive techniques that make the detection of luciferase activity inliving cells and organisms feasible (Greer and Szalay, 2002).
Green fluorescent protein (GFP). GFP was discovered during theinvestigation of marine bioluminescent organisms. In the 1960s, it wasdemonstrated that Aequoria jellyfish emitted light after the addition ofCa2þ, with no need for other cofactors. The gene encoding the AequoriaGFP was cloned in 1991, and is used as a reporter in cells, where uponexcitation at 395 nm a green fluorescence is emitted at 509 nm. The GFP isexceptionally stable with respect to pH, temperature, and proteolysis, andcan be detected in living cells and organisms (Yang et al., 1996). Due to theprolonged time required between the post-translational maturation andthe appearence of fluorescence (3–5 hours) in the wild-type GFP (Brand,1995), different mutants exhibiting an increased fluorescence intensityhave been generated (Welsh and Kay, 1997). The enhanced GFP (EGFP)is a variant with two amino acid substitutions (Phe64Leu and Ser65Thr),whose fluorescence is shifted to the red spectrum. The advantages thatEGFP presents over the wild-type species are: (i) an increased fluorescenceintensity; (ii) a shorter time period between protein synthesis and fluores-cence; and (iii) higher expression levels in several animal cells. Currently,there are also yellow (EYFP) and cyan (ECFP) variants, which are excitedat 514 and 434 nm, with a maximal emission at 477 and 527 nm, respec-tively.
Alkaline phosphatase (AP). APs refer to a class of hydrolase enzymesthat catalyze the hydrolysis of a broad range of monophosphates and havean optimal activity at alkaline pH (10–10.5). APs are found in all organ-isms. In earlier times, the use of APs as reporter marker was hamperedbecause most animal cells exhibit high endogenous activity. This limitationwas overcome by Berger et al. (1988), who generated a secreted form ofthe human placental AP, known as SEAP. The enzymatic properties of theSEAP are equivalent to the wild-type AP. AP activity derived from SEAPis distinguished from the endogenous AP by assaying the activity in an
Cloning and expression of heterologous proteins in animal cells 65

aliquot of culture supernatant. In general, SEAP offers certain benefitswhen compared with other intracellular reporter enzymes: (i) there is noneed for cell lysis; (ii) the kinetics of gene expression is easily monitoredby harvesting and assaying the supernatant periodically; (iii) living trans-fected cells remain available for additional phenotypic characterization,such as cell growth, specific mRNA expression, and other enzymaticactivities; and (iv) the test presents good sensitivity due to the use ofchemiluminiscence substrates (Alam and Cook, 2003)
3.9 Screening, quantitation, and bioassay methods
Once the selection process is completed, many resistant clones may beobtained, which express the heterologous gene at different levels. Accord-ing to experienced researchers, the expression levels of ‘‘overproducer’’clones should be 5–30-fold higher than the average of the pool of clones.These variations in the expression levels are independent of the cell lineand the transfection method used (Wirth and Hauser, 1993). For thatreason, it is necessary to have screening and monitoring methods that aresensitive and specific enough to detect and quantify the protein expressedby high producer clones in early stages. In general, protein detection canbe carried out by assaying its biological activity (in the case of enzymes,coagulation factors, cytokines, growth factors, hormones, etc.) or by usingan immunochemical assay (ELISA, Western blot, RIA, dot blot, etc.). Thefirst provides a precise measurement of the protein functionality, while thesecond is only useful to identify the molecule without an indication ofactivity. In general, the immunochemical methods are technically simple,fast, and less costly than those based on the assesment of biologicalactivity.
In the case of recombinant products expressed with a tag or fusionprotein, the immunoassay can be directed towards the detection of the tag,for example, in the case of an antibody that reacts against myc-tag (seeSection 3.4.3). Another example is the use of bicistronic vectors where,apart from the gene of interest, a reporter gene is coexpressed and itsproperties are exploited for the selection and isolation of recombinantclones (i.e. GFP-coexpressing cells sorted by flow cytometry). Alterna-tively, high speed cell sorting can be used for the selection and separationof cells when the reporter gene is expressed as a surface protein, forexample, a receptor. In this example, the separation is based on the use of afluorescent-labeled antibody that reacts against the surface protein.
3.10 Optimizing the initial stage of an animal cell-basedbioprocess
In summary, it can be concluded that the optimization of the expression ofheterologous genes in animal cells deserves careful design. Firstly, thebiological properties of the final product and the amount required for itsfurther application (e.g. diagnostics or therapy) have to be considered.These two factors determine the strategy and expression system that bestsuit the needs of the recombinant product. Both the vector and the target
66 Animal Cell Technology

sequence can be genetically manipulated, adding or removing elementsthat can improve the rate of transcription and translation of the gene ofinterest. The selected host for the production of the recombinant proteinmust be able to introduce the post-translational modifications required forthe biological activity of the product. It is essential that the host cell iscultivated under optimal conditions to warrant higher transfection effi-ciencies, and to facilitate the selection, cloning and growth of the futurerecombinant cell lines. Finally, selecting the most suitable transfectionmethod and choosing the selection marker and screening technique arepivotal issues that can substantially increase the probability of isolatingrecombinant cell lines with high specific productivities.
References
Alam J, Cook JL (2003), Reporter genes for monitoring gene expression in mammaliancells, In: Makrides SC (Ed.), Gene Transfer and Expression in Mammalian Cells,Elsevier Science BV, Amsterdam, pp. 291–308.
Andersen DC, Bridges T, Gawlitzek M, Hoy C (2000), Multiple cell culture factorscan affect the glycosylation of Asn-184 in CHO-produced tissue-type plasmino-gen activator, Biotechnol. Bioeng. 70:25–31.
Bacchetti S, Graham FL (1977), Transfer of the gene for thymidine kinase to thymidinekinase-deficient human cells by purified herpes simplex virus DNA, Proc. NatlAcad. Sci. U S A 74:1590–1594.
Bebbington CR, Renner G, Thomson S, King D, Abrams D, Yarranton GT (1992),High level expression of a recombinant antibody from myeloma cells using aglutamine synthetase gene as an amplifiable selectable marker, Biotechnology10:169–175.
Behr JP, Demeneix B, Loeffler JP, Perez-Mutul J (1989), Efficient gene transfer inmammalian primary endocrine cells with lipopolyamine-coated DNA, Proc. NatlAcad. Sci. U S A 86:6982–6986.
Berger J, Hauber J, Hauber R, Geiger R, Cullen BR (1988), Secreted placental alkalinephosphatase: a powerful new quantitative indicator of gene expression in eukar-yotic cells, Gene 66:1–10.
Bertling W, Hunger-Bertling K, Cline MJ (1987), Intranuclear uptake and persistenceof biologically active DNA after electroporation of mammalian cells, J. Biochem.Biophys. Methods 14:223–232.
Bertschinger M, Chaboche S, Jordan M, Wurm FM (2004), A spectrophotometricassay for the quantification of polyethylenimine in DNA nanoparticles, Anal.Biochem. 334:196–198.
Blasey HD, Lundstrom K, Tate S, Bernard AR (1997), Recombinant protein produc-tion using the Semliki Forest Virus expression system, Cytotechnology 24:65–72.
Blau HM, Rossi FM (1999), Tet B or not tet B: advances in tetracycline-inducible geneexpression, Proc. Natl Acad. Sci. U S A 96:797–799.
Bode J, Gotze S, Ernst E, Husemann Y, Baer A, Seibler J, Mielke C (2003),Architecture and utilization of highly expressed genomic sites, In: Makrides SC(Ed.), Gene Transfer and Expression in Mammalian Cells, Elsevier Science BV,Amsterdam, pp. 551–572.
Bourbeau D, Zeng Y, Massie B (2003), Virus-based vectors for gene expression inmammalian cells: Adenovirus, In: Makrides SC (Ed.), Gene Transfer and Expres-sion in Mammalian Cells, Elsevier Science BV, Amsterdam, pp. 109–124.
Boussif O, Lezoualc9h F, Zanta MA, Mergny MD, Scherman D, Demeneix B, Behr JP(1995), A versatile vector for gene and oligonucleotide transfer into cells in cultureand in vivo: polyethylenimine, Proc. Natl Acad. Sci. U S A 92:7297–7301.
Cloning and expression of heterologous proteins in animal cells 67

Brand A (1995), GFP inDrosophila, Trends Genet. 11:324–325.Bullock C, Gorman C (2000), Fusions to chloramphenicol acetyltransferase as a
reporter, Methods Enzymol. 326:202–221.Burton EA, Bai Q, Goins WF, Fink D, Glorioso JC (2003), Virus-based vectors for
gene expression in mammalian cells: Herpes simplex virus, In: Makrides SC (Ed.),Gene Transfer and Expression in Mammalian Cells, Elsevier Science BV, Amster-dam, pp. 27–54.
Cachianes G, Ho C, Weber RF, Williams SR, Goeddel DV, Leung DW (1993),Epstein-Barr virus-derived vectors for transient and stable expression of recombi-nant proteins, Biotechniques 15:255–259.
Calos MP, Lebkowski JS, Botchan MR (1983), High mutation frequency in DNAtransfected into mammalian cells, Proc. Natl Acad. Sci. U S A 80:3015–3019.
Carroll MW, Kovacs GR (2003), Virus-based vectors for gene expression in mamma-lian cells: Vaccinia virus, In: Makrides SC (Ed.), Gene Transfer and Expression inMammalian Cells, Elsevier Science BV, Amsterdam, pp. 125–136.
Chen C, Okayama H (1991), Calcium phosphate mediated gene transfer into estab-lished cell lines, In: Murray EJ (Ed.), Gene Transfer and Expression Protocols,Humana Press, Clifton, pp. 15–21.
Cho MS, Yee H, Chan S (2002), Establishment of a human somatic hybrid cell line forrecombinant protein production, J. Biomed. Sci. 9:631–638.
Chu L, Robinson D (2001), Industrial choices for protein production by large-scalecell culture, Curr. Opin. Biotechnol. 12:180–187.
Colbere-Garapin F, Horodniceanu F, Kourilsky P, Garapin A (1981), A new dominanthybrid selective marker for higher eucaryotic cells, J. Mol. Biol. 150:1–14.
Condreay JP, Kost TA (2003), Virus-based vectors for gene expression in mammaliancells: Baculovirus, In: Makrides SC (Ed.), Gene Transfer and Expression inMammalian Cells, Elsevier Science BV, Amsterdam, pp. 137–150.
Condreay JP, Witherspoon SM, Clay WC, Kost TA (1999), Transient and stable geneexpression in mammalian cells transduced with a recombinant baculovirus vector,Proc. Natl Acad. Sci. U S A 96:127–132.
Cone RD, Mulligan RC (1984), High-efficiency gene transfer into mammalian cells:generation of helper-free recombinant retrovirus with broad mammalian hostrange, Proc. Natl Acad. Sci. U S A 81:6349–6353.
Delente JJ (1985), Glycosylation revisited, Trends Biotechnol. 3:218.Derouazi M, Girard P, Van Tilborgh F, Iglesias K, Muller N, Bertschinger M, Wurm
FM (2004), Serum-free large-scale transient transfection of CHO cells, Biotech-nol. Bioeng. 87:537–545.
Emerman M, Temin HM (1984), Genes with promoters in retrovirus vectors can beindependently suppressed by an epigenetic mechanism, Cell 39:449–467.
Enjuanes L, Almazan F, Ortego J (2003), Virus-based vectors for gene expression inmammalian cells: Coronavirus, In: Makrides SC (Ed.), Gene Transfer and Expres-sion in Mammalian Cells, Elsevier Science BV, Amsterdam, pp. 151–168.
Fedorov A, Saxonov S, Gilbert W (2002), Regularities of context-dependent codon biasin eukaryotic genes, Nucleic Acids Res. 30:1192–1197.
Felgner PL, Gadek TR, Holm M, Roman R, Chan HW, Wenz M, Northrop JP,Ringold GM, Danielsen M (1987), Lipofection: a highly efficient, lipid-mediatedDNA transfection procedure, Proc. Natl Acad. Sci. U S A 84:7413–7417.
Fromm M, Berg P (1983), Simian virus 40 early- and late-region promoter functionsare enhanced by the 72-base-pair repeat inserted at distant locations and invertedorientations, Mol. Cell. Biol. 6:991–999.
Gao X, Huang L (1995), Cationic liposome-mediated gene transfer, Gene Therapy2:710–722.
Gerasimova TI, Corces VG (2001), Chromatin insulators and boundaries: effects ontranscription and nuclear organization, Annu. Rev. Genet. 35:193–208.
68 Animal Cell Technology

Girard P, Derouazi M, Baumgartner G, Bourgeois M, Jordan M, Jacko B, Wurm FM(2002), 100-liter transient transfection, Cytotechnology 38:15–21.
Gluzman Y (1981), SV40-transformed simian cells support the replication of earlySV40 mutants, Cell 23:175–182.
Goff SP, Berg P (1976), Construction of hybrid viruses containing SV40 and lambdaphage DNA segments and their propagation in cultured monkey cells, Cell9:695–705.
Gonzalez A, Jimenez A, Vazquez D, Davies JE, Schindler D (1978), Studies on themode of action of hygromycin B, an inhibitor of translocation in eukaryotes,Biochem. Biophys. Acta 521:459–469.
Gorman CM, Moffat LF, Howard BH (1982), Recombinant genomes which expresschloramphenicol acetyltransferase in mammalian cells, Mol. Cell. Biol. 2:1044–1051.
Gorman CM, Howard BH; Reeves R (1983), Expression of recombinant plasmids inmammalian cells is enhanced by sodium butyrate, Nucleic Acids Res. 11:7631–7648.
Graham FL, Van Der Eb AJ (1973), A new technique for the assay of infectivity ofhuman adenovirus 5 DNA, Virology 52:456–467.
Gray NK, Wickens M (1998), Control of translation initiation in animals, Annu. Rev.Cell. Dev. Biol. 14:399–458.
Greer LF, Szalay AA (2002), Imaging of light emission from the expression ofluciferases in living cells and organisms: a review, Luminiscence 17:43–74.
Grens A, Scheffler IE (1990), The 59- and 39-untranslated regions of ornithinedecarboxylase mRNA affect the translational efficiency, J. Biol. Chem.265:11810–11816.
Gurtu V, Yan G, Zhang G (1996), IRES bicistronic expression vectors for efficientcreation of stable mammalian cell lines, Biochem. Biophys. Res. Commun.229:295–298.
Hamer DH, Davoli D, Thomas CA Jr, Fareed GC (1977), Simian virus 40 carrying anEscherichia coli suppressor gene, J. Mol. Biol. 112:155–182.
Hauser H (1997), Heterologous expression of genes in mammalian cells, In: Hauser H,Wagner R (Eds), Mammalian Cell Biotechnology in Protein Production, Walterde Gruyter, Berlin, pp. 3–32.
Heiser WC (2004), Gene delivery to mammalian cells, vol. 2: Viral gene transfertechniques, In: Heiser W (Ed.), Methods in Molecular Biology, vol. 246, HumanaPress, Totowa.
Holmes-Son ML, Appa RS, Chow SA (2001), Molecular genetics and target sitespecificity of retroviral integration. Adv. Genet. 43:33–69.
Huang MT, Gorman CM (1990), The simian virus 40 small-t intron, present in manycommon expression vectors, leads to aberrant splicing, Mol. Cell. Biol. 10:1805–1810.
Inacio A, Liebhaber SA (2003), Pathways of mammalian messenger RNA degradation,In: Makrides SC (Ed.), Gene Transfer and Expression in Mammalian Cells,Elsevier Science BV, Amsterdam, pp. 495–512.
Izant JG, Weintraub H (1985), Constitutive and conditional suppression of exogenousand endogenous genes by anti-sense RNA, Science 229:345–352.
Jordan M, Schallhorn A, Wurm FM (1996), Transfecting mammalian cells: optimiza-tion of critical parameters affecting calcium phosphate precipitate formation,Nucleic Acids Res. 24:596–601.
Jordan M, Wurm FM (2003), Co-transfer of multiple plasmid/viruses as an attractivemethod to introduce several genes in mammalian cells, In: Makrides SC (Ed.),Gene Transfer and Expression in Mammalian Cells, Elsevier Science BV, Amster-dam, pp. 337–348.
Kaufman RJ (1990), Vectors used for expression in mammalian cells, Methods
Cloning and expression of heterologous proteins in animal cells 69

Enzymol. 185:487–511.Kaufman RJ (1997), DNA transfection to study translational control in mammalian
cells, Methods 11:361–370.Kaufman RJ (2000), Overview of vector design for mammalian gene expression, Mol.
Biotechnol. 16:151–160.Kaufmann H, Fussenegger M (2003), Metabolic engineering of mammalian cells for
higher protein yield, In: Makrides SC (Ed.), Gene Transfer and Expression inMammalian Cells, Elsevier Science BV, Amsterdam, pp. 457–469.
Keown WA, Campbell CR, Kucherlapati RS (1990), Methods for introducing DNAinto mammalian cells, Methods Enzymol. 185:527–537.
Kim CH, Oh Y, Lee TH (1997), Codon optimization for high-level expression ofhuman erythropoietin (EPO) in mammalian cells – human or yeast codon usageeffect on over-expression in 293T cell culture, Gene 199:293–301.
King LA, Possee RD (1992), The Baculovirus Expression System: A LaboratoryGuide, In: King LA, Possee RD (Eds), Chapman & Hall, New York.
Klehr D, Maass K, Bode J (1991), Scaffold-attached regions from the human interferonbeta domain can be used to enhance the stable expression of genes under thecontrol of various promoters, Biochemistry 30:1264–1270.
Kozak M (2005), Regulation of translation via mRNA structure in prokaryotes andeukaryotes, Gene 361:13–37.
Levinson AD (1990), Expression of heterologous genes in mammalian cells, MethodsEnzymol. 185:485–487.
Lindell J, Girard P, Muller N, Jordan M, Wurm FM (2004), Calfection: a novel genetransfer method for suspension cells, Biochim. Biophys. Acta 1676:155–161.
Luckow VA (1995), Protein production and processing from baculovirus expressionvectors, In: Shuler ML, Wood HA, Granados RR, Hammer DA (Eds), Baculo-virus Expression Systems and Biopesticides, J Wiley & Sons, New York, pp.51–90.
Lundstrom K (2003), Virus-based vectors for gene expression in mammalian cells:Semliki Forest virus, In: Makrides SC (Ed.), Gene Transfer and Expression inMammalian Cells, Elsevier Science BV, Amsterdam, pp. 207–230.
Lutfalla G, Armbruster L, Dequin S, Bertolotti R (1989), Construction of an EBNA-producing line of well-differentiated human hepatoma cells and of appropriateEpstein-Barr virus-based shuttle vectors, Gene 76:27–39.
McCaughan KK, Brown CM, Dalphin ME, Berry MJ, Tate WP (1995), Translationaltermination efficiency in mammals is influenced by the base following the stopcodon, Proc. Natl Acad. Sci. U S A 92:5431–5435.
Mackett M, Smith GL, Moss B (1982), Vaccinia virus: a selectable eukaryotic cloningand expression vector, Proc. Natl Acad. Sci. U S A 79:7415–7419.
Maitland NJ, McDougall JK (1977), Biochemical transformation of mouse cells byfragments of herpes simplex virus DNA, Cell 11:233–241.
Makrides SC (1999), Components of vectors for gene transfer and expression inmammalian cells, Protein Expr. Purif. 17:183–202.
Makrides SC (2003), Vectors for gene expression in mammalian cells, In: Makrides SC(Ed.), Gene Transfer and Expression in Mammalian Cells, Elsevier Science BV,Amsterdam, pp. 9–26.
Makrides SC, Prentice HL (2003), Why choose mammalian cells for protein produc-tion?, In: Makrides SC (Ed.), Gene Transfer and Expression in Mammalian Cells,Elsevier Science BV, Amsterdam, pp. 1–8.
Mather JP (1990), Optimizing cell and culture environment for production of recombi-nant proteins, Methods Enzymol. 185:567–577.
Matsushita T, Elliger S, Elliger C, Podsakoff G, Villarreal L, Kurtzman GJ, Iwaki Y,Colosi P (1998), Adeno-associated virus vectors can be efficiently producedwithout helper virus, Gene Ther. 5: 938–45.
70 Animal Cell Technology

Mattaj IW (1990), Splicing stories and poly(A) tales: an update on RNA processingand transport, Curr. Opin. Cell. Biol. 3:528–538.
Merrihew RV, Clay WC, Condreay JP, Witherspoon SM, Dallas WS, Kost TA (2001),Chromosomal integration of transduced recombinant baculovirus DNA in mam-malian cells, J. Virol. 75:903–909.
Miller JH (1972), Assay of �-galactosidase, In: Miller JH (Ed.), Experiments inMolecular Genetics, Cold Spring Harbor Laboratory, Cold Spring Harbor, NY,pp. 352–355.
Moss B (1996), Poxviridae: the viruses and their replication, In: Fields BN, Knipe DM,Howley PM (Eds), Fields Virology, 3rd ed., Lippincott–Raven, Philadelphia, pp.2637–2671.
Muller WJ, Mueller CR, Mes AM, Hassell JA (1983), Polyomavirus origin for DNAreplication comprises multiple genetic elements, J. Virol. 47:586–599.
Munroe D, Jacobson A (1990), Tales of poly(A): a review, Gene 91:151–158.Nettelbeck DM, Jerome V, Muller R (1999), A dual specificity promoter system
combining cell cycle-regulated and tissue-specific transcriptional control, GeneTher. 6:1276–1281.
Niwa H, Yamamura K, Miyazaki J (1991), Efficient selection for high-expressiontransfectants with a novel eukaryotic vector, Gene 108:193–199.
Novina CD, Roy AL (1996), Core promoters and transcriptional control, TrendsGenet. 12:351–355.
Papadakis ED, Nicklin SA, Baker AH, White SJ (2004), Promoters and controlelements: designing expression cassettes for gene therapy, Curr. Gene Ther. 4:89–113.
Parolın C, Palu G (2003), Virus-based vectors for gene expression in mammalian cells:Retrovirus, In: Makrides SC (Ed.), Gene Transfer and Expression in MammalianCells, Elsevier Science BV, Amsterdam, pp. 231–250.
Petitclerc D, Attal J, Theron MC, Bearzotti M, Bolifraud P, Kann G, Stinnakre MG,Pointu H, Puissant C, Houdebine LM (1995), The effect of various introns andtranscription terminators on the efficiency of expression vectors in variouscultured cell lines and in the mammary gland of transgenic mice, J. Biotechnol.40:169–178.
Potter H, Weir L, Leder P (1984), Enhancer-dependent expression of human kappaimmunoglobulin genes introduced into mouse pre-B lymphocytes by electropora-tion, Proc. Natl Acad. Sci. U S A 81:7161–7165.
Rossi FM, Blakely BT, Blau HM (2000), Interaction blues: protein interactionsmonitored in live mammalian cells by beta-galactosidase complementation,Trends Cell. Biol. 10:119–122.
Sambrook J, Fritsch EF, Maniatis T (2000), Molecular Cloning: A Laboratory Manual,3rd ed., Cold Spring Harbor Laboratory Press, Nova York, 3 vols.
Sanders PG (1990), Protein production by genetically engineered mammalian cell lines,In: Spier RE, Griffiths JB (Eds), Animal Cell Biotechnology, vol. 4, AcademicPress, London, pp. 15–70.
Sanders PG, Wilson RH (1984), Amplification and cloning of the Chinese hamsterglutamine synthetase gene, EMBO J. 3:65–71.
Sandig V, Lieber A, Strauss M (1997), Vectors for gene transfer and expression inanimals cells, In: Hauser H, Wagner R (Eds), Mammalian Cell Biotechnology inProtein Production, Walter de Gruyter, Berlin, pp. 65–85.
Serebriiskii IG, Golemis EA (2000), Uses of lacZ to study gene function: evaluation ofbeta-galactosidase assays employed in the yeast two-hybrid system, Anal. Bio-chem. 285:1–15.
Shimotohno K, Temin HM (1981), Formation of infectious progeny virus afterinsertion of herpes simplex thymidine kinase gene into DNA of an avian retro-virus, Cell 26:67–77.
Cloning and expression of heterologous proteins in animal cells 71

Simonsen CC, Levinson AD (1983), Isolation and expression of an altered dihydrofo-late reductase cDNA, Proc. Natl Acad. Sci. U S A 80:2495–2499.
Spencer SC (1991), Electroporation technique of DNA transfection, In: Murray EJ(Ed.), Methods in Molecular Biology, vol. 7, Humana Press, Clifton, pp. 45–52.
Strauss JH, Strauss EG (1994), The alphaviruses: gene expression, replication, andevolution, Microbiol. Rev. 58:491–562.
Sugden B, Marsh K, Yates J (1985), A vector that replicates as a plasmid and can beefficiently selected in B-lymphoblasts transformed by Epstein-Barr virus, Mol.Cell. Biol. 5:410–413.
Szutorisz H, Dillon N, Tora L (2005), The role of enhancers as centres for generaltranscription factor recruitment, Trends Biochem. Sci. 30:593–599.
Teshigawara K, Katsura Y (1992), A simple and efficient mammalian gene expressionsystem using an EBV-based vector transfected by electroporation in G2/M phase,Nucleic Acids Res. 20:2607–2611.
Toneguzzo F, Keating A (1986), Stable expression of selectable genes introduced intohuman hematopoietic stem cells by electric field-mediated DNA transfer, Proc.Natl Acad. Sci. U S A 83:3496–3499.
Torres RM, Kuhn R (1997), Laboratory protocols for conditional gene targeting, In:Torres RM, Kuhn R (Eds), Oxford University Press, Oxford, pp. 1–167.
Urlaub G, Chasin LA (1980), Isolation of Chinese hamster cell mutants deficient indihydrofolate reductase activity, Proc. Natl Acad. Sci. U S A 77:4216–4220.
Ward GA, Stover CK, Moss B, Fuerst TR (1995), Stringent chemical and thermalregulation of recombinant gene expression by vaccinia virus vectors in mammaliancells, Proc. Natl Acad. Sci. U S A 92:6773–6777.
Welsh S, Kay SA (1997), Reporter gene expression for monitoring gene transfer, Curr.Opin. Biotechnol. 8:617–622.
West AG, Gaszner M, Felsenfeld G (2002), Insulators: many functions, many mechan-isms, Genes Dev. 16:271–288.
Wigler M, Silverstein S, Lee LS, Pellicer A, Cheng VC, Axel R (1977), Transferof purified herpes virus thymidine kinase gene to cultured mouse cells, Cell 11:223–232.
Wirth M, Hauser H (1993), Genetic engineering of animal cells, In: Rehm HJ, Reed G,Puhler A, Stadler P (Eds), Biotechnology, vol. 2, Editora VCH, Weinheim, pp.663–744.
Wirth M, Bode J, Zettlmeissl G, Hauser H (1988), Isolation of overproducingrecombinant mammalian cells by a fast and simple selection procedure, Gene73:419–426.
Wong TK, Neumann E (1982), Electric field mediated gene transfer, Biochem.Biophys. Res. Commun. 107:584–587.
Wurm FM (2004), Production of recombinant protein therapeutics in cultivatedmammalian cells, Nat. Biotechnol. 22:1393–1398.
Wurm FM, Bernard A (1999), Large-scale transient expression in mammalian cells forrecombinant protein production, Curr. Opin. Biotech. 10:156–159.
Wurm FM, Bernard A (2001), Transient gene expression from mammalian cells: a newchapter in animal cell technology, Cytotechnology 35:155–156.
Xiao X (2003), Virus-based vectors for gene expression in mammalian cells: adeno-associated virus, In: Makrides SC (Ed.), Gene Transfer and Expression in Mam-malian Cells, Elsevier Science BV, Amsterdam, pp. 93–108.
Yaniv M (1982), Enhancing elements for activation of eukaryotic promoters, Nature297:17–18.
Yang F, Moss LG, Phillips GN Jr (1996), The molecular structure of green fluorescentprotein, Nat. Biotechnol. 14:1246–1251.
Zahn-Zabal M, Kobr M, Girod PA, Imhof M, Chatellard P, de Jesus M, Wurm FM,Mermod N (2001), Development of stable cell lines for production or regulated
72 Animal Cell Technology

expression using matrix attachment regions, J. Biotechnol. 87:29–42.Zhu ZY, Veldman GM, Cowie A, Carr A, Schaffhausen B, Kamen R (1984), Construc-
tion and functional characterization of polyomavirus genomes that separatelyencode the three early proteins, J. Virol. 51:170–180.
Cloning and expression of heterologous proteins in animal cells 73


4Cell metabolism and itscontrol in culturePaola Amable and Michael Butler
4.1 Introduction
Metabolism, the sum of all chemical transformations taking place in a cell,is a highly coordinated network of activities in which many multi-enzymesystems and pathways are involved. The purposes of this network can besummarized as follows:
(i) to obtain chemical energy by capturing solar energy or degradingenergy-rich nutrients from the environment;
(ii) to convert nutrient precursor molecules into the characteristic macro-molecules of the cell;
(iii) to polymerize monomers into macromolecules (proteins, nucleicacids, and polysaccharides);
(iv) to synthesize and degrade biomolecules required for specializedcellular functions, such as membrane lipids, intracellular messengers,and pigments.
The network operates through a series of enzyme-catalyzed reactionsthat constitute the metabolism. Each of the consecutive steps in a metabolicpathway brings about a specific chemical change, usually the removal,transfer, or addition of a particular atom or functional group. The pre-cursor is converted into a product through a series of metabolic intermedi-ates called metabolites. The term intermediary metabolism is often appliedto the combined activities of all the metabolic pathways that interconvertprecursors, metabolites, and products of low molecular weight.
Some metabolic pathways are linear, some are cyclic, and some arebranched, yielding multiple end products from a single precursor orconverting several precursors into a single product.
Metabolic pathways are regulated at several levels within a cell. Themost immediate regulation is by the availability of substrate. A secondtype of rapid control is allosteric regulation by a metabolic intermediate orcoenzyme (an amino acid or ATP, for example) that signals the cell’sinternal metabolic state. In multicellular organisms the metabolic activitiesof different tissues are also regulated and integrated by growth factors andhormones that act from outside the cell (Nelson and Cox, 2004).
Cells, removed from animal tissues or whole animals, will continue togrow if supplied with nutrients and growth factors, allowing single cells toact as independent units that are able to divide by mitosis. Cell lines can

live in vitro for a finite time (finite cell lines) or indefinitely (permanentcell lines). Permanent cell lines may continue growth in a culture vesseluntil limited by some parameter associated with the mode of culture. Thelimitation for growth in a culture may arise from nutrient depletion,accumulation of metabolic byproducts or lack of surface for anchorage-dependent cells.
Multiple culture passages can be established by transfer of cells from ahigh density growth-limited culture into fresh medium. In this way,growth of cells can be maintained for prolonged periods in culture.Normal animal cells have an intrinsic finite growth capacity but some cellsacquire a capacity for infinite growth and such a population can be calledan established or continuous cell line. This requires the cell to go througha process called transformation, which causes the cells to lose theirsensitivity to the stimuli associated with growth control. Transformedcells may lose their anchorage dependence and often show some chromo-some fragmentation. This genetic state is referred to as aneuploidy, whichmeans that there is slight alteration from the normal diploid state. Thetransformed cells have a high capacity for growth in relatively simplegrowth media and without the need for growth factors (Butler, 2004).
4.2 Energy sources
In contrast to plant cells, which normally get their cellular energy fromphotosynthesis, animal cells need a carbohydrate source, usually glucose,and the amino acid glutamine. The catabolism of these substrates allowsthe production of two coenzymes (ATP and NADH – nicotinamideadenine dinucleotide), which are essential for maintaining the viability ofthe cells. These coenzymes can be used for the maintenance, metabolismand/or for the synthesis of particular desired products (Wagner, 1997).
The nature and concentration of carbon and nitrogen substrates in theculture medium affect both the energy status and metabolism of the cells.Medium generally contains both a carbohydrate (normally glucose) and arange of amino acids to satisfy the cellular growth requirements (Butler,2004). Lipids are also important, not only as an energy source, but also asprecursors for the synthesis of the cellular membrane components.
As a consequence of transformation, cells in culture assume a modifiedmetabolism when compared with the same cell in the organism of origin.For example, the consumption rates of glucose and glutamine are veryhigh initially but decline throughout a normal batch culture, as does thespecific growth rate. These high uptake rates exceed the cellular need forboth precursors and energy, and result in increased fluxes in glycolysis andglutaminolysis, which in turn leads to overflow metabolism and formationof byproducts such as lactate, ammonium, and alanine (Doverskog et al.,1997).
4.2.1 Glucose
Glucose is a monosaccharide sugar that functions as an important fuel forenergy metabolism in all mammalian cells. It is also a remarkably versatile
76 Animal Cell Technology

precursor, capable of supplying a huge array of metabolic intermediatesfor biosynthetic reactions. In animals and vascular plants, glucose may bestored (as a polysaccharide such as glycogen or starch), oxidized to athree-carbon compound (pyruvate) via glycolysis to provide ATP andmetabolic intermediates, or oxidized via the pentose phosphate cycle(PPC) to yield ribose 5-phosphate for nucleic acid synthesis and reducednicotinamide adenine dinucleotide phosphate (NADPH) generation forreductive biosynthetic processes.
The cytoplasmic membrane of mammalian cells is impermeable toglucose, and therefore the uptake is by means of transport proteins locatedin the plasma membrane. In the majority of mammalian cells the glucosetransport mechanism is facilitated diffusion. This is saturable, bidirec-tional, and driven by the concentration gradient across the cell membrane.Once glucose enters the cell cytoplasm, it is rapidly phosphorylated byhexokinase to glucose-6-phosphate. This enzymatic reaction leaves lowamounts of free glucose in the cytoplasm, stimulating the transport ofmore glucose in the uptake direction. Six different isoforms of glucosetransporters have been isolated in different tissues and designated GLUT1,GLUT2, GLUT3, GLUT4, GLUT5, and GLUT7 (Craik and Elliot, 1979;Kayano et al., 1988; Carruthers, 1990; Gould et al., 1991; Burant et al.,1992; Kahn, 1992; Pessin and Bell, 1992; Waddell et al., 1992).
In the cytosol, glucose-6-phosphate is converted by two main pathways:glycolysis and the PPC.
Glycolysis occurs completely in the cytosol and does not require O2. Itproduces a small amount of ATP, NADH, and the three-carbon com-pound pyruvate. The sequence of reactions is shown in Figure 4.1
Four molecules of ATP are formed per glucose molecule duringglycolysis, catalyzed by phosphoglycerate kinase and pyruvate kinase.However, early in the glycolytic pathway, two ATP molecules areconsumed: one by the addition of a phosphate residue to glucose in thereaction catalyzed by hexokinase and another by the addition of a secondphosphate to fructose 6-phosphate in the reaction catalyzed by phospho-fructokinase-1. Thus glycolysis yields a net of only two ATP moleculesper glucose molecule.
The overall chemical equation for this first stage of glucose metabolismis:
C6H12O6 þ 2NADþ þ 2ADP3- þ 2P2- ! 2C3H4O3 þ 2NADHþ 2ATP4-
The PPC allows the generation of NADPH reduction equivalentsrequired for cell anabolism, and ribose 5-phosphate molecules for thesynthesis of nucleic acids. Alternatively, ribose 5-phosphate can also begenerated or transformed into fructose 6-phosphate or glyceraldehyde3-phosphate, providing metabolic flexibility to the cell, in order to balancethe fluxes through these pathways. The flux through the PPC is related tothe nucleic acid requirements for DNA duplication or RNA transcription,and could probably be controlled by the cell cycle (Wagner, 1997).
In the presence of oxygen, however, pyruvate formed in glycolysis istransported into mitochondria, where it is oxidized by O2 to CO2 andH2O in a series of oxidation reactions, collectively called the tricarboxylic
Cell metabolism and its control in culture 77

acid (TCA) cycle, citric acid cycle, or Kreb’s cycle (Figure 4.2). Thesereactions generate 8 NADH, 2 GTP (guanosine 59-triphosphate; inter-changeable with ATP), and 2 FADH2 (1,5-dihydro-flavin adenine di-nucleotide). When NADH and FADH2 are further metabolized through
Glucose
Glucose 6-phosphate
Fructose 6-phosphate
HEXOKINASE
Fructose 1,6-biphosphate
ATP
ADP
PHOSPHOGLUCOSE
ISOMERASE
PHOSPHOFRUCTOKINASE 1
TRIOSEPHOSPHATEISOMERASE GLYCERALDEHYDE
3-PHOSPHATE
DEHYDROGENASE
ATP
ADP
Glyceraldehyde 3-phosphate
(2 molecules)
ALDOLASE
1,3-Bisphosphoglycerate
(2 molecules)2 ADP
2 ATPPHOSPHOGLYCERATE
KINASE
3-Phosphoglycerate
(2 molecules)
PHOSPHOGLYCEROMUTASE
2-Phosphoglycerate
(2 molecules)ENOLASE
Phosphoenolpyruvate
(2 molecules)2 ADP
2 ATPPYRUVATE KINASE
LACTATE DEHYDROGENASEPyruvate
(2 molecules)
ALDOLASE
2 NAD 2 P� �
2 NAD�
2 NADH 2 H� �
2 NADH
2 H� �
H O2
Lactate
(2 molecules)
Figure 4.1
The glycolytic pathway by which glucose is degraded to pyruvate.
78 Animal Cell Technology

the oxidative phosphorylation and GTP is converted into ATP, the TCAcycle renders a final amount of 25 ATP molecules per glucose molecule,far outstripping the ATP yield from glycolysis. ATP is the most importantmolecule for capturing and transferring free energy in biological systems.
Lactate
Alanine
Serine
Cysteine
Pyruvate
NAD�
NADH H� �
Acetyl CoA
Fatty acids
Leucine
Isoleucine
LACTATE
DEHYDROGENASE
PYRUVATE
DEHYDROGENASE
CO2
FADH2
FAD
NAD�
NADHCoA
Citrate
ACONITASE
Aconitate
Isocitrate
ISOCITRATE
DEHYDROGENASEGLUTAMATE
DEHYDROGENASE
ACONITASEH2O
CO2
NADP�
NADPH
Glutamate
Histidine
Proline
ArginineNADH
NAD�
H
NH
�
�4
α-KETOGLUTARATE
DEHYDROGENASE
CO2
FADH2
FAD
Succinyl-CoA
Oxaloacetate
H O2
FUMARASE
Malate
MALATE
DEHYDROGENASE NAD H� �
NADH
H O2
Fumarate
SUCCINATE
DEHYDROGENASEFADH2
FAD CoQH2
CoQ
Succinate
CoA
SUCCINYL
CoA LIGASE
GTPGDP
P�
Acetoacetyl-CoA
Acetoacetate3-OXOACID
CoA
TRANSFERASE NAD
H� �
NADH
CITRATE
SYNTHETASEAspartate
Tyrosine
Phenylalanine
ACETYL CoA
TRANSFERASE
CoA
�-HYDROXYBUTARATE
DEHYDROGENASE
2�
α-ketoglutarate
�-hydroxylbutyrate
Figure 4.2
The tricarboxylic acid (TCA) cycle, in which acetyl groups transferred from acetyl CoA are oxidized tocarbon dioxide.
Cell metabolism and its control in culture 79

The released energy of almost all the metabolic pathways is converted tothe chemical energy of phosphoanhydride bonds in ATP. Cells use theenergy released during hydrolysis of the ATP bonds to power energeti-cally unfavorable processes.
The TCA cycle takes place inside the mitochondria. It is not only themetabolic pathway that accounts for the complete combustion of theproduct of glycolysis, but also the pathway that accounts for the completecombustion of carbohydrates, fatty acids, and amino acids. The main func-tions of the cycle are to provide different compounds that are precursors forthe cell anabolism and to generate most of the metabolic energy.
The connection between TCA and glycolysis is made through pyruvate.The pyruvate produced in glycolysis is transported from the cytosol acrossthe mitochondrial membranes to the inner mitochondrial matrix. There, itreacts with coenzyme A (CoA), forming CO2 and the intermediate acetyl-CoA. This reaction, catalyzed by pyruvate dehydrogenase, is highlyexergonic and essentially irreversible.
Although the TCA cycle directly generates only one ATP per turn, thereare four oxidation steps in the cycle that provide NADH and FADH2.These compounds generate a large flow of electrons into the respiratorychain and thus lead to formation of a large number of ATPmolecules duringoxidative phosphorylation. In this pathway, passage of two electrons fromNADH or FADH2 to O2 drives the formation of ATP. The number ofATP molecules that may be formed through oxidative phosphorylationmay vary depending on the cell line. It is considered that the metabolism ofa NADH molecule generates 2.5 ATP molecules, and a FADH2 moleculegenerates 1.5 ATP molecules (Elliott and Elliott, 2001). These values areknown as P/O ratios and represent the relationship between ATP synthesisand oxygen consumption. Then, the overall yield of ATP from the completeoxidation of glucose is 32 ATP molecules per glucose molecule when bothpyruvate molecules are completely oxidized.
Unlike mammalian cells in vivo, established mammalian cell lines arehighly deregulated. They show a high glycolytic flux (Donelly andScheffler, 1976) and are unable to completely oxidize glucose, generatinghigh amounts of lactate (a maximum of 2 moles of lactate per mole ofglucose) as an end product, even under fully aerobic conditions. Further-more, in the presence of non-limiting glucose concentrations they con-sume glucose at a much higher rate than would be strictly required tomaintain cell growth. This indicates that a low percentage of pyruvate isincorporated into the TCA cycle for a complete oxidation, a pathwaymuch more efficient regarding the energetic yield (32 ATP instead of2 ATP when lactate is the end product).
There are several hypotheses related to lactate generation in mammaliancells in culture (Haggstrom, 2000):
(i) the cells convert pyruvate to lactate as a way to re-equilibrate theirredox potential and as a means of NADH regeneration in the cytosol;
(ii) lactate dehydrogenase competes with pyruvate dehydrogenase forconversion of pyruvate to lactate in the cytosol;
(iii) too low concentrations of aspartate in the cytosol may limit themalate–aspartate shuttle activity;
80 Animal Cell Technology

(iv) respiration may be suppressed by low availability of ADP (adenosinediphosphate), which would be consumed due to rapid flux of theglycolysis pathway;
(v) malate may accumulate inside the mitochondria due to glutaminemetabolism, which would make more difficult the influx of malateinto the mitochondria, as required by the malate–aspartate shuttle;
(vi) the respiratory system may be saturated by NADH generated by themetabolism of glutamine inside the mitochondria;
(vii) there may be a deficiency in a key enzymatic activity linking theglycolysis pathway with the TCA cycle, such as pyruvate dehydro-genase complex, phosphoenolpyruvate carboxykinase, or pyruvatecarboxylase. In this situation, the metabolism of pyruvate through thelactate dehydrogenase enzyme would be favored (Fitzpatrick et al.,1993; Petch and Butler 1994; Neerman and Wagner, 1996).
From all the hypotheses mentioned above, the low flux of pyruvate intothe TCA cycle is better explained by a decreased activity of severalenzymes: pyruvate carboxylase, pyruvate phosphoenol carboxykinase,pyruvate dehydrogenase, and malic enzyme II (Figure 4.3). Then, thepyruvate accumulated is converted to lactate by the enhanced catalyticaction of the lactate dehydrogenase, as an alternative pathway to generateenergy for cellular processes.
There are many studies supporting this hypothesis. Gstraunthaler et al.(1999) have demonstrated that when renal proximal tubular cells arebrought into culture, they revert from oxidative metabolism and gluco-neogenesis to high rates of glycolysis. They investigated the metabolism ofcontinuous renal cell lines LLC-PK(1) (porcine kidney) and OK (opossumkidney) and found that glucose was quantitatively converted to lactate,which accumulated in a 2:1 molar ratio (lactate:glucose). In LLC-PK(1)cells, increased glucose supply caused increases in hexokinase, phospho-fructokinase, pyruvate kinase, and lactate dehydrogenase activities. Thishigher lactate dehydrogenase activity is responsible for the increasedlactate generation and the reduced TCA cycle activity. Neerman andWagner (1996) compared glucose metabolism in a mammalian (BHK) andan insect (Sf9) cell line. They found no activity of the key enzymesconnecting glycolysis with the TCA cycle, such as pyruvate dehydrogen-ase, pyruvate carboxylase, and phosphoenolpyruvate carboxykinase, indi-cating that glucose is mainly metabolized via glycolysis and lactateformation.
Glutamine is normally another important energy source in cultured celllines. However, in the absence of glutamine, the cells may change theirmetabolism, to increase the energy yield from glucose. Chen and Harcum(2005) demonstrated that, when Chinook salmon embryo (CHSE) cellswere cultured in a glutamine-free culture, hexokinase activity remainedconstant and lactate dehydrogenase activity decreased. In this way, thelack of glutamine reduced lactate production to make the energy metabo-lism more efficient.
Acetyl-CoA enters the TCA cycle by reacting with oxaloacetate to formcitrate. At this point, there is an important flux of citrate leaving the TCAcycle and being exported to the cytosol, where it contributes to lipid
Cell metabolism and its control in culture 81

formation. The combination of a low incorporation of acetyl-CoA intothe cycle and the outflow of citrate depletes the metabolites of the TCAcycle, which need to be replenished to satisfy requirements for energygeneration, since the ATP production by glycolysis is low. Replenishmentmay occur at the level of Æ-ketoglutarate. The primary role of glutamine isto supply this intermediate to keep the operation of the cycle. In this way,glutamine is a major source of carbon and energy. Other amino acids andlipids also participate in the supply of intermediates to the TCA cyclethrough anaplerotic reactions (Figure 4.2).
In most media formulations for mammalian cell lines, glucose is in-cluded at an initial concentration of 10–25 mM, which decreases to aroundhalf the concentration level within the period of a batch culture. Theproduction of lactic acid may lower the pH of the culture and this maydecrease the cellular growth rate. However, if the culture is appropriatelybuffered then the accumulated lactate levels typically found in a batchculture should not cause any growth inhibition (Hassell et al., 1991).
As glucose is metabolized at a far greater rate than it is needed tomaintain viability, it is better to supplement it during the culture than to
Phosphoenolpyruvate
PYRUVATE
KINASEPyruvateLactate
LACTATE DEHYDROGENASE
ALANINE AMINO
TRANSFERASE
Alanine
Oxalacetate
MalateCitrate
PYRUVATE
CARBOXYLASE
MALIC
ENZYME II
PYRUVATEDEHYDROGENASE
PHOSPHOENOL-
PYRUVATE
CARBOXYKINASE
GLUTAMATE
HYDROGENASE
GLUTAMINASE
TCA
CYTOSOL
MITOCHONDRIA
Acetyl CoA
α-ketoglutarate
Glutamate
Glutamane
Figure 4.3
Enzymes that link glycolysis and the tricarboxylic acid (TCA) cycle. Dashed arrows indicate reducedor suppressed enzymatic activity.
82 Animal Cell Technology

increase the initial concentration. This will limit the accumulation oflactate in the culture. Nevertheless, the cell concentration and the proteinproductivity may be affected by glucose concentration. Meijer and vanDijken (1995) have reported the effects of the glucose supply on growthand metabolism of an SP2/0 derived recombinant myeloma cell line in achemostat culture with Iscove’s Modified Dulbecco’s Medium (IMDM)medium. Lowering glucose concentration of the feed medium from 25.0 to1.4 mM resulted in a decrease of steady-state viable cell concentration,whereas viability remained above 90%. Sun and Zhang (2001a) havereported the effects of the glucose concentration on batch cultures ofrecombinant CHO (Chinese hamster ovary) cells. They demonstrated thatthe accumulated concentration of erythropoietin (EPO) increased with theincrease of glucose concentration from 8.9 to 17.9 mM, and decreased withits further increase from 17.9 to 49.6 mM. They concluded that there is anoptimal glucose concentration for the enhancement of EPO expression bythese recombinant CHO cells. They also demonstrated that the yieldcoefficient of lactate from glucose increased with the initial glucoseconcentrations from 8.9 up to 17.9 mM, and then kept constant above17.9 mM.
An alternative is to substitute glucose by other hexoses, like galactose orfructose, or by disaccharides, like maltose. Galactose is converted intogalactose-6-phosphate, a reaction catalyzed by hexokinase, and then it istransformed into glucose-6-phosphate, an intermediate of glycolysis.Fructose can also be phosphorylated to fructose-6-phosphate by hexoki-nase. Fructose can also enter the glycolysis pathway at the level ofglyceraldehyde-3-phosphate, via the fructose-1-phosphate pathway. Asmaltose is a disaccharide of glucose, it is slowly hydrolyzed into glucosemolecules and then transported into the cell and metabolized. The meta-bolism of alternative carbohydrate sources provides different amounts ofenergy. The flux through glycolysis may be slower due to a low affinity ofthe hexokinase enzyme for galactose and fructose or due to the slowhydrolysis of maltose. Thus, substitution of glucose with fructose, galac-tose, or maltose may decrease the rate of production of lactic acid (Butlerand Christie, 2004).
The reduced glycolytic rate and formation of lactic acid may result in aslower growth rate (Griffiths, 2000). Duval et al. (1992) cultured a mousehybridoma cell line (VO 208) in batch/fed-batch cultures in a mediumsupplemented with fructose instead of glucose and demonstrated an in-crease of the lifespan of the culture and an enhancement in the antibodysecretion. However, it has been reported that complete glucose substitutionby other hexoses can alter product glycosylation (Paredes et al., 1999).
Another strategy to improve the efficiency of central carbon metabolismand to reduce lactate accumulation is metabolic engineering. Increasingthe flux of glucose into the TCA cycle can improve the efficiency ofglucose for energy metabolism by enhanced formation of ATP. Weide-mann et al. (1994) have reported that the introduction of a cytosolicpyruvate carboxylase derived from Saccharomyces cerevisiae into BHK-21cells enabled cells to transfer glycolysis-derived pyruvate into malate,which then entered the TCA cycle for complete oxidation. As a result,higher yields of recombinant EPO were achieved by the BHK cells.
Cell metabolism and its control in culture 83

4.2.2 Glutamine
Glutamine is the major source of energy, carbon, and nitrogen formammalian cells. It plays two important functions: it acts as an energydonor and plays a critical role in nitrogen metabolism, acting as a collec-tion point for amino groups. For example, in the cytosol of hepatocytes,amino groups from most amino acids are transferred to Æ-ketoglutarate toform glutamate, which enters the mitochondria and gives up its aminogroup to form ammonium. Excess ammonium generated in most tissuesother than the liver is converted to the amide nitrogen of glutamine.Glutamine and glutamate, or both, are present in higher concentrationsthan other amino acids in most tissues or biological fluids.
Glutamine is transported into the cytosol of the cell by means of twokinds of transporters: Naþ-dependent and Naþ-independent. Once in thecytosol, glutamine must be transported into the mitochondria, where it ismetabolized.
The metabolic pathway of glutamine, called glutaminolysis, begins withan enzymatic reaction catalyzed by glutaminase, which converts glutamineinto glutamate with ammonium removal. Then, glutamate is convertedinto Æ-ketoglutarate by the action of the glutamate dehydrogenase, liberat-ing another ammonium ion (Figure 4.4). This Æ-ketoglutarate entersdirectly to the TCA cycle (Figure 4.2).
In culture media for mammalian cells, together with the carbohydratesource, glutamine is the most abundant source of reduced carbon. Similarto glucose, glutamine is also consumed by mammalian cells at a high rate,particularly if the glutamine concentration is higher than the minimalneeds for maintaining cell viability. This leads to the unwanted accumula-tion of ammonium ions, a toxic byproduct, in addition to an inefficientuse of glutamine.
Glutamine is normally included at a concentration of 1–5 mM, which isa significantly higher concentration than that of any other amino acids.Glutamine is an important precursor for the synthesis of purines, pyrimi-dines, amino sugars, and asparagine. However, glutamine also has animportant role as substrate for the TCA cycle (Butler, 2004).
For some mammalian cells, glutamine is the main source of energy. Itwas observed in an antibody-secreting murine hybridoma (CC9C10)culture that, after 2 days of exponential growth in batch culture in amedium containing 20 mM glucose and 2 mM glutamine, the glutaminecontent of the medium was completely depleted, whereas the glucosecontent was reduced to only 60% of the original concentration. Petch andButler (1994) demonstrated that glucose is normally metabolized via
GlutamateGlutamineGLUTAMINASE
NADP� NH4�
GLUTAMATEDEHYDROGENASE
NADPH
H� �
H O2 NH4�
α-ketoglutarate
Figure 4.4
Initiation of the glutamine metabolism pathway.
84 Animal Cell Technology

glycolysis (. 96%), the PPC (3.6%), and the TCA cycle (0.6%). Gluta-mine, on the other hand, is partially oxidized via glutaminolysis to alanine(55%), aspartate (3%), glutamate (4%), lactate (9%), and CO2 (22%)(Petch and Butler, 1994). Fitzpatrick et al. (1993) demonstrated that, in amurine B-lymphocyte hybridoma (PQXB1/2) batch culture, glutaminewas completely depleted, but glucose was partially depleted to only 50%of its original concentration when the cells reached a stationary phasefollowing exponential growth. This suggests that glutamine is the majorcontributor of cellular energy. Vriezen et al. (1997) cultured two differentcell lines (MN12, a mouse–mouse hybridoma, and SP2/0-Ag14, a mousemyeloma) in steady-state chemostat cultures fed with IMDM mediumwith 5% serum and glutamine concentrations ranging from 0.5 to 4 mM.The culture profiles showed that glutamine was the growth-limitingsubstrate in this concentration range. Furthermore, they showed thatexcess glutamine gives rise to high consumption rates: in glutamine-limitedcultures, the specific rates of ammonia and alanine production were lowcompared with glutamine-rich cultures containing 4 mM glutamine in thefeed medium.
The preferential utilization of glutamine as an energy source is cell-dependent. Maranga and Goochee (2006) have demonstrated thatPER.C6TM cells fall into a minor category of mammalian cell lines forwhich glutamine plays a minor role in energy metabolism.
Although glutamine is used as a major substrate for the growth ofmammalian cells in culture, it suffers from some disadvantages. The meta-bolic deamination of glutamine leads to ammonia, which accumulates inthe culture up to 2–4 mM and can be inhibitory to cell growth. Theproblem of ammonia accumulation is made worse by the fact thatglutamine may decompose spontaneously to produce ammonia in theculture medium at a rate of 0.1 mM per day at 378C. The extent of growthinhibition by ammonia is greater at higher pH levels and is cell line-dependent.
The accumulation of ammonia from glutamine can be decreased by acontinuous feed of a low concentration of glutamine into the culture.Ljunggren and Haggstrom (1992) cultured the murine myeloma cell lineSp2/0-Ag 14 in an ordinary batch culture and in a glutamine-limited fed-batch culture. In batch culture, the overflow metabolism of glutamine ledto excess production of ammonium and the amino acids alanine, proline,ornithine, asparagine, glutamate, serine, and glycine. In the fed-batchculture, glutamine limitation halved the cellular ammonium productionand reduced the ratio of ammonium/glutamine. The excess production ofalanine, proline, and ornithine was reduced by a factor of 2–6, whileasparagine was not produced at all. They demonstrated that essentialamino acids were used more efficiently in the fed-batch culture as judgedby the increase in the cellular yield coefficients in the range of 1.3–2.6times for 7 of the 11 amino acids consumed. Altogether, this leads to amore efficient use of the energy sources glucose and glutamine, as revealedby an increase in the cellular yield coefficient for glucose by 70% and forglutamine by 61%, as well as a reduction in the generation of ammonium.
Maranga and Goochee (2006) have reported that, when PER.C6TM cellswere cultured in suspension in a 2-liter serum-free bioreactor at a con-
Cell metabolism and its control in culture 85

trolled glutamine concentration of 0.25 mM, the consumption rate ofglutamine and the production rate of ammonium were reduced byapproximately 30%, with respect to the same culture with a higherglutamine concentration. Furthermore, the consumption rate of alanineand the consumption rate of non-essential amino acids were reduced by85% and 50%, respectively. The fed-batch control of glutamine alsoreduced the overall accumulation of ammonium ion by approximately50% by minimizing the spontaneous thermal degradation of glutamine.
In order to reduce the ammonium production, substitution of glutamineby an alternative substrate such as glutamate may be possible. However, ifglutamate is used, a period of adaptation is required during which theactivity of glutamine synthetase and the rate of transport of glutamateboth increase, since glutamate has a low efficiency transport system. Thecell yield increases when ammonia accumulation is decreased followingculture supplementation with glutamate rather than glutamine. However,some cell lines fail to adapt to growth in glutamate (McDermott andButler, 1993). The cell line HL-60 was adapted to growth in glutamine-deficient medium by stepwise glutamine deprivation. The successfuladaptation of different cell lines to non-ammoniagenic medium has beendescribed by Hassell and Butler (1990). They replaced glutamine by eitherglutamate or Æ-ketoglutarate. A mole to mole substitution of glutamine byglutamate was successful for a McCoy cell line and led to normal growthrates after approximately 10 days. Cell yield was increased by 17%,ammonia accumulation was reduced by 70%, and glucose consumptionand lactate production both decreased by more than 70%. A BHK and aVero cell line had to be slowly adapted from an initially high glutamateconcentration. The MDCK cell line could not be adapted to growth onglutamate. The authors proposed that the glutamate uptake, and not theglutamine synthetase activity, is responsible for the ability of a given cellline to grow in a glutamine-free medium (McDermott and Butler, 1993).
An alternative to cell adaptation is metabolic engineering. Cells trans-formed with the glutamine synthetase gene can grow in media supplemen-ted with glutamate instead of glutamine, with a direct elimination/reduction of ammonia generation, either by glutamine decomposition ormetabolism (Paredes et al., 1999). Bell et al. (1992, 1995) successfullyobtained a murine hybridoma cell line that could grow in the completeabsence of glutamine by transformation with the glutamine synthetasegene. Ammonia concentrations in the medium of batch cultures of thesecells were below detection levels. This cell line could not be adapted toglutamine-free growth even in the presence of elevated levels of glutamate,so metabolic engineering was the unique alternative.
Another strategy for the reduction of ammonia accumulation can be theuse of glutamine-containing dipeptides, which hydrolyze slowly in theculture (Butler and Christie, 2004). The supplementation of a glutamine-free medium with dipeptides containing glutamine allows a reduction inthe rate of ammonium generation, but this requires the presence ofdipeptidases, which may be produced by the cells and may be released intothe medium. Christie and Butler (1994) grew a murine hybridoma(CC9C10) in media containing the dipeptides alanyl-glutamine (Ala-Gln)or glycyl-glutamine (Gly-Gln) as a substitute for glutamine. They
86 Animal Cell Technology

obtained high cell yields in the presence of 6 mM Ala-Gln or 20 mMGly-Gln, with the final cell yield in Gly-Gln 14% higher than in Gln. Thehigher concentration of Gly-Gln was necessary for cell growth because ofthe presence of a peptidase (in the cytosolic fraction of the cells) with alower affinity for Gly-Gln. Monoclonal antibody productivity was com-parable in Gln, Ala-Gln, or Gly-Gln. Substrate utilization and metabolismwas affected by the presence of the dipeptides, particularly with Gly-Gln.The specific consumption rates of glucose and six amino acids werereduced and the accumulation of ammonia and lactate was significantlylower.
The replacement of glutamine (2 mM) by pyruvate (10 mM) supportedcell growth of several adherent cell lines (MDCK, BHK-21, CHO-K1) inserum-containing and serum-free media, without adaptation for at least 19passages and with no reduction in growth rate. Even at very low levels ofpyruvate (1 mM), MDCK cells grew to confluence without glutamine oraccumulation of ammonia. Also glucose uptake was reduced, whichresulted in lower lactate production. Amino acid profiles from the cellgrowth phase for pyruvate medium showed a reduced uptake of serine,cystine, and methionine, an increased uptake of leucine and isoleucine, anda higher release of glycine compared with glutamine medium (Genzelet al., 2005).
4.2.3 Amino acids
Amino acids are a class of biomolecules that make a significant contribu-tion to the generation of metabolic energy. The fraction of metabolicenergy obtained from amino acids varies greatly with the type of cell andwith metabolic conditions.
The transport of amino acids into mammalian cells can be regulated bynutritional, hormonal, or other environmental factors or by changes with-in cells like transformation. The intracellular or extracellular concentrationof amino acids probably has the most profound influence on the efficiencyor capacity of transport into animal cells.
The TCA cycle functions as a major route for the synthesis andoxidation of most amino acids and is the primary route through whichamino acid carbon flows in the synthesis of other small molecules (Figure4.5).
Amino acids are a vital constituent of all cell culture media. They arenormally added as defined components to cell culture medium. Theimportance of amino acids in synthetic media for in vitro growth ofmammalian cells has long been recognized, as both a nitrogen donor and acarbon source. Studies on the rates of amino acid uptake have showngenerally that glutamine is the most rapidly consumed, followed by lysine,leucine, and isoleucine (Roberts et al., 1976). The nutritional requirementfor a certain metabolite, however, may also be influenced by the cellpopulation density. For example, serine, cystine, glutamine, and asparaginehave been shown to be required at low, but not at high, cell densities(Eagle and Piez, 1962). This occurs in situations when the metabolite isutilized in amounts that exceed the biosynthetic capacity of the cell. Thecritical population density occurs at the minimum effective intracellular
Cell metabolism and its control in culture 87

level, before the cells die of the specific deficiency. At high cell densities,however, the cell culture medium may require supplementation with extraamino acids, to prevent their depletion (Doyle and Griffiths, 1998). Theuptake of leucine, isoleucine, and methionine is closely related to the cell’sposition in the cell cycle and is regulated by growth factors (such asinsulin) in mammalian cells (Doverskog et al., 1997).
Higher eukaryotic cells have lost the ability to synthesize a number ofamino acids. These amino acids are generally called essential amino acids,while those that can be synthesized are called non-essential. However, thisnomenclature is very misleading for two reasons. First, some of the non-essential amino acids are in fact very essential in that they are required forsynthesis of nucleotides (glycine, aspartate, and glutamine). The reasonwhy the ability to synthesize these amino acids has been retained may wellbe that they are indispensable. Secondly, the capability to synthesize them
Pyruvate
Glycine
Serine
Alanine
Cystine
Threonine
Lysine
Acetyl CoA Acetoacetate
3-hydroxy 3-methylglutaryl-CoA-
Oxalocetate
Fumarate
Succinyl CoA
TCA
Leucine
Phenylalanine
Tyrosine
Tryptophan
Asparagine
Aspartate
Tyrosine
PhenylalanineValine
Methionine Isoleucine
Threonine
α-ketoglutarate
Proline
Histidine
Glutamate
Glutamine
Ornithine
Arginine
Figure 4.5
Points at which amino acids enter or exit the tricarboxylic acid (TCA) cycle in mammalian cells.
88 Animal Cell Technology

may be conditional depending on the nutritional situation, the prolifera-tive status, and cell line-specific properties (Doverskog et al., 1997). Theearly work of Eagle (Eagle, 1955) demonstrated a need for 12 amino acidsto support the proliferation of strain L mouse fibroblasts in mediumcontaining 0.25–2% dialyzed horse serum. Cells would die within 1–3 days in the absence of any one of the 12 amino acids. Glutamine waslater added to this list (Eagle, 1959), which also includes arginine, cystine,histidine, isoleucine, leucine, lysine, phenylalanine, methionine, threonine,tryptophan, tyrosine, and valine.
The rates at which these and other amino acids are utilized or producedcan vary dramatically between cell lines. The relative concentration ofamino acids and serum in the culture medium and other conditions of theculture environment will also influence the rates of utilization or produc-tion of specific amino acids.
Amino acids, whose carbon skeleton can be synthesized de novo inmammalian cells, include serine, glycine, alanine, aspartate, asparagine,and in principle glutamate and glutamine. The biosynthesis of amino acidsis closely linked to the central intermediary metabolism, occurring directlyfrom intermediates of glycolysis or TCA, in one or a few steps. The keyenzymes involved are transaminases (Meister, 1955). Although most cellspossess glutamate dehydrogenase, it is doubtful if there is any significantnet synthesis of glutamate through this enzyme in cultured cells. Theallosteric regulation of glutamate dehydrogenase involving up-regulationby GDP (guanosine 5’-diphosphate) and ADP, and inhibition of enzymeactivity by GTP and ATP indicates that it has a catabolic function, that is,the enzyme is activated when cells need amino acids for energy production(Mehler, 1982). Glutamine, proline and ornithine are all synthesized fromglutamate (Doverskog et al., 1997).
The amino acids that can be synthesized by a cell depend upon thestrain-specific profile of biosynthetic enzymes. For example, BHK andCHO cells are capable of glutamine synthesis (Street et al, 1993; Neer-mann and Wagner, 1996), while hybridoma and myeloma cells that do notpossess glutamine synthetase are not (Bebbington et al., 1992). Anotherexample of a strain-specific difference is the ability to synthesize glycine.Sf9 insect cells and certain CHO cell mutants are reported to be partialglycine auxotrophs (Appling, 1991; Tremblay et al., 1992; Chasin et al.,1994). The explanation involves the localization of serine hydroxymethyl-transferase. This enzyme, which converts serine to glycine and tetrahydro-folate-bound single-carbon units, is present both in the cytoplasm andmitochondria. The mitochondrial isoenzyme activity may be absent inthese partial auxotrophs, which are self-supporting in single-carbon unitsthrough the cytoplasm enzyme activity, but they need glycine from themedium for protein synthesis. In contrast to mammalian cells, insect cellsare much more flexible in their amino acid metabolism (Ferrance et al.,1993), some cell lines being capable of synthesizing many more aminoacids (Mitsuhashi, 1982), including glutamine, glutamate, and aspartatesimultaneously (Ohman et al., 1996).
The capability of synthesis of a certain amino acid may be conditional,and depends on the availability of carbon precursors and nitrogen donors.For example, a glutamine-free medium for mammalian cells may have to
Cell metabolism and its control in culture 89

be supplemented with aspartate and/or asparagine (Bebbington et al.,1992) to supply intracellular precursors for glutamine biosynthesis and asa source of aspartate and asparagine, the synthesis of which may becomelimited in a glutamine-free medium. Another example of conditionalbiosynthesis is the formation of cystine (from methionine, the cystathio-nine pathway) in Sf9 cells, which appears to be regulated in relation to theproliferative status of the cells (Doverskog et al., 1997).
It has been recognized that certain cells have a specific requirement foran amino acid, for example, serine for lymphoblastoid cells (Birch andHopkins, 1977). This may be due either to the inability of the cells to makean amino acid, or because the amino acid is decomposed in the medium.The concentration of amino acids usually limits the maximum cell concen-tration attainable, influences cell survival and growth rate, and can affectthe synthesis of certain proteins. A too low concentration of an amino acidcan result in rapid depletion from the medium, and is thus ‘‘limiting,’’whereas a too high concentration can be inhibitory.
Branched chain amino acids are consumed particularly rapidly by anumber of cell lines including MDCK cells (Butler and Thilly, 1982),human fibroblasts (Lambert and Pirt, 1975), mouse myeloma cells(Roberts et al., 1976), and BHK cells (Arathoon and Telling, 1982). Milleret al. (1989) found that serine and branched amino acids were moreextensively oxidized by hybridoma cells when the specific glutamineutilization rate was low. The sulfur-containing amino acids, methionineand cystine, are also rapidly consumed by cells in culture (Lambert andPirt, 1975; Butler and Thilly, 1982). It is suggested that a function ofglutamine uptake and glutamate formation is to allow cystine uptake byglutamate exchange into the culture medium (Bannai and Ishii, 1988).
Certain amino acids often accumulate in the culture medium duringbatch growth with surplus glucose and glutamine (Griffiths, 1971; Lanksand Li, 1988; Duval et al., 1991; Ljunggren and Haggstrom, 1992). How-ever, in glutamine-limited fed-batch cultures of myeloma cells the over-flow of asparagine, ornithine, proline, alanine, and glutamate isconsiderably less than in batch cultures. The same situation exists inhybridoma cells (Ljunggren and Haggstrom, 1995). These results can beexplained by the involvement of glutamine and glutamine-derived gluta-mate, both in the nitrogen transfer reactions and in providing carbonprecursors. The results also highlight the close coupling between theamino acid and energy metabolism (Doverskog et al., 1997).
One of the determinants of cell growth and survival in cultures of Sf9cells is the transport of amino acids across the plasma membrane. Uptakeof cystine increases as a function of the cystine concentration in themedium. However, the increased cystine uptake does not lead to anincrease in the final cell concentration or in the growth rate. On thecontrary, there appears to be a negative influence on cell physiology asmore of the energy-yielding substrates, glucose, glutamine, and glutamateare consumed at the higher cystine concentration. This is another exampleof less tight regulation of metabolism in animal cells (Doverskog et al.,1997).
Alanine, an end product of glutamine metabolism in many mammaliancells (McKeenhan, 1986), is also formed by Sf9 cells. In a normal batch
90 Animal Cell Technology

culture of Sf9 cells with excess glucose and glutamine, alanine is the onlyoverflow metabolite that accumulates to significant concentrations. Theuse of substrate-limited fed-batch cultures revealed some interestingfeatures of Sf9 metabolism. During glucose limitation alanine formationwas totally depressed, while instead ammonium formation was triggered.Glutamine limitation decreased alanine formation somewhat withoutprovoking ammonium formation, and during simultaneous glucose andglutamine limitation, very little overflow metabolism occurred. Theseresults indicate that in Sf9 cells, glucose-derived pyruvate is the carbonprecursor for alanine and that glutamine provides the nitrogen. As inhybridoma (Ljunggren and Haggstrom, 1995) and myeloma cells (Ljung-grenn and Haggstrom 1992), the energy metabolism of Sf9 insect cellsbecomes more efficient during substrate limitation (Ohman et al., 1996).
Consequently, quantitative amino acid data are important to optimizethe formulation of cell culture media. The concentration of many aminoacids can be determined and the data used to calculate the rate ofutilization or assimilation of the individual amino acids (Doyle andGriffiths, 1998).
4.2.4 Lipids
The oxidation of long-chain fatty acids to acetyl-CoA is a central energy-yielding pathway in many organisms and tissues. In mammalian heart andliver, for example, it provides as much as 80% of the energetic needs underall physiological conditions (Lodish et al., 2003).
Lipids have several important functions in animal cells, which includeserving as structural components of membranes and as a stored source ofmetabolic fuel (Griner et al., 1993). Eukaryotic cell membranes arecomposed of a complex array of proteins, phospholipids, sphingolipids,and cholesterol. The relative proportions and fatty acid composition ofthese components dictate the physical properties of membranes, such asfluidity, surface potential, microdomain structure, and permeability. Thisin turn regulates the localization and activity of membrane-associatedproteins. Assembly of membranes necessitates the coordinate synthesisand catabolism of phospholipids, sterols, and sphingolipids to create theunique properties of a given cellular membrane. This must be an extremelycomplex process that requires coordination of multiple biosynthetic anddegradative enzymes and lipid transport activities.
Saturated fatty acids or unsaturated fatty acids, such as oleic acid (18:1,n-9), can be synthesized by normal mammalian cells that posses elongationand desaturation enzymes (Rosenthal, 1987). However, the polyunsatu-rated fatty acids of the n-3 and n-6 group, such as linoleic acid (18:2, n-6)or linolenic acid (18:3, n-3), are essential nutrients for animals because theyare precursors for the synthesis of eicosanoid hormones such as prosta-glandins (Needleman et al., 1986).
The enzymes of fatty acid oxidation in mammalian cells are located inthe mitochondrial matrix. The fatty acids with chain lengths of 12 or fewercarbons enter the mitochondria without the help of membrane transpor-ters. Those with 14 or more carbons, which constitute the majority of fattyacids obtained in the diet or released from adipose tissue, cannot pass
Cell metabolism and its control in culture 91

directly through the mitochondrial membranes: they must first undergothe three enzymatic reactions of the carnitine shuttle. The first reaction iscatalyzed by a family of isozymes (different isozymes for fatty acidshaving short, intermediate, or long carbon chain) present in the outermitochondrial membrane, the acyl-CoA synthetases, which promote thegeneral reaction:
Fatty acidþCoAþATP $ fatty acyl-CoAþAMPþ PP
Thus, acyl-CoA synthetases catalyze the formation of a thioesterlinkage between the fatty acid carboxyl group and the thiol group ofcoenzyme A to yield fatty acyl-CoA, coupled to the cleavage of ATP toform AMP (adenosine monophosphate) and PP (Pyrophosphate). Fattyacyl-CoA molecules, like acetyl-CoA, are high energy compounds. Fattyacyl-CoA esters formed at the cytosolic side of the outer mitochondrialmembrane can be transported into the mitochondria and oxidized toproduce ATP, or they can be used in the cytosol to synthesize membranelipids. The second reaction of fatty acyl-CoA oxidation is a transesterifica-tion catalyzed by carnitine acyltransferase I, located in the outer mem-brane. This enzyme catalyzes the attachment of the fatty acyl-CoA to thehydroxyl group of carnitine to form fatty acyl-carnitine. The fatty acyl-carnitine ester then enters the matrix by facilitated diffusion through theacyl-carnitine/carnitine transporter in the inner mitochondrial membrane.In the third and final step of the carnitine shuttle, the fatty acyl group isenzymatically transferred from carnitine to intramitochondrial coenzymeA by carnitine acyltransferase II. This isoenzyme, located on the inner faceof the inner mitochondrial membrane, regenerates fatty acyl-CoA andreleases it, along with free carnitine, into the matrix. Carnitine re-entersthe intermembrane space via the acyl-carnitine/carnitine transporter. Thecarnitine-mediated entry process is the rate-limiting step for oxidation offatty acids in mitochondria and is a regulation point.
Mitochondrial oxidation of fatty acids takes place in three stages. In thefirst stage (�-oxidation), fatty acids undergo oxidative removal of succes-sive two-carbon units in the form of acetyl-CoA, starting from thecarboxyl end of the fatty acyl chain. The fatty acid undergoes a number ofmetabolic cycles sufficient for the total conversion to acetyl-CoA. In thesecond stage, the acetyl groups are oxidized to CO2 in the TCA cycle,which also takes place in the mitochondrial matrix. The third stage consistsof oxidative phosphorylation, where the reduced electron carriers NADHand FADH2 donate electrons to O2 with the concomitant phosphoryla-tion of ADP to ATP. The energy released by fatty acid oxidation is thusconserved as ATP.
Although the role of lipids in cell culture has been rather neglected, it isrecognized that lipids are important for cell proliferation in serum-freemedia. In this respect the importance of serum albumin has been recog-nized as a carrier of supplemented fatty acids and lipids. Fatty acids areoften included in serum-free media to replace the growth-promotingproperties of the lipid components of serum. However, the effect ofselective fatty acids on cell growth is variable: they can stimulate (Jager etal., 1988; Rose and Connolly, 1990; Grammatikos et al., 1994), inhibit
92 Animal Cell Technology

(Calder et al., 1991), or have no effect on cell growth (Bailey and Dunbar,1973; Spector et al., 1981; Cornwell and Morisaki, 1984).
The regulatory mechanism of cellular uptake of fatty acids appears to belimited and so the composition of the intracellular lipids is likely to reflectthe availability of the fatty acids in the medium. This was shown for theCC9C10 hybridoma (Butler et al., 1997) and for BHK and CHO cells(Schmid et al., 1991). Thus, cells growing in serum-supplemented culturesare likely to attain a fatty acid composition reflecting that of serum, inwhich the predominant fatty acids are palmitic, stearic, oleic, and linoleicacids at a ratio 2:1:3:1, respectively.
Over 90% of the fatty acid composition of the cells could be accountedfor by linoleic, palmitic, oleic, stearic, and arachidonic acids. Minimalquantities of other fatty acids (C8:0, C10:0, C12:0, C14:0, C18:3) were alsodetermined but were less than 10 mol % in control cells and were de-creased to less than 5 mol % after one passage of growth in either linoleicor oleic acid (Butler et al., 1997).
Linoleic acid has been shown to enhance the proliferation of mousemammary epithelial cells by metabolism to arachidonic acid, which is aprecursor of prostaglandin E2 (Bandyopadhyay et al., 1987). However, themechanism of growth promotion of the unsaturated fatty acids in culturemay be related to their importance in the synthesis of cellular membranes(Rintoul et al., 1978; Rockwell et al., 1980), which may have a significanteffect on membrane fluidity (Calder et al., 1994).
Unsaturated fatty acids (linoleic or oleic acid) have been shown to beessential for hybridomas in serum-free cultures, as they significantlyenhance the cell yield and monoclonal antibody (mAb) productivity(Butler and Huzel, 1995; Butler et al., 1997). When Butler et al. (1999)cultured the murine hybridoma CC9C10 in spinner flasks at high shearrates to determine the effects of fatty acids, they obtained up to threefoldenhanced cell yields in 25 �M linoleic acid or 50 �M oleic acid comparedwith fatty acid-free control cultures. The half-lives of viable cells were2.38 and 3.63 h, respectively, for cultures containing 25 and 50 �M linoleicacid, compared with the control culture half-life of 1.97 h (Butler et al.,1997). At a higher concentration (over 75 �M), they found that cell yieldsfall below the level of the control cultures. Hexanoic, lauric, margaric, andstearic acids had no effects on cell growth over the concentration rangethey tested. Arachidonic, linolenic, octanoic, and myristic acids caused aconcentration-dependent inhibition of cell growth. Palmitic and decanoicacids enhanced cell growth marginally (9%) but significantly at 25 �M.Linoleic acid (25 �M) enhanced growth more than oleic acid (25 �M), butan equimolar mixture of oleic and linoleic acid (25 �M) stimulated growthmore than either fatty acid alone (Butler et al., 1999). The most likelymechanism for growth enhancement in hybridoma cells is that the fattyacids are required as components of phospholipids contained in mem-branes. The effect of growth enhancement was reversible: when cells thathad been passaged continuously in the presence of fatty acids were re-introduced into unsupplemented medium, the growth advantage overcontrol cultures was lost.
The effect of linoleic or oleic acid supplementation on mAbs productionhas been studied. There was a significant initial enhancement of antibody
Cell metabolism and its control in culture 93

titers in fatty acid-supplemented cultures but this enhancement effectgradually decreased to insignificance. Subsequent transfer of the cells tofatty acid-free cultures resulted in a transitory state in which higher mAbtiters were re-established for cells previously grown in the presence of thefatty acids. The observed enhancement of mAb titer was significantlyhigher in cultures supplemented with linoleic acid or linoleic/oleic acidmix than in those supplemented with oleic acid alone (Butler et al., 1997).
Partial inhibition of glycolysis by saturated fatty acids has been ob-served in Ehrlich ascites tumor cells. Palmitate and acetate decreasedglutamate formation from glutamine (the first step in glutaminolysis) inthis cell line, suggesting the possible role of fatty acids as an alternativeenergy source (Butler et al., 1999).
Butler et al. (1997) cultivated a murine B-lymphocyte cell line(CC9C19) and a myeloma (SP2/0) in T-flasks in a serum-free mediumsupplemented with linoleic acid. They determined that, in the presenceof linoleic acid, the glutamine consumption rate was significantly lower,and this correlated with a significant decrease in the specific rate ofproduction of ammonia. The glucose consumption rate was slightlylower but the specific rate of production of lactate increased signifi-cantly. This can be explained by a change in the formation of glycolyticend-products. The rate of production of alanine was lower in linoleicacid-grown cells. Alanine is produced from pyruvate by transaminationwith glutamate in response to the need for sequestration of excessmetabolic nitrogen. It is likely that the decreased glutamine utilizationin linoleic acid-grown cells would lower the level of intracellularglutamate. This would in turn decrease the transamination reaction andcause a greater proportion of pyruvate to be converted to lactate. Thesechanges were reversible on the removal of the fatty acids (Butler et al.,1997, 1999).
There may be several mechanisms for these metabolic effects. Unsatu-rated fatty acids have been shown to directly activate specific enzymes andto induce DNA synthesis and cytokine release from lymphocytes (Karstenet al., 1994). The induction of specific protein synthesis may produce thereduction in glutamine metabolism. The increase in the robustness of thefatty acid-grown hybridomas in agitated cultures could be explained by ahigh incorporation of the available fatty acids into the cellular phospho-lipids fraction, which is a major structural component of the outermembrane of the cell (Butler et al., 1999).
Cell-protecting additives, such as Pluronic1
F-68, are commonly in-cluded as a media component to reduce cell damage in gas-sparged,agitated cultures. Despite the value of Pluronic
1F-68 in protecting cells,
there is a potential problem in that Pluronic1
may have some cytosoliceffects: it may reduce the yield of the producer cell line in culture andthere is a possibility of complexation or co-purification with a cellproduct. The replacement of Pluronic
1with fatty acids, as well as being
positive for the half-lives and production of cultured cell lines, provides analternative method to protect producer cells in agitated cultures (Butleret al., 1999).
The effect of the unsaturated fatty acids on protein secretion of culturedcells can be dissociated from growth effects. Recombinant protein produc-
94 Animal Cell Technology

tivity from BHK cells seems to be stimulated by unsaturated fatty acidsindependently of cell growth (Schmid et al., 1991).
4.3 Metabolic byproducts
4.3.1 Lactate
Cells in vivo convert a proportion of the pyruvate generated by glycolysisinto lactic acid, in a reaction catalyzed by the lactate dehydrogenaseenzyme. This lactic acid is largely secreted into the blood; some passes intothe liver, where it is reoxidized to pyruvate and either further metabolizedto CO2 aerobically or converted to glucose. Much lactate is metabolizedto CO2 by the heart, which is perfused by blood and can continue aerobicmetabolism at times when exercising skeletal muscles secrete lactate. In thecase of mammalian cells in culture, the lactic acid is accumulated in themedium. Lactate generation requires the use of pH control methods toavoid the direct negative effects of medium acidification on cell growth.
Generally, lactate concentrations below 20 mM are considered not toshow any negative effects (Table 4.1). There are several actions that can beperformed in a culture process to reduce lactate accumulation, and thesehave already been mentioned.
Lao and Toth (1997) have studied the effects of lactate concentration onthe metabolism of a CHO cell line producing a recombinant glycoprotein,cultivated in batch mode with an initial concentration of sodium lactate of60 mM. They demonstrated a reduction of glucose and glutamine con-sumption (decreased by 20%) and ammonia and alanine production (de-creased by 64% and 70%, respectively), while productivity was notaffected. They showed that cultures with added lactate have no lactateproduction and they hypothesized that inhibition of lactate dehydrogenasewas the cause of this decreased lactate production. Inhibition of lactatedehydrogenase prevents the regeneration of NADH to NADþ coupledwith the pyruvate/lactate conversion, which leads to an accumulation ofNADH. This excess of NADH inhibits glycolysis in the cytosol. In-creased efficiency of the malate–aspartate shuttle to transport NADHacross mitochondrial membrane would be one of the responses from thecells to retain the glycolytic rate. The lactate inhibition of glycolysis alsoleads to a lower concentration of pyruvate, which may be the cause of adecrease in glutamine consumption. Due to the diminished energy produc-tion from lower glycolytic and glutaminolytic rates, with the diversion of
Table 4.1 Influence of different lactate concentrations on cell growth atconstant pH (Wagner, 1997)
Lactate (mM) Growth Productivity Reference
, 20 No effect No effect Wagner et al. 1988Miller et al. 1988
20–40 No effect Inhibition Glacken et al. 198840–60 Slight inhibition Inhibition Glacken et al. 198860 Inhibition Inhibition Glacken 1988
Cell metabolism and its control in culture 95

more energy into maintenance of the ion gradient to counter the effects ofa hypertonic environment, growth was inhibited under high concentra-tions of lactate.
On the other hand, Cruz et al. (2000) reported that 28 mM lactatereduced the growth of a BHK cell line by 50%, and that lactate wasconsumed at concentrations above 30 mM. Increased concentrations oflactate reduced cell growth and specific ammonia production but increasedspecific glutamine and glucose consumption. The effect of lactate was atleast partially due to an increase of osmolarity. An increase in lactate from0 to 60 mM induced a 40% reduction in specific productivity of arecombinant fusion protein secreted by the BHK cells in both stationaryand stirred cultures.
The effects of elevated lactic acid concentration on the cell cycle kineticsof hybridoma cell growth and antibody production in batch culture werestudied by Kromenaker and Srienc (1994). When 33 mM lactic acid wasinitially present, the specific growth rate was reduced by 37% and the cell-specific antibody production rate increased by a factor of 2.6 relative to acontrol culture with no additional lactic acid.
4.3.2 Ammonia
Ammonia (NH3) and the ammonium ion (NH4þ) are highly toxic to
mammalian cells. In vivo, ammonium is secreted by the cells and trans-ported to the mitochondria of hepatocytes, where it is converted into ureavia the urea cycle. Urea production occurs almost exclusively in the liverand is the fate of most of the ammonium channeled there. The urea passesinto the bloodstream and thus to the kidneys and is excreted into theurine. Mammalian cells in culture secrete ammonium into the culturemedium, where its concentration increases gradually because there is noammonium recycling pathway (Newland et al., 1990).
As previously stated, ammonium in cell culture medium is the productof glutamine metabolism and its spontaneous decomposition at 378C.Negrotti et al. (1989) showed that the half-life for glutamine at 378C andpH 7.2 is only 7 days. The effects of ammonium on cell metabolism areobserved from concentrations as low as 2 mM, which is easily reached inculture systems (Table 4.2). For example, the spontaneous decompositionof glutamine can result in 0.1 mM ammonia per day (Butler and Spier,1984). Anchorage-dependent cells grown on microcarriers produce be-tween 2 and 3 mM ammonia after growth in a batch culture (Butler et al.,
Table 4.2 Effect of different medium concentrations of ammonium ongrowth and productivity (Wagner, 1997)
Ammonium (mM) Growth Productivity Reference
, 2 No effect No effect Glacken 19882–5 Inhibition No effect Glacken et al. 1988
McQueen and Bailey1990Glacken 1988
5 Inhibition Inhibition Glacken 1988
96 Animal Cell Technology

1983; Butler and Spier, 1984), and hybridomas in batch suspension cultureproduce between 4.5 and 5.5 mM (Reuveny et al., 1986).
Ammonium can either perturb the intracellular or intra-organelle pHand electrochemical gradients, or directly interact with enzymes. The toxiceffects can be classified into two possibilities, as described below.
(i) Perturbation of intracellular pH and electrochemical gradients.At the physiological pH of 7.1–7.5, which is the pH at which mostmammalian cell cultures are maintained, only about 1% of the totalconcentration of ammonia/ammonium is present as ammonia (NH3),the rest being ammonium (NH4
þ). Ammonia is a small, uncharged,lipophilic molecule, which readily diffuses across cellular mem-branes. The small percentage of ammonia present in the extra- andintracellular aqueous phases will diffuse across the membranes, thusrapidly equilibrating any transmembrane gradient of ammonia. Am-monium is produced, in the ionic form, inside the mitochondria(Figure 4.6A) by the action of glutaminase and glutamate dehydro-genase. The inner mitochondrial membrane is extremely imperme-able to ions; however, ammonia readily passes from themitochondrial matrix into the cytoplasm. This ammonia outflowfrom the mitochondria leads to a decrease of the pH in the matrix,since a proton is left behind. Ammonia can diffuse out of thecytoplasm into the environment; however, it can be transported backas ammonium by carrier proteins. The consequence of such a cycleis an acidification of the cytoplasm and the mitochondrial matrix,and an alkalinization of the environment. Ammonia/ammoniumderived from glutamine decomposition or added externally (Figure4.6B) will transiently increase the pH of the cytoplasm due to rapiddiffusion of ammonia into the cell. This alkalinization is followed byan acidification due to transport of ammonium by carrier proteins.Diffusion of ammonia into the mitochondria and other organellesleads to an increase of the pH inside these compartments. The resultis an alkalinization of the cellular environment and of the inside ofthe organelles, mitochondria included, and an acidification of thecytoplasm. Thus, it is very important to realize that the physiologicalconsequences of adding extracellular ammonium to the medium arevery different to those resulting from ammonium produced intracel-lularly.
(ii) Ammonium and enzymatic reactions. Ammonia or ammonium canparticipate in enzyme reactions and displace equilibria or interactwith regulatory sites of enzymes. The key enzyme of the glycolyticpathway, phosphofructokinase, as well as Æ-ketoglutarate dehydro-genase, an enzyme of the TCA cycle, have been reported to beactivated by ammonium (Uyeda and Racker, 1965; Parmeggiani et al.,1966). Thus, elevated ammonium concentrations could lead to a highrate of glycolysis and lactate production and a reduced TCA cycleactivity. Other enzymes affected by ammonium concentration arethose involved in the glycosylation of proteins. Gramatikos et al.(1998) have reported that the intracellular content of UDP-N-acetyl-hexosamines (UDP-GNAc) is substantially elevated under high am-
Cell metabolism and its control in culture 97

monium concentrations in the medium. This may lead to an increasein the antennarity of the N-linked oligosaccharides of glycoproteins,or a decrease in terminal sialylation (Yang and Butler, 2002) (seeChapter 6).
A
B
NH H3 � �
NH H3 � �
NH4�
Glutamine
metabolism
pH
diffusion
CYTOPLASM
EXTRACELLULARSPACE
MITOCHONDRIA
diffusion
A
pH
diffusion CYTOPLASM
MITOCHONDRIA
diffusion
EXTRACELLULARSPACE
Glutamine decomposition
Ammonium addition
B
active transport
NH4�
NH H3 � �
NH H3 � �
NH4�
NH4�
active transport
NH H3 � � NH4�
NH H3 � � NH4�
Figure 4.6
Effects of ammonium on mammalian cell cultures. (A) Effects of ammoniumgenerated by glutamine metabolism. (B) Effects of ammonium generated byglutamine decomposition or by ammonium addition in the culture medium.
98 Animal Cell Technology

The toxic effects produced by ammonium are: (i) enzymatic inhibition(in glycolysis, TCA cycle, glutaminolysis, and PPC); (ii) perturbation ofthe transcellular ionic gradient; (iii) intracellular pH modification; (iv)increase of UDP-GNAc synthesis, with concomitant glycolysis modifica-tion and affecting the quality of the recombinant protein; and (v) increasein the alanine secretion.
As shown schematically in Figure 4.7, an increase of the UDP-GNAcconcentration in the cytoplasm leads to elevated transport of UDP-GNAcinto the Golgi vesicle, by means of the sugar nucleotide transport systemI. This higher concentration of UDP-GNAc, however, inhibits the sugarnucleotide transport system II that is responsible for CMP-NANA importto the Golgi, and a higher CMP-NANA concentration inhibits in turn, viafeedback inhibition, the UDP-N-acetylglucosaminyl epimerase that cata-lyzes the first step of UDP-NANA synthesis. This block, together withthe inhibition of the transport system, reduces CMP-NANA concentra-tion, resulting in a decrease of sialylation.
It was reported by Yang and Butler (2002) that ammonia caused anincrease in the antennarity and a decrease in the sialylation of glycans ofrecombinant EPO in CHO cells. Gawlitzek et al. (1998) have studied thefinal carbohydrate structure of a human interleukin (IL)-2 mutant glyco-protein, named IL-Mu6. Furthermore, Valley et al. (1999) demonstratedthat about 60–80% of N-acetylated sugars in N-glycan structures con-tained 15N, provided by 15NH4Cl used as a supplement in the culturemedium. This indicates that ammonium is used as a building block duringsynthesis of the carbohydrate structures expressed in cultivated mamma-lian cells. Gawlitzek et al. (2000) cultured a BHK-21 recombinant clone ina continuously perfused double membrane bioreactor. In the presence of15 mM exogenously added NH4Cl, a significant and reproducible increasein tri- and tetra-antennary oligosaccharides (45% of total) was detected inthe secretion product. They also studied the effect of ammonium on theglycosylation pattern of the recombinant immunoadhesin tumor necrosisfactor-IgG (TNFR-IgG) produced by CHO cells. They demonstrated thatas ammonium increased from 1 to 15 mM, a concomitant decrease of up to40% was observed in terminal galactosylation and sialylation of themolecule. Gawlitzek et al. (1999) cultivated recombinant CHO cellsproducing an immunoadhesin glycoprotein (GP1-IgG) under controlledconditions in the presence of different ammonium N-Glycans synthesizedin the presence of 15NH4Cl revealed an N-glycan-dependent increase inmass to charge ratio of 2.5–4.8 Da. A 60–70% of the total nitrogencontained in the monosaccharides was 15N, which suggested that 15NH4
þwas incorporated into GlcNAc and N-acetylneuraminic acid as proposedearlier (Ryll et al., 1994). Studies of secreted EPO from CHO recombinantcells during cultivation in a medium supplemented with NH4Cl revealedthat the presence of ammonium caused a significant increase in theheterogeneity of the glycoforms, as shown by the isoelectric point, whichincreased from a range of 4.06–4.67 in the control culture to 4.18–6.05,when ammonium was added to the culture medium. A shift in molecularweight, from 33 000–39 000 in the control culture to 27 000–37 000 in theammonium-supplemented medium, was further evidence for the increasedheterogeneity. Cell growth was inhibited above a culture concentration of
Cell metabolism and its control in culture 99

Glutamine NH3
active transport
URIDILATE
KINASE
URIDINE
KINASE
NUCLEOSIDE
DIPHOSPHATE KINASE
CO2
Carbamoyl
phosphate
CARBAMOYL
PHOSPHATE
SYNTHETASE I
OMP
UMP
UDP
UTP
UDP-GlcNAcUDP-GalNAcUDP- -ACETYL-D-
GLUCOSAMINE 4-EPIMERASE
N
Urd
ManNAc6P
NeuNAc
CMP-NANA
Glc 6-P-
Fruc 6-P-
GlcN 6-P-
GlcNAc 6-P-
GlcNAc 1-P-
MITOCHONDRIACYTOSOL
ACETYL GLUCOSAMINE
PHOSPHOMUTASE
GLUCOSE-6-PHOSPHATE
ACETYLASE
GLUCOSAMINE 6-
PHOSPHATE DEAMINASE
PHOSPHOFRUCTO
ISOMERASE
HEXOKINASE
UDP- -ACETYL-
GLUCOSAMINYL
EPIMERASE
N
TRANS-GOLGI
S I S II
NUCLEUS
PROTEIN OF INTEREST
EXTRACELLULAR
SPACE
EXTRACELLULAR SPACE (glutamine decomposition)
OR MITOCHONDRIA (glutamine metabolism)
NH4�
diffusion Glucose
NH3NH4�
NH4�
Figure 4.7
Effects of increased ammonium concentrations on the glycosylation of proteins. OMP, orotidinemonophosphate; UMP, uridine monophosphate; UDP, uridine diphosphate; UTP, uridinetriphosphate; UDP-GlcNAC, UDP-N-acetylglucosamine; UDP-GalNAc, UDP-N-acetylgalactosamine;ManNAc6P, mannose-N-acetyl-6-phosphate; NeuNAc, N-acetylsialic acid; CMP-NANA, cytosinemonophosphate-N-acetylneuraminic acid; S I, sugar nucleoside transport system I; S II, sugarnucleoside transport system II; Glc-6-P, glucose-6-phosphate; Fruc-6-P, fructose-6-phosphate;GlcN-6-P, glucosamine-6-phosphate; GlcNAc-6-P, N-acetylglucosamine-6-phosphate; GlcNAc-1-P,N-acetylglucosamine-1-phosphate. The dashed arrows indicate the influence of the increasedammonium concentration.
100 Animal Cell Technology

5 mM NH4Cl, whereas the specific production of EPO increased with theaddition of NH4Cl above this level. At 10 mM NH4Cl, the final celldensity after 4 days in culture was significantly lower but the final yield ofEPO was significantly higher. This appeared to be due to continuedprotein production after cell growth had ceased. The metabolic effects ofadded NH4Cl included higher specific consumption rates of glucose andglutamine and an increased rate of production of alanine, glycine, andglutamate (Yang and Butler, 2000).
Sun and Zhang (2001b) showed that an increase of the initial ammoniaconcentration resulted in decreased cellular yields with respect to glucose,glutamine, and other consumed amino acids. In a batch culture with aninitial ammonia concentration of 5.66 mM, the cellular yields from glucoseand glutamine reduced by 78% and 74%, respectively, compared to thatwith ammonia at an initial concentration of 0.21 mM. The yields of cellswith respect to other consumed amino acids also decreased by 50–70%.The metabolic pathways were altered in the cultures with the higherammonia concentrations. The glucose consumption was more prone toform lactate. For glutamine metabolism, the reaction of glutamate to Æ-ketoglutarate catalyzed by the glutamate dehydrogenase was inhibited byammonia, and that by the glutamate amino transferase was facilitated.However, the yields of glutamate to glutamine decreased with the increaseof ammonia concentrations, showing that the reaction of glutamate to Æ-ketoglutarate was inhibited by ammonia as a whole. Lao and Toth (1997)reported a decrease in alanine production. While aspartate consumptionincreased sixfold, glutamate changed from consumption to low-levelproduction and higher consumption again with added ammonium concen-trations. Cells consumed more aspartate and glutamine at high ammoniumconcentrations. There was also a decrease in TCA intermediates, forexample, malate (Lao and Toth, 1997).
Chen et al. (2005) investigated the addition of amino acids to the growthmedia for CHO cell cultures as a means of mitigating the negative effectsof ammonium. Threonine, proline, and glycine additions enhanced CHOcell growth and recombinant protein levels. Furthermore, the addition ofthese amino acids positively impacted important metabolic parameters,including glucose consumption, lactate production, glutamine utilization,and final ammonium levels. Additionally, threonine, proline, and glycineincreased the level of Æ-2,3-linked sialic acid, galactose-�-1,4-N-acetylglu-cosamine, and Æ-2,6-linked sialic acid residues in recombinant tissueplasminogen activator (tPA). Thus, these amino acids can be used tomitigate some of the toxic effects of ammonium on cell growth, recombi-nant protein productivity, and protein quality.
4.4 Factors affecting cell metabolism
There are several factors that have a large influence on metabolic path-ways. Among the external factors, the most important are the dissolvedoxygen and carbon dioxide concentration, the pH, and the temperature ofthe culture. These factors are discussed in Chapter 2, but here their effectson metabolic pathways are described.
Cell metabolism and its control in culture 101

4.4.1 Oxygen requirements
The effects of dissolved oxygen on mammalian cell growth and metabo-lism have been studied extensively. It has been established that anaerobicconditions can severely depress cell growth. At high oxygen concentra-tions, on the other hand, oxidative damage is observed. Between theselimits, there exists an optimal dissolved oxygen range suitable for prolif-eration of mammalian cells. Generally, a dissolved oxygen range between30% and 60% air saturation is accepted to be optimal for cell growth,although the sensitivity of cells to extreme dissolved oxygen levels isknown to vary. Each cell line seems to have a different optimal dissolvedoxygen range. It has been shown that established cell lines are moretolerant to high dissolved oxygen levels. Lymphoblastoid cells, for in-stance, achieved their highest cell yield and growth rates at high dissolvedoxygen concentrations (100%).
WI-38 cells grown at dissolved oxygen values between 16% and 85%air saturation had similar growth parameters, such as population density,glucose utilization, and lactate production. The growth rate decreasedgreatly and metabolic rates of glucose and lactate increased four- to six-fold when the dissolved oxygen was lowered to 5%. Similar increases inglucose utilization and lactate production at low dissolved oxygen havebeen reported for other cell lines. Less is known about the effects ofdissolved oxygen on glutamine metabolism. An increase in glutamineconsumption rate at very low and very high oxygen concentrations hasbeen reported. Effects of oxygen were also reported on ammonia produc-tion from glutamine (Ozturk and Palssom, 1990).
The murine hybridoma CC9C10 was grown at steady state, underserum-free conditions in continuous culture, at dissolved oxygen concen-trations in the range of 10–150% of air saturation. There was a require-ment for cellular adaptation at each stepwise increase in dissolved oxygen.Adaptation to a dissolved oxygen concentration of 100% was associatedwith an increase in the specific activities of glutathione peroxidase(18-fold), glutathione S-transferase (11-fold), and superoxide dismutase(6-fold), which are all known antioxidant enzymes. At dissolved oxygenconcentrations above 100%, the activities of glutathione peroxidase andglutathione S-transferase decreased, possibly as a result of inactivation byreactive oxygen radicals. The increase in dissolved oxygen concentrationcaused changes in energy metabolism. The specific rate of glucose uptakeincreased at higher dissolved oxygen concentrations, with a higher propor-tion of glucose metabolized anaerobically. It was shown that the flux ofglucose through glycolysis and the pentose phosphate pathway increased,whereas the flux through the tricarboxylic acid cycle decreased at highdissolved oxygen concentrations (Jan et al., 2000).
Acute exposure of Chinese hamster ovary (CHO) cells or humanbladder cancer MGH-U1 cells to hypoxia plus low pH (6.5–6.0), wascytotoxic in a time- and pH-dependent manner. Inhibition of glycolysisby incubation of CHO cells under hypoxic conditions in the absence ofglucose at pH 7.0 led to a larger fall in cellular ATP and energy charge. Adecrease in energy charge of the cells may contribute to loss of viability,but additional mechanisms appear to be involved (Rotin et al., 1986).
102 Animal Cell Technology

Activities of enzymes involved in glycolysis, the pentose phosphatepathway, the TCA cycle, and glutaminolysis have been determined in themouse myeloma SP2/0.Ag14, when the cells were grown on IMDMmedium with 5% serum in steady-state chemostat culture under differentlevels of oxygenation. The specific rates of glucose consumption andlactate production were highest at low oxygen supply. Under low oxygenconditions, the specific production of ammonia increased and the con-sumption pattern of amino acids showed large changes compared with thecontrol culture. The levels of glycolytic enzymes were elevated underconditions of low oxygen supply (Vriezen et al., 1997).
Not only does the oxygen level affect metabolism, but also metabolismaffects oxygen uptake rates, making a tight control of oxygen concentra-tion necessary when the composition of the culture medium is changed.
4.4.2 Carbon dioxide
Carbon dioxide is one of the end products of mammalian cell metabolism,produced in different metabolic steps. In some reactions, carbon dioxidecan be used as a substrate, such as the carboxylation of pyruvate tooxaloacetic acid. The importance of carbon dioxide is also related to itsgeneralized use in cell culture technology for pH regulation, in equili-brium with medium bicarbonate. The influence of carbon dioxide genera-tion by cell metabolism can be especially relevant in industrialapplications, operating with systems optimized to provide an efficientoxygen supply and to reach high cell densities. In such systems, themetabolically produced carbon dioxide may increase, with an elevatedpartial pressure, which can lead to reduced cell viability, decreased specificproduction rates, and polysialylation rates (Zanghi et al., 1999).
4.4.3 Temperature
Standard temperatures are usually defined for every known cell line, forexample, mammalian cell lines are usually cultured at 378C and insect celllines at 288C. However, studies have demonstrated that temperaturemodifications can lead to changes in certain parameters, such as increasedproductivity of recombinant proteins or decreased byproduct generation.
Several studies have shown environmental control strategies to affectprotein glycosylation and carbon metabolism, as well as cell growth andcell death. Experiments suggest that reduced culture temperature results inhigher viability and shear resistance, decreased specific growth rate,limited release of waste products, and reduced glucose/lactate metabolism.There are several reports on the effects of the culture temperature on cellsproducing recombinant proteins (Bollati-Fogolin et al., 2005). In somecases reduced temperatures were associated with improved cellular pro-ductivity, and prolonged cellular viability in culture (Rodriguez et al.,2005). However, Weidemann et al. (1994) described that a temperaturebelow 378C reduced the cell growth and glucose consumption of arecombinant BHK cell line but did not affect the cellular productivity ofrecombinant antithrombin III.
Cell metabolism and its control in culture 103

4.4.4 pH
Ideally, the pH should be near 7.4 at the initiation of a culture and remainabove a value of 7.0 during the culture, although some hybridomas appearto prefer lower pH. A pH below 6.8 is usually inhibitory to cell growth.Factors affecting the pH stability of the medium are buffer capacity,volume of headspace, and glucose concentration.
As described in Chapter 2, the usual normal buffer system in culturemedia is the carbon dioxide-bicarbonate system, analogous to that in theblood. Modifications in the medium pH produce changes to the intracellu-lar pH value, with modifications to enzyme activities.
4.5 Conclusions
Mammalian cell culture is a technology used for the production ofrecombinant proteins of therapeutic use, as they can secrete proteins withpost-translational modifications similar to those present in human pro-teins. The most important advantages of this capacity of the mammaliancell lines are that they secrete a protein with the similar characteristics tothe original protein, so that the protein can be used for human treatmentwithout generating immunological responses.
As the productivity of mammalian cell lines is lower compared with thatof other production systems (bacteria, insect cells, etc.), it is desirable toimprove the productivity per cell or the total cell yield per unit volume ofculture. An increase in the specific productivity could involve enhance-ment at the genetic level by gene amplification or by the addition of aninducer to enhance the transcription of a gene. However, knowledge ofmammalian cell metabolism helps in the development of strategies forproductivity enhancement, as changes in the culture conditions can affectboth metabolism and productivity.
The cell yield can be improved by a full understanding of the physico-chemical environment of the cells during growth and maintenance. It isnow becoming clear that cells in culture are highly adaptable and may bemaintained under conditions that are substantially different from theirnormal environment in vivo. Intracellular enzyme activity levels canchange considerably and such changes can alter fluxes through metabolicpathways, which may reflect the optimal utilization of the nutrients madeavailable in the culture medium (Crabtree and Newsholme, 1987; Glacken,1988; Butler et al., 1989).
Thus, knowledge of cell physiology is an important prerequisite forfurther directed metabolic optimization and the investigation of associatedcellular phenomena.
References
Appling DR (1991), Compartmentation of folate-mediated one-carbon metabolism ineukaryotes, FASEB J. 5:2645–2651.
Arathoon WR, Telling CR (1982), Uptake of amino acid and glucose by BHK-21 clone13 suspension cells during cell growth, Dev. Biol. Stand. 50:145–154.
Bailey JM, Dunbar LM (1973), Essential fatty acid requirements of cells in tissue
104 Animal Cell Technology

culture: a review, Exp. Mol. Pathol. 18:142–161.Bandyopadhyay GK, Imagawa W, Wallace D, Nandi S (1987), Linoleate metabolites
enhance the in vitro proliferative response of mouse mammary epithelial cells toepidermal growth factor, J. Biol. Chem. 262:2750–2756.
Bannai S, Ishii T (1988), A novel function of glutamine in cell culture: utilization ofglutamine for the uptake of cystine in human fibroblasts, J. Cell. Physiol.137:360–366.
Bebbington CR, Renner G, Thomson S, King D, Abrams D, Yarranton GT (1992),High-level expression of a recombinant antibody from myeloma cells using aglutamine synthetase gene as an amplifiable selectable marker, Biotechnology10:169–175.
Bell SL, Bushell ME, Scott MF, Wardell JN, Spier RE, Sanders PG (1992), Geneticmodification of hybridoma glutamine metabolism: physiological consequences.In: Proceedings of the 11th ESACT Meeting, Brighton, UK, pp. 180–182.
Bell SL, Bebbington C, Scott MF, Wardell JN, Spier RE, Bushel ME, Sanders PG(1995), Genetic engineering of hybridoma glutamine metabolism, EnzymeMicrob. Technol. 17:98–106.
Birch JR, Hopkins DW (1977), The serine and glycine requirements of cultured humanlymphocyte lines. In: Acton RT, Lynn JD (Eds), Cell Culture and its Applica-tions, Academic Press, New York, pp. 503–511.
Bollati-Fogolin M, Forno G, Nimtz M, Conradt HS, Etcheverrigaray M, Kratje R(2005), Temperature reduction in cultures of hGM-CSF-expressing CHO cells:effect on productivity and product quality, Biotechnol. Prog. 21:17–21.
Burant CF, Takeda J, Brot-Laroche E, Bell GI, Davidson NO (1992), Fructosetransporter in human spermatozoa and small intestine is GLUT5, J. Biol. Chem.267:14523–14526.
Butler M (2004), Animal Cell Culture & Technology, 2nd Ed., BIOS ScientificPublishers, New York.
Butler M, Christie A (2004), Adaptation of mammalian cells to non-ammoniagenicmedia, Cytotechnology 15:87–94.
Butler M, Huzel N (1995), The effects of fatty acids on hybridoma cell growth andantibody productivity in serum-free cultures, J. Biotechnol. 39:165–173.
Butler M, Spier RE (1984), The effects of glutamine utilization and ammonia pro-duction on the growth of BHK cells in microcarrier cultures, J. Biotechnol.1:187–196.
Butler M, Thilly WG (1982), MDCK microcarrier cultures: seeding density effects andamino acid utilization, In Vitro 18:213–219.
Butler M, Imamura T, Thomas WG, Thilly M (1983), High yields from microcarriercultures by medium perfusion, J. Cell. Sci. 61:351–363.
Butler M, Huzel N, Barnabe N (1997), Unsaturated fatty acids enhance cell yields andperturb the energy metabolism of an antibody-secreting hybridoma, Biochem. J.322:615–623.
Butler M, Huzel N, Barnabe N, Gray T, Bajno L (1999), Linoleic acid improves therobustness of cells in agitated cultures, Cytotechnology 30:27–36.
Butler, M. and Jenkins, H. (1989), Nutritional aspects of growth of animal cells inculture. J. Biotechnol. 12, 97-110.
Calder PC, Bond JA, Bevan SJ, Hunt SV, Newsholme EA (1991), Effect of fatty acidson the proliferation of concanavalin A-stimulated rat lymph node lymphocytes,Int. J. Biochem. 23:579–588.
Calder PC, Yaqoob P, Harvey DJ, Watts A, Newsholme EA (1994), Incorporation offatty acids by concanavalin A-stimulated lymphocytes and the effects on fatty acidcomposition and membrane fluidity, Biochem. J. 300:509–518.
Carruthers A (1990), Facilitated diffusion of glucose, Physiol. Rev. 70:1135–1176.Chasin LA, Feldman A, Konstam M, Urlaub G (1994), Reversion of a Chinese hamster
Cell metabolism and its control in culture 105

cell auxotrophic mutant, Proc. Natl Acad. Sci. U S A 71:718–722.Chen J, Sun X, Zhang Y (2005), Growth and metabolism of marine fish Chinook
salmon embryo cells: response to lack of glucose and glutamine, Biotechnol. Lett.27:395–401.
Chen P, Harcum SW (2005), Effects of amino acids additions on ammonium stressedCHO cells, J. Biotechnol. 117:277–286.
Christie A, Butler M (1994), Glutamine-based dipeptides are utilized in mammaliancell culture by extracellular hydrolysis catalyzed by a specific peptidase,J. Biotechnol. 37:277–290.
Cornwell DG, Morisaki N (1984), Fatty acid paradoxes in the control of cell prolifera-tion: prostaglandins, lipid peroxides and cooxidation reactions, In: Pryor WA(Ed.), Free Radicals in Biology VI, Academic Press, New York, pp. 95–147.
Crabtree B, Newsholme EA (1987), A systematic approach to describing and analyzingmetabolic control systems, Trends Biochem. Sci. 12:6–12.
Craik JD, Elliot KRF (1979), Kinetics of 3-O-methyl-D-glucose transport in isolatedrat hepatocytes, Biochem. J. 182:503–508.
Cruz HJ, Freitas CM, Alves PM, Moreira JL, Carrondo MJT (2000), Effects ofammonia and lactate on growth, metabolism, and productivity of BHK cells,Enzyme Microb. Technol. 27:43–52.
Donelly M, Scheffler IE (1976), Energy metabolism in respiration deficient and wildtype Chinese hamster fibroblasts in culture, J. Cell. Physiol. 18:39–52.
Doverskog M, Ljunggren J, Ohman L, Haggstrom L (1997), Physiology of culturedanimal cells, J. Biotechnol. 59:103–115.
Doyle A, Griffiths JB (1998), Cell and Tissue Culture: Laboratory Procedures inBiotechnology, John Wiley & Sons, Chichester, UK.
Duval D, Demangel C, Munier-Jolain K, Miossec S, Geahel I (1991), Factors control-ling cell proliferation and antibody production in mouse hybridoma cells: I.Influence of the amino acid supply, Biotechnol. Bioeng. 38:561–570.
Duval D, Demangel C, Miossec S, Geahel I (1992), Role of metabolic waste productsin the control of cell proliferation and antibody production by mouse hybridomacells, Hybridoma 11:311–322.
Eagle H (1955), Nutrition needs of mammalian cells in tissue cultures, Science122:501–504.
Eagle H (1959), Amino acid metabolism in mammalian cell cultures, Science 130:432–437.
Eagle H, Piez K (1962), The population dependent requirement by cultured mamma-lian cells for metabolites which they can synthesize, J. Exp. Med. 116:29–43.
Elliott WH, Elliott DC (2001), Biochemistry and Molecular Biology, 2nd Ed., OxfordUniversity Press, New York.
Ferrance JP, Goel A, Ataai MM (1993), Utilization of glucose and amino acids in insectcell cultures: quantifying the metabolic flows within the primary pathways andmedium development, Biotechnol. Bioeng. 42:697–707.
Fitzpatrick L, Jenkins HA, Butler M (1993), Glucose and glutamine metabolism ofa murine B-lymphocyte grown in batch culture, Appl. Biochem. Biotechnol. 43:93–116.
Gawlitzek M, Valley U, Wagner R (1998), Ammonium ion and glucosamine dependentincreases of oligosaccharide complexity in recombinant glycoproteins secretedfrom cultivated BHK-21 cells, Biotechnol. Bioeng. 57:518–528.
Gawlitzek M, Papac DI, Sliwkowski MB, Ryll T (1999), Incorporation of 15N fromammonium into the N-linked oligosaccharides of an immunoadhesin glycoproteinexpressed in Chinese Hamster Ovary cells, Glycobiology 9:125–131.
Gawlitzek M, Valley U, Wagner R (2000), Ammonium alters N-glycan structures ofrecombinant TNFR-IgG: degradative versus biosynthetic mechanisms. Biotech-nol. Bioeng. 68:637–646.
106 Animal Cell Technology

Genzel Y, Ritter JB, Konig S, Alt R, Reichl U (2005) Substitution of glutamine bypyruvate to reduce ammonia formation and growth inhibition of mammalian cells.Biotechnol. Prog. 21:58–69.
Glacken MW (1988), Catabolic control of mammalian cell culture, Biotechnology6:1941–1950.
Glacken MW, Adema E, Sinskey AJ (1988), Mathematical descriptions of hybridomaculture kinetics I. Initial metabolic rates, Biotechnol. Bioeng. 28:1376–1389.
Gould GW, Thomas HM, Jess TJ, Bell GI (1991), Expression of human glucosetransporters in Xenopus oocytes. Kinetic characterization and substrate specifici-ties of the erythrocyte, liver, and brain isoforms, Biochemistry 30:5139–5145.
Grammatikos SI, Subbaiah PV, Victor TA, Miller WM (1994), Diverse effects ofessential (n-6 and n-3) fatty acids on cultured cells, Cytotechnology 15:31–50.
Gramatikos SI, Valley U, Nimtz M, Conrad HS, Wagner R (1998), Intracellular UDP-N-acetylhexosamine pool affects N-glycan complexity: a mechanism of ammo-nium action on protein glycosylation, Biotechnol. Prog. 14:410–419.
Griffiths B (2000), Scaling-up of animal cell cultures, In: John RW (Ed.), Animal CellCulture, 3rd Ed., Masters, Oxford University Press, pp. 19–63.
Griffiths JB (1971), The effect of medium changes on the growth and metabolism ofthe human diploid cell, WI-38, J. Cell Sci. 8:43–52.
Griner RD, Aleo MD, Schnellmann RG (1993), The role of short chain fatty acidsubstrates in aerobic and glycolytic metabolism in primary cultures of renalproximal tubule cells, In Vitro Cell Dev. Biol. Anim. 29A:649–655.
Gstraunthaler G, Seppi T, Pfaller W (1999), Impact of culture conditions, culturemedia volumes and glucose content on metabolic properties of renal epithelial cellcultures. Are renal cells in tissue culture hypoxic?, Cell. Physiol. Biochem. 9:150–172.
Haggstrom L (2000), Animal cell metabolism In: Spier R (Ed.), Encyclopedia of CellTechnology, Wiley & Sons, New York, pp. 392–411.
Hassell T, Butler M (1990), Adaptation to non-ammoniagenic media and selectivesubstrate feeding lead to enhanced yields in animal cell culture, J. Cell Sci. 96:501–508.
Hassell T, Gleave S, Butler M (1991), Growth inhibition in animal cell culture: theeffect of lactate and ammonia, Appl. Biochem. Biotechnol. 30:29–41.
Jager V, Lehmann J, Friedl P (1988), Serum-free growth medium for the cultivation ofa wide spectrum of mammalian cells in stirred bioreactors, Cytotechnology1:319–329.
Jan DCH, Petch DA, Huzel N, Butler M (2000), The effect of dissolved oxygen on themetabolic profile of a murine hybridoma grown in serum-free medium incontinuous culture, Biotechnol. Bioeng. 54:153–164.
Kahn BB (1992), Facilitative glucose transporters. Regulatory mechanisms and de-regulation in diabetes, J. Clin. Invest. 89:1367–1374.
Karsten S, Schafer G, Schauder P (1994), Cytokine production and DNA synthesis inhuman peripheral lymphocytes in response to palmitic, stearic, oleic and linoleicacids, J. Cell Physiol. 161:15–22.
Kayano T, Fukumoto H, Eddy RL, Fan YS, Byers MG, Shows TB, Bell GI (1988),Evidence for a family of human glucose transporter-like proteins. Sequence andgene localization of a protein expressed in fetal skeletal muscle and other tissues,J. Biol. Chem. 263:15245–15248.
Kromenaker SJ, Srienc F (1994), Effect of acid lactic on the kinetics of growth andantibody production in a murine hybridoma: secretion patterns during the cellcycle, J. Biotechnol. 34:13–34.
Lambert J, Pirt SJ (1975), The quantitative requirements of human diploid cells (strainMRC-5) for amino acids, vitamins and serum, J. Cell Sci. 17:397–41.
Lanks KW, Li PW (1988), End products of glucose and glutamine metabolism by
Cell metabolism and its control in culture 107

cultured cell lines, J. Cell Physiol. 135:151–155.Lao M, Toth D (1997), Effects of ammonium and lactate on growth and metabolism
of a recombinant Chinese Hamster Ovary cell culture, Biotechnol. Prog. 13:688–691.
Ljunggren J, Haggstrom L (1992), Glutamine limited fed-batch culture reduces theoverflow metabolism of amino acids in myeloma cells, Cytotechnology 8:45–56.
Ljunggren J, Haggstrom L (1995), Specific growth rate as a parameter for tracinggrowth limiting substances in animal cell cultures, J. Biotechnol. 42:163–175.
Lodish H, Scott MP, Matsudaria P, Darnell J, Zipursky L, Kaiser CA, Berk A, KriegerM (2003), Molecular Cell Biology, 5th Ed., Freeman and Company, New York.
McDermott RH, Butler M (1993), Uptake of glutamate, not glutamine synthetase,regulates adaptation of mammalian cells to glutamine-free medium, J. Cell Sci.104:51–58.
McKeehan WL (1986), Glutaminolysis in animal cells, In: Morgan MM (Ed.), Carbo-hydrate Metabolism in Cultured Cells, Plenum, New York, pp. 111–150.
McQueen A, Bailey E (1990), Effect of ammonium ion and extracellular pH onhybridoma cell metabolism and antibody production, Biotechnol. Bioeng.35:897–907.
Maranga L, Goochee CF (2006), Metabolism of PER.C61cells cultivated under fed-
batch conditions at low glucose and glutamine levels, Biotechnol. Bioeng. 94:139–150.
Mehler AH (1982), Amino acid metabolism I: General Pathways, In: Devlin TM (Ed.),Textbook of Biochemistry with Clinical Correlations, 2nd Ed. Wiley, New York,pp. 437–452.
Meijer JJ, van Dijken JP (1995), Effects of glucose supply on myeloma growth andmetabolism in chemostat culture, J. Cell. Physiol. 162:191–198.
Meister A (1955), Transamination, In: Nord FF (Ed.), Advances in Enzymology,Interscience, New York, pp. 185–246.
Miller WM, Wilke CR, Blanch HW (1988), Transient response of hybridoma cells tolactate and ammonia pulse and step changes in continuous culture, BioprocessEng. 3:113–122.
Miller WM, Wilke CR, Blanch HW (1989), Transient response of hybridoma cells tonutrient additions in continuous culture: I. Glucose pulse and step changes,Biotechnol. Bioeng. 33:487–499.
Mitsuhashi J (1982), Determination of Essential Amino Acids for Insect Cell Lines,Academic Press, New York.
Needleman P, Turk J, Jakschik BA, Morrison AR, Lefkowith JB (1986), Arachidonicacid metabolism, Annu. Rev. Biochem. 55:69–102.
Neerman J, Wagner R (1996), Comparative analysis of glucose and glutamine metabo-lism in transformed mammalian cell lines, insect and primary liver cells, J. Cell.Physiol. 166:152–169.
Negrotti M, Murray K, Reidy TJ, Krok K, Seaver SS (1989), Effects of glutamine andammonia on hybridoma cell proliferation and antibody production, Proceedingsof Second Engineering Foundation Conference on Animal Cell Culture, SantaBarbara, CA, p. 65 (abstract).
Nelson DL, Cox MM (2004), Lehninger Principles of Biochemistry, 4th Ed., PalgraveMacMillan Publications, Hants, UK.
Newland M, Greenfield PF, Reid S (1990), Hybridoma growth limitations: the roles ofenergy metabolism and ammonium production, Cytotechnology 3:215–229.
Ohman L, Alarcon M, Ljunggren J, Ramqvist AK, Haggstrom L (1996), Glutamine isnot an essential amino acid for Sf-9 insect cells, Biotechnol. Lett. 18:765–770.
Ozturk SS, Palssom BO (1990), Effects of dissolved oxygen on hybridoma cell growth,metabolism and antibody production kinetics on continuous culture, Biotechnol.Prog. 6:437–446.
108 Animal Cell Technology

Paredes C, Prats E, Cairo JJ, Azorın F, Cornudella L, Godia F (1999), Modification ofglucose and glutamine metabolism in hybridoma cells through metabolic engi-neering, Cytotechnology 30:85–93.
Parmeggiani A, Luft JH, Love DS, Krebs EG (1966), Crystallization and properties ofrabbit skeletal muscle phosphofructokinase, J. Biol. Chem. 241:4625–4637.
Pessin JE, Bell GI (1992), Mammalian facilitative glucose transporter family. Structureand molecular regulation, Annu. Rev. Physiol. 54:911–930.
Petch D, Butler M (1994), Profile of energy metabolism in a murine hybridoma:glucose and glutamine utilization, J. Cell. Physiol. 161:71–76.
Reuveny S, Velez D, Macmillan JD, Millar L (1986), Comparison of cell propagationmethods for their effect on monoclonal antibody yield on fermentors, J. Immunol.Methods 86:61–69.
Rintoul DA, Sklar LA, Simoni RD (1978), Membrane modification of Chinese hamsterovary cells, J. Biol. Chem. 253:7447–7452.
Roberts RS, Hsu HW, Lin KD, Yang TJ (1976), Amino acid metabolism of myelomacells in culture, J. Cell. Sci. 21:609–615.
Rockwell GA, Sato GH, McClure DB (1980), The growth requirements of SV40 virustransformed Balb/c-3T3 cells in serum-free monolayer culture, J. Cell. Physiol.103:323–331.
Rodriguez J, Spearman M, Huzel N, Butler M (2005), Enhanced production ofmonomeric interferon-� by CHO cells through the control of culture conditions.Biotechnol. Prog. 21:22–30.
Rose DP, Connolly JM (1990), Effects of fatty acids and inhibitors of eicosanoidsynthesis on the growth of a human breast cancer cell line in culture, Cancer Res.50:7139–7144.
Rosenthal MD (1987), Fatty acid metabolism of isolated mammalian cells, Prog. LipidRes. 26:87–124.
Rotin D, Robinson B, Tannock IF (1986), Influence of hypoxia and an acidicenvironment on the metabolism and viability of cultured cells: potential implica-tions for cell death in tumors, Cancer Res. 46:2821–2126.
Ryll T, Valley U, Wagner R (1994), Biochemistry of growth inhibition by ammoniumions in mammalian cells, Biotechnol. Bioeng. 44:184–193.
Schmid G, Zilg H, Eberhard U, Johannsen R (1991), Effect of free fatty acid andphospholipids on growth of and product formation by recombinant Baby Ham-ster Kidney (rBHK) and Chinese Hamster Ovary (rCHO) cells in culture,J. Biotechnol. 17:155–167.
Spector AA, Mathur SN, Kaduce TL, Hyman BT (1981), Lipid nutrition andmetabolism of cultured mammalian cells, Prog. Lipid Res. 19:155–186.
Street C, Delort AM, Braddock PSH, Brindle KM (1993), A 1H/15N n.m.r. study ofnitrogen metabolism in cultured mammalian cells, Biochem. J. 291:485–492.
Sun XM, Zhang YW (2001a), Effects of glucose on growth, metabolism and EPOexpression in recombinant CHO cell cultures, Chin. J. Biotechnol. 17:698–702.
Sun XM, Zhang YX (2001b), Effects of ammonia on cell metabolism in the culture ofrecombinant CHO cells, Chin. J. Biotechnol. 17:304–309.
Tremblay GB, Mejia NR, MacKenzie RE (1992), The NADP-dependent methylenete-trahydrofolate dehydrogenase-methenyltetrahydrofolate cyclohydrolase-formyl-tetrahydrofolate synthetase is not expressed in Spodoptera frugiperda cells, J. Biol.Chem. 267:8281–8285.
Uyeda K, Racker E (1965), Regulatory mechanisms of carbohydrate metabolim. VII.Hexokinase and phosphofructokinase, J. Biol. Chem. 240:4682-4688.
Valley U, Nimtz M, Conradt HS, Wagner R (1999), Incorporation of ammonium intointracellular UDP-activated N-acetylhexosamines and into carbohydrate struc-tures in glycoproteins, Biotechnol. Bioeng. 64:401–417.
Vriezen N, Romein B, Luyben KCAM, Van Dijken JP (1997), Effects of glutamine
Cell metabolism and its control in culture 109

supply on growth and metabolism of mammalian cells in chemostat culture,Biotechnol Bioeng. 54:272–286.
Waddell ID, Zomerschoe AG, Voice MW, Burchell A (1992), Cloning and expressionof a hepatic microsomal glucose transport protein, Biochem. J. 286:173–177.
Wagner R (1997), Metabolic control of animal cell culture processes. In: Hauser H,Wagner R (Eds), Mammalian Cell Biotechnology in Protein Production, Walterde Gruyter, Berlin, pp. 193–232.
Wagner R, Ryll T, Krafft H, Lehmannm J (1988), Variation of amino acids concentra-tions in the medium of HU �-IFN and HU IL-2 producing cell lines, Cytotech-nology 1:145–150.
Weidemann R, Ludwig A, Kretzmer G (1994), Low temperature cultivation: a steptowards process optimization, Cytotechnology 15:111–116.
Yang M, Butler M (2000), Effects of ammonia on CHO cell growth, erythropoietinproduction and glycosylation, Biotechnol. Bioeng. 68:370–380.
Yang M, Butler M (2002), Effects of ammonia and glucosamine on the heterogeneity oferythropoietin glycoforms, Biotechnol. Prog. 18:129–138.
Zanghi JA, Schmeltzer AE, Mendoza TP, Knop RH, Miller WM (1999), Bicarbonateconcentration and osmolality are key determinants in the inhibition of CHO cellpolysialylation under elevated pCO2 or pH, Biotechnol Bioeng. 65:182–191.
110 Animal Cell Technology

5Culture media for animalcellsAngela Maria Moraes, Ronaldo Zucatelli Mendonca, andClaudio Alberto Torres Suazo
5.1 Introduction
Effective in vitro maintenance and growth of animal cells requires cultureconditions similar to those found in vivo with respect to temperature,oxygen and carbon dioxide concentrations, pH, osmolality, and nutrients.Within normal tissue in vivo, animal cells receive nutrients through bloodcirculation. For growth in vitro, animal cells require an equivalent supplyof a complex combination of nutrients. For this reason, the first attemptsin animal cell culture were based on the use of biological fluids such asplasma, lymph and serum, as well as on extracts from embryonic-derivedtissue.
Medium composition is one of the most important factors in the cultureof animal cells. Its function is to provide appropriate pH and osmolalityfor cell survival and multiplication, as well as to supply all chemicalsubstances required by the cells that they are unable to synthesizethemselves. Some of these substances can be provided by a culture mediumconsisting of low molecular weight compounds, known as basal media.However, most basal media fail to promote successful cell growth bythemselves and require supplementation with more complex and chemi-cally undefined additives such as blood serum.
Many attempts have been made to develop culture media that do notneed this type of supplementation, that is, serum-free media formulations.These serum-free media present several practical advantages. However, theformulations that have been developed are specific for certain cell typesand a universal culture medium suitable for the culture of all animal celltypes seems, so far, unreachable.
While some culture media are formulated to promote cell multiplication(growth media), others only maintain cell structural and metabolic integ-rity (maintenance media), but do not stimulate cell division. Mediaprepared with highly purified compounds and with known compositionare designated chemically defined media. These are particularly attractivefor biopharmaceutical production, because they are less vulnerable tocontamination and quality control is easier. Nevertheless, these media canbe expensive.
A complete medium for the culture of animal cells can be considered tohave two distinct parts. The first supplies basic cell needs of nutrients,

salts, and pH control, while the second comprises a set of supplements thatprovide other cell needs, allowing cell growth in the basal medium. Anutrient can be defined as a chemical substance that enters into the cell andis used as a structural component, such as a substrate for cell biosynthesisor energy metabolism, or as a catalyst in metabolic processes. Additionalcompounds required for cell proliferation can be considered as supple-ments, including all undefined additives such as serum and other biologicalfluids.
Media frequently employed in the culture of continuous mammaliancell lines include: Eagle’s medium, MEM (Eagle, 1959); Eagle’s mediummodified by Dulbecco, DMEM (Dulbecco and Freeman, 1959); RPMI1640 medium (Moore et al., 1967); CMRLTM 1066 medium (Parker et al.,1957); and Ham’s F12 medium (Ham, 1965). For the cultivation ofadherent continuous cell lines the following basal media are suitable:CMRLTM 1066, MCDB 411, DMEM. F12, MCDB 301, and IMDM. Fornon-transformed cells, the media DMEM, IMDM, MCDB 104, 105, 202,401, and 501 are suitable (Freshney, 1992). Each of these basal formula-tions may be supplemented with serum or other specific proteins.
For insect cells the following basal media can be used: Grace’s, TC 100,TNM-FH, D22, Schneider, and M3. These media normally require supple-mentation with fetal bovine serum. Alternatively, different serum-freemedia are available for insect cells, such as Sf900II, Ex-Cell
1400, 405, and
420, Express Five1 SFM, Insect-XPRESSTM, HyQ SFX-InsectTM, andIPL 41. These have the advantage of higher reproducibility and lower costwhen compared with serum-supplemented basal media (Ikonomou et al.,2003).
For comparison purposes, Table 5.1 shows the composition of DMEM(one of the most versatile medium formulations, typically employed in theculture of mammalian cells) and Schneider’s medium (used for dipterainsect cells, especially Drosophila melanogaster). A total of 34 differentcomponents are present in DMEM, although some minor variations incomposition may occur between suppliers.
Table 5.1 Composition of minimum Eagles’s medium modified by Dulbec-co, DMEM, used for mammalian cells, and of Schneider’s medium, used in theculture of dipteran cells
Component Concentration in medium(mg/ml)
DMEM Schneider
Amino acidsL-Alanine – 500,0Glycine 30.0 250.0L-Aspartic acid – 400.0L-Glutamic acid – 800.0L-Arginine – 600.0L-Arginine hydrochloride 84.0 –L-Cysteine – 60.0L-Cystine 48.0 –
112 Animal Cell Technology

Table 5.1 (continued)
Component Concentration in medium(mg/ml)
DMEM Schneider
L-Cystine dihydrochloride – 26.7L-Glutamine 584.0 1800.0L-Histidine – 400.0L-Histidine hydrochloride.H2O 42.0 –L-Isoleucine 105.0 150.0L-Leucine 105.0 150.0L-Lysine hydrochloride 146.0 2060.8L-Methionine 30.0 150.0L-Phenylalanine 66.0 –L-Proline – 1700.0L-Serine 42.0 250.0L-Threonine 95.0 350.0L-Tryptophan 16.0 100.0L-Tyrosine 72.0 –L-Tyrosine 2Na – 72.0L-Valine 94.0 300.0VitaminsCholine chloride 4.0 –D-Pantothenate Ca 4.0 –Folic acid 4.0 –i-Inositol 7.2 –Nicotinamide 4.0 –Pyridoxine hydrochloride 4.0 –Riboflavin 0.4 –Thiamine hydrochloride 4.0 –Inorganic saltsCalcium chloride (CaCl2) 200.0 600.0Ferric nitrate (Fe(NO3)3.9H2O) 0.1 –Magnesium sulfate heptahydrate (MgSO4.7H20) 200.0 –Magnesium sulfate – 1810.0Potassium chloride (KCl) 400.0 1600.0Monobasic potassium phosphate (KH2PO4) – 450.0Sodium bicarbonate (NaHCO3) 3700.0 400.0Sodium chloride (NaCl) 6400.0 2100.0Monobasic sodium phosphate monohydrate(NaH2PO4.H2O)
125.0 –
Monobasic sodium phosphate (NaH2PO4) 700.0Other componentsD-Glucose (dextrose) 4500.0 2000.0D-Threalose – 2000.0Phenol red 15.0Sodium pyruvate 110.0Linoleic acid 0.084Fumaric acid – 60.0Æ-Ketoglutaric acid – 350.0Malic acid – 600.0Succinic acid – 60.0Yeast extract – 2000.0
Culture media for animal cells 113

5.2 Main components of animal cell culture media
The culture medium must contain nutrients essential to the synthesis ofnew cells and substrates for accomplishing cell metabolism, besides com-pounds allowing physiological and catalytic functions, or which act ascofactors. To maintain the conditions found in the original tissue fromwhich a particular cell originated, it is necessary for a culture medium tocontain: inorganic salts, sugars, amino acids, vitamins, lipids, organic acids,proteins, hormones, carbon and nitrogen sources, micronutrients (organicions and minerals), and water as well as cell-specific substances. Some-times, blood serum and antibiotics are also required, and in addition, theculture must be kept free from inhibiting or toxic compounds.
Information on animal cell metabolism is essential for the formulationof new culture media, as well as for the composition of the mostappropriate nutrient feed that may be used in various strategies of batch,semi-batch or continuous culture that may be designed for the productionof the targeted protein. As already discussed in detail in Chapter 4 andconcisely presented in Figure 5.1, two fundamental substrates for animalcells are glucose and glutamine.
The following sections will outline the major components of a typicalculture medium for animal cells as well as their typical concentrations andtheir functions in cell metabolism.
5.2.1. Water
One of the basic components of a culture medium, and also one of themost critical, is water. Animal cells are extremely sensitive to water
GlucoseGlucose-6-
phosphatePyruvate Acetyl-CoA
Ribose-5-phosphate
Pentose
Cycle
Nucleic acids
Oxaloacetate
Malate TCA
cycle
Fatty
acids
6-P-Gluconate
Glyceraldehyde
Dihydroxyacetone
Phospholipids
Glutamine
NH4�
NH4�
Glutamate
Alanine
α-Ketoglutarate
Lactate
Asparate
Protein
Nucleic
acid
Figure 5.1
Major pathways for central metabolism in animal cells (based on Shuler and Kargi, 2002).
114 Animal Cell Technology

quality, since this can be the source of contamination that can affect cellgrowth. Potential contaminants include inorganic compounds (heavymetals, iron, calcium, and chloride), organic compounds (detergents),microbial-related contaminants (endotoxins and pyrogens), besides parti-cles and colloids from several different origins. Since the presence of anyof these contaminants can prevent cell culture on any scale, strict puritystandards of water quality must be maintained. Efficient water purificationsystems are, therefore, required, and can be based on multiple-distillationsystems or on equipment combining deionization, microfiltration, andreverse osmosis. The water used in the preparation of industrial culturemedia should be subjected to similar purification methods and should becontinuously monitored to ensure the physicochemical and microbio-logical standards established by national pharmacopoeia. The standardsfor water employed for pharmaceutical use in different countries aredescribed in Table 5.2, both for water for injection (WFI) and for purifiedwater (PW). While PW is used for the preparation of products notrequiring sterile or apyrogenic water, WFI meets the standards for PW aswell as for bacterial endotoxins, conductivity, and total organic carbon.
5.2.2 Glucose
Glucose is usually the main carbohydrate for animal cell growth, acting assource of both carbon and energy (Berdad et al., 1993; Drews et al., 1995;Ohman et al., 1995; Mendonca et al., 1999; Freshney, 2005). Normally,this compound is added to the culture medium in concentrations varyingfrom 5 to 25 mM (0.9–4.5 g/L), but may be up to 56 mM (10 g/l).
Table 5.2. Standards for the quality of purified water (PW) and water for injection (WFI)(Slabicky, 1994)
Parameter Units USA Great Britain Europe Japan
PW WFI PW WFI PW WFI PW WFI
Acidity/alkalinity mg.L–1 1 2 1 2 0.1 0.1Ammonium mg.L–1 0.3 0.3 0.2 0.2 0.2 0.2 0.05 0.1Bacterialendotoxin
EU.L–1 0.25 Pyrogen Pyrogen 0.25
Calcium mg.L–1 0.5 0.5 1 1 1 1Carbon dioxide mg.L–1 4 4Chlorides mg.L–1 0.5 0.5 0.5 0.5 0.5 0.5 0.5 0.5Heavy metals (Pb) mg.L–1 0.5 0.5 1 1 0.1 0.1 1Magnesium mg.L–1 0.6 0.6 0.6 0.6Nitrates (N) mg.L–1 0.2 0.2 0.2 0.2 0.2 0.2Oxidizablesubstances
mg.L–1 5 5 1 0.5 5 10 5
pH 5–7 5–7Sulfates mg.L–1 0.5 0.5 0.5 0.5 0.5 0.5 0.5Total organiccarbon
mg.L–1 0.500
Total solids % 0.001 0.001 0.001 0.003 0.001 0.003 0.001 0.003
PW, purified water; WFI, water for injection; EU, endotoxin units; Pyrogen, pyrogen test (qualitative).
Culture media for animal cells 115

As detailed in Chapter 4, glucose is metabolized mainly throughglycolysis, forming pyruvate, which can be converted to lactate or acetylthat can enter into the citric acid cycle, forming carbon dioxide and water.Lactate accumulation in the culture medium indicates that the citric acidcycle may not function in vitro similarly to the way it does in vivo. Thereis evidence that a significant amount of carbon may be assimilated fromglutamine, and not from glucose, and that explains the large requirementfor this amino acid by some cell types. Insect cells, in general, accumulatelactate at lower levels than mammalian cells. However, lactate can still beproduced by these cells in media with low oxygen concentrations.
The accumulation of lactate in high density cultures is a problem, sinceit causes medium acidification. Also, this compound is toxic to the cells,inhibiting cell growth when present in large concentrations. The substitu-tion of part of the glucose by mannose, fructose, galactose, or maltosereduces glucose consumption rate and, as a consequence, also reduces thelactate formation rate. However, total substitution may affect proteinglycosylation patterns, altering proteins such as antibodies.
5.2.3 Amino acids
Essential amino acids are those not synthesized by the organism and arerequired by animal cells in culture. These include specific amino acids suchas cysteine and tyrosine but the requirement varies between cell lines.Amino acids are necessary for protein, nucleotide, and lipid synthesis and,in addition, may be used as an energy source.
These compounds can be provided as a defined mixture or in the formof protein hydrolysates, such as lactoalbumin, or plant-derived hydroly-sates, like colza (Deparis et al., 2003), soybean (Donaldson and Shuler,1998; Heidemann et al., 2000; Ikonomou et al., 2001), wheat (Heidemannet al., 2000; Ikonomou et al., 2001; Ballez et al., 2004), and rice (Heide-mann et al., 2000; Ikonomou et al., 2001; Ballez et al., 2004). Supplementa-tion with yeast extract also provides additional amino acids.
Traditionally, from 0.1 to 1 mM of each amino acid is added to theculture medium, including both essential and non-essential amino acids.The concentrations of amino acids added to insect cell culture media aremuch higher than those found in media for vertebrate cells (Echalier,1997), probably due to the fact that higher amino acid concentrations arefound in insect hemolymph (insect body fluid) in comparison with bloodserum.
Glutamine, methionine, and serine are growth-limiting amino acids(Freshney, 1992). Glutamine acts as a source of carbon, nitrogen, andenergy, and is normally added to the culture medium at high concentra-tions, varying from 1 to 5 mM. Special attention should be given to itsstability, since glutamine spontaneously degrades by cyclization to pyrro-lidone carboxylic acid in the culture medium. Glutamine is prone tothermal degradation (at 358C, for instance, glutamine is 50% degraded inonly 9 days), and therefore, should be periodically replenished whenrequired. The main metabolite generated from glutamine metabolism isammonium which, similarly to lactate, presents toxic effects and is a cellgrowth inhibitor when accumulated in large quantities. It can be converted
116 Animal Cell Technology

enzymatically to glutamic acid, leucine, and isoleucine by enzymes foundin cells and also in the blood serum normally added to culture media(Freshney, 1992).
5.2.4 Vitamins
Many cells require media supplemented with complex B vitamins, whileother vitamins are presumably supplied by the addition of serum toculture media. Nevertheless, when serum-free media are employed, notonly the water-soluble vitamins should be provided, but also the lipid-soluble ones, such as biotin, folic acid, niacin, panthotenic acid, thiamine,and ascorbic acid, as well as the vitamins B12, A, D, E, and K.
Vitamins are used in very low amounts as enzyme cofactors, essentialfor general cell metabolism. While ascorbic acid acts in collagen synthesis,vitamin A affects cell growth and differentiation. Vitamin K is required forgamma-carboxylation and for correct protein processing. Vitamin E is anantioxidant agent, whereas vitamin D regulates calcium ion transport andacts as a hormone, being toxic when supplied in excess.
Besides serum, yeast extract can also be used as an effective vitaminsupply to culture media.
5.2.5 Salts
The salts most commonly added to the culture medium are Naþ, Kþ,Mg2þ, Ca2þ, Cl –, SO4
2–, PO43–, and HCO3
–. These ions are important inthe maintenance of the ionic balance and osmotic pressure, besides actingas enzymatic cofactors. Salts are the components that contribute most tothe increase in culture medium osmolality. Naþ, Kþ, and Cl– have relevantaction in the regulation of the cellular membrane potential, while SO4
2–,PO4
3–, and HCO3– are important for macromolecular synthesis, as well as
regulators of intracellular charge (Freshney, 2005). In addition, HCO3–
acts in the binding of iron to transferrin and in culture medium buffering.For suspension cultures, the concentration of calcium and magnesium
should be kept low to prevent cell aggregation and adhesion. Other metals,such as iron, manganese, selenium, vanadium, zinc, copper, and molybde-num, are usually added to the culture medium, but at reduced concentra-tions, and mainly if the medium is not supplemented with animal serum.
5.2.6 Serum
Blood serum, usually bovine-derived (calf or fetal bovine), contains aminoacids, growth factors, vitamins, proteins, hormones, lipids, and minerals,among other components, as indicated in Table 5.3. Besides fetal bovineserum, serum from horse (equine), and even from humans (less common)can also be used. The main functions of serum are to stimulate growth andother cellular activities through hormones and growth factors, to increasecellular adhesion through specific proteins, and to supply proteins for thetransport of hormones, minerals, and lipids (Freshney, 2005). Supplemen-tation with bovine fetal serum is performed at concentrations from 2 to20% in volume.
Culture media for animal cells 117

In the case of insect cells, insect hemolymph can be used as analternative to bovine serum. However, the availability of hemolymph ismuch more restricted.
5.2.7 Other components necessary for cell culture
Besides the compounds already mentioned, some adherent cell linesneed proteins of the extracellular matrix (ECM) for efficient adherenceto the support and for cell growth. Many ECM proteins, such asfibronectin, are present in serum, as shown in Table 5.3, while others,such as collagen, are secreted by cells constitutively or after theirstimulation with a growth factor. Another ECM protein, laminin, can
Table 5.3 Serum components and their functions in the animal cells cultured in vitro (adaptedfrom Freshney, 2005)
Component Probable function
ProteinsAlbumin Osmotic control and buffering agent, transport of
lipids, hormones and minerals, mechanicalprotection
Fetuin Cell attachmentFibronectin Cell attachmentÆ2-Macroglobulin Trypsin inhibitorÆ1-Antitrypsin Trypsin inhibitorTransferrin Binds iron
Growth factorsEndothelial growth factor (ECGF) MitogenEpidermal growth factor (EGF) MitogenFibroblast growth factor (FGF) MitogenInsulin-like growth factors (IGF-1 and IGF-2) MitogenPlatelet-derived growth factor (PDGF) Mitogen and major growth factorInterleukin-1 (IL-1) Induces interleukin-2 releaseInterleukin-6 (IL-6) Promotes differentiation
HormonesHydrocortisone Promotes attachment and proliferationInsulin Promotes glucose and amino acids uptakeGrowth hormones Mitogen (present in fetal serum)
Metabolites and nutrientsAmino acids Cellular proliferationGlucose Cellular proliferationKeto-acids (e.g. pyruvate) Cellular proliferationLipids (e.g. cholesterol) Membrane synthesis
MineralsIron, copper, zinc, selenium Enzyme cofactors and constituents
Inhibitorsª-GlobulinBacterial toxins from prior contaminantsChalones (tissue-specific inhibitors)
118 Animal Cell Technology

be used as an alternative to fibronectin, especially for epithelial cellcultures. Growth factors, present in very low amounts, are usually smallpeptides (5–30 kDa). Among them, the following types are prominent:FGF (fibroblast growth factor), EGF (epidermal growth factor), NGF(nerve growth factor), TGF (transforming growth factor), PDGF (plate-let-derived growth factor), the insulin homologous IGF-1 and IGF-2,and interleukins (Jenkins, 1991).
According to Jenkins (1991), the mitogenic factor FGF is isolated frombovine brain in two forms, acid FGF (pI 5.6) and basic FGF (pI . 9.0).These factors bind strongly to heparin. Basic FGF (bFGF) presentsmitogenic action through calcium influx and activation of quinase Cproteins, being a potent mitogenic agent for several types of culturesderived from mesodermal and neuroectodermal cells, as well as forseveral transformed cell lines. This compound also promotes differentia-tion of adipocytes and ovary granulous cells, inducing the synthesis ofECM proteins such as collagen type IV. bFGF has been used to enhancethe survival of new cell lines derived from primary cultures and also toeliminate the use of feeder cells during hybridoma cloning. Feeder cells(such as irradiated fibroblasts or cells from peritoneal exudates) are usedto condition culture media with an undefined mixture of growth-promot-ing substances, particularly when hybridomas are present at low densi-ties.
EGF can be isolated from mouse submaxillary glands and also fromhuman urine. It is a potent mitogenic agent for many primary cultures andfor mesenchymal and epithelial cells, having a synergistic effect with othergrowth factors, such as IGF-1 and TGF�.
NGF is another factor purified from mouse submaxillary glands, and itcan also be obtained from bovine brain and placenta. NGF is not a potentmitogenic agent, but it induces differentiation and increases the survival ofsympathetic neurons and PC12 cells in culture.
The factors TGFÆ and TGF� were initially observed in fibroblastcultures of mouse kidney cells transformed by retrovirus (Sporn et al.,1987). TGFÆ induces cellular growth independently of adhesion, and itsaction is similar to that of EGF (Derynck, 1988). However, several celllines that produce endogenous TGFÆ, like A431, can have their growthinhibited by EGF. TGFÆ is found naturally in embryonic kidney, adultbrain, pituitary gland, skin, and in the placenta.
TGF� is a factor commonly purified from human platelets, whichpredominantly secrete TGF-1 (Jenkins, 1991). The biologically inactiveTGF precursor (220–235 kDa) circulates in the blood as a protein andpossible protease carrier. Most of the mammalian cells in culture secretesmall amounts of TGF� precursor and have TGF� receptors. TGF�promotes growth in several lineages of mesenchymal cells when incombination with TGFÆ or EGF. In contrast, isolated TGF� inhibits thegrowth of many cell lines in monolayer culture, which could result fromits capacity to stimulate the secretion of ECM proteins (collagen, fibronec-tin, and glucosaminoglycans) and protease inhibitors (Moses et al., 1987).The inhibition of monolayer growth by TGF is more prominent inepithelial cells, endothelial cells (antagonized by the bFGF), stem cells,and lymphocytes.
Culture media for animal cells 119

PDGF is one of the most common serum components (40–60 ng/ml). Itis also secreted by endothelial and placenta cells, and by several cell linessuch as BHK and 3T3-fibroblasts. PDGF has synergetic action with EGFand IGF-1 and is a potent mitogen.
Another fundamental compound for cellular growth is insulin, whichpresents weak affinity to IGF-1 receptors. Insulin can activate severalmitogenic responses, through IGF-1 receptors when in large doses. How-ever, insulin is also added to most serum-free media due to its ability topromote anabolic metabolism, such as oxidation processes, glycogensynthesis, and amino acids transport (Jenkins, 1991).
Peptides homologous to insulin can also act as growth factors, such assomatomedin-C (Daughaday and Rotwein, 1989). IGF-1, secreted in smallamounts by many tissues, acts on several mesenchymal cells, while IGF-2,produced by fetal liver, muscle, skin, and adult brain, is known for itsgrowth stimulatory activity.
Some cells, such as hybridomas, stem, and hematopoietic cells mayrequire a class of proteins known as interleukins, especially IL-6. Thiscompound can substitute for feeder cells (such as those of the peritonealexudates or spleen, fibroblasts or timocytes) in the post-fusion stage ofhybridoma cultures. IL-6 is secreted by monocytes, T lymphocytes, andendothelial cells and is effective in the stimulation of hybridomas ofdifferent species, including lineages that are difficult to cultivate, such ashuman–mouse and rat–mouse hybrids. IL-6 also presents a synergisticeffect with other interleukins to increase antibody production.
Some growth factors act as carrier proteins in the culture medium. Theseproteins can serve as carriers in lipid transport (as in the case of thealbumin) or for metal ion transfer to cells (such as transferrin). Albumincan act as a buffering or a detoxifying agent (due to its binding toendotoxin and pyrogens), as well as serving as a carrier for vitamins,hormones, or other micronutrients. Transferrin, on the other hand, is aprotein with a large capacity as an iron carrier. Many mammalian cellspossess transferrin-specific receptors which capture transferrin/Fe3þ com-plexes.
Lipids also can be beneficial for cells in culture, since some substancesabsorbed by the cells need to be solubilized in lipids, or in some cases thetoxicity of compounds may be reduced by complexation with lipids. Theabsence of essential lipids such as linoleic acid, lecithin, cholesterol,ethanolamine, or phosphorylcholine can result in the decrease of cloningefficiency and in reduction in the size of colonies, as shown for insect cellsby Echalier (1997). However, one of the difficulties in supplying lipids atreasonable concentrations is their low solubility. To circumvent thislimitation, lipids can be emulsified with complexing agents such asPluronic
1F68 or cyclodextrin (Maiorella et al., 1998).
Antibiotics such as penicillin, streptomycin, and amphotericin B canalso be added to the culture medium to prevent microbial growth. How-ever, their use should be kept to a minimum level, because some antibioticscan have cytotoxic effect, even when high serum concentrations are used.Besides, the continuous use of antibiotics can result in the selection ofresistant microorganisms, inducing a chronic contamination of the culture(Freshney, 1992).
120 Animal Cell Technology

5.3 Advantages and limitations of the use of mediasupplemented with animal serum
As already mentioned, the most frequently employed serum in animal cellculture is bovine fetal serum; however, sera of calves, horses, and evenhuman sera are also used. Proteins of the human plasma are obtained insubstantial amounts as a result of routine therapeutic production of bloodproducts. In these conditions, large amounts of albumin, transferrin andinsulin, as well as growth factors, can be obtained. The fractions with notherapeutic application are usually discarded, but they can be processedwith the purpose of supplementing low protein media, as a direct substi-tute for bovine fetal serum, allowing the growth of a wide range of cells.To use these proteins, cell adaptation to the medium containing the newproducts is necessary, and this process can take several weeks. In addition,limitations such as the possibility of introduction of human pathogens inthe culture should be considered.
Fetal bovine serum is the favorite because it presents low immuno-globulin and high growth factor concentrations. Its main advantage is thatit allows the same medium to culture different cell lines. For production,the blood of bovine fetuses is collected by heart puncture and, after slowcoagulation, it is centrifuged, resulting in the serum in the supernatant.The entire process should be performed at low temperatures, and theanimals should be free from infectious diseases, such as rinderpest, foot-and-mouth (aftosa), and bovine spongiform encephalopathy (‘‘mad cowdisease’’). Fetal bovine serum is scarce since, on average only 7–9% ofslaughtered animals are estimated to be pregnant and each fetus suppliesfrom 0.2 to 0.5 l of blood with only half the volume becoming serum.Thus, around 44–144 animals have to be slaughtered to obtain 1 l of fetalbovine serum. Beside the low process yield, there is also an ethical aspect.The animals can suffer if at the moment of blood collection their lungs areinsufflated with air, increasing the oxygen blood concentration to levelscompatible with animal consciousness (Van der Valk et al., 2004).
In addition to the factors that increase cellular adhesion and the nutri-tional factors, serum also presents culture-stimulating (growth factors,hormones and proteins) and protecting agents, both for biological protec-tion (antitoxin, antioxidant, antiprotease) and for prevention of mechanicaldamage. However, fetal serum is one of the most expensive components inculture medium. In addition, serum supplementation can significantlyincrease the complexity and the cost of the targeted product recovery andpurification process due to the presence of many proteins and growthfactors, among other components, most of them undefined. Bovine fetalserum can contain more than 1000 different components.
Another factor to be taken into account when using animal serum is thepotential risk for human health, due to the possible presence of adventi-tious agents, such as virus and proteins as prions. In addition, serum cancontain contaminants such as bacteria, fungi, and mycoplasmas (smallbacteria without cellular walls), which can negatively affect cell culture.
Another strong limitation to the use of bovine fetal serum is itsvariability between different lots and suppliers, which hinders the standar-dization of the culture medium and the reproducibility of culture perform-
Culture media for animal cells 121

ance. Since several animal cell lines can grow in serum-free media, or inmedia supplemented with certain components found in bovine fetal serum,as part of good practice for cell cultivation, the use of bovine fetal serumshould be avoided (Van Valk et al., 2004).
Within the last few years there has been a strong recommendation fromregulatory agencies such as the FDA (Food and Drug Administration,USA), not to use animal-derived components in media formulation for theproduction of biopharmaceuticals and other compounds destined fortherapeutic application in humans.
5.4 Strategies to formulate serum-free culture media
The first culture medium with a defined composition was developed in the1950s. In 1959, Eagle developed the ‘‘minimal essential medium’’ formammalian cell culture, composed of glucose, amino acids, vitamins, and asolution of balanced salts. In 1962 Grace accomplished the same with aculture medium for insect cells (Grace, 1962). Within the last 50 yearsthere has been considerable work in the search for more efficient culturemedia or to meet the specific needs of some cell lines. Such media werealways based on minimal formulations supplemented with fetal serum,which as previously discussed, acts as a source of enzymes, hormones, andmicroelements necessary for cell growth. However, since adding serumhas many disadvantages, the development of serum-free media with adefined composition has intensified in recent years. Formulating mediumfor animal cells requires an evaluation of the effect of each constituent sothat the optimal composition is attained.
Any new formulation may be evaluated against the properties of aserum-substituted medium for growth and productivity. As well asgrowth promotion, a serum supplement in medium may also lead to areduction in cell death by apoptosis and this allows extended culturelongevity. This can enable a substantial increase in recombinant proteinproductivity.
In a multi-component system such as the cell environment, many factorsare interconnected, and a specific compound may be essential in some butnot all situations. Although an initial medium formulation is often basedon the composition of the circulating fluid of the organism, some nutrientsessential for metabolic activity in tissues and organs may be completelyunnecessary for in vitro cell proliferation.
One approach to developing a medium with a defined composition is toidentify the existing elements in fetal serum that have a positive effect incell culture. Serum may then be substituted by adding specific componentswith similar functions, based on the effect of each supplement on cellgrowth (Barnes and Sato, 1979, 1980; Barnes et al., 1984a, 1984b, 1984c,1984d; Taub and Livingston, 1981). To determine the importance of aspecific component, cultures can be monitored with or without its pre-sence at quantities normally found under physiological conditions. After-wards, the concentrations can be varied and the effect of each specificcomponent can be optimized.
122 Animal Cell Technology

The key strategy when a new medium is developed is to reproduce themetabolic conditions of the cells when in vivo. Therefore, when addingmedia components it is important to maintain the pH, redox potential, andosmolality constant, as well as attempting to avoid generation of metaboliccompounds that are toxic or growth inhibitory, such as lactate and/orammonium. Apart from purely nutritional factors, it is important todevelop a medium that is stable under normal storage conditions or incontact with light.
Currently, due to the wide use of cell culture in the biopharmaceutical,therapeutic, and diagnostic areas, the development of new media has beencritical, in an attempt to minimize the number of components, maximizingefficiency, or simplifying the purification processes. Thus, media withmany characteristics and distinct functions have been developed.
In the development of an alternative culture medium for a given cellline, it must be ensured that the components not being studied areprovided in sufficient quantity, such as oxygen, which can behave as alimiting substrate in some situations. The assessment of cellular perform-ance in different culture media is usually challenging and time-consuming,since it requires establishment of the concentration of total and viablecells, over multiple passages. In addition it may involve the quantificationof residual nutrients, such as glucose and glutamine, of metabolic bypro-ducts, such as lactate, ammonium and alanine, and the concentration of thetarget product. Equally relevant is the use of cellular inoculum of appro-priate age and concentration. One of the greatest difficulties is to design aculture medium that ensures replicate cultures that show stable genetic,metabolic, and kinetic behavior.
Among the strategies used to establish new formulations are: univariateanalysis (where the effect of only one component is studied at a time),analysis of the effect of a group of nutrients, and statistical design ofexperiments.
The strategy of statistical design of experiments (Barros Neto et al.,1995; Rodrigues and Iemma, 2005) appears to be a rational and efficientway for a direct and quick determination of the effect and interactionamong the parameters analyzed (Montgomery and Runger, 1999). Thistype of procedure results in the minimization of cost and time. Thisstrategy has proved to be adequate to qualitatively analyze the effects ofthe use of protein hydrolysates as supplements for insect cell cultivation(Ikonomou et al., 2001; Batista et al., 2005).
The new media that are commercially available possess many distinctcharacteristics; some are completely free of animal-derived components,others are serum-free, sometimes requiring addition of some proteinfraction or containing a discrete quantity of proteins. Another class isprotein-free media, which can include components derived from animals,plants, or yeast hydrolysates. In some cases, the development of novelmedia is unnecessary, as it is sufficient to supplement basal medium with afew known specific components. It is emphasized that the final osmolalityof the formulated medium should be compatible with cellular tolerance, asdiscussed in Chapter 2.
Protein hydrolysates may provide an alternative to a serum supplement.Such hydrolysates contain oligopeptides, peptides, and amino acids ob-
Culture media for animal cells 123

tained by chemical or enzymatic hydrolysis of caseins, plants, animaltissues, or yeast (Ikonomou et al., 2003). Some of the most commonlyused hydrolysates are bacto-peptone (Keay, 1976), proteose peptone(Hasegawa et al., 1988), and Primatone
1RL (Mizrahi, 1977; Schlaeger
et al., 1993; Schlaeger, 1996). Primatone1
RL, a commercially availablemeat digest, is a low-cost supplement that serves as a source of aminoacids, oligopeptides, iron salts, lipids, and traces of other low molar masssubstances.
Recently, plant hydrolysates have also been tested as additives forserum-free culture media (Donaldson and Shuler, 1998; Franek et al.,2000; Heidemann et al., 2000). Donaldson and Shuler (1998) demonstratedthat a peptide obtained from soy hydrolysate (Hy-Soy
1) played an
important role in a serum-free medium developed for insect cells. Ikono-mou et al. (2003) also showed the effectiveness of culture mediumsupplemented with the soy hydrolysate SE50MAF in the growth of HighFiveTM cells.
Further than providing nutrients, these hydrolysates may play anessential role in providing growth factors, antiapoptotic factors, or proteinproduction stimulators in serum-free cultures (Ikonomou et al., 2003).
As well as these hydrolysates, other supplements can also totally orpartially substitute serum, such as yeast extract (Drews et al., 1995; Wuand Lee, 1998; Wu et al., 1998; Ikonomou et al., 2001, 2003; Sung et al.,2004; Batista et al., 2005, Mendonca et al., 2007) and peptides obtainedfrom insect hemolymph (Maranga et al., 2003; Souza et al., 2005). Whileyeast extract is mainly used as a source of vitamins (Mitsuhashi, 1989),stimulating cell growth, the peptides obtained from insect hemolymphhave a potent effect in inhibiting apoptosis and positive activity in cellgrowth and in producing recombinant proteins (Maranga et al., 2003).
Some cell lines, such as Namalwa, can grow satisfactorily in medium inwhich the only protein is albumin. Other cell lines show distinct proteinrequirements, such as albumin, transferrin, and insulin, or the addition ofpolypeptide growth factors, isolated from non-serum sources that haveshown stimulation of many cell types in culture. Some cells have veryfastidious growth requirements and their stability and productivity maybe reduced significantly in serum-free media.
The chemically defined media, that is, those that may contain a specificprotein or a specific animal extract compound, as long as they are purifiedand have known concentration of all components, are ideal to eliminateproduction variability, increasing reproducibility, facilitating and reducingthe costs of protein purification, and eliminating the potential risk ofpathogenic agent transmission. Many components of animal origin thatare necessary for cell growth can be substituted by bioactive syntheticchemical products or by compounds originating from microbial fermenta-tion. The formulation of chemically defined media can allow more in-depth studies, especially metabolic and regulation studies, as well as thefact that their use can facilitate approval of products derived from animalcells by the regulatory agencies.
Despite all the development seen, up to the present time there is nostandard culture medium that could be universally utilized for all cells,since each cell line has a specific metabolic profile and requires an
124 Animal Cell Technology

appropriate medium composition. The most difficult part of the mediumdevelopment process is to predict exactly which supplement or set ofsupplements will be necessary for each cell line. Nevertheless, usefulinformation can be obtained from work on cell lines of the same origin.Recent advances in cellular biology and molecular genetics have allowedthe development of new cell lines and this has intensified the demand fornew culture media.
Generally, in terms of the growth factor requirements, cells can beclassified in four categories, as discussed below (Jenkins, 1991). In the firstcategory are the transformed cell lineages, such as CHO, BHK, melanoma,hybridoma, and myeloma cells, which go through the cell cycle, onlyneeding some maintenance factors. Normally, these cells need insulin(5 �g/ml), serum albumin, lipid- and vitamin-carrying proteins, transferrin(5 �g/ml for iron transport), and microelements (Jenkins, 1991).
The second category includes mesenchymal cells, such as fibroblasts(BALB/c 3T3, Swiss 3T3), adipocytes, endothelial cells, smooth thinmuscle cells, and neuroectodermic cells (such as glia cells). Most of thesecells need maintenance factors. Some cells, such as the NIH-3T3, can growin a serum-free medium containing minimal medium supplemented withtransferrin (25 �g/ml), insulin (10 �g/ml), EGF (100 ng/ml), bFGF (100ng/ml), and PDGF (0.5 U/ml).
The cells from the third category, such as epithelial cells isolated frommammal glands, testes, ovaries, pituitary gland, prostate, and from oculartissue, generally proliferate with more difficulty in a defined medium.Besides maintenance factors, these cells may also need proteins from theECM to promote their adhesion. Those proteins can be collagen, fibronec-tin, or laminin. Non-peptide factors, such as retinol (50 ng/ml) andcorticosteroids (10–100 ng/ml), may also be necessary.
Finally, in the fourth and last category are certain types of cells (PC12,hybridomas, and hepatic cells) that may also need factors such as NGF,IL-6, and growth hormones.
When preparing a new medium the need for cell adaptation should beconsidered. The adjustment process for low protein media is often carriedout in static cultures employing tissue culture flasks. However, problemsseen at the time of adaptation can be minimized in suspension cultures,since this allows subculture during the log growth phase. Cultures insuspension also allow better medium oxygenation. However, under anycondition and with any medium, there will always be a need for some celladaptation to the new medium to stabilize cellular replication. As soon asa cell population is adapted for growth in a low protein medium, it isrecommended that a cell bank is established.
References
Ballez JS, Mols J, Burteau CC, Agathos SN, Schneider YJ (2004), Plant proteinhydrolysates support CHO-320 cells proliferation and recombinant interferon-gamma production in suspension and inside microcarriers in protein-free media,Cytotechnology 44:103–114.
Barnes D, Sato G (1979), Growth of a mammary tumor cell line in a serum-freemedium, Nature 281:388–389.
Culture media for animal cells 125

Barnes D, Sato G (1980), Methods for growth of cultured cells in serum-free medium,Anal. Biochem. 102:255–270.
Barnes DW, Sirbasku DA, Sato GH (1984a), Methods for Preparation of Media,Supplements, and Substrata for Serum-free Animal Cell Culture, Alan R Liss,New York, p. 355.
Barnes DW, Sirbasku DA, Sato GH (1984b), Methods for Serum-free Culture of Cellsof the Endocrine Systems, Alan R Liss, New York, p. 255.
Barnes DW, Sirbasku DA, Sato GH (1984c), Methods for Serum-free Culture ofNeuronal and Lymphoid Cells, Alan R Liss, New York, p. 263.
Barnes DW, Sirbasku DA, Sato GH (1984d), Methods for Serum-free Culture ofEpithelial and Fibroblastic Cells, Alan R Liss, New York, p. 291.
Barros Neto B, Scarminio IS, Bruns RE (1995), Planejamento e Otimizacao deExperimentos, 2nd Ed., Editora da UNICAMP.
Batista FRX, Pereira CA, Mendonca RZ, Moraes AM (2005), Enhancement of Sf9 cellsand baculovirus production employing Grace’s medium supplemented with milkwhey ultrafiltrate, Cytotechnology 49:1–9.
Berdad C, Tom R, Kamem A (1993), Growth, nutrient consumption, and end productaccumulation in Sf9 and BTI-EAA insect cell cultures: insights into growthlimitation and metabolism, Biotechnol. Prog. 9:615–624.
Daughaday WH, Rotwein P (1989), Insulin-like growth factors I and II. Peptide,messenger ribonucleic acid and gene structures, serum, and tissue concentrations,Endocr. Rev. 10:68–91.
Deparis V, Durrieu C, Schweizer M, Marc I, Goergen Jl, Chevalot I, Marc A (2003),Promoting effect of rapeseed proteins and peptides on Sf9 insect cell growth,Cytotechnology 42:75–85.
Derynck R (1988), Transforming growth factor alpha, Cell 54:593–595.Donaldson MS, Shuler ML (1998), Low-cost serum-free medium for the BTI-Tn5B1-4
insect cell line, Biotechnol. Prog. 14:573–579.Drews M, Paalme T, Vilu R (1995), The growth and nutrient utilization of the insect
cell line Spodoptera frugiperda Sf9 in batch and continuous culture, J. Biotechnol.40:187–198.
Dulbecco R, Freeman G (1959), Plaque production by the polyoma virus, Virology8:396–397.
Eagle H (1959), Amino acid metabolism in mammalian cell cultures, Science 130:432–437.
Echalier G (1997), Drosophila cells in Culture, Academic Press, New York.Franek F, Hohenwarter O, Katinger H (2000), Plant protein hydrolysates: preparation
of defined peptide fractions promoting growth and production in animal cellcultures, Biotechnol. Prog. 16:688–692.
Freshney RI (1992), Animal Cell Culture – A Practical Approach, 2nd Ed., IRL Press,Oxford.
Freshney RI (2005), Culture of Animal Cells. A Manual of Basic Technique, 5th.Ed.,John Wiley & Sons, Hoboken.
Grace TDC (1962), Establishment of four strains of cells from insect tissues grown invitro, Nature 195:788–789.
Ham RG (1965), Clonal growth of mammalian cells in a chemically defined syntheticmedium, Proc. Natl Acad. Sci. U S A 53:288.
Hasegawa A, Yamashita H, Kondo S, Kiyota T, Hayashi H, Yoshizaki H, MurakamiA, Shiratsuchi M, Mori T (1988), Proteose peptone enhances production of tissue-type plasminogen activator from human diploid fibroblasts, Biochem. Biophys.Res. Commun. 150:1230–1236.
Heidemann R, Zhang C, Qi H, Rule JL, Rozales C, Park S, Chuppa S, Ray M,Michales J, Konstantinov K, Naveh D (2000), The use of peptones as mediumadditives for the production of a recombinant therapeutic protein in high density
126 Animal Cell Technology

perfusion cultures of mammalian cells, Cytotechnology 32:157–167.Ikonomou L, Bastin G, Schneider YJ, Agathos SN (2001), Design of an efficient
medium for insect cell growth and recombinant protein production, In Vitro Cell.Dev. Biol. Anim. 37:549–559.
Ikonomou L, Schneider YJ, Agathos SN (2003), Insect cell culture for industrialproduction of recombinant proteins, Appl. Microbiol. Biotechnol. 62:1–20.
Jenkins N (1991), Growth factors. In: Butler M (Ed.), Mammalian Cell Biotechnology,A Practical Approach, 1st Ed., IRL Press, Oxford, pp. 39–55.
Keay L (1976) Autoclavable low cost serum-free cell culture media: the growth ofestablished cell lines and production of viruses, Biotechnol. Bioeng. 18:363–382.
Maiorella B, Inlow D, Shauger A, Harano D (1998), Large-scale insect cell-culture forrecombinant protein production, Bio/Technology 6:1406–1410.
Maranga L, Mendonca RZ, Bengala A, Peixoto CC, Moraes RHP, Pereira CA,Carrondo MJT (2003), Enhancement of Sf-9 cell growth and longevity throughsupplementation of culture medium with hemolymph, Biotechnol. Prog. 19:58–63.
Mendonca RZ, Palomares LA., Ramırez OT (1999), An insight into insect cellmetabolism through selective nutrient manipulation, J. Biotechnol. 72:61–75.
Mendonca RZ, de Oliveira E C, Pereira CA, Lebrun I (2007), Effect of bioactivepeptides isolated from yeastolate, lactalbumin and NZCase in the insect cellgrowth, Bioprocess Biosyst. Eng. 30:157–164.
Mitsuhashi J (1989), Nutritional requirements of insect cells in vitro, In: Mitsuhashi J(Ed.), Invertebrate Cell System Applications, CRC Press, Boca Raton, pp. 3–20.
Mizrahi A (1977), Primatone1
RL in mammalian cell culture media, Biotechnol.Bioeng. 19:1557–1561.
Montgomery DC, Runger GC (1999), Applied Statistics and Probability for Engineers,2nd Ed., Wiley, New York.
Moore GE, Gerner RE, Franklin HA (1967), Culture of normal human leukocytes, J.Am. Med. Assoc. 199:519–524.
Moses HL, Coffey RJ Jr, Leof EB, Lyons RM, Keski-Oja J (1987), Transforminggrowth factor beta regulation of cell proliferation, J. Cell Physiol. Suppl., Suppl.5:1–7.
Ohman L, Ljunggren J, Haggstrom L (1995), Induction of a metabolic switch in insectcell by substrate-limited fed batch cultures, Appl. Microbiol. Biotechnol.43:1006–1013.
Parker RC, Castor LN, McCulloch EA (1957), Altered cell strains in continuousculture, Special Publications NY Acad. Sci. 5:303–313.
Rodrigues MI, Iemma AF (2005), Planejamento de Experimentos e Otimizacao deProcessos: uma Estrategia Sequencial de Planejamentos, 1st ed., Editora Casa doPao, Campinas.
Schlaeger EJ, Foggetta M, Vonach JM, Christensen K (1993), SF-1 a low cost culturemedium for the production of recombinant proteins in baculovirus infected insectcells, Biotechnol. Tech. 7:183–188.
Schlaeger EJ (1996), The protein hydrolysate, Primatone1
RL, is a cost-effectivemultiple growth promoter of mammalian cell culture in serum-containing andserum-free media and displays anti-apoptosis properties, J. Immunol. Methods194: 191–199.
Shuler ML, Kargi F (2002), Bioprocess Engineering – Basic Concepts, 2nd Ed.,Prentice Hall PTR, Upper Saddle River.
Slabicky R (1994), Pharmaceutical water systems: design and validation. In: LydersenBK, D’Elia NA, Nelson KL (Eds), Bioprocess Engineering: Systems, Equipmentand Facilities, John Wiley & Sons, New York, pp. 525–573.
Souza APB, Peixoto CC, Maranga L, Carvalhal AV, Moraes RHP, Mendonca RZM,Pereira CA, Carrondo MJT, Mendonca RZ (2005), Purification and characteriza-
Culture media for animal cells 127

tion of an anti-apoptotic protein isolated from Lonomia obliqua hemolymph,Biotechnol. Prog. 21:99–105.
Sporn MB, Roberts A, Wakefield LM, Crombrugghe (1987), Some recent advances inthe chemistry and biology of transforming growth factor-beta, J. Cell. Biol.105:1039–45.
Sung YH, Lim SW, Chung JY, Lee GM (2004), Yeast hydrolysate as a low-costadditive to serum-free medium for the production of human thrombopoietin insuspension cultures of Chinese hamster ovary cells, Appl. Microbiol. Biotechnol.63:527–536.
Taub N, Livingston D (1981), The development of serum-free hormone-supplementedmedia for primary kidney cultures and their use in examining renal functions,Ann. N Y Acad. Sci. 372:406–21.
Van der Valk J, Mellor D, Brands R, Fischer R, Gruber F, Gstraunthaler G,Hellebrekers L, Hyllner J, Jonker FH, Prieto P, Thalen M, Baumans V (2004),The humane collection of fetal bovine serum and possibilities for serum-free celland tissue culture, Toxicol. Vitro 18:1–12.
Wu J, Lee KD (1998), Growth promotion by yeastolate and related components oninsect cells, Biotechnol. Tech. 12:67–70.
Wu J, Ruan Q, Peter Lam HY (1998), Evaluation of spent medium recycle and nutrientfeeding strategies for recombinant protein production in the insect cell-baculo-virus process, J. Biotechnol. 66:109–116.
128 Animal Cell Technology

6Post-translationalmodification ofrecombinant proteinsMichael Butler
6.1 Introduction
Many proteins require post-translational modifications to insure the fullbiological activity that is essential for their use as efficacious biopharma-ceuticals. The most widely recognized form of post-translational modifica-tion is glycosylation that requires an extensive sequence of processing andtrimming events in the endoplasmic reticulum (ER) and Golgi apparatus.Because eukaryotic cells have the metabolic capability for these types ofmodifications they have become the host cells used in biopharmaceuticalprocesses. More specifically, mammalian cells (particularly the hamsterBHK and CHO cells) have become the host cells of choice because theglycosylation patterns generated from these cells are most similar toequivalent human patterns. Most therapeutic proteins are glycoproteinsthat have an extensive heterogeneity of glycoforms arising from incom-plete glycosylation processes.
Although glycosylation is the most extensive and widely studied formof post-translational modification, there are other modifications that areequally important for the activity of specific proteins. The blood clottingfactor, factor X, is a good example to illustrate a range of post-translationalmodifications on a single complex protein. The recognized modificationsnecessary to ensure bioactivity of this factor include: removal of signalsequences, formation of disulfide bonds, gamma-carboxylation of glutamicacid residues, modification of aspartate to beta-hydroxyaspartate, N- andO-glycosylation, removal of an internal tripeptide, and removal of apropeptide (Camire et al., 2000). In order to express this protein as arecombinant form in a cell culture bioprocess, it is necessary to insure thatthe host cell has the appropriate metabolic capabilities for efficient post-translational modification and also to insure that the culture conditions aresuitable to drive the metabolism to high productivity of the active protein.
This chapter describes some of the most important and well-studiedforms of post-translational modifications of proteins, which have beenassociated with the production of glycoproteins as biopharmaceuticalsfrom mammalian cell culture systems. Most attention is given to glycosy-lation because of its general importance for the activity of all these

proteins. However, other modifications are also described and related tothe production of specific proteins.
6.2 Glycan structures attached to proteins
Carbohydrate chains when attached to other molecules are known asglycans. In proteins the glycans can be attached to asparagine residuesforming N-glycans or to serine or threonine residues forming O-glycans.
6.2.1 N-glycans
This is the most widely studied structural form of glycosylation and hasthe greatest effect on overall protein structure and function (Kornfeld andKornfeld, 1985; Spellman, 1990). The glycan consists of a core pentasac-charide (Man3GlcNAc2) attached via an N-glycosidic bond to an Asnresidue of a consensus amino acid sequence (sequon) Asn-X-Ser/Thr,where X can be any amino acid except proline (Figure 6.1).
The full sequence of reactions involved in the synthesis of the N-glycansin mammalian cells is shown in Figure 6.2. The precursor for glycosylationis the oligosaccharide (Glc3Man9GlcNAc2), which is formed by the step-wise addition of monosaccharides from nucleotide sugars (UDP-GlcNAcand GDP-Man) or lipid intermediates (Dol-P-Man and Dol-P-Glc)to a dolichol-linked pyrophosphate acceptor to form the complex:Glc3Man9GlcNAc2-P-P-dolichol. The 14-mer oligosaccharide is trans-ferred to the consensus sequence (Asn-X-Ser/Thr) on the growing peptidevia the complex reaction of the oligosaccharyltransferase (OST) enzyme,which is thought to be approximately 65 amino acid residues from theribosome P-site (Yan and Lennarz, 2005). Further processing by trimmingof the attached glycan occurs by glucosidases and mannosidases that are
Asn
Mannose
GlcNAcSequon Asn-X-Ser/Thr�
Figure 6.1
Core N-glycan structure. This consists of a core pentasaccharide composed of atrimannosyl group attached to two Glc-NAc residues. The structure is attached toan asparagine (Asn) residue in a sequon which is an amino acid motif of threeamino acids. X is any amino acid (except Pro) that is positioned between Asn andeither serine or threonine.
130 Animal Cell Technology

located within the membrane of the ER. Trimming is initiated by Æ-1,2glucosidase I (Gluc I) which removes the terminal glucose. The next twoglucose residues are then removed sequentially by a single Æ-1,3 glucosi-dase II (Gluc II). At least one mannose residue may then be removed bymannosidase I (Man I) before the newly synthesized glycoprotein istransported to the Golgi cisternae by means of vesicles. This sequentialprocess of trimming in the ER will only occur efficiently if the proteinassumes an appropriate folding pattern and so the process has beenthought of as a quality control mechanism required for the formation ofthe protein tertiary structure (Ellgaard and Helenius, 2003).
The core structure may be processed further to a complex-type glycanwith the sequential addition of monosaccharides such as GlcNAc, galac-tose, fucose, and sialic acid through a series of transferases that are presentin the Golgi. In mammalian cells high-mannose glycan structures areproduced as intermediates in the formation of complex glycans (Figure6.3). These may have two to six additional mannose structures attached tothe core as a result of processing in the ER prior to translocation to the
Asn Xaa Ser/ThrDol
P
P
NH2
Golgi
Hybrid
type
Man
Complex
type
Oligosaccharide
transferase
Glc
GlcGlc
Endoplasmic
reticulum
α-Glc I α-Glc II α-Glc II α-Man I
Man
Oligomannose
type
GnTISialT
FucT
GalT GnTII Man II
Figure 6.2
N-linked glycosylation pathway. The addition of a 14mer oligosaccharide to an N-glycan sequonoccurs co-translationally in the endoplasmic reticulum. This is followed by a series of trimmingreactions to remove glucose and mannose residues. In animal cells the glycan structures withexposed mannose groups and attached to newly synthesised proteins are transferred to the Golgi forfurther processing. A series of transferase enzymes ensures the addition of N-acetylglucosamine,fucose, galactose, and sialic acids. The transferase reactions form a metabolic network resulting in avariety of end products, which account for the variable glycoforms found in proteins.
Post-translational modification of recombinant proteins 131

Golgi. However, in lower eukaryotes such as fungi and yeast the high-mannose structures are released from the cell as end products of glycosyla-tion (Meynial-Salles and Combes, 1996).
There is a great deal of variability of N-glycan structures attached toany protein. This arises through macroheterogeneity, which is defined asvariable occupancy of potential sites of attachment and microheterogene-ity, which is defined as variable structural forms at each site.
6.2.1.1 Macroheterogeneity
The occupation of a sequon occurs cotranslationally in the ER andinvolves the transfer of a consensus oligosaccharide structure(Glc3Man9GlcNAc2) from a dolichol-linked pyrophosphate donor to theAsn side chain of an available sequon. Only around 65% of all appropriateglycoprotein sequons are occupied and the oligosaccharyl transfer reactionappears to depend upon various cellular factors including the proteintranslation rate, the availability of the oligosaccharyl donor, and theactivity of the enzyme. Petrescu et al., (2004) surveyed the occupation ofsequons on several thousand proteins and found a significantly largenumber of occupied glycans that have low accessibility in the foldedprotein. Although this may seem surprising, it must be realized thatprotein glycosylation precedes folding and so the inaccessibility of asequon in the fully folded protein does not mean that it is necessarilyinaccessible to the OST enzyme. The glycans may play a part in maintain-ing the folded structure by reducing the conformational freedom of thelocal peptide backbone (Petrescu et al., 2004). However, disulfide bridge
Asn
Asn
Asn
Complex
Hybrid
High mannose
� Fuc
� GlcNAc
� Man
� Gal
� NeuAc
Figure 6.3
N-glycan structures of glycoproteins. There are three main types of glycanstructure, which are built on the core structure. The high mannose structures arethe main type of structures found in fungi. In animal cells these are generallyintermediates that are transferred to the Golgi for further processing. The complexglycans consist of a variety of structures added in sequence to the trimannosylcore. The hybrid structures consist of at least one antenna from the trimannosylcore with a complex structure and one with a high mannose structure.
132 Animal Cell Technology

formation is also co-translational in the ER and may interfere with theaccessibility of some sequons, leaving them unoccupied. For some proteinssuch as tissue-type plasminogen activator (tPA) this may lead to variableoccupancy of a specific site and macroheterogeneity of glycoforms (Allenet al., 1995).
A further consideration is the position of the sequon in relation to theprimary structure of the protein. Statistical analysis of a large number ofglycoproteins has indicated that the frequency of non-glycosylated se-quons increases toward the C-terminus (Gavel and von Heijne, 1990). Thecritical distance appears to be 60 amino acid residues from the C-terminuswhen reduced glycan occupation occurs. This distance corresponds to thedistance between the ribosome P-site and the active site of the OST and ithas been hypothesized that the protein chain is not available for N-glycanattachment once it is released from the ribosome. However, this phenom-enon of poor glycosylation efficiency toward the C-terminus does notappear to be universal for all proteins (Walmsley and Hooper, 2003).
6.2.1.2 Microheterogeneity
The transferase reactions in the Golgi do not always go to completion andso give rise to heterogeneity of the final glycan structure (microhetero-geneity). This heterogeneity is evident as variable antennarity, with thenumber of branches from the central mannose of the core structureranging typically between two (biantennary) and four (tetra-antennary).Terminal sialylation of the antenna, fucosylation of the innermost coreGlcNAc (proximal) or the outer arm GlcNAc (peripheral), and additionof a ‘‘bisecting’’ GlcNAc to the central core Man residue are also examplesof glycan processing that is variable and may be incomplete in the Golgi.
A diverse range of glycan forms may be produced in some recombinantproteins. For example, the HIV envelope glycoprotein (gp120) producedfrom CHO cells contains 24 occupied sequons, of which 13 are complexglycans and 11 are high mannose or hybrid structural forms (Leonardet al., 1990).
6.2.2 O-linked glycans
Although most attention has been focused on N-linked glycosylation ofproteins, O-linked glycans are smaller structurally but equally ubiquitousamong eukaryotic glycoproteins. The most common form of O-glycanattached to glycoproteins from mammalian cells is the mucin-type, whichinvolves the addition of N-acetylgalactosamine to a serine or threonineresidue in a protein. The O-glycan is added post-translationally to thefully folded protein. No consensus sequence has been identified, althoughglycosylation often occurs in a region of the protein that contains a highproportion of serine, threonine, and proline (Van den Steen et al., 1998).These residues probably enable the region of the protein to assume aconformation that is accessible to the GalNAc transferase enzyme respon-sible for the addition of the GalNAc. The first step for the assembly of themucin type O-glycans is the addition of N-acetylgalactosamine (GalNAc)residue to a Ser/Thr by a GalNAc transferase (GalNAcT) from UDP-
Post-translational modification of recombinant proteins 133

GalNAc (Van den Steen et al., 1998). Further elongation leads to a largenumber of structures, synthesized by various glycosyltransferases, produ-cing eight different core structures (Figure 6.4). These core structures canbe further modified by sialylation, fucosylation, sulfation, methylation, oracetylation. The most common is the core 1 structure (Gal�1-3GalNAc)that may be monosialylated or disialylated. These are the most prominentO-glycan structures found in glycoproteins produced from CHO cells(Backstrom et al., 2003).
6.2.3 Patterns of glycosylation in non-mammalian cells
The prokaryotes (mainly E. coli) were the first cells to be used for geneexpression of recombinant proteins. These cells can be manipulatedgenetically and show high productivity in large-scale systems. However,the cells lack any metabolic pathways for glycosylation and so the proteinsproduced are not glycosylated. Lower eukaryotes (yeast, insect, and plantcells) are capable of glycosylation of proteins. However, the glycansproduced in these cells differ significantly from those present in mamma-lian glycoproteins (Jenkins et al., 1996). Yeast, insect, plant, and mamma-lian cells share the feature of N-linked oligosaccharide processing in theER, including attachment of Glc3Man9GlcNAc2-P-P-Dol and subsequenttruncation to Man8GlcNAc2 structure. However, oligosaccharide proces-sing by these different cell types diverges in the Golgi apparatus (Goochee
S/T
S/T
S/T
S/T
Core VIII
Core V
Core VI
Core VII
S/T
S/T
S/T
S/T
S/T
Core I
Core II
Core III
Core IV
Tn antigen
23
4
86
Linkage position
GlcNAc
Gal
GalNAc
Figure 6.4
Core structures of mucin-type O-linked glycans. These represent a series ofcharacteristic structures attached to a serine (S) or threonine (T) amino acidresidue of a protein. There are eight core structures, each of which may havefurther monosaccharide additions. Tn is a precursor of the T (Thomsen–Freidenreich) antigen which is commonly used as a marker for tumor cells.
134 Animal Cell Technology

et al., 1991). Although there is extensive heterogeneity of structures arisingfrom any cell type, examples of predominant N-glycans that might occurfrom different systems are shown in Table 6.1.
Insect cells. Lepidopteran insect cell lines (such as Spodoptera frugiper-da, Sf-9) have been used extensively for expression of recombinantproteins using the baculovirus as an expression vector (Jarvis et al., 1998).Alternative methods of protein expression are also available using efficientinsect-associated promoter systems (Farrell et al., 1998). The advantage ofthe use of these cells is the high expression level and growth rate of thecells in culture. However, the glycosylation of proteins expressed by insectcells is limited. These cells can add Glc3Man9GlcNAc2 precursors toappropriate N-glycan sites in a nascent polypeptide and convert them toMan9GlcNAc2. They also have the enzymes necessary to trim thisoligosaccharide all the way down to Man3GlcNAc2. The formation of thisproduct requires the action of the enzymes ManI, GnTI, and ManII.However, there is little structural processing beyond the Man3GlcNAc2core oligosaccharide apart from the possibility of fucosylation (Jarvis andFinn, 1996; Donaldson et al., 1999).
Glycosyltransferase enzymes are either absent or at a low level ofactivity (Jarvis et al., 1998). Therefore, generally the insect expressionsystem is incapable of synthesizing sialylated lactosamine complex-typeN-glycan or sialylated O-glycans. However, some insect cells have beenfound to produce recombinant glycoproteins with elongated trimannosylcore structures containing terminal GlcNAc or Gal, and one recombinantglycoprotein acquired complex biantennary N-linked glycan containingsialic acid (Davidson et al., 1990; Kulakosky et al., 1998).
Table 6.1 Typical predominant N-glycan structures from different cell types.
Cell-type N-glycan Structure
Bacteria, E.coli None----------------------------
Yeast High mannose
Insect Fucosylated core structure
Plant Xylosylated and fucosylatedcore structure
Mammalian Complex biantennary
Post-translational modification of recombinant proteins 135

Jarvis et al. (1998) proposed a model to explain the N-linked oligosac-charide structures found in insect cell-produced glycoproteins. In thismodel the enzyme GlcNAcTII competes with N-acetylglucosaminidase(GlcNAdase) at a branch point. Depending upon the relative activities ofthese competing processing enzymes, trimannosyl core or complexN-linked glycans may be produced. It would appear that insect cells havea high level of N-acetylglucosaminidase activity, which can removeGlcNAc from a terminal position. The production of complex sialylatedN-linked structures could only occur when the recombinant protein is avery poor substrate for GlcNAdase or excellent substrate for the low levelactivities of the glycosyltransferases. The enzymic activity may vary con-siderably and this explains the differences in the N-glycan pattern of thesame glycoprotein secreted by different insect cell lines (Kulakosky et al.,1998).
The potential of insect cells for O-glycosylation was reported in a studyin which three lepidopteran cell lines were shown to produce predomi-nantly short O-glycan structures (Lopez et al., 1999). All three cell linesexpressed GalNAcÆ1-O-Ser/Thr (Tn antigen), whereas the ability tosynthesize Gal�1-3GalNAcÆ1-O-Ser/Thr (T antigen) and GalÆ1-4Gal�1-3GalNAcÆ1-O-Ser/Thr (PT antigen) was more limited. This indicatedlow activity of �1-3-galactosyltransferase and Æ1-4-galactosyltransferase.There was no indication of sialylation of these structures, suggesting theabsence of sialyltransferase activity. The culture medium used to growthese cell lines had a major effect on the O-glycans expressed. The use of asemi-defined rich medium enhanced glycosyltransferase activity signifi-cantly compared with a minimal nutrient medium. The limitations in theability of insect cells for glycosylation have restricted their use forproduction of human therapeutics. Genetic engineering of these systems isunder study in an attempt to improve the glycosylation machinery toproduce more ‘‘humanized’’ glycoproteins (Jarvis et al., 1998). In particu-lar the transformation of insect cells with the gene for mammalian �1,4-N-acetylgalactosyltransferase with a baculovirus expression vector leads toexpression of the enzyme and results in more extensively processed N-glycans (Jarvis and Finn, 1996).
Fungi. The early steps in the addition of carbohydrate to proteinsappear to have been remarkably conserved during evolution. The synthesisof the Glc3Man9GlcNAc2-P-P-Dol precursor, the transfer to the polypep-tide, and early processing in the ER are common events shared byeukaryotic cells. However, although relatively few N-linked sites havebeen characterized, it was noted that there is a trend in favor of the use ofAsn-X-Thr sites over Asn-X-Ser in yeast glycoproteins. In contrast tomammalian cells, where several Man residues may be removed duringprocessing, in Saccharomyces cerevisiae, a single specific Man residue iscleaved to form Man8GlcNAc2. Most yeast and filamentous fungi synthe-size carbohydrate chains of the high mannose type. Complex glycanstructures are not observed among fungal glycoproteins. Addition of Manresidues to core oligosaccharides occurs very rapidly in the Golgi, formingthe characteristic high mannose structures (mannan), which can consist ofmore than 50 mannose residues and resulting in high molecular weightglycoproteins (Hersecovics and Orlean, 1993).
136 Animal Cell Technology

Proteins synthesized in yeast may also contain O-glycans consisting oflinear poly-mannose structures attached to Ser or Thr. Similar to mamma-lian cells, O-glycosylation in yeasts has no obvious consensus sequence.However, unlike mammalian cells O-glycosylation in yeast is initiatedwith covalent attachment of mannose via a dolichol phosphate mannoseprecursor. Maras et al., (1997) showed that if the high mannose structuresare trimmed in vitro by mannosidase, they can become acceptors for therecombinant processing enzymes, N-acetylglucosaminyltransferase I,�1,4-galactosyltransferase, and Æ2,6-sialyltransferase. Mutant strains ofyeast also may synthesize truncated mannose structures.
Plants. Plant cells also conserve the early stages of N-glycosylation.However, the processing of the oligosaccharide trimming and furthermodification of glycans in the Golgi differ from mammalian cells. Plant-derived oligosaccharides do not possess sialic acid and frequently containxylose (Xyl), not normally present in mammalian N-linked oligosacchar-ides. Typically processed N-glycans in plants have a Man3GlcNAc2structure with �1,2 xylose and/or Æ1,3 fucose residues attached to thereducing terminal GlcNAc (Palacpac et al., 1999). Xylose is not present inmammalian glycan structures and fucose is attached to proximal (core)GlcNAc by an alternative linkage (Æ1,6) in mammalian cells. The presenceof these two residues (Xyl and Æ1,3 fucose) in plant recombinant glyco-proteins and their absence in mammalian proteins makes them highlyimmunogenic if present in therapeutic glycoproteins (Parekh et al., 1989;Storring, 1992; Palacpac et al., 1999).
6.2.4 Glycosylation in animal cells: the effect of the host cell line
The pattern of protein glycosylation is dependent on the expression ofvarious glycosyltransferase enzymes that are present in the Golgi of thecell. Differences in the relative activity of these enzymes among speciescan account for significant variations in structure. In one systematic studyof glycan structures of IgG produced from cells of 13 different animalspecies significant variation was found in the proportion of terminalgalactose, core fucose, and bisecting GlcNAc (Raju et al., 2000).
The fact that glycoproteins normally exist as mixtures of glycoformssuggests that the protein structure is not the primary determining factor inglycosylation. The glycoforms that emerge from the Golgi are endproducts of a series of incomplete enzymic reactions. Thus, the choice ofthe host cell line is a particularly important factor in the glycoform profileof a recombinant protein (Rudd and Dwek, 1997). Sialylation patterns ofthe secreted protein are particularly affected by the host cell.
6.2.5 Culture parameters that may affect glycosylation
It is important to control culture parameters to insure consistency ofglycosylation of a recombinant protein in a culture bioprocess. However,this may not be so easy given that the extent of glycosylation may decreaseover time in a batch culture (Curling et al., 1990). This is likely to be dueto the continuous depletion of nutrients (particularly glucose or gluta-mine) and accumulation of metabolic byproducts, which have been shown
Post-translational modification of recombinant proteins 137

to limit the glycosylation process (Hayter et al., 1992; Jenkins and Curling,1994; Nyberg et al., 1999). Culture conditions such as nutrient content,pH, temperature, oxygen, or ammonia, may have a significant impact onthe distribution of glycan structures found on the resulting recombinantprotein (microheterogeneity). This of course is of major concern in tryingto produce consistent biopharmaceuticals. It can lead to enhanced glyco-form heterogeneity and significant batch to batch variation in the produc-tion process. To maintain product quality it is important to understand theparameters that cause the variation in glycosylation.
Glucose starvation may result in an intracellular depleted state with ashortage of glucose-derived precursors of glycans that could result inreduced site occupancy. This has been shown at low glucose concentration(, 0.5 mM) for the synthesis of antibody (Stark and Heath, 1979) andrecombinant gamma-interferon (Hayter et al., 1992). Fed-batch strategiesmay be designed to insure that the concentrations of these key nutrientsdo not decrease below a critical level that could compromise proteinglycosylation (Xie and Wang, 1997). The lower levels of nutrients for theproduction of recombinant protein from CHO cells were found to be 0.1mM glutamine and 0.7 mM glucose (Chee et al., 2005). Nutrient levelsbelow these critical concentrations led to decreased sialylation and anincrease in hybrid and high mannose-type glycans. A plausible mechanismfor reduced site occupancy of a recombinant protein produced by glucose-depleted or glutamine-depleted CHO cell cultures was offered by Nyberget al. (1999). They showed that in both cases the low level of glycosylationwas related to a decreased intracellular concentration of UDP-GlcNAc.
This intracellular concentration of UDP-GlcNAc has also been shownto be important in another respect. An elevated UDP-GlcNAc appears tocause a decrease in sialylation, which may be explained metabolically bythe inhibition of CMP-sialic acid transport (Pels Rijcken et al., 1995). Thismay be the mechanism for the observed decrease in sialylation that hasbeen shown to accompany high levels of ammonia in culture (Yang andButler, 2000).
The dissolved oxygen (DO) level of cultures has also been shown to bea critical parameter to affect glycosylation. Terminal galactosylation of animmunoglobulin (IgG) was changed significantly with a gradual decreasein the digalactosylated glycans (G2) from 30% at the higher oxygen levelto around 12% under low oxygen conditions (Kunkel et al., 1998).
6.3 Other forms of post-translational modification
6.3.1 Deamidation
Non-enzymatic deamidation of glutamine or asparagine residues of pro-teins can occur spontaneously, leading to potential structural changes andloss of biological activity. Deamidation of Asn occurs more rapidly andleads to Æ-linked (Asp) or �-linked aspartyl (Isoasp) via a succinamidederivative. This introduces an extra negative charge in the protein that canresult in alterations of properties. For example, deamidation of an Asnresidue of human growth hormone-releasing factor can lead to a 25–500-
138 Animal Cell Technology

fold loss in potency (Friedman et al., 1991). Low levels of deamidation canlead to protein aggregation and are related to amyloid formation (Nilssonet al., 2002). The presence of Isoasp may also enhance the immunogenicityof a protein. Deamidation may occur during bioprocessing or storage ofbiopharmaceuticals and is dependent upon a number of factors includingpH, temperature, solvent dielectric constant, and ionic strength, as well asthe structure of the protein. Deamidation half-times for Asn in syntheticpeptides at neutral pH and 37oC are in the range of 1–500 days. Huanget al. (2005) described ‘‘hot spots’’ for spontaneous deamidation in ahumanized monoclonal antibody (mAb) that can lead to loss of bindingcapacity.
6.3.2 Deamination
Proteins subjected to metal-catalyzed oxidation can form carbonyl groupsthat are essentially deamination products (glutamic and aminoadipicsemialdehydes) that result from proline, arginine and lysine residues. Thismay lead to loss of function or structural alterations of the proteins thatare associated with the loss of a positive charge. Glutamic semialdehyde(5 mmole/mol) accounted for the majority of carbonyl groups in proteinsfrom HeLa cells in culture. Treatment of the cells with an H2O2-generat-ing system led to a 2.5-fold increase of these carbonyl groups (Requenaet al., 2001).
Oxidative deamination of lysine has also been observed by incubating amodel protein in the presence of high concentrations of glucose (50 mM)or lower concentrations of the Æ-oxoaldehydes; methyl glyoxal, or3-deoxyglucosone (1 mM; Akagawa et al., 2002). These Æ-oxoaldehydesmay be formed by the nonenzymatic degradation of glucose or from theearly stage of glycation (Thornalley et al., 1999). The presence of copper(Cu2þ) increases the rate of this process.
6.3.3 Glycation
This is a non-enzymatic process of adding glycans that may contribute tothe post-translational modification of proteins. It is a complex process thatresults in lysine- and arginine-derived glycation adducts in intracellular orextracellular proteins. The initial Maillard reaction involves the formationof a Schiff’s base between glucose and the �-amino group of lysine (Figure6.5). This undergoes a rearrangement to form a more stable fructosamine–protein adduct. However, a number of subsequent reactions are possiblethat lead to advanced glycation end products (AGEs) that have beenassociated with pathological complications of diabetes. The process hasbeen well studied in connection with pathological hyperglycemia. How-ever, there are also some specific considerations for bioprocesses.
Biopharmaceuticals may be subjected to heat treatment as a means ofviral inactivation. Protein damage is prevented by the addition of highconcentrations of a thermostabilizing excipient such as sugars or polyhyd-ric alcohols. The non-reducing polyhydric additives increase thermostabil-ity of the protein by the formation of a hydrogen-bonded solvent shell.The typical treatment for factor VIII consists of heat treatment at 608C for
Post-translational modification of recombinant proteins 139

10 h in the presence of high concentrations of sucrose and glycine. Such atreatment will destroy most viruses but may cause glycation products thatcould render the protein immunogenic (Smales et al., 2002). The observedmodifications take place by reaction adducts of glucose or fructose that arederived from the hydrolysis of sucrose. The heat treatment can result indeamidation, protein glycation, or AGE adduct formation.
6.3.4 Gamma-carboxylation
Gamma-carboxyglutamic acid (Gla) is an amino acid with a dicarboxylicacid side chain that has metal-binding properties and is important for thebiological activities of a range of blood coagulation proteins that includeprothrombin, factor X, factor IX, and factor VII, as well as the regulatoryproteins, protein C and protein S. The extra negative charge provided bythe carboxylation aids in the calcium-induced interaction of these proteinswith membrane surfaces. Gamma-carboxyglutamic acid is synthesized bythe post-translational modification of glutamic acid residues (Glu) in areaction catalysed by a carboxylase enzyme with requirements for vitamin
R.NH glucose2 �
H
HO
N
H
C
CC
CC
OH
R
H
OH
CH OH2
HH
OH
o
NH-proteinHO
OH
HOCH2
Schiff’s base
HNHR
HO H
C
CC
OH
OH
CH OH2
HH OHH OH
COH
OHOH
O
HO
NH-protein
NHR
HO H
C
C
O
OH
CH OH2
HH OH
CH2
C
H OH
HO
Fructosamine
Amadorire-arrangement
Figure 6.5
Glycation reactions. Glucose or other sugars may react non-enzymatically with proteins to formglycation products. Early glycation products such as fructosamine–protein adducts may later betransformed to the more complex advanced glycation end products (AGE products).
140 Animal Cell Technology
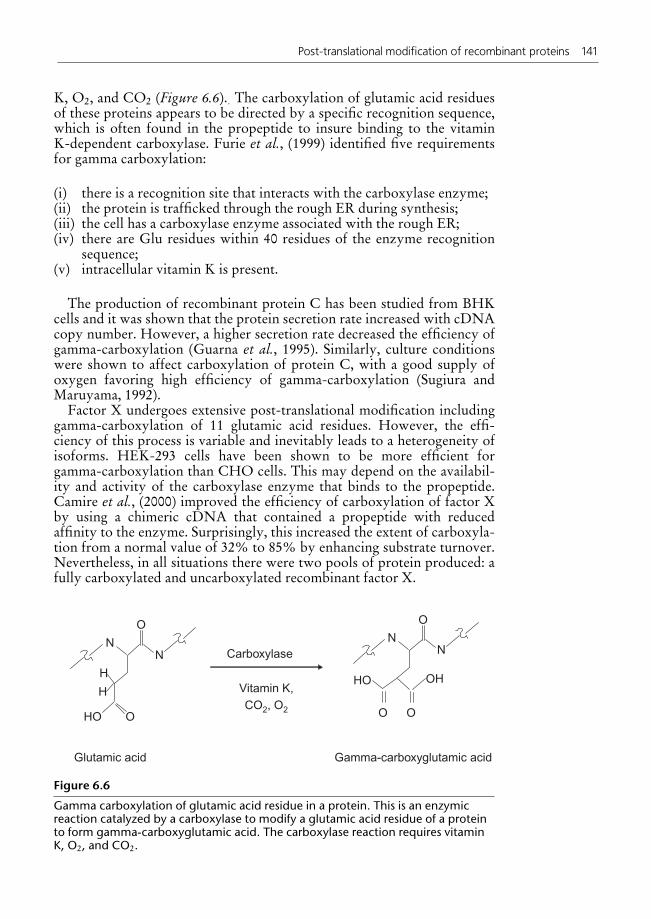
K, O2, and CO2 (Figure 6.6).: The carboxylation of glutamic acid residuesof these proteins appears to be directed by a specific recognition sequence,which is often found in the propeptide to insure binding to the vitaminK-dependent carboxylase. Furie et al., (1999) identified five requirementsfor gamma carboxylation:
(i) there is a recognition site that interacts with the carboxylase enzyme;(ii) the protein is trafficked through the rough ER during synthesis;(iii) the cell has a carboxylase enzyme associated with the rough ER;(iv) there are Glu residues within 40 residues of the enzyme recognition
sequence;(v) intracellular vitamin K is present.
The production of recombinant protein C has been studied from BHKcells and it was shown that the protein secretion rate increased with cDNAcopy number. However, a higher secretion rate decreased the efficiency ofgamma-carboxylation (Guarna et al., 1995). Similarly, culture conditionswere shown to affect carboxylation of protein C, with a good supply ofoxygen favoring high efficiency of gamma-carboxylation (Sugiura andMaruyama, 1992).
Factor X undergoes extensive post-translational modification includinggamma-carboxylation of 11 glutamic acid residues. However, the effi-ciency of this process is variable and inevitably leads to a heterogeneity ofisoforms. HEK-293 cells have been shown to be more efficient forgamma-carboxylation than CHO cells. This may depend on the availabil-ity and activity of the carboxylase enzyme that binds to the propeptide.Camire et al., (2000) improved the efficiency of carboxylation of factor Xby using a chimeric cDNA that contained a propeptide with reducedaffinity to the enzyme. Surprisingly, this increased the extent of carboxyla-tion from a normal value of 32% to 85% by enhancing substrate turnover.Nevertheless, in all situations there were two pools of protein produced: afully carboxylated and uncarboxylated recombinant factor X.
O
NN
O
H
H
OHO
NN
O
HO OH
O
Glutamic acid Gamma-carboxyglutamic acid
Carboxylase
Vitamin K,
CO , O2 2
Figure 6.6
Gamma carboxylation of glutamic acid residue in a protein. This is an enzymicreaction catalyzed by a carboxylase to modify a glutamic acid residue of a proteinto form gamma-carboxyglutamic acid. The carboxylase reaction requires vitaminK, O2, and CO2.
Post-translational modification of recombinant proteins 141

6.3.5 C-terminal modifications
A cause of heterogeneity in some proteins arises from the partial cleavageof terminal lysine or arginine by an intracellular carboxypeptidase. FormAbs the C-terminal lysine of heavy chains may be removed, giving riseto a mixture of Lys0 (absence) or Lys1 (presence) heavy chain variants.Analysis by mass spectrometry showed that the Lys0 variant can amountto 40–45% of the total (Lazar et al., 2004). Removal of C-terminalarginine has been shown for human recombinant EPO and also for thetwo-chain form of tPA following zymogen activation (Harris, 1995). It isconsidered that the removal of either C-terminal lysine or arginine isunlikely to cause loss of biological activity because they are found asnatural variants of these proteins under physiological conditions in vivo.
6.3.6 Hydroxylation
The most well-known example of protein hydroxylation arises from theactivity of the enzyme, prolyl-4-hydroxylase. This enzyme can convertproline to hydroxyproline when the substrate is contained in an aminoacid motif (X-Pro-Gly). This is known to occur in collagens and requiresfour co-substrates: ferrous ion, 2-oxoglutarate, oxygen, and ascorbate(Kivirikko et al., 1989). An example of this type of conversion has alsobeen found in the N-terminus of the prion protein in which there is adomain containing poly (L-proline) (Gill et al., 2000). An asparagine andproline hydroxylase may serve to regulate the activity of a hypoxia-inducible factor (HIF) in vivo (Lando et al., 2002). Under normoxicconditions these enzymes are active and are capable of hydroxylatingspecific asparagine and proline residues in HIF, which is then targeted fordestruction via the ubiquitin proteasome pathway. However, hypoxiainhibits the activity of the enzymes, allowing the HIF to function as atranscriptional regulator of genes, whose products play a role in adaptingfor oxygen deficiency in vivo.
6.4 Conclusions
Many biopharmaceuticals are produced as secreted glycoproteins frommammalian cell culture. The post-translational modification of theseproteins is essential to insure structural stability and biological and clinicalactivity. The best characterized of these modifications is N-glycosylation.This gives rise to a significant heterogeneity of structural forms and it isimportant to monitor these to insure consistency of production. However,the ability to control the glycosylation is limited by our understanding ofthe parameters that affect the heterogeneity of added glycan structures. Itis clear that the glycosylation process is affected by a number of factorsincluding the three-dimensional structure of the protein, the enzymerepertoire of the host cell, the transit time in the Golgi, and the availabilityof intracellular sugar-nucleotide donors. From a process developmentperspective there are many culture parameters that can be controlled toenable a consistent glycosylation profile to emerge from each batchculture. A further, but more difficult goal is to control the culture
142 Animal Cell Technology

conditions to enable the enrichment of specific glycoforms identified withdesirable biological activities. There are also a number of other possiblepost-translational modifications of proteins that can be characterized asthe addition or removal of small organic residues. These may be importantfor the structural integrity of the protein and should be monitored inculture bioprocesses designed for biopharmaceutical production.
Acknowledgment
The Natural Science and Engineering Research Council (NSERC) ofCanada is gratefully acknowledged for financial support for the study ofpost-translational modification of proteins through a series of Discoveryand Collaborative Research and Development (CRD) grants.
References
Akagawa M, Sasaki T, Suyama K (2002), Oxidative deamination of lysine residue inplasma protein of diabetic rats. Novel mechanism via the Maillard reaction, Eur. J.Biochem. 269:5451–5458.
Allen S, Naim HY, Bulleid NJ (1995), Intracellular folding of tissue-type plasminogenactivator. Effects of disulfide bond formation on N-linked glycosylation andsecretion, J. Biol. Chem. 270:4797–4804.
Backstrom M, Link T, Olson FJ, Karlsson H, Graham R, Picco G, Burchell J, Taylor-Papadimitriou J, Noll T, Hansson GC (2003), Recombinant MUC1 mucin with abreast cancer-like O-glycosylation produced in large amounts in Chinese-hamsterovary cells, Biochem. J. 376:677–686.
Camire RM, Larson PJ, Stafford DW, High KA (2000), Enhanced gamma-carboxyla-tion of recombinant factor X using a chimeric construct containing the prothrom-bin propeptide, Biochemistry 39:14322–14329.
Chee F, Wong D, Tin Kam Wong K, Tang Goh L, Kiat Heng C, Gek Sim Yap M(2005), Impact of dynamic online fed-batch strategies on metabolism, productivityand N-glycosylation quality in CHO cell cultures, Biotechnol. Bioeng. 89:164–177.
Curling EM, Hayter PM, Baines AJ, Bull AT, Gull K, Strange PG, Jenkins N (1990),Recombinant human interferon-gamma. Differences in glycosylation and proteo-lytic processing lead to heterogeneity in batch culture, Biochem. J. 272:333–337.
Davidson DJ, Fraser MJ, Castellino FJ (1990) Oligosaccharide processing in theexpression of human plasminogen cDNA by lepidopteran insect (Spodopterafrugiperda) cells. Biochemistry. 29(23):5584-90.
Donaldson M, Wood HA, Kulakosky PC (1999), Glycosylation of a recombinantprotein in the Tn5B1-4 insect cell line: influence of ammonia, time of harvest,temperature, and dissolved oxygen, Biotechnol. Bioeng. 63:255–262.
Ellgaard L, Helenius A (2003), Quality control in the endoplasmic reticulum, Nat.Rev. Mol. Cell Biol. 4:181-191.
Farrell PJ, Lu M, Prevost J, Brown C, Behie L, Iatrou K (1998), High-level expressionof secreted glycoproteins in transformed lepidopteran insect cells using a novelexpression vector, Biotechnol. Bioeng. 60:656–663.
Friedman AR, Ichhpurani AK, Brown DM, Hillman RM, Krabill LF, Martin RA,Zurcher-Neely HA, Guido DM (1991), Degradation of growth hormone releasingfactor analogs in neutral aqueous solution is related to deamidation of asparagineresidues. Replacement of asparagine residues by serine stabilizes, Int. J. Pept.Protein Res. 37:14–20.
Post-translational modification of recombinant proteins 143

Furie B, Bouchard BA, Furie BC (1999), Vitamin K-dependent biosynthesis ofgamma-carboxyglutamic acid, Blood 93:1798–1808.
Gavel Y, von Heijne G (1990), Sequence differences between glycosylated and non-glycosylated Asn-X-Thr/Ser acceptor sites: implications for protein engineering,Protein Eng. 3:433–442.
Gill AC, Ritchie MA, Hunt LG, Steane SE, Davies KG, Bocking SP, Rhie AG, BennettAD, Hope J (2000), Post-translational hydroxylation at the N-terminus of theprion protein reveals presence of PPII structure in vivo, EMBO J. 19:5324–5331.
Goochee CF, Gramer J, Andersen DC, Bahr JB, Rasmussen JR (1991), The oligosac-charides of glycoproteins: bioprocess factors affecting oligosaccharide structureand their effect on glycoprotein properties, Bio/Technology 9:1347–1355.
Guarna MM, Fann CH, Busby SJ, Walker KM, Kilburn DG, Piret JM (1995), Effect ofcDNA copy number on secretion rate of activated protein C, Biotechnol. Bioeng.46:22–27.
Harris RJ (1995), Processing of C-terminal lysine and arginine residues of proteinsisolated from mammalian cell culture, J. Chromatogr. A 705:129–134.
Hayter PM, Curling EMA, Baines AJ., Jenkins N, Salmon I, Strange PG, Tong JM,Bull AT (1992), Glucose-limited chemostat culture of chinese hamster ovary cellsproducing recombinant human interferon-. Biotechnol. Bioeng. 39:327–335.
Hersecovics A, Orlean P (1993), Glycoprotein biosynthesis in yeast. FASEB J. 7:540–550.
Huang L, Lu J, Wroblewski VJ, Beals JM, Riggin RM (2005), In vivo deamidationcharacterization of monoclonal antibody by LC/MS/MS, Anal. Chem. 77:1432–1439.
Jarvis DL, Finn E (1996), Modifying the insect cell N-glycosylation pathway withimmediate early baculovirus expression vectors, Nat. Biotechnol. 14:1288–1292.
Jarvis DL, Kawar ZS, Hollister JR (1998), Engineering N-glycosylation pathways inthe baculovirus-insect cell system, Curr. Opin. Biotech. 9:528–533.
Jenkins N, Curling EM (1994), Glycosylation of recombinant proteins: problems andprospects. Enzyme Microb. Technol. 16:354–364
Jenkins N, Parekh RB, James DC (1996), Getting the glycosylation right: implicationsfor the biotechnology industry. Nat. Biotechnol. 14:975–981.
Kivirikko KI, Myllyla R, Pihlajaniemi T (1989), Protein hydroxylation: prolyl 4-hydroxylase, an enzyme with four cosubstrates and a multifunctional subunit.FASEB J. 3:1609–1617.
Kornfeld R, Kornfeld S (1985), Assembly of asparagine-linked oligosaccharides, Annu.Rev. Biochem. 54:631–664.
Kulakosky PC, Shuler ML, Wood HA (1998), N-Glycosylation of a baculovirus-expressed recombinant glycoprotein in three insect cell lines, In Vitro Cell. Dev.Biol. 34:101–108.
Kunkel JP, Jan DC, Jamieson JC, Butler M (1998), Dissolved oxygen concentration inserum-free continuous culture affects N-linked glycosylation of a monoclonalantibody, J. Biotechnol. 62:55–71
Lando D, Peet DJ, Whelan DA, Gorman JJ, Whitelaw ML (2002), Asparaginehydroxylation of the HIF transactivation domain a hypoxic switch. Science295:858–861.
Lazar AC, Kloczewiak MA, Mazsaroff I (2004), Matrix-assisted laser desorption/ionization mass spectrometry for the evaluation of the C-terminal lysine distribu-tion of a recombinant monoclonal antibody, Rapid Commun. Mass Spectrom.18:239–244.
Leonard CK, Spellman MW, Riddle L, Harris RJ, Thomas JN, Gregory TJ (1990),Assignment of intrachain disulfide bonds and characterization of potential glyco-sylation sites of the type 1 recombinant human immunodeficiency virus envelopeglycoprotein (gp120) expressed in Chinese hamster ovary cells, J. Biol. Chem.
144 Animal Cell Technology

265:10373–10382.Lopez M, Tetaert D, Juliant S, Gazon M, Cerutte M, Verbert A, Delannoy P (1999),
O-glycosylation potential of lepidopteran insect cell lines, Biochim. Biophys. Acta1427:49–61.
Maras M, Saelens X, Laroy W, Piens K, Claeyssens M, Fiers W, Contreras R (1997), Invitro conversion of the carbohydrate moiety of fungal glycoproteins to mamma-lian-type oligosaccharides. Evidence for N-acetylglucosaminyltransferase-I-accepting glycans from Trichoderma reesei. Eur. J. Biochem. 249:701–707.
Meynial-Salles I, Combes D (1996), In vitro glycosylation of proteins: an enzymaticapproach. J. Biotechnol. 46:1–14.
Nilsson MR, Driscoll M, Raleigh DP (2002), Low levels of asparagine deamidation canhave a dramatic effect on aggregation of amyloidogenic peptides: implications forthe study of amyloid formation. Protein Sci. 11:342–349.
Nyberg GB, Balcarcel RR, Follstad BD, Stephanopoulos G, Wang DI (1999), Meta-bolic effects on recombinant interferon-gamma glycosylation in continuous cul-ture of Chinese hamster ovary cells, Biotechnol. Bioeng. 62:336–347.
Palacpac NQ, Yoshida S, Sakai H, Kimura Y, Fujiyama K (1999), Stable expression ofhuman � 1,4-galactosyltransferase in plant cells modifies N-linked glycosylationpatterns, Proc. Natl Acad. Sci. U S A 96:4692–4697.
Parekh RB, Dwek RA, Edge CJ, Rademacher TW (1989), N-glycosylation and theproduction of recombinant glycoproteins, Tibtech 7:117–122.
Pels Rijcken WR, Overdijk B, Van den Eijnden DH, Ferwerda W (1995), The effect ofincreasing nucleotide-sugar concentrations on the incorporation of sugars intoglycoconjugates in rat hepatocytes, Biochem. J. 305:865–870.
Petrescu AJ, Milac AL, Petrescu SM, Dwek RA, Wormald MR (2004), Statisticalanalysis of the protein environment of N-glycosylation sites: implications foroccupancy, structure, and folding, Glycobiology 14:103–114.
Raju TS, Briggs JB, Borge SM, Jones AJ (2000), Species-specific variation in glycosyla-tion of IgG: evidence for the species-specific sialylation and branch-specificgalactosylation and importance for engineering recombinant glycoprotein thera-peutics, Glycobiology 10:477–486.
Requena JR, Chao CC, Levine RL, Stadtman ER (2001), Glutamic and aminoadipicsemialdehydes are the main carbonyl products of metal-catalyzed oxidation ofproteins. Proc. Natl Acad. Sci. U S A 98:69–74.
Rudd PM, Dwek RA (1997), Glycosylation: heterogeneity and the 3D structure ofproteins, Crit. Rev. Biochem. Mol. Biol. 32:1–100.
Smales CM, Pepper DS, James DC (2002), Protein modification during anti-viral heat-treatment bioprocessing of factor VIII concentrates, factor IX concentrates, andmodel proteins in the presence of sucrose, Biotechnol. Bioeng. 77:37–48.
Spellman MW (1990), Carbohydrate characterization of recombinant glycoproteins ofpharmaceutical interest, Anal. Chem. 62:1714–1722.
Stark NJ, Heath EC (1979), Glucose-dependent glycosylation of secretory glycopro-tein in mouse myeloma cells, Arch. Biochem. Biophys. 192:599–609.
Storring PL (1992), Assaying glycoprotein hormones – the influence of glycosylationon immunoreactivity, Tibtech 10:427–432.
Sugiura T, Maruyama HB (1992), Factors influencing expression and post-translationalmodification of recombinant protein C, J. Biotechnol. 22:353–360.
Thornalley PJ, Langborg A, Minhas HS (1999), Formation of glyoxal, methylglyoxaland 3-deoxyglucosone in the glycation of proteins by glucose, Biochem J.344:109–116.
Van den Steen P, Rudd PM, Dwek RA, Opdenakker G (1998), Concepts and principlesof O-linked glycosylation, Crit. Rev. Biochem. Mol. Biol. 33:151–208.
Walmsley AR, Hooper NM (2003), Glycosylation efficiency of Asn-Xaa-Thr sequonsis independent of distance from the C-terminus in membrane dipeptidase, Glyco-
Post-translational modification of recombinant proteins 145

biology 13:641–646Xie L, Wang DI (1997), Integrated approaches to the design of media and feeding
strategies for fed-batch cultures of animal cells, Trends Biotechnol. 15:109–113.Yan A, Lennarz WJ (2005), Unraveling the mechanism of protein N-glycosylation,
J. Biol. Chem. 280:3121–3124.Yang M, Butler M (2000), Effects of ammonia on CHO cell growth, erythropoietin
production, and glycosylation, Biotechnol. Bioeng. 68:370–380.
146 Animal Cell Technology

7Mechanisms of cellproliferation and cell deathin animal cell culture invitroMaıra Peixoto Pellegrini, Rodrigo Coelho Ventura Pinto, andLeda dos Reis Castilho
7.1 Introduction
The advances attained in the last decades in the knowledge of the bio-logical fundamentals underlying animal cell culture have enabled signifi-cant improvements in cell culture processes in vitro. In this chapter, themechanisms that determine cell proliferation and cell death are discussed.Aspects concerning the kinetics and the mathematical description of cellgrowth and cell death are dealt with in Chapter 8.
7.2 Cell proliferation mechanisms
Cell proliferation occurs through a sequence of coordinated events aimedat doubling the cellular material, so that cells can divide. This is known asthe cell cycle and is the essential mechanism governing reproduction of alleukaryotic cells. The basic function of the cell cycle is the error-freeduplication of the genetic material (DNA – deoxyribonucleic acid) con-tained in the chromosomes, followed by a precise segregation of the copiesinto two genetically identical daughter cells. During the cell cycle, totalproteins and RNA are duplicated and two cells of similar size with respectto volume and mass are formed (Mitchison, 2003).
The duplication process defines two important phases of the cell cycle(Griffiths, 1984; Alberts et al., 2002). In the S phase (synthesis), which inmammalian cells lasts 10–12 hours (representing half of the cell cycle),DNA duplication occurs. In the M phase (mitosis), which lasts less than 1hour in mammalian cells, segregation of chromosomes and cell divisiontake place. This phase is divided into six stages: prophase, prometaphase,metaphase, anaphase, telophase, and cytokinesis (Figure 7.1). In the initialstages, the duplicated DNA strands are condensed into more compactchromosomes, which are necessary for segregation. Subsequently, thechromosome copies bind to the mitotic spindle, which consists of a bundleof microtubules. Its function is to segregate chromosomes during cell

division. The chromosomes are aligned and move to opposite poles of thecell, that is, to the opposite ends of the mitotic spindle. At this stage theyare less compact and they form two new nuclei. The final stage of thisprocess, known as cytokinesis, consists of the complete division into twocells, each containing part of the original cytoplasm.
Cell division also requires duplication of the protein mass and oforganelles, which takes longer to be accomplished than DNA replication.Thus, for the cell to be able to grow and duplicate its contents, there aretwo additional phases in the cell cycle: the G1 phase (between the M andthe S phase), and the G2 phase (between the S-phase and mitosis). The cellcycle is divided into four sequential phases: G1, S, G2, and M (Figure 7.2).The part of the cycle that consists of phases G1, S, and G2 is designated theinterphase. In a typical proliferating mammalian cell, the interphase can
Prometaphase TelophaseAnaphase CytokinesisProphase Metaphase
Figure 7.1
The nuclear division process during the M phase lasts less than an hour. The Mphase can be divided into six distinct stages, according to the progression ofnuclear division (prophase, prometaphase, metaphase, anaphase, telophase, andcytokinesis) (adapted from Alberts et al., 2002).
S
G2
M
G0
1
2
Relative
contents
Synthesis
rate
G1 S MHeLa
cell line 8.0 0.5 h
DNA
RNA protein�
G1
G2
9.5 4.8
Figure 7.2
Cell cycle phases versus synthesis rate and concentration of macromolecules in thecell, as well as average duration of cell cycle phases for the tumor HeLa cell line(adapted from Griffiths, 1984).
148 Animal Cell Technology

last 23 hours and mitosis 1 hour, resulting in an average doubling time (td)of 24 hours (Griffiths, 1984; Alberts et al., 2002). Depending on theenvironmental conditions and the characteristics of the cell (e.g. tumorcells), the doubling time can vary.
The two G phases represent mainly time intervals when the cell cangrow, but important regulatory phenomena also occur during G1 and G2.In these phases, the cell monitors the intra- and extracellular environmentto ensure that there are adequate conditions and that the cell itself isprepared to move forward to the next phase. G1 has a rather variableduration, which depends on extracellular conditions and external signals.If the conditions are not suitable, the cell delays its progression throughG1 and may even enter a quiescent phase designated G0, where it canremain for an indefinite period of time until restarting cell proliferation. Ifthe extracellular environment is favorable and there are growth factorsavailable, a cell in G1 and G0 proceeds up to a point where it cannot bedetained any more, known as point of restriction. After transposing thispoint, the cell is fated to replicate its DNA, even if the environmentbecomes adverse for its development (Griffiths, 1984; Alberts et al., 2002).
The cell division process is governed by a complex regulatory mechan-ism, which comprises signals from different sources that indicate whendivision is necessary and appropriate. These signals originate from both theextracellular and intracellular environment. The signals consist of growthfactors and hormones, which help cells to determine when it is necessary forthem to divide, if the necessary nutrients are available, and if there are anysignals contrary to the start of the reproductive cycle. The signals relating tothe intracellular verification points, at the end of phases G1 and G2, arenecessary to coordinate in time and space the different cell cycle events,ensuring that a complete sequence of events occurs before a new sequencebegins. If DNA damage or poor assembly of the mitotic spindle occurs, thecycle progression is interrupted until repair measures are successfullyaccomplished (Fussenegger and Bailey, 1998; Li and Zou, 2005).
The intracellular control of the cell cycle is carried out by a family ofproteins known as cyclin-dependent kinases (CDKs). The activity of thesekinases varies according to the progression of the cell in the cycle.Alterations in the activity of these proteins result in cyclic changes inphosphorylation of intracellular proteins, which indicate or regulate themain cell cycle events. These cyclic changes that may occur in the activityof CDKs are in turn controlled by other proteins, known as cyclins. Asthe name suggests, CDKs depend on cyclins for appropriate activity, sincethey are only active when bound to a specific cyclin. Unlike the level ofCDKs, which is approximately constant, cyclins present cycles of synth-esis and degradation, which result in a cyclic formation and activation ofcyclin–CDK complexes. This activation, in turn, activates the cell cycleevents of animal cells (Alberts et al., 2002). Other important proteins andintracellular factors also participate in the regulation of cell proliferationand cell death. The protein known as p53 is activated upon DNA damageduring replication, interrupting cell cycle progression and activating celldeath or senescence mechanisms (Harris and Levine, 2005). The family ofpolo-like kinases (PLKs) mediates the control of the checkpoints thatmonitor events such as replication and segregation (Xie et al., 2005).
Mechanisms of cell proliferation and cell death in animal cell culture in vitro 149

When cells from normal mammalian tissues are cultivated in vitro underadequate conditions, they usually stop dividing after a given number ofcycles, and this is called replicative cellular senescence. Hayflick andMoorhead (1961) first recognized that cells have a limited lifespan in vitro.They worked with human fibroblasts (WI-38 cell line) and observed thatthese cells died after about 50 population doublings (Hayflick and Moor-head, 1961; Hayflick, 1965). Senescence is related to changes in thestructure of telomeres, which are repetitive DNA sequences associatedwith proteins at the tips of the chromosomes. When cell division occurs,the telomere sequences are not replicated in the same way as the rest of theDNA. These sequences are synthesized by the telomerase enzyme, whichis also responsible for the addition of proteins that protect the chromo-some ends. In the germ line, during early development, and in highlyproliferative organs, telomere shortening and elongation is balanced.However, when cells become fully differentiated or mature, the shorteningprocess becomes dominant due to telomerase repression (Bekaert et al.,2004). Thus, the telomeres become shorter and their protective proteinsdeteriorate with time. With their ends exposed, the chromosomes becomeprone to damage, and this may cause an arrest of the cell cycle or inducecell death mechanisms (Alberts et al., 2002). Normal rodent cells possessactive telomerase throughout their proliferative lifespan, and this explainswhy they are so readily immortalized and transformed in culture com-pared with their human counterparts. Telomerase is present in 90% ofhuman cancer cells, and therefore it represents an attractive target fordeveloping new anticancer drugs (Newbold, 2002).
Although the use of immortalized cell lines has allowed the establish-ment of different cell culture technologies for the large-scale production ofbiopharmaceuticals, an enhanced capacity for proliferation may becomedisadvantageous. In batch cultures, for instance, the aim is to reach highcell concentrations, but this results in exhaustion of essential nutrients andaccumulation of toxic metabolites, leading to sub-optimal nutritionalconditions that lead to cell death and to the end of the production process(Fussenegger and Bailey, 1999). However, in many cases, the synthesis of aproduct is not associated with cell growth and maximum productivity isreached under conditions in which cell proliferation is decreased, but highviabilities are maintained. Therefore, some cultivation processes are basedon operational strategies that allow cells to remain viable, but in a non-proliferative state, so as to prolong the productive phase and to increasethe productivity of the process (Suzuki and Ollis, 1989, 1990; Fusseneggerand Bailey, 1999).
By these strategies cell proliferation may be controlled by addingchemical additives that arrest the cell cycle, usually in the G1 phase,increasing specific productivity. However, concomitantly undesirable ef-fects such as cytotoxicity may be observed, which result in a decrease incell viability and in the impossibility of maintaining the culture in anonproliferative state for long periods of time (Suzuki and Ollis, 1990;Al-Rubeai et al., 1992). Deprivation of specific nutrients and growthfactors can also stop cell proliferation, but in this case cell viabilitydecreases and programmed cell death – apoptosis – is activated (Mercilleand Massie, 1994a, 1994b; Singh et al., 1994; Fussenegger and Bailey,
150 Animal Cell Technology

1999). Currently, much research on the biochemical control of cellcultures based on preventing the cell death mechanisms, to avoid cell deathinstead of inhibiting cell growth, is being carried out with the aim ofprolonging the productive period of a cell culture process (Al-Rubeai andSingh, 1998; Fussenegger et al., 1999; Fussenegger and Bailey, 1999). Thisbiochemical control is based on the knowledge and manipulation of themolecular basis of cell death, as discussed in detail in Section 7.6 of thischapter.
7.3 Cell death mechanisms: apoptosis and necrosis
Cell death occurs by two different mechanisms: necrosis or apoptosis. Theterm ‘‘apoptosis’’ was first used in 1972 by Kerr, Wyllie, and Currie todescribe a form of cell death that differed from cell death by necrosis inthat no damage to the cell membrane and no inflammatory responses wereobserved (Kerr et al., 1972). Apoptosis was later recognized as an impor-tant physiological process during the life of all multicellular organisms,where cells are regularly lost. These cells are removed when they are nolonger needed or when they represent a danger. This allows the tissue tofunction normally. The perfect balance between proliferation and celldeath maintains homeostasis. Examples of apoptosis during the life of anorganism are: tissue renovation, positive and negative selection of lympho-cytes, elimination of cells during embryogenesis (such as the formation oflimbs), and development of the nervous system of vertebrates. An appro-priate control of apoptosis is crucial for higher eukaryotes, and any failurein its regulation can lead to diseases. The lack of a mechanism forapoptosis in tumor cells permits them to survive and, thus, contributes tocancer development. It can also be responsible for autoimmune diseases.Excessive or inappropriate activation of apoptosis may cause degenerativediseases, such as osteoporosis and Alzheimer’s or Parkinson’s diseases.
Necrosis is considered an accidental death, and thus a non-physiologicalprocess, which is characterized by changes in morphology and in mito-chondrial function, as well as by the inability of the plasma membrane toregulate osmotic pressure inside the cell. Initially, there is an increase inthe cytoplasmic volume due to the influx of liquid into the cell (Figure7.3). This is followed by membrane and organelle rupture, leading to therelease of lysosomes and cytoplasmic material, and culminating in randomnuclear fragmentation (Al-Rubeai, 1998). The damage to the plasmamembrane includes alterations in the ion transport system, followed by anincrease in the permeability of the membrane and cell swelling (Buja et al.,1993).
Apoptosis in turn is characterized by a series of morphological altera-tions, in an autodestruction process that results in the formation of vesiclescontaining cell material, known as apoptotic bodies, which, in vivo, aresubsequently phagocytized by specialized cells. This series of events isinitiated by a given stimulus that elicits a cascade of intracellular signals,activating enzymes (caspases) that will mediate the morphological andphysiological changes experienced by the cell. In general, apoptosis differsfrom necrosis by the absence of cytoplasmic material leakage, by the
Mechanisms of cell proliferation and cell death in animal cell culture in vitro 151

decrease in cell size, by a controlled and uniform DNA fragmentation,and by specific changes in the chromatin, which becomes highly con-densed and can appear concentric with the nuclear membrane. The onlyalteration that may be observed in the organelles is a swelling of theendoplasmic reticulum (ER) (McCarthy, 2002). However, during cultiva-tion processes in vitro, apoptosis ends up in a stage called secondarynecrosis (Figure 7.3; see color section), where, due to the absence ofspecialized phagocytic cells, the apoptotic cells and apoptotic bodiesrelease their contents into the extracellular medium, as occurs in necrosis(Al-Rubeai, 1998).
7.4 Influence of environmental conditions on the induction ofcell death
During in vitro cultivation of animal cells, any change relative to theoptimal environmental conditions may result in a rapid decrease in cellviability. This phenomenon is more frequently observed in cell lines thatexhibit high susceptibility to apoptosis (Singh and Al-Rubeai, 1998). Anyagent or condition that alters the cell metabolism may activate pro-grammed cell death. Cells exposed to high stress levels due, for instance,to the presence of a high concentration of toxins, to large changes in pH,or to high agitation rates, generally die by necrosis, because there is notime for the cell to generate a response, that is, cell death is instantaneous.At intermediate stress levels, the cell can be damaged without instanta-neously dying, having time to activate its programmed death mechanism.Under low levels of environmental stress, the cells may produce heat-shock proteins (HSPs), which allow their survival until the stimulus iseliminated. However, once a threshold level of resistance is surpassed,survival becomes impossible and the cells activate their apoptotic path-ways (Cotter and Al-Rubeai, 1995).
Cells in culture are usually exposed to variations in environmentalconditions and, depending upon these conditions, cells can survive or die.In biotechnological processes, the usual aim is to maintain cells alive andproductive. There are a large number of factors that influence the qualityof a cell culture, including an appropriate supply of nutrients, pH, shearstress, accumulation of metabolites, and oxygen availability. Studies havealready shown that several alterations in culture conditions, such as thelack of nutrients or serum, increase in osmotic pressure, and maintainingcells in suspension culture, may induce apoptotic mechanisms. The criticalfactors determining apoptosis vary between cell lines (Singh et al., 1994;Zanghi et al., 1999; Kim and Lee, 2002).
7.4.1 Depletion of nutrients and growth factors
Cells survive and proliferate according to the addition of appropriateamounts of nutrients and growth factors, which are provided by theculture media. When these requirements are not met, cells die. Theavailability of nutrients and growth factors is considered the most signifi-cant factor influencing the biological activity of cells. The lack or depletion
152 Animal Cell Technology

of these substances can not only lead to arrest of proliferation, but also tocell death by apoptosis.
In the cells, control of proliferation and apoptosis is carried out by anintegrated signaling mechanism that activates or avoids one of theseprocesses and also influences other aspects of cell activity. For instance,the presence of mitotic agents that induce proliferation, and survivalfactors that inhibit apoptosis, are necessary for maintaining cell viability(Al-Rubeai, 1998). It is important, however, to distinguish between mito-gens and survival factors. Insulin-like growth factor 1 (IGF-1) is a potentsurvival factor, but a poor mitogen. Many cytokines are good mitogens,but poor survival factors, since they induce cell division but do not avoidapoptosis. In this way, induction of cell growth and apoptosis inhibitionbecome independent events. Macrophage-colony stimulating factor(M-CSF), for instance, promotes cell survival when present at low concen-trations, but promotes proliferation at high concentrations. Thus, thecorrect balance of growth and survival factors is an important considera-tion for maintaining high cell viability in culture (Cotter and Al-Rubeai,1995).
Animal serum, especially serum from bovine fetuses, plays an importantrole in the growth and survival of animal cells in culture. Serum containsgrowth factors, proteins, and other nutrients. The removal of serum hasbeen associated with apoptotic induction in different cells, includinghybridomas and Chinese hamster ovary (CHO) (Zanghi et al., 1999) andplasmacytomas (Singh et al., 1994). The mechanism by which the removalof growth factors, such as those contained in serum, induces apoptosisseems to involve the expression of the proto-oncogene c-myc (Al-Rubeai,1998). In CHO cells, apoptosis is induced by nutrient depletion due toaccelerated nutrient consumption in the absence of serum. On the otherhand, when serum or plasma is present at high concentrations, death byapoptosis is also induced, but this phenomenon can be avoided by addingsupplements containing thiol groups, such as L-cysteine or L-tryptophan(Al-Rubeai, 1998).
When cells are deprived of an energy source such as glucose or glutamine,apoptosis can be induced. The effects of lack of glutamine on apoptosisinduction have been observed in hematopoietic cells, such as hybridomasand plasmacytomas (Mercille andMassie, 1994a; Singh et al., 1994). Sanfeliuand Stephanopoulos (1999) demonstrated that the lack of glutamine is themajor factor activating apoptosis in a CHO cell line producing interferon-gamma, and that this effect could be attenuated by the expression of thegene Bcl-2, which codes for an anti-apoptotic protein that participates inthe signaling pathway that is triggered in response to apoptotic stimuli. Theinfluence of glucose and glutamine on the apoptotic pathways is not yetcompletely understood, but the concentrations of both compounds regulatecell growth and the catabolic pathways. Their depletion can block DNAsynthesis and arrest the culture in the G1 phase, causing apoptosis. How-ever, this does not explain why cells in phases S, G2, and M also undergoapoptosis. It is suggested that apoptosis can be induced when the energyrequired for synthesis of the ATP, needed for the duplication of cellularmaterial, is decreased to a critical level, resulting in the activation ofregulatory proteins that promote apoptosis (Al-Rubeai, 1998).
Mechanisms of cell proliferation and cell death in animal cell culture in vitro 153

The relationship between apoptosis induction and glutamine depletionin batch cultures of hybridomas led to studies suggesting that apoptosis isactivated upon depletion of any amino acid. Although the lack of essentialamino acids is critical, the depletion of any amino acid can induceapoptosis, since the synthesis of molecules involved in the regulation ofcell death is blocked (Simpson et al., 1998). There are two probableexplanations for this. According to one of them, the decrease in theintracellular concentration of amino acids can lead to a depletion of tRNAmolecules, blocking translation (protein synthesis). According to thesecond theory, transcription and translation can be impaired by the de-crease in the intracellular ATP levels. Although not all amino acidscontribute to the energetic requirements of the cells, the absence of anyamino acid results in the induction of apoptosis. Experiments with murinehepatocytes showed that protein synthesis is inhibited at the level of theinitiation of the peptide chain. This indicates that the role of amino acidsas protein precursors could be one of the most significant factors inducingdeath by apoptosis (Singh and Al-Rubeai, 1998).
7.4.2 Oxygen limitation
The apparent involvement of free radicals in apoptotic processes has led tostudies of the effects of dissolved oxygen tension on animal cells in culture.Hydrogen peroxide was demonstrated to be a factor inducing apoptosis,whereas antioxidants such as catalase and superoxide dismutase protectcells. Formerly, it was believed that the Bcl-2 protein acted as an antiox-idant, but today it is known that anoxic conditions can induce apoptosis(Mercille and Massie, 1994a) and that Bcl-2 expression presents an anti-apoptotic action also under limiting conditions of oxygen. These studiesare very important for large-scale cultivation processes and for processeswhere oxygen may be limiting, since the supply of oxygen is a key factorthat limits the viable cell concentration attained in these culture systems.The effects of Bcl-2 protection under anoxic conditions have already beendemonstrated for different cell lines. For cells derived from Burkitt’slymphoma transfected with the Bcl-2 gene, the resistance to anoxicconditions increased, and cell viability could be maintained at high levelsfor a longer period than with control cells (Singh et al., 1997). In the caseof a hybridoma, the expression of this gene also conferred a higherviability and integrity of the cells when exposed to anaerobic conditions(Simpson et al., 1997).
7.4.3 Susceptibility to shear stress
Animal cells do not have a cell wall and are, thus, highly susceptible to theeffects of shear stress. Cells respond to hydrodynamic stress withinminutes, altering their metabolism and the gene expression pattern (Nol-lert et al., 1991). Under sub-lethal levels of shear stress, there is initially anincrease in passive transmembrane transport, simultaneously with damageto surface receptors. The plasma membrane is generally the main site forshear damage, and it may lose its capacity to mediate the transport of ionsand molecules, so that the cell loses its viability. It has been demonstrated
154 Animal Cell Technology

that the susceptibility of some cell lines to the effects of hydrodynamicstress is related to cell size and cell cycle, with cells in S and G2 phasesmore prone to damage and smaller cells more resistant to injury. It hasalso been observed that cell damage and the dominating death mechanism(necrosis or apoptosis) depend on the intensity and exposure time to shearstress (Al-Rubeai et al., 1995a, 1995b). Exposing hybridoma cells tomoderate agitation levels resulted in a decrease of viability and an increasein cell death by apoptosis (Al-Rubeai et al., 1995b), whereas extreme shearlevels led to cell death by necrosis, with complete cell fragmentation.
The hydrodynamic environment in a stirred-tank bioreactor can bestressful for animal cells. This arises from the high energy introduced intothe system to maintain homogeneity and cells in suspension. Furthermore,gas bubbling results in cell damage, especially at the gas–liquid interfacenear the headspace of the bioreactor. While knowledge of the effects ofhydrodynamic conditions has improved bioreactor design and operationstrategies, so as to decrease hydrodynamic stress, a compromise still existsconcerning the need for efficient agitation and aeration and the suscept-ibility of cells to shear. Certainly, if apoptosis is induced by hydrodynamicstress, then the suppression of this death mechanism, e.g. by molecularstrategies, would allow enhanced agitation and aeration, improving masstransfer with a decreased effect on cell viability (Singh and Al-Rubeai,1998).
7.4.4 Osmolality
Culture medium osmolality has a large influence on animal cell culture.Hyperosmotic conditions, achieved by using salts, CO2, or concentratedmedia, has been shown as a low-cost method to increase specific produc-tivity of cells. Hybridoma cultures, for instance, show improved produc-tivity with an increase in osmolality (Oh et al., 1993). However, thismethod is not very popular due to the negative effects on cell growth. Thedrop in cell growth under hyperosmotic conditions occurs, probably, dueto cell death by apoptosis. Thus, expression of anti-apoptotic genes, suchas Bcl-2, could allow the use of hyperosmotic conditions to simulta-neously limit cell death and increase cell productivity (Kim and Lee,2002).
7.5 Methods of detection of cell death by apoptosis
Currently, there are many methods available for determining cell death byapoptosis in cell cultures and tissues. These methods are based essentiallyon changes that occur in apoptotic cells. During apoptosis, severalphenomena can be observed, such as DNA fragmentation, chromatincondensation, nuclear fragmentation, cytoplasm acidification, cytochromec release from the mitochondria, exposure of intracellular phospholipidsand the activation and breakdown of proteins. These apoptotic phenomenacan be detected by direct or indirect methods, on cell populations or onindividual cells that are representative of a population. The main principlesused by the different detection methods are:
Mechanisms of cell proliferation and cell death in animal cell culture in vitro 155

(i) DNA fragmentation;(ii) morphological changes;(iii) changes in membrane asymmetry;(iv) activation of apoptotic proteins;(v) release of cytochrome c in the cytoplasm.
7.5.1 DNA fragmentation
During controlled cell death, the DNA is initially cleaved into 300–500 kbfragments (Brown et al., 1993). Later on, these fragments are decreased tomultiples of 180–200 bp, which is the distance between histone proteins,around which the condensed chromatin is wrapped. This phenomenonoccurs simultaneously with morphological changes, such as chromatincondensation. The resulting fragments are known as LMW-DNA (lowmolar mass DNA) fragments, which are able to pass through pores of thenuclear membrane and reach the cytoplasm, and HMW-DNA (high molarmass DNA) fragments, which remain in the nucleus. The main enzymeinvolved in this process is a caspase-activated DNAse (CAD) (Nagata,2000).
Agarose gel electrophoresis
The DNA fragments can be visualized in electrophoretic runs in agarosegels showing a distinct band pattern (DNA laddering). The sizes of thebands are multiples of the smallest nucleosomal fragments. Unlike those ofapoptosis, the DNA fragments arising from necrosis are of irregular size,resulting in a smear in the sample lane. Although the gel electrophoresispattern is a biochemical indication of apoptosis, in some cases the classicmorphological features of apoptosis may be noted without DNA fragmen-tation (Al-Rubeai, 1998; Nagata, 2000).
TUNEL
TUNEL stands for terminal deoxynucleotidyl transferase x-dUTP nickend labeling. This assay is based on the detection of DNA fragmentsmarked by an enzyme that incorporates modified nucleotides to the 39-OH ends of the fragments, which can be then specifically detected. Theenzyme is a deoxynucleotidyl transferase, which can act in absence of acomplementary strand. Among the nucleotides, there is one specificallymarked with a fluorochrome, an enzyme, or an antigen. This allowsdifferent methods of detection.
When the deoxynucleotide is associated with a fluorochrome, the cellscan be observed under a fluorescence microscope, whereby apoptotic cellspresent an intense fluorescence and, in advanced stages, nuclear fragmenta-tion can be visualized. For a quantitative analysis, either a hemocytometerin an optical microscope or a flow cytometer can be used (Tinto et al.,2002). Peroxidase-marked deoxynucleotides can be quantified by chromo-genic tests that use the enzyme substrate. Indirect methods use antigenslinked to the nucleotide and recognized by labeled antibodies. However,
156 Animal Cell Technology

this is a less sensitive technique, which is used mainly in pre-fixedhistological samples.
In the TUNEL test, it is necessary to permeabilize the cells to introducethe enzyme and the deoxynucleotides, but the permeabilization is carriedout after weak fixation with formaldehyde, so that low molar massfragments are not lost. Permeabilization is carried out in an ice bath,followed by labeling with the reaction solution.
Propidium iodide, ethidium bromide, and DAPI
These methods use fluorescent labels, such as propidium iodide, ethidiumbromide, or DAPI (49,69-diamidino-2-phenylindole), which are incorpo-rated into the DNA, allowing chromatin condensation and nuclear frag-mentation to be visualized under a microscope with the appropriatefluorescence filters. To allow fluorochromes to enter the cells and reachthe nucleus, the cells need to be prepermeabilized, for example, with 70%ethanol at –208C. LMW-DNA fragments may be lost by the permeabili-zation, decreasing the amount of DNA inside the cells. The lower nucleicacid concentration results in a lower fluorescence intensity in apoptoticcells, which can be detected by fluorescence microscopy or flow cytome-try (Calle et al., 2001).
7.5.2 Morphological changes
Several methods are based on microscopy observations to detect morpho-logical changes in the cells, mainly chromatin condensation. Differentmarkers can be used to differentiate between the stages of apoptosis.
To distinguish apoptotic from normal and necrotic cells, fluorescentdyes can be used to form complexes with DNA, such as acridine orange,ethidium bromide, or propidium iodide (Mercille and Massie, 1994b).Fluorescence microscopy following cell labeling clearly reveals chromatincondensation and fragmentation in apoptotic cells. By combining the useof fluorescent dyes that are able to label the chromatin in intact cells (e.g.acridine orange) with those that just label the chromatin in cells with adamaged membrane (e.g. ethidium bromide and propidium iodide), it ispossible to identify different levels of cell viability (Mercille and Massie,1994a).
Acridine orange is able to penetrate cells independently of the integrityof the cell membrane. It intercalates the bases in double strands of DNAand emits green fluorescent light. It can also form complexes with RNAand single-stranded DNA, but in this case it does not intercalate the basesand emits red fluorescent light. Thus, a viable cell can be visualized with agreen nucleus and, possibly, reddish spots in the cytoplasm.
Ethidium bromide is not able to permeate the plasma membrane, andonly penetrates non-viable cells that have lost the selective permeability ofthe membrane. It can intercalate the bases of double-stranded DNAmolecules, emitting an orange fluorescent light. Ethidium bromide alsoforms weak complexes with RNA, resulting in red fluorescence. Thus,non-viable cells will present a strong orange fluorescence, since ethidium
Mechanisms of cell proliferation and cell death in animal cell culture in vitro 157

bromide labeling overlays acridine orange fluorescence. If there is stillcytoplasmic material inside the cell, it will be labeled dark red.
As shown in Figure 7.3 (see color section), the morphologies observedin a sample incubated with acridine orange and ethidium bromide allowthe identification of four levels of cell viability, as described below:
(i) Viable nonapoptotic (VNA) cells show the nucleus uniformly coloredgreen, with no chromatin condensation. In this cell population, onlyacridine orange is able to penetrate the cells and bind to the DNA.
(ii) Early apoptotic cells, also called viable apoptotic (VA), show brilliantgreen granules in the nuclear region. These granules correspond to thecondensed and fragmented chromatin, which means that the cellshave already initiated the apoptotic process, but still keep the selectivepermeability of the membrane. In this phase, the formation ofapoptotic bodies containing material that will be expelled by the cellscan be observed.
(iii) Late apoptotic cells, also known as non-viable apoptotic (NVA), arecolored reddish-orange, with granules in the nuclear region showingbrilliant orange fluorescence. The cells have lost membrane integrityand have become permeable to ethidium bromide. Another character-istic of this phase is the decrease in cell size, due to the loss of cellmaterial as a result of elimination of apoptotic bodies.
(iv) Necrotic cells are totally colored orange, indicating loss of selectivepermeability of the membrane. These cells do not show any conden-sation or fragmentation of the chromatin, and present no decrease insize. On the contrary, there is a tendency for an increase in cellvolume. No apoptotic bodies are formed. This stage is very short, andcell lysis occurs within a short time.
7.5.3 Membrane asymmetry
Translocation of the phosphatidylserine from the inner to the outer leafletof the plasma membrane is an initial event related to the apoptotic processand possibly serves as a signal for the removal of apoptotic bodies byphagocytic cells (Martin et al., 1995). The exposure of this phospholipidhas been largely used as a specific apoptosis marker.
Membrane asymmetry changes can be detected by flow cytometry usinga fluorescent marker (e.g. fluorescein, FITC) conjugated to annexin V, aprotein that has high affinity for phosphatidylserine. When using afluorescence microscope, this technique can be quantitative if a hemocyt-ometer is used.
Unfortunately, annexin V also binds to phosphatidylserine residues inthe inner leaflet of the plasma membrane of necrotic cells due to the loss ofintegrity of the membrane. However, the use of propidium iodide as acounter-marker allows viable, apoptotic, and necrotic cells to be distin-guished (Plasier et al., 1999).
158 Animal Cell Technology

7.5.4 Apoptotic proteins
There are a large number of genes related to apoptosis, and the corre-sponding proteins modulate the cell death process. Tests that detect theseproteins or their activities are largely used to detect apoptosis in cellculture. This group of apoptotic proteins is very large and, theoretically,any key protein participating in apoptotic pathways, such as p53 proteinand caspases 3 and 7, can be used to detect apoptosis (Kim and Lee, 2002;Arden and Betenbaugh, 2004).
7.5.5 Cytochrome c release
Alterations of the mitochondrial membrane may precede those that occurin the nucleus. These changes can involve both the inner and the outermembrane, leading to a dissipation of the transmembrane potential and/orto the release of intermembrane proteins through the outer membrane.The main group of proteins responsible for mitochondrial alterationsconsist of the proteins known as Bax, which form pores in the outermembrane, causing the release of cytochrome c to the cytoplasm (Loefflerand Kroemer, 2000; Arden and Betenbaugh, 2004). Western blot techni-ques can be used to specifically detect the presence of cytochrome c in thecytoplasm of apoptotic cells. However, complex purification protocols arerequired, and there is the possibility of incomplete separation ofmitochondria from the cytoplasm; therefore, this technique is not verypopular.
7.6 Apoptosis suppression by molecular techniques
7.6.1 Molecular basis of apoptotic cell death
Much of the current knowledge of the genetic regulation of apoptosisbegan with genetic studies of the nematode Caenorhabditis elegans, inwhich 131 of 1090 somatic cells formed during adult development die byapoptosis. This cell death is regulated by a group of approximately 13genes (Horvitz et al., 1994). The apoptotic mechanism identified in C.elegans seems to be highly evolutionarily conserved in vertebrates andinvertebrates, since homolog genes were also discovered in mammals,although in a much greater amount.
The events involved in apoptosis can be divided into four phases:initiation, signaling, effector, and degradation (Mastrangelo and Beten-baugh, 1998). During the initiation phase, the cell is exposed to insults thattrigger the apoptotic cascade. The main insults found in cell cultures are:nutrient depletion (such as glucose, glutamine, and other amino acids),deprivation of growth and survival factors (e.g. factors in fetal bovineserum), accumulation of toxic metabolites (ammonia and lactate), oxygenconcentration (hypoxia and hyperoxia), hydrodynamic stress, loss of celladhesion (e.g. during suspension adaptation), viral infection (e.g. whenviral vectors are used for recombinant DNA transfer), and protein over-expression. Once apoptosis has been triggered (initiation), the message istransmitted through the signaling cascade during the signaling phase. This
Mechanisms of cell proliferation and cell death in animal cell culture in vitro 159

stage of apoptosis includes several parallel pathways that converge to afew or even a single pathway of the effector phase. Each insult probablyactivates a different signaling cascade pathway, finally leading to theeffector phase, which involves the activation of caspases, the proteasesresponsible for cellular degradation (Dickson, 1998). During this lastphase, which is irreversible, it is possible to observe the specific morpholo-gical changes of apoptosis, such as chromatin condensation, nuclearfragmentation, cellular shrinkage, blebbing of plasma membrane, andformation of apoptotic bodies. Different cell lines respond to differentinsults with varying intensities, possibly as a result of activation of differ-ent apoptotic pathways (Singh and Al-Rubeai, 1998).
The caspase family
The characteristic morphological features of apoptosis are due to the director indirect action of caspases, a highly conserved protease group (Alnemriet al., 1996). Caspases are cysteine-aspartate proteases, members of acysteine-protease family that specifically cleave their substrates afteraspartic acid residues. To date, at least 14 mammalian caspases have beenidentified. Although they share a common structure, they can be dividedinto two functional groups: those that participate in the apoptosis process(caspases 2, 3, 6, 7, 8, 9, 10, and 12) and those that are responsible forcytokine processing during immune response and are involved in theinflammatory process (caspases 1, 4, 5, and 11) (Alnemri et al., 1996).However, due to the lack of functional information on some of thecaspases (e.g. caspases 2, 4, 5, 7, 11, 12, and 13), the exact division betweenthe two groups is still ambiguous.
Caspases are expressed as zymogens or procaspases and require aproteolytic cleavage at specific aspartic acid residues to become active.These cleavages generate four fragments: the N-terminal prodomain (2–25kDa), the large subunit (17–21 kDa), the C-terminal small subunit (10–13kDa), and a small linker between large and small subunits (Figure 7.4).Some caspases do not possess the small linker. An active caspase consistsof a heterotetramer containing two small and two large subunits, whichare derived from two procaspase molecules (Walker et al., 1994). The N-terminal prodomain and the linker (if present) are removed from themature and active caspase. The observation that caspases, to become active,undergo the same process as their substrates (they are cleaved at asparticacid residues) suggests a caspase proteolytic cascade, that is, an activecaspase can subsequently cleave and activate other procaspases (Thorn-berry et al., 1997).
Caspases involved in the apoptotic process can be subclassified asinitiator or effector caspases, depending on the structure of their prodo-main. This also reflects their different roles in the apoptotic cascade(Earnshaw et al., 1999).
Initiator caspases (caspases 2, 8, 9, 10, and 12) possess a functionalprodomain. This prodomain is large and contains interaction domains(structural motifs) where adaptor proteins, like Apaf-1 and FADD, canbind. The interaction with adaptor proteins is important for the caspaseactivation process. There are two types of interaction domains: DED
160 Animal Cell Technology

(death effector domain) and CARD (caspase recruitment domain) (Muzioet al., 1996; Hofmann et al., 1997). The contact with CARD domains isbased on electrostatic interactions, while the contact with DEDs is basedon hydrophobic interactions. Caspases 2, 9, and 12 have CARDs andcaspases 8 and 10 have DEDs. Generally, initiator caspases act upstream ofthe effector caspases and are responsible for their activation (Thornberryet al., 1997; Earnshaw et al., 1999).
The main activation mechanism of initiator caspases is autoproteolytic,which is dependent on procaspase aggregation. Caspases possess lowintrinsic enzymatic activity when in a zymogen form. Their catalyticactivity increases when they are cleaved and assembled into tetramers(Yamin et al., 1996). It has been observed that procaspase aggregation oroligomerization facilitates intermolecular proteolysis, which results inautocatalysis (Srinivasula et al., 1998; Yang et al., 1998). Adaptor proteinsrecruit and bring together initiator caspases into activating complexes,which allows the autoactivation.
Effector caspases (caspases 3, 6, and 7) may possess a small inactiveprodomain or may lack it completely, since they do not need to form
Caspase 1
Caspase 2
Caspase 3
Caspase 4
Caspase 5
Caspase 6
Caspase 7
Caspase 8
Caspase 9
Caspase 10
Caspase 14
CARD
CARD
CARD
CARD
CARD
DED DED
DED DED
316 331152 435
297 317119 404
17528 277
270 290 377
311 331 418
179 19423 293
19823 303
374 385216 479
315 331 416
415219 521
242
Procaspase domain structure
Preferred
substrate
sequence
WEHDYEVD
DEHDVDVAD
DEVDDNQD
LEVD(W/L)EHD
(W/L)EHD
VEIDVEHD
DEVD
(I/L)ETD
LEHD
IEAD
?
Function
Inflammation
Apoptosis
Apoptosis
Inflammation
Inflammation
Apoptosis
Apoptosis
Apoptosis
Apoptosis
Apoptosis
Keratinocytes
differentitation?
Figure 7.4
Caspase family. This scheme illustrates the domain structures, internal cleavagesites, preferred peptide substrate sequences, and biological function of caspases.Each procaspase consists of a large and small domain and may also possess DED(death effector domain) and CARD (caspase recruitment domain) (adapted fromHill et al., 2003).
Mechanisms of cell proliferation and cell death in animal cell culture in vitro 161

aggregates to be active. After being activated, generally by initiatorcaspases, the effector caspases are responsible for the death signal amplifi-cation, for example, caspase 9 activates others caspases, like caspase 3,which in turn cleaves and activates more caspase 9, thus amplifying theapoptotic signal (Slee et al., 1999).
Effector caspases are activated by a transactivation mechanism, which ischaracterized by the catalytic action of a mature caspase on a procaspase(Thornberry et al., 1997; Earnshaw et al., 1999; Slee et al., 1999). Never-theless, their activation can also occur by the action of other proteases.Granzyme B, a serine-protease, also has proteolytic specificity for asparticacid residues. It is able to cleave and directly activate caspase 3 (Darmon etal., 1995). Cathepsin B, a lysosomal protease, cleaves and activates procas-pase 11 (Schotte et al., 1998).
Effector caspases also interact with other molecules besides caspases.These caspases interact and cleave key regulatory and structural proteins(Earnshaw et al., 1999) that can be directly inactivated, directly activated,or can modulate the function of other proteins as a result of cleavage. Themain substrates directly inactivated are structural proteins, which losetheir function, like cytoskeleton proteins (actin, gelsolin, Æ-foldrin); com-ponents of gap junctions (�-cathenin, plakoglobin), and nuclear proteins(lamin A and B); proteins involved in metabolism and DNA repair (DNAtopoisomerase II, PARP); signaling proteins, like transcriptional activators(NFkB) and kinases (Akt, FAK); and antiapoptotic proteins (Bcl-2, Bcl-XL). The cleavage of cytoskeleton and gap junction proteins results in cellsbecoming spherical and detaching from the surface and from neighborcells. The cleavage of lamin A and B contributes to the break up of thenucleus into vesicles. Examples of proteins activated after cleavage are thecaspases themselves, proapoptotic proteins, like Bid and Bax, and kinases(PAK2, MEKK1). These two kinases, when activated, are capable ofactivating the SAPK/JNK pathway, which increases the transcription ofproapoptotic genes under the control of the transcription factor c-Jun.Caspases can also modulate the activity of specific proteins by inactivatinginhibitors of these proteins, such as DNAse CAD/DFF40, which isconstantly inactivated by its inhibitor ICAD. This inhibitor is a caspase 3substrate, and CAD/DFF40 release results in chromosome cleavage atinternucleosomal spaces. These irreversible proteolytic events are respon-sible for the morphological changes displayed by apoptotic cells.
Caspase activation occurs as a late and common step in all cells under-going apoptosis. Nevertheless, there are many initial pathways that canresult in caspase activation. Probably, each distinct pathway is triggeredby different apoptotic stimuli. In mammalian cells, the apoptotic responseis usually mediated by the intrinsic and extrinsic pathways, depending onthe origin of the death signal. The intrinsic pathway can further be dividedinto mitochondrial and ER stress pathways.
The Bcl-2 family and the intrinsic mitochondrial pathway
Besides its role as the energy-generating organelle, the mitochondrion hasrecently emerged as the center of conversion of cellular life and deathsignals. This organelle contains, in its intermembrane space, apoptogenic
162 Animal Cell Technology

factors, like cytochrome c, AIF (apoptosis-inducing factor), procaspases 2,3, and 9, Smac/DIABLO (second mitochondrial activator of caspases/direct inhibition of apoptosis protein IAP binding protein with low pI),Omi/HtrA2, and endonuclease G (Gross et al., 1999). In the presence ofapoptotic signals, these factors are released into the cytoplasm and a fewof them participate in caspase activation. This apoptotic pathway centeredon the mitochondria is known as the intrinsic mitochondrial or mitochon-dria-dependent caspase activation pathway.
Proteins of the Bcl-2 family are responsible for the maintenance orrelease of these factors from the mitochondria into the cytoplasm. For thisreason, this family and the caspase family are considered as the mainregulators of the apoptosis process (Gross et al., 1999; Cory and Adams,2002; Kuwana and Newmeyer, 2003). To date, at least 20 members of theBcl-2 family have been identified, which can be divided into two maingroups, depending on their function. The proapoptotic group containsmembers (e.g. Bax, Bcl-XS, Bak, Bad, Bid, Bik) that induce the release ofapoptogenic factors from the mitochondria into the cytoplasm, resultingin apoptosis. On the other hand, the antiapoptotic group contains proteins(e.g. Bcl-2, Bcl-XL, Mcl-1, Bcl-w, Boo) that are responsible for themaintenance of these factors inside the mitochondria, inhibiting theapoptotic process (Adams and Cory, 1998).
Members of the Bcl-2 family share one or more Bcl-2 homology (BH)domains, named BH1, BH2, BH3, and BH4 (Adams and Cory, 1998). It isnot yet clear which structural features determine if these proteins possesspro- or anti-apoptotic activities. However, some studies revealed that theBH3 domain is a critical domain for the proapoptotic members (Chitten-den et al., 1995). Besides BH domains, some contain a hydrophobicdomain in the C-terminal region, which is essential for the attachment tointracellular membranes, like the outer mitochondrial, nuclear, and endo-plasmic reticulum membranes (Krajewski et al., 1993; Nguyen et al., 1993).
In the absence of a death signal, most of the pro- and anti-apoptoticmembers are located in separate subcellular compartments. Anti-apoptoticproteins are inserted in intracellular membranes, mainly the mitochondrialmembrane, while some proapoptotic members are located in the cyto-plasm or cytoskeleton in an inactive form. They are activated and translo-cated by apoptotic stimuli to their place of action to perform theirfunctions (Gross et al., 1999).
A remarkable feature of the Bcl-2 proteins is their ability to interactwith one another to form either homo- or hetero-dimers (Oltvai et al.,1993). The formation of hetero-dimers between pro- and anti-apoptoticmembers suggests a competitive neutralization of their activities. Ahealthy cell maintains a balance between these groups of proteins and adestabilization in their relative concentration determines, at least in part,the decision for cell survival or cell death (Gross et al., 1999).
Proapoptotic proteins can be further classified according to their BHdomains (Figure 7.5). Some members, such as Bax and Bak, contain multi-ple domains and others, like Bid, Bad, Bim, and Bmf, contain only theBH3 domain (Gross et al., 1999; Kuwana and Newmeyer, 2003). Thesestructural differences also reflect differences in their function. Multi-domain proteins directly induce outer mitochondrial membrane permeabi-
Mechanisms of cell proliferation and cell death in animal cell culture in vitro 163

lization with consequent release of apoptogenic factors into the cytoplasm(Desagher et al., 1999; Zong et al., 2001). On the other hand, the proteinswith only the BH3 domain are considered the essential initiators of the celldeath program (Huang and Strasser, 2000; Bouillet and Strasser, 2002).When activated by apoptotic stimuli, the BH3-only proteins have twofates: (1) some are targeted to the outer mitochondrial membrane andheterodimerize with Bcl-2 and Bcl-XL, neutralizing the action of these
BH3BH4 BH1 BH2
BH3BH4 BH1 BH2
BH3BH4 BH1 BH2
BH3BH4 BH1 BH2
BH3BH4 BH1 BH2
BH3BH4 BH1 BH2
BH3 BH1 BH2
BH3 BH1 BH2
BH3 BH1 BH2
BH3
BH3
BH3
BH3
BH3
BH3
BH3
BH3
BH3
BH3
BH3 BH3
Bcl-2
Bcl-xL
Bcl-w
Mcl-1
A1
Boo/Diva
Bax
Bak
Bok/Mtd
Bid
Bad
Bim
Bmf
Bik
Hrk/DP5
Blk
Nip3
BNip3/Nix
Puma
Noxa
Antiapoptotic
TM
Proapoptotic
Multidomain
BH3-only
Figure 7.5
Classification scheme of the Bcl-2 family members. TM refers to the hydrophobicC-terminal region, which is probably a transmembrane domain (adapted fromKuwana and Newmeyer, 2003).
164 Animal Cell Technology

antiapoptotic proteins and allowing, indirectly, multidomain proapoptoticBax and Bak proteins to release apoptogenic factors from the mitochon-dria; (2) others, besides the previously described function, are also respon-sible for the direct activation of the multidomain proteins, as is the case forBid (Desagher et al., 1999; Eskes et al., 2000) and probably Bim (Letaiet al., 2002). At least two events seem to be critical for Bax and Bak torelease apoptogenic factors into the cytoplasm homodimerization andinsertion into the outer mitochondrial membrane (Bouillet and Strasser,2002).
It is not clear whether each member of this subgroup is activated by aparticular stimulus and through a specific mechanism, or whether theirroles are redundant. Nevertheless, it is possible that different BH3-onlydomain proteins, or their combinations, are critical for apoptosis in differ-ent cell types.
Tridimensional structure analysis of some Bcl-2 family members, suchas Bcl-XL, Bcl-w, Bax, and Bid, surprisingly revealed that pro- and anti-apoptotic proteins share common structures (Kuwana and Newmeyer,2003). The BH3 domain is buried inside the molecule, and it has beensuggested that it is essential for activity of the proapoptotic members andhas to be exposed to render the protein active. Therefore, in a healthy cell,proapoptotic members are inactive, with the BH3 domain hidden insidethe molecule. However, by receiving apoptotic signals, they undergo aconformational change, exposing this domain and, thus, acquiring pro-apoptotic activity.
In some molecules, such as Bid, Bax, Bak, Bmf, and Bim, the N-terminalregion acts as an inhibitory domain, hiding the BH3 domain (Gross et al.,1999). Bid must be cleaved by caspase 8, and its truncated form (withoutthe N-terminal) translocates to the mitochondria to interact with Bax and/or Bak, activating them (Li et al., 1998; Desagher et al., 1999). Prior to theapoptotic signal, Bmf and Bim are found associated with cytoskeletoncomplexes by the N-terminal region. In the presence of these signals, theydissociate from these complexes and translocate to the mitochondria tobind Bcl-2 and Bcl-XL, antagonizing their antiapoptotic activity (Puthala-kath et al., 1999, 2001). Bax and Bak require the interaction with someBH3-only proteins to derepress their N-terminal domain, exposing notonly their BH3-only domain, but also a C-terminal hydrophobic domain,which allows them to become integral proteins in the outer mitochondrialmembrane and induce the release of apoptogenic factors (Goping et al.,1998; Desagher et al., 1999). Bad is phosphorylated at two serine residues(Ser-112 and Ser-136), which allows it to be sequestered by the cytosolicprotein 14-3-3, keeping it inactivated (Zha et al., 1996). In the presence ofapoptotic signals, Bad is dephosphorylated, resulting in its dissociationfrom the 14-3-3 protein and its translocation to the outer mitochondrialmembrane to bind to Bcl-2 and Bcl-XL (Kelekar et al., 1997; Ottilie et al.,1997). It is suggested that Bad phosphorylation regulates the BH3 domainexposure (Zha et al., 1997). Antiapoptotic proteins can also be convertedto proapoptotic if they expose their BH3 domains (Cheng et al., 1997).
However, not all proapoptotic members are regulated post-translation-ally. Some, such as Noxa, Puma, and HRK, are regulated transcriptionally.Noxa and Puma are regulated by the p53 protein and, therefore, are critical
Mechanisms of cell proliferation and cell death in animal cell culture in vitro 165

for an apoptosis process induced by DNA damage (Oda et al., 2000;Nakano and Vousden, 2001), while HRK is regulated by the JNK-dependent mechanism (Harris and Johnson, 2001). Some post-translation-ally regulated proteins can also be regulated transcriptionally, such as Bax,which can also be regulated by p53 (Miyashita and Reed, 1995). Antiapop-totic members, like Bcl-XL, Mcl-1, A-1 and, less frequently, Bcl-2, canalso be regulated transcriptionally (Gross et al., 1999).
The exact manner of how proapoptotic proteins induce the release ofapoptogenic factors from the mitochondrial intermembrane space into thecytoplasm and how antiapoptotic proteins prevent it remains obscure.
The protection conferred by antiapoptotic members may occur bytheir direct binding to proapoptotic members, sequestering the BH3-only proteins and therefore preventing the activation of Bax and Bak ordirectly neutralizing the activity of the multidomain proteins (Oltvaiand Korsmeyer, 1994). The heterodimerization between members ofBcl-2 family occurs by the insertion of the BH3 domain of theproapoptotic protein into a hydrophobic pocket formed by the BH1,BH2, and BH3 domains on the surface of the antiapoptotic protein(Sattler et al., 1997). Bcl-2 and Bcl-XL do not prevent Bid-inducedconformational change of Bax and Bak (Desagher et al., 1999). How-ever, they block the release of apoptogenic factors from the mitochon-dria. Some mutants of Bcl-XL that have lost the ability to formheterodimers with Bax and Bak can still suppress cell death by apopto-sis, suggesting the existence of a protection mechanism independent ofheterodimer formation (Cheng et al., 1996).
In the literature, two main mechanisms have been proposed that couldexplain how Bax and Bak induce the release of apoptogenic factors,especially cytochrome c. The first model of outer mitochondrial mem-brane permeabilization predicts the occurrence of homo-oligomerizationof Bax (probably four molecules) and Bak, resulting in the formation ofchannels just wide enough for the passage of cytochrome c. The passageof other apoptogenic factors is still contested (Antonsson et al., 1997;Saito et al., 2000; Kuwana et al., 2002; Kuwana and Newmeyer, 2003).The second model is based on the activity regulation of pre-existentchannels, such as the permeability transition pore (PTP) (Marzo et al.,1998; Narita et al., 1998; Kuwana and Newmeyer, 2003). PTP is amultiprotein channel, formed by components of both the outer and innermitochondrial membranes and matrix proteins, including VDAC (vol-tage-dependent anion channel, also known as mitochondrial porin), ANT(adenine nucleotide translocator), and cyclophilin D, respectively(Crompton et al., 1999). Bax, Bak, and Bcl-XL have been found tointeract with VDAC (Narita et al., 1998; Shimizu et al., 1999), and Baxto interact with ANT (Marzo et al., 1998). The PTP opening would befollowed by the swelling of the mitochondrial matrix and the rupture ofthe outer membrane. In this context, the release of apoptogenic factorswould not be specific and would occur indirectly, as a result of therupture of the outer membrane. When PTP is induced, the innermitochondrial membrane potential (˜łm) becomes dissipated, leading tothe loss of mitochondrial functions, such as energy production andprotein import.
166 Animal Cell Technology

Some authors suggest that the mitochondria, especially the inner mem-brane, remain intact during apoptosis. Thus, it is suggested that PTPactivation is not involved or that cells starting to die by apoptosis couldswitch to necrosis, therefore activating the PTP (Antonsson, 2001). Never-theless, it is important to remember that these contradictory results canoccur since apoptosis can be activated by distinct mechanisms in differentcell types by different apoptotic signals. It is also possible that bothmechanisms are correct. Bax and Bak oligomers can form channels for theinitial release of cytochrome c, followed by a larger flux through PTP. Inboth cases, antiapoptotic proteins Bcl-2 and Bcl-XL seem to inhibit theformation of both kinds of channels.
Following the outer mitochondrial membrane permeabilization, theapoptogenic factors are released into the cytoplasm. Among them, cyto-chrome c has an important role in caspase activation, because it is thecofactor for assembling a large caspase 9 activating complex in thecytoplasm, called apoptosome. Along with cytochrome c, the Apaf-1protein and dATP or ATP are required to form this complex in thecytoplasm (Hill et al., 2003).
Apaf-1 consists of three functional domains: an N-terminal CARD, acentral NBD (nucleotide-binding domain), and WD-40 repeats at the C-terminal region (Figure 7.6). In the absence of cytochrome c, Apaf-1 existsas a monomer in a compact, auto-inhibited form (Hu et al., 1998; Acehanet al., 2002). When cytochrome c and dATP (or ATP) are present, Apaf-1is forced into a more open conformation, facilitating the oligomerizationwith adjacent Apaf-1 molecules (Jiang and Wang, 2000) and the cyto-chrome c association with the WD-40 repeats (Acehan et al., 2002). Theapoptosome assembly is illustrated in Figure 7.6.
It has been suggested that the apoptosome is formed by the oligomer-ization of seven Apaf-1 molecules, resulting in a wheel-like structure. Thisstructure comprises a central hub connected to seven radial spokes, asshown in Figure 7.6. The model suggests that the ring is composed ofseven Apaf-1 CARD domains held together in close proximity. Apaf-1central and C-terminal regions form spokes projecting outward from thehub (Qin et al., 1999; Acehan et al., 2002). The procaspase 9 is recruitedinto the apoptosome through interaction with Apaf-1 with the procaspase9 CARD domains, at a 1:1 proportion (Budihardjo et al., 1999; Jiang andWang, 2004). The procaspase 9 aggregation leads to autoproteolysis (Salehet al., 1999). Caspase 9 and the apoptosome form an active holoenzyme,responsible for the activation of downstream effector caspases, such ascaspases 3 and 7 (Bratton et al., 2001).
After caspase 9 activation, the death signal is propagated by downstreamcaspase activation. Caspase 9 directly activates caspases 3 and 7. Caspase 3,in turn, processes and activates caspases 2 and 6 and also caspase 9,therefore amplifying the death signal. Caspase 6 cleaves and activatescaspases 8 and 10 (Slee et al., 1999).
Besides cytochrome c and procaspase 9, other important apoptogenicfactors are also released from the mitochondria, such as SMAC/DIABLO,Omi/HrtA2, AIF, and endonuclease G. The function of SMAC/DIABLOand Omi/HrtA2 is to activate caspase by suppressing the caspase inhibi-tory activity of IAP (Du et al., 2000; Verhagen et al., 2000). The protein
Mechanisms of cell proliferation and cell death in animal cell culture in vitro 167

family IAP, which contains members like survivin, xIAP, cIAP1, cIAP2,inhibits caspase activity by directly binding to the active enzymes. Theseproteins contain one or more BIR (baculovirus IAP repeat) domains,which are responsible for the caspase inhibitory activity. In healthy cells,it is likely that IAP proteins serve to inhibit residual or unwanted caspaseactivity. SMAC/DIABLO directly binds to BIR domains of IAPs, inhibit-ing their functions. Since Omi/HtrA2 is a serine-protease, it proteolyti-cally cleaves and inactivates IAP proteins.
When AIF and endonuclease G are released into the cytoplasm, theydirectly translocate to the nucleus and induce DNA fragmentation andsubsequent chromosomal condensation, a remarkable morphological fea-ture of the apoptotic process. AIF induces chromatin digestion into largefragments of approximately 50 kb, probably by activating a nuclearDNAse. Therefore, these proteins are important for the caspase-indepen-dent apoptosis pathway.
CARD NBD WD-40 repeat region
A
Apoptotic stimulus
Mithocondrion
Cytochrome c
Apaf-1 dATP/ATP
Apoptosome
Procaspase-9
Active caspase-3/7 Procaspase-3/7
B
Figure 7.6
Scheme of the mechanism of apoptosome formation. (A) The Apaf-1 moleculepossesses three domains: CARD, NBC, and WD-40 repeats. (B) In the absence ofcytochrome c, Apaf-1 may exist in a compact, autoinhibited form, with the CARDregion buried between the lobes of WD-40 repeats. The binding of cytochrome cdisplaces the CARD region from the WD-40 repeats, forcing the molecule into amore open conformation. The interaction with dATP/ATP prevents thereassociation of CARD to the lobes of WD-40 repeats, facilitating the interactionwith other Apaf-1 molecules for the apoptosome assembly. Procaspases 9 arerecruited by a CARD:CARD interaction, leading to their autoprocessing (adaptedfrom Hill et al., 2003, and Jiang and Wang, 2004).
168 Animal Cell Technology

The intrinsic ER stress-induced pathway
The ER is an organelle in which most proteins acquire their tertiary andquaternary structures. It is also the Ca2þ storage site (Rao et al., 2004).Under certain conditions, such as disruption of Ca2þ homeostasis, hypoxiaor ischemia, or when there is an overload of proteins, an accumulation ofunfolded proteins occurs in the ER. This accumulation activates a com-pensatory mechanism called ER stress response or unfolded proteinresponse (UPR). This response consists of four distinct steps: a cell cyclearrest in G1/S phase; attenuation of protein synthesis to prevent furtherprotein aggregation and accumulation in this organelle; induction of ER-localized chaperone proteins to assist protein folding; and activation of aprotein degradation mechanism to eliminate unwanted protein aggregates.However, if the ER stress cannot be bypassed, it culminates in apoptosis(Szegezdi et al., 2003).
Since this ER pathway was discovered recently, not much is knownabout its signaling mechanism. However, it is clear that this pathway canunleash the apoptotic process through three distinct mechanisms. The firstmechanism is dependent on a transcription factor, the GADD153/CHOP.Although no target genes have been identified to date, it has beenspeculated that GADD153/CHOP can decrease Bcl-2 expression(McCullough et al., 2001).
The second mechanism is dependent on caspase 12 activation. Never-theless, it is still not clear how this activation occurs. Preliminarystudies showed a caspase activating complex containing VCP and ALG-2 proteins, which also possess apoptotic activities. This has suggestedthe existence of a caspase 12 activating complex, similar to the apopto-some, which was designated eraptosome (Hoppe et al., 2002; Kilic etal., 2002). The adaptor protein TRAF2 may be involved in procaspase12 aggregation, resulting in its cleavage and activation (Yoneda et al.,2001). The procaspase 12 may also be processed by caspase 7, through acleavage in the middle of its prodomain, which leads to autoprocessingbetween the prodomain and the large subunit, and between the largeand small subunits of caspase 12 (Szegezdi et al., 2003). Furthermore, itwas also suggested that caspase 12 can be processed by calpain. Thedisruption of Ca2þ homeostasis leads to calpain activation, which inturn translocates from the cytoplasm to the ER and cleaves off thecaspase 12 CARD prodomain. After this processing, this caspase isautoprocessed into large and small subunits (Szegezdi et al., 2003).Once activated, caspase 12 cleaves and activates the procaspase 9,triggering the remaining caspase proteolytic cascade. Calpain can alsocleave Bid.
The third mechanism is Ca2þ-dependent and also involves the intrinsicmitochondrial pathway. Some apoptotic stimuli induce Ca2þ release fromthe ER, and this process may be regulated by the Bcl-2 family membersthat reside in this organelle (Szegezdi et al., 2003). Bax and Bak seem toinduce Ca2þ release, while antiapoptotic members, such as Bcl-2, seem toreduce this process. Ca2þ ions released from the ER eventually accumulatein mitochondria, which induces permeabilization of the outer mitochon-drial membrane through PTP formation. Release of apoptogenic factors
Mechanisms of cell proliferation and cell death in animal cell culture in vitro 169

into the cytoplasm causes activation of caspase 9 and mitochondria-mediated apoptosis. Apoptogenic Bap31 protein, which resides in the ER,can be cleaved by caspase 8 and also seems to induce Ca2þ release fromthis organelle (Breckenridge et al., 2003).
The extrinsic or death receptor-induced pathway
The extrinsic pathway consists of a series of events initially induced bydeath receptors located on the cell surface. It is initiated by interaction ofextracellular death ligands with their respective receptors, located on thesurface of the plasma membrane. The death ligands are members of thetumor necrosis factor (TNF)/nerve growth factor (NGF) superfamily.TNF-R1, Fas (Apo-1/CD95), TRAIL-R1, TRAIL-R2, and NGF-R areexamples of death receptors. They are transmembrane proteins consistingof an external domain, where the ligand associates, and a cytoplasmicdomain, which contains the DD (death domain).
The death ligands, such as FasL, are typically homotrimeric molecules.When they bind to their receptors, which are monomers, they induceaggregation and trimerization of the receptors, resulting in their cytoplas-mic domains becoming physically closer together. The close proximity ofthe DDs results in the recruitment of adaptor proteins located in thecytoplasm, such as FADD and TRADD. These adaptor proteins alsopossess a DD and bind to the DD of the death receptors. FADD bindsmainly to Fas, while TRADD binds preferentially to TNF-R1. AfterTRADD binds to TNF-R1, FADD can bind to TRADD. FADD alsopossesses another domain, besides DD, which is called DED. Procaspases8 and 10 (initiator caspases) also possess the DED and are able to bind tothe adaptor protein through their DED, therefore assembling the DISC(death-inducing signaling complex) (Figure 7.7).
The DISC-induced procaspase assembly results in the autoactivation ofcaspases 8 and 10. The DISC process of caspase activation seems to beanalogous to the apoptosome process of caspase 9 activation. Caspase 8, inturn, cleaves and activates caspase 3, which is responsible for the apoptoticsignal amplification with subsequent cell collapse.
Some cell types maintain a low level of caspase 8 in the cytoplasm.Therefore, in the presence of apoptotic stimuli, this small amount ofcaspase 8 is activated in the DISC complex, and the subsequent activationof effector caspases is not possible. These cell types are called type II andalso require the mitochondrial pathway activation. These two pathwayscan communicate through the cleavage of a Bcl-2 member, Bid, by caspase8 (Li et al., 1998). Cell lines that have a higher level of caspase 8 in thecytoplasm are called type I. In these cells, Bcl-2 family members do notregulate the death receptor-mediated pathway.
The proteolytic cleavage of Bid removes its N-terminal portion, exposingthe BH3 domain (Li et al., 1998). The truncated Bid protein, called tBid orp15, translocates to the mitochondria, where it interacts with Bax or Bak,inducing a conformational change in these proteins (Desagher et al., 1999).This conformational change is necessary for the permeabilization of theouter mitochondrial membrane and the subsequent release of the apopto-genic factors into the cytoplasm, resulting in caspase 9 activation.
170 Animal Cell Technology
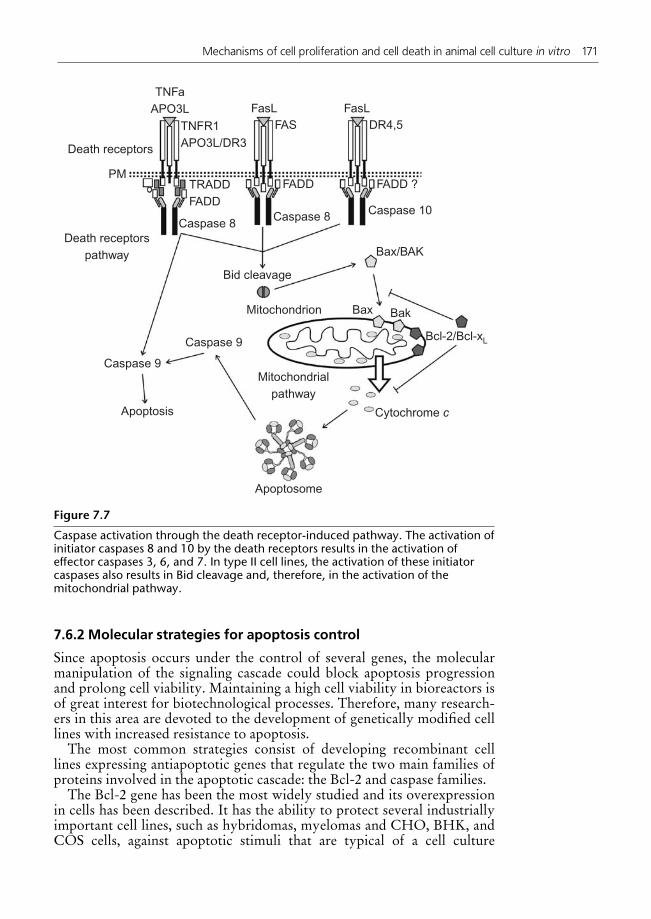
7.6.2 Molecular strategies for apoptosis control
Since apoptosis occurs under the control of several genes, the molecularmanipulation of the signaling cascade could block apoptosis progressionand prolong cell viability. Maintaining a high cell viability in bioreactors isof great interest for biotechnological processes. Therefore, many research-ers in this area are devoted to the development of genetically modified celllines with increased resistance to apoptosis.
The most common strategies consist of developing recombinant celllines expressing antiapoptotic genes that regulate the two main families ofproteins involved in the apoptotic cascade: the Bcl-2 and caspase families.
The Bcl-2 gene has been the most widely studied and its overexpressionin cells has been described. It has the ability to protect several industriallyimportant cell lines, such as hybridomas, myelomas and CHO, BHK, andCOS cells, against apoptotic stimuli that are typical of a cell culture
Death receptors
PM
TNFa
APO3L
TNFR1
APO3L/DR3
FASFasL FasL
DR4,5
TRADD
FADD
FADD FADD ?
Caspase 8
Caspase 9
Caspase 9
Caspase 8 Caspase 10
Death receptors
pathway
Apoptosis
Bid cleavage
Mitochondrion Bax
Bax/BAK
Bak
Bcl-2/Bcl-xL
Cytochrome c
Mitochondrial
pathway
Apoptosome
Figure 7.7
Caspase activation through the death receptor-induced pathway. The activation ofinitiator caspases 8 and 10 by the death receptors results in the activation ofeffector caspases 3, 6, and 7. In type II cell lines, the activation of these initiatorcaspases also results in Bid cleavage and, therefore, in the activation of themitochondrial pathway.
Mechanisms of cell proliferation and cell death in animal cell culture in vitro 171

process, such as nutrient deprivation, serum withdrawal, oxygen limita-tion, hydrodynamic stress, accumulation of toxic metabolites, and viralinfection. In almost all cases, this overexpression prolonged cell viability.However, eventually, the cultures displayed different phenotypes. In somecases, the cell density increased, but in others a growth arrest was observed(Vives et al., 2003a). Moreover, the effect of this overexpression in theproductivity of recombinant proteins is variable. In some cases, an increasein productivity was observed, while in other cases there was no significanteffect or even a decrease in productivity (Vives et al., 2003a; Tey andAl-Rubeai, 2004). In most cases, the level of Bcl-2 expression correlateswith the level of protection. Nevertheless, the expression of Bcl-2 hasshown little to no apoptosis protection in some cell types, as in the case ofHeLa, NS0, and insect (Sf9) cells (Vives et al., 2003a). Overexpression ofBcl-XL has also been efficient in the control of apoptosis (Charbonneauand Gauthier, 2000; Mastrangelo et al., 2000a, 2000b).
The cells probably have an intrinsic regulation mechanism for the levelof antiapoptotic proteins. In the Bcl-2 case, the regulation occurs throughthe action of caspase 3, resulting in a 23 kDa fragment with proapoptoticactivity. Therefore, the overexpression of Bcl-2, and probably Bcl-XL,may not be completely efficacious, because at some point these proteinswill be degraded or even modified into proapoptotic proteins. To bypassthis situation, a Bcl-2 mutant, resistant to the intrinsic cell regulation, wasexpressed in CHO and BHK cells and showed improved efficacy over thewild-type protein (Figueroa et al., 2001). Also, some viral Bcl-2 homologgenes, such as E1B-19kDa (from adenovirus), BHRF1 (from Epstein–Barrvirus), and KSBcl-2 (from Kaposi’s sarcoma-associated herpesvirus) havebeen studied, since they are resistant to the intrinsic cell regulation (Viveset al., 2003b). Although the overexpression of Bcl-2 gene could not protectNS0 cells from apoptosis, the expression of the E1B-19kDa analog could.This suggests a different mechanism of action between E1B-19kDa andBcl-2 in inhibiting apoptosis (Mercille et al., 1999).
There are just a few studies of the use of caspase inhibitors to preventapoptosis. Most studies concentrate on the expression of proteins of theIAP family (XIAP being the most noticeable) and the viral componentsp35 and CrmA (Vives et al., 2003a). CrmA, encoded by the smallpoxvirus, is a pseudo-substrate for serine and cysteine proteases. It inhibitscaspases 1, 8, and 10 in several cell types (Sauerwald et al., 2003). p35 is awide-spectrum caspase inhibitor encoded by baculoviruses, and it alsobehaves as a pseudo-substrate, inhibiting caspases 1, 3, 6, 7, 8, and 10(Zhou et al., 1998). XIAP is the most potent member of the IAP family. Itis found in the mammalian genome and is responsible for the inhibition ofcaspases 3, 7, and 9 (Sauerwald et al., 2002). An increased protective effectis found in CHO and HEK-293 cells expressing a XIAP mutant resistantto degradation (XIAP-BIR123) when compared with the wild-type pro-tein (Sauerwald et al., 2002).
Numerous pathways are involved in the activation of apoptosis,although at some point, all these pathways seem to converge to a fewrelated ones. In order to be more efficient, molecular strategies to preventapoptosis should concentrate on these few steps of the apoptotic cascadethat are common to all cell types and to different apoptotic stimuli. For
172 Animal Cell Technology

this reason, research on genetic manipulation to prevent apoptosis isfocusing on the last steps of the cascade. While many strategies haveenabled a delay of the apoptotic process, so far none is capable ofcompletely circumventing it. This suggests that the cells may have othermechanisms available to overcome the antiapoptotic activity of the ex-pressed proteins. It is also possible that the heterologous gene is lostduring cellular division or that death by other mechanisms, such asnecrosis, is responsible for the inability to completely circumvent celldeath.
7.7 Conclusions and perspectives
Complex phenomena regulate cell proliferation and cell death both in vivoand in vitro. The increasing understanding of these phenomena is servingas a basis for studies aimed at improving the performance of biotechnolo-gical processes based on in vitro animal cell culture. Multidisciplinaryresearch projects, involving groups from different disciplines, such asbiology and engineering, are advancing towards the development oftechniques to control cell proliferation and cell death, with the aim ofincreasing the longevity and robustness of cells in culture. The outcomeof these studies will constitute, in the future, important tools to increaseproductivity, predictability, and reliability of animal cell culture processes.
References
Acehan D, Jiang X, Morgan DG, Heuser JE, Wang X, Akey CW (2002), Three-dimensional structure of the apoptosome: implications for assembly, procaspase-9binding, and activation, Mol. Cell. 9:423–432.
Adams JM, Cory S (1998), The Bcl-2 protein family: arbiters of cell survival, Science281:1322–1326.
Alberts B, Johnson A, Lewis J, Raff M, Roberts K, Walter P (2002), Molecular Biologyof the Cell, 4th Ed., Garland Science, New York.
Alnemri ES, Livingston DJ, Nicholson DW, Salvesen G, Thornberry NA, Wong WW,Yuan J (1996), Human ICE/CED-3 protease nomenclature, Cell 87:171.
Al-Rubeai M (1998), Apoptosis and cell culture technology, Adv. Biochem. Eng.Biotechnol. 59:225–249.
Al-Rubeai M, Singh RP (1998), Apoptosis in cell culture, Curr. Opin. Biotechnol.9:152–156.
Al-Rubeai M, Emery AN, Chalder S, Jan DC (1992), Specific antibody productivityand the cell-cycle comparisons of batch, continuous and perfusion cultures,Cytotechnology 45:463–472.
Al-Rubeai M, Singh RP, Goldman MH, Emery AN (1995a), Death mechanisms ofanimal cells in conditions of intensive agitation, Biotechnol. Bioeng. 45:463–472.
Al-Rubeai M, Singh RP, Emery AN, Zang Z (1995b), Cell cycle and cell sizedependence of susceptibility to hydrodynamic forces, Biotechnol. Bioeng. 46:88–92.
Antonsson B (2001), Bax and other pro-apoptotic Bcl-2 family ‘‘killer-proteins’’ andtheir victim, the mitochondrion, Cell Tissue Res. 306:347–361.
Antonsson B, Conti F, Ciavatta A, Montessuit S, Lewis S, Martinou I, Bernasconi L,Bernard A, Mermod JJ, Mazzei G, Maundrell K, Gambale F, Sadoul R, MartinouJC (1997), Inhibition of Bax channel-forming activity by Bcl-2, Science 277:370–372.
Mechanisms of cell proliferation and cell death in animal cell culture in vitro 173

Arden N, Betenbaugh MJ (2004), Life and death in mammalian cell culture: strategiesfor apoptosis inhibition, Trends Biotechnol. 22:174–180.
Bekaert S, Derradji H, Baatout S (2004), Telomere biology in mammalian germ cellsand during development, Dev. Biol. 274:15–30.
Bouillet P, Strasser A (2002), BH3-only proteins – evolutionarily conserved proapop-totic Bcl-2 family members essential for initiating programmed cell death, J. CellSci. 115:1567–1574.
Bratton SB, Walker G, Srinivasula SM, Sun XM, Butterworth M, Alnemri ES, CohenGM (2001), Recruitment, activation and retention of caspases-9 and -3 by Apaf-1apoptosome and associated XIAP complexes, EMBO J. 20:998–1009.
Breckenridge DG, Stojanovic M, Marcellus RC, Shore GC (2003), Caspase cleavageproduct of BAP31 induces mitochondrial fission through endoplasmic reticulumcalcium signals, enhancing cytochrome c release to the cytosol, J. Cell Biol.160:1115–1127.
Brown DG, Sun X-M, Cohen GM (1993), Dexamethasone-induced apoptosis involvescleavage of DNA to large fragments prior to internucleosomal fragmentation,J. Biol. Chem. 268:3037–3039.
Budihardjo I, Oliver H, Lutter M, Luo X, Wang X (1999), Biochemical pathways ofcaspase activation during apoptosis, Annu. Rev. Cell Dev. Biol. 15:269–290.
Buja LM, Eigenbrodt ML, Eigenbrodt EH (1993), Apoptosis and necrosis. Basic typesand mechanisms of cell death, Arch. Pathol. Lab. Med. 117:1208–1214.
Calle Y, Palomares T, Castro B, del Olmo M, Alonso-Varona A (2001), Removal ofN-glycans from cell surface proteins induces apoptosis by reducing intracellularglutathione levels in the rhabdomyosarcoma cell line S4MH, Biol. Cell. 92:639–646.
Charbonneau JR, Gauthier ER (2000), Prolongation of murine hybridoma cell survivalin stationary batch culture by Bcl-XL expression, Cytotechnology 34:131–139.
Cheng EH, Levine B, Boise LH, Thompson CB, Hardwick JM (1996), Bax-indepen-dent inhibition of apoptosis by Bcl-XL, Nature 379:554–556.
Cheng EH, Kirsch DG, Clem RJ, Ravi R, Kastan MB, Bedi A, Ueno K, Hardwick JM(1997), Conversion of Bcl-2 to a Bax-like death effector by caspases, Science278:1966–1968.
Chittenden T, Flemington C, Houghton AB, Ebb RG, Gallo GJ, Elangovan B,Chinnadurai G, Lutz RJ (1995), A conserved domain in Bak, distinct from BH1and BH2, mediates cell death and protein binding functions, EMBO J. 14:5589–5596.
Cory S, Adams JM (2002), The Bcl2 family: regulators of the cellular life-or-deathswitch, Nat. Rev. Cancer 2:647–656.
Cotter TG, Al-Rubeai M (1995), Cell death (apoptosis) in cell culture systems, TrendsBiotechnol. 13:150–155.
Crompton M, Virji S, Doyle V, Johnson N, Ward JM (1999), The mitochondrialpermeability transition pore, Biochem. Soc. Symp. 66:167–179.
Darmon AJ, Nicholson DW, Bleackley RC (1995), Activation of the apoptoticprotease CPP32 by cytotoxic T-cell-derived granzyme B, Nature 377:446–448.
Desagher S, Osen-Sand A, Nichols A, Eskes R, Montessuit S, Lauper S, Maundrell K,Antonsson B, Martinou JC (1999), Bid-induced conformational change of Bax isresponsible for mitochondrial cytochrome c release during apoptosis, J. Cell Biol.144:891–901.
Dickson AJ (1998), Apoptosis regulation and its application to biotechnology, TrendsBiotechnol. 16:339–342.
Du C, Fang M, Li Y, Li L, Wang X (2000), Smac, a mitochondrial protein thatpromotes cytochrome c-dependent caspase activation by eliminating IAP inhibi-tion, Cell 102:33–42.
Earnshaw WC, Martins LM, Kaufmann SH (1999), Mammalian caspases: structure,
174 Animal Cell Technology

activation, substrates, and functions during apoptosis, Annu. Rev. Biochem.68:383–424.
Eskes R, Desagher S, Antonsson B, Martinou JC (2000), Bid induces the oligomeriza-tion and insertion of Bax into the outer mitochondrial membrane, Mol. Cell Biol.20:929–935.
Figueroa B Jr, Sauerwald TM, Mastrangelo AJ, Hardwick JM, Betenbaugh MJ (2001),Comparison of Bcl-2 to a Bcl-2 deletion mutant for mammalian cells exposed toculture insults, Biotechnol. Bioeng. 73:211–222.
Fussenegger M, Bailey JE (1998), Molecular regulation of cell-cycle and apoptosis inmammalian cells: implications for biotechnology, Biotechnol. Prog. 14:807–833.
Fussenegger M, Bailey JE (1999), Control of mammalian cell proliferation as animportant strategy in cell culture technology, In: Al-Rubeai M, Dordrecht AH(Eds), Cancer Therapy and Tissue Engineering, Kluwer, Dordrecht.
Fussenegger M, Bailey JE, Hauser H, Mueller PP (1999), Genetic optimization ofrecombinant glycoprotein production by mammalian cells, Trends Biotechnol.17:35–42.
Goping IS, Gross A, Lavoie JN, Nguyen M, Jemmerson R, Roth K, Korsmeyer SJ,Shore GC (1998), Regulated targeting of BAX to mitochondria, J. Cell Biol.143:207–215.
Griffiths JB (1984), Cell biology: experimental aspects, In: Spier RE, Griffiths JB(Eds), Animal Cell Biotechnology, Chapter 3, Academic Press, Orlando.
Gross A, McDonnell JM, Korsmeyer SJ (1999), BCL-2 family members and themitochondria in apoptosis, Genes Dev. 13:1899–1911.
Harris CA, Johnson EM Jr (2001), BH3-only Bcl-2 family members are coordinatelyregulated by the JNK pathway and require Bax to induce apoptosis in neurons,J. Biol. Chem. 276:37754–37760.
Harris SL, Levine AJ (2005), The p52 pathway: positive and negative feedback,Oncogene 24:2899–2908.
Hayflick L (1965), The limited in vitro lifetime of human diploid cell strains, Exp. CellRes. 37:614–636.
Hayflick L, Moorhead PS (1961), The serial cultivation of human diploid cell strains,Exp. Cell Res. 25: 585–621.
Hill MM, Adrain C, Martin SJ (2003), Portrait of a killer: the mitochondrial apopto-some emerges from the shadows, Mol. Interv. 3:19–26.
Hofmann K, Bucher P, Tschopp J (1997), The CARD domain: a new apoptoticsignaling motif, Trends Biochem. Sci. 22:155–156.
Hoppe J, Kilic M, Hoppe V, Sachinidis A, Kagerhuber U (2002), Formation ofcaspase-3 complexes and fragmentation of caspase-12 during anisomycin-inducedapoptosis in AKR-2B cells without aggregation of Apaf-1, Eur. J. Cell Biol.81:567–576.
Horvitz HR, Shaham S, Hengartner MO (1994), The genetics of programmed celldeath in the nematode Caenorhabditis elegans, Cold Spring Harb. Symp. Quant.Biol. 59:377–385.
Hu Y, Ding L, Spencer DM, Nunez G (1998), WD-40 repeat region regulates Apaf-1self-association and procaspase-9 activation, J. Biol. Chem. 273:33489–33494.
Huang DC, Strasser A (2000), BH3-only proteins – essential initiators of apoptoticcell death, Cell 103:839–842.
Jiang X, Wang X (2000), Cytochrome C promotes caspase-9 activation by inducingnucleotide binding to Apaf-1, J. Biol. Chem. 275:31199–31203.
Jiang X, Wang X (2004), Cytochrome C-mediated apoptosis, Annu. Rev. Biochem.73:87–106.
Kelekar A, Chang BS, Harlan JE, Fesik SW, Thompson CB (1997), Bad is a BH3domain-containing protein that forms an inactivating dimer with Bcl-XL, Mol.Cell Biol. 17:7040–7046.
Mechanisms of cell proliferation and cell death in animal cell culture in vitro 175

Kerr JF, Wyllie AH, Currie AR (1972), Apoptosis: a basic biological phenomenonwith wide-ranging implications in tissue kinetics, Br. J. Cancer 26:239–257.
Kilic M, Schafer R, Hoppe J, Kagerhuber U (2002), Formation of noncanonical highmolecular weight caspase-3 and -6 complexes and activation of caspase-12 duringserum starvation induced apoptosis in AKR-2B mouse fibroblasts, Cell DeathDiffer. 9:125–137.
Kim NS, Lee GM (2002), Response of recombinant Chinese hamster ovary cells tohyperosmotic pressure: effect of Bcl-2 overexpression, J. Biotechnol. 95:237–248.
Krajewski S, Tanaka S, Takayama S, Schibler MJ, Fenton W, Reed JC (1993),Investigation of the subcellular distribution of the Bcl-2 oncoprotein: residence inthe nuclear envelope, endoplasmic reticulum, and outer mitochondrial mem-branes, Cancer Res. 53:4701–4714.
Kuwana T, Newmeyer DD (2003), Bcl-2-family proteins and the role of mitochondriain apoptosis, Curr. Opin. Cell Biol. 15:691–699.
Kuwana T, Mackey MR, Perkins G, Ellisman MH, Latterich M, Schneiter R, GreenDR, Newmeyer DD (2002), Bid, Bax, and lipids cooperate to form supramolecu-lar openings in the outer mitochondrial membrane, Cell 111:331–342.
Letai A, Bassik MC, Walensky LD, Sorcinelli MD, Weiler S, Korsmeyer SJ (2002),Distinct BH3 domains either sensitize or activate mitochondrial apoptosis, servingas prototype cancer therapeutics, Cancer Cell 2:183–192.
Li H, Zhu H, Xu C-J, Yuan J (1998), Cleavage of BID by caspase 8 mediates themitochondrial damage in the Fas pathway of apoptosis, Cell 94:491–501.
Li L, Zou L (2005), Sensing, signaling, and responding to DNA damage: organizationof the checkpoint pathways in mammalian cells, J. Cell Biochem. 1:298–306.
Loeffler M, Kroemer G (2000), The mitochondrion in cell death control: certaintiesand incognita, Exp. Cell Res. 256:19–26.
McCarthy NJ (2002), Why be interested in death, In: Jacobson MD, McCarthy NJ(Eds), Apoptosis: The Molecular Biology of Programmed Cell Death, Chapter 1,Oxford University Press, Cambridge.
McCullough KD, Martindale JL, Klotz LO, Aw TY, Holbrook NJ (2001), Gadd153sensitizes cells to endoplasmic reticulum stress by downregulating Bcl-2 andperturbing the cellular redox state, Mol. Cell Biol. 21:1249–1259.
Martin SJ, Reutelingsperger CPM, McGahon AJ, Rader JA, van Schie RC, LaFaceDM, Green DR (1995), Early redistribution of plasma membrane phosphatidyl-serine is a general feature of apoptosis regardless of initiating stimulus: inhibitionby overexpression of Bcl-2 and Abl, J. Exp. Med. 182:1545–1556.
Marzo I, Brenner C, Zamzami N, Susin SA, Beutner G, Brdiczka D, Remy R, Xie ZH,Reed JC, Kroemer G (1998), The permeability transition pore complex: a targetfor apoptosis regulation by caspases and bcl-2-related proteins, J. Exp. Med187:1261–1271.
Mastrangelo AJ, Betenbaugh MJ (1998), Overcoming apoptosis: new methods forimproving protein-expression systems, Trends Biotechnol. 16:88–95.
Mastrangelo AJ, Hardwick JM, Bex F, Betenbaugh MJ (2000a), Part I. Bcl-2 and Bcl-XL limit apoptosis upon infection with alphavirus vectors, Biotechnol. Bioeng.67:544–554.
Mastrangelo AJ, Hardwick JM, Zou S, Betenbaugh MJ (2000b), Part II. Overexpres-sion of bcl-2 family members enhances survival of mammalian cells in response tovarious culture insults, Biotechnol. Bioeng. 67:555–564.
Mercille S, Massie B (1994a), Induction of apoptosis in nutrient-deprived cultures ofhybridoma and myeloma cells, Biotechnol. Bioeng. 44:1140–1154.
Mercille S, Massie B (1994b), Induction of apoptosis in oxygen-deprived cultures ofhybridoma cells, Cytotechnology 15:117–128.
Mercille S, Jolicoeur P, Gervais C, Paquette D, Mosser DD, Massie B (1999), Dose-dependent reduction of apoptosis in nutrient-limited culture of NS/O myeloma
176 Animal Cell Technology

cells transfected with the E1B-19KDa adenoviral gene, Biotechnol. Bioeng.63:516–528.
Mitchison JM (2003), Growth during the cell cycle, Int. Rev. Cytol. 226:165–258.Miyashita T, Reed JC (1995), Tumor suppressor p53 is a direct transcriptional activator
of the human bax gene, Cell 80:293–299.Muzio M, Chinnaiyan AM, Kischkel FC, O’Rourke K, Shevchenko A, Ni J, Scaffidi
C, Bretz JD, Zhang M, Gentz R, Mann M, Krammer PH, Peter ME, Dixit VM(1996), FLICE, a novel FADD-homologous ICE/CED-3-like protease, is re-cruited to the CD95 (Fas/APO-1) death-inducing signaling complex, Cell85:817–827.
Nagata S (2000), Apoptotic DNA fragmentation, Exp. Cell Res. 256:12–18.Nakano K, Vousden KH (2001), PUMA, a novel proapoptotic gene, is induced by p53,
Mol. Cell 7:683–694.Narita M, Shimizu S, Ito T, Chittenden T, Lutz RJ, Matsuda H, Tsujimoto Y (1998),
Bax interacts with the permeability transition pore to induce permeability transi-tion and cytochrome c release in isolated mitochondria, Proc. Natl Acad. Sci. U SA 95:14681–14686.
Newbold RF (2002), The significance of telomerase activation and cellular immortali-zation in human cancer, Mutagenesis 17:539–550.
Nguyen M, Millar DG, Yong VW, Korsmeyer SJ, Shore GC (1993), Targeting of Bcl-2to the mitochondrial outer membrane by a COOH-terminal signal anchorsequence, J. Biol. Chem. 268:25265–25268.
Nollert MU, Diamond SL, McIntre LV (1991), Hydrodynamic shear stress and masstransport modulation of endothelial cell metabolism, Biotechnol. Bioeng. 38:588–602.
Oda E, Ohki R, Murasawa H, Nemoto J, Shibue T, Yamashita T, Tokino T, TaniguchiT, Tanaka N (2000), Noxa, a BH3-only member of the Bcl-2 family and candidatemediator of p53-induced apoptosis, Science 288:1053–1058.
Oh SKW, Vig P, Chua FKF (1993), Substantial overproduction of antibodies byapplying osmotic pressure and sodium butyrate, Biotechnol. Bioeng. 42:601–609.
Oltvai ZN, Korsmeyer SJ (1994), Checkpoints of dueling dimers foil death wishes,Cell 79:189–192.
Oltvai ZN, Milliman CL, Korsmeyer SJ (1993), Bcl-2 heterodimerizes in vivo with aconserved homolog, Bax, that accelerates programmed cell death, Cell 74:609–619.
Ottilie S, Diaz JL, Horne W, Chang J, Wang Y, Wilson G, Chang S, Weeks S, FritzLC, Oltersdorf T (1997), Dimerization properties of human BAD. Identificationof a BH-3 domain and analysis of its binding to mutant BCL-2 and BCL-XLproteins, J. Biol. Chem. 272:30866–30872.
Plasier B, Lloyd DR, Paul GC, Thomas CR, Al-Rubeai M (1999), Automatic imageanalysis for quantification of apoptosis in animal cell culture by annexin-V affinityassay, J. Immunol. Methods 229:81–95.
Puthalakath H, Huang DC, O’Reilly LA, King SM, Strasser A (1999), The proapopto-tic activity of the Bcl-2 family member Bim is regulated by interaction with thedynein motor complex, Mol. Cell 3:287–296.
Puthalakath H, Villunger A, O’Reilly LA, Beaumont JG, Coultas L, Cheney RE,Huang DC, Strasser A (2001), Bmf: a proapoptotic BH3-only protein regulatedby interaction with the myosin V actin motor complex, activated by anoikis,Science 293:1829–1832.
Qin H, Srinivasula SM, Wu G, Fernandes-Alnemri T, Alnemri ES, Shi Y (1999),Structural basis of procaspase-9 recruitment by the apoptotic protease-activatingfactor 1, Nature 399:549–557.
Rao RV, Ellerby HM, Bredesen DE (2004), Coupling endoplasmic reticulum stress tothe cell death program, Cell Death Differ. 11:372–380.
Mechanisms of cell proliferation and cell death in animal cell culture in vitro 177

Saito M, Korsmeyer SJ, Schlesinger PH (2000), BAX-dependent transport of cyto-chrome c reconstituted in pure liposomes, Nat. Cell Biol. 2:553–555.
Saleh A, Srinivasula SM, Acharya S, Fishel R, Alnemri ES (1999), Cytochrome c anddATP-mediated oligomerization of Apaf-1 is a prerequisite for procaspase-9activation, J. Biol. Chem. 274:17941–17945.
Sanfeliu A, Stephanopoulos G (1999), Effect of glutamine limitation on the death ofattached chinese hamster ovary cells, Biotechnol. Bioeng. 64:46–53.
Sattler M, Liang H, Nettesheim D, Meadows RP, Harlan JE, Eberstadt M, Yoon HS,Shuker SB, Chang BS, Minn AJ, Thompson CB, Fesik SW (1997), Structure ofBcl-xL-Bak peptide complex: recognition between regulators of apoptosis, Science275:983–986.
Sauerwald TM, Betenbaugh MJ, Oyler GA (2002), Inhibiting apoptosis in mammaliancell culture using the caspase inhibitor XIAP and deletion mutants, Biotechnol.Bioeng. 77:704–716.
Sauerwald TM, Oyler GA, Betenbaugh MJ (2003), Study of caspase inhibitors forlimiting death in mammalian cell culture, Biotechnol. Bioeng. 81:329–340.
Schotte P, Van Criekinge W, Van de Craen M, Van Loo G, Desmedt M, Grooten J,Cornelissen M, De Ridder L, Vandekerckhove J, Fiers W, Vandenabeele P,Beyaert R (1998), Cathepsin B-mediated activation of the proinflammatorycaspase-11, Biochem. Biophys. Res. Commun. 251:379–387.
Shimizu S, Narita M, Tsujimoto Y (1999), Bcl-2 family proteins regulate the release ofapoptogenic cytochrome C by the mitochondrial channel VDAC, Nature399:483–487.
Simpson NH, Milner A, Al-Rubeai M (1997), Prevention of hybridoma cell death bybcl-2 during suboptimal culture conditions, Biotechnol. Bioeng. 54:1–16.
Simpson NH, Singh RP, Perani A, Goldenzon C, Al-Rubeai M (1998), In hybridomacultures, deprivation of any single amino acid leads to apoptotic death, which issuppressed by the expression of the bcl-2 gene, Biotechnol. Bioeng. 59:90–98.
Singh RP, Al-Rubeai M (1998), Apoptosis and bioprocess technology, Adv. Biochem.Eng. Biotechnol. 62:167–184.
Singh RP, Al-Rubeai M, Gregory CD, Emery AN (1994), Cell death in bioreactors: arole for apoptosis, Biotechnol. Bioeng. 44:720–726.
Singh RP, Finka G, Emery AN, Al-Rubeai M (1997), Apoptosis and its control in cellculture systems, Cytotechnology 23:87–93.
Slee EA, Harte MT, Kluck RM, Wolf BB, Casiano CA, Newmeyer DD, Wang HG,Reed JC, Nicholson DW, Alnemri ES, Green DR, Martin SJ (1999), Ordering thecytochrome C-initiated caspase cascade: hierarchical activation of caspases-2, -3,-6, -7, -8 and -10 in a caspase-9-dependent manner, J. Cell Biol. 144:281–292.
Srinivasula SM, Ahmad M, Fernandes-Alnemri T, Alnemri ES (1998), Autoactivationof procaspase-9 by Apaf-1-mediated oligomerization, Mol. Cell 1:949–957.
Suzuki E, Ollis DF (1989), Cell cycle model for antibody production kinetics,Biotechnol. Bioeng. 34:1398–1402.
Suzuki E, Ollis DF (1990), Enhanced antibody production at slowed growth rates:experimental demonstration and a simple structured model, Biotechnol. Prog.6:231–236.
Szegezdi E, Fitzgerald U, Samali A (2003), Caspase-12 and ER-stress-mediatedapoptosis: the story so far. Ann. N Y Acad. Sci. 1010:186–94.
Tey BT, Al-Rubeai M (2004), Suppression of apoptosis in perfusion culture ofmyeloma NS0 cells enhances cell growth but reduces antibody productivity,Apoptosis 9:843–852.
Thornberry NA, Rano TA, Peterson EP, Rasper DM, Timkey T, Garcia-Calvo M,Houtzager VM, Nordstrom PA, Roy S, Vaillancourt JP, Chapman KT, NicholsonDW (1997), A combinatorial approach defines specificities of members of thecaspase family and granzyme B. Functional relationships established for key
178 Animal Cell Technology

mediators of apoptosis, J. Biol. Chem. 272:17907–17911.Tinto A, Gabernet C, Vives J, Prats E, Cairo JJ, Cornudella L, Godia F (2002), The
protection of hybridoma cells from apoptosis by caspase inhibition allows culturerecovery when exposed to non-inducing conditions, J. Biotechnol. 95:205–214.
Verhagen AM, Ekert PG, Pakusch M, Silke J, Connolly LM, Reid GE, Moritz RL,Simpson RJ, Vaux DL (2000), Identification of DIABLO, a mammalian proteinthat promotes apoptosis by binding to and antagonizing IAP proteins, Cell102:43–53.
Vives J, Juanola S, Cairo JJ, Godia F (2003a), Metabolic engineering of apoptosis incultured animal cells: implication for the biotechnology industry. Metab. Eng.5:124–132.
Vives J, Juanola S, Cairo JJ, Prats E, Cornudella L, Godia, F (2003b), Protective effectof viral homologues of Bcl-2 on hybridoma cells under apoptosis-inducingcondition, Biotechnol. Prog. 19:84–89.
Walker NP, Talanian RV, Brady KD, Dang LC, Bump NJ, Ferenz CR, Franklin S,Ghayur T, Hackett MC, Hammill LD (1994), Crystal structure of the cysteineprotease interleukin-1 beta-converting enzyme: a (p20/p10)2 homodimer, Cell78:343–352.
Xie S, Xie B, Lee MY, Dai W (2005), Regulation of cell cycle checkpoints by polo-likekinases, Oncogene 24:277–286.
Yamin TT, Ayala JM, Miller DK (1996), Activation of the native 45-kDa precursorform of interleukin-1-converting enzyme, J. Biol. Chem. 271:13273–13282.
Yang X, Chang HY, Baltimore D (1998), Autoproteolytic activation of procaspases byoligomerization, Mol. Cell 1:319–325.
Yoneda T, Imaizumi K, Oono K, Yui D, Gomi F, Katayama T, Tohyama M (2001),Activation of caspase-12, an endoplasmic reticulum (ER) resident caspase, throughtumor necrosis factor receptor-associated factor 2-dependent mechanism in re-sponse to the ER stress, J. Biol. Chem. 276:13935–13940.
Zanghi AJ, Fussenegger M, Bailey JE (1999), Serum protects protein-free competentChinese hamster ovary cells against apoptosis induced by nutrient deprivation inbatch culture, Biotechnol. Bioeng. 64:108–119.
Zha J, Harada H, Yang E, Jockel J, Korsmeyer SJ (1996), Serine phosphorylation ofdeath agonist BAD in response to survival factor results in binding to 14-3-3 notBCL-X(L), Cell 87:619–628.
Zha J, Harada H, Osipov K, Jockel J, Waksman G, Korsmeyer SJ (1997), BH3 domainof BAD is required for heterodimerization with BCL-XL and pro-apoptoticactivity, J. Biol. Chem. 272:24101–24104.
Zhou Q, Krebs JF, Snipas SJ, Price A, Alnemri ES, Tomaselli KJ, Salvesen GS (1998),Interaction of the baculovirus anti-apoptotic protein p35 with caspases. Specifi-city, kinetics, and characterization of the caspase/35 complex, Biochemistry37:10757–10765.
Zong WX, Lindsten T, Ross AJ, MacGregor GR, Thompson CB (2001), BH3-onlyproteins that bind pro-survival Bcl-2 family members fail to induce apoptosis inthe absence of Bax and Bak, Genes Dev. 15:1481–1486.
Mechanisms of cell proliferation and cell death in animal cell culture in vitro 179


8Mathematical models forgrowth and productsynthesis in animal cellcultureElisabeth F.P. Augusto, Manuel F. Barral, andRosane A.M. Piccoli
8.1 Introduction
It is extremely important from a scientific and technological point of viewto understand cell behavior under different culture conditions. This know-ledge allows control of the processes that generate important commercialproducts and establishes a rational basis to increase cell productivity andyield.
By understanding cell behavior, it is possible to identify factors thatlimit and inhibit cell growth and product synthesis. This allows improve-ments in culture media formulation, defining adequate culture conditionsand keeping them at optimum values through process control. Theoptimization of these conditions allows an increase in reaction rates andtheir control, resulting in enhanced process productivity, higher finalproduct concentration, and increased substrate-to-product conversionfactor. This process optimization, in general, may also allow improve-ments in product quality, insuring technical and economic viability.
The systematization and quantification of this knowledge throughmathematical equations, called mathematical modeling, relate culture con-ditions to growth, death, nutrient consumption, and product synthesisrates. Solving these equations allows a quantitative prediction of cellbehavior, meaning that it is possible to simulate the changes in the majorvariables (such as component concentrations) with time. Even at the initialstages of model development, before it is capable of representing thetotality of the observed phenomena, it is possible to use a model for thesimulation of different culture conditions. The capacity to predictthe dynamics of the population helps to understand the system underinvestigation, because it may guide experimental planning, reduce thenumber of experiments, and allow estimates of un-measured variables, aswell as providing rational criteria for process design, optimization, andcontrol of bioreactors.
Although animal cells have the ability to produce high value proteinswith post-translational modifications appropriate for clinical application,

there is an urgent need to increase bioprocess efficiency and productivity.The reduction of cost is essential to insure that animal cell culture remainscompetitive compared to alternative technologies such as ribosome displayand transgenic animals. Improvements can be made by a biologicalapproach, as discussed in Chapter 3, or based on the optimization ofculture conditions. Mathematical modeling is probably the most efficienttechnique for the optimization of culture conditions.
The construction of a mathematical model involves the following steps,as developed by several authors (Engasser et al., 1998; Miller and Reddy,1998; Bonomi and Schmidell, 2001).
(i) Formulation of kinetic equations. This is probably the most impor-tant step in developing models because it establishes mathematicalrelations between the observed phenomena and the cellular responses.It depends on several tasks, namely:– Definition of variables relevant to the process: state variables,
such as cells, substrates, and product concentrations, thatcharacterize the system studied; and operational variables, thatrepresent particular conditions of the system, that may be initialor fixed conditions such as initial concentrations, feeding rates,etc.;
– Kinetic analysis of experimental data and proposed hypotheses ofthe process limitations or inhibitory steps, which correspond tothe identification of the dominant phenomena in the system;
– Selection of mathematical equations able to represent the specificrates (for growth, product synthesis and substrate consumption)that can describe the phenomena identified in the previous steps.
(ii) Establishment of mass balances, total and for each component, con-sidering the operational and state variables. Examples of mass bal-ances for different operation modes (batch, fed-batch, continuous,etc.) are presented in Chapter 9. Depending on the defined variablesin the model, it may be necessary to perform energy and momentumbalances.
(iii) Parameter fitting. Mathematical model equations contain state vari-ables and one or more parameters that are mathematical constants.This step of model formulation, called parameter fitting, consists indefining optimal values for these parameters that minimize thediscrepancies between experimental values and the values calculatedthrough the equations (simulated values).
(iv) Model validation. The applicability of a model comes from itscapacity to predict cell behavior under different culture conditions.Thus, the procedure for model validation consists of comparativestatistical analysis between real values (experimental) and calculatedvalues (model simulation). This is an indispensable step to completethe task of modeling any system.
The crucial step in model building is model formulation, since themathematical modeling is intended to represent a large network of multi-ple biochemical reactions, controlled by complex regulatory processes that
182 Animal Cell Technology

cause cell adaptation to changes in culture conditions. The complexity ofcell metabolism may be treated by different approaches, and both the typeof information needed and the material resources to get it should be takeninto account when modeling.
The systematization of biological data through mathematical modelingis not a trivial task and requires the intensive use of material and humanresources. Moreover, the models often incorporate experimental uncer-tainties that do not always allow the identification of the trends of theculture, with the desired precision. Figure 8.1 summarizes the main typesof models applied to the description of cellular metabolism, according tothe classification proposed by Tsuchiya et al., (1966).
Unstructured and non-segregated models allow the most simplifiedrepresentation of cellular complexity. As indicated in Figure 8.1, in thesemodels, the entire cell population is represented by only one kind of cell(the average cell). Differences between cells within the population are notconsidered and thus, the cell population is considered homogeneous.
Although an unstructured and non-segregated model includes simplifi-cations of the cellular complexity, it is often used in culture simulation,because it is an adequate compromise between the available data, thedifficulties involved in model formulation, and the desired model preci-sion.
The unstructured and segregated model considers the cell culture as aheterogeneous population, with individual cells characterized by age,mass, or size. The variation of properties follows a statistical distribution.The most concise way to deal with such population heterogeneity isthrough a population balance model (PBM). These models can becomemathematically complex because the equations that describe the popu-lation have to consider that the properties vary in the population and
Balanced
cellcell
Unstructured Structured
Non
-seg
rega
ted
Seg
rega
ted
One cell behaves likeothers cells, the celland the populationare homegeneous growth
(approximation)
The cell population isdescribed by one kind ofcell with many intracellularcomponents, anheteregeneus cell.
Mean(approx.)
Mean(approx.)
The cell population has differentindividuals, a heterogeneouspopulation, but the cell has
intracellular componentesa homogeneous cell.no
The cell is a representation ofacellular multicomponents
with different cell by cell.intr
growth
(approx.)
Balanced
Figure 8.1
Model classification (based on Tsuchiya et al., 1966; Bailey and Ollis, 1986).
Mathematical models for growth and product synthesis in animal cell culture 183

during the time course of cell culture. The mathematical description in asegregated model is based on partial differential equations, while the non-segregated model is described entirely by ordinary differential equations.Although this complexity adds difficulties to the mathematical solution ofthe problem, and also to the estimation of model parameters, newmathematical tools and advances in process monitoring have made possi-
0
40
80
120
160
ALA
(m
g/L)
0
20
40
60
80
GLY
(m
g/L)
(F)
0.00
0.01
0.02
0.03
0.04
0.05(E)
0
10
20
30
40
50
MA
b (
g/m
L)µ
(C)
0
200
400
600
GLN
(m
g/L)
0
10
20
30
40
50
NH
(mg/
L)4�
(D)
0.E 00�
5.E 05�
1.E 06�
2.E 06�
2.E 06�
3.E 06�
Time (h)
Time (h)
Time (h)
Time (h)
Time (h)
Time (h)
X(c
el/m
L)v
0
20
40
60
80
100
Via
b (%
)
(A)
0
1
2
3
4
5
GLC
(g/
L)
0
1
2
3
4
5
LAC
(g/
L)
(B)
0
0
0
0
0
0
20
20
20
20
20
20
40
40
40
40
40
40
60
60
60
60
60
60
80
80
80
80
80
80
µ X,A
pp1
(h)
�
Figure 8.2
Typical kinetic profiles (hybridoma). (A) Cell concentration and viability; (B) glucose consumption(GLC) and lactate production (LAC); (C) monoclonal antibody production (mAb); (D) glutamineconsumption (GLN) and ammonium production (NH4
þ); (E) specific growth rate (�x); (F) alanine(ALA) and glycine (GLY) production. Adapted from Lee (2003). Symbols correspond to theexperimental data and the lines to the manual curve fitting. Vertical lines indicate the instant atwhich exponential growth phase ended (�X , �X,max).
184 Animal Cell Technology
ble the use of such models, changing the past situation when these modelswere restricted to academic research.
The structured and non-segregated model considers the cellular popu-lation as homogeneous with reference to certain characteristics (age, size,and mass), however the intracellular structures are discriminated, in such away that each cell represents a heterogeneous structure. Thus, it is possibleto characterize with more precision, the cellular state through the know-ledge of the dynamics of these internal structures and its response to theenvironment conditions. The main advantage of the use of these models isan improved knowledge about the process and, consequently, the capacityto predict cell adaptation to environmental changes. Certainly, increasingthe number of cell structures results in an increase of the number ofequations and parameters required to describe process dynamics. More-over, intracellular measurements that require sophisticated methodologiesand equipment are necessary. In the past, the use of this type of model wasrestricted to academic research, but in recent years, it has become morefeasible for use in process simulation and evaluation.
The structured and segregated model considers a heterogeneous cellpopulation and the cell as a heterogeneous structure, thus representing thediversity of physiological states as well as intracellular structures and themetabolic pathways associated with each structure. This type of modelrepresents the complexity occurring in cell culture. Although these modelsaim to represent cell growth in a more realistic way, the complexityinvolved in the mathematical formulation and in fitting of the parametersmakes their applicability very restrictive.
Depending on the degree of complexity, these models can be verydifficult to solve mathematically. Even with some simplifications, forinstance, separating the cells into discrete populations to avoid infiniteequations that could be generated considering a continuous populationdistribution, difficulties in determining the internal characteristic para-meters may still remain.
The complexity involved in cell structured and segregated models isincreased with the necessity of their integration and can explain why someauthors define the structured and segregated models as the next challengefor animal cell modeling. These difficulties are reflected by the scarcenumber of publications dealing with this integration. This advancedresearch field is beyond the scope of this book.
The mathematical modeling of animal cell processes was reviewed byTziampazis and Sambanis (1994), Portner and Schafer (1996), and Sidoliet al., (2004). These authors focused on non-structured and non-segregatedmodels, certainly the most abundant models in literature, and also dis-cussed the evolution of the use of other models, mainly the structured andsegregated ones.
8.2 Kinetic analysis of bioprocesses
When studying the kinetic behavior of a system, it is necessary to under-stand how the concentrations of the representative components of thesystem (cell, substrate, products, and byproducts) vary with time. Thus,
Mathematical models for growth and product synthesis in animal cell culture 185

the analysis of the change of these variables with time allows the calcula-tion of some kinetic variables that characterize the system and are the basisfor the identification of the controlling phenomena.
The mathematical modeling of animal cell processes has many elementsin common with the modeling of microbial systems. In fact, manyexamples of mathematical modeling discussed in Section 8.3.1 were ini-tially considered for microorganisms and were later adapted to animalcells.
Figure 8.2 (see page 184) shows the typical behavior of animal cells inculture. Cell growth, substrate consumption, and product synthesis pro-files are very similar to those presented in Chapters 2, 4, and 9, and will beused to demonstrate the approach to data treatment usually applied to thiskind of process.
Considering that animal cells have high nutritional requirements, theculture medium is always a complex formulation to insure the adequatefunction of catabolism and anabolism (see Chapters 4 and 5). Glucose andglutamine are precursors for biosynthesis and energy generation pathways,and are the most highly consumed substrates. In parallel, lactate andammonium are synthesized at high rates as byproducts of glucose andglutamine (or other amino acid) metabolism, respectively. There is also thepossibility of secretion of amino acids (mainly alanine, glycine, andaspartate) and of commercially attractive products (monoclonal anti-bodies, mAbs, for example).
8.2.1 Characteristic kinetic variables
The identification of phenomena that explain the behavior of a studiedsystem depends on the analysis of their kinetic data. Normally, this kineticanalysis is performed using characteristic variables calculated from theexperimental data. The specific rates and the yield coefficients are thecommon values used in this task. When cell concentration data are avail-able, cell growth and death rates, as well as cell viability, are the bestkinetic variables to characterize the population physiological state. In theabsence of this information – as can occur, for example, with immobilizedcells – the treatment must be based on substrate consumption or onmetabolites production (Miller and Reddy, 1998).
Specific rates
To predict kinetic behavior it is necessary to know the change of the statevariables over time. Thus, it is necessary to determine the characteristicrates of the system under transformation. The instantaneous cell growthrate, for example, is defined in Equation 1.
rX ¼ dXV
dt(1)
where:Xv ¼ viable cell concentration (M � L�3 or Cel � L�3);rX ¼ cellular growth rate (M � L�3 � T or Cel � L�3 � T);t ¼ time (T).
186 Animal Cell Technology

As indicated above, the units defined for the listed variables are given inthe MLT system, except in cases where cell concentration (given foranimal cells as numbers) is involved. M represents mass, L length, and Ttime.
Similar equations can be written for the substrate consumption rate (rS)and product synthesis rate (rP):
rS ¼ � dS
dt(2)
rP ¼ dP
dt(3)
where:rS ¼ substrate consumption rate (M � L�3 � T�1);rP ¼ product synthesis rate (M � L�3 � T�1);S ¼ substrate concentration (M � L�3);P ¼ product concentration (M � L�3).
The instantaneous rates are necessary for the characterization of thecellular activities but may not be sufficient. This occurs because during aspecific interval of time, the concentration of cells can vary significantly,and this may affect transformation rates. Therefore the specific growthrate is defined as a characteristic rate of the population. The specificgrowth rate is calculated from the cellular growth rate divided by thecellular concentration, and can be represented by the Equation 4 (Millerand Reddy, 1998; Hiss, 2001):
�X ¼ 1
XV� dXV
dt¼ 1
XV� rXð Þ (4)
where:�X ¼ specific growth rate (T�1).
The specific growth rate can be calculated from cellular concentrationdata if the cell viability is sufficiently high. When the cell death rate issignificant, the value obtained from Equation 4 is in fact an ‘‘apparent’’specific rate, since the measured values in the laboratory are determined asa balance between growth and death. The apparent rate is related to thetrue specific growth rate by the following equation:
�apX ¼ �X � kd (5)
where:�apX¼ apparent specific growth rate (T�1);
kd ¼ specific cell death rate (T�1).
The specific death rate can be obtained directly from viable and deadcell concentrations (Equation 6).
kd ¼1
Xv� dXd
dt(6)
where:Xd ¼ dead cell concentration (M � L�3 or Cel � L�3).
Mathematical models for growth and product synthesis in animal cell culture 187

The methodology normally used for the determination of dead cellconcentrations is the dye exclusion method (Freshney, 1994), although thisis not adequate in cases in which cellular lysis is significant. In thesesituations, other methodologies must be adopted to determine the amountof lysed cells, such as, for example, the measure of the lactate dehydrogen-ase concentration (LDH) in the culture medium (Freshney, 1994; Millerand Reddy, 1998).
It is possible define the specific substrate consumption rate (Equation 7)and specific product synthesis rates (Equation 8) in a similar way to thespecific growth rate.
�S ¼1
XV� � dS
dt
� �¼ 1
XV� (�rS) (7)
where:�S ¼ specific substrate consumption rate(M �M�1 � T�1 or M �Cel�1 � T�1);
�P ¼ 1
XV� dPdt
¼ 1
XV� rPð Þ (8)
where:�P ¼ specific product synthesis rate (M �M�1 � T�1 or M �Cel�1 � T�1).
Yield coefficients
The yield coefficients that measure the substrate conversion into cells andsubstrate conversion into products are also excellent variables for thecharacterization of the system, as well as to follow the metabolic changesof the culture. The substrates are consumed to form cells and products (orbyproducts), and to generate energy. These conversions have characteristicparallel reactions, as substrate consumption (S) leads to many ‘‘products’’,that is, cells, products, and byproducts (Figure 8.3).
The substrate-to-cells or substrate-to-products yield coefficients can becalculated in an interval of time ˜t, as indicated by Equations 9 and 10.
Substrate (S)
Cells (X)
Product (Pi)
Energy (ATP)
SX
SPi
SATP
Figure 8.3
Simplified schema of the substrate partition between metabolic pathways;catabolism (used for ATP and ADP synthesis) and anabolism (for biomasssynthesis). The quantities SPi indicate the fraction of S destined to formation of theproduct ‘‘i’’.
188 Animal Cell Technology

YX=S ¼ ˜X
�˜SX(9)
where:YX=S ¼ substrate-to-cells yield coefficient (or factor)(M �M�1 or Cel �M�1);˜X ¼ cellular concentration variation in the time interval ˜t(M � L�3 or Cel � L�3);�˜SX ¼ substrate consumption for cell formation in time interval ˜t(M � L�3).
YP=S ¼ ˜P
�˜SP(10)
where:YP=S ¼ substrate-to-product yield coefficient (or factor) (M �M�1);˜P ¼ product concentration variation in the time interval ˜t (M � L�3);�˜SP ¼ substrate consumption for the product formation in the timeinterval ˜t (M � L�3).
If the final destination of the substrate is unique, the yield coefficient (tocell or products) is a stoichiometric constant that relates reagents to‘‘products.’’ However, it is frequent that the substrate forms more thanone substance (for example, glucose may be converted to cells and lactate),or that a specific product comes from distinct substrates (for example,lactate formed from glucose and glutamine). In these cases, the calculationof the real conversion factors is only possible when a labeled reagent isused, allowing the identification of the reagent destination in the metabolicpathway. In practice, global yield coefficients are often calculated fromtotal substrate consumption and the total ‘‘products’’ formed, as indicatedin Equations 9 and 10. Instantaneous yields coefficients YX=S and YP=S canbe calculated as a relation between substrate consumption rate and‘‘products’’ formation rate, as indicated in Equations 11 and 12.
YX=S ¼ � rXrS
¼ � �X
�S
(11)
YP=S ¼ � rPrS
¼ � �P
�S
(12)
Finally, oxygen consumption per unit of substrate (Equation 13) is afactor that helps in understanding the metabolic pathways utilized by thecells and, therefore, it is useful in system analysis. This not exactly a yieldcoefficient, because it establishes a relation of consumption between twosubstrates. Similarly, other relations, not exactly yield coefficients (forexample, YLAC=X; YNH3=X, etc.), can be calculated and utilized for systemcharacterization.
YO2=S ¼ � �O2
�S
(13)
where:YO2=S ¼ oxygen consumption per unit of substrate factor (M �M�1);
Mathematical models for growth and product synthesis in animal cell culture 189

�O2¼ specific oxygen consumption rate
(M �M�1 � T�1 or M �Cel�1 � T�1).
8.2.2 Data treatment
The treatment of experimental data is an essential activity to calculateprecise kinetic variables in the equations above. The quality of the kineticanalysis, the identification of relevant phenomena and, subsequently,model parameter fitting, are directly dependent on the initial data.
This section discusses treatment of experimental data, especially forconditions where state variables change over time. These are the mostdifficult data to treat and correspond to cultures from batch, fed-batch, orany continuous transient phase. In continuous steady state, the statevariables and rates values do not alter with time, and the rate calculationresults from the algebraic equation solution.
The experimental error is also relevant to data treatment, and will alsobe considered in this section. The extent of the analytic error depends onvarious factors including the type of methodology adopted, operatortraining, and inoculum protocols. The errors are relatively high in bio-logical systems: for example, 10–30% for proteins concentration; 7–10%for cells concentration and viability (especially at low viability); 2–5% forliquid chromatography measures (glucose, lactate, amino acids) (Portnerand Schafer, 1996; Miller and Reddy, 1998).
The experimental error of measurements from batch processes is nor-mally higher than those obtained from a stationary state in processesconducted in a continuous mode, simply because, in batch, variations inculture conditions occur during the whole process. In a stationary state ofa continuous process, the kinetic variables are calculated from statevariable average values.
It is always possible to calculate the kinetic variables directly from theexperimental data. However, the values of kinetic variables are of higherquality when the errors are attenuated and identified before employing thetreatment data methods.
This attenuation can be made by smoothing methods that allow dataextrapolation, if the number of experimental points is reduced. Thesmoothing methods should also allow rate calculation from these points.The most commonly used smoothing techniques of experimental data arepresented below.
(i) Manual smoothing of the experimental data, which implies tracingan average curve with experimental points based on previous know-ledge of the system. Subsequently, the smoothed curve is read,creating a data table (variable ¼ f(time)).
(ii) Simple mathematical function fitting – linear, logarithmic, or poly-nomial with low degree regressions. This can be sufficient to obtainsmooth experimental data. By applying the minimal quadratic meth-od, it is possible to fit any of these functions, minimizing thedifference between real data and those simulated by functions. This isa relatively easy task, since these functions are available in variouscommercial software products. Although it is difficult to represent
190 Animal Cell Technology

the entire culture profile by one curve, it is always possible to fitdifferent functions to the various phases of culture (iii and iv below).
(iii) Mathematical function fitting by stepwise changes. This approachaims to represent the growth phase by stepwise changes of functions.The ‘‘spline’’ method, for example, consists of a series of low degreepolynomial regressions, which fit a low number of experimentalpoints (3 to 4 points) each time, ensuring continuity between thevarious polynomial functions (Lancaster and Salkauskas, 1986).
(iv) A mixed approach combines the smoothing of experimental data,based on previous knowledge of the system (i), and mathematicalfunction fitting (linear regression, logarithmic, polynomial, spline,etc.), as outlined in (ii) and (iii) above.
Once the experimental errors are attenuated, data are prepared for thecalculation of kinetic variables. Frequently, it is necessary to determine therates (Equations 4 to 8), and the possible approaches are:
(v) the derivation of mathematical functions fitted, as proposed in (ii) and(iv) above;
(vi) the calculation of derivatives employing geometrical methods, as LeDuy and Zajic (1973), applied to experimental smoothed data (Hiss,2001).
The determination of these rates allows the direct calculation of instan-taneous yield factors, as in Equations 11 and 12. This form of calculation isemployed whenever these factors change during the cultivation time.Alternatively, it is possible to determine yield factors by linear regressionof ‘‘product’’ concentration (cell, byproducts, or product) as a function ofthe substrate concentration.
8.2.3 Phenomena identification
A lot of effort as regards phenomena identification is based on specificgrowth rate analysis. In Chapter 2, cell growth and division were proposedin three phases, based on values of specific growth rates. The number ofsteps observed in a culture depends on each system, that is, some stepsmay not exist or have an insignificant duration under some conditions.
A lag (or latent or adaptation) phase can occur at the beginning ofculture during which no growth occurs, followed by an acceleration phase,a period in which the specific growth rate varies until reaching a maximumvalue. The analysis of this initial behavior can reveal any problemsconnected with preparation of inocula, as well as any substrate inhibition.
The other typical situation is that shown in Figure 8.2E, in which the �Xis maximum from the beginning of culture. During the exponential growthphase, the specific growth rate remains at the maximum value (�X,max) untilany nutritional limitation or inhibition by toxic products alters cellgrowth. Thus, a specific growth rate reduction can be observed.
The behavior analysis of the other state variables (substrates andproduct concentrations), at the same time as the �X decrease, can indicatethe cause of the metabolism change. For the case exemplified in Figure 8.2it can be observed that at 47 hours (end of exponential phase) the
Mathematical models for growth and product synthesis in animal cell culture 191

glutamine concentration is very low (Figure 8.2D), which can indicate alimitation of this nutrient.
It may be necessary to verify if the lactate levels (�2.2 g/L) and/orammonium (�35 mg/L) reach inhibitory concentration values. It is neces-sary to consider the possibility of the occurrence of limitation andinhibitory effects quite frequently in the culture. To discriminate betweenthe influences of several phenomena it is necessary to do tests underconditions specifically planned for this purpose, allowing the investigatorto distinguish between limitation and inhibition phenomena.
The rate of change of �X at the decline phase can also help in phenomenaidentification. For example, an abrupt fall in the �X value is an indicationof nutrient limitation. Once the limiting nutrient has reached a criticalconcentration, complete depletion and a decrease in growth will occurquickly. On the other hand, when a reduction of �X occurs slowly, thephenomenon responsible is usually the formation of an inhibiting metabo-lite, which has gradually accumulated in the system.
There are other ways to identify the factors that regulate cell metabo-lism, and each researcher may establish suitable methods for a particularsystem based on kinetic data analysis (Sinclair and Kristiansen, 1987;Engasser et al., 1998; Bonomi and Schmidell, 2001). Nevertheless, theimportance of adequate experimental data treatment is evident. This wouldallow precise specific rate calculations and identification of the associatedphenomena.
8.3 Unstructured and non-segregated models
As stated previously, unstructured and non-segregated models are thosemost commonly employed for simulating cell culture, due to their simpli-city in representing the biological complexity of the system. It is should berestated that these models consider the cell population as homogeneousand do not distinguish between individual cells.
In this section, a classical set of equations – initially developed formicrobial systems – will be presented, followed by a review of the mostimportant models for cell culture in the literature.
8.3.1 Classical formulas for cell growth, substrate consumption, andproduct synthesis
From kinetics studies of unicellular organisms, a set of mathematicalexpressions have been established to represent the most frequent phenom-ena in bioprocesses. These phenomena involve a limitation or inhibition ofgrowth and product formation, caused by the presence of substrates,products, or byproducts in culture media. Many of these expressions donot derive from known kinetic mechanisms. In fact, they are simplymathematical expressions with fitted parameters that are able to reproduceexperimentally observed kinetic profiles. These equations have beenderived and used in many unstructured microbial or cell models.
192 Animal Cell Technology

Cell growth
Substrate limitationMany of the equations employed in unstructured and non-segregatedmodels derive from those of enzymatic kinetics (Sinclair and Kristiansen,1987; Nielsen and Nikolajsen, 1988). Cells are considered as chemicalreactors that support thousands of complex reactions catalyzed by en-zymes that allow the conversion of substrates into secreted products. Theequation formulated by Michaelis and Menten represents the enzymaticconversion rate of a unique substrate into one product (Equation 14).
rE ¼ k � E � S
km þ S(14)
where:rE ¼ reaction rate;k ¼ reaction constant;E ¼ enzyme total amount;km ¼Michaelis constant;S ¼ limiting substrate concentration.
The amount (k.E) is the maximum reaction rate (rE,max), that alwaysoccurs at conditions where limiting substrate concentrations are muchhigher than the constant km (S .. km), allowing enzyme saturation bysubstrate.
By analogy to Michaelis and Menten enzymatic kinetics, Monod (1949)proposed the formula shown in Equation 15 that represents the cellgrowth rate as a function of cell and substrate concentrations.
rX ¼ �X,max
S
kS þ S�X (15)
where:�X,max¼maximum specific cell growth rate (T�1);kS ¼ substrate limitation constant for growth (or substrate saturationconstant for growth) (M � L�3);S ¼ limiting substrate concentration (M � L�3);X ¼ cell concentration (M � L�3 or Cel � L�3).
This same equation can be written as a function of the specific growthrate (Equation 16).
�X ¼ �X,max
S
kS þ S(Monod, 1949) (16)
Thus, the specific growth rate can be expressed by two parameters(constants) – �X,max and kS – and one state variable – S. This allows aparameter fitting to experimental data of cell (X) and substrate (S)concentrations. The procedure to fit these parameters will be shown inSection 8.3.3.
Figure 8.4 presents simulations of the Monod model with different setsof parameters. As a general rule, whenever the limiting substrate is inexcess (S . . kS), specific cell growth takes the maximum value (�X,max),and becomes independent of substrate.
Mathematical models for growth and product synthesis in animal cell culture 193

When the limiting substrate reaches the concentration equivalent to kS,the specific growth rate assumes the value of
�X,max
2 . This is the criticalsubstrate concentration for cell growth.
Certainly, Monod’s formula has been used extensively in phenomenolo-gical (unstructured) models, although the literature presents other equa-tions for one limiting substrate systems (Equations 17 and 18). In Moser’sformulation it was necessary to introduce a third parameter (‘‘n’’ inEquation 17) to represent experimental data.
�X ¼ �X,max
Sn
k9S þ Sn(Moser, 1958) (17)
where:k9S ¼ constant ((M � L�3)2)
�X ¼ �X,max
S
k 0SXþ S(Contois, 1959) (18)
0.00
0.02
0.04
0.06
S (g/L)
S (g/L)
0.800.200.05kS
k (g/L)S
(a)
k 0.8 g/LS �
0.00
0.02
0.04
0.06
0.05
0.04
0.03
µX, MAX
(b)
µ X1
(h)
�µ X
1(h
)�
µX,MAX10.05 h� �
0
0
2
2
4
4
6
6
8
8
µX,max1(h )�
Figure 8.4
Specific growth rate as a function of limiting-substrate S, for different sets ofparameters �X,max and kS.
194 Animal Cell Technology

where:k 0S ¼ constant (M �M�1 or M �Cel�1)
Equation 19 presents a kinetic model for dual-limiting substrates (S1and S2) in culture. In such cases, the Monod structures for substratelimitation ( Si
kSiþSi) are reproduced for each one of the limiting substrates.
�X ¼ �X,max
S1kS1 þ S1
:S2
kS2 þ S2(Megee et al:, 1972) (19)
The proposal made by Megee et al. (1972) is valid whenever limitingsubstrates are consumed simultaneously and both are essential for growth.This means that growth is interrupted when complete consumption of anysubstrate occurs, even though the other substrate is in excess. Dunn et al.(1992) proposed the idea of enhancing substrates that are non-essential,but if available they can improve specific cell growth rate (Equation 20).
�X ¼ �X,max1 � S1kS1 þ S1
þ �X,max2 � S2kS2 þ S2
(Dunn et al:, 1992) (20)
Substrate inhibitionModels formulated in Equations 21 and 22 describe the situation of amedium component that can be either a limiting substrate or an inhibitingsubstrate. At the beginning of a culture, the high substrate concentrationcauses growth inhibition; nevertheless the gradual consumption by cellsreduces this effect until concentration gets low enough to become limiting.
�X ¼ �X,max
S
kS þ Sþ S2
ki,S
(Andrews, 1968) (21)
where:ki,S ¼ substrate inhibition constant for growth (M � L�3).
�X ¼ �X,max
S
1þ kSSþ S
k9i,S
� �n (Wu et al:, 1988) (22)
where:k9i,S ¼ constant ((M � L�3)n).
Product inhibitionEquations 23 to 25 are expressions of growth inhibition due to synthesisof byproducts during culture. Those formulas can represent exponential,hyperbolic, and linear reduction profiles of specific growth rates as afunction of product accumulation in the culture environment.
�X ¼ �X,max � e�k9i,P�P (Aiba et al:, 1968) (23)
where:k9i:P ¼ product inhibition constant for growth (L3 �M�1).
Mathematical models for growth and product synthesis in animal cell culture 195

�X ¼ �X,max �ki,p
ki,P þ P(Aiba and Shoda, 1969) (24)
where:ki,P ¼ product inhibition constant for growth (M � L�3).
�X ¼ �X,max � 1� P
Pm
� �(Ghose and Tyagi, 1979) (25)
where:Pm ¼maximum product concentration that states for �X ¼ 0 (M � L�3).
Substrate consumption
The classical studies of Monod (1942) demonstrated a carbon flux partitionbetween catabolism and anabolism, and suggested that a small amount ofthe carbon uptake is used for maintenance purposes. However, at that timeit was impossible to determine the consumption needed for cell main-tenance, because the methodologies lacked precision.
Later, it was observed that substrate to cell yield factors (YX=S) couldvary as a function of specific growth rate. Pirt (1966) described a linearrelationship between growth and substrate consumption, as well as thestatement of a term for cell maintenance (Equation 26).
�S ¼1
(YmaxX=S)
� �X þmS (Pirt, 1966) (26)
where:mS ¼ specific substrate uptake rate for maintenance, or maintenancecoefficient (M �M�1 � T�1 or M �Cel�1 � T�1);Ymax
X=S ¼ maximum or global substrate-to-cells yield factor (M �M�1 orCel �M�1).
This expression establishes a variation of the real yield factor as afunction of specific growth rate (Equation 27).
1
YX=S¼ 1
Ymaxx=s
!þ mS
�X
� �(27)
The maintenance coefficient can explain the non-growth associatedsubstrate consumption for energy production, an energy that supportstransmembrane ions gradient, motility, among other functions.
The expression established by Pirt (1966) describes anaerobic systemsand carbon-limited cultures. However, it gives a poor representation undersubstrate excess (Zeng and Deckwer, 1995a, 1995b). Then, Tsai and Lee(1990) built a model to represent the excessive consumption of substrate,under conditions of substrate excess (Equation 28).
�S ¼ ��S þ �ES (Tsai and Lee, 1990) (28)
where:��S¼ specific substrate uptake rate under substrate limitation conditions
196 Animal Cell Technology

(M �M�1 � T�1 or M �Cel�1 � T�1);�ES¼ increment or decline of specific substrate uptake rate due to
substrate excess (M �M�1 � T�1 or M �Cel�1 � T�1).
Zeng and Deckwer (1995a, 1995b) demonstrated the flexibility of theTsai and Lee (1990) proposition in representing data from microorganismsand animal cells, using the following equations to describe the terms ��Sand �E
S :
��S ¼ �X
YmaxS
þmS (with S , S�) (Zeng and Deckwer, 1995a) (29)
�ES ¼ ˜�max
S
S� S�S� S� þ kSS
(with S > S�) (Zeng and Deckwer, 1995a)
(30)
where:˜�max
S ¼ maximum increment or decline of specific substrate uptakerate due to substrate excess (M �M�1 � T�1 or M �Cel�1 � T�1);S�¼ substrate concentration under substrate limitation (M � L�3);(S� S�) ¼ excess of substrate (M � L�3);kSS ¼ substrate limitation constant for substrate uptake (M � L�3).
Product formation
Similarly to cell growth, the literature presents a set of expressions relatingspecific product synthesis and state variables (Bonomi and Schmidell,2001).
Equation 31 shows the generic model for product synthesis formulatedby Luedeking and Piret (1959). In this model, the product synthesis can beassociated to growth (term Æ�X), and also in a non-associated form (�). Inmany situations only one of the phenomena is observed – the synthesis isassociated or non-associated – employing only one of the terms of Equa-tion 31. Figure 8.5 illustrates the kinetics profiles for the three differentpossibilities of product synthesis described above.
�P ¼ Æ�X þ � (Luedeking and Piret, 1959) (31)
where:Æ ¼ constant for growth-associated production (M �M�1 or M �Cel�1);� ¼ constant for non-growth-associated production (M �M�1 � T�1 orM �Cel�1 � T�1).
A usual modification for this equation considers the influence ofsubstrate concentration on the non-associated term, usually expressed as aMonod-type limitation (Equation 32).
�P ¼ Æ�X þ �mS
kpS þ S
(32)
where:�m ¼ constant (M �M�1 � T�1 or M �Cel�1 � T�1);kpS ¼ substrate limitation constant for product synthesis (M � L�3).
Mathematical models for growth and product synthesis in animal cell culture 197

Another form of inhibition of product synthesis results from theproduct accumulation in the medium itself, that can be modeled using thesame structures seen before (Equations 23 to 25) for cell growth inhibition(Equations 33 to 35).
�P ¼ �P,max � e�kP9i,P�P (Aiba et al:, 1968) (33)
where:�P,max ¼ maximum specific product synthesis rate (M �M�1 � T�1 orM �Cel�1 � T�1);kP9i,P ¼ product inhibition constant for product synthesis (L3 �M�1).
�P ¼ �P,max �kPi,P
kPi,PþP
(Aiba and Shoda , 1969 ) (34)
kPi,P ¼ product inhibition constant for product synthesis (M: � L�3).
�P ¼ �P,max � 1� P
P9m
� �(Ghose and Thiagi, 1979) (35)
where:P9m ¼ maximum product concentration that determines �P ¼ 0(M � L�3).
Similarly to what was seen in Equations 28 to 30, Zeng (1995) and Zengand Deckwer (1995a) proposed a model for specific production rateconsidering three aspects: production associated with growth; productionnot associated with growth, and a term due to substrate excess that causesan increment or decline of the specific production rate (Equation 36).
X
P
(A) X
P
(B) X
P
(C)
Time (h) Time (h) Time (h)
µX µXµX
µP
µP
µP
Figure 8.5
Profile for growth and product synthesis according to different production models:(A) growth associated production; B) growth partially associated production, and;C) non-growth associated production.
198 Animal Cell Technology

�P ¼ Y�P=X 3 �X þmP|fflfflfflfflfflfflfflfflfflfflfflfflffl{zfflfflfflfflfflfflfflfflfflfflfflfflffl}Limitation of Substrate
þ˜�maxP
S-SP
S-SP þ kPS|fflfflfflfflfflfflfflfflfflfflfflfflffl{zfflfflfflfflfflfflfflfflfflfflfflfflffl}Excess of Substrate
(Zeng, 1995; Zeng and Deckwer, 1995a)
(36)
where:Y�P=X � �X ¼ growth-associated specific production rate, under sub-strate-limiting conditions;Y�P=X ¼ yield coefficient for product formation due to cell growth(M �M�1 or M �Cel�1);mP ¼ nongrowth-associated specific production rate, under substrate-limiting conditions (M �M�1 � T�1 or M �Cel�1 � T�1);˜�max
PS�SP
S�SPiþkPS
¼ increment or decline of specific production rate due tosubstrate excess;˜�max
P ¼ maximum increment or decline of specific production rate dueto substrate excess (M �M�1 � T�1 or M �Cel�1 � T�1);SP ¼ substrate concentration at which an increase or decrease of �Pstarts to take place (M � L�3);(S� SP) ¼ substrate excess for product synthesis (M � L�3);kPS ¼ substrate limitation constant for product synthesis (M � L�3).
8.3.2 Kinetic models for animal cells
In the previous section, the main equations used for building unstructuredand non-segregated generic models were discussed. In principle, thedescription of an animal cell system can be based on any of these formulas,or combinations of them, as can be seen in some literature reviews(Tziampazis and Sambanis, 1994; Portner and Schafer, 1996; Sidoli et al.,2004). Nevertheless, the complexity of animal cell systems also demandsalternative mathematical expressions for the full description of observedphenomena.
The identification of such phenomena, as the basis for any mathematicalmodel building, assumes certain knowledge about cell metabolism, underdifferent culture conditions. Chapter 4 discusses the metabolism of animalcells, and should be consulted for a full understanding of the kineticmodels presented below.
Kinetics models for cell growth and death, as well as for substrateconsumption and product and byproduct synthesis, are presented here.Most of these were developed for hybridomas in continuous processes.Although these models are representative of animal cell systems, it isimportant to understand that the cellular response to an environmentalstimulus is highly dependent on the specific cell line. The reviewpublished by Porter and Schafer (1996) illustrated this variability throughthe comparison of experimental data and models from different groups ofcell lines. Besides this, the lack of proper knowledge to explain experi-mentally observed phenomena also accounts for the variability of modelstructures.
Mathematical models for growth and product synthesis in animal cell culture 199

Kinetic formulations for animal cell growth
Table 8.1 summarizes a set of mathematical expressions for the descriptionof the specific growth rate during culture. Most of these formulationsemploy Monod-type structures for cell growth limitation by substrates(Monod, 1949), and structures for byproduct inhibition (Aiba and Shoda,1969; see Equations 16 and 24).
Glucose and glutamine, which provide carbon for catabolic and anabolicpathways, appear in the majority of models as limiting substrates. Cer-tainly, the frequency of glucose and glutamine as limiting substrateindicates their importance to cell metabolism, but also the need for
Table 8.1 Kinetic equations for specific hybridoma growth rates
Formulations References Eq.
�X ¼ �X,max �GLN
kGLN þ GLNPortner et al., 1996 (37)
�X ¼ �X,max
GLC
kGLC þ GLC� GLN
kGLN þ GLNde Tremblay et al., 1992 (38)
�X ¼ �X,max
GLC
kGLC þ Glc� ki,LACki,LAC þ LAC
Kurokawa et al., 1994 (39)
�X ¼ �X,max
GLN
kGLN þ GLN� ki,NH3
ki,NH3 þNH3� ki,LACki,LAC þ LAC
Bree et al., 1988 (40)
�X ¼ �X,max �GLC
kGLC þ GLC� GLN
kGLN þ GLN� ki,NH3
ki,NH3þNH3
� ki,LACki,LAC þ LAC
Miller et al., 1988 (41)
�X ¼ �X,min þ (�X,max � �X,min) �(GLC� GLCthres)
kGLC þ (GLC� GLCthres)Frame and Hu, 1991a (42)
�X ¼ �X,max � (Serum) � GLC
kGLC þ GLCDalili et al., 1990 (43)
�X ¼ �X,max �Serum
(Serumþ (kSerum)0 � X��� )� GLN
kGLN þ GLN:
k9i,NH3
k9i,NH3þ (NH3)
2Glacken et al., 1989 (44)
�X ¼ a1 � B� a2B
Gaertner and Dhurjati,1993
(45)
�X ¼ Dþ d0 � e(d1=�X) Linardos et al., 1991 (46)
�X ¼ �X,max � 1� Æ1 � XV
D
� �� GLC
kGLC þ GLC� GLN
kGLN þ GLNZeng et al., 1998 (47)
Adapted from Portner and Schafer, 1996. GLC, glucose; GLN, glutamine; NH3, ammonia; LAC, lactate; B, basemedium concentration; D, specific feed rate; Xv, concentration measured as viable cells number per volume(106 cell/ml).
200 Animal Cell Technology

facilities to determine these substances in comparison to other mediacomponents. Nevertheless, not all formulas indicate dual limiting-substrate kinetics (GLC and GLN), mainly because the cell responsedepends upon the cell line and on the culture conditions.
It is possible to represent a kinetic limitation by introducing a thresholdconcentration, as GLCthres in Equation 42 (Frame and Hu, 1991a). Thisparameter suggests the existence of an unknown component in culturemedium, which causes growth limitation when the glucose concentrationreaches the value GLCthres.
Zeng et al. (1998) proposed another way to deal with unknown limitingor inhibiting components. From an evaluation of growth, death, andproduction kinetics of hybridomas in perfusion culture, they noted thatneither glucose and glutamine limitation, nor lactate and ammonia inhibi-tion, the most frequent phenomena in an unstructured model, couldexplain their data. The introduction of parameter Æ1 (Equation 47), whichrelates the specific autoinhibitor production rate and its critical concentra-tion, could represent the behavior of many different cell lines. However,this model shows a strong dependence on the substrate availability,represented by the specific feed rate (D), as well as on viable cellconcentration (XV). This alternative model shows the difficulty, stillpresent, in establishing a cause–effect relationship between a change in theenvironment and cell behavior.
Gaertner and Dhurjati (1993) used the initial concentration of basemedium (B) in an attempt to handle the absence of information concerningthe limiting substrate (Equation 45). The base medium corresponded to aDMEM formulation without GLC, GLN, NaCl, and NaHCO3: Differentconcentrations of this base were tested. The solution showed a hyperbolicrelationship between the specific growth rate and the basal mediumconcentration, independently of the effective limiting component.
Finally, Equations 43 and 44 introduce serum concentration, measuredas a percentage of total volume, as the growth-limiting factor. Except forthe work of Kurokawa et al. (1994), all models presented in Table 8.1derive from data obtained in serum-based cultures. However, only two ofthese models (Glacken et al., 1989; Dalili et al., 1990) utilize this strategyto represent the unknown limiting component.
In general, glucose and glutamine are consumed at a high rate, since cellsin culture cannot regulate their uptake. Therefore, cells synthesize largeamounts of lactate and ammonia, eventually accompanied by amino acidssecretion (alanine, glycine, and aspartate). This absence of regulationcauses the rapid depletion of substrates (GLC and GLN) from media, andthe consequent accumulation of byproducts (LAC and NH3), potentialinhibitors of the system, both represented in Equations 39 to 41 and 44.
Among the possibilities presented in Section 8.3.1 (Equations 23 to 25),the structure for a hyperbolic inhibitory profile is the most widely used(see Equations 39 to 41, 44 and 47). However, not every formula includesan expression for the potential inhibition of byproducts (LAC and NH3),since the response is cell-dependent.
The values of the parameters shown in Table 8.1, used in building ofmodels, were fitted from different sets of experimental data. Except forvery robust models that can represent a large number of situations, differ-
Mathematical models for growth and product synthesis in animal cell culture 201

ent cell lines and experimental conditions (operation mode, media formu-lation, initial conditions, etc.) may influence the fitting of parameters and,consequently, different parameter values are expected for the same phe-nomena. Table 8.2 presents parameter values fitted for models of Table 8.1from specific experimental conditions. These are indicative of the range ofvalues they can assume for animal cell systems. However, some of thesevalues may be considered inappropriate. This is the case of the value fittedfor �X,max in Equation 40 – 0.125 h–1 – surely a value not representativefor an animal cell system.
Kinetic formulations for animal cell death
Necrosis and apoptosis, the two mechanisms of cell death, are discussedextensively in Chapter 7, and are considered in more detail in this section.
Cell death is particularly important for animal cell systems, consideringtheir intrinsic fragility in the imposed culture conditions, mainly as a resultof hydrodynamics shear stress and media composition. This scenario isvery different from that of microbial systems, for which it is rare to findformulas representing death processes. When establishing culture condi-tions for animal cells, there is always much concern in minimizing injuryto cells, to insure high viabilities for long periods. Nevertheless, modifica-tions in the environment, mainly in media composition, occur during theculture that normally lead to loss of viability. That explains why many
Table 8.2 Fitted parameters for models in Table 8.1
Eq. �X,max(h–1)
kGLC(mM)
kGLN(mM)
ki,LAC(mM)
ki,NH3
(mM)Other parameters
(37) 0.036 – 0.06 – – –
(38) 0.045 1 0.30 – – –
(39) 0.033 0.278 – 13.9 – –
(40) 0.125 – 0.8 8.0 1.05 –
(41) 0.063 0.15 0.5 140 20 –
(42) – – 0.0309 – – �X,min¼ 0.013 h–1;
GLCLimiar ¼ 0.0303 mM
(43) 0.056 0.06 – – – –
(44) 0.055 – 0.15 – – (kSerum)0¼26.5;
�¼0.21;
k9i,NH3¼ 26 mM2
(45) – – – – – a1 ¼ 0.043 h–1;
a2 ¼ 0.07 g/L
(46) – – – – – d0 ¼ 0.0029 h–1;
d1 ¼ 0.0195 h–1;
(47) 0.045 to 0.072 0 to 0.0094 0 to 0.040 – – 0.0043< Æ1 < 0.0092(L/109 cel.h)
202 Animal Cell Technology
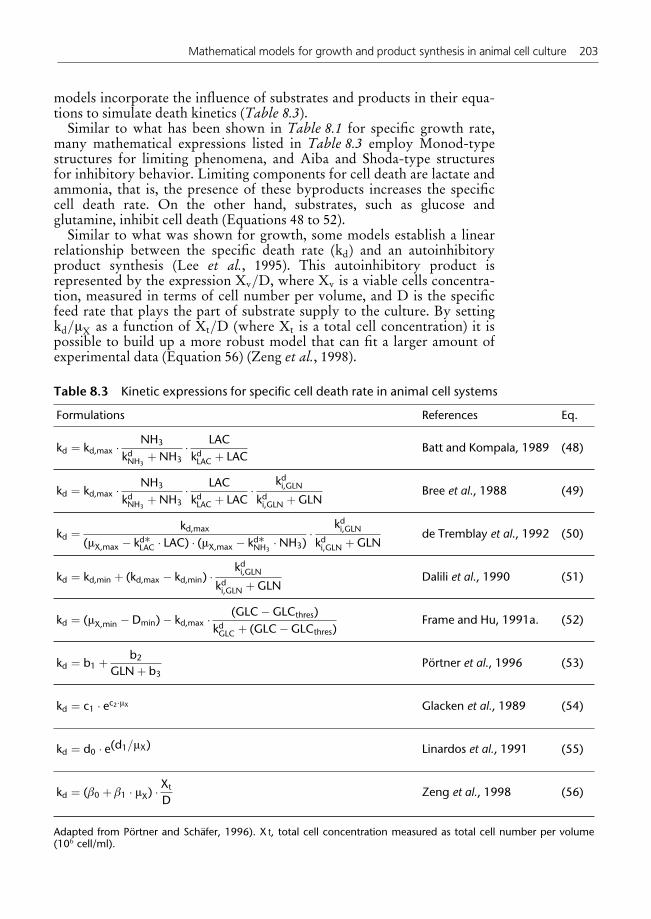
models incorporate the influence of substrates and products in their equa-tions to simulate death kinetics (Table 8.3).
Similar to what has been shown in Table 8.1 for specific growth rate,many mathematical expressions listed in Table 8.3 employ Monod-typestructures for limiting phenomena, and Aiba and Shoda-type structuresfor inhibitory behavior. Limiting components for cell death are lactate andammonia, that is, the presence of these byproducts increases the specificcell death rate. On the other hand, substrates, such as glucose andglutamine, inhibit cell death (Equations 48 to 52).
Similar to what was shown for growth, some models establish a linearrelationship between the specific death rate (kd) and an autoinhibitoryproduct synthesis (Lee et al., 1995). This autoinhibitory product isrepresented by the expression Xv=D, where Xv is a viable cells concentra-tion, measured in terms of cell number per volume, and D is the specificfeed rate that plays the part of substrate supply to the culture. By settingkd=�X as a function of Xt=D (where Xt is a total cell concentration) it ispossible to build up a more robust model that can fit a larger amount ofexperimental data (Equation 56) (Zeng et al., 1998).
Table 8.3 Kinetic expressions for specific cell death rate in animal cell systems
Formulations References Eq.
kd ¼ kd,max � NH3
kdNH3þNH3
� LAC
kdLAC þ LACBatt and Kompala, 1989 (48)
kd ¼ kd,max � NH3
kdNH3þNH3
� LAC
kdLAC þ LAC� kdi,GLN
kdi,GLN þ GLNBree et al., 1988 (49)
kd ¼ kd,max
(�X,max � kd�LAC � LAC) � (�X,max � kd�NH3�NH3)
� kdi,GLN
kdi,GLN þ GLNde Tremblay et al., 1992 (50)
kd ¼ kd,min þ (kd,max � kd,min) �kdi,GLN
kdi,GLN þ GLNDalili et al., 1990 (51)
kd ¼ (�X,min � Dmin)� kd,max � (GLC� GLCthres)
kdGLC þ (GLC� GLCthres)Frame and Hu, 1991a. (52)
kd ¼ b1 þ b2
GLNþ b3Portner et al., 1996 (53)
kd ¼ c1 � ec2��X Glacken et al., 1989 (54)
kd ¼ d0 � e(d1=�X) Linardos et al., 1991 (55)
kd ¼ (�0 þ �1 � �X) �Xt
DZeng et al., 1998 (56)
Adapted from Portner and Schafer, 1996). X t, total cell concentration measured as total cell number per volume(106 cell/ml).
Mathematical models for growth and product synthesis in animal cell culture 203

Table 8.4 lists parameter values fitted to models presented in Table 8.3.
Formulations for substrate uptake
Generally, the expressions proposed for the kinetics of glucose or gluta-mine uptake do not differ significantly from each other. Table 8.5 (forformulations) and Table 8.6 (parameters) sum up the kinetic models forthe description of substrate uptake rates.
Pirt’s formulations, or variations of them (see Equation 26), wereemployed in many models shown in Table 8.5. In one of them (Equation59) the term �ekd is added to better fit data obtained at low specificgrowth rate (Linardos et al., 1991). Other propositions introduced aminimum specific growth rate (�X,min) to fit the non-linearity observed atthe same low specific growth rate (Frame and Hu, 1991a, 1991b).
For Equations 62 and 63, the maintenance coefficient appears limited bysubstrate through a Monod-type formulation.
Finally, in Equation 64, Zeng (1996a) modified his own original model(presented in Equations 28 to 30), by eliminating parameter S* thatassumes low values for hybridomas culture. The influence of nutrients isdependent, not on nutrient concentration, but on available mass ofnutrient per cell unit S=Xv.
Formulations for product synthesis
Table 8.7 (mathematical expressions) and Table 8.8 (parameters) reviewthe main models found in the literature for the representation of product
Table 8.4 Fitted parameters for models of Table 8.3
Eq. kd,max
(h–1)kdNH3
(mM)kdLAC(mM)
kdi,GLN(mM)
Other parameters
(48) 0.08 1.44 311 –
(49) 0.0833 1.44 15 5.10–4 –
(50) 0.0288 – – 0.02 kd�NH3¼ 0.0025 (1/mM.h);
kd�LAC 0.00042 (1/mM.h)
(51) 0.08 – – 5.10–6kd,min¼ 0.05 h–1
(52) 0.00628 – – – Dmin ¼ 0.00636 h–1;
�min¼ 0.013 h–1;
kdGLC¼ 0.240 mM
(53) – – – – b1 ¼ 0.002 h–1; b2 ¼ 6.105 g/L.h;
b3 ¼ 0.0025 g/L
(54) 0.051 – – – c1 ¼ 0.051 h–1; c2 ¼ –101.2 h
(55) – – – d0 ¼ 0.0029 h–1; d1 ¼ 0.0195 h–1
(56) – – – – 0.0< �0 < 4.6.10–5 h–1
0.0< �1 < 0.0038 L/109.cel.h
204 Animal Cell Technology

(proteins) synthesis. Once more, the diversity of mathematical structuresreflects the variability of response in such systems, as well as the lack ofknowledge of intracellular mechanisms.
Some models utilize the concept of Luedeking and Piret (1959) forgrowth associated and/or non-growth associated production (Equations65 to 67). However, in some circumstances, the best fit occurs when thespecific death rate kd is considered, instead of the specific growth rate �X(Equations 68, 70 and 71) (Linardos et al., 1991; Zeng, 1996a, 1996b). Thisstatement follows the observation that antibody production increaseswhen cells are under conditions of stress.
Considering the influence of media components on specific productionrate, only one expression makes serum relevant (Equation 69), whileglutamine appears as a limiting substrate in three formulas (Equations 69to 71), always with a Monod-type structure. Glucose shows either aninhibitory effect over production (Equations 71 and 72), or a limiting andinhibitory pattern simultaneously (Equations 70). Instead of the classical
Table 8.5 Kinetic parameters for specific uptake rates in hybridoma systems: equations arevalid for both substrates – GLC and GLN
Formulations References Eq.
�S ¼1
(YmaxX=S )
� �X de Tremblay et al., 1992;Hiller et al., 1991
(57)
�S ¼1
(YmaxX=S )
� �X þmS Harigae et al., 1994; Hiller et al.,1991; Miller et al., 1988;Kurokawa et al., 1994
(58)*
�S ¼1
(YmaxX=S )
� �X þmS � ekd Linardos et al., 1991 (59)
�S ¼1
(YmaxX=S )
� (�X � �min) Frame and Hu, 1991a (60)
�S ¼1
1
YX=S� º
YP=S
� �X þ Æ2
YP=S� 1
YX=S� �X,min Frame and Hu, 1991b (61)
�S ¼1
(YmaxX=S )
� �X þmSS
kSS þ Sde Tremblay et al., 1992 (62)
�S ¼h1 � Sh2 þ S
Portner et al., 1996;Gaertner and Dhurjati, 1993
(63)
�S ¼1
YmaxS
� �X þmS
!þ ˜�m
S � S
Sþ (Xv � kS#S )Zeng, 1996a (64)
*Same formulation proposed in Equation 26.
Mathematical models for growth and product synthesis in animal cell culture 205

Table
8.6
Fittedparameters
formodelsofTable
8.5
Eq.
References
SYmax
X=S
(108cel/mmol)
mS
(10–10mmol/cel.h)
Otherparameters
(57)
deTremblayet
al.,1992
GLN
3.80
––
(58)
Hilleret
al.,1991
GLC
1.02
–Milleret
al.,1988
GLC
2.8
0.50
–Harigaeet
al.,1994
GLC
5.88
0.51
–GLN
3.44
0.08
–Hilleret
al.,1991
GLN
16.9
1.56
(59)
Linardoset
al.,1991
GLC
5.93
1.96
–GLN
6.30
0.29
–
(60)
FrameandHu,1991a
GLC
0.355mgcel/mgGLC
(p/�,0.0508h–1):
0.101mgcel/mgGLC
(p/�.0.0508h–1)
p/�,0.0508h–1:
�min¼
0.00630h–1
or
p/�.0.0508h–1:
�min¼
0.391h–1
(61)
FrameandHu,1991b
GLC
1.82
(p/�,0.00429h–1)
0.52
(p/�.0.00429h–1)
–Æ2¼
0.00672mg/cel.h;
º¼
9.31.10–9mg/cel;
�X,m
in¼
0.013h–1;
Y P=S¼
73.4
mg/m
M
(62)
deTremblayet
al.,1992
GLC
1.09
0.00708
kS S¼
1.0
mM
(63)
Portneret
al.,1996
GLN
––
h1¼
0.6810–10mmol/cel.h
h2¼
0.2
mmol
GaertnerandDhurjati,1993
GLC
––
h1¼
2.7010–10mmol/cel.h
h2¼
0.34mmol
(64)
Zeng,1996a
GLC
1.72
0.086
˜�m GLC¼
0.094L/109cel.h
ks9 GLC¼
0.29g/cel
GLN
9.52
0.0093
˜�m GLN¼
0.033L/109cel.h
kS#
GLN¼
0.089g/cel
206 Animal Cell Technology

formulation for the limitation or inhibition of a substrate (Equations 21and 22), a hyperbolic structure is employed to represent inhibition, andthe parameter GLC� is introduced to represent the minimum glucoseconcentration that guarantees product synthesis.
In Equation 70, Zeng (1996b) considers also the loss of productioncapacity within the cell population – in the term (F1 þ e�F2�˜t). This is acharacteristic common to many hybridomas that are expressed in long-term culture. For Zeng (1996b), any cell population has two categories ofindividuals, one characterized with high protein productivity, and anotherwith low protein productivity. The loss of producing capacity is attributedto mutation or loss of genetic materials, and is irreversible. The parameter‘‘F2’’ in Equation 70 represents the transformation rate from a producingto a non-producing population. The parameter ‘‘F1’’ states a relationshipbetween the specific production rates of these two populations, each oneof them homogeneous in its productivity. Finally, an exponential function– e�F2�˜t – simulates the loss of producing capacity within a cell popu-lation.
If a process is operated in perfusion with high cell densities, Equation 70might need an adjustment, as indicated in Equations 71 and 72. This canoccur by taking the relation (S=XV) for the main state variable, which
Table 8.7 Kinetic expressions for specific monoclonal synthesis rate
Formulations References Eq.
�MAb ¼ � Portner et al., 1996;Hiller et al., 1991
(65)
�MAb ¼ Æ � �x þ � Frame and Hu, 1991b (66)
�MAb ¼ Æ0
k� þ �X
� �X þ � de Tremblay et al., 1992 (67)
�MAb ¼ Æ1 � kd þ �1 Linardos et al., 1991 (68)
�MAb ¼ �2 � (Serum)GLN
kMAbGLN þ GLN
Dalili et al., 1990 (69)
�MAb ¼ (Æ1 � kd þ �1)GLN
kMAbGLN þ GLN
� kMabi,GLC
GLC� GLC� þ kMAbi,GLC
(F1 þ e�F2�˜t) Zeng, 1996b (70)
�MAb ¼ (Æ1 � kd þ �1) �GLN
kMAb#GLN � Xv þ GLN
� kMAb#i,GLC �Nv
GLCþ kMAb#i,GLC � Xv
Zeng, 1996a (71)
�MAb ¼ � � DPer
DPer þ kMAbDPer
� kMAbi,GLC
GLCþ kMAbi,GLC
Zeng, 1996a (72)
DPer ¼ specific perfusion rate (h�1).
Mathematical models for growth and product synthesis in animal cell culture 207

includes the influence of substrate and high cell density (Equation 71); orby considering the stimulation of productivity caused by the specificperfusion rate (DPer).
Tables 8.9 and 8.10 show examples of kinetic expressions for byproductsynthesis and the parameter values fitted to them.
Frequently, the specific byproduct formation rate is presented as afunction of specific substrate consumption rate and substrate-to-productyield (see Equation 12), but other structures can be assumed. The specificproduction rate can be limited by a precursor substrate and modeled by aMonod-type expression, as in Equation 73, or it may be inhibited by asubstrate that is not, in principle, linked to its production, as in Equation
Table 8.8 Fitted parameters for models of Table 8.7
Eq. References Æ(mg/mgcel)
�(mg/109cel.h)
Other parameters
(65) Portner et al., 1996 – 0.0167 –Hiller et al., 1991 – 0.708 –
(66) Frame and Hu, 1991b –0.0266 0.00672(mg/mgcel.h)
–
(67) de Tremblay et al., 1992 0.146 Æ0¼ 0.115 mg/108cel
k�¼ 8.33.10–4 h–1
(68) Linardos et al., 1991 – – Æ1¼ 273 g/106cel
�1¼ 0.0375 g/106cel.h
(69) Dalili et al., 1990 – – �2¼ 0.4 mg/108cel.h
kMAbGLN ¼ 0.1 mM
(70) Zeng, 1996b – – Æ1¼ 0 – 51.6 g/109cel
�1¼ 0.5 – 1.21 mg/109cel.h
kMAbGLN ¼ 4.42 – 9.01 mM
kMAbi,GLC¼ 4.42 – 9.01 mM
GLC* ¼ 0.1 mM
F1 ¼ 0.37 – 1.18
F2 ¼ 0 – 0.018 h–1
(71) Zeng, 1996a Æ1¼ 0.092 mg/109cel
�1¼ 1.33 mg/109cel.h
kMAb#GLN ¼ 0.0079 mmol/109cel
kMAb#i,GLC ¼ 12.65 mmol/109cel
(72) Zeng, 1996a �¼ 4.16 mg/109cel.h
kMAbDPer
¼ 0.115 h–1
kMAbi,GLC¼ 13.97 mM
208 Animal Cell Technology

76 and 77. For example, glucose inhibits ammonia synthesis, an assump-tion that takes account of the complex regulation of dual-substratemetabolism (GLC and GLN) in animal cell systems (see Chapter 4).
In Equations 74 and 78 data fit to a model that considers the concept ofexcess substrate in culture, as set previously in Equation 36 (Zeng, 1995).However, this formulation needs modification in order to include high celldensity conditions. In Equations 75 and 79, as seen before, the mass ofnutrient available per cell (S=XV) is the state variable to take this intoaccount.
8.3.3 Parameter fitting in models
Unstructured models, as detailed in Sections 8.3.1 and 8.3.2, are formu-lated by a series of kinetic and differential non-linear equations thatrepresent the dynamics of all the state variables during the process. Thus,to simulate a model that consists of parameters and state variables, it isnecessary to attribute values to the parameters.
The initial parameters values can be estimated in different ways:
(i) from the stoichiometric relationship, utilizing experimental or theor-etical data;
Table 8.9 Kinetic formulations for synthesis of byproducts (ammonia and lactate)
Formulations References Eq.
�LAC ¼ �LAC,max �GLC
kLACGLC þ GLCGaertner and Dhurjati, 1993 (73)
�LAC ¼ YLAC=X � �X þmLAC þ ˜�maxLAC, GLC � GLC� GLC�
GLC� GLC� þ kLACGLC
Zeng, 1995 (74)
�LAC ¼ YLAC=X � �X þmLAC þ ˜�maxLAC, GLC � GLC
GLCþ kLAC#GLC � Xv
þ . . . Zeng, 1996a (75)
. . . þ ˜�maxLAC, GLN � GLN
GLNþ kLAC#GLN � Xv
�NH3¼ E1 þ E2 � GLC
E3 þ GLCGaertner and Dhurjati, 1993 (76)
�NH3¼ G1 þ G2 � LAC
G3 þ LACGaertner and Dhurjati, 1993 (77)
�NH3¼ YNH3=X � �X þmNH3
þ ˜�maxNH3, GLN
� GLN3
GLN3þ kNH3
GLN
þ . . . Zeng, 1995 (78)
. . . þ˜�maxNH3, GLC
� GLC
GLCþ kNH3
GLC
�NH3¼ YNH3=X � �X þmNH3
þ ˜�maxNH3, GLN
� GLN
GLNþ kNH3#GLN � Xv
Zeng, 1996a (79)
Mathematical models for growth and product synthesis in animal cell culture 209

(ii) by linearization and, sometimes, simplification of kinetic equationsand by fitting the experimental data by linear regression;
(iii) by utilizing parameter values available in the literature.
Item (i) above is largely employed to obtain substrate-to-cell andsubstrate-to-product yield factors. When the substrate consumption isdiverted to several different products, an estimate of the substrate-to-product yield factors can be based on the stoichiometric relationshipsobtained from the biochemical reactions.
Table 8.10 Fitted parameters for models of Table 8.9
Eq. Byproducts(bP)
YbP=X�mmolsP109cel
� � mbP
mmolsP109cel � h
� � ˜�maxbP,S
mmolsP109cel � h:
� � kbPS(mM)
Other parameters
(73) LAC 0.34 �LAC,max¼ 2.7
(mmol/1010cel.h)
(74) LAC 10,42 0.050 0.355 0.43
(75) LAC 2553 888 1322 (S ¼ GLN)3663 (S ¼ GLC)
kLAC#GLN 0.013
(mmol/109cel)
kLAC#GLC ¼ 17.54
(mmol/109cel)
(76) NH3 E1 ¼ 2.0
(mmol2/1010cel.L.h)
E2 ¼ 0.35
(mmol/1010cel.h)
E3 ¼ 3.3 mM
(77) NH3 G1 ¼ 6.2(mmol2/1010cel.L.h)
G2 ¼ 0.22(mmol/1010cel.h)
G3 ¼ 14 mM
(78) NH3 0.21 0.00068 0.032 (p/S ¼ GLN)0.0041 (p/S ¼ GLC)
0.56(p/GLN)0.96
(p/GLC)
.
(79) NH3 0.73 – 0.025 (S ¼ GLN) kNH3#GLN 0.071
(mmol/109cel)
210 Animal Cell Technology

Item (ii) is largely employed in obtaining kinetic parameters such as thesubstrate limitation and inhibition constants for cellular growth and death(kS and ki,S, respectively) and substrate inhibition constants for production(kPi,S); maximum specific growth and death rates (�X,max and kd,max), as wellas the global yield factors (YX=S and YP=S), that may be associated or not tothe cellular growth.
Simplification of the equations involves separating the parameters to beestimated.
Besides the simplification, a subset of data must be selected, from theavailable data set, that is more adequate for the determination and fittingof the parameters.
Andrew’s kinetic model (Equation 21) (Andrews, 1968), for example,relates the specific growth rate (�X) with the substrate concentration S,applying three parameters (�X,max, kS and ki,S).
The initial parameter estimations of �X,max and kS can be based on asimplification of Equation 21, by disregarding the inhibition term for thesubstrate. Thus, Equation 21 becomes Equation 80.
�X ¼ �X,max
S
kS þ S(80)
Re-arranging this equation results in its linearization.
1
�X
¼ 1
�X,max
þ kS�X,max
� 1S
(81)
Using data extracted from the test conducted with non-inhibitingsubstrate concentrations, the construction of the graph 1=�X ¼aþ b � (1=S) allows a fit of values for ‘‘a’’ and ‘‘b’’ and, from these, anestimate of �X,max and kS (Equation 81).
An initial estimate for parameter ki,S can be obtained by the simplifica-tion of Equation 21, disregarding the limitation for the substrate term, S,forming Equation 82:
�X ¼ �X,max
S
Sþ S2
ki,S
(82)
Re-arranging this equation results in its linearization:
1
�X
¼ 1
�X,max
þ 1
�X,max:ki,s
!� S (83)
Using data extracted from the test conducted with inhibiting substrateconcentrations, the construction of the graph 1=�X ¼ aþ b � S allows a fitof values for ‘‘a’’ and ‘‘b’’, and, from these, an estimate of �X,max and ki,S(Equation 83). Others ways of estimating parameters can be found inBonomi and Schmidell (2001).
Once the initial values of the parameters are estimated, the modelbecomes dependent only on the state variable. From now on, forecasts canbe made with the model and the results compared to the experimental datafor different culture conditions (model simulation). Thus, the quality of
Mathematical models for growth and product synthesis in animal cell culture 211

the model is evaluated and, if necessary, one should try new values for theparameters to improve the forecasts so that they resemble more and morethe experimental values. This approach is named model fitting and intendsto find the optimal parameters that minimize the difference between theexperimental data and that generated by the model. The final result of thisfitting is the final model parameter estimation, also called parameteroptimization.
The estimation of model parameters can be reduced to the solution ofan optimization problem. This means that once the objective is defined, aclass of mathematical functions that best match the specified objectivesmust be found.
The optimization can be carried out by several methods of linear andnonlinear regression. The mathematical methods must be chosen withcriteria to fit the calculation of the applied objective functions. The mostwidely applied methods of nonlinear regression can be separated into twocategories: methods with or without using partial derivatives of theobjective function to the model parameters. The most widely employednonderivative methods are zero order, such as the methods of direct searchand the Simplex (Himmelblau, 1972). The most widely used derivativemethods are first order, such as the method of indirect search, Gauss-Seidel or Newton, gradient method, and the Marquardt method.
The objective functions employed in the parameter optimization canassume different forms (Equations 84 to 89):
OF ¼Xi
(~yyi � yi)2 (84)
where:OF ¼ objective function;yi¼ experimental value of variable i.
Or
OF ¼Xi
~yyi(yi)m
� yi(yi)m
� �2
(85)
where:~yyi¼ calculated value of variable i;(yi)m¼maximum experimental value of variable i.
Or
OF ¼Xi
~yyi � yi~yyi
� �2
(86)
Or
OF ¼Xi
~yyi � yi~yyi � yi
2
� �264
3752
(87)
Or
212 Animal Cell Technology

OF ¼X
r� 1j j þX
a� 1j j (88)
where:r ¼ correlation coefficient of the linear regression (experimental vs.calculated variables);a ¼ angular coefficient of the linear regression (experimental vs.calculated variables).
OF ¼ r� 1j j þ a� 1j j (89)
Whatever the form of calculation of the objective function or themethod employed in parameter optimization, the numerical solution ofthe set of differential equations can be obtained by applying algorithms ofinitial values. Examples of these algorithms are the implicit integrationmethods (Euler, Crank-Nicolson, Adams-Moulton), or prediction-correc-tion methods (Runge-Kutta, Michelsen, Gear) or bounded value problemalgorithms, such as finite difference methods, Jacobi’s polynomial ororthogonal collocation methods (Rice and Do, 1995; Constantinides andMostoufi, 1999).
In the Appendix of this book, there is an example of parameter fittingproposed for the case of mathematical modeling of mAb production,adapted from Lee (2003).
8.3.4 Model validation
The next step to model fitting is its validation. Statistical analysis isemployed for the verification of the experimental error, determination ofthe best model, to identify any systematic deviation between the fittedmodel and the experimental data, as well as to verify whether the model isstatistically consistent, that is, whether it shows an error in the real dataconsistent with the experimental error.
The most widely employed statistical test for validation of a mathema-tical model is the F test.
For the application of this test, the experimental error must be known.One way of determining the experimental error is to carry out a set oftests, conducted in identical conditions. The relationship between the errorfrom model fitting and the experimental error estimate is given by Equa-tion 90:
Fc ¼ s2cs2e
(90)
where:s2c ¼ model error for variance estimate;s2e ¼ experimental error variance estimate.
The form of calculation of these variances is given by Equations 91 and 92.
Mathematical models for growth and product synthesis in animal cell culture 213

s2c ¼
Xvi¼1
Xnj¼1
(~yyij � yij)2
(nv)c � p(91)
s2e ¼
Xvi¼1
Xnj¼1
(yij � yi)2
(nv)e � v(92)
where:n ¼ number of points for each variable;v ¼ number of state variables defined by the model;(nv)c ¼ number of fitted points (all tests and variables);(nv)e ¼ number of experimental points (all repeated tests and statevariables);p ¼ number of parameters from the model;~yyij¼ variable values calculated by the model;yij¼ experimental variable values;yi¼ average variable values for repeated tests.
For model validation, Fc , 1 or s2c, s2e.For more than one model, the relationship of the model to experimental
data can be determined by the �2 Bartlett statistical test (Fromment andBischoff, 1990).
8.4 Structured and non-segregated models
The structured and non-segregated models, as mentioned before, considerthe cell population as homogeneous, but the intracellular structures areseparated, in a way that the cell is considered complex and treated as aheterogeneous structure. Thus, it is possible to characterize the intrinsiccell behavior and to forecast its interaction. As indicated in Chapter 5,media for animal cells culture are complex, with components that includesugar, amino acids, salts, and growth factors. Glucose and glutamine addedto media as carbon, nitrogen, and energy sources can affect cellular growthand byproducts (such as lactate and ammonia) can accumulate in theculture medium causing inhibition.
The difficulty of understanding all these interactive phenomena fromthe cell and environment, which are in permanent transition, demands adetail of the cellular structure – the characteristic of the structured models.Depending on the quantity of detail and physiological structures consid-ered, these structured models have varying ability for forecasting andbecome highly valuable tools for understanding the cell physiology.
One of the pioneers of structured models in animal cell culture used asingle-cell model (Batt and Kompala, 1989). Based on hybridoma metabo-lism (Figure 8.6), the model was based on the formulation of fourcompartments: amino acids (including the TCA precursors), the nucleo-tides (including DNA and RNA), the proteins, and lipids. The excretedbyproducts (lactate and ammonia) and the excreted product (mAb) werealso considered. However, although flexible for simulation of different
214 Animal Cell Technology

operating strategies, the model lacked detail concerning inhibition bysecreted byproducts.
Different structured models formulated for hybridoma growth havebeen shown (Linardos et al., 1992; Cazzador and Mariani, 1993; Martenset al., 1995; Sanderson et al., 1999), as well as production of mAbs (Suzukiand Ollis, 1990).
Besides being more robust than the unstructured models, these struc-tured models describe the cellular response under a narrow band ofconditions. To forecast the cellular response to operation strategies ofvarious bioreactors, the model can be extended by an increasing numberof structures, to accumulate metabolic information (Wu et al., 1992) orassociate the metabolic fluxes to the structured model (Follstad et al.,1999). The methodologies for flux balances, which employ a series ofreactions from glucose metabolism (Figure 8.7), and calculate all the meta-bolic reactions rates during the stationary state, allow a better under-standing of the cellular behavior and the prediction of other more efficientoperating conditions.
Evidently, a higher number of structures implies that a higher numberof equations and parameters must be employed to describe the processkinetics, increasing the difficulties in formulation and quantification of theintracellular components. Even so, the capacity for identifying theseintrinsic cellular phenomena and their incorporation into the modelsincreases the ability for prediction and forecasting. This forms an impor-tant part of the study and development of the kinetic models.
8.5 Unstructured and segregated models
The representation of a property variation (mass, age, volume, etc.) withina cellular population is made using population balance models (PBM).These models allow the calculation of the variation of the rate of apopulation characteristic considering the rates of increase and disappear-ance of the specific characteristic within the cell population. Thus, theyallow a calculation of one special feature in the population. Mathematicalmodels that were originally unable to consider the diversity of character-
AMINO ACIDS GLUCOSE
nucleotides
lipids
amino acids
proteins
Cell
antibodiesGLUTAMINE
ammonia
lactate
Figure 8.6
Hybridoma metabolism scheme (based on Batt and Kompala, 1989).
Mathematical models for growth and product synthesis in animal cell culture 215

istics can now take this into account. The inclusion of cellular diversitymakes the model more complex and it is necessary to use non-trivialmathematics to solve the equations, including the integration of partialdifferential equations. Sidoli et al. (2004) have written a review of PBMsfor animal cells, indicating the major segregated models and their charac-teristics. These models are classified into single- or multi-variables,depending on the number of properties considered in the model, as well assingle- or multi-staged models, depending on the number of phases con-sidered in the cellular life cycle. If the mass is the property variation to beconsidered, then the model is called mass structured, and if the cellularage is the property to be considered then the model is called agedstructured.
As an example, the single-variable population balance model, single-staged, mass structured is indicated by Equation 93.
@N m, tð Þ@t
zfflfflfflfflfflffl}|fflfflfflfflfflffl{Accumulation
¼� @ r m, Sð ÞN m, tð Þ� �@m
zfflfflfflfflfflfflfflfflfflfflfflfflfflfflfflfflffl}|fflfflfflfflfflfflfflfflfflfflfflfflfflfflfflfflffl{Single cell growth
�ˆ m, Sð ÞN m, tð Þzfflfflfflfflfflfflfflfflfflfflfflfflfflffl}|fflfflfflfflfflfflfflfflfflfflfflfflfflffl{Celullar division rate
þ 2
ð1�ˆ m9, Sð Þp m, m9, Sð ÞN m9, tð Þdm
zfflfflfflfflfflfflfflfflfflfflfflfflfflfflfflfflfflfflfflfflfflfflfflfflfflfflfflfflfflfflfflfflffl}|fflfflfflfflfflfflfflfflfflfflfflfflfflfflfflfflfflfflfflfflfflfflfflfflfflfflfflfflfflfflfflfflffl{Birth rate(93)
This equation states that accumulation of cells with a mass m is theconsequence of three rates that determine the dynamics of the massvariation in the population: the rate of reduction of the number ofelements with mass m due to the mass increase that results from cell
Glucose
G6P
GAP
Lactate Pyruvate
Biomass G6P
Biomass R5P
BiomassGlySer
LysHeLeu
AcCoA Biomass
Biomass
AsnAsp
BiomassOAA
Fum
TCAcycle
a-KG
SuCoA
Val Thr Ile
Ala
Glu
ProGln
CO2NADHNADH 0.502�FADH2 0.502�
BiomassCO2BiomassNADH
3ATP2ATP
Figure 8.7
Hybridoma metabolism scheme (based on Follstad et al., 1999).
216 Animal Cell Technology

growth; the rate of reduction of the number of cells due cellular division,and the rate of generation of new cells within this mass m.
In this equation N(m, t) is the distribution indicating the number ofcells with mass m, a function that depends on the mass of the cell, becausethere is a mass distribution in the population, and on time, since there arefactors that continuously modify this distribution over time. Thus, N(m,t) is a distribution function of a property in the population, in this in casethe cellular mass, over time.
The growth of cells of mass m is indicated by function r(m, S), inEquation 93. It is a cell growth rate dependent on the cell mass and also onthe limiting substrate concentration. If a cell increases its mass, as aconsequence it leaves the class of the cells of massm.
The cellular division also causes the reduction of the number of cell withmass m and this reduction is determined by a division rate, ˆ(m, S) inEquation 93. The product ˆ.N indicates the division rate of all the cellswith a mass m. Cell division gives rise to two daughter cells from themother cells of mass m9. The information on how the parent cell partitionsits mass off is contained in the partition function p(m, m9, S), thatexpresses the probability of a parent cell of mass m9 giving rise to adaughter cell of mass m. In this way, 2.p.ˆ.N indicates the rate ofappearance of new cells with mass m, originating from parent cells of massm9. The parent cells have a continuous distribution of mass that goes froma minimum mass, mmin, to an unlimited value (theoretically to an infinitemass). Consequently, the total rate of cell generation with mass m iscalculated by the integration of cell generation rates for all intervals ofvariation of the mass in the population. The division rate for the wholedistribution is the third term of Equation 93.
To solve Equation 93 it is necessary to know the characteristic functionsof the cellular physiology, that is, the growth rate r(m, S), the cellulardivision rate ˆ(m, S), and the cell mass partition function p(m, m9, S). Sincethese functions are substrate concentration- dependent, the substrateconsumption rate must also be defined. These substrate concentrationvariations are calculated using the yield coefficient YX=S, that establishes arelationship between the growth rates and the substrate consumption rate.The consumption rate is indicated by Equation 94.
dS
dt¼ 1
Yx=s3
ð1mmin
r m, Sð Þ3N m, tð Þ dm (94)
As pointed out before when discussing structured models, physiologicalfunctions like the single cell growth rate r(m, S), cellular division rate ˆ(m,S), and cell mass partition function p(m, m9, S) are difficult to measure andthis adds to the complexity of using the model. The mathematicalcomplexity is also a limitation for optimization and control purposes thatdemand online measurements and calculations.
The difficulties of characterizing the cell physiological properties canexplain the difficulties in applying these models and why they have notbeen widely used in the solution of biochemical engineering problems. Onthe other hand, the advances in monitoring, especially in flow cytometry,and in computer science development, that increase the capacity for model
Mathematical models for growth and product synthesis in animal cell culture 217

prediction, have provided new stimulating factors that have made thesemodels an option for some researchers.
References
Aiba S, Shoda M (1969), Reassessment of product inhibition in alcohol fermentation,J. Ferment. Technol. 47:790–794.
Aiba S, Shoda M, Nagatami M (1968), Kinetics of product inhibition in alcoholfermentation, Biotechnol. Bioeng. 10:845–864.
Andrews JF (1968), A mathematical model for the continuous culture of microrgan-isms utilizing inhibitory substrate, Biotechnol. Bioeng. 10:707–723.
Bailey JE, Ollis DF (1986), Biochemical engineering fundamentals, 2nd Ed., McGraw-Hill, New York.
Batt BC, Kompala DS (1989), A structured kinetic modeling framework for thedynamics of hibrodoma growth and monoclonal antibody production in contin-uous suspension cultures, Biotechnol. Bioeng. 34:515-531
Bonomi A, Schmidell W (2001), Modelagem matematica e simulacao de processosfermentativos, In: Schmidell W, Lima UA, Aquarone E, Borzani W (Eds),Biotecnologia Industrial, vol. 2, Engenharia Bioquımica, Edgard Blucher, Brazil,pp. 123–178.
Bree MA, Dhurjati P, Geoghegan R, Robnett B (1988), Kinetic modeling of hybridomacell growth and immunoglobulin production in a large-scale suspensions culture,Biotechnol. Bioeng. 32:1067–1072.
Cazzador L, Mariani J (1993), Growth and production modeling in hybridomacontinuous cultures, Biotechnol. Bioeng. 42:1322–1330.
Constantinides A, Mostoufi N (1999), Numerical Methods for Chemical Engineerswith MATLAB Applications, Prentice Hall, New Jersey.
Contois DE (1959), Kinetics of bacterial growth: relationship between populationdensity and specific growth rate of continuous cultures, J. Gen. Microbiol. 21:40–50.
Dalili M, Sayles GD, Ollis DF (1990), Glutamine-limited batch hybridoma growthand antibody production: experiment and model, Biotechnol. Bioeng. 36:74–82.
de Tremblay M, Perrier M, Chavarie C, Archambault J (1992), Optimization of fed-batch culture of hybridoma cells using dynamic programming: single and multifeed cases, Bioprocess Eng. 7:229–234.
Dunn IJ, Heinzle E, Ingham J, Prenosil, JE (1992), Biological Reaction Engineering,VCH.
Engasser JM, Goergen JL, Marc A (1998), Modeling, In: Doyle A, Griffiths JB (Eds),Cell and Tissue Culture: Laboratory Procedures in Biotechnology, John Wiley &Sons, Guildford, UK, pp.160–178.
Follstad BD, Balcarcel RR, Stephanopoulos G, Wang DIC (1999), Metabolic fluxanalysis of hybridoma continuous culture steady state multiplicity, Biotechnol.Bioeng. 63:675–683.
Frame KK, Hu WS (1991a), Kinetic study of hybridoma cell growth in continuousculture. I. A model for non-producing cell, Biotechnol. Bioeng. 37:55–64.
Frame KK, Hu WS (1991b), Kinetic study of hybridoma cell growth in continuousculture. II. Behaviour of producers and comparison to non-producers, Biotechnol.Bioeng. 38:1020–1028.
Freshney RI (1994) Culture of Animal Cells. A Manual of Basic Technique, 3rd Ed.,Wiley-Liss, New York.
Fromment GF, Bischoff KB (1990), Chemical reactor analysis and design, John Wiley& Sons, Singapore.
Gaertner JG, Dhurjati P (1993), Fractional factorial study of hybridoma behavior. 2.Kinetics of nutrient uptake and waste production, Biotechnol. Prog. 9:309–316.
218 Animal Cell Technology

Ghose TK, Tyagi RD (1979), Rapid ethanol fermentation of cellulose hydrolysate. II.Product and substrate inhibition and optimization of fermentor design, Biotech-nol. Bioeng. 21:1401–1420.
Glacken MW, Huang C, Sinskey AJ (1989), Mathematical descriptions of hybridomaculture kinetics. III Simulation of fed-batch bioreactors, J. Biotechnol. 10:39–66.
Harigae M, Matsumura M, Kataoka H (1994), Kinetic study on HBs-MAb productionin continuous cultivation, J. Biotechnol. 34:227–235.
Hiller GW, Aeschlimann AD, Clark DS, Blanch HW (1991), A kinetic analysis ofhybridoma growth and metabolism in continuous suspension culture on serum-free medium, Biotechnol. Bioeng. 38:733–741.
Himmelblau DM (1972), Applied Nonlinear Programming, McGraw-Hill, New York.Hiss H (2001), Cinetica de processos fermentativos, In: Schmidell W, Lima UA,
Aquarone E, Borzani W (Eds), Biotecnologia Industrial, vol. 2, EngenhariaBioquımica, Edgard Blucher, Brazil, pp. 93–122.
Kurokawa H, Park YS, Iijima S, Kobayashi T (1994), Growth characteristics in fed-batch culture of hybridoma cells with control of glucose and glutamine concentra-tions, Biotechnol. Bioeng. 44:95–103.
Lancaster P, Salkauskas K (1986), Curve and Surface Fitting, Academic Press, London.Le Duy A, Zajic JE (1973), A geometrical approach for differentiation of an experi-
mental function at a point: applied to growth and product formation, Biotechnol.Bioeng. 15:805–810.
Lee CY (2003), Estrategias para otimizacao da producao de anticorpo monoclonalanti-TNP (trinitrofenil) em sistema de biorreator agitado: fortificacao do meio eprocesso descontınuo alimentado. Dissertacao de Mestrado, Programa de Mestra-do em Biotecnologia Interunidades USP-I.Butantan-IPT.
Lee YK, Yap PK, Teoh AP (1995), Correlation between steady-state cell concentrationand cell death of hybridoma cultures in chemostat, Biotechnol. Bioeng. 45:18–26.
Linardos TI, Kalogerakis N, Behie LA, Lamontagne LR (1991), The effect of specificgrowth rate and death rate on monoclonal antibody production in hybridomachemostat cultures, Can. J. Chem. Eng. 69:429–438.
Linardos TI, Kalogerakis N, Behie LA (1992), Cell cycle model for growth rate anddeath rate in continuous suspension hybridoma cultures, Biotechnol Bioeng.40:359–368.
Luedeking R, Piret EL (1959), A kinetic study of the lactic acid fermentation. Batchprocess at controlled pH, J. Biochem. Microbiol. Technol. Eng. 1:393–412.
Martens DE, Sipkema EM, de Gooijer CD, Beuvery EC, Tramper J (1995), Acombined cell-cycle and metabolic model for the growth of hybridoma cells insteady-state continuous culture, Biotechnol. Bioeng. 48:49–65.
Megee RD, Drake JF, Fredrickson AG, Tsuchiya HM (1972), Studies in intermicrobialsymbiosis of Saccharomyces cerevisiae and Lactobacillus casei, Can. J. Microbiol.18:1733–1742.
Miller WM, Reddy A (1998), Quantitative analysis of cell growth, metabolism, andproduct formation, In: Doyle A, Griffiths JB (Eds), Cell and Tissue Culture:Laboratory Procedures in Biotechnology, John Wiley & Sons, Guildford, UK, pp.133–159.
Miller WM, Blanch HW, Wilke CR (1988), A kinetic analysis of hybridoma growthand metabolism in batch and continuous suspension culture: effect of nutrientconcentration, dilution rate, and pH. Biotechnol. Bioeng. 32:947–965.
Monod J (1942), Recherches sur la Croissance de Culture Bacterienne, Hermann &Cie, Paris.
Monod J (1949), The growth of bacterial cultures, Annu. Rev. Microbiol. 3:371–394.Moser H (1958), The dynamics of bacterial population maintained in the chemostat.
Carnegie Institution of Washington, Washington.Nielsen J, Nikolajsen K (1988), Review and discussion of literature on mathematical
Mathematical models for growth and product synthesis in animal cell culture 219

models on microbial systems, Status Report 2: Structure models for microbialsystems, Department of Biotechnology, Technical University of Denmark, Den-mark,
Pirt SJ (1966), The maintenance requirement of bacteria in growing cultures, Proc. R.Soc. Lond. B 163:224–231.
Portner R, Schafer T (1996), Modeling hybridoma cells growth and metabolism – acomparison of selected models and data, J. Biotechnol. 49:119–135.
Portner R, Schilling A, Ludemann I, Markl H (1996), High density fed-batch culturesfor hybridoma cells performed with the aid of a kinetic model, Bioprocess. Eng.15:117–124.
Rice RG, Do DD (1995), Applied Mathematics and Modeling for Chemical Engineers,John Wiley & Sons, New York.
Sanderson CS, Jang JD, Barford JP, Barton GW (1999), A structured, dynamic modelfor animal cell culture systems: application to murine hybridoma, Biochem. Eng.J. 3:213–218.
Sidoli FR, Mantalaris A, Asprey SP (2004), Modeling of mammalian cells and cellculture processes, Cytotechnology 44:27–46.
Sinclair CG, Kristiansen B (1987), Fermentation kinetics and modeling, Open Uni-versity Press, Taylor & Francis, UK.
Suzuki E, Ollis DF (1990), Enhanced antibody production at slowed growth rates:experimental demonstration and a simple structured model, Biotechnol. Prog.6:231–236.
Tsai SP, Lee YH (1990), A model for energy-sufficient culture growth, Biotechnol.Bioeng. 35:138–145.
Tsuchiya HM, Fredrickson AG, Aris R (1966), Dynamics of microbial cell population,Adv. Chem. Eng., 6:125–206.
Tziampazis E, Sambanis A (1994), Modeling of cell culture processes, Cytotechnology,14:191–204.
Wu P, Ray NG, Shuler ML (1992), A single-cell model for CHO cells, Ann. N YAcad. Sci., 665:152–187.
Wu YC, Hao OJ, Ou KC, Schoelze RJ (1988), Treatment of leachate from solid wastelandfill site using a two-stage anaerobic filter, Biotechnol. Bioeng. 31:257–266.
Zeng AP (1995), A kinetic model for product formation of microbial and mammaliancells, Biotechnol. Bioeng, 46:314–324.
Zeng AP (1996a), Quantitative assessment of cell density effect on the metabolism andantibody production rate of hybridoma cells at high cell density, J. Biotechnol.45:243–251.
Zeng AP (1996b), Mathematical modeling and analysis of monoclonal antibodyproduction by hybridoma cells, Biotechnol. Bioeng. 50:238–247.
Zeng AP, Deckwer WD (1995a), A kinetic model for substrate and energy consump-tion of microbial growth under substrate-sufficient conditions, Biotechnol. Prog.11:71–79.
Zeng AP, Deckwer WD (1995b), Mathematical modeling and analysis of glucose andglutamine utilization and regulation in cultures of continuous mammalian cells,Biotechnol. Bioeng. 47:334–346.
Zeng AP, Deckwer WD, Hu WS (1998), Determinants and rate laws of growth anddeath of hybridoma cells in continuous culture, Biotechnol. Bioeng. 57:642–654.
220 Animal Cell Technology

9Bioreactors for animal cellsErnesto Chico Veliz, Gryssell Rodrıguez,and Alvio Figueredo Cardero
9.1 Introduction
Around the end of the 1970s it became apparent that cells could becultivated in vitro on a large scale for the production of a wide range ofhuman health products. Since then, studies aimed at defining the relevantenvironmental conditions needed for efficient cell proliferation in vitrohave been increasingly carried out. This has motivated work on thedevelopment of chemically defined media and on the determination ofoptimal physicochemical conditions (pH, temperature, dissolved oxygen,etc.) for culturing cells for large-scale operations. As a practical conse-quence of these studies, several types of equipment to control environ-mental culture conditions have been developed, giving rise to thebioreactor systems currently used in the biopharmaceutical industry.
To ensure adequate cell proliferation and product biosynthesis, bioreac-tors have to meet the following requirements:
(i) control the acid-base equilibrium (pH) of the culture medium;(ii) control temperature;(iii) provide gas exchange to appropriately supply oxygen to the cells and
remove excess carbon dioxide;(iv) allow the supply of nutrients through the use of adequate formula-
tions of culture media;(v) supply enough surface for adhesion of cells, in the case of anchorage-
dependent cells;(vi) maintain aseptic conditions, avoiding contamination by microorgan-
isms, viruses, or other cells.
The basic challenge regarding the operation of bioreactors is to guaran-tee a homogeneous physicochemical environment for the whole cell popu-lation, preventing the occurrence of large gradients and regions withinadequate conditions, which could cause the undesired death of part ofthe cell population. The maintenance of adequate environmental condi-tions requires the use of sensors and control systems, as discussed in detailin Chapter 10.
9.2 Inoculum propagation and small-scale culture systems
To ensure consistency and reproducibility, especially in industrial produc-tion processes, it is important always to use raw materials with identical

properties. Therefore, it is necessary, in each production lot, to employ thesame cell line and guarantee that cell characteristics do not change betweenlots. Also, in research, it is important to use defined cell lines and to ensurethat they do not change by mutations over time that could alter theirproperties.
To guarantee the availability of cells and the maintenance of theircharacteristics, a sufficiently large quantity of cells is kept in master andworking cell banks, as discussed in Chapters 13 and 14. The number ofcryotubes containing cells in a working cell bank is calculated to ensurethat, for the whole expected lifespan of a product, each production lot willbe obtained starting with cells from identical cryotubes. The most widelyemployed method for the conservation of cell banks is cryoconservation inliquid nitrogen at –1968C, which avoids mutations that could potentiallyalter cell characteristics.
Each production lot starts by thawing cells from a cryotube, whichusually contains 10 to 20 million cells suspended in a volume of 1–10 mL.Thawing cells is a stage of the process that should be carried out with greatcare, since it can generate a high level of cell death if performed inade-quately.
After eliminating the cryoprotector (generally DMSO – dimethyl sulf-oxide), cells are suspended in fresh medium at a concentration between 0.1and 0.4 million cells per-mL, depending on the cell line and the culturemedium, to be used subsequently for incubation and propagation. Thisrange of inoculum concentration is used as a standard for the inoculationof animal cell cultures, since lower concentrations result in long lag phasesand in a delay in cell growth, which is detrimental to process time andproductivity.
In general, the subsequent stages occur in small bioreactors, knownsimply as flasks or bottles, since they have no monitoring and controlsystem and are usually disposable. Apart from flasks and bottles, multiwellplates can be used to culture cells, but their use is restricted mainly tocloning and selection of cells.
In the first step after thawing, cells are generally propagated in station-ary flasks with approximately 10 ml working volume, with a monolayer ofcells being formed on the lower surface of the flask after 2–3 days. Thecells are later transferred to larger flasks, maintaining the cell concentra-tion range mentioned above. Alternatively, cells able to grow in suspen-sion can be thawed directly from the cryotube to small stirred flasks, suchas magnetically stirred flasks known as spinners.
In stationary flasks, oxygen transfer to the liquid medium is limited bythe small gas–liquid interface area and by the lack of agitation. For thisreason, other types of culture systems need to be used when workingwith more than 100 million cells. The type of culture system to be useddepends on the cell line characteristics, mainly if it is adherent or if it isable to grow in suspension (Figure 9.1). For cells growing in suspension,spinner flasks are largely used, although shaker flasks may also beemployed. Anchorage-dependent cells, on the other hand, are frequentlycultured in roller bottles. For the transfer of adherent cells from one flaskto another, cells can be released mechanically or enzymatically, e.g. usingtrypsin.
222 Animal Cell Technology

All the procedures carried out on a small scale are labor-intensive andrequire skilled operators. Manipulation of the cultures is carried out inlaminar-flow cabinets, to maintain asepsis. During this stage of cellpropagation/inoculum development, activities are carried out by directoperator manipulation, so that the process is considered to be ‘‘open’’.Thus, as a general rule, these activities occur in areas separated from thosewhere the intermediate and production bioreactors are installed.
Figures 9.2 and 9.3 show schemes that illustrate inoculum developmentfrom the cryotubes to production scale for suspension and adherent cells,respectively. In these hypothetical process schemes, the expression ‘‘pro-duction bioreactor’’ is used arbitrarily for any of the types of bioreactorpresented in the next section of this chapter. In general, different flasksand several intermediate bioreactors are used for cell propagation to reachthe quantity of cells necessary to inoculate the production bioreactor. Thenumber of propagation steps is a function of the final scale of theproduction bioreactor.
Roller bottle
Area: 500–1750 cmX 2.10 cells/cm
2
f5 2�
Stationary flask(T-flask)
Area: 25–225 cmX 10 cells/cm
2
2f
5�
Shaker flask
Volume: 0.05–0.5 LX 2.10 cells/mLf
6�
Spinner flask
Volume: 0.05–2 LX 2.10 cells/mLf
6�
Figure 9.1
Low volume bioreactors. Although it is mentioned in literature that stirred flasks can be used up to20 L, they are mostly used for lower volumes (up to 2 L). Xf: typical final cell concentration.
Cryotube
~10 cells7
Expansion instationary flasks
~10 cells8
Propagation instirred flasks~2.10 cells9
Productionbioreactor
Inoculum bioreactor
~10 cells10
Figure 9.2
Hypothetical example of the propagation of suspension cells, using stirred-tank bioreactors in theintermediate and final stages. The amount of cells usually obtained at the end of each step is alsoindicated.
Bioreactors for animal cells 223

9.3 Types of bioreactors
In the last few decades, a wide variety of bioreactors have been developed,with some of them being an attempt to mimic animal organs, and othersbeing an adaptation of the principles of submerged microbial fermentationto the culture of animal cells.
The bioreactors used for animal cell cultivation can be classified accord-ing to different criteria. One of the most useful refers to the homogeneityof the system. All culture systems are multiphase systems, since at leasttwo phases are involved: a solid one (cells) and a liquid one (culturemedium). Eventually, a third phase (gas) may be present due to bubbleaeration. Bioreactors in which cells are uniformly suspended in the liquidphase are designated homogeneous bioreactors. On the other hand, thosebioreactors in which cells are not homogeneously distributed in the entirevolume are called heterogeneous bioreactors. Table 9.1 lists different typesof bioreactors classified according to the homogeneity of the system.
Given the potential risk of contamination of a biopharmaceuticalproduct with residues of parts of a bioreactor in contact with the culture,the materials used in the construction of bioreactors must respect the rulesdictated by the regulatory agencies of different countries. The manufactur-ing process of the components of a bioreactor must be well documentedand the materials must be certified.
In the case of stainless steel, the surfaces that come in contact with theproduct must be made of pharmaceutical-grade stainless steel (AISI 316L).The average surface rugosity (Ra), defined as the average distance of thebase of a surface up to the rugosity profile (or the average height of bumpson a surface), must be lower than 0.8 �m. Thus, different treatments areemployed for polishing the surfaces, with the final aim of facilitatingequipment cleaning and maintaining process asepsis. Among the treat-ments commonly employed, electropolishing is recommended for finalsurface manipulation. This treatment does not alter macrorugosity of asurface, but it smooths its profile and adds a dense inert layer of chromiumoxide, which protects the metal from corrosion. Furthermore, electropol-ishing eliminates hydrogen from the polished surface, decreasing the
Roller bottles
~10 –10 cells8 9Stationary flask
~10 –10 cells7 8Cryotube
~10 cells7Production bioreactor
~10 cells10
Figure 9.3
Hypothetical example of the propagation of adherent cells, using hollow-fiber modules as theproduction bioreactor in the final stage. The amount of cells usually obtained at the end of each stepis also indicated.
224 Animal Cell Technology

ability of microorganisms to grow on it. Figure 9.4 (see color section)shows a polished surface inside an animal cell stirred-tank bioreactor.
Seals, o-rings, and valve membranes must be manufactured out ofpolymers that are resistant to thermal sterilization and to the bases andacids used in the biopharmaceutical industry. When in contact with theproduct, the elastomers employed must additionally present the followingsafety characteristics: the rates of release of polymer components must below and remain below well-established threshold levels; the componentsreleased must be innocuous to human health, according to rules previouslyestablished.
Another material that is frequently employed is glass. It is used in small-scale vessels and also in sight glasses of large-scale bioreactors and tanks.A detailed review of the materials used in the manufacturing of bioreac-tors, as well as the surface treatments used, can be found in the literature(Krahe, 2003).
9.3.1 Homogeneous bioreactors
Stirred-tank, air-lift, and wave bioreactors are the most important types ofhomogeneous bioreactors used in animal cell cultivation, as previouslyoutlined in Table 9.1. One of the most important advantages of usinghomogeneous bioreactors is the possibility of monitoring and controllingthe physicochemical environment to which the cells are submitted in amuch more reliable way than in heterogeneous bioreactors. Thus, it ispossible to indirectly control the physiological state of cells.
Stirred-tank bioreactors
Stirred-tank bioreactors are widely used in the modern biotechnologicalindustry. Most products produced from animal cells on a large scaleworldwide are manufactured in this type of bioreactor. In general, thesereactors are very similar to fermenters used in industrial submergedculture of microorganisms, and are simple to design, having the shape of atank and impellers to promote mixture of the contents.
Stirred-tank bioreactors can be operated according to any of the opera-tion modes that will be discussed later in this chapter. Figure 9.5A (seecolor section) shows the typical design of a stirred-tank bioreactor, fittedwith a continuous supply of gases for oxygenation and pH control andwith a gas exhaust outlet in the upper part of the equipment. In most cases,oxygenation occurs by bubbling gases below the impeller, as will be
Table 9.1 Classification of bioreactors according to system homogeneity
Homogeneous bioreactors Heterogeneous bioreactors
Stirred-tank bioreactors Microcarrier-based systemsAir-lift bioreactors Packed-bed bioreactorsWave bioreactors Fluidized-bed bioreactors
Hollow-fiber bioreactorsBioreactors providing surfaces for attached cellgrowth (roller bottles, CellCube
1, Cell Factory)
Bioreactors for animal cells 225

discussed later. The complexity of accessories and systems in this type ofequipment is much greater than that in the schematic representation ofFigure 9.5A. Figure 9.5B (see color section) is a photograph of a 300 Lstirred-tank bioreactor.
Currently, stirred-tank bioreactors have been scaled-up to workingvolumes of 20 000 L (Birch and Racher, 2006). Scale-up criteria that takeinto consideration the negative effects of aeration are generally adopteddue to the large influence of bubbling and shear stress on cells. This issuewill be discussed in more detail in Section 9.5. Due to the high sensitivityof cells, a limited number of cell lines, such as CHO and NS0, nowadaysdominate the industrial animal cell technology arena, due to their greaterrobustness and shear resistance (Castilho and Medronho, 2002; Castilloet al., 2005).
Ensuring aseptic operation is one of the relevant aspects in the operationof animal cell bioreactors. This is a particularly difficult task in large-scalestirred-tank bioreactors where large volumes of fluids are manipulated andmoving parts exist. Guaranteeing containment and minimizing the risk ofmicrobial contamination requires careful design of the equipment, arigorous compliance with strict operational procedures, and the use ofsimple devices that ensure reliability in the manipulation of large volumesof culture medium.
For the aseptic transport of fluids, arrangements of diaphragm valvesespecially designed for use in bioreactors and fitted with steam supply forin situ sterilization of the whole system (SIP – sterilization in place) areused. Adequate sterilization is guaranteed by online temperature monitor-ing and the use of pulsing valves with orifices for condensate elimination,among others. The valves are also interconnected with the lines of fluidsused for cleaning in place (CIP). Safe mechanical seals or, more recently,magnetic drives, are of great importance to guarantee system containmentin spite of the moving parts.
Other elements especially designed to ensure a high efficiency andoperational safety are devices that use bellow valves and diaphragm pumpsthat do not have primary moving parts in contact with the culturemedium. More details regarding these and other devices are available inthe technical literature (Krahe, 2003).
Validation of systems is obligatory in the production of biopharmaceu-ticals and, thus, the bioreactors must be ‘‘validatable.’’ In the case ofstirred-tank bioreactors, apart from the functional validation, the cleaningand sterilization procedures have to be validated, since these are repeateduse equipment. These requirements pose additional challenges to theprocess engineers.
Wave bioreactors
This type of bioreactor consists of two main parts: a disposable sterile bagmade of flexible plastic, in which cells are cultivated, and a movingplatform that supports and shakes the plastic bag. A hydrophobic filterattached to the bag allows the supply of gases, and small tubing allowsculture sampling, as well as nutrient addition and product harvesting.
226 Animal Cell Technology
The plastic bag is disposable and is provided sterile by the manufacturer.This makes it a very attractive bioreactor type for production purposes,especially if the production scale is not very large. Since it is not sterilizedin-house, there is no need for validation of the sterilization procedure. Thevalidation of bag sterilization is the responsibility of its manufacturer.Since it is not reused, there is no need for cleaning and validation ofcleaning procedures. Figure 9.6 (see color section) shows a photograph anda schematic representation of a wave bioreactor.
The oscillatory movement of the platform generates waves in the gas–liquid interface inside the plastic bag. This type of agitation avoids deadzones, maintains cells in suspension and ensures adequate homogeneity,under low shear conditions. Furthermore, the platform can control theculture temperature. The area of the gas–liquid interface, in view of thewaves generated by agitation, is several times larger than that of the surfacewhen stationary. This, together with the movement caused in the cellsuspension near to the gas interface, significantly increases oxygen trans-fer. Volumetric oxygen transfer coefficients (KLa) in the range of 3–4 h–1
were measured by Singh (1999) for bags with working volumes in therange of 1–100 L, suggesting that cell concentrations up to 7 3 106 cellmL–1 could be obtained in this type of bioreactor under nonlimitingconditions with respect to oxygen supply.
However, scale-up of this type of system is limited due to the fact thatoxygen transfer is a function of the area of the wave-containing liquidsurface. Since the area increases with the square and the volume with thethird power of a linear dimension, it is expected that this technology willreach a scale limit. Nevertheless, the companies that market this type ofbioreactor offer bioreactors up to at least 500 L working volume (WaveBiotech, 2006).
Recently, approaches to operate wave bioreactors in perfusion modehave been proposed. This turns this type of bioreactor into an attractivevariant when there is a need for rapidly establishing a process, on arelatively small scale, and there are no robust facilities for the supply ofauxiliary services.
The manipulation of this bioreactor is generally performed in a laminar-flow cabinet, and is thus an open and risky operation. This is probably acharacteristic that differentiates this bioreactor type from the other homo-geneous bioreactors, where reliability of all seals and connections can beensured through the use of direct steam. Also, the large number ofconnections using flexible tubing makes the operation of this type ofbioreactor more complicated than that of other bioreactors of the sameclass. Currently, the performance and application potential of thesebioreactors are under evaluation by the biotechnological community.
Air-lift bioreactors
These bioreactors are characterized by their large height-to-diameter ratioand by an internal concentric cylinder, as shown in Figure 9.7. In the lowercentral region, there is a tube that injects gas inside the bioreactor. Thepressurized gas stream generates bubbles that result in a low-densityregion inside the central tube. When these bubbles ascend, the liquid is
Bioreactors for animal cells 227

pushed upwards through the internal cylinder and returns downwardsthrough the external annulus, generating a characteristic flow pattern, asshown in Figure 9.7. Culture oxygenation occurs effectively due to thecontact of the cell suspension with ascending bubbles. Furthermore,homogenization of the cell suspension is not due to mechanical agitation,but simply due to the bioreactor geometry combined with the gas streaminjected in its bottom region.
These bioreactors are characterized by low levels of cell damage and canalso be operated in perfusion mode. However, the main limitation of thistype of equipment is related to its scale-up: air-lift bioreactors up to only5000 L have been described so far.
Air-lift bioreactors were popular in the 1990s, but currently their large-scale use is limited. Only the company Lonza (originally Celltech) usesthis type of bioreactor on a large scale, for the production of monoclonalantibodies (mAbs) and other therapeutic proteins (Lonza, 2006).
9.3.2 Heterogeneous bioreactors
In this type of bioreactor, there is a compartment where cells remainattached to a surface or immobilized on or inside a biocompatible bed.Culture medium has to be pumped through this compartment for cells tohave access to nutrients and dissolved oxygen. The main disadvantages ofthese bioreactors, developed for the cultivation of adherent cells thatrequire a surface for proliferation, are the impossibility of obtaining homo-geneous samples of the cell population and the limitations of scale-up.
Gas inlet
Exhaust gasoutlet
Figure 9.7
Scheme of an air-lift bioreactor.
228 Animal Cell Technology
Microcarriers
Microcarriers are small particles, made of materials such as cellulose,dextran, glass, collagen, or gelatin. Generally, they have a spherical shapeand present a surface structure and composition that promotes cell adhe-sion and growth.
The first culture of cells on microcarriers was developed by van Wezelin the 1960s (van Wezel, 1967), using DEAE-SephadexTM 50 gel beadsoriginally designed as ion-exchange chromatography beads. The firstproduct to be produced industrially using microcarriers (an inactivatedpolio vaccine) was developed by van Wezel himself several years later.Nowadays, the main industrial use of microcarriers is in the production ofvaccines, but also of gene therapy vectors, recombinant proteins, andmAbs. In the literature, there are reports of culture scale-up to 6000 L forVero cells cultivated on CytodexTM carriers (GE Healthcare, 2006). Figure9.8 (see color section) shows Vero cells growing on microcarriers.
The materials used in the manufacture of microcarrriers are porous but,depending on the pore dimensions, the carriers can be classified asmacroporous and microporous. The latter, also designated ‘‘solid’’ bysome authors, have diameters that are too small to allow cells to penetratethe pores. Cell growth, in this case, is restricted to the carrier surface. Onthe other hand, macroporous microcarriers, also simply designated ‘‘por-ous’’ by some authors, have pores in the range of 10–400 �m, allowingcells to grow inside the pores. Generally, cell concentration inside or onthe porous matrices is in the range between 0.5 3 108 and 5 3 108 cells permL of microcarrier.
Most microporous microcarriers have a bead diameter of 90–300 �m.The cells grow on the surface of the beads, forming an attached mono-layer, which may be susceptible to eventual collision of beads and to theresulting mechanical damage. These microcarriers have densities of ap-proximately 1.02–1.04 g cm–3, which is slightly higher than that of theculture medium. Thus, they can be maintained in suspension at lowagitation speeds. Furthermore, since their diameter is relatively large, thecarriers settle down easily when agitation is stopped, facilitating harvestingof cell-free supernatant.
In the case of macroporous microcarriers, they consist of particles in therange of 0.4–5 mm, which present internal cavities that allow cell growthinside the carriers. This type of microcarrier was developed with thepurpose of allowing tridimensional cell growth and attaining high celldensities. The tridimensional growth favors the action of growth factorsproduced by the cells themselves, decreasing the serum requirements andfacilitating the use of serum-free or protein-free media. The high cellconcentration makes the cell population more stable and increases culturelongevity, making macroporous microcarriers an interesting alternative forlong-term cultures. Additionally, their structure protects the cells fromshear damage in stirred systems.
There are several manufacturers of microcarriers for animal cell culture,providing products with different chemical composition, size, form, anddensity. Table 9.2 shows a list of common commercially available micro-carriers and their manufacturers.
Bioreactors for animal cells 229

When anchorage-dependent cells are immobilized by microcarriers theycan be cultivated in homogeneous bioreactors (Jo et al., 1998). Further-more, the immobilization on the carriers allows the use of other bioreac-tors that will be discussed in the following sections, such as fluidized-bedand packed-bed bioreactors. The microcarriers can be separated from thesupernatant by sedimentation, facilitating downstream processing or cellretention in perfusion processes.
However, the use of microcarriers on a large scale presents someproblems regarding inoculum propagation. It may be desirable that cellsalready attached to microcarriers used at an intermediate scale colonizenew carriers to inoculate a larger-scale culture. Enzymatic and sonicationmethods can be used to release cells from microcarriers, but the conditionscan be harsh to the cells and present negative effects on cell physiology. Amore recent approach and an alternative to the total release of cells, isbead-to-bead transfer. This technique seems to be highly dependent on thecombination of adhering characteristics of the cells and properties of themicrocarriers. The efficient transfer of cells between particles is onlypossible with some cell–carrier combinations (Wang and Ouyang, 1999).
Furthermore, the homogeneity of parameters and the mass transfer ofnutrients to the interior of macroporous microcarriers can be critical,especially for larger beads and at larger cultivation scales (Rupp, 1987).
Packed-bed bioreactors
In packed-bed bioreactors, cells are maintained in a fixed bed, that is,confined in a given environment. In most applications, cells adhered tomicrocarriers are used in these bioreactors. Culture medium is recirculatedthrough the packed bed, promoting transfer of nutrients, metabolites, andproducts. Before being pumped into the bed, the medium should beenriched in dissolved oxygen. This can be accomplished by vigorousstirring in aeration tanks or by the use of membrane modules, generallypositioned in an external recirculation loop. The size of the packed bed is acritical parameter, since the dissolved oxygen concentration in the medium
Table 9.2 Commercially available microcarriers and their manufacturers
Product Material Manufacturer
Microporous microcarriersBiosilon
1Polystyrene with negative surface charge Nunclon
CytodexTM1 Cross-linked dextran with DEAE groups GE HealthcareCytodexTM3 Cross-linked dextran coated with a denatured collagen
layerGE Healthcare
HyQ1SphereTM Polystyrene with different options of charge and coating Hyclone/
SoloHillMacroporous microcarriersCultispher
1Cross-linked porcine gelatine Percell Biolytica
CytolineTM Polyethylene/silica GE HealthcareCytoporeTM Cross-linked cellulose with DEAE groups GE Healthcare
230 Animal Cell Technology

gradually decreases as the liquid flows through the bed (Fassnacht andPorter, 1999).
One of the advantages of this system is that a clarified fluid is obtainedat the bioreactor outlet, with no need for a cell separation device. Figure9.9 (see color section) shows the operational scheme of a fixed-bedbioreactor and a photograph of a small-scale model.
Fluidized-bed bioreactors
Fluidized-bed bioreactors are also used mainly for the culture of cellsattached to microcarriers. However, in this case, microcarriers with ahigher density should be employed. In these bioreactors, a given amountof microcarriers is fluidized inside a compartment of the bioreactor,avoiding cell damage due to bubble explosion. Figure 9.10 (see colorsection) shows a photograph and an operational scheme of this type ofbioreactor.
These bioreactors are operated in perfusion mode and cell concentra-tions reach 5 to 10 million cells per mL of medium. Several authors reporttheir results in terms of cell concentration per microcarrier volume and, inthis case, values in the order of 20 to 35 million cells per mL of carrier areobtained (Wang et al., 2002).
Bioreactors providing surfaces for attached cell growth
Roller bottles and systemswithmultiple plates, such as Cell Factory (Nunc)and CellCube
1(Corning), provide a large surface area for cell adhesion and
proliferation. In the case of roller bottles, although the relative surface area(area/volume) is small and consequently the production capacity is low,large-scale plants can be established by using a large number of rollerbottles. This approach was adopted by the company Amgen for theindustrial production of erythropoietin. Operation costs for this type ofplant are high, because they are labor-intensive, and the risk of contamina-tion is high, due to the manipulation of lots of small bottles.
On the other hand, the principle of CellCube1and Cell Factory is to
provide a large area for cell adhesion and proliferation in relativelycompact devices. The latter consists of multiple trays, providing surfaceareas in the range of 700–25 000 cm2, for medium volumes of 0.2–8 L(Nunc, 2006). The system called CellCube
1provides a surface area in the
range of 8500–85 000 cm2 and is fitted with an automated control system(Corning, 2006).
Hollow-fiber bioreactors
The core part of a hollow-fiber bioreactor is the hollow-fiber membranemodule, also simply known as the cartridge. It consists of a plastic cylindercontaining hundreds of semi-permeable capillary tubes, known as hollowfibers. The cells are inoculated in the extracapillary space (ECS). The cellscolonize the external surface of the fibers and grow in this region. Theculture medium is pumped through the lumen of the fibers, known as theintracapillary space (ICS), as shown in Figure 9.11.
Bioreactors for animal cells 231

The fibers can be made of different materials, such as cellulose estersand polysulfone. The total surface area of a hollow-fiber bioreactor variesin the range of 0.5–3.5 m2. The pore size of fibers commonly employed inanimal cell culture corresponds to a molar mass cut-off between 10 and100 kDa.
The porous nature of the fibers allows for exchange of nutrients andmetabolites. Low-molar-mass molecules, such as glucose and ammonia,can move freely through the pores of the fibers, at a rate that is controlledjust by the pressure gradients generated by the medium recirculationpump. High-molar-mass proteins, which can be produced by the cells oradded as nutritional supplements to the extracapillary space, are not ableto permeate the membrane fibers and are retained in the cell bed in theECS.
Thus, the cell population grows in the ECS of the hollow-fiber car-tridge, receiving the nutrients originating from the culture medium that isrecirculated through the interior of the fibers. Inhibitory metabolic pro-ducts, generated as a consequence of cell growth, diffuse in the oppositedirection and get diluted in the recirculating culture medium. In the sameway, low-molar-mass proteins and growth factors produced by the cellsor provided by serum can permeate the fibers. Thus, in the axial directionof the fibers a decreasing gradient of medium components and an increas-ing gradient of metabolites are formed. This process may lead to a decreasein the transfer of nutrients to the microenvironment of the cells, with thepossibility of the concentration of these molecules becoming growth-limiting. This may become critical when fiber length is increased, since aregion very poor in nutrients and very rich in inhibitory metabolites canbe created in the final portion of the fibers. This situation can beattenuated through the introduction, directly through the ECS, of anadditional stream perpendicular to the fibers, known as recycle stream.Culture medium containing serum can be added to this recirculationstream, while basal medium is recirculated through the lumen of the fibers.Figure 9.12 shows the scheme of a hollow-fiber bioreactor fitted with anextracapillary recirculation line.
Medium
inlet
Medium
outlet
ECSICS
Figure 9.11
Simplified representation of a hollow-fiber module with only three fibers. Thestraight arrows pointing from the intracapillary space (ICS) to the extracapillaryspace (ECS) represent the transfer of nutrients from the culture medium to thecells (inoculated in the ECS), whereas the straight arrows in the opposite directionrepresent the transfer of metabolites and products from the cells to the fiberinterior.
232 Animal Cell Technology

Oxygen transfer is an important issue in the operation of a hollow-fiberbioreactor. In these bioreactors, a membrane-based aeration system isusually included in the intracapillary recirculation loop to enrich therecirculating culture medium with oxygen. However, due to the lowsolubility of oxygen in aqueous solutions, the recirculation speed throughthe fibers must be very high.
It is possible to modify some design parameters to determine optimaloperational conditions for these bioreactors, such as the fiber material, thepacking density of fibers inside the module, the dimensions of the module,the pore size of the fibers, and the type of aeration system used in therecirculation loop. Furthermore, the yield of these bioreactors can also beimproved by optimizing the operational strategies, such as: implementa-tion of an extracapillary recirculation loop; increase of the flow ratethrough the oxygenation device; execution of periodic cell purges from theECS, to avoid culture necrosis; use of an adequate serum content or of animproved medium composition to favor cell proliferation; and determina-tion of an optimal time and scheme for the extracapillary recirculation.
Parameters that are traditionally used to evaluate the metabolic activityof the cell population inside a hollow-fiber bioreactor include glucoseconsumption rate (rGLC) and oxygen consumption rate (rO2). However,these parameters are highly dependent on variations in nutrient feed andmetabolic products removal (Gramer et al., 1999). The use of a strategy tooverfeed the ICS with nutrients results in a rapid increase in rGLC. On theother hand, an increase in product titer and an improved metabolic
Residue
Basal mediumOxygenator
Serum-containing medium
Product harvesting
Recirculation
pump
Pressure sensor
Intracapillary circuit Extracapillary circuit
pH sensor
Extra-capillarychamber
Pressure sensor
Hollow-fiber
cartridgeIntra-capillarychamber
Figure 9.12
Schematic representation of a hollow-fiber bioreactor fitted with an extracapillary recirculationstream.
Bioreactors for animal cells 233

efficiency in terms of product formation can be attained if an operationstrategy is adopted that includes a perpendicular extracapillary recircula-tion stream and a regular purge of cells, to operate at lower biomassconcentrations (Rodrıguez et al., 2005).
In a study of the production of a humanized mAb produced by NS0cells, Rodrıguez et al. (2005) compared two different operation strategies(Figure 9.13). The optimized strategy provided a significant decrease in theratio of the flow rates of product harvest and medium feed, with a twofoldincrease in the total amount of antibody harvested and a sixfold decreasein the harvested volume. Thus, antibody concentration in the productstream was increased by over 10-fold, with a positive impact on thepurification process of this mAb.
9.4 Modes of operation of bioreactors
The different operation modes used in microbial fermentations are em-ployed also in animal cell cultivation. Although many different classifica-tions can be adopted, the most general is the one that considers thefollowing operation modes: batch, fed-batch, continuous, and perfusion,which is a continuous mode with cell recycle/retention (Castilho andMedronho, 2002).
The behavior of a culture system in terms of cell, nutrients, and productconcentrations can be described mathematically by mass balances and
0
0
200
400
600
800 Intracapillary recirculation
flow rate (mL h )�1
Basic operation Optimized strategy
0.0
0.2
0.4
0.6
0.8Ratio of product harvest flow
rate and extracapillary
recirculation flow rate
2
4
6 r (mmol h )GLC�1
0
2
4
6
8
10 D
BA
C
0 010 1020 2030 3040 4050 5060 60Time (days)
Antibody produced (g)
Figure 9.13
Cultivation of NS0 cells in an AcuSyst JrTM hollow-fiber bioreactor: comparison oftwo different operation strategies, designated basic and optimized strategy(Rodrıguez et al., 2005).
234 Animal Cell Technology

kinetic expressions, such as the Monod equation, which describe theeffects of nutrient and metabolite concentrations on the specific reactionrates.
In order to make a decision on the most appropriate operation mode fora bioreactor, several factors must be taken into consideration. At industrialscale, the most important factors are:
(i) Characteristics of the cell line used, such as the stability of expressionof the product, production pattern, degree of resistance to inhibitorymetabolites, and resistance to shear stress;
(ii) The market demand for the product, which determines the produc-tion scale;
(iii) The technical experience of the teams responsible for both processdevelopment and regulatory issues.
9.4.1 Batch cultivation
Batch is a discontinuous operation mode, and cell growth occurs withoutany additional supplementation of nutrients after inoculation of cells.While substrates are metabolized, the cell population grows, forming theproduct and other metabolites. The volume is maintained constantthroughout the whole process.
Equations 1 to 3 represent the generic mass balances for cells, substrateand product in a batch cultivation process:
dXv
dt¼ �Xv (1)
dS
dt¼ �qSXv (2)
dP
dt¼ qPXv (3)
Where:XV ¼ viable cell concentration;t ¼ cultivation time;� ¼ specific growth rate;S ¼ concentration of a generic substrate;qS ¼ specific consumption rate of a generic substrate;P ¼ concentration of a generic product;qP ¼ specific formation rate of a generic product.
Figure 9.14A shows the operational configuration and typical profilesfor cell and substrate concentration in a batch culture. Figure 14B showsthe concentration of cell, product (mAb), and substrates (glucose andglutamine) for a myeloid transfectoma in batch cultivation.
In a batch cultivation, cell concentration increases from the inoculationdensity (0.1–0.4 million cells per mL) up to maximum values between 2and 4 million cells per mL, being the upper limit applicable to insect cellcultivation. Since animal cells present specific growth rates between 0.02and 0.04 h–1, the time period to attain maximum cell density in a batch
Bioreactors for animal cells 235

culture is approximately 5 days. The range of specific product formationrates is wider, varying from a value as high as 30 pg cell–1 day–1, reportedfor mAb production by transfectomas (Velez et al., 1987), to values twoorders of magnitude lower (Altamirano et al., 2004). The concentration ofa secreted product in batch cultures is usually in the range of 1–50 mg L–1.After attaining maximum product concentration, the culture is interruptedand the spent medium is sent to the downstream processing stages.
Due to the low solubility of oxygen, this gas must be supplied con-tinuously, instead of just at the start of the culture, as in the case of theother nutrients. Control of pH is carried out through addition of base andby varying the CO2 concentration in the gas phase, since most animal cellculture media contain sodium bicarbonate.
0.0E 00�
1.0E 06�
2.0E 06�
3.0E 06�
0
4
8
12
16
20
24
Viable cells Product Glucose Glutamine
S Xv
XvS
(A)
(B)
Time
PC
ell c
once
ntra
tion
(cel
ls/m
L)
0.0 2.5 5.0 7.5 10.0Time (days)
Product concentra
tion (mg/L),
glucose and glutamine (m
M)
Figure 9.14
Batch cultivation: (A) operational configuration and typical viable cell (Xv) andsubstrate (S) concentration profiles; (B) concentration of cells, product and twosubstrates in a batch bioreactor culture of a myeloid transfectoma producing ahumanized monoclonal antibody (Center of Molecular Immunology – CIM, Cuba).
236 Animal Cell Technology

The batch operation mode is the simplest to carry out, and therefore itis widely employed. Generally, it is adopted for the cultivation of cells instationary flasks, in stirred flasks, in small- and intermediate-scale bioreac-tors for inoculum propagation and also in several industries at productionscale. In the case of inoculum propagation, the culture is stopped when thecells are still in the exponential growth phase, to provide a high mass ofcells growing at maximum rate. In this way, it is guaranteed that thesecells, when inoculated in a larger bioreactor, will present a minimal lagphase, and so reducing the non-productive period.
The low volumetric productivities that characterize batch cultivationprocesses are a disadvantage for the use of this operation mode forproduction. However, a variant known as ‘‘repeated batches’’ is an inter-esting alternative. It consists of initially carrying out a batch cultivationfor the time needed to attain the desired product concentration. At thatmoment, just a part of the bioreactor contents is harvested. The remainingcell suspension inside the bioreactor is then used as inoculum for a newbatch, by filling the vessel with fresh medium. This procedure can berepeated several times, until a decrease in cell growth or product formationis observed. The use of repeated batches allows a decrease of the time thebioreactor is non-productive. This eliminates the time periods that wouldbe necessary for cleaning and sterilization between each batch.
The productivity of batch cultures in general is limited by the low cellconcentration and, consequently, the low product concentration at the endof the process. This is related to the fact that the initial concentration ofsubstrates must be relatively low to avoid cell death due to osmotic effects(Morbach and Kramer, 2003), as well as to the fact that the cells aresubmitted to environmental conditions that keep changing during thewhole process.
The main technological features of the batch operation mode are:
(i) operational simplicity;(ii) simple equipment and operational procedure, decreasing contamina-
tion risks, when compared with other operation modes;(iii) low productivity, that can be improved slightly by carrying out
repeated batches;(iv) process optimization possible through manipulation of medium com-
position and determination of the best time to harvest the product;(v) applied in industrial processes at scales up to 20 000 L.
9.4.2 Fed-batch cultivation
The difference of this operation mode compared with batch is that one ormore nutrients are fed during cultivation, to replace those consumed bythe cells. Fed-batch cultures begin with a working volume lower than themaximum working volume, so that nutrients can be added during theculture period, either from fresh culture medium or from a concentratednutrient solution. Figure 9.15A shows typical profiles for cell and productconcentrations, as well as the volume of medium in the reactor resultingfrom pulse additions of nutrients.
Bioreactors for animal cells 237

Feeding nutrients during the culture allows an increase of the totalamount of nutrients metabolized by the cells, which results in higher finalconcentrations of cells and product. Effects of high initial nutrient concen-trations can be eliminated, since the nutrients are not added all at once atthe beginning of the process.
Equations 4 to 6 present the mass balances for cells, substrate, andproduct in a fed-batch culture:
dXv
dt¼ �Xv � F
VXv (4)
dS
dt¼ �qsXv þ F
V(SA � S) (5)
0.0E 00�
1.0E 06�
2.0E 06�
3.0E 06�
4.0E 06�
5.0E 06�
0
20
40
60
80
100
120
Viable cells Product Glucose Glutamine
XvSP
Xv
V
S
(A)
V
F
Time(B)
Cel
l con
cent
ratio
n (c
ells
/ml)
0.0 2.5 5.0 7.5 10.0Time (days)
Product concentra
tion (mg/L),
glucose and glutamine (m
M)
Figure 9.15
Fed-batch cultivation: (A) operational configuration and typical volume, cell, andsubstrate profiles, for a pulse feeding strategy; (B) concentration of cells, product,and two substrates in a fed-batch bioreactor culture of a myeloid transfectomaproducing a humanized monoclonal antibody (Center of Molecular Immunology –CIM, Cuba).
238 Animal Cell Technology

dP
dt¼ qPXv � F
VP (6)
Where:F ¼ feed flow rate, which usually varies with time;SA ¼ concentration of a generic substrate in the feed stream;V ¼ bioreactor working volume, which varies with time.
As can be seen, these equations differ from those presented for batchcultures, since they contain terms related to the addition of nutrients froma solution with concentration SA at a flow rate F.
Figure 9.15B shows the behavior of a fed-batch culture. Starting fromthe inoculum concentration, a cell density of 53 106 cells mL–1 is obtainedwithin a period of 7–10 days, although in the literature higher concentra-tions (10 3 106 cells mL–1) have been reported (Xie and Wang, 1997).Furthermore, in some cases, the cultivation time can be extended to 10–15days. The most relevant in this context is that product concentration canbe increased significantly, when compared with batch cultivation. This isevidenced by Equation 6 (mass balance for product), taking into consid-eration that values for cell mass and culture times are larger in this casethan in batch cultures. Indeed, some of the final concentration valuesreported for this operation mode are among the highest titers attained foranimal cell products. Conventional product concentrations of 150 mg L–1
are usually achieved in fed-batch cultures, but after optimization offeeding strategies and using improved recombinant cell lines, Robinson(1994) reported product concentrations of approximately 2 g L–1.
Nutrient feeding can be carried out according to different strategies;addition of nutrients in pulses, in steps, at constant flow rate, or usingmore sophisticated strategies, such as an exponentially growing feed flowrate. By using optimized strategies, based on the specific consumptionrates for each substrate and on the effect of nutrient concentration on theserates, cell concentrations up to 2.5-fold higher than those observed inbatch mode were achieved by Xie and Wang (1997).
Another interesting positive effect that has been observed in fed-batchcultivation is the duration of the stationary phase (Altamirano et al., 2004).When cells show non-growth associated or inversely associated productformation kinetics, the prolonged stationary phase observed in fed-batchcultures results in considerable gains in productivity. The use of molecularbiology tools to change the production pattern of a cell line for a non-growth associated pattern aims at exploiting this advantage (Weikert et al.,1999).
In fed-batch culture processes, productivity is usually limited by theaccumulation of toxic metabolites, which can inhibit cell growth andnegatively influence culture viability and product formation. The mostrelevant toxic metabolites are lactate and ammonia (Hassell et al., 1991).Feeding strategies aimed at maintaining low levels of nutrients, as well astotal or partial substitution of glucose and glutamine by slowly metabo-lized substrates, allow a decrease of the level of lactate and ammonia incultures. In a fed-batch culture of a tPA-producing CHO cell line,Altamirano et al. (2004) proposed replacing glucose by galactose, a more
Bioreactors for animal cells 239

slowly metabolized sugar, and this caused a decrease in the generation oflactic acid, as well as an increase in cell viability and product formation.
Another active research field is the optimization of intracellular meta-bolic reactions to decrease the production of toxic metabolites throughmetabolic engineering strategies. An example is the introduction of theglutamine synthetase (GS) gene into NS0 cells, that do not have thisactivity, or into CHO cells, that have a low endogenous GS activity.GS catalyzes the formation of glutamine from glutamate, allowing cellsto grow in a medium with low concentrations of glutamine or noglutamine at all. The introduction of this gene leads to a considerabledecrease in ammonia levels in the cultures, resulting in a significantincrease in maximum cell concentration and prolonged duration of thestationary phase. As a consequence, final product concentration andvolumetric productivity are increased (Bebbington et al., 1992). Thisapproach has been applied industrially for both cell lines – NS0 andCHO.
A disadvantage of fed-batch culture is the long residence time of theproduct in the culture environment. A product molecule, secreted at theearly phase of the process, remains inside the bioreactor for the wholeduration of the culture, in the presence of proteases and glycosidases(Goochee and Monica, 1990). Since the product of interest is generally aprotein (usually a glycoprotein), these enzymes may degrade the productand, in some cases, destroy an important fraction of the active materialthat is synthesized. For that reason, molecules that are unstable at theculture temperature or prone to enzymatic cleavage should not be pro-duced by fed-batch cultures.
The most important characteristic of the fed-batch mode is the fact that,in spite of its more complex operation compared with batch cultures, theproductivity is increased significantly. Furthermore, when compared withperfusion operation, the runs are considerably shorter, making processvalidation easier. For this reason, a relatively large number of biotechnolo-gical companies have developed their production processes based on thistechnology (Chu and Robinson, 2001).
In summary, the main technological features of this operation mode are:
(i) moderate operational complexity;(ii) moderate contamination risks;(iii) intermediate volumetric productivity;(iv) long residence time of product in the bioreactor;(v) process optimization possible basically through manipulation of
medium composition, feeding strategy, and harvesting time;(vi) applied in industrial processes at scales up to 20 000 L.
9.4.3 Continuous cultivation
Continuous cultivation is used mainly in research and developmentactivities, at small scales. It is characterized by a continuous feed of freshmedium and a continuous removal of cell suspension, both at the sameflow rate, and at constant bioreactor volume.
240 Animal Cell Technology

Equations 7 to 9 describe the behavior of a continuous culture:
dXv
dt¼ �Xv � DXv (7)
dS
dt¼ �qSXv þ D(SA � S) (8)
dP
dt¼ qPXv � DP (9)
Where:D ¼ dilution rate (D ¼ F/V).
When the system reaches the steady state, concentrations of cells,product, and substrates remain constant, so that according to Equation 7the specific growth rate becomes equal to the dilution rate.
Figure 9.16A shows a typical operational configuration of a continuousbioreactor culture. In Figure 9.16B, the cell concentration data of a realcontinuous culture, operated at three different dilution rates, are pre-sented. The rectangles indicate the different steady states observed,whereas the arrows show the moment of change in dilution rate. Further-more, a guide line has been included in Figure 9.16B to help interpretationof the cell concentration profile.
The continuous mode allows the establishment of well-defined steadystates, so that the relationship between the concentration of substancesinside the bioreactor and different biological reaction rates can be studied.Therefore, this operation mode is a powerful tool for cell characterization(Altamirano et al., 2001).
When carrying out studies in continuous mode, it is important toguarantee that the system stabilizes before measurements are made, toensure that reliable results are obtained. The determination of physiologi-cal parameters in non-steady state can be influenced by effects of adapta-tion or transition of the biological system, therefore making measurementsimprecise (Vits and Hu, 1992).
A limiting condition when carrying out continuous culture is thesituation known as bioreactor wash-out. This condition is characterizedby a cell removal rate at the bioreactor outlet that is equal to or higherthan the cell growth rate, such as that shown in Figure 9.16B after D hasbeen increased to 0.8 d–1. The wash-out condition occurs when thedilution rate is increased to a threshold value called Dwash-out, which can bederived from Equation 7, considering steady state and adopting �MAX
for �.
�MAX ¼ Dwash�out (10)
Dilution rate values higher than Dwash-out cause a progressive decrease incell concentration, until no more cells are found inside the bioreactor.Thus, Dwash-out is the upper limit that should not be exceeded in acontinuous culture. Since the �MAX values for animal cells are between0.02 and 0.04 h–1 (0.5–1 d–1), the maximum cell concentration usually doesnot surpass 2 3 106 cell mL–1. Considering that productivity in a contin-
Bioreactors for animal cells 241

uous process can be expressed by multiplying the dilution rate by theproduct concentration (DP), it is easy to conclude that low cell concentra-tions result in low product concentrations and low productivities, makingthis process not very attractive for industrial applications.
9.4.4 Continuous cultivation with cell retention (perfusion)
Widely known as perfusion, this operation mode presents the highestproductivities and, at the same time, the highest operational complexity.Since the innovating work on a spin-filter in 1969 (Himmelfarb et al.,1969), the use of this operation mode has become more and more popular,both at laboratory and industrial scales (Chu and Robinson, 2001).
(B)
Cel
l con
cent
ratio
n (c
ells
/mL)
0.0E 00�
8.0E 05�
1.6E 06�
2.4E 06�
3.2E 06�
Viable cells
0.6d�1
0.7d�1
0.8d�1
(A)
F, SA
F, S, Xv
0 5 10 15 20Time (days)
XvSP
Figure 9.16
Continuous cultivation: (A) typical operational configuration; (B) cellconcentration as a function of dilution rate for a continuous culture of a myeloidtransfectoma producing a humanized monoclonal antibody (Center of MolecularImmunology – CIM, Cuba). The different steady states are indicated by rectanglesand the line has been included to facilitate interpretation of the cell concentrationprofile.
242 Animal Cell Technology

In this operation mode, it is possible to mitigate the major limitation ofcontinuous cultures, that is, the low productivity due to the loss of cells inthe bioreactor outlet. In perfusion, this issue is overcome by using a cellretention device to maintain cells inside the bioreactor. Figure 9.17 showsa scheme of a stirred-tank bioreactor operating in perfusion mode, as wellas the kinetic behavior of a perfusion run.
Equations 8 and 9, previously shown for the substrate and product massbalances in continuous cultures, can also be applied to this cultivationmode. However, due to cell retention, the equation that expresses the cellmass balance is altered, when compared with the mass balance of cells in acontinuous culture (Equation 11):
0 10 20 30 40 50
(A)
F, S
Cell retention
device
F, S, Xvα
(B)
Viable cells Product
Time (days)
Pro
duct
con
cent
ratio
n (c
ells
/mL) P
roduct concentration (m
g/L)
0.0E 00�
1.0E 07�
2.0E 07�
3.0E 07�
4.0E 07�
0
20
40
60
80
100
120
XvSP
Figure 9.17
Perfusion culture: (A) typical operational configuration, using an external cellretention device; (B) concentration of viable cells and product in a perfusionbioreactor culture of a myeloid transfectoma producing a humanized monoclonalantibody (Center of Molecular Immunology – CIM, Cuba).
Bioreactors for animal cells 243

dXv
dt¼ �Xv � ÆDXv (11)
In Equation 11, Æ is the cell passage factor, defined as the ratio betweencell concentration in the perfusate and in the bioreactor (Equation 12).
Æ ¼ Xv,PERFUSATE
Xv(12)
Cell retention may be total or partial. A total cell retention would resultin Æ ¼ 0, whereas a value of 1 would mean no retention of cells.
Wash-out conditions in perfusion cultures are different due to theretention of cells. In the same way as Equation 10 was obtained, Equation13 can be derived from Equation 11:
�MAX ¼ ÆDwash�out (13)
For low Æ-values (between 0 and 0.2), the dilution rate may be increasedup to values that are much higher than the maximum specific growth rate,without establishing a wash-out condition. The increase in the dilutionrate that can be employed results in a greater availability of nutrients and,consequently, in an increase of cell and product concentrations. Thus, theperfusion mode allows a high-cell-density culture to be maintained for along period, at a high perfusate flow rate and an elevated productconcentration. This results in productivities that are 1–2 orders of magni-tude higher than those obtained in continuous processes. In fact, theperformance of perfusion cultures is superior to that of all other operationmodes (Bibila and Robinson, 1995).
The operation of cultures in perfusion mode is possible for almost allexisting bioreactor types. Heterogeneous bioreactors are usually operatedin perfusion mode, and homogeneous bioreactors can be if a solid–liquidseparation device (cell retention device) is used (see Chapter 11).
As indicated for other modes, it is necessary to maintain the inoculumconcentration in the range of 0.1 3 106 to 0.4 3 106 cells mL–1, tominimize the adaptation lag phase at the beginning of a cultivation process.The profiles for cell growth and product formation will depend on thefeeding strategy adopted, on the cell line characteristics, and on theperformance of the cell retention device.
In the case of homogeneous bioreactors, the maximum cell concentra-tion in perfusion cultures can attain 107–108 cells mL–1. When this opera-tion mode is used in heterogeneous bioreactors, cell concentration in thecell compartment can approach the packing limit of tissues, which is in theorder of 109 cells mL–1. Product concentrations reported for these pro-cesses vary considerably, but are most commonly in the range of 100–500 mg L–1. Culture duration can be in the range of several days up toseveral months (Bodeker, 1994).
The feeding strategy adopted in a perfusion process is of great impor-tance. The ideal approach, that is, the one that results in the highestproductivity, depends on the relationship between growth kinetics andproduct formation kinetics. For cell lines that present growth-associatedproduction, it is recommended to feed culture medium at an increasingdilution rate to allow maximum cell growth. However, if product forma-
244 Animal Cell Technology

tion by the cells is not associated or inversely associated with growthkinetics, then the dilution rate should be increased up to a given value andthen remain constant, resulting in a steady state of the main processparameters (Figueredo, 2002).
An example of the first strategy is the so-called cell-specific perfusionrate (Ozturk, 1996), which allows maintenance of cells in a constantenvironment by exponentially increasing the feed rate according to the cellconcentration profile (Chico and Jager, 2000). A negative aspect of thisstrategy is that very high cell concentrations are achieved rapidly, and thismay negatively affect the cell separation device (Deo et al., 1996), and thuslimit the culture duration. This negative aspect can be minimized byestablishing a cell bleed stream for a controlled removal of cells from thebioreactor. This allows maintenance of a high cell viability, combined witha stable and high cell concentration, at a level that is compatible with goodperformance of the cell separation device. Furthermore, the high dilutionrates used in this case result in short residence times of the product insidethe bioreactor, which can be relevant in the case of products that are veryunstable or that can be easily degraded under culture conditions.
Another feeding strategy, which is sometimes called ‘‘stationary strat-egy’’, aims at extending the culture duration for months (Bodeker, 1994).However, the use of this type of strategy results in a considerable decreasein cell growth rate (Figueredo, 2002) and in an accumulation of dead cells,causing the release of cell debris and substances potentially dangerous toproduct integrity. To diminish this problem, cell purges are periodicallycarried out in order to maintain a more constant and controlled cellenvironment (Kempken et al., 1991).
Although in most cases perfusion operation presents several economicadvantages, its industrial use is not as widespread as that of fed-batchcultures. This is due mainly to false ideas of the technological andoperational difficulties and an underestimation of the productivity gains ofthis operation mode. A critical evaluation of the characteristics of perfu-sion operation indicates that the disadvantages have usually been empha-sized or even exaggerated (Kadouri and Spier, 1997).
The design of bioreactors for perfusion operation is more sophisticated,which makes the equipment more expensive. However, the productivityincreases obtained by perfusion operation allow the use of much morecompact systems than those operated under batch or fed-batch mode. Inthis way, perfusion bioreactors can be up to 10-fold smaller for a givenproduction scale (Bibila and Robinson, 1995), decreasing the costs notonly of the bioreactors themselves, but also of storage tanks and down-stream processing equipment.
As regards validation, perfusion bioreactors, which are more complexand of more recent use, have been classified in the past as difficult tovalidate (Kadouri and Spier, 1997). The longer cultivation runs result inlonger validation processes when compared with discontinuous processes.However, the growing number of approved biopharmaceutical productionprocesses based on perfusion mode suggests a change in attitude by theregulatory agencies (Chu and Robinson, 2001).
In summary, the main technological features of this operation mode are:
Bioreactors for animal cells 245

(i) more complex operation than in the case of other operation modes;(ii) higher contamination risk, since it is an open system that operates
continuously for long periods of time;(iii) higher volumetric productivity;(iv) short residence time of product in the bioreactor (ideal for the
production of labile molecules);(v) process optimization basically through manipulation of medium
composition, feeding strategy, and controlled cell removal (cell bleed-ing);
(vi) scales generally up to 2000 L.
9.5 Aeration and agitation
Aeration and agitation are two important operations in animal cell culture.Oxygen has a low solubility in aqueous media, with a saturation concen-tration of approximately 7 mg L–1 at 378C. This implies that the oxygenmust be provided continuously to the cultures, to ensure that the dissolvedoxygen levels in the culture medium remain at an adequate level. The massbalance for oxygen in the liquid phase can be written as:
d DOð Þdt
¼ kLa DO� � DOð Þ � qO2Xv (14)
Where:DO� ¼ concentration of dissolved oxygen at saturation (in equilibriumwith the gas phase);DO ¼ dissolved oxygen concentration;kL ¼ global oxygen transfer coefficient;a ¼ gas–liquid interfacial area per reactor volume;qO2 ¼ oxygen specific consumption rate.
This mass balance concerns the liquid phase, since oxygen must bedissolved in order to be used by the cells. Due to the difficulty in measur-ing the interfacial area (a), especially when oxygenation is carried out bybubble aeration, it is common to use the product of kL times a (kLa),known as the volumetric oxygen transfer coefficient, as the relevantparameter.
The dissolved oxygen concentration at equilibrium follows Henry’sLaw (Equation 15), with the constant HO2 being a function of tempera-ture. Since the air contains 21% of oxygen, the partial pressure PO2 whenusing pressurized air is fivefold lower than when using pure oxygen. Thus,DO* is higher for pure oxygen injection, resulting in a larger oxygentransfer rate to the liquid medium.
DO� ¼ HO2 � PO2 (15)
Where:PO2 ¼ oxygen partial pressure;HO2 ¼Henry’s constant.
Different studies have established an optimal dissolved oxygen concen-tration for animal cell culture in the range of 20–50% of air saturation
246 Animal Cell Technology

(Butler, 2004). Too high oxygen concentrations lead to the formation offree radicals in the medium, which may cause oxidative damage to cells.The DO concentrations are monitored with previously calibrated electro-des, whereby the 100% value is adjusted after saturation of culturemedium with air, at the cultivation temperature (usually 378C). Theoxygen transfer system must be designed to meet the demands of theculture, avoiding situations of limitation or excess of dissolved oxygen.This is accomplished by supplying air, pure oxygen, or mixtures of bothgases to the culture. Another aim of aeration is to allow dissolved carbondioxide originating from cell respiration to be removed in the gas exhauststream, to avoid toxic levels (Gray et al., 1996). The removal of carbondioxide is known as ventilation.
Different aeration methods have been employed in animal cell culture:
(i) surface aeration;(ii) aeration through membrane devices or gas-permeable tubing;(iii) bubble aeration.
The first two methods are widely used just for laboratory-scale applica-tions, since there are limitations for their use at larger scales. In surfaceaeration, the oxygen transfer rate is related to the liquid surface area (gas–liquid interface). When the culture scale is increased, maintaining constantgeometric proportions, the volume increases with the third power of acharacteristic linear dimension of the system, whereas the surface areaincreases with its square.
A recent option is that found in wave bioreactors, where the generationof waves increases oxygen transfer by augmenting both the interfacial area(a) and the global transfer coefficient kL (Singh, 1999). Therefore, thesereactors are already available commercially at volumes up to 500 L.
The second method uses devices that can be positioned either inside thebioreactor or in external recirculation loops. This method allows aerationin the absence of bubbles, minimizing the negative effects that these canexert on the cells, as will be discussed later in this chapter (Lehmann et al.,1987). The aeration devices can be based either on membranes or on non-porous tubes made of oxygen-permeable materials, such as silicon, or onporous devices made of materials that are impermeable to oxygen, such aspolypropylene. This method also has limitations regarding scale-up, andits use has been reported just for bioreactors up to 150 L in volume(Lehmann et al., 1987). Its use at a larger scale becomes unfeasible, due tothe operational difficulties associated with assembling, cleaning, andsterilizing systems that contain hundreds of meters of tubes or membranes.In heterogeneous bioreactors, external aeration devices are most com-monly employed, since it is easy to recirculate a cell-free or almost cell-free stream through an independent oxygenation system. Due to the lowsolubility of oxygen in aqueous media, the recirculation speed usuallyneeds to be very high, reaching up to 100 vvd (recirculation volume perreactor volume per day).
The aeration method most widely used in animal cell cultures is bubbleaeration, just as in microbial fermentations. This method is simple andconsists of bubbling a gas stream directly into the culture medium, using a
Bioreactors for animal cells 247

sinter sparger, orifice sparger or jet-flow device. Sinter spargers are madeof porous stainless steel and can generate bubbles with diameters in theorder of hundreds of micrometers. Orifice-type and jet-flow spargersgenerate bubbles 1 mm in diameter or larger (Puleo et al., 2004). In thebioreactors, the spargers are generally positioned below the impellers, topromote a homogeneous distribution of bubbles inside the culture vessel.
Although simple, the use of bubble aeration in animal cell cultivationrequires the solution of certain technological challenges for its implemen-tation, since one of the most characteristic features of animal cells is theirlow resistance to mechanical stresses. Cell membranes have a mechanicalresistance that is much lower than that of microbial cell walls. Accordingto Castilho and Anspach (2003), shear stresses in the order of 60 Pa arecritical for cell death.
It is reported that bubble disengagement and bursting at the liquidsurface is a major cause of cell death in animal cell cultures (Kunas andPapoutsakis, 1990; Butler, 2004). The cell membrane is slightly hydropho-bic under culture conditions, and therefore cells tend to adhere to bubblesascending inside a bioreactor. When these reach the liquid surface, the filmof fluid that surrounds the bubble begins to be drained by gravity,decreasing in thickness. The bubble bursts at the moment the mechanicalresistance of this film is not sufficient to resist the pressure inside thebubble. The explosion of a bubble causes large velocity gradients in theliquid below the bubble. Figure 9.18 shows that the presence of a bubblecreates a cavity in the liquid and, at the moment of bubble bursting, thiscavity is quickly filled with liquid, generating high velocity gradientswithin short distances, resulting in shear stress levels that are sufficientlyhigh to destroy the cells found in this region (Meier et al., 1999).
In general, to minimize damage to the cells, very small bubbles shouldbe avoided in animal cell cultures, since the interfacial area of the bubbles
Cavity created by
the bubble
Retroceding
film
Liquid
Flow below the
bubble cavity
Air
Interface
Figure 9.18
Dynamics of bubble explosion (adapted from Wu and Goosen, 1995).
248 Animal Cell Technology

is intrinsically related to the kinetics of cell death in bioreactors (Tramperet al., 1988; Wu and Goosen, 1995). Small bubbles provide a greater totalinterfacial area than large bubbles. Therefore, small bubbles are able tocarry more cells to the top gas–liquid interface, where cell damage occursdue to bubble explosion. On the other hand, small bubbles can transferoxygen more efficiently, and this allows the use of much lower aerationrates. Thus, all these factors should be evaluated when determining themost adequate operational conditions.
The addition of surfactants allows a modification of the kinetics of non-specific cell adhesion to bubbles. When substances such as methyl cellu-lose or Pluronic
1F68 are added to the culture, the time needed for cell
adhesion to occur is increased (Meier et al., 1999). In this way, the numberof cells adhered to a bubble at the moment of its explosion is lower byseveral orders of magnitude. The non-ionic surfactant Pluronic
1F68 is so
far the best option, since it efficiently protects cells from bubble damagewithout significantly affecting oxygen transfer. However, its presence maybe undesirable for certain stages of protein purification.
Foam formation is another problem that occurs in bubble-aeratedbioreactors, especially in the presence of serum-containing culture mediaor at high protein concentrations (Butler, 2004). An uncontrolled accumu-lation of foam in the upper part of the equipment can occur, resultingeventually in severe problems due to blockage of exhaust gas filters. As aconsequence, gas transfer through the surface is seriously affected. Todecrease the negative effects of foam, different approaches can be adopted:(a) chemical antifoams; (b) foam traps; (c) bubble-free aeration; or (d) lowaeration rates using pure oxygen.
The use of silicon-based antifoams is common in industry (van Bonariuset al., 1993). However, they should be used with care, since thesesubstances can be toxic to the cell above certain concentrations. Further-more, chemical antifoams can pose problems for the chromatographicpurification of the product. Foam traps, which are devices mounted in theupper part of bioreactors to break the foam, have been used successfully atsmall and intermediate scales, but are not widely used on a large scale. Onthe other hand, low aeration rates using pure oxygen effectively lead to asignificant decrease or even complete elimination of foam, but may resultin CO2 accumulation in the medium, which is harmful to the cells (Grayet al., 1996).
Both aeration and ventilation are enhanced by mechanical agitation ofthe cell suspension. However, agitation also has other functions in abioreactor: to maintain cells in suspension (in the case of homogeneousbioreactors or suspended microcarriers), as well as to homogenize thefluid. This homogenization is important to avoid the appearance of deadzones and of nutrient, metabolite, and temperature gradients, as well as topromote the transfer of heat and of the different chemical species, includ-ing oxygen, in order not to limit the performance of the biological system.
When stirred-tank bioreactors started to be used for animal cellcultivation, many problems related to deleterious effects of agitation oncell viability were observed. However, it was noted that the use of largeimpellers rotating at low speeds could minimize mechanical damage tothe cells. The most widely used impeller types are marine (Chisti, 1993)
Bioreactors for animal cells 249

and inclined-blade impellers (Michaels et al., 1996). On a small scale,stirrers with oscillating membranes (Lehmann et al., 1987) have alsobeen proposed. However, these and other similar systems have limitedefficiency and are difficult to scale-up. Currently, marine propellerscontinue to be the most widely used impeller type, but also radial-flowimpellers, such as turbines, or combinations of different types areutilized (Krahe, 2003).
The flow pattern in a stirred bioreactor with baffles is extremelycomplex and, generally, turbulent under normal operational conditions(Brucato et al., 1998). Higher shear rates and, consequently, higher energydissipation rates occur near smaller turbulent eddies, that rotate at highervelocities. The smallest size an eddy can reach under given flow conditionsis known as microscale of turbulence and can be estimated throughKolmogorov’s equation (Joshi et al., 1996):
º ¼ �3
�
� �0:25
(18)
Where:º ¼ Kolmogorov eddy length (microscale of turbulence);� ¼ kinematic viscosity;� ¼ energy dissipation per unit mass.
Several authors have proposed that, when the microscale of turbulenceis of the same order or smaller than the cell diameter, the energy dissipa-tion due to the eddy action on the cell surface can destroy the cells (Kunasand Papoutsakis, 1990). In the case of larger eddies, cells can be accom-modated in their interior, moving at the same velocity as the eddies. Thus,no velocity gradients are formed that could damage the cells. However,other authors state that adopting Kolmogorov’s theory to explain celldamage is inadequate, mainly due to the evidence that the dominatingdeleterious effects on cells are due to bubble explosion at the gas–liquidinterface (Kioukia et al., 1992). Furthermore, it has been demonstratedthat in the absence of a gas phase inside the bioreactor, cells are moreresistant to high rotation speeds than when bubbles are present (Kunasand Papoutsakis, 1990).
9.6 Scale-up
To meet the demand for a product in the market, two approaches arepossible; process intensification by increasing process productivity, orincreasing the production scale. The latter approach may be achieved byincreasing the number of bioreactors of a given size or by using bioreac-tors of larger volume. From the economic viewpoint, generally the secondoption is more adequate, since equipment costs usually increase with scaleto the power of 0.6 (Rouf et al., 2000). Beyond that, operation andmaintenance costs increase with the number of pieces of equipment,indicating that for scale-up an increase in the bioreactor volume is moreadvantageous than using several smaller units.
The aim of scaling-up is to reproduce in production scale the conditionsoptimized at laboratory and/or pilot scale. Most of the general principles
250 Animal Cell Technology

adopted for the scale-up of microbial fermentation processes are applicableto animal cell culture. Usually the factors that can influence volumetricproductivity are investigated when changing the scale in order to identifythose that are most critical. Once they are identified, similar criteria forthese factors are established for the different scales. The most commonlyused criteria concern the peripheral rotation velocity of the impeller andthe gas flow rate, in the case of bubble-aeration processes.
Before scaling-up a process established at a small scale, it is importantthat it is appropriately characterized and optimized. First, a cell line withdesirable production, growth, and genetic stability should be selected. Thisselection is usually carried out in multiwell plates and stationary flasks(Castillo et al., 2005). An adaptation to suspension growth is usuallydesirable. Then, the master and working cell banks are prepared, tocryopreserve the selected cell line. Subsequently, process development isinitiated. Studies on the behavior of the cell line are carried out inlaboratory bioreactors that should have the same configuration as those tobe used at a production scale. Under these conditions, the kinetic charac-teristics, production pattern, oxygen requirements, and shear resistance ofthe cell line are determined (Vıctores, 2005). After that, a mode ofoperation should be chosen and the operational variables that maximizevolumetric productivity should be determined. Finally, studies aimed atprocess scale-up should then be carried out.
The stirred-tank bioreactor is an example of a reactor that is scaled-upby direct increase of its volume. One of the critical parameters that shouldbe evaluated at different scales is the rotation speed of the impeller.Different criteria can be employed:
(i) to maintain constant the power per fluid volume dissipated by theimpeller;
(ii) to keep constant the peripheral velocity of the impeller;(iii) to maintain constant the volumetric oxygen transfer coefficient (kLa).
Each of these criteria will give different results, so that they should becarefully evaluated, preferably from experimental results. For the aerationparameters, it is important to evaluate which is the most relevant phenom-enon; the capacity of bubbles for oxygen transfer or their negative effecton the cells (Chisti, 2000). At very large scales, the ventilation is also avery important issue, mainly if low aeration rates with pure oxygen areused (Gray et al., 1996).
Since in animal cell culture processes the effects of mechanical stress aremuch more relevant than in microbial fermentations (Chisti, 1993), it isquite common to adopt scale-up criteria that are associated with celldamage (Joshi et al., 1996), such as constant peripheral impeller velocity,constant aeration rate, and constant integrated shear stress (Croughan etal., 1987).
When bioreactors coupled to cell retention devices are used, it is alsonecessary to evaluate the scale-up of the cell separation equipment. In thecase of the spin-filter (see Chapter 11), parameters such as filter rotationvelocity and the ratio of filtration area to bioreactor working volume areparticularly relevant (Deo et al., 1996).
Bioreactors for animal cells 251

9.7 Economic aspects relevant to bioreactor selection: theproductivity factor
Most proteins produced by animal cell culture on a large scale areinnovative biopharmaceuticals, protected by patents, that have a sellingprice several times higher than the production costs. Those prices arejustified by the large investments in research and development for devel-oping a new biopharmaceutical, which are calculated to be in the range of2 to 250 million US dollars (Savage, 2000).
The complex production facilities required for the cultivation of animalcells, with sophisticated auxiliary services that should avoid contaminationand toxicity in the cultures, and fitted with highly automated and valida-table equipment, are the reasons why the main cost component of theseprocesses is associated with equipment and other technical components(Petrides, 2000).
That is why the main economic consequence of animal cell processoptimization is the decrease of the scale of equipment needed to meet agiven product demand. This can reduce the investment required to build aproduction facility, which varies in the range of 10 to 300 million USdollars (Petrides, 2000).
Volumetric productivity of a process is a parameter that determines thesize of the facilities needed to obtain a given annual production, thusdetermining the economic efficiency of protein production based onanimal cells. Volumetric productivity, as well as the annual production,can be calculated from Equations 19 to 22:
Pacc ¼ Vqp
ðXvdt (19)
t proc ¼ t prep þ t growth þ t prod (20)
PV ¼ Pacc
t proc V(21)
PA ¼ PVVtwork (22)
Where:Pacc ¼ amount of product accumulated throughout a run;tproc ¼ process time;tprep ¼ time required for the preparation of the bioreactor (includescleaning and sterilization);tgrowth ¼ time needed for cells to grow up to the concentration desiredfor the process. This time is a function of the specific growth rate of thecell line and of the inoculation density;tprod ¼ duration of the production phase. In the case of cell lines that donot require induction to express the protein product, this time periodalso includes the cell growth phase;PV ¼ volumetric productivity of the bioreactor;PA ¼ annual production obtained in the bioreactor;twork ¼ number of working days per year (generally 300 days or 44weeks per year).
252 Animal Cell Technology

It is important to emphasize the general character of this definition forthe volumetric productivity (PV), since it includes all phases of a produc-tion cycle in a bioreactor, allowing an evaluation of the impact ofbioreactor preparation time and duration of growth and production phaseson productivity. As can be observed from Equations 19 to 22, for anindustrial bioreactor with a given volume and operation mode, thevolumetric productivity depends basically on cell concentration in theproduction phase and on the specific product formation rate (qP).
The values of qP can vary significantly as a function of the expressionsystem used and of the recombinant protein product. In general, values inthe range of 1–30 pg cell–1 day–1 are reported for stably transfected celllines. However, Chico and Jager (2000) have reported values as high as85 pg cell–1 day–1 for the expression of a protein using the insect cell-baculovirus expression vector system. This value approaches the maximumtheoretical value that is expected for animal cells, which is 100 pg cell–1
day–1 (Ozturk, 1990).In this way, the use of bioreactors that allow high cell density cultures is
of great importance as a tool to increase process productivity. Table 9.3shows volumetric productivity values that can be obtained in the maintypes of industrial bioreactors, as well as the typical working volume andthe cell concentration ranges that are usually attained.
As can be observed in Table 9.3, cell concentrations equal to or higherthan 107 cells ml–1 are needed to attain volumetric productivities higherthan 50 mg L–1 d–1. Also, it is important to note that as cell concentrationincreases, the complexity of the process increases and, consequently,bioreactor scale-up becomes limited, for example by physical limitationsof materials used in hollow-fiber cartridges.
Figure 9.19 shows typical cell concentrations reached in the mainindustrial bioreactors and a comparison of these values with those foundin microbial fermentations. As can be observed, batch and fed-batchcultivations attain dry biomass values comparable to those of continuouscultures of microorganisms, so that mass and heat transfer capacities arenot limited for these operation modes. However, high cell density cultiva-tion in heterogeneous bioreactors, such as hollow-fiber devices, reachesdry biomass values similar to the maxima observed in microbial cultures.
Table 9.3 Comparison of working parameters and typical productivities found for the mainindustrial bioreactors
Parameter Stirred-tank bioreactorsoperated in batch andfed-batch mode
Stirred-tank bioreactorsoperated in perfusionmode
Heterogeneousbioreactors (packed-bedor hollow-fiber) operatedin perfusion mode
Cell concentration(cells mL–1) 106 107 108–109
Complexity Low Medium HighBioreactor volume* Up to 20 000 L 100–2000 L 0.2–10 LProductivity(mg L–1 day–1)
10–40 50–600 500–1000
*Considering only the volume of the bioreactor compartment where cells grow.
Bioreactors for animal cells 253

Figure 9.19 also suggests that there is an optimization window available;developing new cell culture methods that provide cell concentrations inthe range of 107 to 108 cells mL�1 could represent requirements still lowerthan in microbial fermentations, but at the same time a significant increasein the volumetric productivities of industrial animal cell processes.
As evidenced by Equation 22, the volumetric productivity (PV) deter-mines the cultivation volume (V) needed to reach a desired annual produc-tion (PA). Application of this equation for volumetric productivities up to500 mg L–1 d–1 is illustrated in Figure 9.20 and allows an estimate of thetotal culture volume required for obtaining production capacities in therange of 1–1000 kg per year.
As a result of recent advances in the use of recombinant antibodies forthe treatment of chronic diseases and several types of cancer, a growingnumber of new therapeutic antibodies is currently under development (seeChapters 16 and 17). As a consequence, large investments in the construc-tion of industrial animal cell facilities are being made, surpassing 1 millionliters in terms of total installed capacity. In the recent years, biotechnologycompanies such as Genentech Inc. in the USA and Boehringer Ingelheimin Germany constructed plants with a total bioreactor volume of morethan 100 000 L and production capacity higher than 1000 kg of antibodiesper year, after investments in the order of hundreds of million US dollars.
However, from the relationship between culture volume and productioncapacity reported by many companies, it is possible to observe thatvolumetric productivities lower than 50 mg L–1 d–1 are still quite usual.
High cell
density
microbial
culture
Continuous
microbial
culture
Cultures in hollow-fiber bioreactors
Perfusion cultures in stirred-tank bioreactors
Batch and fed-batch cultures
Inoculum concentration
(A) (B)
100
10
1
0.1
109
108
107
106
105
Figure 9.19
Ranges of cell concentration reached in: (A) microbial bioprocesses (concentrationexpressed as gL�1 of dry biomass); (B) animal cell cultures (concentrationexpressed as cellsmL�1), considering 106 cells ¼ 0.25 mg of dry biomass (adaptedfrom Frame and Hu, 1990).
254 Animal Cell Technology

Thus, it becomes evident that increases in the volumetric productivity upto levels in the range of 500 mg L–1 d–1 could lead to a decrease of oneorder of magnitude in the culture volume needed to obtain a large amountof therapeutic proteins on an industrial scale. Therefore, the use of highproductivity bioreactors could represent savings in the range of tens ofmillions of US dollars in the cost of recombinant protein productionfacilities, making this technology feasible for smaller companies and fordeveloping countries (Lage, 1994).
References
Altamirano C, Illanes A, Casablancas A, Gamez X, Cairo JJ, Godia F (2001), Analysisof CHO cells metabolic redistribution in a glutamate-based defined medium incontinuous culture, Biotechnol. Prog. 17:1032–1041.
Altamirano C, Paredes C, Illanes A, Cairo JJ, Godia F (2004), Strategies for fed-batchcultivation of t-PA producing CHO cells: substitution of glucose and glutamineand rational design of culture medium, J. Biotechnol. 110:171–179.
Bebbington CR, Renner G, Thomson S, King D, Abrams D, Yarranton GT (1992),High-level expression of a recombinant antibody from myeloma cells using aglutamine synthetase gene as an amplifiable selectable marker, Bio/Technol.10:169–175.
Bibila T, Robinson DK (1995), In pursuit of optimal fed-batch process for monoclonalantibody production, Biotechnol. Progr. 11:1–13.
Birch JR, Racher AJ (2006), Antibody production, Adv. Drug Deliv. Rev. 58:671–685.Bodeker BDG (1994), Production of recombinant factor VIII from perfusion cultures:
I Large-scale fermentation, In: Spier RE, Griffiths JB, Berthold W (Eds), AnimalCell Technology: Products of Today, Prospects of Tomorrow, Butterworth-Heinemann, London, pp. 580–583.
Brucato A, Ciofalo M, Grisafi F, Micale G (1998), Numerical prediction of flow fields
Ann
ual p
rodu
ctio
n (k
g)
Bioreactor volume (L)100 1000 10000 100000
10
100
1000
30
50
100
300
500
1
10 mg L d� �1 1
Figure 9.20
Relationship between annual production and culture volume, for different levels ofvolumetric productivity.
Bioreactors for animal cells 255

in baffled stirred vessels: a comparison of alternative modelling approaches, Chem.Eng. Sci. 53:3653–3684.
Butler M (2004), Animal Cell Culture and Technology, BIOS Scientific Publishers,London.
Castilho LR, Anspach FB (2003), CFD-aided design of a dynamic filter for mammaliancell, Biotechnol. Bioeng. 83:514–524.
Castilho LR, Medronho RA (2002), Cell retention devices for suspended-cell perfusioncultures, Adv. Biochem. Eng. Biotechnol. 74:129–169.
Castillo A, Vıctores S, Faifer E, Rabasa Y (2005), Development of an integratedstrategy for recombinant cell line selection, In: Godia F, Fussenegger M (Eds),Animal Cell Technology Meets Genomics, Proceedings of the 18th ESACT Meet-ing, Springer, Dordrecht, pp. 505–508.
Chico E, Jager V (2000), Perfusion culture of baculovirus-infected BTI-Tn-5B1-4insect cells: a method to restore cell specific �-trace glycoprotein productivity athigh cell density, Biotechnol. Bioeng. 70:574–586.
Chisti Y (1993), Animal cell culture in stirred bioreactors: observations on scale-up,Process Biochem. 28:511–517.
Chisti Y (2000), Animal-cell damage in sparged bioreactors, Trends Biotechnol.18:420–432.
Chu L, Robinson DK (2001), Industrial choices for protein production by large-scalecell culture, Curr. Opin. Biotechnol. 12:180–187.
Corning (2006), available at: http://www.corning.com (accessed November 2006).Croughan MS, Hamel JF, Wang DI (1987), Hydrodynamic effects on animal cells
grown in microcarrier cultures, Biotechnol. Bioeng. 29:130–141.Deo YM, Mahadevan MD, Fuchs R (1996), Practical considerations in operation and
scale-up of spin-filter based bioreactors for monoclonal antibody production,Biotechnol. Progr. 12:57–64.
Fassnacht D, Porter R (1999), Experimental and theoretical considerations on theoxygen supply of animal fixed-bed culture, J. Biotechnol. 72:169–184.
Figueredo A (2002), Evaluacion de la Tecnologıa de Perfusion en Bioreactores deTanque Agitado como Alternativa Productiva para la Obtencion del AnticuerpohR3, M.Sc. Thesis, ISPJAE, Cuba.
Frame KK, Hu WS (1990), Cell volume measurement as an estimation of mammaliancell biomass, Biotechnol. Bioeng. 36:191–197.
GE Healthcare (2006), Microcarrier Cell Culture: Principles and Methods Hand-book. Available at: http://www5.amershambiosciences.com/aptrix/upp00919.nsf/Content/WD:Microcarrier+ce(148896581-B345) (accessed November 2006).
Goochee CF, Monica T (1990), Environmental effects on protein glycosylation,BioTechnol. (NY) 8:421–427.
Gramer MJ, Poeschl DM, Conroy MJ, Hammer BE (1999), Effect of harvestingprotocol on performance of a hollow fiber bioreactor, Biotechnol. Bioeng.65:334–340.
Gray DR, Chen S, Howarth W, Inlow D and Maiorella BL (1996), CO2 in large-scaleand high-density CHO cell perfusion culture, Cytotechnology 22:65–78.
Hassell T, Gleave S, Butler M (1991), Growth inhibition in animal cell culture: theeffect of lactate and ammonia, Appl. Biochem. Biotechnol. 1:29–41.
Himmelfarb P, Thayer PS, Martin HE (1969), Spin filter culture: the propagation ofmammalian cells in suspension, Science 164:555–557.
Jo EC, Yun JW, Jung KH, Chung SI, Kim JH (1998), Performance study of perfusioncultures for the production of single-chain urokinase-type plasminogen activator(scu-PA) in a 2.5-L spin-filter bioreactor, Bioproc. Eng. 19:363–372.
Joshi JB, Elias CB, Patole MS (1996), Role of hydrodynamic shear in the cultivation ofanimal, plant and microbial cells, Chem. Eng. J. 62:121–141.
Kadouri A, Spier RE (1997), Some myths and messages concerning the batch and
256 Animal Cell Technology

continuous culture of animal cells, Cytotechnology 24:89–98.Kempken R, Buntemeyer H, Lehmann J (1991), The medium cycle bioreactor (MCB):
monoclonal antibody production in a new economic production system, Cyto-technology 1:63–74.
Kioukia N, Nienow AW, Emery AN, Al-Rubeai M (1992), The impact of fluiddynamics on the biological performance of free suspension animal cell culture:further studies, Trans. I. Chem. Eng. 70:143–148.
Krahe M (2003), Biochemical Engineering, In: Ullmann’s Encyclopedia of IndustrialChemistry, Wiley-VCH, Weinheim.
Kunas KT, Papoutsakis ET (1990), Damage mechanisms of suspended animal cells inagitated bioreactors with and without bubble entrainment, Biotechnol. Bioeng.36:476–483.
Lage A (1994), Biotechnology: offering new opportunities for developing countries,Biopharm-Eugene 75:18–20.
Lehmann J, Piehl GW, Schulz R (1987), Bubble free cell culture aeration with porousmoving membranes, Dev. Biol. Stand. 66:227–240.
Lonza (2006), available at: http://www.lonza.com/group/en/products_services/custommanufactoring/mammalian/manu_capabilities.html (accessed November2006).
Meier SJ, Hatton TA, Wang DIC (1999), Cell death from bursting bubbles: role of cellattachment to rising bubbles in sparged reactors, Biotechnol. Bioeng. 62:468–478.
Michaels JD, Mallik AK, Papoutsakis ET (1996), Sparging and agitation-induced injuryof cultured animal cells – do cell-to-bubble interactions in the bulk liquid injurecells?, Biotechnol. Bioeng. 51:399–409.
Morbach S, Kramer R (2003), Impact of transport processes in the osmotic response ofCorynebacterium glutamicum, J. Biotechnol. 104:69–75.
Nunc (2006), Available at: http:»www.nuncbrand.com (accessed November 2006).Ozturk SS (1990), Kinetics and Metabolism of Antibody Production by Hybridoma
Cells, Doctoral Thesis, Michigan University, USA.Ozturk SS (1996), Engineering challenges in high density cell culture systems, Cyto-
technology 22:3–16.Petrides D (2000), Bioprocess Design, Bioseparation Textbook (Intelligent Inc., Super-
pro Designer), available at: http://www.intelligen.com (accessed November 2006).Puleo JA, Johnson RV, Kooney TN (2004), Laboratory air bubble generation of
various size distributions, Rev. Sci. Instr. 75:4558–4563.Robinson DK (1994), Characterization of a recombinant Ab produced in the course of
a high yield feedbatch process, Biotechnol. Bioeng. 44:727–733.Rodrıguez G, Arias MA, Suarez J, Chea M, Bouzo L, Cuervo R, Alvarez I, Chico E
(2005), Optimizing cultivation strategies in different scales of hollow fiberbioreactors, In: Godia F, Fussenegger M (Eds), Animal Cell Technology MeetsGenomics, Proceedings of the 18th ESACT Meeting, Springer, Dordrecht, pp.747–750.
Rouf SA, Moo-Young M, Scharer JM, Douglas PL (2000), Single versus multiplebioreactor scale-up: economy for high-value products, Biochem. Eng. J. 6:25–31.
Rupp R (1987), Cellular microencapsulation for large-scale production of monoclonalantibodies, In: Tolbert WR, Feder J (Eds), Large-Scale Cell Culture Technology,BK Lyndersen Hanser Publisher, Munich.
Savage C (2000), Scale-up and bioproduction, Genet. Eng. News, 20:1–69.Singh V (1999), Disposable bioreactor for cell culture using wave-induced agitation,
Cytotechnology 30:149–158.Tramper J, Smit D, Straatman J, Vlak JM (1988), Bubble-column design for growth of
fragile insect cells, Bioproc. Biosyst. Eng. 3:37–41.van Bonarius D, van de Wouw G, Tramper J (1993), Effect of silicone antifoam
on shear sensitivity of hybridoma cells in sparged cultures, Biotechnol. Progr. 9:
Bioreactors for animal cells 257

504–509.van Wezel AL (1967), Growth of cell-strains and primary cells on micro-carriers in
homogeneous culture, Nature 216:64–65.Velez D, Reuveny S, Miller L, MacMillan JD (1987), Effect of feeding rate on
monoclonal antibody production in a modified perfusion-fed fermentor, J. Im-munol. Methods 102:275–278.
Vıctores S (2005), Seleccion y Caracterizacion de Lıneas de Mieloma NS0 Recombi-nante con el Fin de Escalado Productivo, Final-year Project in ChemicalEngineering, ISPJAE, Cuba.
Vits H, Hu WS (1992), Fluctuations in continuous mammalian cell bioreactors withretention, Biotechnol. Progr. 8:397–403.
Wang MD, Yang M, Huzel N, Butler M (2002), Erythropoietin production fromCHO cells grown by continuous culture in a fluidized-bed bioreactor, Biotechnol.Bioeng. 77:194–203.
Wang Y, Ouyang F (1999), Bead-to-bead transfer of Vero cells in microcarrier culture,Cytotechnology 31:221–224.
Wave Biotech (2006), Available at: http://www.wavebiotech.com (accessed November2006).
Weikert S, Papac D, Briggs J, Cowfer D, Tom S, Gawlitzek M, Lofgren J, Mehta S,Chisholm V, Modi N, Eppler S, Carroll K, Chamow S, Peers D, Berman P,Krummen L (1999), Engineering Chinese hamster ovary cells to maximize sialicacid content of recombinant glycoproteins, Nat. Biotechnol. 17:1116–1121.
Wu J, Goosen MFA (1995), Evaluation of the killing volume of gas bubbles in spargedanimal cell culture bioreactors, Enzyme Microb. Technol. 17:1036–1042.
Xie L, Wang DIC (1997), Integrated approaches to the design of media and feedingstrategies for fed-batch cultures of animal cells, Tibtech 15:109–113.
258 Animal Cell Technology

10Monitoring and control ofcell culturesAldo Tonso
10.1 Introduction
Animal cell cultures can be considered, in many ways, similar to culturesof microorganisms, such as bacteria, yeasts, and filamentous molds,presenting several common characteristics, for instance the major variablesto be monitored and controlled. However, there are some specific culturevariables that may require different strategies. This chapter presents thebasic concepts of bioprocess monitoring and control, with emphasis onthe specific requirements of the cultures of animal cells. This will startwith a description of the general goals of process monitoring and control,a description of the main variables involved, and finally, the most com-monly used control strategies.
It should be noted that developments in electronics and computerscience have contributed significantly to the improvement of monitoringculture systems and process control. However, there are still some areasfor further general improvement of cell culture bioprocess monitoring andcontrol, such as the estimation of cell concentration in real time. Severalbasic texts may supplement this chapter: Kilburn (1991), Schugerl (1991,2001), and Sonnleitner (2000).
10.2 Monitoring and control: basic concepts
Any process, industrial or laboratory-based, presents a series of importantvariables that represent its state. In the case of cell culture, there are thevariables related to the environment to which the cells are exposed, such astemperature, pH, dissolved oxygen, nutrients in the culture medium, andmetabolite concentrations, as well as those related to the cell itself, such asconcentration, average size, or the profile of intracellular enzyme activ-ities. In order to make meaningful decisions during a process it is desirableto have at hand the greatest amount of information available about thesevariables. At this point, it is important to define some concepts relative toprocess monitoring and control.
The first relates to the time the information is available. As an example,suppose we know that the glutamine concentration at a certain point ofthe culture was 0.23 g/L, obtained through a chromatographic run 1 weekafter the end of the culture. Such information is considered offline and canbe used if we study the influence of that substrate in cell growth or

product synthesis. However, if such information were available online, itcould be used in an automated system that could replace the nutrient lossby medium replenishment in a fed-batch process. This would ensure thatglutamine would not be depleted from the medium. In this case, we cansay that the variable glutamine concentration is being monitored in ‘‘realtime’’ (also called ‘‘online’’).
Another important concept is whether the acquired information comesfrom the process place itself, or from a sample that is removed and thenanalyzed. For instance, in the study of the degree of cell aggregation, if asample is removed from the culture, it goes through several manipulationsbefore its analysis (such as dilution) and it becomes possible that theobserved aggregation does not match that present in the culture. In suchcases, the ideal would be to observe the cells through a microscopeinserted inside the bioreactor. This would be called in situ, or ‘‘in its ownplace’’.
There are two basic reasons to have process information by monitoring:
(i) Better knowledge of the process itself, as part of research or in thesearch for cause and effect. For instance, when the pH is below acertain value, the growth of cells decreases. This knowledge is alsofundamental in the development of a model that would represent theprocess under study (see Chapter 8).
(ii) Use of certain information, in real time, to take some control action.For instance, based on the dissolved oxygen concentration at a certainmoment, it is possible to act on the aeration flow, to avoid limitationsto cellular metabolism.
Control refers to the actions taken in the process. A flow chart of atypical control loop is shown, using the temperature control of a bioreac-tor as an example.
As can be observed in Figure 10.1, information from the process (valueof the temperature measured by the sensor) arrives at the control loop,which defines it as a ‘‘closed loop.’’ This is the case for most controllersinstalled in bioreactors. If the decisions of a controller do not take intoaccount any of the monitored information of the process, it is called an‘‘open loop.’’ An example of an open loop is a fed-batch process, where it
�
Controller Actuator
Sensor
Process
�
Thermometer
PID BioreactorElectric
resistance
Measured
value
Error
Set-point
Figure 10.1
Flow chart of a typical control loop showing temperature control elements: adesired temperature value (set-point) is compared to the measured value by thethermometer (sensor) and, based on the error measurement, a signal to theelectric resistance (actuator) is generated by the controller, that will heat up thebioreactor (process).
260 Animal Cell Technology

is desired to keep a nutrient concentration at a certain level, but the flowrate of the nutrient feed is fixed beforehand (a priori). As there is noinformation from the process, that control system is not able to answer tothe behavior fluctuations of the cells during growth.
10.3 Particular characteristics of cell cultures
Animal cell cultures, either from mammalian or insect cells, show specificcharacteristics that differ from microbial cultures (bacteria, yeasts, andfilamentous molds). Among the characteristics that most interfere withmonitoring methodologies and process control (and that will be ap-proached with more detail in the present chapter), are the following.
(i) Slow growth, with specific rates around 10–20 times lower thanmicrobial cells. This has encouraged the development of bioreactorswith cell retention devices (see Chapter 11), where real-time estima-tions of cell concentration or nutrients are often necessary. Longercultures (of the order of several days) require more robust sensors(such as pH and dissolved oxygen) or the possibility of replacingelectrodes during the process. Also, any contamination has a greatereffect on the process, demanding more advanced sterility maintenancesystems.
(ii) Requirement of a solid support (substrata) for cells, in the case ofanchorage-dependent cell lines. This causes problems for the estima-tion of cell concentration.
(iii) Mechanical fragility because of the absence of a cell wall, which ispresent in most microbial cells. Animal cells are adapted to grow intissue structures, which provide mechanical support in vivo andwhich are lost in culture. As a consequence of the fragility, alternativemethods of oxygen transfer have been developed, such as bubble-freesystems (see Chapter 9). Such systems require a suitable strategy formonitoring and control of the variables involved in oxygen transfer.
(iv) The commonly used method of pH buffering by the manipulation ofthe bicarbonate/carbon dioxide concentrations. This alters the overallgas system control.
10.4 Main bioprocess variables
10.4.1 Temperature
Whatever the scale or method of culture (T-flask, Schott bottle, spinnerflask, or bioreactor), the temperature of the culture medium with whichthe cells are in contact is always a fundamental state variable, because itinterferes with growth and the production process. However, it is aprocess variable that is easy to monitor and control. On a small scale theculture flask is usually put in a thermostatically controlled incubator,where the measured value of a thermometer sends a sign to turn theheating on or off (‘‘on–off control’’). In bioreactors, there are equivalentsystems, as will be seen later. Usually, however, a resistance thermometersensor type is used (resistance temperature detector or RTD), the electric
Monitoring and control of cell cultures 261

resistance of which varies according to the temperature of its platinumsensor (Pt100), being typically 100 � at 08C and 123� at 608C.
The most common temperature control systems for cell culture are thefollowing:
(i) Heat blanket around the bioreactor, the electric resistance of whichcan be turned on or off as required to heat the system. In this case, theminimum culture temperature is limited by the room temperature,which can be a problem in cultures of insect cells (with optima around288C) in facilities without air conditioning.
(ii) Water-jacket reactor with a temperature sensor, which sends a signalto the controller that triggers an electrical heating element within thewater of the jacket (to increase the temperature) or open a solenoidvalve that allows the inlet of colder water to the circuit (to decreasethe temperature). In this case, the minimum temperature of culture islimited by the temperature of the water supply. If the water tempera-ture supply is not sufficiently low, a thermostatically refrigerated bathsystem can be used.
(iii) Water-jacket reactor with two temperature sensors, for the jacket andfor the culture medium. This is different from the control system in(ii) in that the control is made in a cascade, where the mediumtemperature controller (master) acts to send a set-point value to thejacket water temperature controller (slave). See Section 10.5.1(iii).
Typically, the process is set to control temperature to a value that resultsin high cell growth or production rate. Sometimes, however, a differenttemperature may be selected, which could result in a better qualityproduct or a respiration rate compatible with the oxygen transfer system(Chuppa et al., 1996). For some processes, a temperature shift batchculture may be desirable in which there are two controlled temperaturevalues, one for the growth phase and another for the production phase, inwhich the cell division is interrupted due to the low temperature (Fox etal., 2004).
10.4.2 pH
pH control systems in cell culture can be classified into four basic types, asfollows.
(i) Culture medium buffered naturally by the dissolved solutes. Thismay allow some pH variation during the culture and in which usuallypH electrodes are not used.
(ii) Culture medium buffered with sodium bicarbonate and carbon diox-ide gas. In this case, the flask is maintained in an incubator withcarbon dioxide gas control, and the concentration of Hþ. The pH willremain relatively constant in an acceptable range, due to the equili-brium:
CO2 þH2O $ H2CO3 $ Hþ þHCO3�
262 Animal Cell Technology

(iii) Controlled addition of CO2 in the gas sparged into the bioreactor(see Section 10.4.5), based on the signal of a pH electrode inserted inthe culture medium.
(iv) Controlled addition of an alkali solution (such as sodium hydroxide)and/or acid (such as hydrochloric acid) to the bioreactor vessel, basedon the signal of a pH electrode.
The most widely used pH electrode in cell culture is the silver/silverchloride electrochemical type with internal gel (that can be sterilized whenthe whole bioreactor is autoclaved), or the combined type (which can bepressurized during sterilization, to compensate the medium pressurizationand to avoid contamination of the sensor with culture medium) (Schugerl,1991).
In long duration cultures (several weeks), a retractable housing for pHand dissolved oxygen electrodes can be used. With the use of an internalchamber, the electrode can be removed from contact with the culturemedium and then recalibrated, repaired, or replaced. After re-installationin the chamber, it is sterilized with direct steam and afterwards re-entersin contact with the culture medium, without risk of contaminations(Sonnleitner, 2000).
There has also been an increase in the ability to measure the intracellularpH, by flow cytometry with pH-dependent fluorescence indicators (Oz-kan and Mutharasan, 2002) and nuclear magnetic resonance. There areseveral reports that relate the intracellular pH value to cell behavior,including metabolism, apoptosis, and specific growth rate (Cherlet andMarc, 1998). Such offline measurements help to interpret the physiologicalstate of the cells, but still cannot be used as control systems.
10.4.3 Dissolved oxygen
Probably the most important state variable for the process control is thedissolved oxygen concentration (DO) in contact with the cells. Because ofthe very low solubility of oxygen in water and in culture medium, around6–8 mg/L at cell culture temperature, it is clear that DO is a nutrient thatneeds to be supplied continuously to the culture medium, and that will beconsumed simultaneously with the carbon source in aerobic cultures(Henzler and Kauling, 1993; Moore et al., 1995).
There are several systems of oxygen transfer, but some are specificallyused in cell culture in agitated tanks: diffusion through liquid surface,direct sparging, microsparging, and diffusion through membranes.Although the specific respiration rate of animal cells is considerably lowerthan with microbial cells, it is important to supply oxygen with minimalpotential shear stress to the cells caused by agitation and by the rupture ofthe gas bubbles.
Nowadays, the most commonly used DO electrode is the polarographicthat employs an electrochemical method, through the reduction of mole-cular oxygen at the platinum electrode (cathode) generating electrons forthe silver oxidation at the silver/silver chloride electrode (anode). In thistype of sensor, it is necessary to impose an external voltage and theresulting current is measured and converted into dissolved oxygen concen-
Monitoring and control of cell cultures 263
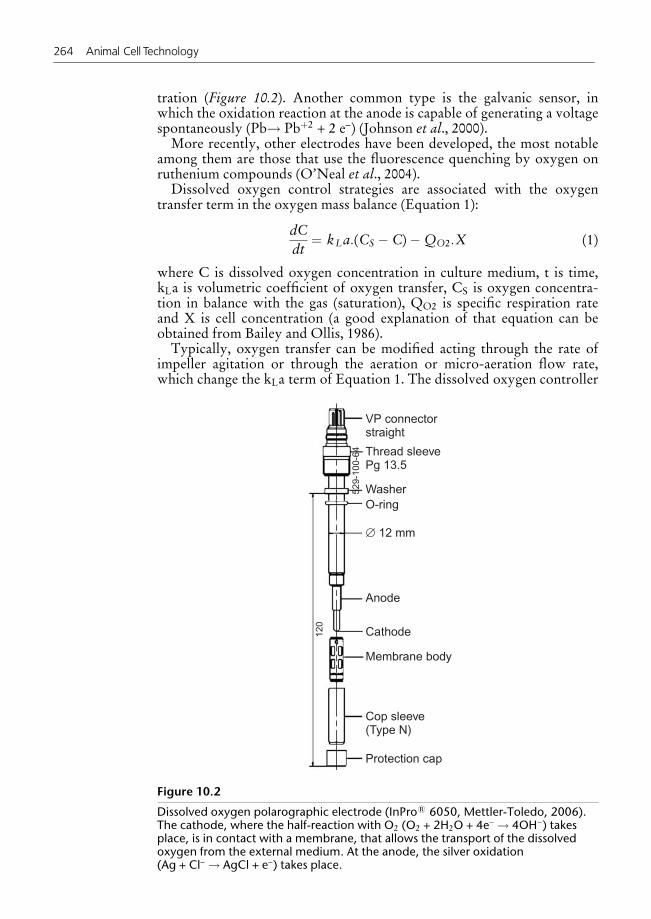
tration (Figure 10.2). Another common type is the galvanic sensor, inwhich the oxidation reaction at the anode is capable of generating a voltagespontaneously (Pb! Pbþ2 + 2 e–) (Johnson et al., 2000).
More recently, other electrodes have been developed, the most notableamong them are those that use the fluorescence quenching by oxygen onruthenium compounds (O’Neal et al., 2004).
Dissolved oxygen control strategies are associated with the oxygentransfer term in the oxygen mass balance (Equation 1):
dC
dt¼ kLa:(CS � C)� QO2:X (1)
where C is dissolved oxygen concentration in culture medium, t is time,kLa is volumetric coefficient of oxygen transfer, CS is oxygen concentra-tion in balance with the gas (saturation), QO2 is specific respiration rateand X is cell concentration (a good explanation of that equation can beobtained from Bailey and Ollis, 1986).
Typically, oxygen transfer can be modified acting through the rate ofimpeller agitation or through the aeration or micro-aeration flow rate,which change the kLa term of Equation 1. The dissolved oxygen controller
VP connectorstraight
Thread sleevePg 13.5
529-
100-
64
WasherO-ring
� 12 mm
120
Anode
Cathode
Membrane body
Cop sleeve(Type N)
Protection cap
Figure 10.2
Dissolved oxygen polarographic electrode (InPro1 6050, Mettler-Toledo, 2006).The cathode, where the half-reaction with O2 (O2 + 2H2O + 4e– ! 4OH–) takesplace, is in contact with a membrane, that allows the transport of the dissolvedoxygen from the external medium. At the anode, the silver oxidation(Ag + Cl– ! AgCl + e–) takes place.
264 Animal Cell Technology

can calculate new values for a set-point based on the agitation motor speedor the flow rate controller. A disadvantage of this control method is that itinterferes with the shear stress imposed by higher values of agitation oraeration, which can be particularly critical in animal cell cultures.
To avoid the above problem a system involving the control of a mixtureof two gases can be used, for instance, oxygen and nitrogen (Figure 10.3).The dissolved oxygen concentration value is controlled by acting on thetwo gas flow rates ratio, which varies the CS value and the oxygen transfer.In this way, it is possible to keep the agitation and the total gas flow rateadmitted into the reactor constant and, consequently, the kLa and thestress induced to the cell are also constant.
Alternatively, a membrane of material allowing oxygen diffusion can beused (usually silicone tubing, a microporous material, or polypropylene),avoiding bubble formation. If aeration is accomplished by a bubble-freesystem (see Chapter 9), using membranes or tubings made of materialsthat allow oxygen diffusion (e.g. silicone tubing or microporous mem-branes made of polypropylene), bubble formation is avoided. In thissituation, the transfer is not regulated by gas flow or agitation, but insteadby the partial pressure of oxygen, which is related to the internal pressurein the membrane and its gas composition and will determine the CS value(Qi et al., 2003).
An additional advantage of this DO control system is the possibility ofhaving a real-time estimation of the cells’ respiration rate. As can beobserved in Equation 1, if C is constant, the term of the transfer kLa.(CS-C) is equivalent to the consumption QO2.X. With the actuation value ofthe controller, the transfer rate can be calculated, and also the consumptionat each moment (Kamen et al., 1996). There are several reports in theliterature dealing with the use of respiration measurements to estimate cellconcentration online, based on the assumption that, during the growthphase, each cell consumes a constant amount of oxygen (Yoon andKonstantinov, 1994; Ruffieux et al., 1998; Jorjani and Ozturk, 1999).
10.4.4 Cell concentration
In every bioprocess, monitoring biomass concentration is fundamental,because usually the growth is required to be maximized. Substrate con-
Q2
O flow rate
controller2
N flow rate
controller2
C (%)
PC
C (%)
Q Q QT 1 2� �Q1
PC
Figure 10.3
Dissolved oxygen control by the adjustment of the oxygen fraction in the spargedgas. Its total flow rate is kept constant and corresponds to the sum of the twocontrolled gases Q1 and Q2.
Monitoring and control of cell cultures 265

sumption or product synthesis rates can be analyzed but it is importantthat variations in these parameters can be related to the cell concentration.For this reason specific rates are often used, such as the specific rate ofproduct formation:
�P ¼ 1
X:dP
dt(2)
where �P is the specific rate of product formation, t is time, X is cellconcentration, and P is product concentration.
For microbial cultures it is common to express cell concentration as drycell weight by volume, in animal cell cultures the number of cells per unitvolume is more commonly used (for instance, 1.33 106 cells/ml). For thedetermination of cell number a microscope graduated slide can be usedsuch as a hemocytometer or Neubauer chamber. In these, the thicknessbetween the slide and the coverslip is fixed and known (typically 0.1 mm)and graduation marks on the slide allow the number of cells to be countedin a certain area. The volume can be determined by multiplying this areaby the known thickness. With the aid of a dye (such as trypan blue), it ispossible to estimate cell viability. This is expressed as the percentage ofviable cells determined as those with an intact membrane capable ofexcluding the dye from inside the cell and so remaining colorless (seeChapter 2 and Freshney, 2005).
Although counting by hemocytometer is the most common method forthe determination of cell concentration, it does not allow any action to betaken during the culture process, because it is typically an offline measure-ment. When a real-time estimation is needed, it is common to use anindirect measurement, such as the optical density, or turbidity. It ispossible to correlate the absorbance measured by a sensor introduced intothe bioreactor with the cell concentration (Konstantinov et al., 1994; Wuet al., 1995; Olsson and Nielsen, 1997). Several sensors are commerciallyavailable for this function, notably those that measure reflected light(Aquasant AS81/44 and Metler FSC402) and transmitted light (ASR LaserTurbidimeter). Optical sensors can also be used for monitoring othervariables, even in small bioreactors (Kostov et al., 2001).
Other forms of online estimation of the cell concentration are:
(i) A microscope directly inserted into the culture medium, using imageanalysis software to evaluate cell concentration and size distributionfor each acquired image (Joeris et al., 2002; Gueza et al., 2004).
(ii) Capacitance measurement of the culture, that is correlated with theconcentration of viable cells. Each cell with an intact membranebehaves as a small electric capacitor (Dowd et al., 2003).
(iii) Fluorescence measurement of the medium. This is based on theassumption of a constant content of a fluorophor such as NAD(P)Hper cell.
As well as the estimation of the cell concentration, other parametersrelated to the biomass can be obtained. However, at present these arelimited to offline measurements. Among these are:
266 Animal Cell Technology

(i) Distribution of the size of the cells, based on the Coulter Counter1
(Beckman Coulter, USA) or similar equipment like Casy TTC(Innovatis, Germany), in which a dilute cell suspension flows througha capillary tube containing two electrodes. Each cell is detected by adisturbance in the electric current, the intensity of which is measured.In this way, not only are the cells counted, but size distribution isestimated, based on a precalibration relating the cell diameter to thedisturbance of electric intensity (Seewoster and Lehmann, 1997).Digital image analysis based on equipment such as Cedex (Innovatis)also provides offline cell size distribution estimation.
(ii) Flow cytometry is a method through which it is possible to countcells presenting certain characteristics (Davey and Kell, 1996; Brezins-ky et al., 2003). FACS (fluorescence activated cell sorter) is a variantof flow cytometry, in which besides counting each cell with certaincharacteristics (fluorescent), it is possible to separate them intosubpopulations with similar characteristics (Figure 10.4; see colorsection) (Herzenberg et al., 2000; Park et al., 2006).
10.4.5 Other variables of interest
Besides the variables previously mentioned, the following deserve to bediscussed.
(i) Partial pressure of dissolved carbon dioxide gas (pCO2). Carbondioxide is a compound present in the culture medium that can inhibitcell growth. In small-scale cultures (Schott or T-flasks), it is commonto keep the flask in an incubator with a controlled CO2 concentra-tion. Such control is made through a sensor (infrared spectrophoto-metry or thermal conductivity) and a valve that releases carbondioxide gas into the incubator. Through the presence of bicarbonatein the culture medium, it is possible to maintain a reasonably constantculture pH (see Section 10.4.2). In bioreactors, pCO2 can be con-trolled through the addition of CO2 to the sparged gas mixture. Cellgrowth inhibition will occur at very high or low pCO2. Therefore, itis desirable to maintain its value between 40 and 200 mmHg, depend-ing on the cell line. There are commercially available sensors designedfor pCO2, which can be sterilized and inserted into any bioreactorport, such as the InPro
15000, with the principle of operation similar
to a pH electrode (Mettler-Toledo, 2006). In the literature there arereports of sensors based on other technologies (Pattison et al., 2000).
(ii) Metabolites can be measured in real time, through techniques such asFIA (flow injection analysis) that allow online measurement of glu-cose and other substrates or products. In this system, a small flow ofculture medium is continuously pumped to a unit composed of atangential filter (for cell separation), injection pump, and detector(Reinecke and Stephanopoulos, 2000). Another possibility is to con-nect offline equipment to automated sampling systems (Figure 10.5),to provide information on the metabolite concentration for a controlsystem, for instance, for controlling the flow of fresh medium in afed-batch culture (Konstantinov et al., 1996; Ozturk et al., 1997). It is
Monitoring and control of cell cultures 267

also possible to estimate cell concentration, including those immobi-lized on microcarriers based on measurements of real-time substrateconsumption (Ducommun et al., 2001).
10.5 Strategies of control
10.5.1 Traditional control
There are several strategies to control a process variable. Among them, themost important are the following.
Bioreactor
Sanitizing agent
Online
sample
device
YSI
Glucose/lactate
analyzer
Process control
computer
Medium
Harvest
Weight
Figure 10.5
Feeding flow rate control system based on glucose concentration measured in real time (adaptedfrom Ozturk et al., 1997).
268 Animal Cell Technology

(i) On-off controller, in which the action can only assume two states (onor off). This controller is used, for instance, in incubators to keeptemperature in a small range. When the temperature sensor indicates avalue lower than set up, the system turns an electric resistance on,heating up its interior. In this situation, it is not possible to take anaction larger or smaller, that means, it is warming up or it is not.
(ii) Controller modulated by pulse width (pulse width modulation orPWM). In this control type, the action is also on or off but the timethat the actuator stays on within a certain cycle can be adjustedcontinuously, allowing a final operation of different intensities. Fre-quently the pH control in bioreactors uses this strategy. The greaterthe difference between the pH set-point and the measured value, thelarger would be the fraction of the cycle (usually a few seconds) inwhich the base pump is on, creating prolonged action within thecycle. This strategy prevents an exaggerated control action that wouldcause substantial deviation from the set-point value (called over-shoot). Some dissolved oxygen control systems operate this way,through the controlled mixing of different gases by the opening andclosing of solenoid valves.
(iii) Cascade controller, composed of one master and one slave loop. Thisis used when a more rigid control of a process variable is required, forinstance, the temperature of the culture medium. Here the action ofthe master controller (primary loop) to keep bioreactor temperaturecontrolled is simply to calculate the adequate value for the slavecontroller set-point, which takes action in the process (Figure 10.6).
(iv) PID or proportional integral derivative controller. This is the mostcommon system used in industry and the one that best keeps controlof the process variable. It is based on the principle that the action istaken not only on how large is the error (difference between desiredand measured values), but also on the sum of past errors (integral of
Controller
(slave)
Actuatorelectricheater
Controller
(master) Process
Sensor
(slave)
jacket
temperatureSensor
(master)
culture
temperature
Set-point
process
Slave (secondary) loop
Set-point
jacket
Figure 10.6
Cascade control. The actuator of the slave controller (electric heater) maintains the temperature ofthe jacket water controlled in a value set by the master controller.
Monitoring and control of cell cultures 269

the error) and to the rate that the error is changing (derivative of theerror). Mathematically it can be expressed as in Equation 3:
actuation ¼ P:errorþ I:
ðerror:dtþD:
d error
dt(3)
where actuation is the controller output (the value that goes to theactuator, according to Figure 10.1), error is the difference between thedesired value (set-point) and the one measured by the sensor, t is time andP, I, and D are constants that need to be adjusted for each system. Theadjustment of the constants for a process, that is, the algorithm todetermine the numeric values that will make the controller operate better,is called PID controller tuning. The most common procedure for this iscalled Ziegler-Nichols. For further details to tune a controller for a givenprocess, a textbook of process control is recommended (Seborg et al.,2003).
10.5.2 Advanced control
For chemical processes (without cells) several advanced control strategieshave been developed, some of which can be applied to bioprocesses and,especially, in animal cell cultures. Two of them are described below.
Adaptive control. When there are big changes during a process, acertain set of values of constants like P, I, and D, may not be adequate forthe whole culture. The controller may be tuned, for instance, to thebeginning of the culture, but not to the end. In this situation, thecontrolled variable may start to oscillate significantly, which can interferewith the process. For those cases, algorithms have been developed to tunethese constants during the process. Such a procedure is called adaptivecontrol (Diaz et al., 1996).
Control based on neural network. Similar to fuzzy logic modeling,neural network analysis uses a series of previous data to execute simula-tions of the process, with a high degree of success, without however usingformal mathematical models (Chen and Rollins, 2000). To this goal, it isnecessary to define inputs, outputs, and how many layers of ‘‘neurons’’will be used, which depends on the number of variables and the availabledata.
References
Bailey JE, Ollis DF (1986), Biochemical engineering fundamentals, 2nd Ed., McGraw-Hill, Singapore.
Brezinsky SCG, Chiang GG, Szilvasi A, Mohan S, Shapiro RI, MacLean A, Sisk W,Thill G (2003), A simple method for enriching populations of transfected CHOcells for cells of higher specific productivity, J. Immunol. Methods 277:141–155.
Chen VCP, Rollins DK (2000), Issues regarding artificial neural network modeling forreactors and fermenters, Bioprocess. Eng. 22:85–93.
Cherlet M, Marc A (1998), Intracellular pH monitoring as a tool for the study ofhybridoma cell behavior in batch and continuous bioreactor cultures, Biotechnol.Prog. 14:626–638.
Chuppa S, Tsai YS, Yoon S, Shackleford S, Rozales C, Bhat R, Tsay G, Matanguihan
270 Animal Cell Technology

C, Konstantinov K, Naveh D (1996), Fermentor temperature as a tool for controlof high-density perfusion cultures of mammalian cells, Biotechnol. Bioeng.55:328–338.
Davey HM, Kell DB (1996), Flow cytometry and cell sorting of heterogeneousmicrobial populations: the importance of single-cell analyses, Microbiol. Rev.60:641–696.
Diaz C, Dieu P, Feuillerat C, Lelong P, Salome M (1996), Simultaneous adaptivepredictive control of the partial pressures of dissolved oxygen (pO2) and dissolvedcarbon dioxide (pCO2) in a laboratory-scale bioreactor, J. Biotechnol. 52:135–150.
Dowd JE, Jubb A, Kwok KE, Piret JM (2003), Optimization and control of perfusioncultures using a viable cell probe and cell specific perfusion rates, Cytotechnology42:35–45.
Ducommun P, Bolzonella I, Rhiel M, Pugeaud P, von Stockar U, Marison IW (2001),On-line determination of animal cell concentration, Biotechnol. Bioeng. 72:515–522.
Fox SR, Patel UA, Yap MG, Wang DI (2004), Maximizing interferon-gamma produc-tion by Chinese hamster ovary cells through temperature shift optimization:experimental and modeling, Biotechnol. Bioeng. 85:177–184.
Freshney RI (2005), Culture of Animal Cells: A Manual of Basic Technique, 5th Ed.,Wiley-Liss, New York.
Gueza JS, Cassar JP, Wartelle F, Dhulster P, Suhr H (2004), Real time in situmicroscopy for animal cell-concentration monitoring during high density culturein bioreactor, J. Biotechnol. 111:335–343.
Henzler HJ, Kauling DJ (1993), Oxygenation of cell cultures, Bioprocess Eng. 9:61–75.
Herzenberg LA, De Rosa SC, Herzenberg LA (2000), Monoclonal antibodies and theFACS: complementary tools for immunobiology and medicine, Immunol. Today21:383–390.
Joeris K, Frerichs J-G, Konstantinov K, Scheper T (2002), In-situ microscopy: onlineprocess monitoring of mammalian cell cultures, Cytotechnology 38:129–134.
Johnson MJ, Borkowski J, Engblom C (2000), Steam sterilizable probes for dissolvedoxygen measurement, Biotechnol. Bioeng. 67:645–656.
Jorjani P, Ozturk SS (1999), Effects of cell density and temperature on oxygenconsumption rates for different mammalian cell lines, Biotechnol. Bioeng. 64:349–356.
Kamen AA, Bedard C, Tom R, Perret S, Jardin B (1996), On-line monitoring ofrespiration in recombinant-baculovirus infected and uninfected insect cell bior-eactor cultures, Biotechnol. Bioeng. 50:36–48.
Kilburn DG (1991), Monitoring and control of bioreactors, In: Butler M (Ed.)Mammalian Cell Biotechnology. A Practical Approach, Oxford University Press,New York, pp. 159–185.
Konstantinov K, Chuppa S, Sajan E, Tsai Y, Yoon S, Golini F (1994), Real-timebiomass-concentration monitoring in animal-cell cultures, Trends Biotechnol.12:324–333.
Konstantinov KB, Tsai Y, Moles D, Matanguihan R (1996), Control of long-termperfusion Chinese Hamster Ovary cell culture by glucose auxostat, Biotechnol.Prog. 12:100–109.
Kostov Y, Harms P, Randers-Eichhorn L, Rao G (2001), Low-cost microbioreactorfor high-throughput bioprocessing, Biotechnol. Bioeng. 72:346–352.
Mettler-Toledo (2006), Available at: http://www.mt.com (accessed 20 December2006).
Moore A, Donahue CJ, Hooley J, Stocks DL, Bauer KD, Mather JP (1995), Apoptosisin CHO cell batch cultures: examination by flow cytometry, Cytotechnology
Monitoring and control of cell cultures 271

17:1–11.Olsson L, Nielsen J (1997), On-line and in situ monitoring of biomass in submerged
cultivations, Trends Biotechnol. 15:517–522.O’Neal DP, Meledeo MA, Davis JR, Ibey BL, Gant VA, Pishko MV, Cote GL (2004),
Oxygen sensor based on the fluorescence quenching of a ruthenium compleximmobilized in a biocompatible poly(ethylene glycol) hydrogel, IEEE SensorsJournal 4:728–734.
Ozkan P, Mutharasan R (2002), A rapid method for measuring intracellular pH usingBCECF-AM, Biochim. Biophys. Acta 1572:143–148.
Ozturk SS, Thrift JC, Blackie JD, Naveh D (1997), Real-time monitoring and controlof glucose and lactate concentrations in a mammalian cell perfusion reactor,Biotechnol. Bioeng. 53:372–378.
Park JY, Lim B-P, Lee K, Kim Y-G, Jo E-C (2006), Scalable production of adeno-associated virus type 2 vectors via suspension transfection, Biotechnol. Bioeng.94:416–430.
Pattison RN, Swamy J, Mendenhall B, Hwang C, Frohlich BT (2000), Measurementand control of dissolved carbon dioxide in mammalian cell culture processes usingan in situ fiber optic chemical sensor, Biotechnol. Prog. 16:69–74.
Qi HN, Goudar CT, Michaels JD, Henzler H-J, Jovanovic GN, Konstantinov KB(2003), Experimental and theoretical analysis of tubular membrane aeration formammalian cell bioreactors, Biotechnol. Prog. 19:1183–1189.
Reinecke M, Stephanopoulos G (2000), Flow injection analysis for simultaneousquantification of prolactin concentration and glycosylation macroheterogeneity incell culture samples, Cytotechnology 34:237–242.
Ruffieux P, Stockar U, Marison IW (1998), Measurement of volumetric (OUR) anddetermination of specific (qO2) oxygen uptake rates in animal cell cultures,J. Biotechnol. 63:85–95.
Schugerl K (Ed.) (1991), Measuring, Modelling and Control, vol. 4, 2nd Ed., In: RehmHJ, Reed G (Eds), Biotechnology, VCH, Weinheim.
Schugerl K (2001), Progress in monitoring, modeling and control of bioprocessesduring the last 20 years, J. Biotechnol. 85:149–173.
Seborg DE, Edgar TF, Mellichamp DA (2003), Process Dynamics and Control, 2ndEd., Wiley, New York.
Seewoster T, Lehmann J (1997), Cell size distribution as a parameter for the predeter-mination of exponential growth during repeated batch cultivation of CHO cells,Biotechnol. Bioeng. 55:793–797.
Sonnleitner B (2000), Instrumentation of biotechnological processes, Advances inBiochemical Engineering Biotechnology, vol. 66, Springer, Berlin, pp. 1–64.
Wu P, Ozturk SS, Blackie JD, Thrift JC, Figueroa C, Naveh D (1995), Evaluation andapplications of optical cell density probes in mammalian cell bioreactors, Biotech-nol. Bioeng. 45:495–502.
Yoon S, Konstantinov KB (1994), Continuous, real-time monitoring of the oxygenuptake rate (OUR) in animal cell bioreactors, Biotechnol. Bioeng. 44:983–990.
272 Animal Cell Technology

Figure 2.4
Different morphology types observed in distinct cell lines. (A) Drosophilamelanogaster cell line S2; (B) Spodoptera frugiperda cell line Sf9; (C) adherentCHO.K1 cell line; (D) CHO.K1 cell line adapted to suspension growth; (E)hybridoma producing anti-TNP (trinitrophenol) monoclonal antibody. Bars inphotos (A) and (B) represent 50 �m. Photographs (C) and (D) were kindlyprovided by Rodrigo Coelho Ventura Pinto (Cell Culture Engineering Laboratory,COPPE, Federal University of Rio de Janeiro, Brazil), and photograph (E) was kindlyprovided by Rita de Cassia Paro Alli (Industrial Biotechnology Laboratory, IPT, SaoPaulo, Brazil).
Color Plates

Figure 7.3
Morphological changes in apoptosis and necrosis. (i) A viable nonapoptotic cell(A), in case of death by necrosis, undergoes a cell swelling process, followed bycell lysis and release of intracellular material (B). In case of apoptosis, chromatincondensation near the nuclear membrane (C) occurs and apoptotic bodies (D) areformed. A final stage, where the cell presents no chromatin (E), may also beobserved. Under in vitro culture conditions, a phenomenon known as secondarynecrosis occurs in the final stages of apoptosis. (ii) Fluorescence microscopy usingacridine orange and ethidium bromide allows identification of the different stagesof cell death: viable nonapoptotic cells (A), necrotic cells (B), viable apoptotic cells(C), nonviable apoptotic cells (D), and chromatin-free cells (E).
Animal Cell Technology

Figure 9.4
Internal surface of a 1000 L bioreactor for animal cell cultivation. It is also possibleto observe the three-blade impeller and the baffles, which are flat vertical partsattached to the internal bioreactor surface with the aim of avoiding vortexformation.
(A) (B)
Gas bubbling
Figure 9.5
Stirred-tank bioreactor with a bubble aeration system: (A) schematicrepresentation; (B) photograph of a 300 L bioreactor (CIM, Cuba).
Color Plates

(B)(A)
Figure 9.6
Wave bioreactor: (A) schematic representation; (B) photograph of a 500 Lbioreactor during a conference exhibition of the company Wave Biotech.
Figure 9.8
Photograph taken under an optical microscope of Vero cells growing onmicroporous microcarriers.
(B)Pump
Gas inlet
Exhaust gas
outlet
(A)
Figure 9.9
Fixed-bed bioreactor: (A) schematic representation including the externalrecirculation loop with an aeration tank; (B) photograph of a small-scalebioreactor.
Animal Cell Technology

(A) (B)
Figure 9.10
Fluidized-bed bioreactor: (A) photograph of a bioreactor commercialized by GEHealthcare; (B) operational scheme.
1202.004
R1
SS
C-c
ompl
exity
/gra
nula
rity
100
100
100
101
101
101
102
102
102
103
103
103
104
104
104
FSC-volume
1202.004
M1
FL1-eGFP intensity
Cou
nts
040
8012
0160
200
Histogram StatisticsFile: 1202.004Gate: G1Total Events: 10000
Acquisition Date: 02-Dec-04Gated Events: 9800
MarkerAllM1
Left,1,
17,
Right99108058
Events98008662
% Gated100.0088.39
% Total98.0086.62
Mean106.57119.70
CV99.5688.60
Median78.4488.17
Figure 10.4
Example of insect cell analysis that expresses the GFP (green fluorescent protein), through a FACSmachine. (A) The abscissa indicates the front dispersion (frontal scatter count, or FSC), that evaluatesthe cell volume (size), while the ordinate shows the lateral light dispersion of each cell (side scattercount, or SSC), that estimates the intracellular granularity (particles and intracellular organelles). Aseach cell is positioned in part of the dispersion, it is possible to quantify their subpopulations. (B) Thehistogram shows the distribution of the number of cells for each dispersed light intensity. If a limit isdefined, population fractions are established (reprinted by permission from Mariza A. Gerdulo dosSantos).
Color Plates

Figure 12.7
Optical microscope photo of Streamline-rPrA1resin, showing the adsorbent
particles composed of quartz and cross-linked agarose in different proportions.
t (min)
mAU
62.1
5
64.5
6
67.5
1
70.7
7
73.9
9
77.3
6
80.7
9
Figure 13.4
Capillary electrophoresis of purified rhEPO (recombinant human erythropoietin)protein. From left to right: isoform nos 2, 3, 4, 5, 6, 7, and 8 (according toEuropean Pharmacopea).
Animal Cell Technology

(A)
(B)
Auto-scaled chromatogram
Auto-scaled chromatogram
Minutes
Minutes
0.00
0.00
20.00
20.00
40.00
40.00
60.00
60.00
80.00
80.00
100.00
100.00
120.00
120.00
140.00
140.00
�0.10
�0.10
�0.05
�0.05
0.00
0.00
0.05
0.05
0.10
0.10
0.15
0.15
0.20
0.20
0.25
0.25
0.30
0.30
0.35
0.35
0.40
0.40
AU
AU
Figure 13.1
Peptide mapping. (A) Peptide mapping of the international standard of rhEPO(recombinant human erythropoietin) (BRP – European Pharmacopea). (B) Peptidemapping of an rhEPO production lot.
Color Plates

1 2 3 4 5 6 7
Figure 13.2
SDS-PAGE of purified rhEPO (recombinant human erythropoietin). Lanes 1–5:dilutions 1: 5 of product (25, 5, 1, 0.2, and 0.04 �g, respectively); lane 7:international standard (25 �g).
1 2 3 4 5 6 7 8
Figure 13.3
Isoelectric focusing of different samples of rhEPO (recombinant humanerythropoietin).The different profiles of isoforms are observed in the differentpreparations. Lane 3: international standard.
Animal Cell Technology

11Animal cell separationLeda dos Reis Castilho and Ricardo de Andrade Medronho
11.1 Introduction
After cell cultivation, a cell separation step is generally needed to processthe culture medium to purify the product. This step is performed either toobtain a cell-free medium for an extracellular product or to obtain a cellconcentrate if the product is intracellular. In animal cell cultures, theproduct is normally secreted. Thus, after cell separation, the product is insolution and can be processed by chromatographic techniques or otherprotein purification methods, as presented in Chapter 12.
When the culture is operated in perfusion mode (Chapter 9), theretention device may be placed inside or outside the bioreactor (Figure11.1). When the cell culture is operated in batch or fed-batch mode, thecell separation is conducted after the end of the cultivation period (Figure11.2). This is the first step of downstream processing.
Animal cell separation is far from a trivial task for many reasons.Animal cells have no cell wall. They are protected only by the cellularmembrane (lipid bilayer). For this reason, they present high sensitivity toshear stress. When cultivated in suspension, the cells tend to attach to thedevice walls, which may generate clogging problems. Their density is notmuch higher than water (1.06–1.14 g cm–3) and cell size is in the range of8–40 �m, which results in low settling velocities (Medronho, 2003). Forexample, Luebberstedt (2000) worked with HeLa cells with a density of1.06 g cm–3 and varying from 10 to 28 �m in size. Schultz (1996) foundBHK-21 cell sizes in the 11–25 �m range.
Spent medium
Perfusion withinternal device
Fresh
medium
Cell retention
device
Perfusion withexternal device
Fresh
medium
Spent medium
Cell retention
device
Figure 11.1
External (left) and internal (right) cell separation device in a perfusion culture.

The terminal settling velocity (v t ) of a spherical particle under laminarflow can be described by Stokes equation (Equation 1):
v t ¼ (rs � r)bd2
18�L
(1)
where rs and r are the particle (cell) density and the fluid (medium)density, respectively; b is the force field intensity (b ¼ g for a gravitationalfield or b ¼ ø2 r for a centrifugal field); d is the particle (cell) diameter; �L
is the fluid viscosity; g is the acceleration due to gravity (9.81 m s�2); ø isthe angular velocity; and r is the radial distance of the particle (cell) fromthe rotation axis.
Terminal settling velocities decrease with cell concentration. Therefore,for cell suspensions with concentrations higher than 1% by volume(around 6 3 106 cells mL–1 for cells with 15 �m diameter), the terminalsettling velocity given by Equation (1) should be corrected using Equation(2). This equation is valid under laminar flow (Stokes region):
v tc ¼ v t 1� cvð Þ4:65 (2)
where cv is the concentration by volume; v tc is the terminal settlingvelocity of the cell at a given concentration cv, and v t is the terminalsettling velocity of the cell given by equation (1).
This chapter describes the main unit operations employed for animalcell separation. These are gravity settlers, centrifuges, hydrocyclones,filters, and ultrasonic separators.
11.2 Separation efficiency
Monitoring the separation efficiency is an important way to evaluate theperformance of a given separator. The efficiency concepts described in thissection apply not only to animal cell separation, but also to the separationof any particles and bioparticles, such as microorganisms, cellular debris,nuclei, etc. These concepts apply to any separation device whose perform-ance remains constant if the operational conditions do not change. Thishappens, for instance, in gravity settlers, centrifuges, and hydrocyclones.
Batch cellculture
Cell retentiondevice
End of thebatch culture
Cell suspension
from the bioreactor
Extracellular
product
Cells
Figure 11.2
Cell separation device as the first step of the downstream processing in a batchculture.
274 Animal Cell Technology

Two kinds of separation efficiency may be defined when dealing withseparation devices: the total and the grade efficiency. The total efficiency isa global efficiency and the grade efficiency is the efficiency attained for agiven cell size. To obtain the grade efficiency it is necessary to know thecell size distributions. These distributions may be presented either asfrequency x or as cumulative distributions (undersize y or oversize z).Figure 11.3 shows the frequency plot (Figure 11.3A) and the cumulativeplots (Figure 11.3B) of HeLa cells cultivated in a stirred bioreactor, in aserum-free medium (Luebberstedt, 2000).
These three forms of presenting the cell size distribution are inter-related through Equations (3) and (4).
x ¼ dy
dd(3)
y ¼ 1� z (4)
(A)
0
5
10
15
20
25
Cell diameter ( m)µ
Cell diameter ( m)µ
Freq
uenc
y (%
)
(B)
0
20
40
60
80
100
Cum
ula
tive
dist
ribut
ion
(%)
yz
10
10
15
15
20
20
25
25
30
30
Figure 11.3
Cell size distribution of HeLa cells grown in serum-free culture medium(Luebberstedt, 2000), presented as (A) frequency and (B) cumulative undersize (y)and oversize (z) distributions.
Animal cell separation 275

A given separator has three main streams: the feed, which carries thecells to be separated, the stream concentrated in cells (underflow), and thediluted stream (overflow), containing the cells that the separator was notable to capture. These three streams are shown in Figure 11.4.
The total separation efficiency E is the cell fraction recovered in theconcentrated stream, as given by Equation (5).
E ¼ QCXC
QX(5)
where Q and QC are the flow rates and X and XC are the cell concentra-tions, as cell number per unit volume, of the feed and concentratedstreams, respectively.
The fluid fraction discharged in the concentrated stream is known as theflow ratio R f . For diluted suspensions like the ones usually found in cellcultures, R f may be expressed by Equation (6). Some separators operatewith R f ¼ 0 and some with R f . 0. Because the fluid leaving the separatorin the concentrated stream drags some particles with it, these particles areseparated not due to the separation power of the separator but due to thedrag force. This bypass is normally considered to be equal to the flow ratio(Medronho, 2003). Hence, R f also represents the lowest separation effi-ciency at which the separator will operate.
Rf ¼QC
Q(6)
The reduced total efficiency E9 (Equation 7) is normally used forseparators that operate with R f . 0. This gives the separation efficiency ofthe particles that are separated in the concentrated stream only due to theseparating power of the separator. Therefore, E9 does not consider theparticles that reach the underflow due to drag.
E9 ¼ E� Rf
1� Rf(7)
Feed
, ,Q X y
Diluted
stream
Concentrated
stream
Q X yD D D, ,
QC, ,X yC C
Figure 11.4
Schematic drawing of a separator showing the flow rates Q, the cellconcentrations X, and the cumulative undersize distributions y.
276 Animal Cell Technology

Based on Equations (5), (6), and (7) and in material balances for theliquid and for the cells, it is possible to obtain Equation (8).
E9 ¼ 1� XD
X(8)
The definition of the grade efficiency (Equation 9) is similar to the totalefficiency definition, but it applies only to a given bioparticle size. Figure11.5 shows a typical grade efficiency curve:
G ¼ QCXdC
QXd(9)
where G is the grade efficiency, and XdC and Xd are the concentrations ofcells of size d in the concentrated and feed streams, respectively.
Based on Equations (3) and (5), it is possible to rewrite Equation (9) as:
G ¼ Ed yCd y
� �(10)
Particle size
Particle size
(A)
(B)
0
20
40
60
80
100
Gra
de e
ffic
ienc
y (%
)
0
20
40
60
80
100
Gra
de e
ffic
ienc
y (%
)
d50
d50
Figure 11.5
Grade efficiency curve for R f equal to 0% (A) and greater than 0% (B).
Animal cell separation 277

Equation (11) represents a global mass balance for the cells of diameter d.
QXd ¼ QCXdC þ QDXdD (11)
Based on Equations (9) and (11), it is possible to write:
G ¼ 1� QDXdD
QXd
� �(12)
Therefore, based on Equations (3) and (5):
G ¼ 1� 1� Eð Þ d yDd y
(13)
From Equation (11), it is possible to write:
QXd y
dd
� �¼ QCXC
d yCd d
� �þ QDXD
d yDd d
� �(14)
Dividing Equation (14) by QX and using Equation (10):
1
G¼ 1þ 1
E� 1
� �d yDd yC
� �(15)
Through Equations (10), (13), and (15), it is possible to obtain the gradeefficiency curve based on the total efficiency E and the size distributionsof two out of three streams (y, yD and yC).
The cell size that is separated with 50% grade efficiency (d50) is usuallyaccepted as the cut size (Figure 11.5). This is an indirect measure of theseparation power of a separator device. A better designed separator willgive a lower cut size. A high proportion of the cells smaller than d50 willleave the separator in the diluted stream while the majority of those greaterthan d50 will leave it in the concentrated stream.
For separators which operate with R f . 0, the grade efficiency curvedoes not start at G ¼ 0% (Figure 11.5B). This is because the separatoroperation always gives a minimum efficiency almost equal to the flowratio R f . The reduced grade efficiency G9 may be obtained in the sameway as the reduced total efficiency E9:
G 9 ¼ G� Rf
1� Rf(16)
A chart showing the reduced grade efficiency versus cell size starts inthe origin, and the cell size corresponding to 50% reduced grade efficiencyis known as the reduced cut size d950 (Figure 11.6).
Equation (17), obtained from Equation (10), shows that it is possible toestimate the total efficiency of cell separation when the curves of gradeefficiency and feed size distribution are known. Based on Equations (16)and (17), it is possible to obtain a similar result for the reduced totalefficiency (Equation 18).
E ¼ð10Gdy (17)
278 Animal Cell Technology

E9 ¼ð10G9dy (18)
If a separator, used as a cell retention device in a perfusion bioreactor, isoperating with E , 100%, some of the cells are lost in the perfusate. Insuch a situation, the apparent specific cell growth rate �ap is given byEquation (19).
�ap ¼1
X
dX
dt(19)
Equation (20) gives a global cell balance in a bioreactor of volume Voperating with a perfusion rate D and using a cell retention device thatgives a cell retention efficiency E.
VdX
dt¼ �V � 1� Eð ÞDV� �
X (20)
Based on Equations (19) and (20), it is possible to write:
�ap ¼ � � (1� E)D (21)
The maximum operational perfusion rate Dmax is thus just marginallylower than that which results in cell wash-out. Therefore, when workingwith Dmax, the cell loss in the perfusate is totally compensated by the cellgrowth. In this situation, the apparent specific cell growth rate �ap is zero.Hence, from Equation (21):
Dmax ¼ �
1� E(22)
Consequently, the maximum perfusion rate possible that can be used ina perfusion bioreactor is a function of both the specific cell growth rateand the cell retention efficiency.
0
20
40
60
80
100
Particle size
Red
uced
gra
de e
ffic
ienc
y (%
)
d�50
Figure 11.6
Reduced grade efficiency curve and reduced cut size (d950).
Animal cell separation 279

11.3 Gravity settling
Cells are separated in a gravity settler due to the action of a gravitationalfield. This type of equipment operates with flow ratios greater than zero.As animal cells have low densities and diameters, their settling velocitiesare very low. For instance, the values in an aqueous medium at 378C are inthe 1–15 cm h–1 range (Castilho and Medronho, 2002). Therefore, theseparator settling area has to be large enough to avoid losing cells throughthe diluted stream, since it would decrease separation efficiency.
There are two main types of gravity settlers, the vertical and thelamellar (Figure 11.7). In the latter, a great number of inclined plates,named lamellas, are packed into the settler in a such a way that the platedistance is very small. Gravity drives the cells to settle over the lamellaimmediately below them. The cells slide down the plate to the bottom ofthe apparatus, forming a concentrated stream. Theoretically, the totalsettling area of a lamella settler is the sum of the surface area projection ofall lamellas in a horizontal plane. However, according to Svarovsky(2000), due to inefficiencies in the settling process, only around 50% ofthis area is really effective. Even so, this separator is much more compactthan a vertical settler, whose settling area is the cross-sectional area of itscylindrical part.
Gravity settlers are usually designed based on a desired 100% cellseparation efficiency. To obtain such efficiency, the terminal settlingvelocity of the smallest cell (v t,min) should be higher than the ascendingvelocity of the liquid (u). At the limiting condition (u ¼ v t,min), theminimum required settling area (Amin) will be given by Equation (23). Therecommended working area for the settler should then be three times thisminimum required settling area.
Amin ¼ QD
v t, min(23)
(B)
QC
XC
QD
XD
QX
QC
XC
QD
XD
QX
(A)
Figure 11.7
Settlers usually employed in cell separations: (A) vertical settler; (B) lamella settler(adapted from Henzler et al., 2003).
280 Animal Cell Technology

Settlers are simple devices and present no moving parts, facilitatingoperations under aseptic conditions. However, they present operationalproblems because of the high residence time of the cells in an environmentthat presents suboptimal conditions of oxygenation and temperature(Woodside et al., 1998). They also present difficulties for scale-up sincethe required settling area is directly proportional to the flow rate to betreated (Equation 23), which increases with bioreactor volume. Lamellasettlers are also prone to cell adhesion on the lamella surface. This problemmay be diminished by using a special coating on the plates or by installinga vibration system to vibrate the whole settler (Castilho and Medronho,2002). This implies an increase in the complexity of the device. Despitethese considerations, Henzler et al. (2003) have successfully employed alamella settler as the cell retention device in perfusion bioreactor systems.According to the authors, the high cell retention efficiencies obtained withtheir specially designed lamella settlers allow using perfusion rates as highas 15 d�1.
11.4 Centrifugation
Centrifugation is based on particle settling in a centrifugal field. Thiscentrifugal field is created when applying a centrifugal acceleration to asuspension, through a rotational movement. In a general way, particlesmore dense than the liquid will attain an outward radial movement andparticles less dense will attain an inward radial movement.
The main types of industrial centrifuges used for bioparticle separationsare the tubular, the multi-chamber, and the disc centrifuges (Figure 11.8).The disc centrifuge may have nozzles to allow continuous exit of theconcentrated suspension. The nozzles allow operation in a continuousmode, with R f . 0. Tubular and multi-chamber centrifuges operate withR f ¼ 0.
The settling velocity of bioparticles in centrifuges is given by Equation(1). In this equation, the angular velocity ø is in rad s–1. Equation (24)converts angular velocity expressed in rotations per minute (rpm) torad s–1.
ø½ �rad=s ¼�
30ø½ �rpm (24)
When expressing operational conditions of centrifuges, it is advisable togive the centrifugal acceleration (ø2R) rather than angular velocity (ø),since the latter does not properly describe the centrifugal field intensity,which is a function of the radius of the centrifuge rotor. Thus, it is usual touse the g-factor concept, also known as RCF (relative centrifugal force).This is obtained by dividing the bioparticle settling velocity under acentrifugal field by the bioparticle settling velocity under the gravitationalfield (Equation 25).
g-factor ¼ ø2R
g(25)
Animal cell separation 281

Centrifuges give high separation efficiencies for animal cells and may beused either in batch processes (Kempken et al., 1995; Tebe et al., 1997) oras cell retention devices in bioreactors operating in perfusion mode(Johnson et al., 1996; Takamatsu et al., 1996). However, centrifuges arecomplex devices, with moving parts, of relatively high cost, and the cellsare submitted to shear stresses that may reach relatively high levels.Bjorling et al. (1995) observed cell adhesion problems and clogging of theexit channels when using a disc centrifuge as a cell retention device in aperfusion culture.
In an attempt to eliminate some of these problems, a new centrifuge(Centritech
1) was specially designed for mammalian cell separation
(Johnson et al., 1996). This centrifuge operates with R f . 0 and generatesa centrifugal field intensity up to 320 g. It operates in a closed system andcontains a presterilized and disposable plastic insert, which eliminates the
(A) (B) (C)
Figure 11.8
Schematic drawing of centrifuges: (A) tubular, (B) multi-chamber, (C) disc centrifuge.
282 Animal Cell Technology

necessity for CIP (cleaning in place) and SIP (sterilization in place). Theavailable models may be employed for cell separation of batch processesdealing with volumes from 5 to 600 L, or in perfusion processes coupledto 5–3000 L bioreactors (Centritech
1, 2006).
11.5 Hydrocyclones
Hydrocyclones are very simple devices and always operate with a flowratio R f . 0. They may be easily designed to give a desired separationefficiency (Castilho and Medronho, 2000), and their performance may alsobe easily predicted (Coelho and Medronho, 2001). In the last few years, ithas been shown either theoretically or experimentally that hydrocyclonesmay be used in animal cell separations (Luebberstedt et al., 2000; Medron-ho et al., 2005; Elsayed et al., 2006; Pinto et al., 2007) aimed mainly atmammalian cell retention in perfusion bioreactors (Jockwer et al., 2001;Elsayed et al., 2005).
Hydrocyclones are similar to centrifuges in that they use cell settlingin a centrifugal field as the principle of separation. A hydrocyclone(Figure 11.9) consists of a conical section joined to a cylindrical portion,
Overflow
(diluted)
Underflow
(concentrated)
Feed
Vortex finder
Primary vortex
Secondary vortex
Figure 11.9
Perspective view of a hydrocyclone showing the liquid flow path.
Animal cell separation 283

which is fitted with a tangential inlet and closed by an end plate withan axially mounted overflow pipe, also called a vortex finder. The endof the cone terminates in a circular apex opening, called an underfloworifice.
The liquid flow path inside a conventional hydrocyclone is shown inFigure 11.9. The culture medium is pumped through the feed pipe andupon entry into the device, acquires a downward rotational movement(primary vortex) trying to leave the device through the underflow orifice.As this opening is not large enough, only part of the liquid is able toescape – carrying with it the larger cells, forming the concentrated stream.The fraction of liquid that is not able to leave the hydrocyclone throughthe apex opening reverses its movement, creating an upward rotationalmovement (secondary vortex), which finally leaves the device through theoverflow pipe (diluted stream) carrying the smallest particles, includingsmall cells and debris.
In spite of using the same separation principle, the main differencebetween a centrifuge and a hydrocyclone is that the latter does not havemoving parts. Therefore, hydrocyclones can cope well with the asepticoperations required by the biopharmaceutical industry. Apart from that,when separating cells, they do not require any maintenance during theirworking life. This means that they can be operated during very longperiods as cell retention devices in perfusion processes.
Pinto et al. (2007) reported that a hydrocyclone specially designed foranimal cell separations (Deckwer et al., 2005) was able to produce totalseparation efficiencies above 97% for CHO cells. The possible effects ofthe device on the cells were evaluated by different techniques, includingthe traditional viability measurement method based on trypan blueexclusion. Measurements of lactate dehydrogenase activity in the culturemedium to verify if this intracellular enzyme had been released to theextracellular medium due to cell lysis, indicated that the hydrocycloneeffect on cell viability was negligible. The concentration of apoptoticcells monitored by fluorescence microscopy showed that passing thecells through the hydrocyclone did not induce cell death by apoptosis.Moreover, the cell viability at the concentrated stream (97%) and at thediluted stream (82%) indicated that the hydrocyclone could selectivelyretain viable cells. This is highly desirable when conducting a perfusionprocess. This hydrocyclone specially designed for animal cell separationwas also evaluated on a pilot scale by Elsayed et al. (2005). Theseauthors, when using the hydrocyclone coupled to a 30 L bioreactoroperating in perfusion mode with HeLa cells, found cell viabilitiesalways above 93%. The same hydrocyclone was also tested on anindustrial scale by the authors of this chapter. In these tests, thebioreactor had a volume of 300 L and operated with NS0 cells produ-cing a monoclonal antibody (mAb) (unpublished data). The resultsconfirmed that the hydrocyclone was capable of promoting cell reten-tion in a perfusion system, which could be operated at high cell viabilitylevels (Figure 11.10A), and that the separation efficiency for viable cellswas higher than that for dead cells (Figure 11.10B). This confirmed thecapability of a hydrocyclone to selectively retain viable cells in thebioreactor.
284 Animal Cell Technology

11.6 Filtration
Filtration is a unit operation commonly employed nowadays in biotech-nological processes. In this unit operation, a filter medium acts as aphysical barrier to particles larger than its pores. Traditional filtrationdevices such as filter presses and rotary vacuum drum filters have so farfound no application for the separation of animal cells. Nevertheless,membrane filters are commonly employed, as well as some alternativefilter designs such as spin-filters. In the next sections, the most commontypes of filters used for animal cell separation will be discussed.
11.6.1 Tangential flow filtration with membranes
Tangential filtration is distinguished from conventional filtration, alsoknown as dead-end filtration, by the fact that the main flow is tangentialto the membrane surface (Figure 11.11). In dead-end filtration a fast dropin the permeate flux is observed due to cake formation over the filter
(A)
(B)
0.0E 00�
1.0E 06�
2.0E 06�
3.0E 06�
4.0E 06�
5.0E 06�
6.0E 06�
Time (h)
Cel
l con
cent
ratio
n (m
L�1 )
0
20
40
60
80
100
Cel
l via
bilit
y (%
)
X in the bioreactorX in the perfusateViability
0
20
40
60
80
100
Time (h)
Red
uced
tota
l eff
icie
ncy
(%)
Viable cellsDead cells
0
0
50
50
100
100
150
150
200
200
250
250
Figure 11.10
Results for a 300 L bioreactor operating in perfusion mode using a speciallydesigned hydrocyclone as a cell retention device.
Animal cell separation 285

medium, but in tangential filtrations this drop in the permeate flux is lessaccentuated. Therefore, in systems with adequate hydrodynamic condi-tions, tangential filters may operate continuously for relatively longperiods, under stable flux conditions.
In tangential filtration, membranes are used as filter media. Membranesare defined as barriers of reduced thickness, across which physical and/orchemical gradients are established to facilitate the preferential migration ofone or more components from a given mixture, promoting their separation(Klein, 1991). They are usually made of polymers or inorganic materials,such as ceramic or sintered steel. In the biopharmaceutical industry,membranes find various applications, such as production of water forinjection (WFI), sterilization of culture media, buffer solutions and gases,separation of cells and cell debris, and purification and concentration ofproteins.
Microporous membranes with nominal pore sizes in the 0.1–10 �mrange are usually employed in animal cell separation. Such membranes areable to retain the cells, but unable to retain solutes of low or high molarmass (Figure 11.12). Microfiltration uses a pressure drop, usually in the0.5–2 bar range, as the driving force to promote separation (Nobregaet al., 2005).
Two main types of membrane modules are normally employed foranimal cell separation: the plate-and-frame and the hollow-fiber modules.The latter type has as an important feature, a high packing density, whichresults in a high permeation area for a compact module. Both moduletypes may be used in cell separation in batch processes, and also inperfusion processes. The main characteristics of these two module typesare described in Table 11.1.
Tangential filtration of animal cell suspensions presents several advan-tages, such as easy scale-up, simple operation, and a permeate totally free
Permeate(A)
Feed
Permeate(B)
FeedRetentate
Figure 11.11
Schematic representation of dead-end filtration (A) and tangential filtration (B).
∆P SolventSolute with low molar massSolute with high molar massParticle
Figure 11.12
Schematic representation of a microfiltration process. The applied pressure drop(˜P) is usually in the range of 0.5–2 bar.
286 Animal Cell Technology

from cells, which allows, for instance, direct application of the permeate tochromatography columns. However, it also has some serious limitationsrelated to concentration, polarization and membrane fouling. The firstphenomenon is a reversible one and occurs due to the formation of aconcentration gradient of solutes on the membrane surface, at the begin-ning of the filtration process. Membrane fouling, however, is generally anirreversible phenomenon. It occurs due to membrane modifications causedby components present in the feed stream. These modifications arisemainly from adsorption of some molecules onto the membrane, depositionof suspended material onto the membrane surface and pore clogging bysuspended particles (Nobrega et al., 2005). These phenomena cause a dropin permeate flux and an increase in solute rejection with filtration time(Cheryan, 1998).
Tangential filtration was developed in an attempt to reduce the drop inpermeate flux, by the generation of high shear stresses on the membranesurface, which avoids material deposition and reduces progressive mem-brane clogging. However, when the suspension to be filtered containsanimal cells, the operating flow rate and, consequently, the shear stressgenerated need to be low because of the fragility of the cells. Differentstrategies have been proposed in the literature to reduce the progressivedrop in permeate flux. These strategies include periodic back-flushing, useof a pulsating feed flow, and coating the membrane with polyethyleneglycol to avoid cell and protein adhesion (Smith et al., 1991; Zhang et al.,1993). Even so, there are few published reports of perfusion processesemploying tangential filtration for long periods (. 20 days).
On the other hand, for cell separations at the end of a batch process,maintaining a high cell viability is a less critical issue than in perfusionprocesses, so that higher shear stress levels are acceptable. Moreover, thefiltration periods are never longer than a few hours. Thus, in batchprocesses the advantages of using tangential filtration are greater than itsdisadvantages.
11.6.2 Dynamic filters
The removal of particles accumulated on a filter medium is stronglyinfluenced by the shear rates generated on its surface (Serra et al., 1999;Silva et al., 2000). Therefore, most membrane modules try to avoidclogging by maximizing the shear rates (Belfort et al., 1994). However,this is not always possible in the case of animal cells, due to their shear
Table 11.1 Comparison between hollow-fiber and plate-and-frame modules
Characteristics Hollow-fiber Plate-and-frame
Internal diameter (�m) 40–500 –External diameter (�m) 80–800 –Membrane area/module volume (m2 m–3) 5000–10000 100–600Maximum operational pressure (bar) 100 (shell), 15 (fibers) 80
Adapted from Nobrega et al. (2005) and Rautenbach (1997).
Animal cell separation 287

sensitivity. Furthermore, in conventional tangential flow filtration, feedflow rate and shear rate levels are intrinsically coupled.
Dynamic filtration modules present a relative movement between themembrane and the module, or between the membrane and a rotor. Thus, itis possible to adjust the shear stress independently of the feed flow rateand of the transmembrane pressure drop.
Dynamic filtration modules are basically of two types: rotating discfilter (RDF) and vortex flow filter (VFF). In the latter, the filtrationmodule has a cylindrical shape and has a rotating concentric cylindricalmesh in its interior. The rotational movement of the internal cylindergenerates a Taylor-Couette flow in the annular gap (Roth et al., 1997),creating Taylor vortices that minimize concentration polarization andmesh fouling. Continuous perfusion processes based on this type of filterand operating continuously for up to 100 days have been reported(Mercille et al., 1994).
In RDFs, a disc-shaped rotor is located inside the module. By adjustingthe rotational velocity of the rotor, it is possible to carefully control theshear stress levels according to the sensitivity of the cells being used.Therefore, RDFs have been successfully used to separate animal cells,mainly in batch processes (Kempken et al., 1997; Vogel and Kroner, 1999).
Castilho and Anspach (2003) have developed an RDF (Figure 11.13)specially designed for mammalian cell separation. These authors employedcomputational fluid dynamics (CFD) to optimize the filter geometry andalso to study the influence of rotor angular velocity on the shear stressgenerated in the device. This filter was successfully used as a cell retentiondevice for perfusion cultivation of CHO cells producing a mAb. It wasalso used in an integrated cell separation/product purification process,using affinity membranes containing protein A as ligand for antibodyadsorption (Castilho et al., 2002).
11.6.3 Spin-filters
Spin-filters are cell retention devices used almost exclusively in perfusionprocesses with animal cells. It is common to find reports in the literaturereferring to internal and external spin-filters. However, in this chapter thelatter have been classified as VFFs and as such were described in Section
Membranes
Membranes
FeedFeed
Filtrate
Filtrate
Retentate
Retentate
Figure 11.13
Rotating disc filter developed by Castilho and Anpach (2003).
288 Animal Cell Technology

11.6.2. The internal spin-filter consists of a cylinder with porous walls(normally a mesh), which rotates inside a bioreactor. It may be driven byan independent motor or may be fitted on the impeller shaft (Figure11.14). Culture medium is continuously removed through the mesh, undervacuum, while fresh medium is added at the same volumetric rate to thebioreactor.
Mesh fouling is the main problem associated with the operation of aspin-filter. As it is located inside the bioreactor vessel, it is impossible toexchange the filter under sterile conditions once it has clogged. When thishappens, the culture must be terminated.
Apart from fouling, cell retention efficiency is another important factorto be considered. An efficiency within a range of 63–99% is normallyachieved when working with spin-filters (Castilho and Medronho, 2002).In reality, the mechanism of cell retention is not yet well understood. Thatis why spin-filter design and optimization of operational conditions arestill performed empirically. Cells are retained inside the bioreactor as afunction of several forces. The main forces involved are the centrifugal andlift forces, arising from spin-filter rotation, and the drag force due toculture medium removal through the spin-filter. However, the interactionsbetween those forces are not well understood. Thus, there are somereports of high retention efficiencies (99%) being achieved using spin-filters with a large mesh opening (127 �m) (Avgerinos et al., 1990), whileother authors found smaller efficiencies (75–95%) when using a meshopening of only 20 �m (Iding et al., 2000). These discrepancies show thenecessity of a better understanding of the fluid dynamics involved in cellretention using spin-filters. In this context, CFD may be a valuable tool tofacilitate this understanding (Castilho and Medronho, 2002; Figueredo-Cardero et al., in press).
11.7 Ultrasonic separation
Ultrasonic separators, also known as acoustic cell filters, use a planestanding-wave to retain cells in a bioreactor. Kilburn et al. (1989) were the
FiltrateFresh
medium
Figure 11.14
Schematic representation of a spin-filter fitted on the impeller shaft of a bioreactor.
Animal cell separation 289

first authors to report this possibility. Since then, many reports have beenpublished about their use at different scales and with different cells(Shirgaonkar et al., 2004).
The ultrasonic separation of cells occurs due to the forces that aregenerated in a plane standing-wave. These forces are the result of inter-actions between the cells and the fluid, and their magnitude is a functionof density and compressibility differences between the cells and the fluid.A plane standing-wave occurs as a result of the interference between twowaves of the same wavelength and amplitude traveling in opposite direc-tions. In such a situation, the cells are retained in pressure nodes (Figure11.15), forming cell aggregates. The device is operated in cycles, and itsperiodic shut-down allows the cell aggregates to settle back towards thebioreactor.
This type of separator has been used basically for cell retention inperfusion processes. It operates directly coupled to the top of a bioreactor.To maximize retention efficiency and cell viability when using it, differentoperational parameters should be optimized, such as cycle duration,perfusion and recirculation flow rates, acoustic force intensity, and theseparator backwash frequency (Shirgaonkar et al., 2004).
Gorenflo et al. (2005) employed an experimental design methodologyfor optimizing the operational conditions of an acoustic filter with a10 L d–1 capacity. They observed a high operational stability of the device,allowing for its use in long-term perfusion runs. Dalm et al. (2005) alsoinvestigated the long-term stability of a 200 L d–1 acoustic filter. Theauthors verified that the separator presented a simple and stable operationthroughout 75 days of perfusion cultivation of a hybridoma.
Several different cell lines have already been investigated in perfusioncultures using the acoustic cell filter. For instance, Shirgaonkar et al.(2004) used NS0, HEK-293, SP2-derived hybridoma, and insect cells indifferent serum-supplemented and serum-free media at different perfusionrates and acoustic chamber volumes. According to these authors, anadequate operation of the filter depends on optimization of operational
CS
HAV
R
CAP
C
FP piezoceramic
C glass
F polysulfone foil
AV active volume
R reflector
CA cell aggregates
CS cell suspension
H harvest (clarified fluid)
�
�
�
�
�
�
�
�
Figure 11.15
Schematic drawing of the acoustic cell filter employed by Groeschl et al. (1998).The pressure nodes are represented by dashed lines.
290 Animal Cell Technology

conditions and strategies. For instance, when working at high cell densi-ties, nutrient and oxygen depletion may occur during the period of timethe cells remain inside the separator. Another concern is the possibleclogging of the bottom part of the acoustic filter. Those authors developedan efficient recirculation and backwashing technique that avoids clogging.However, these techniques increase the complexity level of the acousticfilter operation.
References
Avgerinos GC, Drapeau D, Socolow JS, Mao J, Hsiao K, Broeze RJ (1990), Spin filterperfusion system for high density cell culture: production of recombinant urinarytype plasminogen activator in CHO cells, Bio/Technol. 8:54–58.
Belfort G, Davis RH, Zydney AL (1994), The behavior of suspensions and macro-molecular solutions in cross-flow microfiltration, J. Membr. Sci. 96:1–58.
Bjorling T, Dudel U, Fenge C (1995), Evaluation of a cell separator in large scaleperfusion culture, In: Beuvery EC, Griffiths JB, Zeijlemaker WP (Eds), AnimalCell Technology: Developments Towards the 21st Century, Kluwer Academic,Dordrecht, pp. 671–673.
Castilho LR, Anspach FB (2003), CFD-aided design of a dynamic filter for mammaliancell separation, Biotechnol. Bioeng. 83:514–524.
Castilho LR, Medronho RA (2000), A simple procedure for design and performanceprediction of Bradley and Rietema hydrocyclones, Minerals Eng. 13:183–191.
Castilho LR, Medronho RA (2002), Cell retention devices for suspended-cell perfusioncultures, Adv. Biochem. Eng. Biotechnol. 74:129–169.
Castilho LR, Anspach FB, Deckwer W-D (2002), An integrated process for mamma-lian cell perfusion cultivation and product purification using a novel dynamicfilter, Biotechnol. Progr. 18:776–781.
Centritech1
(2006), Product information. Available at: http://www.pneumaticscale.com/content/menus/psc/centritech_centrifuge.aspx (accessed March 2007).
Cheryan M (1998), Ultrafiltration and Microfiltration Handbook, Technomic Publish-ing, Lancaster.
Coelho MAZ, Medronho RA (2001), A model for performance prediction of hydro-cyclones, Chem. Eng. J. 84:7–14.
Dalm MCF, Jansen M, Keijzer, TMP, Grunsven WMJ, Oudshoorn A, Tramper J,Martens DE (2005), Stable hybridoma cultivation in a pilot-scale acoustic perfu-sion system: long-term process performance and effect of recirculation rate,Biotechnol. Bioeng. 91:894–900.
Deckwer W-D, Anspach FB, Medronho RA, Luebberstedt M (2005), Method forseparating viable cells from cell suspension, Patent US 6878545 B2.
Elsayed A, Piehl G-W, Nothnagel J, Medronho RA, Deckwer WD, Wagner R (2005),Use of hydrocyclone as an efficient tool for cell retention in perfusion cultures, In:Godia F, Fussenegger M (Eds), Animal Cell Technology Meets Genomics –Proceedings of the 18th ESACT Meeting (European Society for Animal CellTechnology), Kluwer Academic Publishers, Dordrecht, pp. 679–682.
Elsayed A, Medronho RA, Wagner R, Deckwer, W-D (2006), Use of hydrocyclonesfor mammalian cell retention – I. Separation efficiency and cell viability, Eng. LifeSci. 6:347–354.
Figueredo-Cardero A, Chico E, Castilho LR, Medronho RA (in press), CFD study ofthe fluid and particle dynamics in a spin-filter perfusion bioreactor, In: Hauser H(Ed.), Proceedings of the 20th ESACT Meeting (European Society for Animal CellTechnology), Springer, Dordrecht.
Gorenflo VM, Ritter JB, Aeschliman DS, Drouin H, Bowen BD, Piret JM (2005),
Animal cell separation 291

Characterization and optimization of acoustic filter performance by experimentaldesign methodology, Biotechnol. Bioeng. 90:746–753.
Groschl M, Burger W, Handl B (1998), Ultrasonic separation of suspended particles –Part III: Application in biotechnology, Acustica 84:815–822.
Henzler H, Kauling J, Schmitt F, Beckers E, Boedeker B, Von Hugo H, KonstantinovK, Naveh D (2003), Continuous high cell density fermentation unit for cultivatingsuspended animal or plant cell lines uses sedimentation separator of specificsurface area, Patent WO2003020919-A2.
Iding K, Lutkemeyer D, Fraune E, Gerlach K, Lehmann J (2000), Influence ofalterations in culture condition and changes in perfusion parameters on theretention performance of a 20 �m spinfilter during a perfusion cultivation of arecombinant CHO cell line in pilot scale, Cytotechnology 34:141–150.
Jockwer A, Medronho RA, Wagner R, Anspach FB, Deckwer WD (2001), Use ofhydrocyclones for mammalian cell retention in perfusion bioreactors, In: OlssonEL, Chatzissavidou N, Lullau E (Eds), Animal Cell Technology: From Target toMarket – Proceedings of the 17th ESACT Meeting (European Society for AnimalCell Technology), Kluwer Academic Publishing, Dordrecht, pp. 301–305.
Johnson M, Lantier S, Massie B, Lefebvre G, Kamen AA (1996), Use of theCentritech
1lab centrifuge for perfusion culture of hybridoma cells in protein-free
medium, Biotechnol. Progr. 12:855–864.Kempken R, Preissmann A, Berthold W (1995), Assessment of a disc stack centrifuge
for use in mammalian-cell separation, Biotechnol. Bioeng. 46:132–138.Kempken R, Rechtsteiner H, Schafer J, Katz U, Dick O, Weidemeier R, Sellick I
(1997), Dynamic membrane filtration in mammalian cell culture harvest, In:Carrondo MJT (Ed.), Animal Cell Technology, Kluwer, Dordrecht, pp. 379–382.
Kilburn DG, Clarke DJ, Coakley WT, Bardsley DW (1989), Enhanced sedimentationof mammalian cells following acoustic aggregation, Biotechnol. Bioeng. 34:559–562.
Klein E (1991), Affinity Membranes – Their Chemistry and Performance in Adsorp-tive Separation Processes, John Wiley and Sons, New York.
Luebberstedt M (2000), Separation tierischer Zellkulturen durch Einsatz von Hydro-zyklonen, Diplomarbeit des Studienganges Biotechnologie der Technische Fach-hochschule Berlin, Berlin.
Luebberstedt M, Medronho RA, Anspach FB, Deckwer W-D (2000), Abtrennungtierischer Zellen mit Hydrozyklonen, Chem. Ing. Tech. 72:1089–1090.
Medronho RA (2003), Solid-liquid separation, In: Mattiasson B, Hatti-Kaul R (Eds)Isolation and Purification of Proteins, Marcel Dekker, New York, pp. 131–190.
Medronho RA, Schutze J, Deckwer W-D (2005), Numerical simulation of hydrocy-clones for cell separation, Latin Am. Appl. Res. 35:1–8.
Mercille S, Johnson M, Lemieux R, Massie B (1994), Filtration-based perfusion ofhybridoma cultures in protein-free medium – reduction of membrane fouling bymedium supplementation with DNAse-I, Biotechnol. Bioeng. 43:833–846.
Nobrega R, Borges CP, Habert AC (2005), Processos de separacao com membranas,In: Pessoa A Jr, Kilikian BV (Eds), Purificacao de Produtos Biotecnologicos,Editora Manole, Barueri/SP, pp. 37–88 (in Portuguese).
Pinto RCV, Medronho RA, Castilho LR (2007), The effects of cell separation withhydrocyclones on the viability of CHO cells, In: Smith R (Ed.), Cell Technologyfor Cell Products – Proceedings of the 19th Meeting of ESACT (European Societyfor Animal Cell Technology), Springer, Dordrecht, pp. 745–748.
Rautenbach R (1997), Membranverfahren – Grundlagen der Modul- und Anlagenaus-legung, Springer Verlag, Berlin, pp. 60–77 (in German).
Roth G, Smith CE, Schoofs GM, Montgomery TJ, Ayala JL, Horwitz JI (1997), Usingan external vortex flow filtration device for perfusion cell culture, BioPharm.10:30–34.
292 Animal Cell Technology

Schulz C (1996), Einsatz eines Scherfilters zur Separation von Tierischen Zellen auskontinuierlicher Kultivierung, Diplomarbeit des Studienganges Biotechnologieder Technischen Universitat Carolo-Wihelmina, Braunschweig (in German).
Serra CA, Wiesner MR, Laine JM (1999), Rotating membrane disk filters: designevaluation using computational fluid dynamics, Chem. Eng. J. 72:1–5.
Shirgaonkar IZ, Lanthier S, Kamen A (2004), Acoustic cell filter: a proven cellretention technology for perfusion of animal cell cultures, Biotechnol. Adv.22:433–444.
Silva CM, Reeve DW, Husain H, Rabie HR, Woodhouse KA (2000), Model for fluxprediction in high-shear microfiltration systems, J. Membr. Sci. 173:87–98.
Smith CG, Guillaume JM, Greenfield PF, Randerson DH (1991), Experience in scale-up of homogeneous perfusion culture for hybridomas, Bioproc. Eng. 6:213–219.
Svarovsky L (2000), Gravity clarification and thickening, In: Svarovsky L (ed), Solid-Liquid Separation, Butterworth-Heinemann, Oxford.
Takamatsu H, Hamamoto K, Ishimaru K, Yokoyama S, Tokashiki M (1996), Large-scale perfusion culture process for suspended mammalian cells that uses acentrifuge with multiple settling zones, Appl. Microbiol. Biotechnol. 45:454–457.
Tebe H, Lutkemeyer D, Gudermann F, Heidemann R, Lehmann J (1997), Lysis-freeseparation of hybridoma cells by continuous disc stack centrifugation, Cytotech-nology 22:119–127.
Vogel JH, Kroner KH (1999), Controlled shear filtration: a novel technique for animalcell separation, Biotechnol. Bioeng. 63:663–674.
Woodside SM, Bowen BD, Piret JM (1998), Mammalian cell retention devices forstirred perfusion systems, Cytotechnology 28:163–175.
Zhang S, Handa-Corrigan A, Spier RE (1993), A comparison of oxygenation methodsfor high-density perfusion cultures of animal cells, Biotechnol. Bioeng. 41:685–692.
Animal cell separation 293


12Product purificationprocessesAngela Maria Moraes, Leda dos Reis Castilho,and Sonia Maria Alves Bueno
12.1 Introduction
The development of methods and techniques for the separation andpurification of biological macromolecules such as proteins has been aprerequisite for advances in bioscience and biotechnology during the lastfive decades.
The recovery and purification of a bioproduct is carried out to isolate itfrom its production system (cell culture, plant or animal tissues), and toobtain the required purity and formulation. Before establishing a strategyfor recovery and purification, it is essential to collect all available informa-tion related to the protein and to the medium where it is found. Usually,not only the theoretical information, but also preliminary experiments areneeded. It is also noted that the feasibility of a process on a laboratoryscale does not guarantee its feasibility on an industrial scale.
With the use of high performance materials and automated instruments,protein separation is becoming a more controllable process. However,some problems persist even with the use of sophisticated instruments.Many difficulties are still found in determining the optimal extraction andpurification conditions, as well as in selecting suitable methods for detect-ing the protein and quantifying its biological activity.
A general scheme of the recovery and purification process for abioproduct is shown in Figure 12.1. Despite the lack of a universalstrategy, some general directions (listed below) should be followed whenestablishing the purification protocol:
(i) choose separation methods based on different physical principles;(ii) choose methods based on physical properties related to the greatest
differences between products and impurities;(iii) first remove contaminants that are most dissimilar to the product
and/or those that are most abundant;(iv) assign the most demanding process to the end of the sequence.
12.2 Basic considerations
Before developing an isolation and purification process for a protein, someconsiderations should be made regarding the final application of theproduct, the most suitable source material and the available information

about the product, including existing data on manipulation and quantifica-tion (Harris and Angal, 1989).
From these preliminary data, the objectives and performance criteria ofthe purification sequence can be defined and, thus, the fundamental basisfor designing the most suitable strategy is established.
12.2.1 Final application of product
Usually protein purification represents the route for obtaining the productin a pure form, suitable for different applications such as: activity andstructural studies, studies of the structure–function relationship of theprotein, and its clinical or industrial applications. The purpose of theapplication determines the required purity of the protein, the acceptable
Solid–liquid separation
(cell extraction)
Cell disruption
Solid–liquid separation
(removal of debris)
Solid–liquid separation
(cell removal)
Bioreactor
Primary isolation
Intermediate purification
Final purification
Formulation
and packing
Intracellularproducts
Extracellularproducts
Figure 12.1
General scheme of a bioproduct recovery and purification process. The dottedarrows indicate integrated processes (see Section 12.4.6).
296 Animal Cell Technology
loss of activity, and also, the acceptable time and cost of the purificationprocess.
Therefore, for activity-related studies, relatively small amounts of pro-tein are needed and high purity is certainly not crucial, provided that theactivity-interfering species are removed. Cost in this case has relativelylow relevance, but speed is important to minimize activity loss.
Structural studies, on the other hand, require large amounts of highlypurified protein. Cost and time are of secondary importance, except instudies regarding structure–function relationship, for which maintenanceof biological activity is important and thus, the purification speed isimportant.
Purification cost and time are most relevant for industrial scale produc-tion. The required amounts and purity levels are determined based on thefinal application of the protein. For example, for therapeutic applicationshigh purity is crucial, but the required amounts are relatively small.
The amount of purified protein obtained depends not only on theamount of the raw material used, but also on the yield of the process. Atevery stage of the purification process, some product loss occurs. There-fore, to maximize the yield, a minimum number of stages should be used.However, decreasing the number of stages can affect the final purity of theprotein. Some purification methods give a higher yield than others andthus, a systematic selection should be made that is aimed at maximizingthe yield at each stage, but also insuring the required final purity isobtained.
The purity of the target protein can be expressed in terms of thepercentage of total protein, although other types of contaminants can alsobe important. For enzymatic studies, 80–90% of purity is usually suitable,not taking into account the activity-interfering contaminants, whichshould be removed. For structural studies, the required purity should beequal to or higher than 95%. For therapeutic applications, any type ofcontaminants should be removed and purity higher than 99.9% is oftenrequired.
Additional purification steps lead not only to additional yield losses, butalso to an increase in processing time and cost. For research purposes, theprocess scales are usually small and the cost of an additional step may notbe important. On the other hand, at an industrial scale, the introduction ofan additional step may make a purification process uneconomic. Removalof residual contaminants is, in most of the cases, significantly moredifficult than the earlier purification steps and involves several additionalsteps, reducing the final yield and increasing the processing cost and time.
In most cases, except for structural studies such as sequencing, thepurified protein should be as native and as active as possible. Attempts tominimize denaturation and proteolysis should be made, avoiding typicallyharsh conditions.
12.2.2 Selection of the protein source
As discussed in the initial chapters of this book, genetically modifiedanimal cells are commonly used to obtain proteins for therapeutic,prophylactic, or diagnostic applications. The problem is that obtaining
Product purification processes 297

bioproducts from animal cell cultures is limited by the low proteinconcentration observed in these systems, making the purification processdifficult and expensive. On the other hand, animal cells can secreterecombinant proteins into the extracellular medium, allowing easier andcheaper purification, as compared with heterologous proteins found asinsoluble intracellular aggregates in bacteria.
To facilitate the purification, the target biomolecule can be modified by,for instance, coupling to it a peptide segment that can be recognized andcaptured by an affinity ligand attached to a chromatographic matrix. Afterpurification, the inserted fragment can be removed by chemical or enzy-matic cleavage (Scheich et al., 2003).
The culture medium containing the bioproduct should be processed assoon as possible, to avoid the possibility of degradation, for example, byoxidation or the action of proteases. When immediate processing ofextracellular products is not possible, it is recommended to remove thecells and freeze the material, provided the bioproduct is stable to freezing.
12.2.3 Protein properties and manipulation
Knowledge of the physical and chemical properties as well as the cellularlocation of the target protein helps in designing the separation process.Whether the protein is intra- or extracellular, soluble or insoluble in thecytoplasm, bound to the cell membrane or located within the organelles,will affect the selection of the separation method and the type of bufferingsystem. Proteins bound to the cell membrane require detergents or organicsolvents for their solubilization.
Apart from the general problems of solution handling, protein solutionsshould be handled to prevent denaturation, aggregation, and degradation.Adequate cleaning and sanitization of all equipment is essential in themanipulation of such biomolecules.
12.3 Cell disruption
Bioproducts are usually secreted from animal cells in culture, and can bepurified after cell removal by solid–liquid separation techniques (seeChapter 11). However, the product can sometimes be found within thecell and this requires its extraction from the cellular mass, which containsnumerous molecular species that can have high viscosity and proteolyticactivity, which increases the difficulty of sample handling.
The extraction of an intracellular protein usually involves a compromisebetween recovery and purity. Optimization of the extraction conditionsshould maximize the release of the target protein, while minimizing thecontaminants, which may be difficult to remove. For this, it is importantto determine the conditions under which denaturation or degradationoccurs.
There are several available methods for disrupting cells or tissues. Theoperational conditions can be optimized through the systematic variationof parameters such as medium composition, time, temperature, stirringrate, and size and shape of the blades. Selection of a suitable procedure
298 Animal Cell Technology

demands preliminary tests in which aliquots of the sample are taken atdifferent time intervals and analyzed for product concentration andactivity.
The recovery of intracellular proteins involves distinct cell disruptionprocedures, depending on the cell characteristics. For the processing ofanimal cells, which do not have a cellular wall, mild and moderatetechniques are commonly used. Mild techniques include cell lysis byenzymatic digestion, chemical solubilization or autolysis and the use ofmanual homogenizers and grinders, whereas the moderate techniquesinvolve blade homogenizers and abrasive grinding.
When the protein is present within a cellular organelle, these methodscan still be suitable. However, they may be preceded by isolation of theorganelles. Sometimes, the protein has low solubility in the extractionmedium, and produces a particulate system requiring specific techniques.These proteins can be extracted through thermal, chemical, or enzymatictreatments, and in some cases detergents are needed for solubilization. Inany case, it is essential that a suitable solvent is selected for proteinextraction.
In all purification steps it is recommended that the pH of the proteinsolution is controlled, to avoid denaturation or deactivation of the targetbiomolecule. It is recommended that an operational pH condition in whichthe target protein presents maximum stability is determined, although thisvalue may be different from the optimal for protein extraction.
Several factors affect the selection of the buffer solution, such as: theoptimum pH; the buffer anionic or cationic species (which can interfere inthe subsequent purification steps); the pH variation with ionic strength ortemperature; the buffer reactivity with the proteins in solution; the bio-logical activity (e.g. phosphates can inhibit or activate a protein in bio-logical reactions); the interaction of the buffer with other components; thebuffer permeation in biological membranes; the toxicity; the light absorp-tion at 280 nm; the cost (especially if used in large-scale processes); and theprotein solubility.
In many cases the target protein is bound to membranes or particles oris aggregated as a consequence of its hydrophobic characteristics. In thesecases, detergents and chaotropic agents can be used to weaken theseinteractions during cell disruption and extraction steps. The detergentperformance is highly dependent on pH and temperature.
Intracellular proteins usually expose thiol groups, which can oxidizeduring the purification process. Such groups may be protected by reducingagents such as 1,4-dithiothreitol (DTT), 1,4-dithioerythritol (DTE), andmercaptoethanol. Usually, reagent concentrations of 10–25 nM are suffi-cient to protect the thiol groups without reducing the internal disulfidebonds.
The presence of metal ions may be harmful to a biologically activeprotein owing to two main factors; the increase in oxidation of the thiolgroups by molecular oxygen, and the complexation with specific groups.The chelating agent most commonly used to complex these metal ions isEDTA (ethylenediaminetetracetic acid) at a concentration of 10–25 nM.However, in some cases, application of metal ions such as calcium andmagnesium may be needed to stabilize certain proteins.
Product purification processes 299

The presence of proteases is a threat for protein stability. A simplestrategy for protection against proteolytic degradation is based on the fasthandling of the sample and use of low temperatures. One additionalprecaution is the addition of protease inhibitors, especially during disrup-tion and extraction steps. In some cases, there is a need for a combinationof inhibitors. Sometimes, pH adjustment is effective in inactivating pro-teases without affecting the stability of the protein product.
Despite being more critical for intracellular products, protease actionmay also occur in extracellular media. For example, in the expression of abaculovirus vector, which is a lytic system, proteases are often expressedand secreted during recombinant protein production, and the problemmay assume a critical level. A similar problem occurs in serum-free culturesystems. The absence of proteins such as albumin and macroglobulinreduces the protection against proteolysis. In these cases, addition of anantiproteolytic agent to the culture medium is recommended.
In order to avoid microbial growth in the protein solution during thepurification process, buffer solutions should be routinely sterilized byfiltration. Buffers such as phosphate, acetate, and carbonate at neutral pHare highly susceptible to microbial growth. Buffers with pH values lowerthan 3 or higher than 9 usually prevent bacterial growth, but can allowfungal growth. To circumvent such problems, it is recommended toproceed with the purification steps as fast as possible, always using freshand filtered buffers, storing solutions at 48C and, if possible, adding anantimicrobial agent to the buffer solutions.
12.4 Protein purification methods
After the extraction of the target biomolecule, purification is the next step.It is possible to select the entire sequence of purification steps for isolatinga particular protein based on its properties, and on the fact that everyprotein presents a unique combination of characteristics. A strategy shouldbe established to minimize the number of stages, leading to the maximumprotein yield, minimum cost, and the required purity for the product’sfinal application.
Table 12.1 shows the most commonly used purification techniques andrelated protein properties to provide separation. Every technique shouldbe evaluated with regard to different parameters such as:
(i) the capacity, i.e. the sample amount that can be handled;(ii) the resolution, i.e. how efficiently proteins are separated from each
other;(iii) the yield;(iv) the cost.
A balance should be made between process parameters and performanceexpectation of each purification stage. In the early stages, capacity and costare important parameters, whereas in the final stages, high resolution ismore relevant.
The sequence of stages in a purification process usually starts with lowresolution steps such as precipitation and liquid–liquid extraction, which
300 Animal Cell Technology

are low cost and allow the processing of large amounts of material andhigh total protein concentrations. In the intermediate steps, a combinationof chromatographic techniques is usually employed, followed by a finalpurification step focusing on the removal of product-related impurities(e.g. aggregates or isoforms) and/or those existing at very low concentra-tions. In this final stage, affinity chromatography and molecular exclusionare very usual processes.
The currently most relevant separation and purification techniques forprocessing biomolecules from animal cell cultures are discussed in thesections that follow. They are classified according to the protein character-istic on which the separation is based, such as solubility, molar mass,electrical charge, adsorption properties, and biological affinity for ligands.
12.4.1 Separation processes based on solubility
Protein precipitation
Precipitation is used as a separation step during the early stages of apurification process, usually followed by chromatographic separations,and also as a concentration method prior to an analysis or to a subsequentpurification step.
The solubility of a protein in an aqueous solution relies on the distribu-tion of the hydrophilic and hydrophobic groups on its surface. Proteinprecipitates are formed by the aggregation of protein molecules caused bychanges in pH, ionic strength, or solvent dielectric properties, as well as bythe addition of a miscible organic solvent, other inert solvents, and
Table 12.1 Characteristics of typical purification methods: properties on which separation isbased and their performance parameters
Principle ofseparation
Technique Capacity Yield Resolution Cost
Solubility Liquid–liquid extraction High High Low LowFractional precipitation High High Low Low
Size Microfiltration, ultrafiltration, dialysis High Medium Low LowMolecular exclusion chromatography Medium-low High Medium-low Medium
Electrical SDS-PAGE Very low High High Mediumcharge Electrofocusing Very low High High Medium
Ion exchange chromatography Medium Medium Medium Medium
Specificinteractionwith ligands
Affinity chromatography Medium-low Low Very high High
Surface Reverse phase chromatography Medium Medium High Highhydro-phobicity
Hydrophobic interactionchromatography
Medium Medium Medium Medium
Adapted from Wheelwright, 1991.SDS-PAGE, sodium dodecyl sulphate-polyacrylamide gel electrophoresis.
Product purification processes 301

polymers. Precipitation is based on the fact that proteins are electrolytesof high molar mass. The method is suitable for fractionation of proteinmixtures, since each protein is composed of different amino acids thatdefine its behavior. The precipitates can be recovered by filtration orcentrifugation, and the remaining traces of both the precipitating agentand the redissolved precipitate can be removed by dialysis, diafiltration, ordesalinization in a molecular exclusion column. Detailed reviews on thetopic are given by Scopes (1994) and Kumar et al. (2003).
The most widely used precipitation agents for protein purification areammonium sulfate and polyethylene glycol (PEG), which are discussedbelow.
Salting-in and salting-outNeutral salts have a pronounced effect on the solubility of proteins,especially if they are globular. At low concentration, salts increase thesolubility of many proteins in a phenomenon known as salting-in. Thissolubilization is a function of the solvent ionic strength, which depends onthe concentration and on the electrical charge of the cations and anionsthat constitute the salt. These effects are caused by changes in the ioniza-tion of dissociating groups of the protein.
However, as the ionic strength is gradually increased, protein solubilitybegins to decrease. At high ionic strengths, the protein may be precipitatedfrom the solution. This effect is known as salting-out. This phenomenonoccurs when a salt is added to a system and the ions are solvated by watermolecules displaced from the protein. Therefore, at high salt concentrationthe hydrophobic protein groups are exposed, enabling the formation ofhydrophobic interactions between the protein molecules, thus causingaggregation. Larger proteins or those with more available hydrophobicregions will aggregate faster and this can be the basis of fractionation. Theeffectiveness of the salt is largely dependent on the anion, multivalentanions being the most effective. The order of selectivity may be describedby the Hofmeister series (Ersson et al., 1998):
Anions: PO43– . SO4
2– . CH3COO– . Cl– . Br– . NO3– . ClO3
–
. I– . SCN–
Cations: NH4þ . Kþ . Naþ . C(NH2)3
þ
Ammonium sulfate is frequently used for protein precipitation, due toits high solubility in water, which allows the solvent to reach very highionic strengths. Usually, protein precipitates produced through salting-outdo not denature and the protein activity is easily recovered. Addition ofneutral salts can also protect proteins against proteolysis and microbialcontamination.
Precipitation with polymersPrecipitation of proteins by the addition of anionic or cationic polymersoccurs through the neutralization of charges and formation of high molarmass aggregates. Polymers commonly used for this purpose are carb-oxymethylcellulose and chitosan. Neutral polymers, such as PEG andmethylcellulose can also be employed. In such cases, the mechanism is
302 Animal Cell Technology

similar to precipitation with organic solvents, that is, by change in thedielectric constant of the medium, although at lower concentrations(around 20%). Higher concentrations result in viscous solutions, makingthe recovery of the precipitate difficult. Polymers used in protein precipi-tation are expected to:
(i) present reversible solubility response to medium changes in pH andtemperature;
(ii) form compact precipitates;(iii) have low cost; and(iv) be inert and nontoxic.
The polymer must have a high molar mass. PEG at a range of 6–20 kDais commonly used (Ersson et al., 1998). Precipitation with PEG was used,for instance, by Deml et al. (1999) as one of the purification steps for theisolation of hepatitis B virus surface antigen (HBsAg) from the insect cellculture supernatant of genetically modified DS-2 (Drosophila melanoga-ster Schneider-2) cells.
Liquid–liquid extraction
Extraction is based on the transfer of a solute from one phase to another,according to its partition properties between two immiscible phases. Inbiotechnological processes, the most widely used extraction is liquid–liquid involving the partitioning of biomolecules, organelles or cells be-tween the phases (Harrison et al., 2003).
In a bioprocess, two types of liquid–liquid systems are used. Whenmolecules are stable in organic solvents, as occurs with low molar massmolecules (such as antibiotics), the extracting liquid can be an organicsolvent immiscible with the aqueous phase originally containing the targetbiomolecule. However, in the case of proteins with a tendency to denatureor degrade in the presence of organic solvents, aqueous two-phase systemsare used (Franco et al., 2005). Such systems are usually formed by apolymer phase and a salt solution, or by two polymers, both soluble inwater but immiscible with each other. The most commonly used systemsare formed by PEG in one phase and a salt or other polymer (such asdextran) in the other. Under ideal conditions, the protein of interest isrecovered in the upper phase (usually PEG) and the contaminants andparticles (cells, fragments of cells, and organelles) in the lower phase(Ersson et al., 1998).
The partitioning coefficient K (equation 1) describes the distribution ofa solute, in equilibrium, between two liquid phases. This coefficient is afunction of several factors, such as the molecular size, pH, temperature,concentration, and type of components in both phases. In Equation (1), yand x are the solute concentrations in the extract and in the originalsolution, respectively.
K ¼ y
x(1)
Ideally, K should be maximized with a minimum volume of the extract-ing phase. Partition coefficients close to 1 implicate in large solvent
Product purification processes 303

volumes and many consecutive extractions to achieve total recovery. Avalue of K close to zero, on the other hand, means that no extractionoccurs (Harrison et al., 2003).
Liquid–liquid extraction offers several advantages, such as low cost,high yield, ease of continuous operation, and scale-up. Also, in the case ofaqueous two-phase systems, the process would not cause degradation ofproteins, enzymes, virus, or organelles (Cunha et al., 2003; Harrison et al.,2003). Efficient extraction techniques can lead to a reduction in volume,providing not only purification, but also a concentration of the sample.They are suitable for processing cell suspensions, enabling an integrationof the solid–liquid separation and the primary purification stages and aconsequent reduction in the number of stages in the downstream proces-sing. However, resolution and purification factors are relatively low, com-pared with chromatographic techniques. Because of this, liquid–liquidextractions are often designed in the early stages of a purification process.Significant improvements in resolution can be achieved with the use ofaffinity ligands in one of the phases, although this can increase cost(Johansson, 1998).
12.4.2 Separation processes based on differences in molar mass
Proteins have high molar mass, the value of which differs from one proteinto another. This allows the use of simple methods to separate proteinsfrom low molar mass molecules, as well as to separate a specific proteinfrom others.
Density gradient centrifugation
Just like other techniques, centrifugation can be applied at different stagesin the downstream processing of a given protein. The main application ofcentrifugation in biotechnology (as seen in Chapter 11) is in the clarifica-tion of protein-containing suspensions, usually for the removal of cellsand cell debris, but also after flotation and precipitation operations.However, density gradient centrifugation or zone centrifugation widensthe range of possible applications of centrifugation by allowing theseparation of small bioparticles such as organelles and viruses, as well asproteins. In the most widely used method, a continuous density gradientof sucrose is prepared with a device that adds a concentrated solution ofsucrose to water, in decreasing proportions along a tube. In this way, themedium density is higher at the bottom of the tube, and the macromole-cules to be fractionated are applied on the top. After centrifugation, thedifferent proteins form bands or layers, according to their molar mass,shape, and density. Two consecutive centrifugation steps (the first usingCsCl and the second using sucrose) were employed by Deml et al.(1999), for purifying HBsAg from cell culture supernatant of geneticallymodified DS-2 cells.
304 Animal Cell Technology

Dialysis
Desalting or buffer exchanges are often required between purificationsteps. At the laboratory scale, the protein solution is placed in a tube of asemipermeable polymer membrane immersed in the desired buffer. Themembrane pore size determines the minimum molar mass of the com-pounds that are retained. Small molecules with a molar mass below themembrane cut-off will flow freely across the membrane until the osmoticpressure equilibrium is reached. Complete buffer exchange requires severalchanges of the dialysis liquid. The process should be carried out at atemperature around 48C, to avoid loss of activity.
In industry, dialysis is not widely used because it is slow and labor-intensive. Here, desalting and/or buffer exchange is usually performed bydiafiltration or molecular exclusion chromatography, which are discussedlater.
Microfiltration
The principle of microfiltration is the application of hydrostatic pressureon a microporous filter membrane, so that the pressure difference forcessolutes, water molecules, and particles smaller than the membrane poresize to flow across the pores, retaining and concentrating the largerparticles in the suspension.
Microfiltration membranes usually have a nominal pore diameter in therange of 0.1–10 �m. However, the membrane specification is not anabsolute parameter. The membranes usually present a pore size distribu-tion around the nominal value and the shape of the bioparticles candetermine whether they are retained or pass through the membrane. Themembranes are manufactured from polymers, such as Teflon
1, polyester,
PVC (polyvinyl chloride), Nylon1, polypropylene, polyethersulfone, and
cellulose, or from inorganic materials, such as ceramic and sinterizedstainless steel.
In microfiltration, the permeate flux increases inversely with the suspen-sion viscosity and proportionally to the applied pressure, provided thatthere is no membrane fouling (Belford, 1988; Ho and Zydney, 2000). Toaccelerate the process, it is possible to decrease the solution viscosity byincreasing the temperature, although not so much as to denature theprotein.
Microfiltration is widely used for the removal of cells and fragmentsfrom suspension. It is also used as a method of sterilization of solutions,and has the advantage of high efficiency, simplicity, compactness, andreliability.
Ultrafiltration
In ultrafiltration, water and other low molar mass molecules are forcedthrough a semi-permeable membrane by the application of high pressures(1–7 bar) or of a centrifugal field. This technique involves membraneswith pore diameters in the range of 1.0–20 nm, which are most commonlycharacterized and selected based on their nominal molar mass cut-off
Product purification processes 305

(MWCO), usually defined as the molar mass at which the membranerejects 90% of solute molecules. However, as in microfiltration, themolecular shape can affect permeability through the membrane pores. Forexample, a membrane with a nominal cut-off of 100 kDa, which does notallow globular molecules with a molar mass of 100 kDa to flow through,may allow fibrous molecules with higher molar masses to flow across thepores. As in microfiltration, the membrane pore size is not uniform, with anormal distribution around an average value.
A common problem of this technique is the gradual decrease inpermeate flux associated with membrane clogging or fouling, caused byadsorption or physical deposition of particles and/or macromolecules onmembrane pores. Fouling can be minimized by prior clarification (particu-late removal) of the feed solution, by the selection of operational condi-tions that minimize interactions between membranes and macromolecules,by the use of tangential flow, or by performing intermittent back-flushingoperations.
Diafiltration
Diafiltration consists of the application of microfiltration or, more com-monly, ultrafiltration membranes for solvent exchange. In diafiltrationsystems, schematically shown in Figure 12.2, the permeate is collectedcontinuously at the same rate at which fresh solvent is added, so thatundesirable solutes are removed in the permeate stream and the retentatevolume is kept constant. Although diafiltration is being increasingly used,especially on a large scale, a disadvantage is the generation of largevolumes of liquid effluents. For instance, in a system with a 100 m2
membrane operating at a permeate flux of 30 L m–2 h–1, a volume of9210 L of water is required to remove 99.99% of the salt present in aprotein solution (Harrison et al., 2003).
Permeate
Fresh
buffer
Feed
tank Diafiltration
module
Figure 12.2
General scheme of a diafiltration system.
306 Animal Cell Technology

Molecular exclusion chromatography
Molecular exclusion chromatography, also known as gel filtration, sizeexclusion chromatography, gel permeation chromatography, or simply gelchromatography, is another separation method based on differences inmolecular size.
In this method, molecules partition between a solvent (aqueous buffer)and a stationary phase of defined porosity. A protein mixture dissolved ina suitable buffer flows through a column packed with spherical porousparticles made of an inert material (usually a polymer or a gel). Thecolumn is equilibrated with a pre-selected buffer appropriate for sampleelution. The flow occurs by gravity or aided by a pump.
In a sample containing a mixture of molecules, the smallest permeate thematrix pores and follow a slow trajectory along the column axis and arecollected later forming the later chromatogram peaks. The largest mole-cules are excluded from the pores, migrating through the interstitial spaceand are, therefore, eluted earlier. The intermediate sized molecules maypartially penetrate the pores, allowing intermediate elution times.
Therefore, the molecules are eluted in the inverse order of theirmolecular size, as indicated in Figures 12.3 and 12.4, and the differences inthe elution times of different proteins are related to the fraction of poresaccessible to the solutes. Equations can be obtained that relate the fractionof pores of different dimensions, the gel structure, and the molecular sizeof solutes with so-called distribution coefficients.
The distribution coefficient Kd (Equation 2) is defined as the volumefraction of pores, in a stationary phase, which is effectively permeated by asolute of a given size. Vo is the interstitial volume of the porous medium,measured by the elution volume of a high molar mass solute that is totallyexcluded from the matrix pores. Ve is the elution volume of the product ofinterest. VS represents the total solvent volume within the pores, availablefor small solutes.
Kd ¼ (Ve � Vo)
VS(2)
Stationary phase
Molecules larger than the pores
Molecules with intermediate size
Molecules smaller than the pores
Figure 12.3
Schematic illustration of the separation principle involved in molecular exclusion chromatography.
Product purification processes 307

Since VS is difficult to measure, it is common to use an alternativedistribution coefficient, called Kav (Equation 3). In this approach, VS isreplaced by the difference between the total column volume (Vt ) and theinterstitial volume (Vo) of the column packed with the chromatographicmatrix (Ladisch, 2001; Moraes and Rosa, 2005).
Kav ¼ (Ve � Vo)
(Vt � Vo)(3)
For a given matrix, Kd or Kav can be plotted against the log of the molarmass of different solutes. For a given molar mass range, a linear relation-ship will be observed. Therefore, by applying to the column molecules ofknown molar mass, and similar shape and density, it is possible todetermine the molar masses of solutes present in a sample (Kumpalumeand Ghose, 2003; Moraes and Rosa, 2005).
Ideally, the column matrix should be inert with regard to the moleculesto be separated. If electrostatic or hydrophobic interactions occur betweenproteins and the stationary phase, it is recommended, respectively, toincrease or decrease the ionic strength of the liquid phase, otherwise partialadsorption of the protein may cause a delay in elution from the column.This would cause a longer elution time than that expected based on themolar mass.
V0 VtV -Vt 0
VS
Kav
Kd
0
0
0.5
0.5
1.0
1.0
High
molar
mass
Solute
that interacts
with the
resin
Low
molar
mass
Intermediate
molar masses
Figure 12.4
Elution profile of a mixture containing solutes of different molar masses and the variables used todescribe solute and matrix behavior (adapted from Ladisch, 2001).
308 Animal Cell Technology

The most commonly used matrices for molecular exclusion chromato-graphy are cross-linked polymer gels, such as agarose, dextran, andpolyacrylamide. Since dextran and agarose are biodegradable, they shouldbe stored in the presence of antimicrobial agents.
The selection of a gel matrix should take into account pH and tempera-ture stability, which should be compatible with the characteristics of thetarget protein. The selection of the most suitable gel should also take intoaccount the main goal to be achieved. If the process is intended to separateproteins from low molar mass solutes (, 5 kDa), a small pore size matrixis recommended, so that proteins are completely excluded from the porousmedium. Such a strategy is used for desalting samples.
Matrices composed of small particles have high resolution, since themolecular diffusion in the interstitial region is small and, therefore, peakbroadening is low. However, these systems are associated with low flowrates, since small particles result in larger pressure drops along the column.Because the application of high pressure can lead to particle deformationand, consequently, to bed compaction, particles that are large and rigid,capable of withstanding high flow rates, are commonly preferred for large-scale processes, even if they are associated with lower resolution.
In molecular exclusion chromatography, resolution is directly related tothe sample loading volume, since the higher the sample volume, the higherthe volume in which the protein is eluted. Usually, sample volume shouldbe 0.5–5% of the total bed volume. For volumes below 0.5% the samplebecomes too diluted, while volumes above 5% work well only formolecules with large differences in size. For desalting, due to the pro-nounced difference in the molecular size of the components, samplevolumes can reach up to 30% of the column capacity without a significantdecrease in resolution.
With regard to the total protein concentration in the injected sample, itshould be ensured that the ratio between the viscosity of the sample andthe eluent is not higher than 2. High viscosities can cause problems, suchas the occurrence of regions with distorted and irregular flow patterns.Hence, protein concentration in the loaded sample should ideally be in therange of 10–20 mg mL–1, although in some cases it can reach 70 mg mL–1.
Therefore, to achieve high resolutions in molecular exclusion chromato-graphy, it is common to use columns with large height-to-diameter ratios(in the range of 20–40), although at an industrial scale this can becomedifficult.
12.4.3 Separation processes based on differences in electricalcharge
Separation of proteins based on differences in their electrical chargedepends on their acid-base properties, which are mostly determined by thenumber and type of ionizable side groups in the peptide chain. Sinceproteins are different from each other with respect to their compositionand amino acid sequence, they also have distinct acid-base properties.Information on these properties allows a prediction of the behavior of agiven protein when exposed to an electrical field.
Product purification processes 309

The acid-base properties of proteins are exploited in two methods,electrophoresis and ion exchange chromatography. These are widely usedin the analysis and separation of protein mixtures.
Electrophoresis
Protein molecules are electrically charged at pH values different from theirisoelectric point (pI). As a consequence, they can migrate when exposed toan electrical field, at a rate dependent upon their electrical charge densities.
In the separation of proteins by electrophoresis, the sample is submittedto an electrical field, causing the electrically charged proteins to move inthe direction of the applied current. If the experiment is carried out insolution (free electrophoresis) and the proteins have different chargedensities, they will move with different velocities, allowing their separa-tion. In practice, the process is normally carried out in a gel matrix, insteadof in solution, and the gel can act not only as an inert support for theelectrophoresis buffer, but also, if desired, as an active material thatinteracts with the proteins.
A very popular electrophoretic technique is SDS-PAGE (sodium dode-cyl sulfate-polyacrylamide gel electrophoresis), used for separating proteinmolecules based on their molar masses, providing high resolution and alsoallowing the determination of the protein molar masses. In this method,the sample is pre-treated with the detergent SDS, which causes thedissociation of protein subunits and the complete unfolding of the poly-peptide chain, which interacts with SDS molecules forming elongated rod-shaped complexes. This provides identical charge/size ratios to all pro-teins, so that the migration velocity of the denatured proteins becomesdependent only on the molar mass.
Another version of electrophoresis, that is also very efficient for proteinseparation, is isoelectric focusing or electrofocusing. In this technique, aprotein mixture is submitted to an electrical field in a gel support, such aspolyacrylamide or agarose, with a gradient of increasing pH establishedfrom anode to cathode. Since the loaded proteins will be positivelycharged at pH values below their pI, and negatively charged at pH valuesabove their pI, a protein will migrate until it finds a location within the gelwhere the pH is the same as its pI (Laas, 1998).
Electrophoretic techniques have a number of practical advantages, suchas high resolution, equipment of relative simplicity and low cost, feasi-bility for multiple samples, high sensitivity, easy detection of specificmolecules, and availability of standards giving reasonably well definedbands. However, as a consequence of its low capacity, electrophoresis ismostly used for analytical purposes rather than as a preparative technique.More details on electrophoretic techniques are provided in Chapter 13.
Ion exchange chromatography
Among the chromatographic methods, ion exchange is the most com-monly used in protein purification, due to its simplicity for scale-up, wideapplicability, and low cost compared with other chromatographic meth-ods. Ion exchange of proteins involves their adsorption onto the charged
310 Animal Cell Technology

groups of a solid support, followed by their elution and concentration inan aqueous buffer of high ionic strength.
For the effective use of ion exchange for protein purification, thestationary phase should be able to bind to positively or negatively chargedproteins. There are two types of ion exchangers: anion exchangers (posi-tively charged matrix) and cation exchangers (negatively charged matrix).Low molar mass counter-ions are associated with the proteins, as well aswith the stationary phase. For protein binding onto the stationary phase,the counter-ions should be dissociated. The most widely used counter-ions are Naþ and Hþ in cation exchangers, and Cl– and OH– in anionexchangers.
The counter-ions can be arranged according to their intensity of inter-action with the other ionic groups at the same concentration. Conse-quently, a chloride would displace hydroxide ions as a counter-ion in ionexchange. The counter-ions are not permanently bound to an ionic group,but are in an equilibrium state, where continuous replacements take place.So, ionic groups can become free to bind a protein. The higher thecounter-ion concentration, the lower will be the probability of the ionicgroups being available for protein binding. Sometimes, before the ionexchange process, counter-ions should be replaced by others more suitablefor the specific application.
The support can be cellulose, agarose, dextran, silica, polyacrylate,polyvinyl, or polystyrene, among other resins. The most suitable matrixfor a given application is often selected based on data provided by themanufacturers.
The selection of the ionic functional groups of the support is based onthe strength of these groups, as listed in Table 12.2. The most widely usedfunctional groups are S, C, DEAE, and Q. The functional groups S and Qare a strong acid and a strong base, respectively. Their pK values arearound 1 and 14, respectively, and thus, they are completely ionized atpractically any pH. The functional groups C and DEAE are a weak acid
Table 12.2 Chemical groups used in ion exchange for protein purification
Formula Group
Strong anion exchangers–CH2N
þ(CH3)3 Trimethylaminomethyl (TAM)–C2H4N
þ(C2H5)3 Triethylaminoethyl (TEAE)–CH2N
þ(CH3)3 Quaternary amine (Q)Weak anion exchangers–C2H4N
þH3 Aminoethyl (AE)–C2H4N
þH(C2H5)2 Diethylaminoethyl (DEAE)Strong cation exchangers–SO3
– Sulfonate (S)–CH2SO3
– Sulfomethyl (SM)–C3H6SO3
– Sulfopropyl (SP)Weak cation exchangers–COO– Carboxy (C)–CH2COO– Carboxymethyl (CM)
From Ladisch (2001), Karlsson et al. (1998).
Product purification processes 311

and a weak base, respectively, with pK values around 4 and 10. For theweak groups, the prevailing pH affects the ionization, and the pK is usedas an indication of the adequate operational pH range. Therefore, to ensurea suitable ionization, the cation exchanger C is used at a pH above 6, andthe anion exchanger DEAE at a pH below 9.
Besides influencing the adsorbent ionizing groups, the pH also affectsprotein charge and stability. In practice, if the protein is more stable at apH below its pI, a cation exchanger is used, and conversely, if it is morestable at a pH above its pI, an anion exchanger is used.
Some adsorbents present a remarkably high density of ionic groups onthe surface, allowing multiple adsorption points, which require high saltconcentrations to promote elution, which may cause denaturation.
The aqueous buffers used in ion exchange should contribute to the ion/counter-ion dissociation. The buffer minimizes pH fluctuations, avoidingprotein denaturation. The selection of the most suitable buffer depends onthe type of the ion exchanger, on product stability, and also on theoptimum pH for maximum adsorption. An important requirement is thatthe buffer should not interact with the adsorbent and this is the reasonwhy the selected buffer, when charged, usually has the same charge as theion exchanger. Depending on the chromatographic step, adsorption orelution, the pH should be adjusted to promote protein adsorption or itsdisplacement from the matrix.
During adsorption, the pH should be adjusted to one unit above orbelow the protein pI, since larger differences result in a greater net chargeof the protein, and consequently, multiple adsorption points, requiringsevere conditions for elution. An ideal pH is suitable for adsorption at alevel which allows the elution to be performed only by a small pH change.
The buffer ionic strength determines the degree to which the ionicgroups of both the protein and stationary phase are blocked. Duringadsorption, the highest ionic strength that still enables adsorption of thedesired protein is used, whereas during elution, the lowest ionic strengththat promotes its desorption is recommended. If the ionic strength isexcessively low during adsorption, the protein will adsorb very strongly,making elution difficult. Keeping the ionic strength as high as possibleduring adsorption minimizes the adsorption of contaminants, and keepingit low during the elution minimizes the desorption of contaminants. Sucha strategy simplifies the elution step.
Once the optimum adsorption/desorption conditions are established,other issues should be considered, such as the need for matrix pretreatmentand the operational mode for adsorption and elution steps. Pretreatmentof the ion exchanger can involve, for example, the removal of fine particles,swelling, washing, or counter-ion replacement.
Adsorption can be carried out in tanks and in a batch system, as well asin chromatographic columns. Batch adsorption can be carried out in theearly purification step, allowing the processing of large product volumes,despite having a low efficiency. Column adsorption, on the other hand,presents limitations with regard to the flow rates, but gives better resolu-tion. There are two distinct methods of elution. The first method is thatprotein adsorbed on the static ion exchange matrix is completely eluted bya small volume of a strong eluent. This method is useful for the concentra-
312 Animal Cell Technology

tion of a protein present in a large sample volume. The second methodinvolves a dynamic ion exchange in which protein separation relies onrelative migration velocities along the column. In this case, there are threedistinct modes of elution:
(i) isocratic, employed for weakly bound proteins, resulting in largeelution volumes;
(ii) in steps, based on discontinuous and sequential changes of pH and/orsalt concentration;
(iii) gradient, based on continuous changes in the eluent composition (pHand/or ionic strength).
The protein concentration in the eluted fractions collected from achromatography column is frequently determined by measuring the absor-bance in the UV region (usually at 280 nm).
An advantage in ion exchange chromatography is that the matrix can beregenerated by the removal of bound contaminants and by the reconstitu-tion of the counter-ions, providing the matrix in the condition requiredfor a new protein adsorption cycle. If the support matrix is stored wet, it issusceptible to microbiological degradation, and the use of antimicrobialagents during storage is recommended.
12.4.4 Separation processes based on differences in hydrophobicity
The surfaces of proteins are mostly hydrophilic. Although the majority ofthe hydrophobic residues tend to be buried in the interior of the protein,some hydrophobic regions are also found on the surface (Voet and Voet,1995; Ladisch, 2001). The level of surface hydrophobicity differs from oneprotein to another, mainly as a consequence of the amino acid compositionand sequence. Difference in surface hydrophobicity is the propertyexploited in hydrophobic interaction chromatography (HIC) and reversephase chromatography (RPC).
In both chromatographic methods, the adsorbent contains hydrophobicgroups. However, in RPC adsorbent hydrophobicity is much higher thanthat in HIC (Eriksson, 1998). Therefore, in HIC the adsorbent is a weakhydrophobic phase, whereas in RPC it is a dense hydrophobic phase.
Hydrophobic interaction chromatography
The adsorbents used in hydrophobic interaction chromatography areusually polymer resins, such as reticulated agarose, derivatized withaliphatic groups such as butyl and octyl, or with aromatic groups, such asphenyl.
The tendency for protein binding to hydrophobic groups is oftenreduced in low salt concentrations. Therefore, to increase the hydrophobicinteraction intensity, high salt concentrations are used during equilibrationand sample application. Due to their effect on strengthening the hydro-phobic interactions, the most effective salts are those used in salting-outprecipitation, such as ammonium sulfate.
Product purification processes 313

For the selection of the operational conditions, it is recognized thathydrophobic interactions can be weakened by several factors, such as atemperature decrease, pH change, presence of organic solvents, non-ionicdetergents, and polyols such as PEG.
Usually, desorption is performed by means of a decreasing salt gradient,so that the solutes are eluted according to the increasing order of theirsurface hydrophobicity. The remaining proteins can also be eluted by theapplication of buffers with increasing concentrations of, for example,PEG. The operational conditions during the process are mild, since thesalts used in HIC exert a stabilizing effect on proteins (Ladisch, 2001).
HIC has a high adsorption capacity and provides high recoveries,making it a popular technique for large-scale applications (Kumpalumeand Ghose, 2003). A limitation, however, is the high cost of using largeamounts of salt. Its selectivity is not high, being lower than that of affinitychromatography. HIC is suitable when combined with ion exchange andmolecular exclusion chromatography steps (Maugeri Filho and Mendieta-Taboada, 2005).
Reverse phase chromatography (RPC)
Currently, the most widely used adsorbents in RPC are silica resins,containing a hydrophobic phase, usually octyl (C8), octyldecyl (C18),methyl (C1), or phenyl groups. Additionally, new adsorbents based onorganic materials such as methacrylate, polystyrene, and copolymers ofstyrene and divinylbenzene have been developed (Hearn, 1998).
Due to its high hydrophobicity, the adsorbent interacts strongly withproteins, requiring low salt concentration during the adsorption, andincreasing gradients of organic solvents, such as methanol, isopropanol,and acetonitrile, during elution (Harrison et al., 2003).
Despite being widely used in protein analysis, peptide mapping, and forpurification of low molar mass molecules, RPC is not often used forprotein purification on a large scale (Ladisch, 2001).
12.4.5 Separation processes based on specificity of ligands
Some proteins function through specific non-covalent binding to othermolecules, termed ligands. Ligands can be small molecules, such asenzyme substrates, or larger molecules, such as hormones. Protein inter-action with the ligand is determined by the size and shape of the ligand, aswell as by the number and distribution of complementary regions. Theseregions combine charged and hydrophobic portions, presenting othershort range interactions, such as hydrogen bonds.
Protein–ligand interaction, which is stereo-specific and consequentlypresents high affinity, can be used for the isolation of a given protein froma complex mixture. This provides a high degree of purification. The mostwidespread technique is affinity chromatography. Affinity ligands havealso been used to increase the resolution and the selectivity of othertechniques such as precipitation (Lali et al., 1998), liquid–liquid extraction(Johansson, 1998), and filtration assisted by macroligands (Romero andZydney, 2002).
314 Animal Cell Technology

Affinity chromatography
Affinity chromatography is an adsorption method based on the recogni-tion between a ligand immobilized on a solid matrix and a biomolecule tobe separated. The main difference between this method and other chroma-tographic techniques is the high interaction specificity between moleculesand stationary phase.
As shown in Figure 12.5, during the adsorption step interactions occurbetween the target biomolecule and the ligand located in the adsorbent
-
Elution
buffer
3. Elution
Sample
loading
1. Adsorption
Adsorption
buffer
Regeneration
buffer
4. Regeneration
Target
protein
2. Washing
Figure 12.5
Principles underlying affinity chromatography.
Product purification processes 315

pores, whereas the remaining molecules flow through the adsorbent with-out interacting. Next, in the washing step, a buffer (usually the same usedin the equilibration or adsorption steps) is pumped through the column,for the removal of molecules retained in the interstitial space or weaklyadsorbed by non-specific interactions. During the elution step, desorptionof the target biomolecule is promoted by changes in the medium (pH,ionic strength, etc.) intended to weaken the interactions between the ligandand the target biomolecule, or by the addition of counter-ligands with astrong affinity to the ligand or to the adsorbate. Finally, regeneration iscarried out by washing the column with a specific solution, to recover theadsorbent for its reuse in a new cycle.
Vijayalakshmi (1989, 2002) classifies the ligands used in affinity chroma-tography in two groups: biospecific and pseudo-biospecific. Biospecificligands interact with the target biomolecule through functional affinity,exactly as happens naturally, for example in antigen–antibody, glycopro-tein–lectin, and hormone–receptor interactions. Biospecific ligands pro-vide high specificity and high adsorption capacities, with possibilities ofachieving purification factors up to 1000-fold (Roper and Lightfoot, 1995).A common example of the application of biospecific ligands is thepurification of monoclonal antibodies (mAbs) from cell culture super-natants using protein A and G as the ligands (Castilho et al., 2002a;Rasmussen et al., 2005; Hahn et al., 2006). However, biospecific ligandsare usually high cost molecules with a fragile three-dimensional structure.The interaction can sometimes be so strong that adsorbate desorption isonly possible under drastic pH or ionic strength conditions.
Pseudo-biospecific ligands, such as metal chelates, amino acids, and dyesare simpler and less expensive molecules with a structural affinity tobiomolecules (group specificity). Since they have simpler structures, theycan be immobilized by stable, well defined chemical reactions to thechromatographic matrix. Their disadvantages are their lower specificity, ascompared with biospecific ligands. However, there are many examples ofmolecules obtained from animal cell cultures that have been successfullypurified using pseudo-biospecific ligands (El-Kak and Vijayalakshmi,1991; Atkins et al., 2005; Serpa et al., 2005; Kumar et al., 2006).
Due to the central role of the ligand in affinity chromatography, somefactors should be considered when selecting a ligand for the purification ofa protein:
(i) specificity: the ligand should be able to selectively recognize the targetprotein;
(ii) reversibility: the ligand should form a reversible complex with theprotein to be purified, and the complex should be resistant to thecomposition of the feeding stream or washing buffers, but easilydissociated during elution without denaturation;
(iii) stability: the ligand should be stable under the conditions employedduring immobilization and chromatography;
(iv) immobilization feasibility: the ligand should contain a functionalgroup suitable for covalent binding to the support, without affectinginteraction properties with the protein.
316 Animal Cell Technology

The interaction between the ligand (L) and the protein (P) to form thereversible complex (PL) can be described by:
P þ L> PL
where the dissociation constant, KD, is given by Equation (4):
KD ¼ P½ � L½ �PL½ � (4)
In general, in affinity techniques KD values are in the range of 10–8 to10–4 M, but the KD determined for free ligands can differ from thosedetermined for immobilized ligands. Many authors report their data interms of the association constant (KA), which is equal to KD
–1.After selecting the ligand, a suitable matrix should be chosen for its
immobilization. The effectiveness of an immobilized ligand can be depen-dent on the matrix structure. Different criteria are used to select the solidmatrix. The matrix should have high porosity and a suitable pore size, sothat the target protein can access the ligands immobilized in its interior. Itshould be chemically stable during activation, ligand coupling, adsorption,elution, and regeneration. The matrix should also be mechanically resistantand rigid to allow suitable mobile phase flow, and should tolerate widepH and temperature ranges. The matrix should have a uniform structure,possess high concentration of functional groups for ligand coupling, andshould not promote non-specific adsorption.
For a particular application, the relevance of these criteria may change.Widely used matrices are agarose and synthetic polymers also used in ionexchange and molecular exclusion chromatography. The ligand can becoupled to the solid matrix through spacer arms, especially when theligand is small and stereo hindrance can affect its interaction with thetarget protein. The length of the spacer molecule is important and, also,it should have reactive ends enabling its coupling to the matrix and tothe ligand. The spacer molecule should not interact with proteins andshould preferably be hydrophilic. The coupling of a ligand to a matrixby means of a spacer arm is based on two general procedures, describedin Figure 12.6.
Once a suitable matrix is obtained, with the ligand coupled to it, andproperly characterized with regard to ligand concentration, the effective-ness of the protein–ligand interaction can be evaluated. A sample contain-ing the target protein is applied to the column, which is washed andevaluated for retained protein.
In affinity chromatography, there are several elution methods. Oneinvolves the elution by affinity based on the addition of high concentra-tions of a free ligand in the buffer. The eluted complex can later bedissociated by changing the buffer salt concentration or by the addition ofa surfactant that decreases hydrophobic and van der Waals interactions,such as a non-ionic detergent. Another possibility is elution based on highsalt concentration. In this case, non-hydrophobic interactions between theprotein and the immobilized ligand are broken, including biospecific ionicforces and other polar forces. Other elution methods are based on pH and
Product purification processes 317

temperature changes (lower temperatures weaken hydrophobic inter-actions) or on the addition of chaotropic agents.
A major concern in affinity chromatography is the release of the ligandfrom the matrix and its consequent loss in the column outlet stream. Thiscan happen due to instability of the ligand–matrix binding or to dissolu-tion of the matrix. Released ligands can contaminate the product anddecrease the adsorbent performance. This reduces the possibilities foradsorbent reutilization, which has an impact on process costs.
For washing and storing, the majority of adsorbents used in affinitychromatography can be regenerated with solutions of high salt concentra-tion (2 M KCl) and stored in the presence of antimicrobial agents.
Affinity chromatography offers several advantages over other types ofchromatography because of its remarkable levels of purification and highyields, which can come close to 100%, at least at laboratory scale (Walshand Headon, 1994). Because of its high selectivity, it allows the isolationof a molecule present in low concentration in a complex mixture, enablingthe processing of large solution volumes and desorption with reduced
*
*
(A)
� Activating
agent �Spacer arm � Ligand
Ligand
spacer arm
�
�Activating
agent
*
*
(B)
Figure 12.6
Alternative routes for the coupling of ligands to a matrix. (A) The spacer arm is coupled to the matrixand then the ligand is covalently attached to the support; (B) the spacer arm is first attached to theligand, and then it is attached to the matrix.
318 Animal Cell Technology

eluent volumes. This provides high purification and concentration factorsin a single step, in short times, and with high recoveries of biologicallyactive product.
12.4.6 Other developments
Expanded bed adsorption
Expanded bed adsorption (EBA) was derived from studies in the 1970s,aimed at carrying out chromatography techniques in fluidized beds(Kilikian and Santos, 2005). However, unlike fluidized beds, in an EBAcolumn the bed expansion is stable and predictable. This occurs becausethe adsorbent usually consists of hybrid particles of high density such asquartz, covered with a polymeric material such as cross-linked agarose towhich the immobilized ligands are attached (Figure 12.7; see color section).By manipulating the proportion of these two materials, an apparentdensity distribution in the range of 1.15–1.20 g cm–3 is obtained. Theparticles have a size distribution, usually in the range of 100–300 �m.When subjected to an ascending stream of the mobile phase, the particlessegregate within the column at different equilibrium positions, accordingto their sizes and apparent densities.
In EBA, it is common to characterize the column and adsorbent throughthe experimental determination of expansion curves, which show bedexpansion as a function of the superficial velocity of the ascending mobilephase. The degree of expansion is defined as the ratio between the height(H) of the expanded bed at a given superficial velocity, and the height ofthe packed bed (H0), before pumping the mobile phase. The expansioncurve of the adsorbent Streamline-rPrA in a Streamline Direct 24 columnis shown in Figure 12.8A. For the characterization of the adsorptionperformance of a column, breakthrough curves can be determined fordifferent superficial velocities (GE Healthcare/Amersham Biosciences,2002), and for different size columns, if scale-up is intended.
After adsorption, the column is washed with the bed still in theexpanded form, whereas elution is usually performed with the bed in thepacked form (Figure 12.8B), to minimize the elution volume, and thusachieving a high concentration factor for the target protein.
EBA is basically an operation mode that is suitable for different typesof chromatography, such as ion exchange, affinity, and hydrophobicinteraction. Its main advantage is that, due to bed expansion, it allows theapplication of cell suspensions, without loss in chromatography perform-ance (Anspach et al., 1999). Therefore, EBA allows the elimination of thesolid–liquid separation steps that usually precede a chromatographicprocess, reducing the number of downstream steps, with a decrease inprocessing time and an increase in overall yield. Such advantages, com-bined with purification and concentration factors that are adequate forprimary purification steps, explain why this technique has been usedincreasingly in recent years on laboratory as well as on an industrialscale.
Interesting results obtained on a pilot plant scale, for the direct purifica-tion of a mAb from 100 L of a hybridoma-containing suspension, were
Product purification processes 319

reported by Ameskamp et al. (1999). Examples of EBA applications in theindustrial processing of vaccines and recombinant proteins from CHOcells have also been reported in the literature (GE Healthcare/AmershamBiosciences, 2000). For the direct application of cell suspensions, it is
(B)
(A)
0
1
2
3
4
Superficial velocity (cm/h)
H/H
o7 rpm, without cells
14 rpm, without cells
17 rpm, without cells
14 rpm, with cells
0 100 200 300 400 500
Figure 12.8
(A) Expansion curve of the adsorbent Streamline-rPrA1, in a Streamline Direct 24
1
column, for different stirring velocities (located on the bottom of the column), inthe presence or absence of cells in the feed. H: height of the expanded bed;Ho: height of the packed bed. (B) Illustration of the adsorption step (left) inexpanded bed mode, and elution (right) in packed bed mode.
320 Animal Cell Technology

recommended to use a specific column equipped with a stirrer positionedat the bottom, which helps to prevent aggregation of adsorbent particlesand cells.
Membrane adsorbers
Membrane adsorbers derive from the technological developments in themembrane separation field and in column chromatography of proteins.They combine the high selectivity of chromatographic separations and thehigh productivity usually obtained in membrane separation processes.
It differs from conventional chromatographic adsorbents in that thesupport for ligand immobilization is composed of microporous mem-branes, usually polymeric, with a nominal pore size generally in the rangeof 0.4–3 �m. Depending on the nature of the immobilized ligand, themembrane is characterized as an ion exchange, affinity, or hydrophobicinteraction adsorber (Thommes and Kula, 1995; Charcosset, 1999; Hauptand Bueno, 2000; Klein, 2000; Bueno and Miranda, 2005). Like chromato-graphy with resin matrices, the selectivity of separation is determined bythe ligand–adsorbate pair and depends on pH, ionic strength, and tem-perature. Adsorption isotherms in Figure 12.9 show the differences pre-sented by a poly(sulfone) membrane containing the synthetic peptideTG19318 as the ligand, concerning the affinity for immunoglobulins (Ig)from different classes, in the presence of different buffers.
0
5
10
15
20
25
c* (mg/mL)
q* (
mg/
mL)
Human IgM, 50 mM Bis-Tris, pH 7
Rat IgG, 50 mM Bis-Tris, pH 7
Human IgG, 50 mM Bis-Tris, pH 7
Human IgG, 50 mM phosphate, pH 7.4
Human IgG, 100 mM phosphate, pH 7.4
0.0 0.5 1.0 1.5 2.0
Figure 12.9
Adsorption isotherms of human IgM, human IgG, and rat IgG using the membraneUltrabind-TG19318, in different buffers (Castilho, 2001). q*, equilibriumconcentration of Ig adsorbed onto the membrane; c*, equilibrium concentrationof Ig in the liquid phase.
Product purification processes 321

One of the major limitations in chromatographic processes carried outin packed columns with porous resins is the slow solute diffusion withinthe particles. The limiting step is the diffusion of the solute towards theimmobilized ligands located within the pores, which implies the use ofrelatively low flow rates (Brandt et al., 1988).
The use of microporous membranes as a chromatography matrix avoidsintraparticle diffusional limitations, since their pores, around two ordersof magnitude larger than those of conventional resins, are accessed mainlyby convection (Figure 12.10). This enables the operation at relatively highflow rates, with relatively low pressure drops. Additionally, membraneadsorbers present better mechanical resistance than gels, with no deforma-tion and bed compaction problems. Also, the systems are usually modularand easy to scale up (Klein, 2000; Bueno and Miranda, 2005).
One of the major advantages of membrane chromatography, similarlyto EBA, is the possibility for direct processing cell suspensions, enablingan integration of the clarification and primary purification steps. However,this is only possible by the use of membrane modules with suitablehydrodynamics, capable of effectively avoiding membrane fouling (Bel-ford, 1988; Castilho and Anspach, 2003).
Examples of integrated processes using affinity membranes are avail-able in the literature. Vogel et al. (2002) purified recombinant humantissue plasminogen activator (rhtPA) directly from a CHO cell suspen-sion, using L-lysine affinity membranes, achieving a yield of 86% and aremoval of 95% of contaminant proteins. Castilho et al. (2002b) pro-posed the use of protein A affinity membranes for an integrated perfu-sion process with simultaneous primary product purification. CHO cellsproducing an anti-HIV mAb were cultivated in a perfusion bioreactorcoupled to a rotating disk filter containing affinity membranes, whichpromoted not only separation and recycling of the cells to the bioreactor,but also product adsorption. Through periodic elution and regenerationcycles, the authors obtained, in only one step, a product with high purityand 14-fold more concentrated than in the bioreactor (Castilho et al.,2002b).
(A) (B)
ConvectionFilm diffusionPore diffusion
ConvectionFilm diffusion
Chromatography in
porous particles
Chromatography in
membrane adsorbers
Figure 12.10
Comparison of solute transport to the adsorption sites: (A) in conventional porousresins and (B) in membrane adsorbers. Adapted from Ghosh (2002).
322 Animal Cell Technology

12.5 Conclusions
Figure 12.11 shows the methods most commonly used as consecutive stepsin the downstream processing of bioproducts. Precipitation and ionexchange chromatography are commonly employed as the first step,whereas, for such processes composed of five steps, molecular exclusionchromatography is used predominantly as the last step. As shown inFigure 12.12, affinity chromatography is the technique with the highestpurification factor, followed by hydrophobic interaction chromatography.Despite being frequently used, precipitation has low selectivity andprovides a low purification factor.
Downstream processing has an important impact on the final productcost, in same cases reaching 90% of the total production costs(Cunha et al., 2003). There are many reasons for this, and one of them isthe high number of steps usually needed to achieve the required purity.Due to an inherent product loss in every step, the global yield of the targetprotein is usually low. The implementation of redundant steps for facilitat-ing process validation is an additional reason for the high costs of down-stream processing.
Therefore, in spite of the large availability of methods for the recoveryand purification of proteins, there is still a need for studies in this area,aiming to improve the existing techniques and to develop novel methodsto satisfy new demands. The optimization of the recovery and purificationprocess for a given bioproduct may involve conflicting objectivesand, therefore, a careful balance should be made of the advantages and
1 2 3 4 5
10
20
30
40
50
60
Precipitation Ion exchange Affinity
0
Freq
uenc
y (%
)
Molecular exclusion
Purification step
Figure 12.11
Frequency of use of different purification methods in processes composed of fivepurification steps. Estimates are based on the analysis of 100 articles ininternational scientific journals published from January 1992 to January 1994(adapted from Freitag and Horvath, 1996).
Product purification processes 323

disadvantages of every change/innovation proposed for a process. Moreextensive discussions on the topic presented in this chapter are available inJanson and Ryden (1998), Ladisch (2001), Harrison et al. (2003), PessoaJunior and Kilikian (2005), Scopes (1994), and Harris and Angal (1989).
References
Ameskamp N, Priesner C, Lehmann J, Lutkemeyer D (1999), Pilot scale recovery ofmonoclonal antibodies by expanded bed ion exchange adsorption, Bioseparation8:169–188.
Anspach FB, Curbelo D, Hartmann R, Garke G, Deckwer WD (1999), Expanded-bedchromatography in primary protein purification, J. Chromatogr. A 865:129–144.
Atkins E, Zamora S, Candia BJ, Baca A, Orlando RA (2005), Development of amammalian suspension culture for expression of active recombinant humanurokinase-type plasminogen activator, Cytotechnology 49:25–37.
Belford G (1988), Membrane modules: comparison of different configurations usingfluid mechanics, J. Membrane Sci. 35:245–270.
Bonnerjea J, Oh S, Hoare M, Dunnill P (1986), Protein purification: the right step atthe right time, BioTechnol. 4:954–958.
Brandt S, Golfe RA, Kessler SB, O’Connor JL, Zale SE (1988), Membrane-basedaffinity technology for commercial scale purifications, BioTechnol. 6:779–782.
Bueno SMA, Miranda EA (2005), Membranas adsortivas, In: Pessoa Junior A, KilikianBV (Eds), Purificacao de Produtos Biotecnologicos, Ed. Manole, Sao Paulo,Brazil, pp. 176–195.
Castilho LR (2001), Development of a dynamic filter for integrated perfusion cultiva-tion and purification of recombinant proteins from mammalian cells, Fortschritt-Berichte Series – Reihe 17 (Biotechnologie/Medizintechnik), VDI-Verlag, Dussel-dorf.
Ads
orpt
ion
to in
orga
nic
supp
orts
Pur
ifica
tion
fact
or
Ext
ract
ion
Pre
cipi
tatio
n
10
100
Aff
inity
chr
oma
tog
raph
y
Gel
per
mea
tion
chro
ma
tog
raph
y
Hyd
roph
obic
inte
ract
ion
chro
ma
tog
raph
y
Ion
exch
ange
chr
oma
tog
raph
y
Technique
Figure 12.12
Average purification factors achieved using different purification techniques(adapted from Bonnerjea et al., 1986).
324 Animal Cell Technology
Castilho LR, Anspach FB (2003), CFD-aided design of a dynamic filter for mammaliancell separation, Biotechnol. Bioeng. 83:514–519.
Castilho LR, Anspach FB, Deckwer W-D (2002a), Comparison of affinity membranesfor the purification of immunoglobulins, J. Membrane Sci. 207:253–259.
Castilho LR, Anspach FB, Deckwer W-D (2002b), An integrated process for mamma-lian cell perfusion cultivation and product purification using a dynamic filter.Biotechnol. Prog. 18:776–781.
Charcosset C (1999), Purification of proteins by membrane chromatography, J. Chem.Technol. Biotechnol. 71:95–110.
Cunha MT, Aires-Barros MR, Cabral JMS (2003), Extraction for rapid proteinisolation, In: Hatti-Kaul R, Mattiasson B (Eds), Isolation and Purification ofProteins, Marcel Dekker, New York, pp. 321–372.
Deml L, Schirmbeck R, Reimann J, Wolf H, Wagner R (1999), Purification andcharacterization of hepatitis B virus surface antigen particles produced in Droso-phila Schneider-2 cells, J. Virol. Methods 79:205–217.
El-Kak A, Vijayalakshmi MA (1991), Study of the separation of mouse monoclonalantibodies by pseudobioaffinity chromatography using matrix-linked histidineand histamine, J. Chromatogr. 570:29–41.
Eriksson KO (1998), Hydrophobic interaction chromatography, In: Janson JC, RydenL (Eds), Protein Purification: Principles, High-Resolution Methods, and Applica-tions, 2nd Ed., Wiley-VCH, Weinheim, pp. 283–310.
Ersson B, Ryden L, Janson JC (1998), Introduction to protein purification, In: JansonJC, Ryden L (Eds), Protein Purification: Principles, High-Resolution Methods,and Applications, 2nd Ed., Wiley-VCH, Weinheim, pp. 3–40.
Franco TT, Kilikian BV, Coimbra JSR, Meirelles AJA (2005), Extracao lıquido-lıquidoem sistemas de duas fases aquosas, In: Pessoa Junior A, Kilikian BV (Eds),Purificacao de Produtos Biotecnologicos, Ed. Manole, Sao Paulo, Brazil, pp.114–165.
Freitag R, Horvath C (1996), Chromatography in the downstream processing ofbiotechnological products, Adv. Biochem. Eng. Biotechnol. 53:17–59.
GE Healthcare/Amersham Biosciences (2000), Gentle STREAMLINE suits fragileCHO cells, Downstream 32:17–23.
GE Healthcare/Amersham Biosciences (2002), Expanded bed adsorption: Streamline50, 100 and 200 columns. Available at: http://www5.amershambiosciences.com/aptrix/upp00919.nsf/(FileDownload)?OpenAgent&docid¼4DA5095795C3BDE1C1256EB40044A9BC&file¼18112735AB.pdf
Ghosh R (2002), Protein separation using membrane chromatography: opportunitiesand challenges, J. Chromatogr. A 952:13–27.
Hahn R, Shimahara K, Steindl F, Jungbauer A (2006), Comparison of protein Aaffinity sorbents III. Life time study, J. Chromatogr. A 1102: 224–231.
Harris ELV, Angal S (1989), Protein Purification Methods: A Practical Approach, IRLPress, Oxford.
Harrison RG, Todd P, Rudge SR, Petrides DP (2003), Bioseparations Science andEngineering, Oxford University Press, New York.
Haupt K, Bueno SMA (2000), Affinity separation: affinity membranes, In: Wilson ID,Adlard ER, Poole C, Cooke M (Eds), Encyclopaedia of Separation Science,Academic Press, pp. 229–235.
Hearn MTW (1998), High-resolution reversed-phase chromatography, In: Janson JC,Ryden L (Eds), Protein Purification: Principles, High-Resolution Methods, andApplications, 2nd Ed., Wiley-VCH, Weinheim, pp. 239–282.
Ho CC, Zydney AL (2000), A combined pore blockage and cake filtration model forprotein fouling during microfiltration, J. Colloid Interface Sci. 232:389–399.
Janson JC, Ryden L (1998), Protein Purification: Principles, High-Resolution Meth-ods, and Applications, 2nd Ed., Wiley-VCH, Weinheim.
Product purification processes 325

Johansson G (1998), Affinity partitioning of proteins using aqueous two-phasesystems, In: Janson JC, Ryden L (Eds), Protein Purification: Principles, High-Resolution Methods, and Applications, 2nd Ed., Wiley-VCH, Weinheim, pp.443–460.
Karlsson E, Ryden L, Brewer J (1998), Ion exchange chromatography, In: Janson JC,Ryden L (Eds), Protein Purification: Principles, High-Resolution Methods, andApplications, 2nd Ed., Wiley-VCH, Weinheim, pp. 145–206.
Kilikian BV, Santos ES (2005), Cromatografia: Adsorcao em Leito Expandido (ALE),In: Pessoa Junior A, Kilikian BV (Eds), Purificacao de Produtos Biotecnologicos,Editora Manole, Sao Paulo, Brazil, pp. 268–279.
Klein E (2000), Affinity membranes: a 10-year review, J. Membr. Sci. 179:1–27.Kumar A, Galaev IY, Mattiasson B (2003), Precipitation of proteins: nonspecific and
specific, In: Hatti-Kaul R, Mattiasson B (Eds), Isolation and Purification ofProteins, Marcel Dekker, New York, pp. 225–276.
Kumar A, Bansal V, Andersson J, Roychoudhury PK, Mattiasson B (2006), Super-macroporous cryogel matrix for integrated protein isolation – immobilized metalaffinity chromatographic purification of urokinase from cell culture broth of ahuman kidney cell line, J. Chromatogr. A 1103:35–42.
Kumpalume P, Ghose S (2003), Chromatography: the high-resolution technique forprotein separation, In: Hatti-Kaul R, Mattiasson B (Eds), Isolation and Purifica-tion of Proteins, Marcel Dekker, New York, pp. 29–56.
Laas T (1998), Electrophoresis in gels, In: Janson JC, Ryden L (Eds), Protein Purifica-tion: Principles, High-Resolution Methods, and Applications, 2nd Ed., Wiley-VCH, Weinheim, pp. 463–494.
Ladisch, MR (2001), Bioseparations Engineering: Principles, Practice, and Economics,John Wiley and Sons, New York.
Lali A, Balan S, John R, D’Souza F (1998), Carboxymethyl cellulose as a newheterobifunctional ligand carrier for affinity precipitation of proteins, Biosepara-tion 7:195–205.
Maugeri Filho F, Mendieta-Taboada O (2005), Cromatografia de Interacao Hidrofobi-ca, In: Pessoa Junior A, Kilikian BV (Eds), Purificacao de Produtos Biotecnologi-cos, Ed. Manole, Sao Paulo, Brazil, pp. 212–230.
Moraes AM, Vieira-e-Rosa PT (2005), Cromatografia de exclusao molecular, In:Pessoa Junior A, Kilikian BV (Eds), Purificacao de Produtos Biotecnologicos, Ed.Manole, Sao Paulo, Brazil, pp. 176–195.
Pessoa Junior A, Kilikian BV (2005), Purificacao de Produtos Biotecnologicos, Ed.Manole, Sao Paulo, Brazil.
Rasmussen LK, Larsen YB, Hojrup P (2005), Characterization of different cell culturemedia for expression of recombinant antibodies in mammalian cells: presence ofcontaminating bovine antibodies, Protein Expres. Purif. 41:373–377.
Romero J, Zydney AL (2002), Affinity ultrafiltration: effects of ligand binding onselectivity and process optimization, Biotechnol. Bioeng. 77:256–265.
Roper DK, Lightfoot EN (1995), Separation of biomolecules using adsorptive mem-branes, J. Chromatogr. 702:3–26.
Scheich C, Sievert V, Bussow K (2003), An automated method for high-throughputprotein purification applied to a comparison of His-tag and GST-tag affinitychromatography, BMC Biotechnol. 3:12–19.
Scopes RK (1994), Protein Purification: Principles and Practice, 3rd Ed., Springer-Verlag, New York.
Serpa G, Augusto EFP, Tamashiro WMSC, Ribeiro MB, Miranda EA, Bueno SMA(2005), Evaluation of immobilized metal membrane affinity chromatography forpurification of IgG1 monoclonal antibody, J. Chromatogr. B 816:259–268.
Thommes J, Kula MR (1995), Membrane chromatography – an integrative concept inthe downstream processing of proteins, Biotechnol. Progr. 11:357–367.
326 Animal Cell Technology

Vijayalakshmi MA (1989), Pseudobiospecific ligand affinity chromatography, TrendsBiotechnol. 7:71–76.
Vijayalakshmi MA (2002), Biochromatography; Theory and Practice, CRC Press,New York.
Voet D, Voet JG (1995), Biochemistry, 2nd Ed., John Wiley & Sons, New York.Vogel JH, Anspach FB, Kroner KH, Piret JMM, Haynes CA (2002), Controlled shear
affinity filtration (CSAF): a new technology for integration of cell separation andprotein isolation from mammalian cell cultures, Biotechnol. Bioeng. 78:806–814.
Walsh G, Headon DR (1994), Protein Biotechnology, John Wiley & Sons, WestSussex.
Wheelwright SM (1991), Protein Purification: Design and Scale Up of DownstreamProcessing, Hanser Publishers, New York.
Product purification processes 327


13Quality control ofbiotechnological productsMarina Etcheverrigaray and Ricardo Kratje
13.1 Introduction
Within the pharmaceutical industry, the term biotechnology, in its broad-est definition, refers to the use of live organisms to produce biomedicines.The general regulatory scheme for biotechnological products is the sameas for products made by traditional methods, with additional specificrequirements based on their biological origin. The aim of this chapter is toconsider the criteria for the production and quality control of productsobtained through biotechnological techniques. In Chapter 14 (Regulatoryaspects), complementary information is supplied about controls requiredby governmental organizations for product registration and quality guar-antees, during a product’s lifetime in the market. These controls are part ofa set of regulations and guidelines known as Good Manufacturing Practice(GMP).
The main difference between traditional and biotechnological pharma-ceutical products lies in the fact that the latter are produced from liveorganisms that are often genetically modified. This category includes notonly proteins or polypeptides derived from recombinant DNA (rDNA)but also monoclonal antibodies (mAbs). In the production stages, all thepharmaceutical products, even those of biotechnological origin, share thesame basic requirements for process validation, environmental control,aseptic production, and quality control systems. However, the biotechno-logical systems usually present a greater degree of complexity.
The rDNA-derived products may contain potentially harmful contami-nants that are normally not present in their equivalents prepared bychemical methods, and which the purification process must be capable ofeliminating, such as the endotoxins expressed in bacterial cells, cellularDNA, and viruses of animal origin. Contamination with nucleic acid fromtransformed mammalian cells is of particular concern due to the possiblepresence of potentially oncogenic DNA.
The selected production procedure affects the nature and level ofpotential contaminants. The possible variability of the system duringproduction may result in modifications that favor the expression ofalternative genes in the host–vector system or produce lower productefficiency, or quantitative and qualitative differences in the present impu-rities. An example of such variability is a change in the profile of proteases

and this should be evaluated, as this may affect the quality of therecombinant protein produced (Kratje et al., 1994). The production ofcontinuous cultures is subjected to similar considerations. Therefore, it isimportant to rely on procedures that assure the uniformity of the condi-tions of production and consequently the uniformity of the final product.
The development of biological materials as therapeutic agents mustinvolve guarantees about their safety, efficacy, and quality. Safety andefficacy are established through well controlled toxicity studies andclinical trials. Biological tests are important as a direct measure of bio-logical activity and as safety indicators that may detect potential deviationsrelated to efficacy and safety. Quality should be confirmed using a varietyof analytical techniques, which can evaluate purity, biological potency,stability, and consistency of production.
With the aim of establishing lot-to-lot consistency, the characterizationof a target protein should be performed during its development, to estab-lish the required analytical criteria for production. This characterizationmay be continued during its manufacture. The evaluation of a product isbased on its adequate characterization before and during process develop-ment. This involves exhaustive research on the structure, physicochemicalproperties, and biological activity, as well as its potential contaminants(Jeffcoate et al., 1993). For a full overall evaluation, it is necessary to use acombination of these procedures, as none of these can provide enoughinformation on their own.
Biotechnological production processes may include the followingstages.
(i) Stage of cell expansion (Upstream). This consists of obtaining suffi-cient producer biomass or cells by bacterial fermentation or cellculture. After this an impure biomolecule may be obtained underconditions of pH, ionic strength, aggregation state, etc., which mustbe optimized during subsequent processing.
(ii) Purification (Downstream). At this stage a molecule with the requireddegree of purity is produced from the crude culture material whilefully maintaining its biological and therapeutic activity. This processmust ensure that the product is treated with criteria acceptable for itseventual use as a pharmacological agent. The resulting material maybe called pure raw material (active pharmaceutical ingredient).
(iii) Galenic conditioning. The pure raw material must be conditioned toachieve a final galenic formulation fulfilling all the requirements of apharmaceutical product, such as suitable pharmokinetics and safety.
The present chapter includes the following applications of cell cultures:
(i) Production of recombinant proteins (WHO, 1991),– the initial materials, including the basic data of the host cell and
the origin, nature, and sequence of the gene used in production;– its production process;– the pure raw material;
330 Animal Cell Technology
(ii) Bioassays (Mire-Sluis et al., 1996; Mire-Sluis and Thorpe, 1998).– Special emphasis on bioassays performed in cell culture.
rDNA-derived products and mAbs are considered to be similar tobiological substances produced by traditional methods, such as bacterialand viral vaccines, in which adequate control of the initial materials andthe production procedure is as necessary as that of the product itself.These considerations, therefore, put considerable emphasis on controlduring the production, to insure the product’s safety and efficacy.
As detailed in Chapter 14 (Regulatory aspects), both the productionprocess validation and purification capacity to eliminate undesirablematerials are considered essential. The general criteria for quality controlof biotechnological products involve special attention to the quality of allcomponents used in production, including the components of fermenta-tion and culture media. If additives of animal origin are used (e.g. fetal calfserum), they should be proved to be free from adventitious agents. It isnot acceptable to use any agent with potential to provoke allergic reac-tions, such as penicillin or other beta-lactam antibiotics.
Biotechnological products must satisfy the general criteria for thequality control of biological products, such as tests of activity, abnormaltoxicity, pyrogenicity, stability, and sterility. The chemical identity of thetarget molecule must also be assured, comparing it to a reference, and agroup of tests that verify its integrity, degree of aggregation, and correctamino acid sequence.
As well as these general criteria there may be specific tests appropriateto specific products with regard to quality control. Therefore, eachproduct’s production and quality control should be considered indepen-dently, taking into account any special characteristic. The considerationsfor each product must also relate to its clinical use. Therefore, a prepara-tion to be administered repeatedly over a long period of time or in largedoses will probably need to be subjected to more stringent tests (particu-larly for antigenicity) than a product that is applied only once (e.g. avaccine).
It is important to determine permissible maximum limits for impuritiesand contaminants that may be present in these products, adapting thelimits according to technological advances for testing or from the contin-uous assessment of the effects of clinical applications.
13.2 Production of recombinant proteins
13.2.1 Control of starting materials
Cloning and expression
As detailed in Chapter 14, regulatory organizations require informationon:
(i) Host cell characterization. This includes origin, phenotype and geno-type, and the description of the culture medium, morphologicalaspects, and growth rate. For eukaryotic cells used as host, the cell
Quality control of biotechnological products 331

line history and general characteristics should be provided. Thesemust be stable from the master cell bank to the end of production. Ifcells have a finite lifespan, the maximum number of populationdoublings should be determined (CBER, 1993).
(ii) Characterization of host–vector system. Documentation concerningthe gene cloning strategy and characterization of the recombinantvector is required (International Conference of HarmonizationGuidelines, 1995).
Cell banks
Once the cell line is selected as a host for production, a cell bank systemmust be generated to guarantee the availability of an adequate source ofequivalent cells to use through the product’s lifetime in the market.Usually, the cell bank system consists of two levels: a master cell bank(MCB) and a manufacturer’s working cell bank (WCB).
Master cell bank (MCB)This is a homogeneous suspension of the original cells, already trans-formed with the expression vector and containing the desired gene, whichis distributed in equal volumes into individual containers (ampoules) forstorage (usually in liquid nitrogen). In some cases, it may be necessary toestablish a separate MCB for the expression vector and the host cell. Thelocalization, identification, and inventory of the individual ampoules mustbe carefully documented.
All the necessary MCB identity tests should be performed to establishthe most significant cell characteristics and their stability over time. Datamust be provided to prove that the cells can be used for the desired aim, aswell as data showing the gene copy number and identity of the expressionsystem, and the quantity and quality of the protein being produced.Normally, the nucleotide sequence of the cloned gene in the MCB shouldbe confirmed. However, in certain cases, as when multiple copies of thecloned gene are introduced into the genome of the host cell, sequencingcan be inappropriate. In these circumstances, it might be useful to performeither a Southern blot analysis of the total cellular DNA (Southern, 1975;Chaplin and Kennedy, 1994) or a Northern blot from the mRNAsequence (Alwine et al., 1977). In these cases, particular attention must bepaid to the characterization of the final product (see Section 13.4).
If a clone is selected from a population of host cells into which anexpression construct has been transferred, it will be necessary to create anew MCB. From this MCB it will be important to guarantee the identityof the clone and the produced protein in reference to the original.
Working cell bank (WCB)This is derived from a homogeneous suspension of cells derived from theMCB after a finite number of passages, distributed in equal volumes inampoules for storage. The localization, identification, and inventory of theindividual ampoule must be carefully documented.
For the production of a lot of biological product, one or more WCBampoules can be used. If cells from more than one ampoule are used, the
332 Animal Cell Technology

cellular suspensions must be mixed immediately after thawing. The popu-lation doubling number of the cells used for production will be based onprevious criteria established by the manufacturer, assuring the integrity ofthe cell product system. AWCB can be used for the production of cultureswith a finite number of passages or continuous cultures.
In both banks:
(i) All ampoules must be treated equally during storage, and onceremoved from storage they must be discarded;
(ii) It is recommended that each MCB and WCB should be stored in twoor more sufficiently separated areas inside the production facilities toavoid loss of the cell line.
13.2.2 Quality control of cell banks
The quality control of cell banks must include information on the follow-ing.
(i) Stability by measurements of vector viability and retention.(ii) Cellular identity through phenotypic characterization.(iii) Evidence must be presented, proving that cell banks are free from
potential infectious or oncogenic agents (viruses, bacteria, fungi, ormycoplasma). Special attention should be paid to viruses that com-monly infect the species from which the cell line is derived. Certaincell lines contain endogenous viruses, for example, retrovirus, whoseelimination might not be feasible. The expression of these endogenousviruses should be tested in a variety of conditions that may cause theirinduction. It is important to show that all lots of cells are free fromevery adventitious contaminant.
(iv) In the case of eukaryotic cells derived from mammals, inform-ation concerning the potential tumorigenicity of the cell bank isnecessary.
(v) Accurate records must be maintained of the composition and originof the culture medium used for the cell banks. As animal based seracan produce allergic reactions in human beings, efforts must be madeto significantly reduce the level of serum required for the propagationand production in cell cultures. The residual quantity of serum oradditives in the final product must be determined and it must notexceed the established limits.
If porcine trypsin is used in the passage of cells, it should be free fromadventitious agents, including porcine parvovirus. The manufacturers ofbiological products must provide information about the source(s) andcontrols of any material derived from ovine or bovine species.
Penicillin or other beta-lactam antibiotics should not be used in produc-tion cell cultures. Minimum concentrations of other antibiotics or inductoragents in the culture may be acceptable; however, the presence of anyantibiotic or inductor agents in the final product is not acceptable.
Quality control of biotechnological products 333

13.3 Control of the production process
13.3.1 Cultures
Cultures with a finite number of passages
This culture method is defined by a limited number of passages orpopulation doublings, which should not be surpassed during the produc-tion process. The maximum number of doublings or passages should beestablished for the process.
The procedure and materials used for cell propagation and productinduction should be described in detail (see Chapter 14). For each produc-tion lot, data should be given about the scope and nature of any microbialcontamination of culture containers immediately before collection. Thesensitivity of the methods used for detection should be described.
Data should be available about the uniformity of the fermentationconditions and cell propagation, and about the maintenance of the productyield (cell concentration and viability, nutrient and metabolite concentra-tions, product concentration, etc.). The criteria as to when to discard aculture should be established (when they are not included in the unifor-mity specifications mentioned). The characteristics of the host cell andvector at the end of production cycles should be observed. If pertinent, thenucleotide sequence of the insert coding the cloned DNA-derived productshould be determined at least once after the culture is carried out on alarge scale.
Continuous cultures
The number of population doublings or passages in this type of culture isneither defined nor restricted for production. The manufacturer will definethe criteria adopted for both the cell culture and the end of the productionprocess (see above – Cultures with a finite number of passages). Duringthe culture stage, these criteria must be monitored; the frequency and typeof monitoring will depend on the nature of the production system and theproduct (Bollati et al., 2005). These should be defined and recorded whenthe product is registered.
Information should also be given about the integrity of the gene that isbeing expressed and the phenotypic and genotypic characteristics of thehost cell after a long term culture. If pertinent, the nucleotide sequence ofthe insert that codes the cloned DNA-derived product should be deter-mined, at least once after a large scale culture. Although, as mentioned inthe section on the MCB above, when multiple copies of the cloned geneare inserted in the genome of a continuous cellular line, it may beinappropriate to sequence the cloned gene.
Data should also be presented showing that the variations in cell densityand product concentration fall within established limits. The acceptance ofculture supernatants for further processing must be clearly linked to thepredefined program adopted, and this will depend upon a clear definitionof the characteristics of a ‘‘product lot.’’ The criteria to discard suspen-sions and stop cultures, when they do not follow the specifications (see
334 Animal Cell Technology

above), should also be established. Systemic tests should be performed toinvestigate the microbial contamination according to a pre-defined har-vesting strategy.
The maximum length of a continuous culture should be based oninformation about the system and product uniformity and stability. Inlong continuous cultures, the cell line and product will be repeatedlyevaluated at intervals determined by the information on the stability of thehost–vector system and the product characteristics.
13.3.2 Purification
The methods used in the recovery, extraction, and purification must bedescribed in detail. Special attention must be paid to the elimination ofviruses, nucleic acids, and undesirable antigenic materials.
In procedures involving affinity chromatography, which may use bio-logical components such as mAbs, appropriate measures should be takento ensure that no contamination arises from its use, such as adventitiousviruses, that could threaten the safety of the final product. The morecommonly used methodologies to determine the levels of contaminationare presented in Section 13.4.8.
The ability of the purification process to eliminate product related orhost cell derived proteins, nucleic acid, carbohydrates, viruses, or otherundesirable impurities, including undesirable media derived and chemicalcomponents, must be thoroughly investigated, as well as the reproduci-bility of the process.
13.4 Product control
13.4.1 Characterization and specification
The requirements for identity, purity, activity, and stability of the productare closely related to the processing technology and the physicochemicaland biological characteristics of a specific drug. The planned use of theproduct should also be considered.
In general the quality control procedures for products obtained throughbiotechnology are very similar to those routinely used with traditionalpharmaceutical products in areas such as raw material testing, documenta-tion of process control, and aseptic processing. The fundamental differenceis in the type of methods used, so as to determine the product’s identity,uniformity, and purity. In the quality control of products obtainedthrough recombinant DNA technology, it is necessary to employ vali-dated tests for the final and intermediary products to ensure the elimina-tion of undesirable impurities.
It is essential to characterize the final active substance through chemical,physical, and biological methods. Special consideration should be given tothe use of a range of analytical techniques to determine a range ofphysicochemical properties of the molecule. The methods used must bevalidated and should have a known sensitivity.
Contamination of the product generally may come from three sources:
Quality control of biotechnological products 335

(i) host organism: proteins or DNA of the host;(ii) proteins and impurities from the production process – mainly from
the purification stage;(iii) impurities related to the active substance, for example, aggregation
state, reduced or oxidized forms.
The purity of a protein preparation obtained through recombinantDNA technology should be maximized. The allowed levels of contami-nants for each product should be specified for the manufacturing process.
13.4.2 Protein content
Quantification of total protein is very important because the values ofother product parameters depend on the accurate determination of proteincontent, for example the specific activity.
There are various accepted methods to determine the protein content,namely:
(i) UV absorbance. This is one of the simplest methods and it does notrequire a standard. However, the coefficient of molar extinction ofthe protein should be known because it is specific for each protein(Goldfarb et al., 1951).
(ii) Lowry method. This is a colorimetric method and needs to becompared to a standard, e.g. the bovine serum albumin (Lowry et al.,1951). The reaction products are spectrophotometrically quantifiedbetween 540 and 560 nm. This technique is linear at the microgramrange and can be used for any protein. Alcohol, sugars, and detergentsinterfere in the measurements, making their removal necessary beforeany reliable measurement.
(iii) Bradford method. This is a colorimetric method that uses Coomassiebrilliant blue, which forms a conjugate with proteins under acidicconditions (Bradford, 1976). An unknown needs to be compared to astandard, e.g. bovine serum albumin. The reaction products arequantified spectrophotometrically at 595 nm. The technique is linearat the microgram range and can be used for any protein. There arevarious substances/factors that interfere with the measurements (SDS,Tween, Triton-X100, high ionic strength, alkaline pH) making theirremoval necessary before any reliable measurement.
(iv) Kjeldahl method. This is a technique used to determine the amountof nitrogen present in a protein. It is estimated that 1 mg of nitrogenequates to 6.5 mg of protein (Kjeldahl, 1883).
13.4.3 Amino acid analysis (identification and/or protein content)
The method consists of the complete hydrolysis of a protein or peptide torelease its component amino acids. These may be separated by reversephase high performance liquid chromatography (HPLC), and quantifiedwith fluorometric detection after derivatization with o-phthaldehyde(Larsen and West, 1981). The method serves to determine both the aminoacid composition and the total quantity of protein present in the sample.
336 Animal Cell Technology

Disadvantages of this method include the total or partial destruction ofsome amino acids (e.g. tryptophan, serine, and threonine), the under-estimation of the quantity of amino acids that are difficult to hydrolyze(valine and isoleucine), and the difficulty of quantifying cysteine andmethionine, except by prior oxidation.
The amino acid composition should be determined from the average ofa minimum of three separate hydrolyses per lot.
13.4.4 Protein sequencing (identification)
This technique gives information about the protein’s primary structure,which may include its amino and/or carboxyl terminal groups (Edman,1950). For recombinant DNA-derived proteins, this analysis serves toconfirm the amino acid sequence predicted by the DNA sequence. Theanalysis can also be useful to determine the protein’s homogeneity.
(i) Amino-terminal: This is a classic chemical technique of sequentialbreakdown from the N-terminal end of a protein and can providelimited, but rapid, sequence information to provide data on homo-geneity and identity. The method is semi-quantitative, and the datacannot be used to determine the exact proportions of amino acidsoriginating from different N-terminals if present in a protein.
(ii) Carboxyl-terminal: This provides sequence information about theprimary structure by degradation from the C-terminal end. Themethod is also semi-quantitative.
13.4.5 Peptide mapping
This method consists of specific cleavage of the target protein using anendoprotease or by a chemical method. The resulting peptides are sepa-rated by reverse phase HPLC or ionic exchange to obtain a highly specificprofile.
Peptide mapping is a method that enables the determination of proteinidentity when compared to a standard. When compared to previous lots ofthe same product, it serves to determine the stability of the protein’sprimary sequence, which in turn reflects the genetic stability of theproducer cells. This method is capable of detecting small differencesbetween proteins in one or more amino acids. The detection will bedependent upon an amino acid alteration affecting the observed peptideprofile (Figure 13.1; see color section).
13.4.6 Electrophoresis
Electrophoresis methods are among the most common and potent used inthe evaluation of protein purity and homogeneity. They are valuableindicators of protein stability because they detect small molecular orchemical changes in the product caused by denaturation, aggregation,oxidation, deamidation, etc. One of the advantages is that they requireonly microgram amounts of a sample.
Quality control of biotechnological products 337

The two most widely used types of electrophoresis tests are: (i) sodiumdodecyl sulfate polyacrylamide gel electrophoresis (SDS-PAGE); and (ii)isoelectric focusing (IEF).
SDS-PAGE
This test separates proteins according to their molecular weight (Laemmli,1970). Firstly, the sample is denatured in a detergent, which breaks thenon-covalent intra- and inter-molecular links of the proteins, and then it isseparated electrophoretically by a polyacrylamide gel. The electrophoreticseparation must be performed under reduced and non-reduced conditionsto determine the existence of impurities with the same molecular weight.
The method under non-reduced conditions is normally used to estimatethe aggregation and/or oligomerization of the protein but only aggregatesor oligomers that are stable in the presence of SDS will be detected andunder the conditions used for the sample preparation and electrophoresis.
In the method validation, low concentrations of the product are used forthe detection of the target protein, while high concentrations are recom-mended for the detection of impurities.
The sample detection after electrophoresis can be quantified by adensitometric analysis of Coomassie brilliant blue stained spots. A silverstain is available to provide higher sensitivities when detection of samplesin the nanogram range is required.
SDS-PAGE, together with the Coomassie brilliant blue coloration, isused to quantitatively determine the sample purity with respect to dimers,larger covalent aggregates, and polypeptide fragments. The SDS-PAGEprotein separation can be combined with the Western blot analysis, whichis used to determine the presence of an electrophoretic band (Figure 13.2;see color section).
To calculate the percentage purity from a dilution series, the lane inwhich the protein of interest is no longer visible is determined (Lm).Similarly, for each band of impurity, the lane in which it is no longervisible is determined (Li).
I(%) ¼ Pm
Pi3 100
where I (%) is the estimated percentage of impurity, Pm the minor proteinmass applied which can be visualized and which corresponds to lane Lm-1and Pi is the protein mass applied in lane Li-1. The sample’s percentagepurity is calculated by adding the impurity percentages corresponding tothe different impurity bands and deducting this result from 100. In orderto apply this principle it is assumed that there are no impurity bands at thesame position as the target protein.
The SDS-PAGE protein separation can be combined with Western blotanalysis, which is used to detect the band of the target protein.
After electrophoresis, proteins are transferred onto a nitrocellulose orPVDF (polyvinylidene fluoride) membrane, which is immersed in asolution of a selected antibody capable of combining with the targetprotein. Then the reaction of antigen-specific antibody is detected througha second antibody which is tagged enzymatically. Special attention must
338 Animal Cell Technology

be paid to impurities of the immunogen used in production of the anti-body (Amadeo et al., 2004; Oggero et al., 2006).
Isoelectric focusing (IEF)
This separates proteins according to their charge in an electric field(Svensson, 1961). The protein charges result from its amino acid composi-tion and the presence of charged molecules from post-transductionalmodification (e.g. sialic acid molecules in complex glycan structuresderived by glycosylation). However, there is a specific pH (the isoelectricpoint, pI) for each protein, in which the opposite charges on each proteinmolecule balance, providing a net charge of zero.
The IEF separation is performed with native proteins in polyacrylamidewith a large pore size or with agarose gel with ampholytes (amphotericions of low molecular weight), which establish a pH gradient due to theirmigration inside the polymer matrix when an electric field is applied. Inthe presence of an electric field, sample proteins with a positive chargemigrate to the cathode and proteins with a negative charge migrate to theanode. The migration ends when each protein reaches the pH valuecorresponding to its specific pI value. Here, its net charge is zero. As theprotein’s migration depends on its amino acid composition, the alteredforms of proteins or non-target proteins will migrate to different points.The IEF gels can be colored for the detection of bands with Coomassiebrilliant blue or silver stain. This technique can also be combined with animmunological method through electro transference of the bands to anitrocellulose or PVDF membrane, after electrophoresis, and its laterreaction with a tagged antibody, either in an enzymatic or radioactiveform.
IEF is used as a purity test and for protein characterization, comparingit with the relative position of an authentic band of the target protein. Itcan also be used as a method to evaluate the stability of a biologicalproduct. Small changes such as the deamination of an amino acid willcause a change in the pI and a modification of the band pattern.
The results of the IEF gel can occasionally be difficult to interpret andits applicability should be considered for each protein (Figure 13.3; seecolor section).
High performance capillary electrophoresis (HPCE)
HPCE offers the advantage of high resolution protein analysis (Dolnik,2006). Through this method it is possible to analyze the content ofisoforms recovered after the recombinant protein purification. Each peakcorresponds to a single isoform and the determination of the relative areaunder each peak enables the determination of the percentage content ofeach isoform. In some cases this can be used an as an assessment of aprotein’s quality, when the relationship between biological activity andstructure is known (Etcheverrigaray et al., 2005) (Figure 13.4; see colorsection).
Quality control of biotechnological products 339

13.4.7 Carbohydrate determination
Glycosylation is a possible post-translational modification, characteristic ofrecombinant proteins expressed from eukaryotic cell lines (see Chapter 6).
Glycosylation can influence pharmacokinetics and protein function, sochanges in the glycosylation profile can have a significant impact on thepharmacodynamic characteristics and consequently therapeutic efficacy(Sinclair and Elliot, 2004; Marini et al., 2005).
The glycosylation profile is affected by the cell culture conditions.Ideally, a product should be characterized at least once to identify thepotential glycosylation sites as well as the specific carbohydrate at eachsite.
The quantification of specific sugars and total carbohydrates should beperformed in each lot. In some cases, IEF and capillary electrophoresis canbe alternative methods for determining the percentage of each isoform in aproduct sample lot. It is often important to determine the isoform profilefor each lot prior to release. It would be ideal, but not always possible, torelate the isoform profile to the specific activity of the product.
Two main approaches can be taken to determine the sugar covalentlylinked to the glycoprotein. Microheterogeneity of glycans is a commonphenomenon of glycoproteins giving rise to variability in glycoformsbetween molecules. Therefore the information on carbohydrate contentrepresents either the average composition or representative structures. Thefirst approach is to determine the composition of glycoprotein-linkedsugars. The second approach is to release and separate the structures ofindividual oligosaccharides covalently bound to glycoprotein. This ap-proach serves to obtain an oligosaccharide map similar to the peptide mapfor a protein (Chaplin and Kennedy, 1994).
More information about this subject can be obtained in Chapter 6(Post-translational modification of recombinant proteins).
13.4.8 Potential impurities and contaminants of biotechnologicalproducts
Table 13.1 describes the most frequent types of impurities and contami-nants, indicating the most suitable detection methods as a guide.
The residual host cell DNA may represent a different threat as animpurity for each product, since it depends on the host organism and thepurification process. The control of residual DNA is a measure of efficacyand consistency in the purification process, as well as the product quality.The levels of DNA should be quantified using methods of an adequatesensitivity. Among the techniques used, the following can be mentioned.
(i) Slot blot hybridization, using specific probes tagged with radioactivephosphorus (32P). This is the most sensitive and routinely performedmeasurement (Pepin et al., 1990).
(ii) Biosensors technology. This methodology is more appropriate for thedetermination of total DNA/nucleic acid impurities than specificallyfor host cell DNA.
(iii) Polymerase chain reaction technology (PCR). Adequate primersshould be used.
340 Animal Cell Technology

13.5 Bioassays
Methods to determine the potential biological activity of products ob-tained through recombinant DNA techniques are of fundamental impor-tance. Despite the existence of numerous physicochemical techniques tocharacterize the protein product structure and the presence of contami-nants, they provide little, if any, information about its biological potency.A bioassay is defined as a functional test, and no physicochemical test canmeasure the function. However, for some peptide hormones, which areless complex in structure than most cytokines, well defined physicochem-ical tests may be used to estimate biological activity; for instance, thecapillary electrophoresis analysis of a protein’s isoform content if thespecific activity of each one is known.
A bioassay is an analytical procedure that uses a responsive biologicalsystem (biological function) to measure the biological potency of aproduct (Mire-Sluis et al., 1996). The most appropriate method to deter-mine it is by comparing the biological activity of a sample with a well-characterized reference standard.
The biological activity measured is often expressed in internationalunits, but should be recorded in relation to the product mass. This meansthat the biological effect is measured as activity per unit of mass and
Table 13.1 Impurities and contaminants in processes to obtain biotechnolo-gical products
Types Detection method
ImpuritiesEndotoxins Bacterial endotoxins test, pyrogen testHost cell proteins SDS-PAGE, immune assaysOther protein impurities SDS-PAGE, HPLC, immune assaysDNA DNA hybridization, ultraviolet spectrophotometry,
PCRMutant proteins Peptide mapping, HPLC, IEF, mass
spectrophotometry, amino acids sequencingFormyl methionine Peptide mapping, HPLC, mass spectrophotometryProteolytic cleavage IEF, SDS-PAGE, HPLC, amino acids sequencingProtein aggregates SDS-PAGE, HPSECDeamination IEF, HPLC, mass spectrophotometry, amino acids
sequencingMonoclonal antibodies SDS-PAGE, immune assaysAmino acids substitution Amino acids sequencing and analysis, peptide
mapping, mass spectrophotometryContaminantsMicrobial contaminants(bacteria, yeasts, fungi)
Hygienic control, sterility test, DNA
Mycoplasma PCR, DNAVirus (exogenous andendogenous)
CPE, Had (only exogenous virus), reverse transcriptaseactivity, PMA
SDS-PAGE, sodium dodecyl sulphate-polyacrylamide gel electrophoresis; HPLC, high perform-ance liquid chromatography; PCR, polymerase chain reaction; IEF, isoelectric focusing; HPSEC,high performance size-exclusion chromatography; DNA, DNA-binding fluorochrome; CPE,cytopathic effect; Had, hemadsorption; PMA, production of murine antibodies.
Quality control of biotechnological products 341

should be consistent within clearly specified limits. The activity expressedper unit of mass is called specific activity and it constitutes a parameter ofidentity and/or purity.
However, the bioactivity measured in an in vitro assay may not beconsidered as a direct biological activity indicator in the human. Thus ithas been shown that a biological assay for a cytokine does not necessarilyreflect the clinical efficacy (Thorpe et al., 1997).
13.5.1 Bioassay types
The first bioassay type evaluated the response of cytokines directly inanimals. However there are many disadvantages to animal tests includinginter-animal variability, their expense, demand for intensive work, andethical concerns when many animals may have to be sacrificed to providestatistically valid data. Significant variability can result from the sex, age,species, and health of the animals used.
Cell culture technology can be a viable alternative to animal testing inmany cases, with the possibility of increasing significantly the number ofreplicate samples and thus expanding the bioassay utility. Primary cellcultures have the advantage that they maintain most of the characteristicsof the animal tissue from which the cells are derived. These would be idealfor bioassays except that they cannot be kept in culture indefinitely. Theycan be difficult and sometimes impossible to grow reproducibly, and aresubject to the inherent variability of the animal they come from.
Consequently, most bioassays for cytokines are performed using estab-lished cell lines that can be grown indefinitely. There are many advantagesassociated with the use of such lines. They are available from frozen cellbanks and do not require direct isolation from primary animal tissue. Theyare generally clonal and so their growth is relatively consistent, allowingrelatively consistent results over time. As indicated earlier there is aninherent variability associated with the use of living systems, whetherentire organisms, ex vivo tissue explants, or isolated cells. However, theuse of continuous cell lines would tend to minimize these problems. Thecells may lose cell function and suffer genetic changes over extendedculture passage. However, this can be controlled by maintaining a largeenough cell bank at low passage number for most experts and so any suchdisadvantage is more than compensated for by their advantages.
Despite the diverse existing varieties of bioassays for cytokines, all arebased on the protein’s capacity to induce a measurable activity in cells andtissues. The cell responds in various ways including: enhanced growth,growth inhibition, expression of cellular markers, cytotoxicity, or antiviralactivity (Wadhwa et al., 1995).
The selection of the type of assay depends on the nature of the bio-logical material available for assay. The bioassays can demonstrate theconsistency of the product’s biological activity by replicate analysis as wellas define the potency of each lot. Figure 13.5 shows the analysis ofbiological activity of a sample of recombinant human interferon-�1a(rhIFN�1a).
342 Animal Cell Technology

13.5.2 In vitro bioassays
The major advantage of a bioassay is the capacity to detect only functionalmolecules. However, despite this, there are also important disadvantages.These include the low specificity, which may be attributed to the nature ofthe molecules themselves, including their pleiotropic actions, their diver-sity of target cells, and their ability to induce different effects on differentcell types. In addition, the same function may be performed by twodifferent cytokines, probably through the same cellular receptor. This is adisadvantage when dealing with samples that may contain multiple cyto-kines, such as clinical samples (Cannon et al., 1993; Whiteside, 1994).However, the inclusion of specific neutralizing antibodies for targetproteins may permit the determination of the activity of a single proteinwithin a mixture.
Contamination (including mycoplasma) and differences in serum lotsfor cultures can affect bioassay performance. Consequently, it is importantto maintain cell lines adequately and use consistent sources of material toensure reproducibility of test results. Bioassay data generally follow asigmoidal curve, which can complicate the interpretation of results.
1E 9� 1E 8� 1E 7� 1E 6� 1E 5� 1E 4�
Dilutions of culture supernatant (dil )�1
rhIFN 1a (UI/ml)�0,01 0,1 1 10 100 1000
Abs
orba
nce
(54
0 nm
)λ
�
0,0
0,5
1,0
1,5
2,0
2,5
3,0
Figure 13.5
Determination of the in vitro biological activity of rhIFN�1a (recombinant humaninterferon-�1a). Standard (d), production sample of rhIFN�1a (m). The curvescorresponding to the standard and the sample were processed in triplicate and theresults are shown as the average value � SD. The dotted horizontal lines indicatethe average values of the test’s negative and positive controls processed inquadruplicate.
Quality control of biotechnological products 343

The ability to obtain cell clones that respond to cytokines and serve assource material for bioassays has aided the development of bioassays. Thecell lines, obtained mainly from human or murine cancers, often dependon a cytokine for their growth and tend to be immortal, thus providing aunique homogeneous cell source, which may be distributed among labora-tories (Mire-Sluis and Thorpe, 1998). The advent of recombinant DNAtechnology has enabled the cloning of specific cytokine receptors and theirexpression in any cell line (Canosi et al., 1996). In this way, a cell line canbe created that responds specifically to almost any cytokine, and avoidsthe necessity to isolate a cell line with an endogenous receptor.
13.5.3 Experimental design
An in vitro bioassay can be designed in several ways, but requiresstatistical validity. A one point assay is not valid. The bioassay should bedesigned to consider factors that introduce variability, and the analysisshould test such variability. A measurement series of a test sample shouldbe compared to an equivalent series of the reference material, carefullyconsidering the comparisons between the linear portions of the dose-response curves (Mire-Sluis et al., 1996). To test validity of a bioassayinter- and intra-assay variability should be considered in both preparation,and in the case of multiwell plates, the variability between each plate. Toreduce the positional effect in plate tests, it is advisable to distribute thepoints on the curves randomly and also to include a reference standard ineach plate (Gaines-Das and Meager, 1995). One of the most widely usedtechniques to validate a bioassay’s performance is to include internalduplicates. The data arising from the comparison can be important inassessing the test’s variability.
Products manufactured by different companies, even with the samesource materials, can present very different specific activities. Conse-quently, the concept of a universal standard of potency has been developedby the World Health Organization (WHO) and this has proved extremelyvaluable to reduce the variability of results between laboratories, as well asto improve the comparability of clinical studies and research (Mire-Sluiset al., 1996).
The international units and standards are vital when establishing thebiological potency of a preparation. The mass cannot be used, since it ispractically impossible to weigh a drug, especially if it contains excipients,as occurs with most biotherapeutic products. To establish internationalstandards, a strict process is followed according to the regulations ofWHO. The importance of this is reflected in the establishment of newstandards, the Reference Reactives (RRs) of the WHO, for cytokines andgrowth factors. These are prepared according to the WHO protocol. Eachstandard is monitored so that it does not lose activity during lyophiliza-tion, and its activity remains stable. However, the potency of a therapeuticproduct measured by an in vitro test is not used to establish clinical doses,because this may not reflect in vivo activity, which can only be establishedby clinical trials.
344 Animal Cell Technology

13.5.4 Statistical analysis
The most widely used type of simultaneous assay is the one in which theresponse has a homoscedastic linear regression on a logarithmic scale.Homoscedasticity means that the variance of all experimental groups is thesame. For such an assay, the condition of similarity requires that thestraight lines of the standard and the samples should be parallel. Other-wise, the condition of similarity between the sample and standard is notestablished, that is, it would not be valid to assume that dilutions of onebehave the same as dilutions of the other, which is the assay’s underlyingprinciple.
This type of test is called parallel-line assay and is based on the compari-son of a sample response with that of a reference standard (Finney, 1978).In general, it determines the response – at least by duplicates – of a seriesof dilutions of each preparation (sample and standard) while plotting themeans of their corresponding doses on a logarithmic scale. As this testrequires analysis of a linear portion of the curves, at least three points ofeach curve belonging to such a portion should be selected. The moreselected points, the better the comparison.
If successive doses for each preparation show the same logarithmicspacing this enables a mathematical transformation that facilitates thecalculation without modifying the final result. With these new valuesassigned to the doses on the abscissa axis and the mean response values onthe ordinate axis, the straight lines of dose-response are replotted, andmust be parallel to allow comparison. This graph allows a quick potencyestimate, and also protects against serious mistakes or misinterpretationsof statistical analysis. The horizontal distance between both straight linesprovides an estimate of the difference in the transformed abscissa values,between doses with the same response. Finally, by expressing this differ-ence in terms of doses, the sample’s potency value is obtained. For thisestimate to be valid, the variance analysis – more commonly known asANOVA – must be performed. The existence of homoscedasticity isdetermined by Bartlett’s test (Finney, 1978).
References
Alwine JC, Kemp DJ, Stark GR (1977), Method for detection of specific RNAs inagarose gels by transfer to diazobenzyloxymethyl-paper and hybridization withDNA probes, Proc. Natl Acad. Sci. U S A 74:5350.
Amadeo G, Oggero Eberhardt M, Zenclussen ML, Robles L, Pereira Bacci D, KratjeR, Etcheverrigaray M (2004), A single monoclonal antibody as probe to detect theentire set and partially unfolded rhEPO glycoforms, J. Immunol. Methods293:191–205.
Bollati Fogolın M, Forno G, Nimtz M, Conradt HS, Etcheverrigaray M, Kratje R(2005), Temperature reduction in cultures of hGM-CSF-expressing CHO cells:effect on productivity and product quality, Biotechnol. Prog. 21:17–21.
Bradford M (1976), A rapid and sensitive method for the quantitation of microgramquantities of protein utilizing the principle of protein-dye binding, Anal. Bio-chem. 72:248–254.
Cannon JG, Nerad JL, Poutsiaka DD, Dinarello CA (1993), Measuring circulatingcytokines, J. Appl. Physiol. 75:1897–1902.
Quality control of biotechnological products 345
Canosi U, Mascuia M, Gazza L, Serlupi-Crescenzi O, Donini S, Antonetti F, Galli G(1996), A highly precise reporter gene bioassay for type I interferon, J. Immunol.Methds 199:69–76.
CBER (Center for Biologics Evaluation and Research) (1993), Points to Consider inthe Characterization of Cell Lines Used to Produce Biologicals, US Food andDrug Administration.
Chaplin MF, Kennedy, JF (1994), Carbohydrate Analysis. A Practical Approach, 2ndEd., IRL Press, Oxford, UK.
Dolnik V (2006), Capillary electrophoresis of proteins (Review 2003–2005), Electro-phoresis 27:126–141.
Edman P (1950), Edman degradation, Acta Chem. Scand. 4:283.Etcheverrigaray M, Amadeo G, Didier C, Pereira Bacci D, Cavatorta FA, Kratje R
(2005), Physicochemical estimation of rhEPO potency produced in suspensionculture, In: Godia F, Fussenegger M (Eds), Animal Cell Technology MeetsGenomics, Springer, Dordrecht, pp. 727–729.
Finney DJ (1978), Parallel line assays, In: Statistical Methods in Biological Assays,Charles Griffin, London, pp. 69–104.
Gaines-Das RE, Meager A (1995), Evaluation of assay designs for assays usingmicrotitre plates: results of a study of in vitro bioassays and immuno-assays fortumor necrosis factor, Biologicals 23:285–297.
Goldfarb R, Saidel L, Mosovich E (1951), The ultraviolet adsorption spectra ofproteins, J. Biol Chem. 193:397–404.
International Conference of Harmonization Guidelines, Q5B Quality of Biotechnolo-gical Products: Analysis of the Expression Construct in Cells used for Productionof R-DNA Derived Protein Products (1995), Q5D Derivation and Characteriza-tion of Cell Substrates Used for Production of Biotechnological/BiologicalProducts (1997).
Jeffcoate SL, Corbel MJ, Minor PD, Gaines-Das R, Schild GC (1993), The control andstandardization of biological products, Proc. R. Soc. Edin. 101B:207–226.
Kjeldahl J (1883), Neue Methoden zur Bestimmung des Stickstoffs in organischenKorpern, Fresenius Z. Anal. Chem. 22:336–382.
Kratje R, Lind W, Wagner, R (1994), Evaluation of the proteolytic potential of invitro-cultivated hybridoma and recombinant mammalian cells, J. Biotechnol.32:107–125.
Laemmli UK (1970), Cleavage of structural proteins during the assembly of the headof bacteriophage T4, Nature 227:680–685.
Larsen BR, West FG (1981), A method for quantitative aminoacid analysis usingprecolumn o-phthaldialdehyd derivation and high performance liquid chromato-graphy, J. Chromatogr. Sci. 19:259–265.
Lowry OH, Rosebrough NJ, Farr AL, Randall RJ (1951), Protein measurement withthe folin phenol reagent, J. Biol. Chem. 193:265–275.
Marini G, Forno G, Kratje R, Etcheverrigaray M (2005), Recombinant humangranulocyte-macrophage colony-stimulating factor (rhGM-CSF): incidence ofglycosylation on pharmacokinetic parameters, In: Proceedings of ENPROMER2005, Rio de Janeiro, Brazil, pp. 123–124.
Mire-Sluis AR, Thorpe R (1998), Laboratory protocols for the quantization ofcytokines by bioassay using cytokine responsive cell lines, J. Immunol. Methods211:199–210.
Mire-Sluis AR, Gaines Das R, Gerrard T, Padilla A, Thorpe R (1996), Biologicalassays: their role in the development and quality control of recombinant biologicalmedicinal products, Biologicals 24:351–361.
Oggero M, Forno G, Kratje R, Etcheverrigaray M (2006), Rational selection ofan antibody probe to detect the heterogeneous collection of CHO-derivedrhGM-CSF glycoforms, Biotechnol. Lett. 28:2049-2056, DOI 10.1007/s10529-
346 Animal Cell Technology

006-9187-3, electronic online first article.Pepin R, Lucas D, Lang R, Lee N, Liao M, Testa D (1990), Detection of picogram
amounts of nucleic acid by dot blot hybridization, BioTechniques 8:628–632.Sinclair AM, Elliot S (2004), Glycoengineering: the effect of glycosylation on the
properties of therapeutic proteins, J. Pharm. Sci. 94:1626–1635.Southern EM (1975), Detection of specific sequences among DNA fragments separated
by gel electrophoresis, J. Mol. Biol. 98:503–517.Svensson H (1961), Isoelectric fractionation, analysis, and characterization of ampho-
lytes in natural pH gradients, the differential equation of solute concentrations ata steady state and its solution for simple cases, Acta Chem. Scand. 15:325–341.
Thorpe R, Wadhwa M, Mire-Sluis AR (1997), The use of bioassays for the character-ization and control of biological therapeutic products produced by biotechnology,Dev. Biol. Stand. 99:79–88.
Wadhwa M, Bird C, Page L, Mire-Sluis AR, Thorpe R (1995), Quantitative biologicalassays for individual cytokine, In: Balkwill FR (Ed.), Cytokines: A PracticalApproach, IRL Press, New York, pp. 357–391.
Whiteside TL (1994), Cytokine measurements and interpretation of cytokine assays inhuman disease, J. Clin. Immunol. 14:327–339.
WHO (World Health Organization) (1991), Guidelines for assuring the quality ofpharmaceutical and biological products prepared by recombinant DNA technol-ogy, WHO Technical Report Series, 814:59–71.
Quality control of biotechnological products 347


14Regulatory aspectsMaria Teresa Alves Rodrigues and Ana Maria Moro
14.1 Introduction
The scientific and technological achievements of the last decades haveallowed the discovery and production of new biological medicines, orsubstitution of those previously extracted from animal sources, like insulinand growth hormone. Most of those medicines are proteins obtained byanimal cell cultivation, which differs from bacteria and yeast in that animalcells carry out post-translational modifications needed for biologicalactivity and similar to the natural protein. Biopharmaceutical productionin mammalian cells, including hormones, monoclonal antibodies (mAbs),vaccines, and other molecules with medical interest, involves high costprocesses due to factors such as:
• low cell yield• complex culture media• shear sensitivity• low resistance to toxic metabolites• complex purification• rigorous control of all phases• sophisticated methodologies of process control and final product
control.
Concepts like quality, safety, and efficacy should be taken into con-sideration during process development, since it is not enough to inspectand test only the final product. Good Manufacturing Practice (GMP), aswell as quality assurance systems are essential to guarantee safety, quality,and economic feasibility during the whole process and therefore to obtaina marketing license.
Biopharmaceuticals, like synthetic pharmaceuticals, can cause adverseeffects. Protein molecules can elicit immunological reactions in patients,which can be enhanced by small modifications of the molecule. Thus, it isvery important to proceed with in-process controls, final product testing,and process validation. By the use of refined analytical methodologies it ispossible to change dogmas such as ‘‘the process defines the product,’’which is imperative for old biological products composed of complex andless purified mixtures. The more recent biopharmaceuticals might be con-sidered as ‘‘well characterized.’’ During the last few years considerablediscussions have occurred between regulatory agencies and manufacturersconcerning the requirements needed for product safety, so regulations areconstantly evolving due to advances in research. In this chapter we presentthe latest positions concerning animal cell-derived biological products

adopted by the regulatory agencies of the major pharmaceutical markets inthe world – the FDA (Food and Drug Administration) in the UnitedStates and EMEA (European Medicines Evaluation Agency) in the Eur-opean Union – as well as by the WHO (World Health Organization) andICH (International Conference on Harmonization of Technical Require-ments for Registration of Pharmaceuticals for Human Use).
14.2 GoodManufacturing Practices and quality assurance
Quality, efficacy, and safety of a medicine are attributes to be planned andestablished throughout the production process. This concept is especiallyvalid for the production of biologics to assure the fundamental character-istics of efficacy and safety to the patient in each vial of every lot. Everystep of pharmaceutical manufacturing should follow high standards in-tended for production consistency and product quality. The principlesdefining these standards are described in the ‘‘Good ManufacturingPractices’’ (GMP) publications.
GMP principles were originated in the US, by the FDA, in 1978. Theprinciples are generally accepted throughout the world. Regulatory autho-rities verify the adherence and compliance to these principles, regularlyinspecting the production plants, and determine whether a manufacturinglicense is maintained or revoked. GMP principles are generic and applic-able to all pharmaceutical processes, but may be complemented by specificconditions depending on products or systems. As an example, the Eur-opean Union publication (EC, 1998a) includes the following chapters:‘‘Quality management’’, ‘‘Personnel,’’ ‘‘Premises and equipment,’’ ‘‘Doc-umentation,’’ ‘‘Production,’’ ‘‘Quality control,’’ ‘‘Manufacture and analy-sis contract,’’ ‘‘Complaints and product recall,’’ and ‘‘Self-inspection.’’ Inaddition to the main chapters, there is a series of annexes: ‘‘Production ofsterile products,’’ ‘‘Production of biological products for human use,’’‘‘Production of medicines in development intended for clinical trials,’’‘‘Production of human blood and plasma derived products,’’ ‘‘Computer-ized systems,’’ ‘‘Parametric release,’’ among others. Similarly, the FDApublishes the ‘‘Points to Consider’’ (PTC) and ‘‘Letters to Industry’’, andWHO publishes specific annexes.
The GMP principles are part of a wider concept that encompasses manyaspects that can influence product quality; this concept constitutes the‘‘quality assurance’’ system (QA). QA is the sum of systematic actions,which are intended to guarantee quality standards expected for a givenproduct. The QA system concerns all steps that can influence biopharma-ceutical quality, such as: research and development; project evaluationunder GMP rules; designation of responsibilities with definition of posi-tions and functions; selection of suppliers; raw material storage; processdevelopment; validation; pilot scale production; clear description of pro-duction and control operations following GMP requirements; testing andcontrol of raw materials, intermediate product, bulk product, and finishedproduct; records; labeling; distribution; and complaints. Self-inspection isalso part of the program aiming to evaluate the effectiveness and applicationof QA system. The QA system should include formal training of produc-
350 Animal Cell Technology

tion and QA personnel, making the whole staff conscious of these practicesand their importance for quality attainment. The concepts of QA, GMP,and quality control (QC) are inter-related aspects of quality management.
QC is a segment of the QA system and encompasses sampling, inspec-tion, test and release of raw materials, packaging materials, and intermedi-ate, bulk, and finished products. The final product release depends onaspects like critical examination of production conditions, results of in-process assays, manufacturing documentation, adherence to the specifica-tions, and examination of final packaging. The QC department should beindependent of other departments and be granted access to the productionareas whenever considered necessary for sampling or investigation, andshould be involved in all decisions related to product quality (EC, 1998b;Christiansen, 1999; ANVISA, 2003).
The manufacture of biological products, unlike that of pharmaceuticals,uses materials that present variability. The active substance is generallyproduced in small quantities and needs to be separated from complexmixtures containing several types of contaminants. Lots are generally smalland quality control tests are usually based on biological techniques thatpresent higher variability than physicochemical assays. The processes arealso susceptible to microbial contamination. The in-process controls are offundamental importance to detect quality deviations that cannot beassessed through assays performed only on the final products.
The development of biological products obtained through animal cellculture, such as recombinant proteins and mAbs, has resulted in well-characterized, high purity therapeutic products. The purification pro-cesses generally include various chromatography steps, and the productsare analyzed by sophisticated analytical techniques and validated bybiological activity assays. In 1995, the concept of a ‘‘well-characterizedproduct’’ (WCP) was introduced by the FDA, being defined as an entitywhose purity, potency, and quantity can be determined and controlled.For a biological compound to be considered a WCP, certain tests anddata are not needed, making it simpler to introduce changes to themanufacturing process. To be granted a WCP profile, a product mustmeet some criteria defined by the industry and the FDA. The manufac-turing process should be robust, reproducible, and validated. Validationis used to demonstrate product safety when produced with consistentstandards (for example, demonstration of the removal of impurities andadventitious agents through validated analytical tests). Also, the productshould be safe from a toxicological perspective and should pass character-ization tests to confirm identity, purity, and potency (Foulkes andTraynor, 1999; Schiff, 2004). For recombinant DNA-derived proteins,the identity can be assessed by primary and secondary structure determi-nation, including amino acid sequence analysis, presence of disulfidebonds, and post-translational modifications such as glycosylation. mAbscan be identified by physicochemical and immunochemical assays. Purityand impurities should be quantifiable and the impurities should beidentified whenever possible; the quantity and biological activity shouldbe measurable. When a product satisfies these criteria, it is considered‘‘well characterized’’ and can be regulated with less interference from theFDA (Henry, 1996).
Regulatory aspects 351

14.3 Regulatory agencies
The US regulatory authority for medicines is the FDA. Inside its organiza-tional structure, biological products such as vaccines, blood-derived pro-ducts, antisera, toxins, and antitoxins intended for therapeutic use areunder control of the Center for Biologics Evaluation and Research(CBER). mAbs for in vivo utilization, immune modulators, and therapeu-tic proteins like cytokines, growth factors, and enzymes are generallyunder the surveillance of the Center for Drug Evaluation and Research(CDER). The FDA regulates clinical trials, evaluates investigational newdrug (IND) applications, analyzes clinical data, checks commercial li-censes, inspects and approves industrial installations, and verifies GMPadherence.
In the European Union, the regulatory authority is the EuropeanCommission (EC), composed of representatives of each participatingcountry. The role of the EC is to propose legislation for the EuropeanUnion. For pharmaceuticals it has a ten-volume series, named The RulesGoverning Medicinal Products in the European Union (EC, 2007). Thesevolumes comprise all aspects of pharmaceutical activity. In 1995 thecreation of the EMEA (European Medicines Evaluation Agency, laternamed European Medicines Agency), based in London, simplified therequirements needed for new drug registration. EMEA, like the FDA,receives applications for the marketing of pharmaceutical products.Although they have similar functions, the FDA has the authority to granta license, while EMEA does not. Through the CPMP (Committee forProprietary Medicinal Products), the EMEA advises on product licensing,but only the EC has authority to grant a marketing license that covers theEuropean Union, which constitutes the largest pharmaceutical market inthe world, followed by the USA and Japan. The PAB (PharmaceuticalAffairs Bureau) regulates the pharmaceutical industry in Japan.
In Brazil, the biological products are regulated by ANVISA (NationalAgency for Sanitary Vigilance), which has the authority for regulation,control, and inspection of products and services that can be hazardous topublic health. It is linked to the Health Ministry, and was created inJanuary 1999. The resolution RDC 315 (ANVISA, 2005) regulates bio-logical products including vaccines, hyperimmune sera, blood-derivedproducts, biomedicines, and allergens. The biomedicines include productsobtained from biological fluids or tissues of animal origin, as well as mAbsand others obtained through biotechnological processes. Biological pro-ducts from other countries can be registered in Brazil if they are registeredand licensed in their country of origin. New medicine registration andapproval is based on the Medicines Technical Chamber report.
14.4 Harmonization
The goal of the pharmaceutical industry to compete on the internationalmarket is hampered by differences among the regulatory requirements. Tobring uniformity, the ICH has been promoting a process of harmonizationof the technical requirements for pharmaceuticals registration amongpharmaceutical industries and regulatory authorities from Europe, the
352 Animal Cell Technology

USA, and Japan since 1990. This effort is supported by the pharmaceuticalcompanies because it will make for more efficient regulation in the mostattractive markets and will also be beneficial to patients with fasteravailability of new drugs. The ICH aims to eliminate duplication of assaysduring research and development of new drugs, as well as provide guide-lines intended to unify the requirements for approval (Walsh, 2004a;Foulkes and Traynor, 1999).
14.5 Premises
14.5.1 Clean rooms
Due to the inherent variability of animal cell-based systems, in-processcontrol and strict adherence to GMP are of critical importance forobtaining quality products. Carefully planned facilities, together withbioreactor design and in-process control systems, determine productquality at feasible manufacturing costs. The regulatory agencies (EC,1998a; CFR, 2003) clearly state that the premises and equipment mustfollow GMP standards.
As most biopharmaceuticals are delivered by the parenteral route,production plants must follow rules for ‘‘injection’’ quality. Criticaloperations are done in clean areas. Other facilities, such as storage,packaging, and quality control, should be adequately built and maintainedwithin appropriate conditions of cleaning and hygiene (Walsh, 2004b).Clean areas are defined by the number of particles per unit volume of air.Thus, the main element of a clean area is filtered air. Clean rooms aredesigned to protect the product from contamination by microorganismsor particles, which may be derived from various sources, air-borne,personnel, or equipment. HEPA (high efficiency particulate air) filters areused to filter the air and remove particulate matter. Sterile products aremade in rooms with positive pressure intended to avoid the entry ofcontaminants from outer rooms. For manipulating pathogens, toxic sub-stances or radioisotopes, the recommendations are to conduct operationsin a negative pressure area, with air flow exhaustion through sterilizingfilters that should be treated after use (usually incinerated).
Each operation of a production process takes place in a different roomwithin the clean area and might require a specific and defined environmentand cleanliness. Rooms should be designed to maintain a degree ofcleanliness higher than required when not in use, so they are within limitsduring operational use. Clean rooms intended for production of sterileproducts are classified according to the total and live particles in theenvironment. In Europe (EC, 2003) clean rooms used to be classified as A,B, C, and D; A being for the most critical operations like filling and asepticconnections, while C and D areas were intended for most of the opera-tions, upstream, downstream, and solutions preparation. The correspond-ing US classification (IES, 1992) was to designate a clean room as class 100(equivalent to A/B above), class 10.000 (level C) or class 100.000 (level D).Brazilian rules (ANVISA, 2003) used to follow the European and WHOnorms (WHO, 2002).
Regulatory aspects 353

A harmonized classification was issued recently with ISO 14644-1, withreference to the classification terminology and also with units (now in m3).Rooms classified as ISO class 5, 7, or 8, correspond respectively to UScategories 100, 10.000, or 100.000 (SBCC, 2005). The key element of theISO class 5 is laminar air flow, a mass of air that flows at a controlled andlow rate and so drags particles without turbulence. These are generallyrepresented by air flow cabinets (islands of ISO class 5).
Another point to consider when designing a clean room is the materialused in construction. Internal surfaces (walls, ceilings, and floors) shouldbe formed by unbroken surfaces made of smooth materials with noshedding particles, therefore allowing easy cleaning and disinfection.Corners should be round. The installations should have a minimumamount of shelving and equipment designed to reduce dust and facilitatecleaning. Recommended materials are polished stainless steel or solidresins.
The flow of materials and people must be carefully managed. FollowingGMP principles, materials should pass through an airlock that does notallow both doors to be open simultaneously. Used material and productsshould be removed by an independent exit. Personnel movement occursthrough separate rooms with separate doors for entry and exit.
The garments used by the workers should be made of synthetic fabricsthat minimize contamination risks. Operators should be trained for theirwork and also for the maintenance of clean conditions and hygiene.Cleaning is a key factor in the maintenance of good conditions and reducesor eliminates potential contaminants that can affect the product. Contami-nants can have various sources: live particles, inert particles (dusts, glass,file dust, lubricants, etc.) or cross-contamination when different processesor products share the same clean area. To avoid problems, the cleaningprocedures should be written and approved, validated, and executed bytrained operators.
14.5.2 Biosafety
Cell cultivation is a tool for the production of viral vaccines, tumorantigens, mAbs, and recombinant proteins. These organisms, their pro-ducts, or adventitious agents that may be present in the productionprocesses can potentially be transmitted to the operators, to the environ-ment, and to the outside. Protection measures must be taken to reduce thisrisk, so that containment must be a central issue regarding the design offacilities, bioreactors, and downstream processing equipment. To workwith GMOs (genetically modified organisms) requires adherence to spe-cific rules adopted by the regulatory agency of each country, for example,NIH (2002) in the USA and CTNBio (1997) in Brazil. When workingwith non-pathogenic recombinant DNA in mammalian cells (risk class I),biosafety level is classified as BSL-1 or BSL-1/’’large volume’’, when theworking volume exceeds 10 L and is in a closed system like a bioreactor.Some procedures, such as sampling, reagent addition, or liquid transfer,are critical and should be performed with particular care to avoid contam-ination. Exhaust gases from bioreactors should be filtered through HEPAfilters or incinerated. GMO-containing bioreactors should only be opened
354 Animal Cell Technology

after adequate sterilization. Waste liquid that could contain live recombi-nant or pathogenic organisms should be decontaminated before discarding.Simultaneous processing can be accepted for some products like mAbsand recombinant proteins once closed systems are used.
14.6 Cell banks
The production of heterologous proteins for therapeutic use requiresselection of the producer cell line, based on yield, monoclonality (forproteins), product quality, stability, and absence of contaminants likebacteria, molds, mycoplasmas, and viruses. Progress in the production ofbiopharmaceuticals by cell culture is due mainly to the use of diploid cellsand continuous cell lines, together with the maintenance of cells by cryo-preservation. It is important to guarantee that the expression systemchosen is able to generate the product in a consistent and economicallyfeasible way (Levine and Castillo, 1999).
The cells used for a process must be held in a cell bank, guaranteeing acontinuous supply during the lifespan of the product. According to theFDA (1993a), the master cell bank (MCB) is defined as a large number ofaliquots containing cells with uniform composition and derived from asingle tissue or cell and conserved in liquid nitrogen (–1968C). The MCBis used for the preparation of the working cell bank (WCB) that is used forthe manufacture of production batches. For the preparation of the banks,cells are cultured to an amount sufficient to dispense into hundreds ofindividual vials.
The documentation related to the cell banks should include the inven-tory of all vials, their identity, and their location. There must be amonitoring program for the stability of the cryopreserved cells in theMCB, including viability and growth characteristics. The cell banks mustbe generated in a controlled environment, observing GMP requirements.While preparing the banks no other cell line or virus should be cultivatedsimultaneously in the same laboratory or by the same operators. Access tothe stored vials should be controlled. The storage temperature should bemonitored and the liquid nitrogen level verified in all the storage units,with records of deviations and any correcting actions.
The manufacturer must establish the maximum cultivation span for aparticular cell in vitro (passage number). The characterization must in-clude the growth rate, morphology, specific yield, and quality of themolecule of interest (Wiebe and May, 1990). The post-production cells(PPCs) must be removed from the bioreactor and tested at least once toevaluate whether new contaminants were introduced or induced by thecultivation conditions. Changes in the culture medium or production scalerequire new evaluation of the PPCs to determine any effects on the yieldand product consistency (Levine and Castillo, 1999).
14.6.1 Cell bank qualification
The cell bank qualification must consider many factors including thepresence and identification of contaminants (FDA, 1993a; ICH, 1998a;
Regulatory aspects 355

WHO, 1998). Usually an extensive characterization is required for theMCB, including tests for the establishment of cell properties and stabilityof those properties during the production process. The WCB must besubjected to tests such as microbial sterility, including mycoplasma detec-tion tests and routine tests for virus detection (in vitro and in vivo), inorder to identify contaminants that might be introduced by the culturemedia or manipulation. This is important because the composition ofculture media is changing, with the trend to substitute animal sera forchemically defined or animal component-free formulations. For cell lineselection for the production of biologicals, FDA (1997) and WHO (1998)do not allow the use of cells obtained from carriers of transmissiblediseases or diseases of unknown etiology. Cells from neural origin cancontain or are able to amplify the causative agent for spongiform encepha-lopathy and therefore must not be used for the production of biologicals.
Cell line characterization
The cell line should have a detailed history, including origin (organ, tissue,age, gender, and donor species) and a description of the methods used forits screening, history of passages, and culture media used. The cell charac-teristics that are identified include: karyotype, isozyme profile, growthrate (generation time), morphology, tumorigenicity, or genetic markers(DNA fingerprinting). When dealing with recombinant products, thedocumentation should include information about the DNA insert thatcodes for the product, preparation method, and the complete DNAsequence (vector), including the regulatory sequences and antibiotic resis-tance markers. The history must contain the cloning details of therecombinant cell and the methodology used, as well as insert copy numberand the physical status of the vector inside the host cell, whether integratedor extrachromosomal. The nucleotide sequence of the insert that codifiesthe expressed product, as well as the restriction map of the expressionvector, must be analyzed at the characterization phase of the MCB and atleast once in the PPCs (FDA, 1985; ICH, 1995, 1998a; Onions, 1997).Cells such as human epithelial cells used for attenuated vaccine productionneed to be tested for tumorigenicity (FDA, 1993a). Whenever cells arecharacterized as non-tumorigenic, in vivo and in vitro testing are per-formed either with MCB or WCB cells propagated up to or over thecultivation time allowed for production, according to the methodologydescribed by WHO (1998).
Adventitious agent testing
Cells in culture are susceptible to microbial contamination from varioussources. The cell line itself can contain viruses derived from the animal itoriginates from. Other sources of animal contamination are sera, additivesto the culture media, or porcine trypsin used for detachment of adherentcells. Operators represent another contamination source. Bacterial andfungal contamination should be tested in 1% of the total number ofampoules, but not less than in two ampoules of MCB and WCB, accordingto the protocols described in the European, Japanese, or American
356 Animal Cell Technology

Pharmacopeia (ICH, 1998a). The absence of mycoplasmas must be verifiedin the MCB and WCB ampoules by at least two different methods (FDA,1993a). Mycoplasma contaminations are rather common and persistentwhile not causing perceptible morphological changes. They can causechromosomal alterations, as well as changes in cellular metabolism andviral replication. According to the literature, the most common sources ofcontamination are oral human microbiota due to operator contamination,and bovine microbiota originating from sera (Timenetsky et al., 1992).
Virus testing
Routine testing for adventitious virusesCells derived from MCB or WCB must be tested for adventitious virusesby in vitro and in vivo methods. For the in vitro test, indicator cells can beused to verify cytopathic or morphological changes when challenged withthe product, the cells used for production or other related materials, likeculture supernatant or lysed cells. The in vivo testing for viral agents thatinduce pathologies can be carried out by the intramuscular inoculation ofcells or cell lysates into adult and newborn mice and guinea pigs. Analternative is the intracerebral inoculation of mice with the test material.Any abnormality observed in the clinical state or mortality of the animalsindicates the possibility of infection that needs to be investigated. For egginoculation, viable cells should be injected into the allantoid cavity andyolk sac of embryonated chicken eggs. Cells from MCB and WCB areaccepted when neither animals nor eggs show evidence of any viral agent(Onions, 1997; WHO, 1998).
Testing for specific virusesSpecies-specific viruses potentially present in mouse, hamster, and rat celllines should be tested through assays for antibody production in therespective animals (MAP, HAP, or RAP). In this assay the cells areinoculated into an animal of the corresponding species, which is bled after28 days to evaluate the presence of antibodies against the specific viruses(WHO, 1992, 1998; ICH, 1997). For the lymphocytic choriomeningitisvirus, murine cytomegalovirus, murine rotavirus, thymic virus, and lacticdehydrogenase virus, specific tests are recommended (Onions, 1997). TheMCB should not be used for production if any potentially human disease-causing virus or polyomavirus is found. Other viruses present do notprevent cells from being used, since removal or inactivation proceduresduring the downstream processing can be validated. For human cell linesthe tests should include Epstein–Barr virus, cytomegalovirus, hepatitis Band C, herpes 6 virus, and any other viruses derived from the donor’sanamnesis. Hybrid cells derived from two species should be tested forviruses specific to both species (FDA, 1997; WHO, 1998). Animal-derivedreagents like sera or trypsin should be certified through appropriate testing(WHO, 1990). Specific detection tests are required for bovine diarrheavirus, bovine polyomavirus, and prions. Prions are agents of bovinespongiform encephalopathy (BSE) and present a particular risk. It isrecommended to use sera exclusively from non-endemic countries of BSEor, even better, not to use animal-derived reagents at all (WHO, 2003).
Regulatory aspects 357
Today, many media suppliers offer serum-free and/or animal component-free media, thus decreasing contamination risks.
Testing for retrovirusesRetroviruses are associated with oncogenic and degenerative diseases andmay be present in some cell lines. They represent a problem since someretroviruses are able to replicate in human cells. Cells from the MCB andcells cultivated over the regular in vitro cultivation period (passage num-ber) should be tested for rodent retroviruses by electronic microscopyand infectivity on susceptible cells (transformation focus detection inS+L- cells, as well as syncitium and plaque formation in XC cells). Ifinfectivity is not detected and electronic microscopy does not revealretroviruses or retrovirus-like particles, a reverse transcriptase assay can beused to detect non-infectious retroviruses (ICH, 1997). Myelomas usedfor production of mAbs have the inherent capacity of producing infectiousretroviruses, and therefore a suitable test should be performed in severalsupernatant harvests and lot-to-lot consistency should be demonstrated.At the end of a typical cultivation process the burden of endogenous viralparticles should be determined. These data are important for planning thepurification process, including steps for removal or inactivation of retro-viruses (FDA, 1997; WHO, 1998). The CHO cell line expresses defectiveretroviral particles; although CHO retroviruses are not infectious, recom-bination is frequent and DNA repair can occur. Thus, for the purificationof CHO-derived recombinant proteins, it is recommended to include oneor more robust steps for retrovirus removal or inactivation. For cells otherthan murine, specific assays for retroviruses are necessary. Cells fromhuman origin should be tested for human T-lymphotropic retrovirus(HTLV-1 and -2) and for the lentiviruses HIV-1 and HIV-2 (FDA, 1997;Onions, 1997).
14.7 Validation
The concept of validation came up in the 1970s in association withsterilization procedures and was extended to all steps of pharmaceuticalmanufacturing procedures. Validation means proving that any and allprocedures, processes, equipment, material, operations, and systems com-ply with the expected performance. Well-planned and well-conductedvalidation studies constitute GMP principles once they guarantee a con-sistently safe and efficacious final product. Validation is important forcompanies, first for QA, and also for cost reduction, decreasing failures,rejection, reworks, recalls, and complaints. The positive aspect of valida-tion is an increase in productivity, as a consequence of a well-controlledprocess. Validation is required by the regulatory agencies of many coun-tries.
14.7.1 General aspects
A validation plan (Validation Master Plan) is a GMP requirement, attest-ing control of all critical operation aspects. Consistent results must be
358 Animal Cell Technology

demonstrated in at least three studies with representative production runsshowing acceptable and comparable results. Unlike other GMP require-ments, validation itself does not improve the process. It confirms that theprocess is adequately developed and under control. Validation processesrequire the mutual collaboration of all related sectors, such as develop-ment, production, engineering, maintenance, QA, and QC (ANVISA,2003).
Design Qualification (DQ) is the first validation element of a newfacility system or equipment, where adherence to the user’s specificationsand to GMP rules is demonstrated. Installation Qualification (IQ) followswith the verification of adequacy of the area, installation of equipmentpipelines, utilities, instrumentation, and conformity of the material used tothe project specifications. At the Operational Qualification (OQ) phase,carried out after installation of all equipment, it is verified whether thesystem, when in operation, complies with the acceptance criteria definedin the validation plan. Once the OQ phase is successfully finalized it ispossible to proceed with the calibration procedures, operation and clean-ing, operator training, and preventive maintenance program. After IQ andOQ are concluded, it is time for the Performance Qualification (PQ), withthe aim of verifying that what was designed, built, and operated results ina product that meets the expected specifications. Production and QCpersonnel are specially trained for these assessments. The tests can be donewith the product of interest or a placebo, and are related to all operations,from raw material reception to product release (EC, 2001).
Process validation
Process validation is usually performed before commercialization (Pro-spective Validation). Exceptionally, it may be necessary to validate pro-cesses during routine production (Concurrent or SimultaneousValidation). Processes already in use can also be validated (RetrospectiveValidation). To validate a process, a previous validation of facilities,systems, equipment, and analytical methods (ICH, 1996a), as well asprevious training of operators (WHO, 1996; EC, 2001), are required.
Cleaning validation
The efficiency of cleaning procedures should be verified through validatedanalytical testing with enough sensitivity for residues or detection ofcontaminants at acceptable levels. It is important that all surfaces poten-tially in contact with the product be cleaned by previously validatedmethods. The FDA proposes that manufacturers set limits for activeprinciple residues after cleaning and in the product to be obtained at asubsequent production run (FDA, 1993b). A multipurpose plant should bespecially monitored to avoid cross-contamination (Doblhoff-Dier andBliem, 1999).
Regulatory aspects 359

Changes in validation
Any change in material, product components, equipment, environment,methodology, or assays that could affect product quality or processreproducibility should be documented. It should be guaranteed that, afterthe alterations, the process results in a product that meets the specifica-tions previously approved. All changes that might affect product qualityor process reproducibility require revalidation and therefore should besubject to permission by the regulatory agencies (WHO, 1996; EC, 2001).
14.7.2 Biological products
The norms for medicinal production are particularly stringent. Biologicalproducts are composed of complex molecules, produced by cell lines witha relatively recent history, and difficult to characterize. Tests performedonly on the final product do not guarantee consistency of production. Thepurification procedures should be planned and validated for the removalof potential contaminants from diverse sources: cells, culture media,equipment, and reagents used in the purification or even degradationproducts derived from the protein itself. There are examples of productswith unexpected risks that have caused serious problems such as bloodcontamination by HIV-1 virus between 1980 and 1985 (Bloom, 1984) orthe presence of residual infectious viruses in the poliomyelitis vaccine dueto inefficient inactivation (Lubiniecki et al., 1990).
Potential risks associated with animal cell-derived products
Among the products derived from animal cells, the potential contaminantsare associated with: (i) the cell itself (whole cells, viruses, and othertransmissible agents, cellular DNA and growth-promoting proteins); (ii)raw materials (adventitious agents such as bacteria, molds, mycoplasma,viruses, foreign proteins, and endotoxins); (iii) reagents used in the process(antibiotics, resin ligands, solvents, sanitizers, inducers, and nutrients).The production planning must include steps for the removal or inactiva-tion of potential risk factors. It is important to identify the introduction,reduction, or concentration of a given risk factor and its content duringthe process and in the final product.
The regulatory authorities evaluate safety aspects when the applicationfor registration is submitted. During product development it is possible todiscuss further with the authorities with the aim of establishing safetylimits (Lubiniecki et al., 1990; WHO, 1998).
Viruses and other transmissible agentsVirus identification can start during cell bank characterization and con-tinues until the final product is obtained. It is essential to demonstrate thatthe viruses are not co-purified with the product (FDA, 1993a, 1997; ICH,1997). The efficiency of removal or inactivation procedures should bedemonstrated on a small scale through spiking experiments, by the use ofthe viruses themselves, when identified and possible, or with model viruseswhich mimic any possible variants: large or small, DNA or RNA genome,
360 Animal Cell Technology

enveloped or not, and with variable resistance to physicochemical agents.At least one or preferably more steps for virus removal or inactivationshould be included in the purification process. The validation is carriedout by deliberate contamination of the supernatant with high titers of themodel viruses followed by performing the complete purification protocol.The viral burden is quantified at each step of the process, and thecumulative virus reduction capacity is usually expressed on a logarithmicscale (FDA, 1997).
Cellular DNACells derived from primary cultures or diploid cell lines have been usedfor a long time for viral vaccine production and the residual cellular DNAis not considered of risk to the users. On the other hand, continuous celllines, which can be cultivated indefinitely due to deregulation of growthcontrol genes, are thought to pose risks to the users due to the possibletransmission of transformation characteristics (Barone et al., 1992; Bert-hold and Walter, 1994). However, Wierenga et al. (1995) injected a humantumor DNA into monkeys over an 8-year period without tumor induc-tion. The quantity of DNA administered to a patient undergoing bloodtransfusion can reach 450 �g (Duxbury et al., 1995), which is 106 timeshigher than the limit allowed in products derived from continuous celllines. These facts, taken together with other evidence (Kurt, 1995; Petric-ciani and Horaud, 1995; Temin, 1990), led to the argument that the riskassociated with residual cellular DNA is low when the amount is 100 pgper dose or less. An important aspect is that residual contaminant DNAusually occurs in small fragments of 200–500 bp (Rodrigues et al., 1997),thus not codifying a functional gene.
According to WHO (1998), DNA from a continuous cell line can beconsidered a cellular contaminant, instead of a significant risk factor thatrequires reduction to extremely low levels. Therefore, upper limits of10 ng per dose are acceptable for products generated from continuous celllines. Only in specific situations that might be considered harmful, forexample, when infectious retroviral pro-virion sequences are present, theacceptable limit per dose should be assigned by the regulatory authorities.Levels of cellular DNA should be measured in the supernatant harvest, inthe intermediate purification steps and in the final product to determine itsinitial concentration and whether it was removed or concentrated. Theremoval efficiency must be determined based on several runs to ensureconfidence in the data. Validation of the process excludes the need forresidual cellular DNA testing in the bulk product (FDA, 1997; WHO,1998).
Other contaminantsThe presence of transforming proteins that induce the proliferation ofdifferent cell lines and that are coded by oncogenes represent a limitedrisk, as they are secreted in small amounts and are quickly inactivatedwhen administered in vivo (Petricciani, 1988; Lupker, 1998). Analyticaltests to assess purity as well as the purification process should be validatedto demonstrate the capacity to remove host cell proteins to acceptablelevels. Once the lot-to-lot consistency has been demonstrated, the test can
Regulatory aspects 361

be dispensed with for release of the bulk product (WHO, 1998). Otherpotential contaminants that should be monitored are endotoxins, animalsera-derived proteins or protein fragments, and degradation products orother contaminants derived from the purification process, such as resinligands, detergents, or salts. The purification steps should be designed toeffectively remove those contaminants and the assays for their quantifica-tion should be validated (ICH, 1996a).
14.8 Stability
Stability is defined as the period of time during which the productmaintains, within the specified limits, the same characteristics and proper-ties displayed when it was manufactured. Environmental factors like tem-perature, air, light, ionic content, and humidity can affect the drug’squality (Ugwu and Apte, 2004). Proteins are susceptible to proteolysis,denaturation, aggregation, fragmentation, and chemical modifications suchas oxidation and changes in the disulfide bonds. The degradation processdirectly affects the biological activity of the product and might causeimmunogenicity, among other adverse effects. The shelf-life is determinedby stability tests that guarantee that the product is active, pure, and safeduring a specified period, if stored under the prescribed conditions. Thestability tests should establish identity, purity, potency, and modificationsof the product. Tests to demonstrate stability include: (i) potency ofbiological activity in vivo or in vitro, compared to reference material; (ii)purity and molecular characterization of the active component and degra-dation products, by SDS-PAGE, capillary electrophoresis, immunoelec-trophoresis, western blotting, isoelectric focusing, chromatography(reverse phase, ion exchange, hydrophobic interaction, or affinity), peptidemapping, circular dichroism, or mass spectrometry; (iii) physical charac-teristics and appearance (color, opacity, pH, visible particulates in thesolution or after reconstitution of the lyophilized material); (iv) sterilitytesting or alternatively package integrity testing; (v) assays to quantifyadditives, stabilizers, preservatives, or excipients.
For registration, the stability tests supporting the proposed shelf-lifemust be performed in three consecutive product batches in their finalpackage. The data obtained on a pilot scale are accepted for registrationwith a commitment by the manufacturer, after approval, to submit the firstthree batches of the commercial-scale production for stability testing. Theshelf-life of biological products determines the frequency at which thetests should be repeated. For a product with a shelf-life longer than 1 year,the tests should be repeated every 3 months for the first year, every 6months for the second year, and annually after that. The stability shouldbe monitored after the beginning of commercialization with enoughbatches and a frequency to allow a tendency analysis (ICH, 1996b; EC,2004). Accelerated tests (Tydeman and Kirkwood, 1984), with samplesstored at temperatures above the specifications, can help in the identifica-tion of degradation products and evaluate the capacity of analytical toolsused in the stability testing.
362 Animal Cell Technology

14.9 Clinical trials
The same process that will be used for commercial-scale productionshould be adopted to produce the material used in the preclinical andclinical trials. Significant differences in the production process used toobtain this material can invalidate the clinical trial results for the commer-cial product, unless the comparability is demonstrated by identity, purity,stability, and potency tests (ICH, 1998b).
14.9.1 Preclinical studies
Preclinical studies of a new drug give a good indication of its safety beforeit is used in volunteers. The main objectives of a preclinical trial are todetermine the initial safe dose for humans, to define the dose regime, toidentify potential toxicity, the organs that may be affected, the severity ofadverse effects, and to identify safety parameters for the clinical monitor-ing. The preclinical studies use two approaches: in vitro and in vivo. Thespecies specificity, immunogenicity, and pleiotropic activity should betaken into consideration for biopharmaceuticals (ICH, 1998b).
Biological activity/pharmacodynamics
The biological activity can be assessed through in vitro assays with celllines with the objective of determining which effects can be related to theclinical efficacy. The animal species selected for toxicity assays shouldconsider the species specificity of the biopharmaceutical. Mammalian celllines can be used to anticipate specific in vivo activity on other speciesincluding the human. For mAbs, immunological properties must be stud-ied, including the antigen specificity, as well as complement binding andcross-reactivity with tissues other than the target. The FDA recommenda-tions (1997) for mAbs list a series of human tissues that must be includedin the cross-reactivity testing. A positive result with a non-target humantissue requires an extensive animal study. Preclinical studies for theevaluation of pharmacological and toxicological properties may involve alarge number of animals. Consequently, economical and ethical considera-tions have encouraged the development of alternative in vitro systemsusing cell culture. The guidelines for these studies are being constantlyrevised by the regulatory authorities.
Toxicity studies
Toxicity studies include the evaluation of acute and chronic effects andreproductive toxicity, as well as mutagenic and carcinogenic activity(CNS, 1997; ICH, 1998b; Walsh, 2004a).
Acute and chronic toxicityAcute toxicity is determined by the administration of one high dose of theproduct to rodents, usually rats and mice of both genders. Two deliveryroutes are chosen, one being that proposed for normal product use. Theanimals are monitored and any deaths are analyzed in detail.
Regulatory aspects 363

Studies of chronic toxicity require daily or intermittent administrationof the drug, mimicking the clinical use. The doses are chosen within adefined range, ensuring that the higher dose can induce an adverse effect ofmoderate amplitude and the lower dose does not induce any adverse effectat all. Two species are chosen, usually rats and dogs of both genders,submitted to clinical evaluation with blood and urine analysis. At the endof the study the animals are evaluated by pathological tests. The durationof the study depends on whether the biopharmaceutical is intended for ashort or prolonged usage.
Reproductive and teratogenic toxicityThe evaluation of reproductive and teratogenic toxicity, when required,depends on the biopharmaceutical itself and on the end users. Thereforeproduct characteristics should be taken into consideration when designingthe study. In cases with potential immunotoxicity for fetal development,the study must include monitoring of newborn immune functions. Gen-erally the reproductive toxicity study verifies the drug effect on thereproductive functionality of males and females. Male spermatogenesisand female follicular maturation are specifically monitored as well as post-mating surveillance to verify possible effects on the fertilization, implanta-tion, and fetal development stages. At least two species are used in thestudy, generally rodents, mainly rats and rabbits, sacrificed when thegestation period reaches near term, allowing the examination of motherand fetus.
Mutagenic activityThe routine studies for potential mutagenic activity normally performedon chemical drugs do not apply to biopharmaceuticals, as the administra-tion of large amounts of peptides or proteins makes the results difficult toanalyze. There is no evidence that these substances interact with DNA orother chromosomal material. In some instances the tests verify the effectof new excipients added to the formulated product.
CarcinogenicityConventional tests to verify the carcinogenicity are generally not adequatefor biopharmaceuticals. Even so, the tests should be performed dependingon the duration of treatment, the target population, and the biologicalactivity of the product, for example, growth factors and immunosuppres-sion agents. The study plan should be adapted to any suspected activityand may depend on specific product characteristics, starting with in vitrostudies and, if needed, complemented with in vivo tests.
14.9.2 Clinical studies
Any new medicine needs to be submitted to clinical trials to determine itssafety and efficacy. Clinical research with humans must meet the ethicaland scientific criteria defined in ‘‘Good Clinical Practices’’ (GCP) (ICH,1996c). Adherence to the GCP guarantees a trial design of high quality, itsimplementation, and appropriate divulgence of the results, thus assuring
364 Animal Cell Technology

the rights, safety, and care of the participants. The ICH norm (1996c)contains the requirements of the European Union, Japan, and the USA.
Clinical trials phases
Usually clinical studies follow three consecutive phases, I, II, and III. Anadditional post-registration study may be required, designated Phase IV(Acceturi et al., 1997; CNS, 1997). In some instances, intermediate phasesare carried out, I/II, Ia/Ib, etc.
Phase IThe drug is administered to a small group of healthy volunteers with theobjective of determining the processes of absorption, distribution, meta-bolism, and excretion (ADME) and the pharmacokinetic effects. Escalat-ing doses are compared to choose one suitable for both safety and efficacy.
Phase IIThis consists of a pilot therapeutic study, following acceptable results inPhase I. This phase aims to evaluate the medicinal effect on patientssuffering from the disease or pathological condition for which thebiopharmaceutical was developed. It has the objectives of establishing thebenefits and efficacy of the drug, the dose-response ratios and the short-term safety. Usually the double-blind technique is used, dividing thepatients into two groups, one receiving the biopharmaceutical and theother the placebo, in such a way that neither the physicians nor thepatients know to which group they belong. In some instances the placebois substituted by a previously approved drug for comparison.
Phase IIIIf Phase II is concluded with safety and efficacy, the therapeutic study isenlarged to include different groups of patients suffering from the disease.Confirmation of safety and demonstration of efficacy are the primaryendpoints of Phase III. As it involves a large number of participants, thedata analysis should be conclusive on the most frequent adverse reactions,interactions with other medicines, effective doses, advantages over pre-existing drugs, and main factors that affect the results (e.g. age). Phase IIIis usually an ‘‘open study’’ in which the patients are aware of whichmedication they are receiving. The competent authorities evaluate theclinical data of the Phase III study to decide whether to grant a license forcommercialization or not.
Phase IVThis is a post-marketing study, to establish the long-term safety of a drug,especially when a biopharmaceutical is intended for prolonged use. Ifunexpected adverse effects are observed the product can be withdrawnfrom the market. Some Phase III licenses are granted with the conditionthat an additional study phase should follow according to a predefinedplan.
Regulatory aspects 365

14.10 Biogenerics or biosimilars
A biogeneric or biosimilar medicine is defined as a substance producedafter an original patent has expired and with the demonstration ofsimilarity or equivalence to the original product. It is expected to beapproved through an abbreviated and simplified regulatory process, re-quiring lower costs, and to be sold with a generic name at a lower sellingprice than the branded product. FDA has adopted the name ‘‘follow-onprotein product,’’ defining it as a product that intends to be a similarversion of a protein product already approved.
Patent protection for the first group of biotechnological innovativeproducts has expired or will expire shortly, including interferons, humaninsulin, erythropoietin, granulocyte-colony stimulating factor, and hepati-tis B vaccine. Annual biopharmaceutical sales exceeded 30 billion dollarsin 2003 (Dimond, 2003), and this large market has stimulated companies toinvest in the development of biogeneric versions of products that have agood market size, a high aggregated cost, and a well-characterized activeprinciple. However, the hurdles for obtaining biogeneric approval areassociated with their complexity. Biologics are large proteins, structurallycomplex, heterogeneous, cell-derived products, attributes that are verydependent on the manufacturing process used to meet the requiredspecifications. Any change in the upstream or downstream steps mightlead to protein alterations and the biogeneric manufacturer is posed withthe difficult task of proving that the new product is as safe and effective asthe original one, that the immunogenicity is not altered, and that there isno detectable difference that could impact safety or efficacy. The require-ment for an extension of the clinical and preclinical studies will depend onthe nature of the active substance, the formulation, and the molecularcomplexity, as well as on possible differences from the reference product,including impurities and stability.
The principle that ‘‘the process makes the product’’ is mitigated in caseswhere the product is considered ‘‘well characterized’’ and can be easilycharacterized by well-refined analytical tools. A biogeneric is not identicalbut comparable. As an example, human growth hormone is being pro-duced by five different companies in Europe through different processesand expression systems; even so, all the processes seem to result inproducts presenting the same amino acids sequence profile, potency,safety, and efficacy (Polastro and Little, 2001).
The approval of biogenerics for commercialization depends not only ontechnical and scientific criteria, but also on the balance of political andeconomic interests. Generic medicines will allow a greater number ofpatients to benefit from high cost medicines, as biogenerics are expected tobe more affordable. Nonetheless the innovative pharmaceutical companiestry to postpone the marketing of biogenerics, intending to strategicallyprotect their investments, extending the patents through some modifica-tion, reducing prices and innovating by launching a second generation ofthe original product or a modified formulation intending to present a saferproduct or a more practical delivery route.
Both the EMEA and FDA are discussing the procedures that should berequired for registration of biogenerics. In 2004, EMEA was the pioneer
366 Animal Cell Technology

agency to adopt new rules to authorize the generic version of biopharma-ceuticals (Dorey, 2004), directed to the comparability of biological pro-ducts similar to those approved (EMEA, 2003, 2004, 2005a). The trend isto intensify the post-marketing requirements, especially regarding immu-nogenicity. A pharmaco-vigilance plan must be considered in the registra-tion application to the European Union for given biopharmaceuticals suchas erythropoietin (EMEA, 2005b), granulocyte-colony stimulating factor(EMEA, 2005c), and human growth hormone (EMEA, 2005d). The FDAconsiders that some biogenerics should follow the same pathway alreadyestablished for chemically synthesized pharmaceuticals, with the originalapproval designated as NDA (new drug application) instead of BLA(biologics license application) (Bouchie, 2002a; Evans, 2003). The onlyconsensus is that the biogeneric field is controversial involving many legalconsiderations. Given this, the FDA has given the opportunity for differ-ent interested groups to argue their positions. Workshops (FDA, 2004,2005a) have been organized to examine the technological and scientificaspects related to the development and marketing of biogenerics. Wheninnovative companies make changes in their processes after the firstapproval, aiming at optimization, they need to submit comparabilityprotocols (FDA, 2005b) that could be used for the biogenerics companiesas well.
Biogenerics of products such as erythropoietin, human growth hor-mone, hepatitis B vaccine, interferons, insulin, and granulocyte-colonystimulating factor are already available in various countries and regions,such as Korea, India, China, and South America (Bouchie, 2002b; Jayara-man, 2003), nonetheless the entry of these to the American and Europeanmarket is much more difficult. OmnitropeTM, a human growth hormoneproduced by Sandoz (Novartis group), was the first biosimilar medicine tobe approved in Australia in 2004 and in Europe in April 2006 (EMEA,2006). In May 2006, the FDA set a precedent by approval of the sameproduct, although this followed a court decision and may not suggesteasier approval for future biogenerics. The challenge for the biosimilarcompanies is to ensure the necessary requisites of safety, efficacy, andquality, while allowing access for a greater number of patients to benefitfrom high cost medicines. To attain these goals, the regulatory agenciesmust consider concepts like comparability and similarity, which are likelyto be dealt with on a case-by-case basis.
References
Acceturi C, Lewi DS, Lousana GB (1997), Manual de Boas Praticas em EnsaiosClınicos, UNIFESP/EPM, Sao Paulo, Brazil.
ANVISA (2003), Resolucao RDC N8 210 de 04 de agosto de 2003. Regulamentotecnico das boas praticas para a fabricacao de medicamentos, Diario Oficial daUniao, Brasılia, D.F. Available at: http://www.cff.org.br/Legisla%C3%A7%C3%A3o/Resolu%C3%A7%C3%B5es/res_210_2003.pdf (accessed October2006).
ANVISA (2005), Resolucao RDC N8 315 de 26 de outubro de 2005. Regulamentotecnico de registro, alteracao pos-registro e revalidacao de registro dos produtosbiologicos terminados. Diario Oficial da Uniao, Brasılia, D.F., 31 out. 2005.
Regulatory aspects 367

Available at: http://e-legis.anvisa.gov.br/leisref/public/showAct.php?id¼19411&word¼Farmacovigil%C3%A2ncia (accessed January 2007).
Barone D, Zaninelli P, Ferrara B (1992), Aspetti regolatori e metodologici dellavalidazione de linee cellulari continue per la produzione de biofarmaci, MinervaBiotec. 4: 82–95.
Berthold W, Walter J (1994), Protein purification: aspects of processes for pharma-ceutical products, Biologicals 22:135–150.
Bloom A (1984), Acquired immunodeficiency syndrome and other possible immuno-logical disorders in European haemophiliacs, Lancet 1:1452–1455.
Bouchie A (2002a), FDA restructures new review centers, Nat. Biotechnol. 20:960.Available at: http://www.nature.com/nbt/journal/v20/n10/pdf/nbt1002-960a.pdf(accessed October 2006).
Bouchie A (2002b), GeneMedix approval in China, Nat. Biotechnol. 20:213. Availableat: http://www.nature.com/nbt/journal/v20/n3/pdf/nbt0302-211.pdf (accessedOctober 2006).
CFR (2003), Code of Federal Regulations 21: parts 200–299. Available at: http://www.access.gpo.gov/nara/cfr/waisidx_03/21cfrv4_03.html (accessed October 2006).
Christiansen GD (1999), Quality control and quality assurance issues in biopharma-ceutical processing, In: Avis KE, Wagner CM, Wu VL (Eds), Biotechnology:Quality Assurance and Validation, vol. 4, Drug Manufacturing Technology Series,Interpharm Press, Buffalo Grove, pp. 33–71.
CNS (1997), Resolucao 251/97 de 7 de agosto de 1997. Normas de Pesquisa Envolven-do Seres Humanos para a Area Tematica de Pesquisa de Novos Farmacos,Medicamentos, Vacinas e Testes Diagnosticos. Diario Oficial da Uniao, Brasılia,D.F., 23 set.1997. Secao 1, p. 21.117.
CTNBio (1997), Instrucao normativa CTNBio N8 7, de 06.06.97. Normas para otrabalho em contencao com organismos geneticamente modificados – OGMs.Diario Oficial da Uniao, Brasılia, D.F., 09 jun.1997, Secao I, p. 11.827.
Dimond PF (2003), Manufacturers of Biogenerics Press Forward: But Demand forBioequivalence Standards May Yet Limit Market, Gen. Eng. News, 23:10–11.
Doblhoff-Dier O, Bliem R (1999), Quality control and assurance from the develop-ment to the production of biopharmaceuticals, Trends Biotechnol. 17:266–270.
Dorey E (2004), EU rules on biogenerics, Nat. Biotechnol. 22:141. Available at: http://www.nature.com/nbt/journal/v22/n2/pdf/nbt0204-141.pdf (accessed October2006).
Duxbury M, Jezuit M, Letwin B, Wright J (1995), DNA in plasma of human blood fortransfusion, Biologicals 23:229–231.
EC (1998a), The Rules Governing Medicinal Products in the European Union, GoodManufacturing Practice: Medicinal Products for Human and Veterinary Use, vol.4, Eudralex. Available at: http://pharmacos.eudra.org/F2/eudralex/vol-4/home.htm (accessed October 2006).
EC (1998b), Quality management, In: The Rules Governing Medicinal Products in theEuropean Union, Good Manufacturing Practice: Medicinal Products for Humanand Veterinary Use, vol. 4, Eudralex. Available at: http://pharmacos.eudra.org/F2/eudralex/vol-4/pdfs-en/cap1en.pdf (accessed October 2006).
EC (2001), Guide to Good Manufacturing Practice: Qualification and Validation,Annex 15, Brussels. Available at: http://europs.eu.int/comm/enterprise/pharmaceuticals/eudralex/vol-4/pdfs-en/v4an15.pdf (accessed October 2006).
EC (2003), Guide to Good Manufacturing Practice: Manufacture of Sterile MedicinalProducts, Revision to Annex 1, Brussels. Available at: http://europa.eu.int/comm/enterprise/pharmaceuticals/eudralex/vol-4/pdfs-en/revan1vol4_3.pdf (accessedOctober 2006).
EC (2004), Guide to Good Manufacturing Practice: On going Stability, Addition toChapter 6, Brussels. Available at: http://europa.eu.int/comm/enterprise/
368 Animal Cell Technology

pharmaceuticals/eudralex/vol-4/pdfs-en/2005_10_chapter_6.pdf (accessed Octo-ber 2006).
EC (2007), EudraLex – The Rules Governing Medicinal Products in the EuropeanUnion, Available at: http://ec.europa.eu/enterprise/pharmaceuticals/eudralex/index.htm (accessed September 2007).
EMEA (2003), CPMP. Guideline on comparability of medicinal products containingbiotechnology-derived proteins as active substances: quality issues, London.Available at: http://www.emea.eu.int/pdfs/human/bwp/320700en.pdf (accessedOctober 2006).
EMEA (2004), CPMP. Guideline on comparability of medicinal products containingbiotechnology-derived proteins as active substances: non-clinical and clinicalissues, London. Available at: http://www.emea.eu.int/pdfs/human/ewp/309702en.pdf (accessed October 2006).
EMEA (2005a), CHMP. Guideline on similar biological medicinal products containingbiotechnology-derived proteins as active substance: quality issues, London. Avail-able at: http://www.emea.eu.int/pdfs/human/biosimilar/4934805en.pdf (accessedOctober 2006).
EMEA (2005b), CHMP. Guideline on similar biological medicinal products containingbiotechnology-derived proteins as active substance: non-clinical and clinicalissues. Guidance on biosimilar medicinal products containing recombinanterythropoietins, Annex, London. Available at: http://www.emea.eu.int/pdfs/human/biosimilar/9452605en.pdf (accessed October 2006).
EMEA (2005c), CHMP. Guideline on similar biological medicinal products containingbiotechnology-derived proteins as active substance: non-clinical and clinicalissues. Guidance on biosimilar medicinal products containing recombinant granu-locyte-colony stimulating factor, Annex, London. Available at: http://www.emea.eu.int/pdfs/human/biosimilar/3132905en.pdf (accessed October 2006).
EMEA (2005d), CHMP. Guideline on similar biological medicinal products containingbiotechnology-derived proteins as active substance: non-clinical and clinicalissues. Guidance on similar medicinal products containing somatropin, Annex,London. Available at: http://www.emea.eu.int/pdfs/human/biosimilar/9452805en.pdf (accessed October 2006).
EMEA (2006), Press release: European Medicines Agency adopts first positive opinionfor a similar biological medicinal product. Available at: www.emea.europa.eu/pdfs/human/press/pr/3179706en.pdf (accessed October 2006).
Evans PC (2003), A coming of age for generic biologic formulations? Examining theregulations for expedited approval of generic biological drugs, Gen. Eng. News23:6,8,17.
FDA (1985), Center for Drugs and Biologics. Points to consider in the production andtesting of new drugs and biologicals produced by recombinant DNA technology,Rockville. Available at: http://www.fda.gov/cber/gdlns/ptcdna.pdf (accessedOctober 2006).
FDA (1993a), CBER. Points to consider in the characterization of cell lines used toproduce biologicals. Rockville. Available at: http://www.fda.gov/cber/gdlns/ptccell.pdf (accessed October 2006).
FDA (1993b), Office of Regulatory Affairs. Guide to inspections of validation ofcleaning processes, Rockville. Available at: http://www.fda.gov/ora/inspect_ref/igs/valid.html (accessed October 2006).
FDA (1997), CBER. Points to consider in the manufacture and testing of monoclonalantibody products for human use, Rockville. Available at: http://www.fda.gov/cber/gdlns/ptc_mab.pdf (accessed October 2006).
FDA (2004), CDER Public Workshop: Scientific Considerations Related to Develop-ing Follow-On Protein Products, September 14–15, 2004. Available at: http://www.fda.gov/cder/regulatory/follow_on/default.htm#publicworkshops (accessed
Regulatory aspects 369

October 2006).FDA (2005a), CDER Workshop: Scientific Considerations Related to Developing
Follow-On Protein Products, February 14–16. Available at: http://www.fda.gov/cder/regulatory/follow_on/default.htm#publicworkshops (accessed October2006).
FDA (2005b), CBER Guidance for Industry: Comparability of biotechnological/biological products subject to changes in their manufacturing process, Rockville.Available at: http://www.fda.gov/cder/guidance/6677fnl.htm (accessed October2006).
Foulkes J, Traynor G (1999), Regulation of antibodies and recombinant proteins, In:Rehm HJ, Reed G, Puhler A, Stadler P (Eds), Biotechnology, 2nd Ed., vol. 5a,Recombinant Proteins, Monoclonal Antibodies and Therapeutic Genes, Wiley-VCH, Weinheim, pp. 495–516.
Henry C (1996), FDA, reform, and the well-characterized biologic, Anal Chem., Nov1. Available at: http://pubs.acs.org/hotartcl/ac/96/nov/fda.html (accessed October2006).
ICH (1995), Steering Committee, Quality of biotechnological products: analysis of theexpression construct in cells used for production of rDNA derived proteinproducts, Geneva. Available at: http://www.ich.org/LOB/media/MEDIA426.pdf(accessed October 2006).
ICH (1996a), Expert Working Group (Quality). Guidance for Industry. Validation ofAnalytical Procedures: Methodology, Geneva. Available at: http://www.ich.org/LOB/media/MEDIA417.pdf (accessed October 2006).
ICH (1996b), Guideline for Industry. Quality of Biotechnological Products: StabilityTesting of Biotechnological/Biological Products, Geneva. Available at: http://www.ich.org/LOB/media/MEDIA427.pdf (accessed October 2006).
ICH (1996c), Steering Committee. Guideline for Good Clinical Practice, Geneva.Available at: http://www.ich.org/LOB/media/MEDIA482.pdf (accessed October2006).
ICH (1997), CPMP. Viral safety evaluation of biotechnology products derived fromcell lines of human or animal origin, Geneva. Available at: http://www.ich.org/LOB/media/MEDIA425.pdf (accessed October 2006).
ICH (1998a), CPMP. Quality of biotechnological products: derivation and character-ization of cell substrates used for production of biotechnological/biologicalproducts, Geneva. Available at: http://www.ich.org/LOB/media/MEDIA429.pdf(accessed October 2006).
ICH (1998b), CPMP. Note for Guidance on Preclinical Safety Evaluation of Biotech-nology- Derived Pharmaceuticals, Geneva. Available at: http://www.ich.org/LOB/media/MEDIA503.pdf (accessed October 2006).
IES (1992), Institute of Environmental Sciences, Federal Standard 209E, Airborneparticulate cleanliness classes in cleanrooms and clean zones, Mount Prospect.Available at: http://www.set3.com/papers/209e.pdf (accessed October 2006).
Jayaraman KS (2003), Indian biogenerics industry emerges, Nat. Biotechnol. 21:1115–1116. Available at: http://www.nature.com/nbt/journal/v21/n10/pdf/nbt882.pdf(accessed October 2006).
Kurt R (1995), Risk potential of the chromosomal insertion of foreign DNA, Ann. NY Acad. Sci. 772:140–151.
Levine HL, Castillo FJ (1999), Validation of biopharmaceutical processes, In: Avis KE,Wagner CM, Wu VL (Eds), Biotechnology: Quality Assurance and Validation,Interpharm Press, Buffalo Grove, p. 115.
Lubiniecki AS, Wiebe ME, Builder SE (1990), Process validation for cell culture-derived pharmaceutical proteins, In: Lubiniecki AS (Ed.) Large-Scale MammalianCell Culture Technology, vol. 10, Bioprocess Technology, Marcel Dekker, NewYork, pp. 515–541.
370 Animal Cell Technology

Lupker JH (1998), Residual host cell protein from continuous cell lines: effect on thesafety of protein pharmaceuticals, In: Brown F, Griffths E, Horaud F, PetriccianiJC (Eds) Safety of Biological Products Prepared from Mammalian Cell Culture,vol. 93, Dev. Biol. Stand., Karger, Basel, pp. 61–64.
NIH (2002), Guidelines for research involving recombinant DNAmolecules. Availableat: http://www4.od.nih.gov/oba/rac/guidelines_02/nih_guidelines_apr_02.htm(accessed October 2006).
Novartis (2004), March to global leadership: follow-on biologics. Available at: http://www.novartis.com/annual_reports/2004/march.shtml (accessed October 2006).
Onions D (1997), Safety evaluation of products derived from mammalian cell lines, In:Hauser H, Wagner R (Eds), Mammalian Cell Biotechnology in Protein Produc-tion, Walter de Gruyter, Berlin, pp. 171–190.
Petricciani JC (1988), Changing attitudes and actions governing the use of continuouscell lines for the production of biologicals, In: Spier RE, Griffiths JB (Eds),Animal Cell Biotechnology, vol. 3, Academic Press, London, pp. 14–23.
Petricciani JC, Horaud FN (1995), DNA, dragons and sanity, Biologicals 23:233–238.Polastro E, Little A (2001), When will we see legal generics of top biopharmaceuticals?
ContractPharma Out. Available at: http://www.contractpharma.com/articles/2001/10/the-future-of-biogenerics.php (accessed October 2006).
Rodrigues MTA, Raw I, Moro AM (1997), Residual DNA from hybridoma cultures:decorrence of apoptosis?, In: Carrondo MJT, Griffiths JB, Moreira JL (Eds),Animal Cell Technology: From Vaccines to Genetic Medicine. Kluwer Academic,Dordrecht, pp. 467–472.
SBCC (2005), Classificacao de Salas Limpas. NBR ISO 14644-1 cancela e substitui aNBR 13700, Revista da SBCC, 19:16.
Schiff LJ (2004), Biotechnology products derived from mammalian cell lines: impact ofmanufacturing changes, Regulatory Affair Focus Oct:29–31.
Temin HM (1990), Overview of biological effects of addition of DNA molecules tocells, J. Med. Virol. 31:13–17.
Timenetsky J, Miyaki C, Mendes IF, Rizzo E (1992), Identificacao de micoplasmaspela inibicao de crescimento de amostras isoladas de culturas celulares, Rev. SaudePubl. 26:17–20.
Tydeman MS, Kirkwood TBL (1984), Design and analysis of accelerated degradationtests for the stability of biological standards I. Properties of maximum likelihoodestimators, J. Biol. Stand. 12:195–206.
Ugwu SO, Apte SP (2004), Efeito de tampoes na estabilidade conformacional deproteınas, Pharm. Technol. Brazil 8:56–78.
Walsh G (2004a), The drug development process, In: Biopharmaceuticals: Biochemis-try and Biotechnology, 2nd Ed., John Wiley & Sons, West Sussex., pp. 69–91.
Walsh G (2004b), The drug manufacturing process, In: Biopharmaceuticals: Biochem-istry and Biotechnology, 2nd Ed., John Wiley & Sons, West Sussex, pp. 97–102.
WHO (1990), Expert Committee on Biological Standardization, Requirements forpoliomyelitis vaccine (oral), Tests for bovine viruses in serum, Geneva, Appendix1: p. 66 [Technical Report Series no. 800].
WHO (1992), Expert Committee on Biological Standardization. Guidelines for assur-ing the quality of monoclonal antibodies for use in humans, Geneva, pp. 47–67[Technical Report Series no. 822].
WHO (1996), Good manufacturing practices: guidelines on the validation of manufac-turing processes, Geneva, pp. 81–95 [Technical Report Series no. 863].
WHO (1998), Expert Committee on Biological Standardization. Requirements for theuse of animal cells as in vitro substrates for the production of biologicals, Geneva,pp. 19–56 [Technical Report Series no. 878].
WHO (2002), Good manufacturing practices for sterile pharmaceutical products,Geneva, pp. 76–96 [Technical Report Series, no. 902].
Regulatory aspects 371

WHO (2003), Working Group on International Reference Materials for Diagnosis andStudy of TSEs. Guidelines on Transmissible Spongiform Encephalopathies inRelation to Biological and Pharmaceutical Products, Geneva. Available at: http://www.who.int/bloodproducts/publications/en/WHO_TSE_2003.pdf (accessedOctober 2006).
Wiebe ME, May LH (1990), Cell banking, In: Lubiniecki AS (Ed.), Large-scaleMammalian Cell Culture Technology, vol. 10, Bioprocess Technology, MarcelDekker, New York, pp. 147–160.
Wierenga DE, Cogan J, Petricciani JC (1995), Administration of tumor cell chromatinto immunosuppressed and non-immunosuppressed non-human primates, Biologi-cals 23:221–224.
Regulatory agencies web sites
ANVISA: http://www.anvisa.gov.brEC: http://ec.europa.eu/enterprise/pharmaceuticals/eudralex/homev4.htmEMEA: http://www.emea.eu.int/FDA: http://www.fda.gov/cber/guidelines.htm and
http://www.fda.gov/cder/biologics/default.htmICH: http://www.ich.orgWHO: http://www.who.int/biologicals/en/
372 Animal Cell Technology

15Intellectual propertyAna Cristina Almeida Muller and Leila Costa Duarte Longa
15.1 Introduction
Intellectual property covers industrial property including author’s rightsover written material, novel processes, products, computer programs, andintegrated circuits. One of the main goals of intellectual property is topromote progress of technology and industry, by granting a temporarymonopoly for innovation through patents.
Industrial property is protected through patents covering inventions,utility models, registration of industrial designs, and trademarks. These areprotected through rights of exclusivity. Another aspect of protection isthrough the suppression of unfair competition, which is directed againstacts of industrial or commercial competitors contrary to honest practices,including:
(i) acts that can create confusion with a competitor’s establishment,products, industrial or commercial activities;
(ii) false claims that can discredit a competitor’s establishment, products,industrial or commercial activities; and
(iii) indications or claims that can mislead the public as to the nature ofthe manufacturing process or the characteristics, suitability or quan-tity of products.
This chapter discusses the protection of inventions in the field ofbiotechnology, including processes based on cell cultures. The ethical andmoral aspects of patent protection of the results of research involving theuse of genetic engineering and the difference between discovery andinvention are also discussed. The requirements for patentability are cov-ered, and examples of inventions involving antigens and antibodies arepresented. Finally, the importance of internal intellectual property andtechnology transfer offices and of specialists in these areas is discussed.
15.2 The biotechnology sector
According to the definition of Bull et al. (1982), biotechnology can bedefined as ‘‘the application of the principles of science and engineering forthe development of materials, through the use of biological agents, aimingto produce services and goods.’’ Biotechnology is a recent industrialsector, based on the knowledge acquired through research in the areas ofbiochemistry and biology, particularly molecular biology. It involves somesmall start-up firms that have a close relationship with university scien-tists. Even more important, these biotech firms play a key role in

transferring the knowledge generated by university laboratories to themarket, through the development of products and/or processes. Accordingto the result of the sixth annual licensing survey carried out by theAssociation of University Technology Managers (AUTM, 1999) of theUnited States, sales of products arising from inventions generated byacademic research and licensed to industry reached roughly US$ 20.6billion in 1996 in that country. Additionally, nearly two-thirds of theselicenses went to small companies, including biotech firms. This showshow the biotech sector is dependent on partnerships with the academicsector (Muller, 2003).
Biotechnology firms tend to cluster around prestigious universities,particularly in the United States, where Boston (e.g. Harvard and MIT)and the San Francisco Bay Area (e.g. UC Berkeley, Stanford, and UC SanFrancisco) are noted centers of biotech activity.
For the biotechnology industry, patent rights are important not onlybecause of the monopoly they guarantee, and hence the return on R&Dinvestments, but also in many cases they are the only ‘‘product’’ thecompany possesses. Patents, then, are of vital importance to obtain finan-cing, whether through venture capital or technology transfer agreements.Additionally, investors look not only at the number of patents, but alsothe exact knowledge that is protected and the potential value of the subjectmatter of the patents (Muller, 2003).
Therefore, it is fundamental for companies to have precise targets todecide in which areas to pursue patents and in which areas to invest.Nevertheless, in the case of new start-ups and research institutions, thisdecision on what to patent is not always an easy task. Taking the shotgunapproach of seeking patents on all results can be a waste of time andmoney. Establishment of a suitable policy in this respect is needed toobtain a good financial return.
15.3 Ethical and moral aspects of research involving geneticengineering
Biotechnology as it is known today traces its roots to the revolutionaryresearch of Cohen (Stanford University) and Boyer (University of Califor-nia-San Francisco), which resulted in the basic technology of recombinantDNA. This was the start of molecular biology and it has become the basisfor genetic engineering.
Genetic engineering is part of biotechnology and can be considered oneof the great revolutions of the twentieth and twenty-first centuries.Although the exact definition of genetic engineering is a subject of debatein scientific circles, according to Beier and Straus (1986), it can be consid-ered as the isolation of genetic material with the aim of building newrecombinant constructs and to insert these constructs of nucleic acids intolive organisms to reproduce them in a new environment.
Genetic engineering takes in a multiplicity of new processes, amongthem:
(i) processes to obtain recombinant DNA in vitro, which basicallyoccurs in four steps: isolating the gene of interest; inserting it into a
374 Animal Cell Technology

vector to obtain a gene transport vehicle, known as a recombinantvector; separation of the successfully ‘‘constructed’’ cells from thosenot transformed, called clone selection; and finally the proliferationof these cells, normally through a culture process to synthesize theproduct of interest;
(ii) processes to produce monoclonal antibodies (mAbs) with the use ofhybridomas; through fusion of lymphocytes that produce antibodieswith myeloma tumor cells capable of propagating rapidly;
(iii) hybridization processes using somatic cells, which are based on cellculture experiments and use isolation and fusion of protoplasts,exploiting the totipotency of plant cells; and
(iv) micro-injection processes, in which DNA sequences that have beencloned in vitro through recombinant DNA technology are injectedinto fertilized animal egg cells.
Examples of the products that can be obtained through the processesinclude: DNA vectors, such as plasmids, viruses, bacteriophages andcosmids; synthetic genes; transformed human viruses (e.g. the Epstein–Barr virus); transformed bacterial cells containing specific properties; ani-mal and plant cells and bacteria; mAbs, tissue cells; regulatory proteinssuch as human insulin, interferons and human growth hormones; andtransgenic plants and animals.
Public perception of this technology includes admiration and anxiety,hope and fear and this can interfere with progress. Nevertheless, despite allthe expectations created by genetic engineering, which range from curesfor various diseases to the fight against hunger, the public debate in recentyears has been dominated by its acceptability and questions on who isresponsible for imposing limits. Is it scientists, guided by their ownconviction, or should politicians and law-makers intervene? In reality, theentire discussion should be centered on how genetic engineering canpromote scientific and technological development in the search for bene-fits to society. The debate is perfectly understandable because it deals witha new field, one that like any new technology has been the subject ofmisunderstandings and misapprehensions, and still needs some provisionallimits.
In the area of law, economic questions are dominant and the debate ongenetic engineering centers on the balance of benefits between interestgroups. However, safety and minimization of risks are important, as wellas ethical and moral criteria.
In the attempt to promote technical, economic, and scientific develop-ment, society uses a special legal instrument, based on patent protection ofinventions. Innovation is recognized by granting exclusive rights for alimited period. The inventor is rewarded for having achieved results thatare useful to society. Industry, in turn, is encouraged to conduct research.The patent system is aimed to encourage invention, investment, andinnovation. This promotes knowledge by revealing and disseminatinginventions, which are protected for a fixed period of time from unfaircompetition.
The central goal is to promote technology, not to regulate it. However,the patent system does not promote technological progress and grant
Intellectual property 375

temporary monopolies to all inventions just because they meet the basicrequirements for patentability (novelty, inventive step, and industrialapplication). Despite being essentially an instrument of economic andtechnical policy, the patent system is subject to the barriers inherent in thelegal system, imposed by constitutions, public policies, and moral percep-tions. These barriers are set forth in the legislations of virtually allcountries, Brazil included. According to Article 18, I, of the BrazilianIndustrial Property Law (Law 9.279/96), the following are not patentable:‘‘anything contrary to public morality, decency, safety, order and health’’.
Nevertheless, it should be clarified that innovations are subject to thegeneral rule that the legal and moral effects of an invention must always bejudged in relation to the use normally expected of the patented product orprocess, not just the possibility of misuse. For example, a specific productthat can be legally used as a pesticide is not excluded from patentabilitysimply because it can also be used in chemical warfare.
The Enlarged Board of Appeal of the European Patent Office made thefollowing comments when questioned about a recent case involvingtransgenic plants (Novartis G 0001/98), in relation to Article 53(a) of theEuropean Patent Convention (EPC), which establishes that inventionsthat are contrary to public morality and customs are not patentable:
‘‘Suppose that a claimed invention defined a copying machine withfeatures resulting in an improved precision of reproduction andsuppose further that an embodiment of this apparatus could comprisefurther features (not claimed but apparent to the skilled person) theonly purpose of which would be that it should also allow reproductionof security strips in banknotes strikingly similar to those in genuinebanknotes. In such a case, the claimed apparatus would cover anembodiment for producing counterfeit money which could be consid-ered to fall under Article 53(a) EPC. There is, however, no reason toconsider the copying machine as claimed to be excluded since itsimproved properties could be used for many acceptable purposes’’.
The same principle applies to inventions related to genetic engineering.Thus, the transfer of exogenous genes by micro-injection, a processfrequently employed in genetic engineering, is not excluded from protec-tion just because it can be used to transfer genes to human germ cells(Beier and Straus, 1986).
15.4 Basic concepts of patentability
15.4.1 Discovery versus invention
Discoveries and inventions are increasingly the result of research. Butwhile discoveries are not protected by industrial property or in any otherform, and can be known and used freely by all, inventions (and so-calledutility models) are protected by patents and their use is restricted: free foruse in research and development, but not for industrial production with-
376 Animal Cell Technology

out the owner’s authorization. This is a universally accepted concept, andis in general stated explicitly in national laws.
A discovery is the revelation of something that exists in nature, does notaim at pre-established practical purposes, and only increases the sum ofhuman knowledge of the physical world. In contrast, an invention is asolution to a technical problem that seeks to satisfy predetermined endsand practical needs. It can be said that discovery is not the inventive spiritthat acts, but the speculative spirit and the faculties of observation, so thatwith a discovery we are in the field of science and speculative intellect,while with invention we penetrate the domain of engineering and practicalintellect (Gama Cerqueira, 1982).
However, American patent legislation differs from others, since itexplicitly provides for the possibility of protecting discoveries:
35U.S.C. 101 – Inventions PatentableWhoever invents or discovers any new and useful improvementthereof, may obtain a patent therefore subject to the conditions andrequirements of this title.
15.4.2 Requirements for the patentability of inventions
The basic requirements of national laws on protection of inventions bypatents are novelty, inventive step, and industrial application, which arenow examined in turn.
Novelty
An invention possesses novelty when the technical knowledge for whichthe patent protection is sought is not included in the state of the art. Notin the state of the art is usually defined as all the information not availableto the public, in any form of disclosure – oral, written, digitized, use/exploitation, among others – at the time of filing the patent application.Absolute novelty is adopted by most countries, meaning that which hasnot been disclosed anywhere in the world.
Some countries have legal provisions accepting the disclosure of theinnovation before seeking protection, as long as the patent application isfiled within a reasonable period that is predefined in law. This ranges from6 months (e.g. Japan) to 1 year (e.g. Brazil and the USA). This term iscalled the ‘‘grace period.’’
In Brazil, the safeguard of the rights of inventors, who are often obligedin some form to disclose their inventions or creations before filing a patentapplication, is established in the Industrial Property Law, Article 12, I toIII (inventions and utility models), and Article 96, § 3 (registration ofindustrial designs). The provisions of Article 12 are as follows:
Article 12 – The disclosure of an invention or utility model occurringduring the 12 (twelve) months preceding the filing date, or prioritydate, of the application shall not be considered to be comprised in thestate of the art if made:
Intellectual property 377

I – by the inventor;
II – by the National Institute of Industrial Property [InstitutoNacional de Propriedade Industrial – INPI], through official publica-tion of an application filed without the consent of the inventor, basedon information obtained from the inventor or as a result of his acts; or
III – by third parties on the basis of information obtained directly orindirectly from the inventor or as a result of his acts.
Sole Paragraph – The INPI may require from the inventor astatement relating to the disclosure, accompanied under the conditionsestablished in the regulations.
In spite of the positive aspect conferred by the grace period, it must benoted that not all countries accept this provision or similar procedures.Therefore, even though this possibility exists in Brazil, the filing in othercountries that do not accept previous disclosure (the majority of Europeancountries, for example) can be prejudiced. Hence, even in Brazil disclosurebefore filing a patent application should be avoided.
An interesting example of a case concerned with novelty can be citedfrom Decision T 301/87 (Interferon Æ/Biogen) by the Opposition Divisionof the European Patent Office, in a case involving a patent granted toBiogen (EP 0321 134), where nine opponents requested its cancellation forlack of novelty (OJ EPO. 1990, 335).
The two main claims are as follows:
(1) A recombinant DNA molecule for use in cloning a DNA sequence inbacteria, yeasts and animals cells, said recombinant DNA moleculecomprising a DNA sequence selected from:(a) The DNA inserts of :
Z-pBR322(Pst)/HClF-4c;Z-pBR322(Pst)/HClF-2h;Z-pBR322(Pst)/HClF-SN35;Z-pBR322(Pst)/HClF- SN42 e;Z-Pkt287(Pst)/HClF- 2h- AH6, said DNA inserts beingexemplified, but not limited to the DNA inserts of therecombinant DNA molecules carried by the microorganismsidentified by accession numbers DSM 1699-1703, respectively;
(b) DNA sequences which hybridize to any of the foregoing DNAinserts and which code for a polypeptide of the IFN-alpha type,and
(c) DNA sequences which are degenerate as a result of the geneticcode to the DNA sequences and inserts defined in (a) and (b) andwhich code for a polypeptide of the IFN-alpha type.
(2) A recombinant DNA molecule according to claim 1, wherein saidDNA sequence which hybridizes to said DNA insert (a) is selectedfrom:(d) the DNA inserts of Z-pBR322(Pst)/HcIF-II-206 and Z-
pBR322(Pst)/HcIF-SN35-AHL6, said DNA inserts being
378 Animal Cell Technology

exemplified, but not limited to, the DNA inserts of therecombinant DNA molecules carried by the microorganismsidentified by accession numbers ATCC 31633–31634,respectively,
(e) DNA sequences which hybridize to any of the foregoing DNAinserts and which code for a polypeptide of the IFN-alpha type,and
(f) DNA sequences which are degenerate as a result of the geneticcode to the DNA sequences and inserts defined in (d) and (e) andwhich code for a polypeptide of the IFN-alpha type.
According to the opponents, the main argument against granting apatent was the lack of novelty of the recombinant DNA sequencesclaimed, which included the DNA sequences that coded interferon-alpha(IFN-alpha) as an insert. This prior art referred to DNA genome libraries,which are fractioned segments (15–20 Kb) of chromosomal DNA ofhuman fetuses, cloned as derivatives of recombinant º phages.
However, the opinion of the Technical Board of Appeal was that theprior art cited by the opponents did not compromise the invention’snovelty, observing that:
‘‘. . . the mere existence of a DNA sequence coding for a polypeptideof the IFN-alpha type, within the multitude of clones of ‘‘Lawn’sgene bank’’ cannot automatically mean that the chemical compound(polynucleotide) concerned does become part of the state of the art.The latter would only then be the case if the existence of the com-pound concerned had recognizably been made publicly available’’.
Hence, according to the Technical Board of Appeal, DNA or genomelibraries of an organism do not anticipate the novelty of the DNAsequences contained in and isolated there from.
Inventive step
To meet this requirement, an invention may not be obvious in the sensethat the idea would not have occurred to a specialist in the field to whichthe creation pertains if that specialist were called on to find a solution tothe problem resolved by the creation. In other words, the matter to beprotected cannot be a simple substitution of matters or means known byothers who have conceived the same function, nor a mere combination ofknown means without a new and unexpected technical effect.
As an example, suppose that it is known to experts in the field that anextract from the plant Clusia criuva has anti-inflammatory activity. There-fore, a specialist in the subject would be led to test other species of thegenus Clusia for the same biological activity (anti-inflammatory). Never-theless, a way to prove inventive step would be to demonstrate that thespecies of interest, for example Clusia rosea, presents an unexpectedtechnical effect. In other words, while the species Clusia criuva has anundesirable side effect associated with its anti-inflammatory action, such
Intellectual property 379

as harm to the intestinal mucous, Clusia rosea does not have this disadvan-tage, and thus can meet the requirement of inventive step.
The stance of the European Patent Office in general is to consider asindicative of the presence of the inventive step the existence of surprisingor superior properties, which could not be anticipated by persons skilledin the art. In the case of a new protein, for instance, this might be fewer orless severe side effects, better absorption, or greater stability.
The same reasoning can be applied to the inventive activity involvingantigens and antibodies. If the antigen is new and has an inventive stepbecause of surprising properties, then it is patentable. The same goes for amAb directed against a patentable antigen, since it is new and a personskilled in the art would not have found any suggestion of obtaining it. Ifon the other hand the antigen (or antiserum) is known, a person skilled inthe art would be capable of preparing mAbs against the antigen, withoutdifficulty, based on his or her technical knowledge. A particular mAb willbe new in this case, because it has not been described in the state of the art,but will lack an inventive step to the extent that an average specialist in thefield could obtain it based on knowledge of the antigen.
However, even if an antigen is known, a specific mAb could still showan inventive step as long as it presents a superior property when comparedto other antibodies directed against the same antigen. This superioractivity can be evidenced, for example, by the fact that the mAb has acomplementary structure to an essential epitope (antigenic determinant) ofthe antigen’s surface, and thus exhibits exceptional binding properties tothe antigen. The use of this specific mAb might offer surprising advantagesin diagnosing and/or treating a disease caused by the antigen. The selectionof this specific mAb, starting from a large number of antibodies aimedagainst the same antigen, but possessing diverse epitopes, justifies theexistence of inventive activity.
The claim for a specific mAb, however, will be inevitably restricted. Thesurprising technical effect required to establish the presence of an inventivestep imposes limits on the possibilities of generalizing the invention, thatis, the scope of protection.
It should be pointed out that in cases of mAbs, the complex structuresof the corresponding genes, which lead to a vast number and variety ofantibodies, generally mean it is impossible to isolate a single mAb a secondtime, so as to satisfy the capacity for repetition. A complete revelation ofthe invention to permit it to be repeated – as in the case of a new organismisolated from nature – can only be guaranteed by depositing the hybrid-oma producing the specific mAb with an internationally recognizeddepositary authority (IDA) before filing the patent application.
Tables 15.1 and 15.2 summarize the requirements for novelty andinventive step for patentability of DNA sequences and mAbs.
Industrial application
An invention must have a use in economic or industrial production. Theterm ‘‘industrial’’ is used in the broad sense to cover both products andprocesses, including any economic activity that involves obtaining pro-ducts in varied sectors besides industry per se, such as agriculture, fishing,
380 Animal Cell Technology

and mineral extraction, as well as any equipment, instruments or apparatusused in these endeavors.
In addition to the above three requirements, inventors must also clearlyand completely describe the invention. This is called sufficiency ofdisclosure. The specification of a patent application must clearly andsufficiently describe the subject matter, so that it can be carried out by askilled person in the subject. Some countries (such as Brazil and theUnited States) also require an indication, when applicable, of the best wayof executing the invention, called the best mode of the invention.
Europe does not have the best-mode requirement in the EuropeanPatent Convention, meaning the applicant is not obliged to deposit bio-logical material merely with the intent of allowing reproduction of theinvention. Rule 28(1) of that convention cannot be interpreted as obligingthe deposit of biological material to facilitate reproducing the invention, aslong as it can be reproduced from the description (even if this route ismore laborious and lengthy than simply growing the deposited material).Such an interpretation would be to introduce the best-mode requirementinto European legislation (T 223/92 and T 412/93). It should be pointedout, however, that in opting not to deposit the biological material, theapplicant should be sure to provide complete information on the material.There are cases where the European Patent Office’s Technical Board ofAppeal, after carefully examining an invention’s description, has indicatedthat the information supplied in the application was sufficient to permit aperson skilled in the art to reproduce the invention, even in the absence ofa deposit of the biological material (T 283/86 and T 181/87). In other cases,
Table 15.1 Patentability of DNA sequences that codify a specific protein
Protein Protection of anyDNA sequence
Protection of a specificDNA sequence
Novelty Inventive step Novelty Inventive step
New + + + +Known – – + +
Table 15.2 Patentability of monoclonal antibodies (mAbs) corresponding toan antigen
Antigen Protection of anymonoclonal antibody
Protection of a specificmonoclonal antibody
Novelty Inventive step Novelty Inventive step
New + + + +Known – – + +Deposit of thehybridoma
Deposit in an IDA notnecessary
Deposit in an IDA necessary
IDA, international depositary authority.
Intellectual property 381

however, the Tribunal has considered the description insufficient (T 815/90 and T 816/90).
In the case of inventions involving new biological materials that cannotbe described so as to permit repetition of the invention by a skilled person,it is necessary for the applicant to deposit this material with a depositaryinstitution indicated in an international convention.
The requirement of descriptive sufficiency is covered by Article 24 ofBrazil’s Industrial Property Law, which reads:
Article 24. The description shall clearly and sufficiently describe thesubject matter, thus enabling it to be carried out by a person skilled inthe art, and shall where appropriate indicate the best manner ofexecution.
Sole Paragraph – In the case of biological material essential forcarrying out the subject matter of the application, which cannot bedescribed in accordance with this article and which is not accessible tothe public, the description shall be supplemented by the deposit of thematerial with an institution authorized by the INPI or referred to inan international agreement.
15.5 Patentable materials
Under the terms of Article 8 of the Brazilian Industrial Property Law,patentable inventions are those that have the three basic requirements ofnovelty, inventive step, and industrial application. Additionally, fromArticle 50, II, if the specification does not clearly and sufficiently describethe subject matter so as to enable its reproduction by a technician in thesubject, the so-called sufficiency of disclosure, it is against the provisionsof Article 24, and is thus not accepted (Art. 50, II).
Article 10 of that law establishes what may not be considered aninvention or utility model, and for this reason is expressly excluded frompatent protection. According to article 10 (IX) the following is not consid-ered as an invention or utility model:
‘‘all or part of natural living beings and biological materials found innature, or isolated there from, including the genome or germ plasmaof any natural living being and the natural biological processes.’’
Therefore, Brazil does not yet grant patents to extracts and activeingredients from plants. It does grant use patents, that is, in the form of apharmaceutical composition, for example, that contain the extract or activeingredient(s). However, this practice of granting patents for extracts andmolecules taken from plants is common internationally.
It should be stressed, then, that since patents in this area are being issuedin other countries, such as the United States and various Europeancountries, it is advisable to evaluate the territory suitable for seekingprotection.
Table 15.3 presents a list with examples of materials considered patent-able and non-patentable under Article 10, IX, and Article 18, III, of the
382 Animal Cell Technology

Brazilian Law 9279/96. According to the latter provision, all or part ofliving things are not patentable, except transgenic microorganisms thatmeet the three patentability requirements (novelty, inventive step, andindustrial application) set forth in Article 8 of the law and that are notmere discoveries.
Scientific advances have permitted the industrial employment of geneti-cally modified microorganisms or cells, capable of producing proteins ofinterest in various areas, particularly human health. This technologypermits reproducing proteins identical to their natural counterparts, aswell as to elaborate others that are totally new by alterations resultingfrom the insertion of genes into these microorganisms or cells. Thesegenetically modified molecules can be more effective than the natural onesfor a predetermined function, for instance through greater biologicalactivity, longer average lifetimes or fewer or less serious side effects.
Before the advent of the current Law 9.279/96, pharmaceutical productswere not eligible for patent protection in Brazil (under the formerIndustrial Property Code, Law 5.772/71). With the new possibility ofpatenting pharmaceuticals, the huge advance in biotechnology and geneticsin recent decades has led to the development of a new and importantsegment in the chemical-pharmaceutical industry: biopharmaceuticals.Libraries of new compounds from animals, plants, fungi, bacteria, andviruses, which provide additional alternatives to chemical processes andcreation of a multiplicity of novel molecules, can be seen.
These advances have brought ethical, economic, and legal implicationsto the granting of patents for all or parts of living things, even if geneticallymodified. This has led many countries, among them Brazil, to establish
Table 15.3 Patentable and non-patentable material according to Article 10, IX, and Article 18,III, of the Brazilian Industrial Property Law
Patentable inventions Non-patentable inventions
Processes related to transformation of plantsRecombinant genesTransgenic microorganisms*Expression vectors that carry genes that codifyhuman insulin isolated or purified from humanpancreas beta cellsEscherichia coli transformed by such expressionvectorsProcesses for production of human insulin involvingthe culturing of those transformed E. coli bacteriaRecombinant proteinsMutants obtained by genetic modification of suchrecombinant human insulinHybridomas that produce antibodies able torecognize antigen APharmaceutical compounds containing extractsisolated from plant Y for treating disease Z
Plant and animal cellsSeedsHuman insulin isolated or purified from humanpancreas beta cellsGenes that code for human insulin isolated orpurified from human pancreas beta cellsYeasts isolated or purified artificially from natureMicroorganisms isolated or purified artificiallyfrom nature and that produce an antibiotic XAntibiotic X produced by such microorganismHuman hepatocyte YHuman liver tissue ZExtracts isolated from plant Y
*For the purposes of Law 9279, transgenic microorganisms are those (except all or part of plants or animals) thatexpress, through direct human intervention in their genetic composition, a characteristic normally not attainable bythe species in natural conditions.
Intellectual property 383

exceptions. For example, in Brazil living things (or parts thereof) are notpatentable, except transgenic microorganisms (Art. 18, III). The majorityof countries, however, follow the European example, where only varietiesof plants and animals are not eligible for patent protection.
In Brazil, for instance, the recombinant form of molecules such as IFN-alpha and human erythropoietin can be patented, as well as the processesfor obtaining them using animal cells. However, the natural forms of thesemolecules, as well as the animal cells used to obtain these molecules, arenot patentable.
15.6 Industrial property and technology transfer offices
The search by the business sector for new sources of technology and theavidity of universities for new sources of funding have started to give anew face to some academic environments. Academic–business relationstake many forms: investment of companies in complete projects or partsof projects, licensing for exploitation of patents, among others.
In whatever form, a company will be much more willing to fundresearch if there are guarantees that the technology will not wind up in thepublic domain, and will instead receive adequate patent protection. In theUnited States, where these movements began to gather steam in the 1970s,universities had to prepare themselves to deal with these new questions.On the other hand, the US Government found that the research financedwith public funds often wound up on the ‘‘shelves.’’ This prompted theneed for legislation, which culminated in 1980 with passage of the Bayh-Dole Act. This act authorizes universities and small companies to retainthe patent rights that result from research funded by the federal govern-ment.
As an indication of the effect of the Bayh-Dole Act, before 1980 fewerthan 250 patents a year were issued to American universities. In 2004, asurvey conducted by the Association of University Technology Managersindicated that 4458 new licensing agreements were signed that year, andthe number of patent applications filed by universities was 13 021. Be-tween 1991 and 2004, the survey reported an increase of over 100% inpatent filings, as well as a 142% jump in the number of licensing andoption agreements signed. These option agreements permit a company toacquire the right to evaluate a technology for a given period, called theoption period, before deciding whether or not to actually license it.
The survey also found, however, that universities and research institu-tions need to be patient and should not expect millionaire returns in shorttime-frames, since the generation of revenues from licensing is not im-mediate. Fewer than 1% of the 20 968 licenses active in 2000 generated amillion dollars or more. Of the institutions responding to the survey, only10% reported profit greater than 20 million dollars from licensing, and80% of these licenses had already been in force for at least 10 years.
In academic environments, the establishment of industrial property andtechnology transfer offices has arisen from the increased activities toprotect inventions, the need to transfer technologies to enable theirproduction, and from legal requirements for obtaining patents, all driven
384 Animal Cell Technology

by the search for profits from research and development investmentsthrough commercialization of the technologies patented.
In Brazil, researchers have started to wake up to the need to patent theirinventions, albeit tardily and slowly. The number of patent applicationsfiled with the INPI (Brazilian PTO), even though small compared withthe number of journal publications and conference proceedings, is increas-ing every year. Of the 22 000 applications filed in 2001, 6200 were byBrazilians. In 2000, Brazilians filed 5800 of the 20 000 applications withthe INPI.
Besides seeking assistance from a qualified professional, researchersfrom some institutions in the country can call on specialized units at theirinstitutions to support and guide them. Among the institutions that haveestablished such units are Embrapa, Fiocruz, Unicamp (Campinas/SP),University of Sao Paulo, Minas Gerais Federal University, Rio de JaneiroFederal University, and Rio Grande do Sul Federal University, amongothers. The Sao Paulo State Research Support Foundation (Fapesp) main-tains a Patent and Licensing Unit (Nuplitec) to guide researchers whoseprojects are financed by Fapesp.
In 2004, Law 10,973 was enacted, called the Law of Innovation, whichamong other provisions, requires public-funded scientific and technologyinstitutions to have an innovation unit to encourage patenting and licen-sing of technology. This is an important instrument to protect theintellectual property generated at these institutions, as well as the negotia-tion for licensing and transfer to the market. Before negotiating withprospective partners, it is necessary to sign a confidentiality agreementbetween the parties to preserve the secrecy of the information exchangedduring the negotiating phase. All this guidance and support is the respon-sibility of the internal intellectual property and technology transfer office.
According to Chamas (2001), although the debate and interest inintellectual property rights have arrived tardily in Brazil, the legal barriersare gradually being removed and the climate is becoming more receptiveto the new activities. In this sense, the move by Brazilian universities isevident to protect and exploit their intellectual property. A portfolio ofpatents and similar assets should be the object of a competent businesspolicy, including frequent analysis of the advisability of commercializingscientific ideas. The construction of an ample portfolio of intellectualproperty rights is justified to protect and reward scientific effort and allowa period of protected commercialization. Nevertheless, in the case of thepublic sector, this may not be the only motivation, since concern must begiven to the country’s social welfare and economic development.
Mention must also be made of the crucial role of support agencies forthe structuring and consolidation of these internal offices.
An article by Kingston (2000) reports the history of the ‘‘antibioticsrevolution’’ and how the discovery of Pasteur in 1877 that certain bacteriawere able to inhibit the growth of anthrax organisms supplies importantlessons for economic innovation. According to the article, questions suchas the establishment of strategies for patenting and ownership of intellec-tual property, cooperation between universities and industries, and therole of support agencies must be considered when seeking successfulinnovation of a product/process.
Intellectual property 385

The distinction between the profile of an inventor and innovator is quiteclear from the report involving the invention and innovation of penicillinand streptomycin. According to Schumpeter (1988), an inventor producesideas, while an innovator makes things happen, and materializes ideas.Personal commitment and willpower are characteristics of an innovator.This is the difference between Fleming and Florey in relation to thediscovery and innovation of penicillin, respectively. The researcher/inven-tor has to deal with resistance to new ideas without the ability to makethese new ideas accepted. In contrast, an innovator has the ability neces-sary to promote ideas and transform them into reality.
Researchers need to be capable of perceiving that an experiment maygenerate more information than it is possible to foresee before starting.On this point, Kingston (2000) shows the misleading effect that a partialsuccess can have, which he exemplifies by the fact that Fleming was onlyable to perceive a limited use of his discovery of penicillin, allowing thispartial success to mask the possibility of its use as an antibiotic.
This is where the innovator comes in, capable of noting this previouslyunidentified potential, and especially knowing how to use his or herpersonal characteristics to find the means to overcome difficulties andconvince others to invest in developing and materializing the idea.
15.7 Patent and technology transfer specialists
An internal intellectual property and technology transfer office will havetwo types of professionals: the industrial property specialist and thetechnology transfer specialist. These activities require specific qualifica-tions and extensive training, involving expertise normally not mastered byscientists. For this reason, the interactions between universities and re-search institutions on the one hand and companies on the other regardingpatenting and marketing of inventions warrant specific handling.
The intellectual property specialist, usually with a professional back-ground in engineering, chemistry, physics, or biomedical sciences, needsto have an understanding of international law, treaties, and conventions aswell as national laws, decrees, edicts, etc., and the entire bureaucraticapparatus in the field. He or she must also interact with scientists to obtainthe information necessary to draft the patent application, study the state ofthe art to prepare the diagrams, determine the scope of claims, see to thedeposit of biological material with an international depositary authority,develop patenting strategies, deal with industrial property agents, followthe progress of the application, see to maintenance of patents alreadygranted, monitor the patents and applications of competitors, contestnegative opinions from patent offices, and respond to the various technicaland legal demands involving the whole process, including any violation ofintellectual property rights (Chamas and Muller, 1998).
Regarding monitoring patent applications of third parties, Brazilianlegislation allows any interested party to submit documents and informa-tion during an application process period, to assist the technical examina-tion. This is provided in Article 31 of the Industrial Property Law, and canbe done up to the final examination. The tools for this are the Industrial
386 Animal Cell Technology

Property Review and the INPI site. Once a patent has been granted, noappeal is possible, but administrative cancellation can be sought within 6months. Court action to nullify a patent can be taken at any time duringits lifetime.
Technology transfer specialists, in contrast, are more focused on busi-ness aspects. They need to be able to work closely with and understandthe work of the industrial property people, to help them check on thepatent applications filed by the institution. But they also, and moreimportantly, must follow market trends involving the portfolio of patentsand applications, orient the preparation of technical cooperation, detectand contact potential partners for future technology transfers, negotiateand draft contractual instruments applicable to each case, monitor thepartnerships formed, deal with external law offices specializing in intellec-tual property, and act in cases of breach of contractual clauses. In relationto this last item, when a contractual infraction or other complianceproblem is noted, a choice must be made as to what action to take. Will itbe by judicial action or some form of alternative dispute resolution?
There is a range of alternative dispute resolution (ADR) methods.Among the most common are arbitration and mediation, although con-ciliation and direct negotiation are also possible.
Dispute resolution is an important process for business, since it permitsa quick, fair, and economic way to solve conflicts, without the need forprolonged litigation. Hence, it is possible to obtain a more satisfactoryoutcome and often to preserve a suitable commercial relationship.
Some activities need to be carried out jointly by the industrial propertyand technology transfer specialists. An example is the decision on whetheror not an invention is patentable, or should be patented, based on technicaland economic considerations, and industrial property policies.
Some aspects of intellectual property that need to be evaluated by thesespecialists when analyzing a research project are listed below (Muller,2003).
(i) Searching for prior art and verifying the satisfaction of patentabilityrequirements.
(ii) Confirming with inventors the absence of disclosure of the result ofthe research, even in articles submitted for publication.
(iii) If the patentability requisites are met, preparing the first draft of theapplication from the technical information sent by the inventors.
(iv) Whenever possible, including functional equivalents of the inventionto enlarge the scope of the protection.
(v) In parallel, confirming who the inventors are and to what companies/institutions they belong.
(vi) In the case of external inventors, verifying if there is a formal partner-ship agreement.
(vii) If so, verifying whether the agreement contains ownership clauses.(viii) Identifying the percentage of intellectual contribution of each inven-
tor in materializing the invention, information that will influence thepercentage that will accrue to each company/institution.
(ix) Verifying whether there were or will be other external sources of
Intellectual property 387

funding for the project besides the outlay of the company/institutionitself.
(x) Whenever possible, negotiating the ownership of the company/insti-tution and proposing an agreement between the parties stipulatingthe percentage that belongs to the other party or parties as a result ofcommercial exploitation of the invention.
15.8 Conclusions
Based on the above observations, the importance of patent protection ofbiotechnology inventions is clear, as well as the need for professionalstrained to take care of the protection and licensing of the intellectualproperty generated by universities, research institutions, and companies.
Public–private partnerships should be encouraged as essential for thedevelopment of products and processes, and especially to leverage invest-ment seeking to reduce the dependence on imported biopharmaceuticals.For this, it is vital that institutions adequately project their research results,to enable them to better attract investors to fund technological develop-ment. Hence, it will be possible to increase the chances that an inventionwill turn into an innovation.
References
Association of University Technology Managers (1999), AUTM Licensing Survey FY1996. Norwalk: AUTM.
Beier FK, Straus J (1986), Genetic engineering and industrial property, In: TheSixteenth Bitburg Colloquium on Genetic Engineering and Law, Bitburg,Abstracts.
Bull AT, Holt G, Lilly MD (1982), Biotechnology: International Trends and Perspec-tives, OECD, Paris.
Chamas CI (2001), Protecao e Exploracao Economica da Propriedade Intelectual emUniversidades e Instituicoes de Pesquisa, COPPE/UFRJ, PhD Thesis.
Chamas CI, Muller ACA (1998), Gerencia da Propriedade Industrial e da Transfer-encia de Tecnologia, In: XX Simposio de Gestao da Inovacao Tecnologica, SaoPaulo, Abstracts.
Gama Cerqueira JDA (1982), Tratado da Propriedade Industrial, 2nd Ed., EditoraRevista dos Tribunais, Rio de Janeiro.
Kingston W (2000), Antibiotics, invention and innovation, Research Policy 29:679–710.
Muller ACA (2003), Patenteamento em Biotecnologia: Abrangencia e Interpretacao deReivindicacoes, EQ/UFRJ, PhD Thesis.
Schumpeter JA (1988), A teoria do desenvolvimento economico, Nova Cultural, SaoPaulo.
388 Animal Cell Technology

16Recombinant therapeuticproteinsMaria Candida Maia Mellado and Leda dos Reis Castilho
16.1 Introduction
Biopharmaceuticals are proteins and nucleic acid-derived molecules thatare used for therapeutic purposes or in vivo diagnostics, and are producedby means other than direct extraction from a native (non-engineered)biological source (Walsh, 2002). When considered together with vaccinesand biomolecules extracted from natural sources, they are designated‘‘biologicals’’ by the pharmaceutical industry.
A survey carried out by the Pharmaceutical Research and Manufacturersof America (PhRMA) verified that in 2004 over 100 biopharmaceuticalshad already gained approval from the US Food and Drug Administration(FDA) (PhRMA, 2004). This survey found that 324 new biotechnologymedicines, targeting nearly 150 diseases, were undergoing human clinicaltrials or under review by the FDA. Among the products under develop-ment, almost half (154) were intended for cancer treatment, and anothersignificant portion for infectious diseases, AIDS/HIV and related condi-tions, and autoimmune and neurological disorders. Despite the longdevelopment time for biopharmaceuticals (Figure 16.1) and the fact thatmost molecules under clinical trials do not gain final approval from theregulatory agencies, a considerable increase in the number of commercia-lized biopharmaceuticals is expected in the next few years.
It is estimated that to date more than 250 million people worldwidehave benefited from the biologicals already approved for the treatment orprophylaxis of cardiac diseases, multiple sclerosis, several types of cancer,hepatitis, arthritis, and diabetes, among others. Since biopharmaceuticalsfocus their action on the molecular basis of diseases, they are providingphysicians and patients with new powerful tools for the treatment ofdiseases, changing fundamentally the way diseases are treated (PhRMA,2004).
16.2 Main therapeutic proteins
Therapeutic proteins can be divided into seven different groups: cytokines,hematopoietic growth factors, growth factors, hormones, blood products,enzymes, and antibodies (Walsh, 2003). Most of these proteins havecomplex structures and undergo different post-translational modifications,

such as glycosylation, which usually is essential for biological activity, asdiscussed in Chapter 6. For this reason, most of the biopharmaceuticalsalready approved or under development are produced by mammalian cells,since microorganisms and insect cells are not able to correctly perform therequired post-translational modifications. Among mammalian cells, thecell line most usually employed in the production of recombinant ther-apeutic proteins is the CHO cell line (Chinese hamster ovary cells), whichprovides proteins with a glycosylation pattern very similar to that ofhuman native proteins. Besides, CHO cells are considered safe because themajor viruses that cause disease in humans are not able to replicate in thesecells. The manufacturing processes for these proteins are all based onprinciples discussed in the previous chapters of this book.
16.2.1 Cytokines
Cytokines play a central role in regulating the immune and inflammatoryresponse. Interferons (IFNs) were the first family of cytokines to be
CommercialPhase IIIPhase IIPhase IIND
Duration (years)Develop-
ment
phase1 2 3 4 5 6 7 8
Preclinical
Phase I
Phase II
Phase III
BLA
Phase
Premises
Expression
system
defined
Process
scalability
Primary
definition
of process
No
validation
Refinement of
operational control
parameters
Development of
scale-down process
models for validation
Process out-of-limit
definition
Finalization of
process control
parameters
Fixed and defined
process and
products
Pivotal process
validation and
characterization
studies
Validated
production
process
Well-characterized
productRobust process
Figure 16.1
Phases in the development of a biopharmaceutical and the concept of time-to-market. IND,Investigational New Drug Application; BLA, Biologics License Application(adapted from Werner, 2004).
390 Animal Cell Technology

discovered, and are used as biopharmaceuticals to enhance the immuneresponse against infectious agents (viruses, bacteria, and protozoa) and totreat some autoimmune conditions and some types of cancer (Table 16.1).There are distinct classes of IFNs, and humans produce at least three;IFNÆ, IFN�, and IFNª (Walsh, 2003).
The IFNÆ class consists of approximately 20 subtypes of mole-cules, most of them having 165–172 amino acids and a molar mass ofapproximately 20 kDa. Depending on the subtype, they can be eitherO-glycosylated or non-glycosylated, and present over 70% amino acidhomology with each other. Beyond being abundant in leucine and gluta-mate, they are characterized by conserved cysteines, usually at positions 1,29, 99, and 139, which generally form two disulfide bonds. The secondarystructure is characterized by several Æ-helices and no �-sheets. The majorapplication of IFNÆ as a biopharmaceutical is the treatment of hepatitis,but some commercial preparations have already been approved for leuke-mia and other types of cancer.
IFN� is produced in vivo normally by fibroblasts. In humans, only oneIFN� is found, which has 166 amino acids and a molar mass larger than 20kDa. The molecule has a disulfide bond as well as an N-linked carbo-hydrate chain bound to asparagine 80. Structurally, it is characterized bythe presence of five Æ-helices. Recombinant IFN� is marketed under thenames of Betaferon
1, Betaseron
1, Avonex
1, and Rebif
1, being indicated
for the treatment of multiple sclerosis, since it blocks the secretion of othercytokines involved in the pathogenesis of this disease.
IFNª, also known as immune interferon, is produced in vivo predomi-nantly by lymphocytes. Human IFNª has 143 amino acids, with a molarmass varying between 17 and 25 kDa, depending on the level of N-glycosylation. The secondary structure consists of six Æ-helices. The mostimportant therapeutic application of IFNª is the treatment of chronicgranulomatous disease (CGD), a rare genetic condition characterized bythe deficiency of phagocytic cells. CGD is characterized by repeatedinfections in sufferers because of the absence of phagocytes to ingest ordestroy infectious agents (Walsh, 2003).
Until the 1970s, the source of exogenous IFN for therapeutic use washuman blood itself. However, recombinant DNA technology made possi-ble the cloning of IFN genes into several expression systems, such asEscherichia coli, yeast, and mammalian cells, facilitating the large-scaleproduction of these proteins and increasing safety. The level of glycosyla-tion of these proteins determines the expression system in which theyshould be expressed. IFNÆ, for example, is not glycosylated in its nativeform and therefore can be expressed in E. coli. Mammalian cells, especiallyCHO cells, may be used to produce the other IFN classes, which areglycosylated.
Another cytokine class used as a biopharmaceutical is interleukin (IL),which consists of at least 25 different subtypes (IL-1 to IL-25). Except forIL-1, most interleukins are glycosylated and have a molar mass in therange of 15–30 kDa. IL-2 is the most well studied interleukin, and itsrecombinant form is approved for the treatment of renal cell carcinoma.Since the absence of glycosylation does not affect its biological activity,rIL-2 is produced in genetically engineered E. coli.
Recombinant therapeutic proteins 391

16.2.2 Hematopoietic growth factors
Hematopoietic growth factors are also cytokines and play an essential rolein the formation and differentiation of blood cells (hematopoiesis). Themain molecules of this family are erythropoietin (EPO), granulocytecolony-stimulating factor (G-CSF), macrophage colony-stimulating factor(M-CSF) and granulocyte-macrophage colony-stimulating factor (GM-CSF).
GM-CSF, also known as pluripoietin-Æ, is a glycosylated polypeptidewith 127 amino acids and a molar mass of approximately 22 kDa. Thesecondary structure exhibits four Æ-helices and two anti-parallel �-sheets.G-CSF (or pluripoietin) is a glycoprotein with two splicing variants, thepredominant one presenting 174 amino acids and 21 kDa, with only oneO-glycosylation site. Its structure is characterized by the presence of twodisulfide bonds and four Æ-helices. M-CSF (or CSF-1) has three N-glycosylation sites and several disulfide linkages. There are three forms ofthis protein, with molar masses varying from 45 to 90 kDa and the largestone having 522 amino acids (Walsh, 2003).
The three types of recombinant CSFs (GM-CSF, G-CSF, and M-CSF)are used as hematopoietic stimulators, in the treatment of infectiousdiseases, some types of cancer, bone marrow transplants, and neutropenia,a disease characterized by a reduced level of neutrophils, the precursors ofwhite blood cells (Table 16.1).
EPO is a globular glycoprotein, characterized by four Æ-helices and twoanti-parallel �-sheets, which contains 166 amino acids. It has a molar massbetween 34 and 40 kDa, 40% of which is due to carbohydrate chains. Themolecule has three N-glycosylation sites (asparagine residues 24, 38, and83) and an O-glycosylation site (serine 126). The carbohydrate chainscontribute to the solubility, in vivo metabolism, and cellular processing ofthe molecule. However, its complex glycosylated tetra-antennary structureand the high degree of sialylation enhance the importance of a carefulcontrol of operational conditions during the manufacturing process. Thisaims at minimizing the micro- and macroheterogeneity and, consequently,maximizing the yield in terms of isoforms with high biological activity(see Chapter 6).
The first approval of a therapeutic use for recombinant EPO was in1989 for the treatment of anemia related to chronic renal failure. Thetreatment with EPO stimulates production of erythrocytes and improvesthe patient’s quality of life, as well as reducing or eliminating the need forblood transfusion. There are other non-renal applications, such as theminimization of blood transfusion after surgery, the prevention of anemiaafter bone marrow transplantation, and the treatment of anemia caused bythe use of antiretroviral drugs, by chemotherapy, and by prematurity.
16.2.3 Growth factors
Apart from the hematopoietic growth factors, discussed in Section 16.2.2above, there are other types of growth factors, such as transforminggrowth factor (TGF), platelet-derived growth factor (PDGF), insulin-likegrowth factor (IGF), and epidermal growth factor (EGF).
392 Animal Cell Technology

TGF consists of a family of growth factors employed in the treatmentof bone fractures and skin ulcers. TGF molecules of type � exist in theform of homodimers of 112 amino acids. Two members of this family havetheir recombinant form approved for treating tibia fractures (Osigraft
1
and InductOsTM), being produced in mammalian cells (Table 16.1).PDGF, which plays an important role in wound healing (cicatrization),
is a dimer formed by two polypeptides. There are two isoforms of thisprotein that are most commonly encountered in the human body: onewith 110 amino acids and another with 125. Both isoforms have oneglycosylation site and three disulfide bonds.
IGF is a polypeptide of 70 amino acids, with three disulfide bonds and amolar mass of 7.6 kDa. Its therapeutic use is still under study and futuremedical applications for this protein are likely to be the treatment ofdwarfism, diabetes type 2, and renal diseases, among others.
EGF has a sequence of 1208 amino acids divided into seven domains,the largest being a glycosylated peptide of 53 amino acids. The secondarystructure is characterized by the presence of two anti-parallel �-sheets andthree disulfide bonds, which confer stability to the molecule. This proteinis indicated for the treatment of wounds and skin ulcers.
16.2.4 Hormones
Hormones are proteins responsible for regulating molecular synthesis invivo. The most well known therapeutic hormones are insulin, glucagon,growth hormones, and gonadotropins.
Recombinant human insulin and recombinant human growth hormone,both produced by microbial cells, were the first biopharmaceuticals toobtain approval from the regulatory agencies. Insulin is widely used fordiabetes treatment, whereas growth hormone is used in the treatment ofshort stature, obesity, and for stimulating ovulation.
The gonatropins are a family of hormones that include follicle stimulat-ing hormone (FSH), luteinizing hormone (LH), and chorionic gonadotro-pin (CG), among others. These three proteins are heterodimers thatcontain an identical polypeptide subunit (Æ) and another specific subunit(�), which confer the respective biological activity. FSH has a molar massof 34 kDa, 14% of it being due to carbohydrate side chains. LH has amolar mass of 28.5 kDa.
The recombinant forms of these proteins (Gonal-f1, Luveris
1,
Ovitrelle1, and Puregon
1), produced in CHO cells, are indicated for
treating female infertility (Table 16.1).
16.2.5 Therapeutic enzymes
There is a great range of recombinant enzymes used for therapeuticpurposes, but not all of them are expressed in mammalian cells.
Tissue plasminogen activator (tPA) is a protease with 527 amino acidsand 4 glycosylation sites that acts in vivo as a thrombolytic agent. Itsfunction is to proteolytically convert the zymogen, plasminogen, intoactive plasmin, which in turn degrades fibrin strands, thus dissolvingthe clots (Walsh, 2003). For this reason, recombinant tPA molecules
Recombinant therapeutic proteins 393

Table 16.1 Examples of biopharmaceuticals produced in mammalian cells approved forcommercialization
Classification Product name Protein Indication
Cytokines Avonex1
Interferon �1a Multiple sclerosisRebif
1Interferon �1a Multiple sclerosis
Hematopoietic Epogen1/Procrit Epoetin Æ Anemia
growth factors Epogin/Recormon Epoetin � AnemiaNeorecormon
1Epoetin � Anemia
Nespo/Aranesp1
Darbepoetin Æ AnemiaNeutrogin
1/Granocyte G-CSF (lenograstim) Neutropenia
Hormones Gonal-f1
FSH Female infertilityLuveris
1/Lutropin alfa Luteinizing hormone Female infertility
Ovitrelle1/Ovidrel/
Choriogonadotropin ÆGonadotropin Female infertility
Puregon1/Follistim
AQ/Follitropin �FSH Female infertility
Thyrogen1
Thyrotropin Æ Thyroid function (in vivodiagnostics)
Growth factors InductOS1/Dibotermin Æ Bone morphogenetic
protein-2Tibia fracture, spinal surgery
Osigraft1/Eptotermin Æ Bone morphogenetic
proteinTibia fracture
Blood Advate Factor VIII Hemophilia Acoagulation BeneFIX Factor IX Hemophilia Bfactors Helixate
1NexGen/
Kogenate1FS
Factor VIII Hemophilia A
Kogenate1
Factor VIII Hemophilia ANovoSeven
1Factor VIIa Hemophilia A and B
Recombinate Factor VIII Hemophilia ARefacto
1B-domain deleted factorVIII
Hemophilia A
Therapeutic Activase1/Alteplase tPA Acute myocardial infarction
enzymes Cerezyme1
Glucocerebrosidase Gaucher’s diseaseFabrazyme
1/Agalsidase � Æ-Galactosidase A Fabry disease
HylenexTM Hyaluronidase Increase absorption anddispersion of other injecteddrugs
Myozyme1/Alglucosidase
ÆAcid Æ-glucosidase Pompe disease
NaglazymeTM/Galsulfase N-Acetylgalactosamine4-sulfatase
Mucopolysaccharidosis VI
Pulmozyme1
DNAse I Cystic fibrosis
Replagal1/Agalsidase Æ Æ-Galactosidase Fabry disease
fiTNKase/TenecteplaseTM/Metalyse
tPA Acute myocardial infarction
Xigris1/Drotrecogin Æ Activated protein C Severe sepsis
394 Animal Cell Technology

r
Cell line Manufacturingprocess data
Firstapprovaldate
Company Countries whereapproved
CHO Bioreactor 1996 Biogen Europe, USACHO Bioreactor with
microcarriers1998 Serono Europe, USA
CHO Roller bottles 1989 Amgen SeveralCHO – 1990 Chugai Japan, EuropeCHO – 1997 Roche EuropeCHO – 2001 Amgen Europe, USACHO – 1991 Chugai Japan, EuropeCHO – 1995 Serono Europe, USACHO Bioreactor 2000 Serono Europe, USACHO – 2000 Serono Europe, USA
CHO Bioreactor 1996 Organon Europe, USA
CHO Repeated batches 1998 Genzyme Europe, USA
CHO Suspension bioreactor 2002 Wyeth Europe
CHO – 2001 Howmedica International Europe
CHO 2500 L bioreactor 2003 Baxter Europe, USACHO Fed-batch bioreactor 1997 Genetics Institute Europe, USABHK Perfusion bioreactor 2000 Bayer USA, Australia,
Europe,Switzerland
BHK Perfusion bioreactor 1993 Bayer SeveralBHK Bioreactor, repeated
batches1996 Novo Nordisk Europe, USA,
SwitzerlandCHO – 1992 Baxter SeveralCHO Perfusion bioreactor 1999 Genetics Institute/Biovitrum AB Europe, USA
CHO – 1986 Genentech SeveralCHO – 1994 Genzyme Europe, USACHO Continuous bioreactor 2001 Genzyme Europe, USACHO – 2005 Halozyme Therap. USA
CHO – 2006 Genzyme Europe, USA
CHO – 2005 BioMarin Europe, USA
CHO – 1993 Genetech Sweden, USA,Switzerland
Humanfibroblasts
– 2001 Shire Human Genetic Therapies Europe
CHO 12 000 L bioreactor 2000 Genentech/Boehringer Ingelheim Europe, USA
HEK-293 Bioreactor 2001 Eli Lilly Europe, USA
Continued
Recombinant therapeutic proteins 395
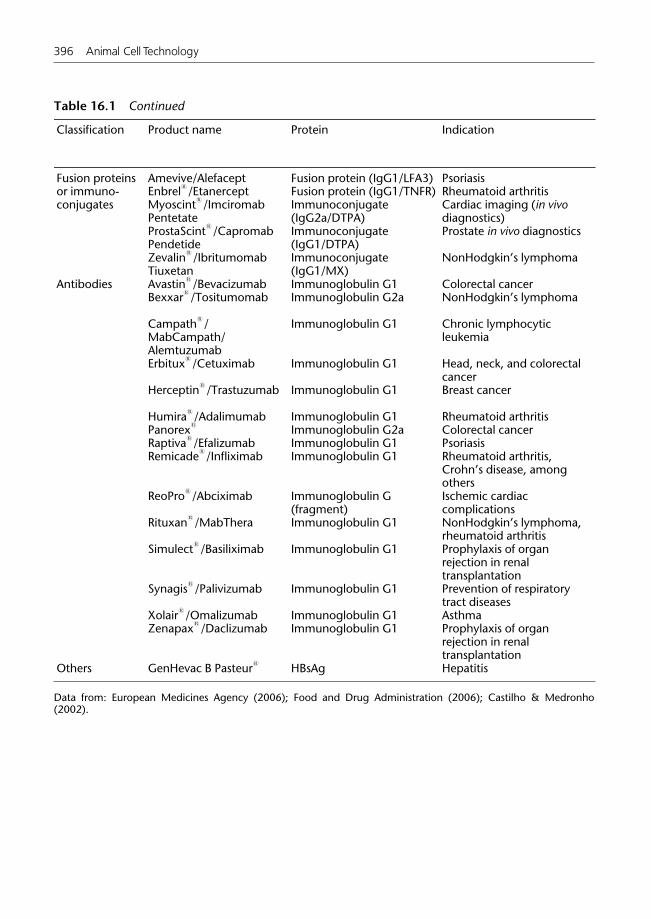
Table 16.1 Continued
Classification Product name Protein Indication
Fusion proteins Amevive/Alefacept Fusion protein (IgG1/LFA3) Psoriasisor immuno- Enbrel
1/Etanercept Fusion protein (IgG1/TNFR) Rheumatoid arthritis
conjugates Myoscint1/Imciromab
PentetateImmunoconjugate(IgG2a/DTPA)
Cardiac imaging (in vivodiagnostics)
ProstaScint1/Capromab
PendetideImmunoconjugate(IgG1/DTPA)
Prostate in vivo diagnostics
Zevalin1/Ibritumomab
TiuxetanImmunoconjugate(IgG1/MX)
NonHodgkin’s lymphoma
Antibodies Avastin1/Bevacizumab Immunoglobulin G1 Colorectal cancer
Bexxar1/Tositumomab Immunoglobulin G2a NonHodgkin’s lymphoma
Campath1/
MabCampath/Alemtuzumab
Immunoglobulin G1 Chronic lymphocyticleukemia
Erbitux1/Cetuximab Immunoglobulin G1 Head, neck, and colorectal
cancerHerceptin
1/Trastuzumab Immunoglobulin G1 Breast cancer
Humira1/Adalimumab Immunoglobulin G1 Rheumatoid arthritis
Panorex1
Immunoglobulin G2a Colorectal cancerRaptiva
1/Efalizumab Immunoglobulin G1 Psoriasis
Remicade1/Infliximab Immunoglobulin G1 Rheumatoid arthritis,
Crohn’s disease, amongothers
ReoPro1/Abciximab Immunoglobulin G
(fragment)Ischemic cardiaccomplications
Rituxan1/MabThera Immunoglobulin G1 NonHodgkin’s lymphoma,
rheumatoid arthritisSimulect
1/Basiliximab Immunoglobulin G1 Prophylaxis of organ
rejection in renaltransplantation
Synagis1/Palivizumab Immunoglobulin G1 Prevention of respiratory
tract diseasesXolair
1/Omalizumab Immunoglobulin G1 Asthma
Zenapax1/Daclizumab Immunoglobulin G1 Prophylaxis of organ
rejection in renaltransplantation
Others GenHevac B Pasteur1
HBsAg Hepatitis
Data from: European Medicines Agency (2006); Food and Drug Administration (2006); Castilho & Medronho(2002).
396 Animal Cell Technology

Cell line Manufacturingprocess data
Firstapprovaldate
Company Countries whereapproved
CHO – 2003 Biogen USACHO – 1998 Immunex/Wyeth Europe, USAHybrid-oma
– 1989 Centocor Europe, USA
Hybrid-oma
Hollow-fiber bioreactor 1996 Cytogen USA
CHO – 2002 Idec Europe, USA
CHO – 2004 Genentech/Roche Europe, USAHybrid-oma
– 2003 Corixa/GlaxoSmithkline USA
CHO Suspension bioreactor 2001 ILEX/Genzyme Europe, USA
SP2/0 10 000L batchbioreactor
2004 ImClone/Merck Europe, USA
CHO 12 000 L batchbioreactor
1998 Genentech/Roche Europe, USA
CHO Batch bioreactor 2002 Abbott Laboratories Europe, USA– – 1995 Glaxo GermanyCHO – 2003 Genentech/Serono Europe, USASP2/0 Perfusion bioreactor 1998 Centocor Europe, USA
SP2/0 Perfusion bioreactor 1997 Centocor USA
CHO Suspension bioreactor 1997 Idec/Genentech/Roche Europe, USA
Murinemyeloma
– 1998 Novartis Europe, USA
NS0 Fed-batch bioreactor 1998 MedImmune/Abbott Europe, USA
CHO Suspension bioreactor 2003 Genentech/Novartis Europe, USANS0 Suspension bioreactor 1997 Hoffmann-La Roche Europe, USA
CHO – 1989 Pasteur-Merieux France
Recombinant therapeutic proteins 397

(Alteplase and TenecteplaseTM) are used in the treatment of acute myocar-dial infarction.
Urokinase is also a thrombolytic agent, used for treating pulmonaryembolism. Two variants of this protease have already been isolated: one of54 kDa and another of 33 kDa, both displaying proteolytic activity overplasminogen. Until recently, the only exogenous source for this enzymewas urine. However, in 2002 the product called Abbokinase
1, which is
produced in neonatal kidney tissue culture, was approved in the USA.Gaucher’s disease is a disorder of genetic origin, characterized by the
absence of a vital enzyme called glucocerebrosidase. In this case theglucocerebroside, the lipid component of cell membranes, accumulates inthe organism, leading to an exaggerated enlargement of the liver and otherorgans. Cerezyme
1, produced by the company Genzyme, is the recombi-
nant version of glucocerebrosidase, expressed in CHO cells (Table 16.1).Another genetic metabolic disorder is Fabry disease, which is related to
a deficiency in the enzyme Æ-galactosidase A. This enzyme is involved inthe metabolism of lipids, and its deficiency leads to the accumulation oflipids in the eyes, kidneys, and nervous and cardiovascular systems. In2001, the biopharmaceutical called Fabrazyme
1was approved, which
consists of recombinant Æ-galactosidase A and is produced by geneticallymodified CHO cells.
16.2.6 Blood coagulation factors
There are 13 factors involved in the blood coagulation process. Some ofthem, such as factors VII, VIII, and IX, are proteins. The absence of theseproteins constitutes a genetic disease known as hemophilia. A hemophilicperson is constantly at risk of undergoing a hemorrhage because of theincapacity to correctly carry out coagulation. Until the development ofrecombinant blood coagulation factors in the 1990s, hemophiliacs weretreated by blood transfusion and with proteins obtained from the plasmaof human donors. However, both solutions presented high risk of trans-mission of pathogenic agents, especially viruses. This is why a significantnumber of persons affected with hemophilia were contaminated with HIVand hepatitis viruses in the 1980s. Since then, although an additional virusinactivation step has been added to the manufacturing of plasma-derivedmolecules to increase product safety, there is still the risk of transmittingunknown viruses and pathogens of other types. Apart from that, limit-ations related to the availability of raw material (plasma from donors) alsopose problems for plasma-derived coagulation factors. For these reasons,an increasing demand for recombinant coagulation factors has occurred inrecent years and, in some countries such as Canada and Ireland, theexclusive use of recombinant factors is obligatory.
Blood factor VIII (FVIII) is a glycoprotein with 2351 amino acids and330 kDa. Its deficiency causes hemophilia A. The first products based onrecombinant factor VIII to reach the market were Recombinate andKogenate
1, expressed in CHO and BHK cells, respectively. Over the last
decade, other rFVIII products were approved, with modifications to themolecule (e.g. deletion of the B-domain), in the formulation or in theproduction processes.
398 Animal Cell Technology

In the production process of Kogenate1, BHK cells are cultivated in
perfusion bioreactors up to 500 L in size. The first step of purificationinvolves anion exchange chromatography. After that, an immunoaffinitychromatographic step and gel filtration are carried out, followed byanother immunoaffinity and another anion exchange chromatography step(Boedeker, 1992; Bhattacharyya et al., 2003).
Recombinate is produced in CHO cells cultivated in 2500 L bioreactors,operated in fed-batch mode. The purification process starts by removingcells by a filtration step, followed by three chromatographic steps: im-munoaffinity, anion exchange, and cation exchange (Bhattacharyya et al.,2003).
When hemophilia is due to a deficiency in factor IX (FIX), it isdesignated hemophilia B. In the same way as hemophilia A, the alternativeto treatment based on blood transfusion or plasma-derived products is theuse of recombinant FIX, which was approved for commercialization in1997 with the name of BeneFix
1.
It is produced in recombinant CHO cells cultured in a medium free ofanimal-derived components. The BeneFix
1production process involves
an ultrafiltration/diafiltration step, followed by four chromatographicsteps: ion exchange (Q resin), pseudo-affinity (Cellufine sulfate resin),hydroxyapatite, and affinity (immobilized Cu2þ ions). After these chro-matographic steps, there are membrane processes (nanofiltration for viralclearance and diafiltration for solvent exchange), after which the purifiedprotein is formulated (Edwards and Kirby, 1999).
Some hemophilia A and B patients develop antibodies against FVIII andFIX, respectively. This complicates the direct administration of theseproteins. An alternative in these cases is treatment with active factor VII(FVIIa), which complexes with factor III in the presence of phospholipidsand Ca2þ, activating factor X, which, in normal patients, is activated byactive factors VIII and IX. The commercial name of recombinant FVIIaexpressed in BHK cells and produced by Novo-Nordisk is NovoSeven
1
(Table 16.1).
16.2.7 Antibodies
Therapeutic antibodies constitute the most studied and commercializedclass of biopharmaceuticals nowadays. Their applications range from invitro and in vivo diagnostics, to the treatment of cancer, cardiovasculardiseases, asthma, and infectious and autoimmune diseases.
In the case of tumor treatment, in most cases, the mechanism of actionof a monoclonal antibody (mAb) is based on the specific recognition andbinding to specific surface receptors that are found on the tumor cells.However, in 2004, the antibody Avastin
1(Bevacizumab), which acts as an
inhibitor of the vascular endothelial growth factor (VEGF), was approvedfor the treatment of metastatic colorectal cancer. In this way, Avastin
1
inhibits angiogenesis around tumors, avoiding the abnormal formation ofblood vessels that support tumor expansion. Additionally, mAbs can beconjugated to drugs, to direct these molecules to the target tumor cells,decreasing any adverse effects on normal cells.
Recombinant therapeutic proteins 399

In the case of cardiovascular diseases, clot formation in the vascularsystem not only interrupts blood flow but also leads to embolism withfatal consequences. Antibodies against fibrin are able to detect these clotsin their initial stage of formation.
In viral infectious diseases, antibodies are used to bind to viral surfaceantigens, inhibiting disease propagation. Among the viruses most widelystudied as potential antibody targets are the hepatitis B and HIV viruses.
One of the worst consequences of a bacterial infection is sepsis. Becauseof the release of bacterial endotoxins (lipopolysaccharides), the immunesystem acts to produce cytokines, which are only efficient for localizedinfections. However, in the case of septicemia, the excessive release ofcytokines leads to dilatation of blood vessels, causing a drop in bloodpressure and insufficient tissue irrigation. Antibodies against endotoxinscan be used to minimize this condition.
Another application of antibodies is to treat autoimmune diseases,which occur due to a deficiency of the immune system that recognizes anendogenous molecule as a foreign element. The most common immu-notherapeutic approach in these cases is that the antibody is directedagainst the antigen on the surface of the lymphocytes responsible for theimmune response.
Finally, some antibodies are used in prophylaxis to prevent the rejectionof transplanted organs, such as kidney, liver, and heart. An example isZenapax
1, which was approved for use in 1997.
Some examples of therapeutic mAbs are presented in Table 16.1. How-ever, because of the clinical and commercial importance of this class oftherapeutic proteins, an entire chapter is dedicated to monoclonal anti-bodies (Chapter 17).
16.3 Economic aspects
The biopharmaceutical global market grew from 2000 to 2004 at an annualrate of 19%, and was evaluated at US$ 48 billion in 2005. This represents amuch higher growth rate than that experienced by the pharmaceuticalindustry as a whole. The forecast is that the biopharmaceutical market willreach US$ 100 billion by 2010 (Research and Markets, 2005a).
Erythropoietin (Epoetin, EPO) had a global market of US$ 11.1 billionin 2004 (Research and Markets, 2005b) and was the top-selling biopharma-ceutical worldwide. The patent on this biopharmaceutical, owned by thecompany Amgen, expired in 2004, paving the way for new companies toenter the market.
The colony stimulating factors (G-CSF, GM-CSF, and M-CSF) are alsocommercially relevant. The annual sales growth rate of these proteins inthe period 2000–2004 was 16% and in 2004 the sales totalled US$ 3.6billion (Research and Markets, 2005c).
However, the most promising class of biopharmaceuticals consists ofthe therapeutic mAbs. In 2004, total sales of therapeutic mAbs reachedapproximately US$ 11.2 billion, with an impressive annual growth rate of42% in the period 2000–2004 (Research and Markets, 2005d). The forecastis that in 2010 this market will reach US$ 34 billion.
400 Animal Cell Technology
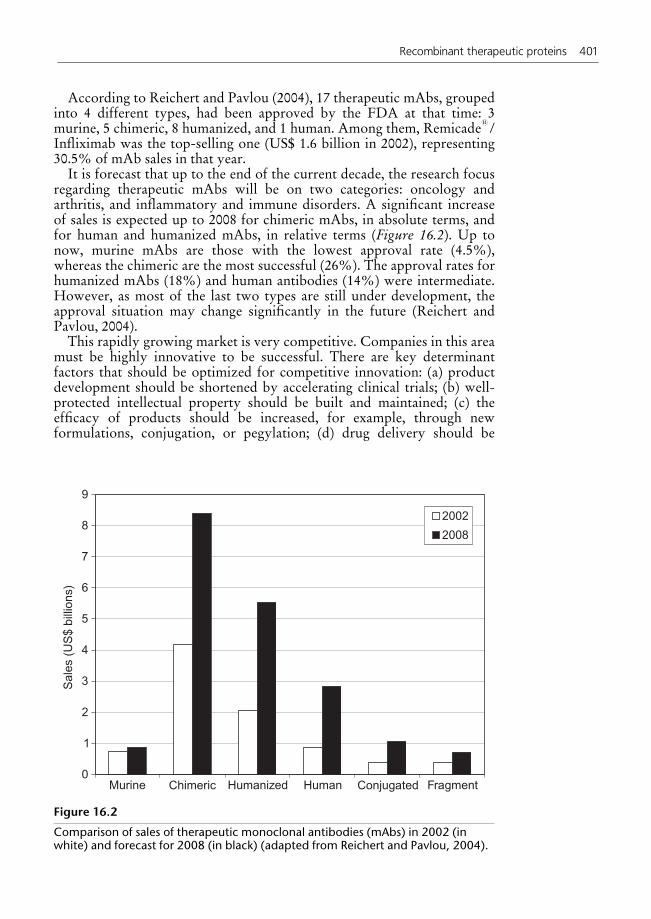
According to Reichert and Pavlou (2004), 17 therapeutic mAbs, groupedinto 4 different types, had been approved by the FDA at that time: 3murine, 5 chimeric, 8 humanized, and 1 human. Among them, Remicade
1/
Infliximab was the top-selling one (US$ 1.6 billion in 2002), representing30.5% of mAb sales in that year.
It is forecast that up to the end of the current decade, the research focusregarding therapeutic mAbs will be on two categories: oncology andarthritis, and inflammatory and immune disorders. A significant increaseof sales is expected up to 2008 for chimeric mAbs, in absolute terms, andfor human and humanized mAbs, in relative terms (Figure 16.2). Up tonow, murine mAbs are those with the lowest approval rate (4.5%),whereas the chimeric are the most successful (26%). The approval rates forhumanized mAbs (18%) and human antibodies (14%) were intermediate.However, as most of the last two types are still under development, theapproval situation may change significantly in the future (Reichert andPavlou, 2004).
This rapidly growing market is very competitive. Companies in this areamust be highly innovative to be successful. There are key determinantfactors that should be optimized for competitive innovation: (a) productdevelopment should be shortened by accelerating clinical trials; (b) well-protected intellectual property should be built and maintained; (c) theefficacy of products should be increased, for example, through newformulations, conjugation, or pegylation; (d) drug delivery should be
FragmentConjugatedHumanHumanizedChimeric0
1
2
3
4
5
6
7
8
9
Murine
Sal
es (
US
$ bi
llion
s)
2002
2008
Figure 16.2
Comparison of sales of therapeutic monoclonal antibodies (mAbs) in 2002 (inwhite) and forecast for 2008 (in black) (adapted from Reichert and Pavlou, 2004).
Recombinant therapeutic proteins 401

improved; and (e) cost-efficient manufacturing capabilities should bedeveloped (Pavlou and Belsey, 2005).
Cost-effective technologies have been gaining importance in the last fewyears due to the expiration of patents of the first-generation biopharma-ceuticals (Table 16.2). In the past, the concept of ‘‘time-to-market’’dominated the industrial arena. Nowadays, companies are willing to focuson process optimization and cost reduction. Important tools for thispurpose are the use of advanced genetic manipulation techniques toincrease the cell specific productivity, as well as the development ofperfusion processes, to increase volumetric productivity, and moreefficient purification processes, to improve yield (see Chapters 3, 9, 11and 12).
16.4 Challenges and future perspectives
16.4.1 Formulation and delivery of biopharmaceuticals
Despite the significant development in the biopharmaceutical area inrecent years, many challenges have yet to be overcome. Among the mainobstacles faced by companies are the development of improved formula-tions and new routes of administration, as well as the delivery of the activemolecules to the site of therapeutic action. Many biopharmaceuticalspresent limitations of low stability in vitro (shelf-life) or in vivo (half-lifeafter injection in the patient), and low solubility and bioavailability(Muller and Keck, 2004).
Inhalation/nebulization is an alternative method of administration ofsome biopharmaceuticals, for example insulin and GM-CSF (Anderson
Table 16.2 Examples of biopharmaceuticals that have lost patent protection
Company Commercial name Protein Year of patentexpiration
Produced in animal cellsBiogen Avonex
1Interferon �-1a 2003
Amgen/J&J/Sankyo Epogen1/Procrit Epoetin Æ (erythropoietin) 2004
Genentech Activase1
Alteplase (tPA) 2005Genetics Institute Recombinate Factor VIII 2005Genetics Institute/Wyeth Benefix
1Factor IX 2005
Eli Lilly Xigris1
Drotrecogin Æ (activated protein C) 2005
Produced in microorganismsSchering-Plough Intron A
1Interferon Æ-2a 2002
Novo Nordisk Novolin1
Insulin 2002Eli Lilly Humulin
1Insulin 2002
Eli Lilly Humatrope1
Human growth factor 2003Genentech Nutropin
1Human growth factor 2003
Genentech Protropin1
Human growth factor 2004Amgen Neupogen
1Filgrastim (G-CSF) 2006
Adapted from Dudzinski (2004).
402 Animal Cell Technology

et al., 1999). The first biopharmaceutical administered by inhalation to becommercialized is Exubera
1, a powder insulin, which was approved by
FDA and EMEA in 2006 (European Medicines Agency, 2006; Food andDrug Administration, 2006). This is the first alternative route of adminis-tration since the discovery of insulin in the 1920s.
Another possible form of administration that is under study is throughthe use of nanoparticles with diameters in the range of 200–400 nm,obtained through the formation of nanocrystals or by creating nanoscalestructures that capture the biomolecules. Depending on the materialsemployed and the preparation method, distinct particles can be used:nanoparticles, liposomes, polymeric micelles, ceramic nanoparticles, anddendrimers.
Nanocrystals can increase in vitro stability by transforming solublemolecules into non-soluble forms. In this way, only the nanocrystalsurface is accessible to degrading factors, such as water and oxygen. Thismeans that an external monolayer of degraded molecules is formed toprotect the inner part of the nanocrystal. Soluble molecules, such aspeptides, nucleotides, and proteins can be transformed into particles bydispersing them into oil. After oral administration, the oil is degraded bylipases in vivo, releasing the drug. Alternatively, soluble molecules can betransformed into non-soluble molecules by forming lipid conjugates(LDC
1). Conjugated particles can be prepared by either salt formation
(e.g. amino group containing molecule with fatty acid) or covalent bond(e.g. ether, ester) (Muller and Keck, 2004).
Another challenge is the delivery of a biopharmaceutical to its site ofaction, as the injection of molecules in solution leads to a partitioning ofthe molecules according to their physicochemical properties. One ap-proach to deliver particles injected intravenously is based on the conceptof ‘‘differential protein adsorption.’’ After injection the particles adsorbblood proteins according to physicochemical surface properties of theparticles. The adsorbed proteins determine the cells to which the particleswill be directed (Muller and Keck, 2004).
A popular approach to confer enhanced stability and improve thepharmacokinetics of therapeutic proteins is to conjugate them to differ-ent polymers. Nowadays polyethylene glycol (PEG) is the most widelyemployed polymer due to its low toxicity and cost. This technique,known as pegylation, is able to increase protein stability, improvepharmacokinetics, and potentially decrease immunogenicity (Chirinoand Mire-Sluis, 2004). Since the entry of the first pegylated protein inthe market in 1990, several products have been approved, such asNeulasta
1(pegylated G-CSF for the treatment of neutropenia induced
by chemotherapy) and PEG-IntronTM/Pegasys (IFNÆ for the treatmentof chronic hepatitis C). These products have enhanced stability, thusreducing the number of injections patients need to receive. However,the companies owning the patents commercialize pegylated biopharma-ceuticals at prices much higher than the corresponding nonpegylatedones, preventing a broader use of the pegylated version, mainly indeveloping countries. The prices charged certainly do not represent theadditional cost of polymer conjugation, but rather a market value thatreflects a monopoly.
Recombinant therapeutic proteins 403

16.4.2 Characterization of biopharmaceuticals
Biopharmaceuticals have completely different properties from conven-tional low molar mass pharmaceuticals. This particularly affects productcharacterization, due to the complex production processes and proteinstructures. Thus, successful production of biopharmaceuticals reliesmainly on strict protocols, clinical expertise, and follow-up during clinicalapplication (Crommelin et al., 2003).
For these reasons, the ability to compare products originating fromdifferent processes is more important than characterizing a biopharma-ceutical product from a well established process. Modifications in theproduction process can result in changes in physicochemical propertiesand post-translational modifications. These modifications can influencebiological activity, bioavailability, and immunogenicity of the product(Chirino and Mire-Sluis, 2004). Therefore, as discussed in Chapter 14, theregulatory agencies worldwide are discussing criteria to be applied toevaluate comparability of biological products (Food and Drug Adminis-tration, 2005; European Medicines Agency, 2005).
Among the many tests available for characterizing biopharmaceuticals,assessment of protein structure, particularly quaternary structure, includ-ing aggregate formation, seems to be particularly important, since it canstrongly influence immunogenicity. This remains a concern for the char-acterization of biological products, since preclinical studies, carried out inanimals, are not able to predict the immunogenicity of a biological drug inthe target population (Chirino and Mire-Sluis, 2004). In this context,product labelling becomes an important issue, since aggregate formationand continuous administration of a protein drug can lead to antibodyproduction (Ryff and Schellekens, 2002). Biopharmaceutical labellingcould thus provide information in such a way that the physician wouldunderstand the clinical and biological consequences of antibody produc-tion and, therefore, could make a decision that could lead to the suspen-sion of a treatment.
16.4.3 Alternative expression systems
Due to the structural complexity of therapeutic proteins, their recombi-nant forms are usually produced in mammalian cell culture. When glyco-sylation is not present or is not essential for biological activity, therapeuticproteins can be produced in bacteria (e.g. E. coli) or yeast (e.g. Sacchar-omyces cerevisiae). However, some studies propose the use of thesesystems for glycosylated proteins as well.
Baneyx and Mujacic (2004) propose the genetic manipulation of E. coli,to enable metabolic competency to carry out post-translational modifica-tions. Gerngross (2004) argues for the use of filamentous fungi and yeastfor the production of therapeutic proteins by the expression of humanglycosylation enzymes. This type of strategy was reported by Chiba et al.(1998) and Martinet et al. (1998) for S. cerevisiae and Pichia pastoris,respectively.
Plant cells are another expression system, which is being evaluated forthe production of recombinant therapeutic proteins. According to Hellwig
404 Animal Cell Technology

et al. (2004), recombinant human glycoproteins synthesized in plant cellsshow greater similarity to the native proteins than those produced inrecombinant microorganisms. However, there are some limitations, suchas the instability of recombinant proteins in plant cell culture media andthe low protein yields reported so far for plant cells in culture (Hellwig etal., 2004). Among therapeutic proteins, GM-CSF has been produced inNicotiana tabacum (Lee and Kim, 2002) and Lycopersicum esculentum(Kwon et al., 2003). A concrete example of the application of plant cells isthe first market license issued in January 2006 to a veterinary vaccineproduced in plant cells (Katsnelson et al., 2006). The North AmericanUSDA (United States Department of Agriculture) considered the veter-inary viral vaccine safe and effective in protecting chickens from New-castle disease. This subunit vaccine consists of a protein expressed inrecombinant tobacco cells and represents the first vaccine obtained fromplant cells to be approved worldwide.
Another possible system for the production of therapeutic proteinsconsists of transgenic animals. Although there is controversy regardingsafety and reproducibility, many reports on this subject have been pub-lished and some proteins derived from these systems are currently underclinical trials. Parker et al. (2004) purified and characterized humanfetoprotein Æ secreted in transgenic goat milk. This protein, used in thetreatment of autoimmune diseases, proved to be identical to the nativeform by mass spectrometry, circular dichroism, and pharmacokinetic tests.
Using a different approach, some authors propose post-translationalmodification in vitro. Glycosylated proteins could be obtained by in vitroglycosylation after their production in non-mammalian expression sys-tems. Synthetic strategies for preparing glycoproteins can be classified intotwo main categories: convergent and sequential. In the convergent strat-egy, the glycan is assembled separately by enzymatic or chemical methods,or obtained from natural sources, and is then attached to the polypeptidechain. In the sequential strategy, a mono- or disaccharide unit is intro-duced into the polypeptide, and then the complete glycan is synthesizedby the sequential attachment of sugars by the action of glycosyltrans-ferases. However, the development of simple and reliable methods forobtaining selectively and uniformly glycosylated proteins is still a chal-lenge and will probably remain a focus of future research (Khmelnitsky,2004).
Finally, some authors propose the use of enzyme mixtures for thebiosynthesis of complex molecules. A cell free protein synthesis (CFPS)system is a novel approach that was successfully used for the productionof complex mammalian proteins with multiple disulfide bonds (Bhatta-charya, 2004). However, even if the technical potential of this method isproved, its economical feasibility has still to be proven.
16.4.4 Second-generation biopharmaceuticals
Most biopharmaceuticals initially approved, known as first-generationbiopharmaceuticals, consist of simple replacement proteins with an aminoacid sequence identical to the native human protein. Second-generationbiopharmaceuticals are engineered molecules resulting from modifications
Recombinant therapeutic proteins 405

of glycans or of amino acid composition, or from conjugation to othermolecules, such as in the case of pegylated proteins. These alterations inthe protein are carried out with different goals: (i) to improve thepharmacokinetic profile of the protein; (ii) to increase protein half-life;and/or (iii) to alter its immunogenic profile.
An example of a second-generation biopharmaceutical obtained by site-directed mutagenesis is TNKase (TenecteplaseTM), which is an alteredform of recombinant tPA produced in CHO cells by Genentech. Thesubstitution of three amino acids in the native protein results in a moleculewith higher affinity for its receptor (fibrin), a higher resistance to itsnatural inhibitor (PAI-1), and an increased half-life (Walsh, 2004).
Second-generation insulins are also available and consist of moleculeswith changes in one to two amino acids, aimed at accelerating the onset ofactivity (Lispro and Aspart insulin products) or increasing the half-life(Glargine insulin product).
Humanized antibodies, discussed in more detail in Chapter 17, are alsoconsidered second-generation molecules. By humanization, the high im-munogenicity of a murine antibody is eliminated, enabling improvedtherapeutic use.
Protein engineering can also be used for creating fusion proteins orhybrid biopharmaceuticals. An example of this type of product is Enbrel
1
(Etanercept), which consists of the extracellular ligand-binding domain ofthe 75-kDa receptor for tumor necrosis factor-alpha (TNFÆ) and the Fcportion of human IgG1. TNF is a proinflammatory cytokine present athigh concentrations in patients suffering from rheumatoid arthritis. En-brel
1acts as competitive inhibitor of TNF, as it competes with the
receptor molecules (TNFR) present in the cell. The antibody portion ofthe fusion protein increases the half-life in blood (Walsh, 2004).
Another approach relies on modifying the glycan of glycoproteins toimprove pharmacokinetics of biopharmaceuticals. An example was theintroduction of two additional N-glycosylation sites in EPO, resulting ina hyperglycosylated erythropoietin product (Aranesp
1), which was ap-
proved for commercialization in 2001. The modification of the carbo-hydrate structure increased the half-life to 25.3 hours (as compared with8.5 hours for the first-generation EPO), allowing a decrease in injectionfrequency that is attractive for patients.
With the considerable evolution achieved in recent years in the elucida-tion of structure–function relationship of proteins, as well as in the areasof protein engineering and bioinformatics, many new developments areexpected in the field of new-generation biopharmaceuticals. These willhave significant advantages for patients, including lower immunogenicity,lower frequency of injections, and enhanced stability in serum.
References
Anderson PM, Markovic SN, Sloan JA, Clawson ML, Wylam M, Arndt CAS,Smithson WA, Burch P, Gornet M, Rahman E (1999), Aerosol granulocytemacrophage-colony stimulating factor: a low toxicity, lung-specific biologicaltherapy in patients with lung metastases, Clin. Cancer Res. 5:2316–2323.
406 Animal Cell Technology

Baneyx F, Mujacic M (2004), Recombinant protein folding and misfolding in Escher-ichia coli, Nat. Biotechnol. 22:1399–1408.
Bhattacharya SK (2004), The use of enzyme mixtures for complex biosyntheses, Curr.Opin. Biotechnol. 15:449–455.
Bhattacharyya MS, Singh J, Soni P, Banerjee UC (2003), Recombinant factor VIII forhaemophilia: an overview of production technologies, CRIPS 4:2–8.
Boedeker BGD (1992), The manufacturing of the recombinant factor VIII Kogenate1,
Transf. Med. Rev. 6:256–260.Castilho LR, Medronho RA (2002), Cell retention devices for suspended-cell perfusion
cultures, Adv. Biochem. Eng. Biotechnol. 74:129–169.Chiba Y, Suzuki M, Yoshida S, Yoshida A, Ikenaga H, Takeuchi M, Jigami Y,
Ichischimak K (1998), Production of human compatible high mannose-type(Man5GlcNAc2) sugar chains in Saccharomyces cerevisiae, J. Biol. Chem.273:26298–26304.
Chirino AJ, Mire-Sluis A (2004), Characterizing biological products and assessingcomparability following manufacturing changes, Nat. Biotechnol. 22:1383–1391.
Crommelin DJA, Storm G, Verrijk R, Leede L, Jiskoot W, Hennink WE (2003),Shifting paradigms: biopharmaceuticals versus low molecular weight drugs, Int. J.Pharm. 266:3–16.
Dudzinski DM (2004), Reflections on historical, scientific, and legal issues relevant todesigning approval pathways for generic versions of recombinant protein-basedtherapeutics and monoclonal antibodies, Harvard Law School, Thesis. Availableat: http://leda.law.harvard.edu/leda/data/630/(accessed February 2006).
Edwards J, Kirby N (1999), Recombinant coagulation factor IX (BeneFix1). In: Walsh
G, Murphy B (Eds), Biopharmaceuticals: An Industrial Perspective, SpringerVerlag, Berlin, pp. 73–108.
European Medicines Agency (2005), Guidance documents on biosimilar products.Available at: http://www.emea.eu.int/htms/human/biosimilar/biosimilarfin.htm(accessed October 2005).
European Medicines Agency (2006), EPARs for authorised medicinal products forhuman use. Available at: http://www.emea.europa.eu/htms/human/epar/a.htm(accessed December 2006).
Food and Drug Administration (2005), Scientific considerations related to developingfollow-on protein products. Available at: http://www.fda.gov/cder/meeting/followOn/followOnPresentations2_2005.htm and http://www.fda.gov/cder/meeting/followOn/followOnPresentations.htm (accessed May 2005).
Food and Drug Administration (2006), FDA approved products. Available at: http://www.accessdata.fda.gov/scripts/cder/drugsatfda/(accessed December 2006).
Gerngross TU (2004), Advances in the production of human therapeutic proteins inyeast and filamentous fungi, Nat. Biotechnol. 22:1409–1414.
Hellwig S, Drossard J, Twyman RM, Fischer R (2004), Plant cell cultures for theproduction of recombinant proteins, Nat. Biotechnol. 22:1415–1422.
Katsnelson A, Ransom J, Vermij P, Waltz E (2006), News in brief: USDA approvesthe first plant-based vaccine, Nat. Biotechnol. 24:233–234.
Khmelnitsky YL (2004), Current strategies for in vitro protein glycosylation, J. Mol.Catal. B Enzym. 31:73–81.
Kwon TH, Kim YS, Lee JH, Yang MS (2003), Production and secretion of biologicallyactive human granulocyte macrophage-colony stimulation factor in transgenictomato suspension cultures, Biotechnol. Lett. 25:1571–1574.
Lee SY, Kim DI (2002), Stimulation of murine granulocyte macrophage-colonystimulation factor production by pluronic F-68 and polyethylene glycol intransgenic Nicotiana tabacum cell culture, Biotechnol. Lett. 24:1779–1783.
Martinet W, Maras M, Saelens X, Jou WM, Contreras R (1998), Modification of the
Recombinant therapeutic proteins 407
protein glycosylation pathway in the methylotrophic yeast Pichia pastoris, Bio-technol. Lett. 20:1171–1177.
Muller RH, Keck CM (2004), Challenges and solutions for the delivery of biotechdrugs – a review of drug nanocrystal technology and lipid nanoparticles,J. Biotechnol. 113:151–170.
Parker MH, Birck-Wilson E, Allard G, Masiello N, Day M, Murphy KP, Paragas V,Silver S, Moody MD (2004), Purification and characterization of a recombinantversion of human Æ-fetoprotein expressed in the milk of transgenic milk, Prot.Express. Purif. 38:177–183.
Pavlou AK, Belsey MJ (2005), The therapeutic antibodies market to 2008, Eur. J.Pharm. Biopharm. 59:389–396.
PhRMA (2004), 324 Biotechnology medicines in testing promise to bolster the arsenalagainst disease. Available at: http://www.phrma.org/files/Biotech%20Survey.pdf(accessed February 2006).
Reichert J, Pavlou A (2004), Monoclonal antibodies market, Nat. Rev. Drug Discov.3:383–384.
Research and Markets (2005a), Biopharmaceuticals – current market dynamics &future outlook. Available at: http://www.researchandmarkets.com/reports/39083(accessed May 2005).
Research and Markets (2005b), Erythropoietin – current market dynamics & futureoutlook. Available at: http://www.researchandmarkets.com/reportinfo.asp?report_id¼298258 (accessed May 2005).
Research and Markets (2005c), Colony stimulating factors – current market dynamics& future outlook. Available at: http://www.researchandmarkets.com/reportinfo.asp?report_id¼235022 (accessed May 2005).
Research and Markets (2005d), Monoclonal antibody therapeutics: current marketdynamics & future outlook. Available at: http://www.researchandmarkets.com/reportinfo.asp?report_id¼75046 (accessed May 2005).
Ryff JC, Schellekens H (2002), Immunogenicity of rDNA-derived pharmaceuticals,Trends Pharmacol. Sci. 23:254–256.
Walsh G (2002), Biopharmaceuticals and biotechnology medicines: an issue of nomen-clature, Eur. J. Pharm. Sci. 15:135–138.
Walsh G (2003), Biopharmaceuticals – Biochemistry and Biotechnology, 2nd Ed., JohnWiley and Sons, Chichester.
Walsh G (2004), Second-generation biopharmaceuticals, Eur. J. Pharm. Biopharm.58:185–196.
Werner RG (2004), Economic aspects of commercial manufacture of biopharmaceuti-cals, J. Biotechnol. 113:171–182.
408 Animal Cell Technology

17Monoclonal antibodiesWirla M.S.C. Tamashiro and Elisabeth F.P. Augusto
17.1 Introduction
Antibodies are molecules secreted by plasmocytes; these are differentiatedfrom B lymphocytes following previous contact with a specific antigen.The number of different antibodies produced by humans is extremelylarge, incorporating between 107 and 108 distinct molecules, but any one Blymphocyte only produces antibodies against a single specific antigen.After immunization or contact with the antigen, the B cells whichrecognize each antigenic determinant in an antigen molecule will produceclones, thus increasing the number of lymphocytes specific for thatantigen. Although the antibodies produced by all of these lymphocyteclones will be specific for the same antigen, these antibodies will notnecessarily be structurally identical, that is, they are polyclonal antibodies.The result of this process is an increase in the level of specific antibodies inthe serum or body secretions of the immunized individual. Even immuni-zation with highly purified antigens results in the production of polyclonalantibodies, so that the composition and properties of immune sera varywith each preparation (Abbas et al., 2000).
Attempts to produce homogeneous antibodies in vitro arose almost assoon as lymphocytes and their biological properties were discovered.However, B lymphocytes normally do not survive in cell cultures. Forsurvival, they must undergo a malign transformation, such as that inducedby the Epstein–Barr virus (Steinitz et al., 1977). Some tumors of Blymphocytes, the multiple myelomas, can arise spontaneously and otherscan be induced by the administration of mineral oil. These tumors,whether spontaneous or induced, can be adapted to in vitro cultivation,and they will secrete highly homogeneous antibodies (monoclonal anti-bodies, mAbs) since they originate from a single tumor cell (Horibata andHarris, 1977). However, even if all antibodies are homogeneous in amyeloma culture, it is impossible to predict what this specificity will be.
The production in vitro of mAbs with a predetermined specificity hasonly been possible since the advent of the technology of hybridomas,which was introduced by Kohler and Milstein in 1975. These hybridomasare the products of in vitro fusion of myelomas with normal B lympho-cytes. The fusion products preserve the capacity for self-propagation in aculture, as well as the secretion of the antibodies of interest, characteristicsinherited from the parent myeloma and the normal B lymphocyte,respectively. The myelomas used in such fusions generally involve celllines from B-lymphocyte tumors developed in mice or rats (Cotton andMilstein, 1973; Kohler and Milstein, 1975b; Shulman et al., 1978), while

the B lymphocytes come from mice or rats previously immunized with theantigen of interest. After the fusion of the myeloma with the normal Blymphocyte, the hybridomas of interest can be selected and cloned toobtain an unlimited quantity of homogeneous antibodies that are highlyspecific (Kohler and Milstein, 1975a).
The production of such mAbs using hybridoma technology has made itpossible to detect and quantify a wide variety of molecules produced bylive organisms in highly specific and sensitive assays, thus making possibleenormous advances in various areas of biological research. The specificityof these mAbs has also facilitated the improvement of clinical diagnoses, aswell as creating expectations about their use as a therapeutic agent forhuman diseases.
One problem with the use of these antibodies in humans, however, isthe immunogenicity (the ability to induce an immune response) of murinemAbs, and various associated adverse reactions. Some mouse mAbs have,however, been licensed for use in human patients (Lin et al., 2005). Theadverse reactions can be controlled to a certain extent by ‘‘humanization’’of the murine reagents (produced by cells transfected with antibodygenes), as well as by the use of recombinant DNA techniques to produceantibody fragments preserving the antigen-binding capacity of the originalantibody molecules (Huhalov and Chester, 2004). Only recently has theestablishment of a line of human myeloma cells (called Karpas 707H) beenreported, and this is proving useful in the production of hybridomas viafusion with B lymphocytes obtained from immunized or infected humans(Karpas et al., 2001; Vaisbourd et al., 2001). Obtaining all these highlyspecific mAbs, whether murine, humanized, or antibody fragments, isdependent upon the production of a hybridoma.
Both hybridomas and humanized antibody producer cells can be culti-vated indefinitely in conventional cultures, usually containing fetal bovineserum in the medium. In the supernatants of these cultures, the quantity ofmAbs varies from 20 to 100 �g/ml of protein, depending on the cell andthe system of cultivation.
There are, however, in vivo methods of obtaining mAbs, and theseproduce much larger quantities. One of these is intraperitoneal administra-tion of the hybridomas into histocompatible animals (of the same cell lineas the parents of the hybridoma) or immunodeficient animals (individualswith no functional immune system). These receptor animals will developascitic tumors containing from 1 to 40 mg/ml of the mAb secreted by thehybridoma (Kretzmer, 2002). However, despite the fact that this methodis well documented and has been used widely in the past, the procedure ispresently being rejected because of ethical concerns over the use oflaboratory animals.
This has led to an increased interest in methods for the in vitroproduction of large quantities of mAbs. Submersed cultivation in bioreac-tors is one possibility. In contrast with traditional methods, this procedureuses large quantities of culture medium, increasing the scale of the processand making possible the production of virtually unlimited quantities ofmAbs by a given hybridoma.
In this chapter, the fundamentals of hybridoma technology are dis-cussed and the most widely used protocols and procedures are presented.
410 Animal Cell Technology

The main advances in large-scale in vitro production of mAbs are alsopresented. This topic is of extreme importance in the biotechnologyindustry, as can be seen by the extent of the use of mAbs in diagnostic andtherapeutic applications.
17.2 Antibodies
Antibodies constitute the prototype of the superfamily of immunoglobins(Ig), molecules, which have globular domains resulting from the existenceof cysteine residues along their polypeptide chains. These residues formdisulfide bridges (S-S) within and between chains. The functional units ofthe antibody molecules are generally monomers, each formed by a pair oflight polypeptide chains of approximately 25 kDa each, and another pairof heavy ones of about 50 kDa (Figure 17.1). The chains of each pair areidentical, with all four chains linked by inter-chain disulfide bridges. Eachof the antibody chains in this monomer has an N-terminal domain,identical for the two members of each pair, although these domains varyfrom one molecule to another. The heavy chains also have three or moreconstant domains (C-terminals), whereas the light chains have only asingle one. The variable N-terminal domains of the Ig molecule constitutethe antigen combining sites, with each of the two sets of heavy and lightchains of the monomer constituting a single site for antigen binding.Hence, each monomer of the immunoglobulin has duplicate sites forcombining with a specific antigen. The rest of the molecule(the C-domains) effects the other functions of the antibody: interactionwith the cells of the immune system (via Ig receptors), linking to themolecules of the complement system, and crossing the placenta or epithe-
Mouse
Human
CDR1CDR2
CDR3
CDR1CDR2
CDR3
S-SS-SS-S
Figure 17.1
Structure of an antibody molecule.
Monoclonal antibodies 411

lial mucosa. The Ig classes (IgD, IgM, IgG, IgE, and IgA) are determinedby the primary sequence of the constant domains of the heavy chain pair.IgD and IgM monomers are expressed on the surface of the naıve Blymphocyte, which constitute B-cell receptors (BCRs) for antigens. Exceptfor IgD, all of the Ig classes can be secreted by plasmocytes upon contactwith a specific antigen, whether a foreign substance or an altered nativeconstituent. Although IgG and IgE are always monomers, IgA moleculescan be secreted as either monomers or dimers. IgM is always secreted as apentamer. In humans, there are four IgG subclasses: IgG1, IgG2, IgG3,and IgG4, whereas there are two IgA subclasses: IgA1 and IgA2 (Abbas etal., 2000).
There are, however, enormous numbers of antigens that may be encoun-tered by the immune system. To deal with them, B lymphocytes undergoa unique developmental process involving genetic recombination of genesegments to form a wide variety of antibodies. This process, which takesplace in the bone marrow of mammals and the Fabricius bursa of birds,was determined some 30 years ago by Tonegawa et al. (1978). The criticalaspect of this process is the occurrence of cuts in the parent DNA chainof the developing lymphocyte by special enzymes (RAG1 and RAG2),that are only found in these cells. This cutting and the subsequent re-arrangement of gene segments allows great variety in the gene, which isresponsible for the formation of the N-terminal (variable) regions of the Igchains. This enables coupling with the wide variety of antigen determi-nants encountered by the organism.
Three regions of the parent DNA heavy chain are affected by these cuts:V, D, and J (for variable, diversity, and junction, respectively). Initially,simultaneous cuts occur in a D and a J region of the chain; the segmentbetween the two cuts is eliminated, and the two loose ends are joined in aDJ sequence. Then, two additional cuts occur, one in a V region, and thesecond immediately prior to the new DJ sequence. The interveningsegment is eliminated, and the V region is attached to the DJ sequence toform the final VDJ gene sequence, which codifies the variable portion ofwhat will be the heavy Ig chain. Figure 17.2 shows this gene recombinationin the formation of the heavy chain variable region.
The second step in the formation of the heavy chain involves transcrip-tion of the DNA to form the primary transcript of the RNA of thedeveloping lymphocyte, which includes the new VDJ sequence. Thisprimary transcript (tRNA), however, still includes non-codifying seg-ments (introns). In the third step, these introns are eliminated, and thefinal RNA includes only the variable N-terminal gene and the genes for allof the constant regions.
This mRNA is then translated to heavy polypeptide chains in thecytoplasm. The first set formed is the heavy chain of IgM, consisting of aVDJ region and a C� region (the first of the sequence of constant genes)(Maki et al., 1980). Each pair of these heavy chains is joined with a pair ofsurrogate light chains (formed without genetic recombination) and mi-grates to the surface of the developing lymphocyte. This provisionalantibody probably attaches to a self-antigen, triggering the rearrangementof the genes for the variable region of the light chains. This rearrangementis similar to that undergone in the formation of the heavy chain, except
412 Animal Cell Technology

that only a single pair of cuts in the V and J regions is involved, becausethere is no D region in light chains.
The first or primary transcript of this light chain gene segment includesboth the VJ gene sequence and the two genes for the constant region(kappa and lambda). The formation of the mRNA for the light chains issimilar to that of the heavy chains. Kappa chains are the first light chainsto be formed and lambda chains will only be formed if the molecules arenon-functional.
Once the definitive light chains have been produced, they replace thesurrogate chains in the constitution of the antigen receptor of developingB lymphocyte, and then the immature lymphocyte migrates to the periph-eral lymphoid organs (spleen, lymph nodes, etc.). Once definitive chainshave been produced, their presence inhibits rearrangement of the genes ofthe corresponding allele. This process, called allele exclusion, leads to theproduction of surface immunoglobulins capable of recognizing only onespecific antigenic determinant. The set of genetic events described here isresponsible for the generation of the enormous repertoire of antibodies inorganisms with an immune system (Sakano et al., 1980).
During the mid-1970s, this process of antibody generation was notunderstood, and the laboratory of Cesar Milstein was one of those tryingto decipher the mechanisms involved. The experimental approach adopted
DNA
DNA
IgM gene
IgG gene
DNA re-arrangement
V
V D
D
I
I
µ
δ γ3
γ3
γ1
γ1
γ2b
γ2b
γ2a
γ2a
ε
ε
α
α
V V V1 2 100, ...
(variable)
segments
� D D D1 2 30, ...
(diversity)
segments
� J1, J2...J6
(joining)
segments
1234...100 1 2...30 1...6 µ δ
mRNAV D J µ
Figure 17.2
Genes for the expression of immunoglobulins heavy chain.
Monoclonal antibodies 413

by this group involved the fusion of myelomas from mice with those fromrats using the Sendai virus. The resultant hybrid cells were found to beable to express complete molecules from both of the parent cells, as well asmixed proteins formed by the light chains of one parent and the heavychains of the other. Given these results, he corroborated the hypothesis ofallele exclusion of Ig genes, which had been proposed several years earlier(Pernis et al., 1965), but he also showed that the joining of light and heavychains was not a selective process, that is, any light or heavy chainavailable in the cytoplasm of the hybrid cell could be included.
Once inter-species fusion was shown to be possible, the next step wasan attempt to fuse myelomas with normal B lymphocytes. Only in 1975did Kohler and Milstein propose a protocol that led to the efficientproduction of hybrid cells for the secretion of mAbs with a predeterminedspecificity, which could be perpetuated in cell cultures, the so-calledhybridomas (Kohler, 1981).
For the isolation of these hybridomas to be feasible, the myeloma linemust be deficient in one of the two paths of DNA synthesis. The myelomacells used by Kohler and Milstein for the production of the first hybrido-mas were deficient in hypoxanthine phosphoribosyl transferase (HGPRT),an enzyme involved in the synthesis of DNA nucleotides. When thesemyelomas were put into contact with the spleen cells of mice previouslyimmunized with sheep erythrocytes, and an inactivated Sendai virus addedas a fusion agent, the resulting fusion products included hybridomasproducing the mAb of interest. By removing the fusion agent and seedingthe cells in the presence of aminopterin, an inhibitor of the salvagepathway of DNA synthesis, they were able to isolate the effectivehybridoma, because growth of the myeloma cells not fused with the spleencells is completely inhibited.
Approximately a week after plating, all the normal (non-fused) Blymphocytes had already been eliminated naturally from the culture,because normal lymphocytes do not propagate in culture. Only thosehybrids resulting from the fusion of the myelomas with the B lymphocyteswere able to grow in the culture, and some of them also preserved theability to secrete antibodies against the antigen used for immunization.
Today the myelomas most frequently used in the production of hybri-domas are still those that have a mutation in the gene that codifies theHGPRT enzyme (Littlefield, 1964), and show growth inhibition in amedium containing 8-azaguanine or 6-thioguanine, both analogs of gua-nine. Other mutant cell lines lacking the enzyme thymidine kinase (TK)also exist, but are less frequently used. Their hybridomas can be identifieddue to their ability to survive in a medium containing 5-bromodeoxiur-idine, an analog of thymidine.
HGPRT and TK enzymes are important in the synthesis of DNA frompreformed nucleotides provided in the culture medium. The myeloma cellslacking these enzymes are unable to utilize the hypoxanthine or thymidinefrom the medium; moreover, they die in the presence of aminopterin,which inhibits the de novo synthesis of DNA. Thus, in a medium contain-ing aminopterin, hypoxanthine, and thymidine (HAT medium) only thosehybridomas that receive the HGPRT or TK enzyme from the normalparents (spleen B lymphocytes) will survive.
414 Animal Cell Technology

The standard protocol used today for the production of hybridomas issomewhat different from that employed by Kohler and Milstein in 1975.The major modifications (proposed by De St Groth and Scheideger(1980)) involve the use of polyethylene glycol (PEG) as a fusion agent, theuse of myeloma cells that do not produce antibodies, the cloning ofhybridomas using limitant dilution, and cultivation on plastic plates.
17.3 Production of monoclonal antibodies
Five steps are important in the production of hybridomas to be used forthe secretion of mAbs of a determined specificity (Nelson et al., 2000): (1)immunization of mice, (2) fusion and selection of secreting hybridomas;(3) cloning of hybridomas, (4) definition of the isotype of mAbs obtained,and (5) further development (Figure 17.3).
17.3.1 Step 1: Immunization
Most myeloma lines used in cell fusion originate from BALB/c mice.These mice can be immunized with exogenous proteins (50–100 �g/ml),with cells (107 cells) or with peptides conjugated with carrier proteins,such as the keyhole limpet hemocyanin (KLH). The proteins and peptides
Antigen
Fuse in
polyethylene
glycol
Cell culture
myeloma line
Spleen cells Myeloma cells
Select and grow hybrid cells
Select cells making antibody
of desired specificityPropagate
desired
clonesFreeze
Grow in
mass culture
Antibody Antibody
Induce
tumors
Thaw
Figure 17.3
Scheme for hybridoma production.
Monoclonal antibodies 415

are generally mixed with adjuvants (complete or incomplete Freundadjuvant, potassium alum (K2Al24SO4 + 24H2O) or commercial adjuvantssuch as Titer Max) and introduced subcutaneously or intraperitoneally.Cells are generally administered intraperitoneally in the absence of adju-vants. It is usually necessary to repeat the administration of the antigenonce or twice to obtain an immune response with a high level of anti-bodies. The level of specific antibodies in the serum is assessed byimmunoenzymatic assays of the ELISA type, using serum separated froma small sample of blood collected from the tail or the ocular plexus veins.
The immunization of laboratory animals such as mice or rats is designedto increase the number of B-lymphocyte clones specific for the antigen,thus increasing the chances of obtaining hybridomas that will secrete theantibodies of interest in fusion experiments. The booster doses promotethe switch of immunoglobulin class and the maturation of antibodyaffinity due to somatic hypermutation of the variable genes for theimmunoglobulins that arise after repeated exposure of the animal to theantigen.
17.3.2 Step 2: Fusion and selection of secreting hybridomas
Myeloma cells are generally of the SP2Ag14/0 line (Kohler and Shulman,1978); they are cultivated in RPMI 1640 medium containing 10% fetal calfserum until semiconfluence and then collected from the culture flasks bycentrifugation.
Animal spleens that present the highest antibody levels are collectedaseptically, disrupted in the culture medium, and then the spleen cellsuspensions are transferred to the centrifuge tube containing the myelo-mas. The mixture contains 2 3 107 myeloma cells for each 108 spleen cells.These cells are allowed to sediment and are then washed twice with aserum medium and centrifuged.
The cell mixture is then resuspended in 1 ml of a 10% DMSO and 50%PEG solution. This solution is added slowly to the cells over a period of2.5 minutes. The first 60 seconds are at room temperature, after which thetemperature is increased to 378C (for the final 90 seconds). The volume ofthe cell suspension is then slowly increased to a total of 50 ml with culturemedium or physiological saline solution. After 5 minutes the cells areallowed to sediment and washed twice by centrifugation. The finalsediment is resuspended in HAT medium containing 20% fetal bovineserum. In the standard procedure, the cells are now plated at a density of105 per well in 96-well plates containing a feeder layer of macrophages,although in some protocols, subsequent selection is simplified by plating24 wells with a density of 106 cells per well. The feeder layer is preparedby seeding the wells with macrophages collected from the peritonealcavity of normal mice some 48 hours prior to the fusion procedure. Inaddition to providing growth and differentiation factors, such as interleu-kin (IL)-6, this feeder layer provides the cell density necessary for thegrowth of the hybridomas that manage to survive the process.
Some 10–15 days after seeding, the hybridomas are already sufficientlyestablished on the surface of the plate that the antibodies of interest can bedetected in the supernatants of the cultures. Their identification involves
416 Animal Cell Technology

the use of specific assays, which are defined by the nature of the antigenand the properties of the antibody being produced.
For cell surface antigens, the most frequently used assays are immuno-fluorescence or immunoenzymatic, with their numerous variations. Forsoluble protein or peptide antigens, the most common assays are immu-noenzymatic, enzyme-linked immunosorbent assays (ELISA) or Westernblot tests.
17.3.3 Step 3: Hybridoma cloning
Once the antibody-secreting hybridomas are obtained, they are cloned bylimiting dilution, a procedure which consists of seeding a 96-well platewith equal aliquots of a 100-cell suspension of the clones, which willhypothetically result in cultures of one cell per well. Some 10 days afterthe cloning, the culture plate is investigated to determine whether or notclones are actually growing. These clones are similar in appearance to abacterial colony in culture. The wells are then tested for the presence ofthe antibody, and each clone with the proper characteristics is expanded inculture flasks. The culture will now secrete a single type of antibody,known as an mAb. Once hybridoma clones are established, they can bepropagated in vitro indefinitely. An alternative means of propagationinvolves in vivo intraperitoneal inoculation in histocompatible animalspreviously inoculated with mineral oil (Pristane or Nujol), since theseanimals will develop ascitic tumors. These tumors accumulate a liquid thatwill contain large quantities of the mAbs. The hybridomas can also befrozen in liquid nitrogen for future use, thus providing an unlimited sourceof specific antibodies.
17.3.4 Step 4: Definition of the isotype of monoclonal antibodiesobtained
Depending on the isotype (i.e. class/subclass and kind of light chain),immunoglobulin molecules will display a particular biological propertyand will require an appropriate method for purification. The identificationof mAb isotypes generally employs the culture supernatants of hybrid-omas and commercially available kits for the specific immunoenzymaticassays. This knowledge about the specific isotype facilitates the selectionof the purification process in the next step.
17.3.5 Step 5: Follow-up/later developments
Depending on the use of the mAbs, certain adaptations may be requiredfor their preparation. When large quantities of mAbs are required, in vivoproduction of the antibody in ascitic fluid is not practical, because it willrequire the use of a large number of animals. Thus, it is often easier tocultivate the antibodies in an appropriate in vitro culture medium. How-ever, given the strict nutritional requirements of the hybridomas and theirfragility in the face of osmolality, pH variations, and the accumulation ofmetabolites, the production of large quantities of antibodies in vitro willnecessitate special care.
Monoclonal antibodies 417

The purification of mAbs of the IgG class is usually carried out byaffinity chromatography on a resin coated with protein A or protein Gfrom Staphylococcus sp., ligands that have affinity for this kind ofimmunoglobulin. More recently, other affinity ligands have been intro-duced, such as protein L, which has a special affinity for kappa lightchains. Other Ig molecule classes, especially those with lambda lightchains, can be purified by other methods, such as pseudo-bioaffinity. Inthis case, the chromatography uses metallic ions or certain dyes as ligands.These will interact with the antibody molecules due either to electriccharge or to hydrophobic reactions (see Chapter 12 and review byVijayalakshmi, 1989).
After purification, mAbs can be covalently linked with other reagentsfor use in specific assays. These reagents include radioisotopes (for radio-immunoassays or the in vivo tagging of antigens), enzymes (for immu-noenzymatic assays), or fluorochromes (for immunofluorescence assays).All of the procedures require time and exhaustive work in reagentstandardization, but the most complex are those produced for therapeuticuse in humans. Some of the developments in obtaining reagents for humanapplications will be discussed here, especially the use of recombinantDNA technology.
17.4 Production of recombinant antibodies
The development of the technique for the construction of hybridomas hasmade possible the rapid dissemination of mAbs as an analytic tool, andthese products have had a profound impact on the procedures of diagnosisand the purification of other proteins. Although numerous applications ofmAbs have been developed, the greatest interest has always been inmedicinal uses. However, the mAbs obtained from hybridomas have – atleast initially – proved to be less efficient as therapeutic agents. Problemsinclude insufficient activation of effector functions in humans and thestimulation of an immune response to the rodent proteins. This latterphenomenon, known as the HAMA response (for human anti-murineantibody), results from the fact that murine antibodies are recognized asantigens by the human immunological system, and they will be rapidlyeliminated from circulation by antimurine antibodies, thus reducing theeffects of the treatment. To overcome this difficulty, larger doses of themedicine are required, although this will increase the risk of undesirableeffects.
These problems explain why so few products of murine origin havebeen launched on the market (Table 17.1). The only therapeutic productof murine origin that is well established is OKT3
1mAb. This antibody is
used in the reversal of acute transplant rejection. It involves an anti-CD3(cluster of differentiation 3) antibody, which is part of the receptor of themembrane of T lymphocytes, enabling the temporary elimination of the Tlymphocytes involved in the rejection process from circulation, thusfacilitating the acceptance of the transplanted organ. Since the treatmentrequired is of short duration, the immune response of the patient againstthe murine antigen, if it occurs, can be kept to acceptable levels.
418 Animal Cell Technology
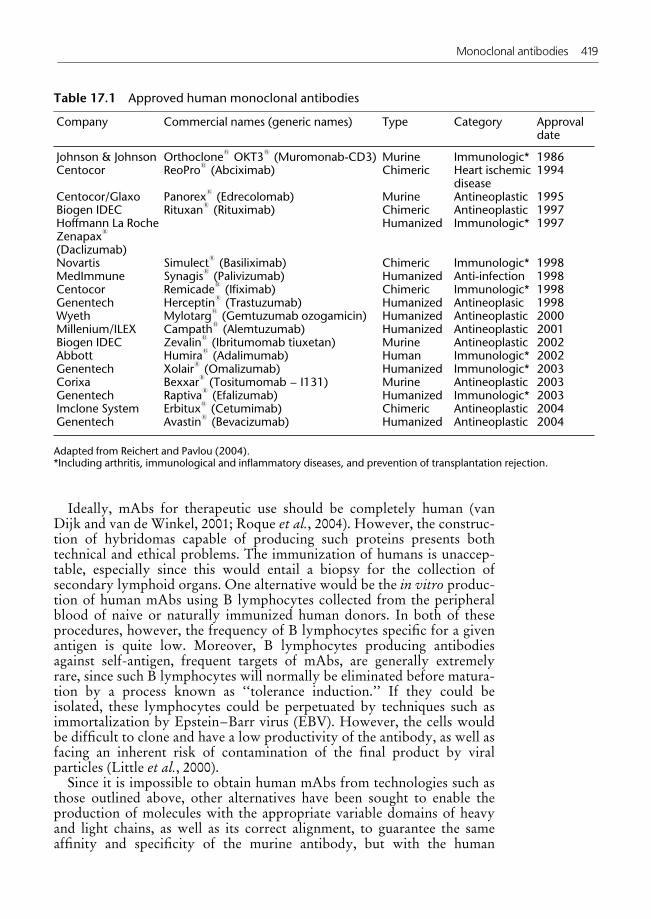
Ideally, mAbs for therapeutic use should be completely human (vanDijk and van de Winkel, 2001; Roque et al., 2004). However, the construc-tion of hybridomas capable of producing such proteins presents bothtechnical and ethical problems. The immunization of humans is unaccep-table, especially since this would entail a biopsy for the collection ofsecondary lymphoid organs. One alternative would be the in vitro produc-tion of human mAbs using B lymphocytes collected from the peripheralblood of naive or naturally immunized human donors. In both of theseprocedures, however, the frequency of B lymphocytes specific for a givenantigen is quite low. Moreover, B lymphocytes producing antibodiesagainst self-antigen, frequent targets of mAbs, are generally extremelyrare, since such B lymphocytes will normally be eliminated before matura-tion by a process known as ‘‘tolerance induction.’’ If they could beisolated, these lymphocytes could be perpetuated by techniques such asimmortalization by Epstein–Barr virus (EBV). However, the cells wouldbe difficult to clone and have a low productivity of the antibody, as well asfacing an inherent risk of contamination of the final product by viralparticles (Little et al., 2000).
Since it is impossible to obtain human mAbs from technologies such asthose outlined above, other alternatives have been sought to enable theproduction of molecules with the appropriate variable domains of heavyand light chains, as well as its correct alignment, to guarantee the sameaffinity and specificity of the murine antibody, but with the human
Table 17.1 Approved human monoclonal antibodies
Company Commercial names (generic names) Type Category Approvaldate
Johnson & Johnson Orthoclone1OKT3
1(Muromonab-CD3) Murine Immunologic* 1986
Centocor ReoPro1(Abciximab) Chimeric Heart ischemic
disease1994
Centocor/Glaxo Panorex1(Edrecolomab) Murine Antineoplastic 1995
Biogen IDEC Rituxan1(Rituximab) Chimeric Antineoplastic 1997
Hoffmann La RocheZenapax
1
(Daclizumab)
Humanized Immunologic* 1997
Novartis Simulect1(Basiliximab) Chimeric Immunologic* 1998
MedImmune Synagis1(Palivizumab) Humanized Anti-infection 1998
Centocor Remicade1(Ifiximab) Chimeric Immunologic* 1998
Genentech Herceptin1(Trastuzumab) Humanized Antineoplasic 1998
Wyeth Mylotarg1(Gemtuzumab ozogamicin) Humanized Antineoplastic 2000
Millenium/ILEX Campath1(Alemtuzumab) Humanized Antineoplastic 2001
Biogen IDEC Zevalin1(Ibritumomab tiuxetan) Murine Antineoplastic 2002
Abbott Humira1(Adalimumab) Human Immunologic* 2002
Genentech Xolair1(Omalizumab) Humanized Immunologic* 2003
Corixa Bexxar1(Tositumomab – I131) Murine Antineoplastic 2003
Genentech Raptiva1(Efalizumab) Humanized Immunologic* 2003
Imclone System Erbitux1(Cetumimab) Chimeric Antineoplastic 2004
Genentech Avastin1(Bevacizumab) Humanized Antineoplastic 2004
Adapted from Reichert and Pavlou (2004).*Including arthritis, immunological and inflammatory diseases, and prevention of transplantation rejection.
Monoclonal antibodies 419

characteristics of the constant regions. Various strategies have been tried,including recombinant DNA technology for the expression of mAbs onphages or in transgenic animals (Roque et al., 2004). A result of the successof these strategies is the ever growing number of drugs for human use thathave recently appeared on the market (Table 17.1). Moreover, some 2609new products can be found in various phases of clinical trials (Reichertand Pavlou, 2004), and some 16 are expected to enter the market by 2008.It seems as if the potential of mAbs as therapeutic drugs has finally beenrealized.
Various procedures are used for obtaining humanized or human anti-bodies. Some of these using microbial or eukaryotic systems of cell expres-sion will be presented further in this chapter. Other means of synthesis ofthese molecules, such as expression in plants, or even in the milk oftransgenic animals, will not be discussed further.
17.4.1 Humanized antibodies
The technique of recombinant DNA provides a tool for the manipulationof the genes encoding antibodies present in murine hybridomas and thoseof human B lymphocytes that determine the expression of human anti-bodies, independent of specificity. It is thus possible to construct a geneticsequence that will express a molecule containing both the variable frag-ments (Fv) of the light and heavy murine chains of interest and the humanfunctional fragments (Fc). Such a combination is called a chimeric anti-body (Figure 17.4). These chimeric constructs can be inserted into celllines, which will express antibodies that are 70% human, with half-livesand effector characteristics similar to those of the human molecule,although they preserve the specificity of the murine antibody. Thesechimeric antibodies still present a human antichimeric antibody (HACA)immune response, but this is less pronounced than that observed with theuse of completely murine antibodies. Moreover, these humanized anti-bodies have been successful in numerous clinical treatments. There arecurrently five products on the market using this technology; they accountfor 70% of the sales of therapeutic antibody treatment. Moreover, a largenumber of chimeric antibodies can be found in various phases of clinicaltrials, and new ones are expected to be approved in the next few years(Reichert and Pavlou, 2004).
Humanized antibodies can also be made by genetic recombinant graft-ing so that specific regions of the chain that determine complementarity inthe human molecule (complementarity-determining regions, CDRs) re-place the murine ones, thus guaranteeing the specificity of the antibodyproduced by the hybridoma, but obtaining 90% of the properties ofhuman antibodies. Each domain (VH and VL) has three of these CDRregions (Figure 17.1). These regions vary greatly and determine thespecificity and affinity of binding sites of antibodies (Roque et al., 2004).Like chimeric antibodies, these genetic constructs can be inserted intoanimal cells, which will then express the protein of interest in a suitableculture system.
Unlike the antibodies obtained by hybridoma technology, this typeof antibody generally has a reduced affinity, but adverse reactions are
420 Animal Cell Technology

of lesser intensity. At present, there are eight therapeutic products onthe market that make use of this technology (Table 17.1), and theprospects for more are high, since some 42% of the mAbs in clinicaltrials involve molecules humanized by CDR grafting (Reichert andPavlou, 2004).
17.4.2 Human antibodies
The same technologies used for obtaining humanized antibodies can beused for the production of fragments of completely human antibodies,which have tremendous advantages for clinical application. The mostsuccessful methods used to obtain human mAbs involve the constructionof transgenic mice or the synthesis of human antibody fragments, based on‘‘DNA libraries’’ of human cells, by using viral vectors to deliver thegenetic material into cells inside a living organism or cultured in vitro.
CDR-grafted Chimeric Mouse
Human
Mouse
hybridoma
Transgenic
mouse
Enzyme
digestion
(papain, pepsin)
In vitroAb
libraries
Recombinant
systems
Chemical
conjugation
F(ab )2� Fab
scFv Fv
F(ab )� 2 pFc Fc
Fab
Immunoadhesin Bispecific F(ab)2
Immunotoxin
Diabody scFv2
Triabody Minibody
Figure 17.4
Recombinant antibodies: examples of possible types of constructions and technology employed(Reprint from Roque et al., 2004. Copyright 2004 American Chemical Society).
Monoclonal antibodies 421

Transgenic antibodies
In producing transgenic antibodies, it is the live mouse that is subjected togenetic modification, rather than the cells that will produce the humanizedantibodies. Initially, the genes codifying the light and heavy chains areinactivated in an embryonic cell. Then large segments of DNA containingthe genes for the light and heavy chains of human immunoglobulin areintroduced into this cell. The cell will then grow into a transgenic mouse,which will be able to produce completely human antibody molecules.With this technology it should be possible to allow for isotype switchingand affinity maturation. These transgenic mice can be immunized withany target molecule to obtain lymphocytes that synthesize human anti-bodies, with hybridomas being produced from these cells (van Dijk andvan de Winkel, 2001; Roque et al., 2004).
Another alternative is the insertion of small sequences of humanchromosomes into embryonic animal cells, thus generating trans-chromo-somic mice. These ‘‘mini’’ chromosomes are isolated from human chromo-somes 2 and 14, which contain the genes for the light and heavy chains,respectively. This means that all of the V, D, and J segments of the variableN-terminal portion, as well as those of the constant regions, will becomepart of the mouse genome (van Dijk and van de Winkel, 2001; Roqueet al., 2004).
A third option uses ‘‘trimera’’ mice, which are mice that have beensubjected to lethal irradiation, but are then prevented from suffering theeffects of radiation by transplanting bone marrow cells from severe com-bined immunodeficient (SCID) mice, which have no B or T lymphocytes.To become trimera mice, the animals are repopulated with lymphocyteprecursors from healthy human donors, and are then immunized with theantigen of interest. The immune system of the trimeras will then produceB lymphocytes that express specific human antibodies for the antigen, andtheir spleen cells can be used to produce hybridomas producing humanimmunoglobulins.
Antibody fragments
Various strategies have been used to combine the variable region ofantibodies, which bind to the antigen determinants, with small functionalproteins. Such constructs can be produced on a large scale in variousexpression systems (Irving et al., 1996; Roque et al., 2004); bacterialexpression systems are relatively simple and less expensive than thealternatives, but eukaryote expression systems (yeast, mammalian, andinsect cells) are also being used for this purpose (Roque et al., 2004).
Most genetic constructs for obtaining antibody fragments express theFv portions (Figure 17.4), which are the smallest antibody fragments thatstill retain the binding affinity of the parental antigen binding site (Irvinget al., 1996). These Fv fragments can also be expressed as single chain Fvmolecules (scFv), or minibodies, in which variable domains of heavy andlight chains are permanently linked by flexible peptide bridges (Figure17.4) (Irving et al., 1996; Roque et al., 2004). This makes it possible toalign the CDR regions of the chains in the same way that they were on the
422 Animal Cell Technology

natural antibody (Irving et al., 1996). The peptide bridges, with 10–25amino acids, should preferentially be of a hydrophilic nature to preventassociation with the hydrophobic V domains (I) and can incorporate tagsthat will be useful in the purification of the fragment after propagation inan expression system. One frequently used ligand is a combination ofresidues of glycine and serine (GLY4Ser)3 (Irving et al., 1996).
The immunoglobulin genes can be obtained from either animals orhumans, both naıve and immunized, although human sources are severelylimited due to the ethical issues mentioned above. The repertoire of genesfrom immunized sources is smaller (�105), but they normally generateantibodies of high affinity. These genes are usually stored in DNAlibraries, which are cloned on phages. These phages serve as vectors forexpression in eukaryotic cells, or in ribosomes, thus leading to thedevelopment of totally in vitro systems (van Dijk and van de Winkel,2001; Roque et al., 2004). The technique of phage presentation is widelyutilized for the construction of these libraries (Emanuel et al., 2000; Roqueet al., 2004). In this procedure, the Ab fragments are expressed as fusionproteins linked to the N-terminal of proteins on a viral surface, withvarious copies of the fusion proteins being expressed in the virus envelope(Irving et al., 1996; van Dijk and van de Winkel, 2001).
Figure 17.5 illustrates the steps necessary for the construction of such acombinatory library of human DNA. Sequences of mRNA are isolatedfrom lymphocytes of naive or immunized sources and utilized to synthe-size the complementary DNA (cDNA), using the enzyme reverse tran-scriptase (Watson et al., 1998). The polymerase chain reaction (PCR) thenmakes it possible to increase the number of gene sequences of both lightand heavy chains of the immunoglobulin of interest. This is followed bylinking these gene sequences to lambda vectors, thus creating two separatelibraries (Emanuel et al., 2000). These libraries can be combined byisolating the cDNA (previously stored on each of the phage types) codingthe genetic sequence of the heavy and light chains. The two DNAsegments are linked and packaged on a lambda expression vector so thateach phage will contain a random pair of cDNA sequences, one for theheavy chain and the other for the light one.
These vector phages are used to infect a microorganism, usually Escher-ichia coli. The expression of the genes of interest can be monitored by theinteraction of the expressed protein with the specific marked antigen,incorporated in the culture medium or in a cellulose-type filter. Once thevector expressing the genes that codify the fragment scFv have beenidentified, this can be used for cloning, usually as a plasmid in a micro-organism. An alternative process is the use of the genes for the reconstruc-tion of a complete chimeric antibody, as described above.
The stability and half-life of complete antibodies is greater than that offragments. These characteristics are crucial in certain therapeutic applica-tions (Hudson and Souriau, 2003). However, fragments are especiallyuseful for diagnostic processes involving images, as well in the treatmentof solid tumors, where good penetration of the tissues and rapid elimina-tion from the bloodstream are desirable characteristics. They are alsouseful for inactivation of cytokines, neutralization of viruses, and blockingof receptors (Hudson and Souriau, 2003). The fragments which retain the
Monoclonal antibodies 423

Amplified
heavy chain
cDNAs
Amplified
light chain
cDNAs
Lymphocytes from
immunized mouse
mRNA
Reverse transcriptase
cDNA
PCR PCR
Ligate H and L chain cDNAs
into expression vectorλ
H chain cDNA L chain cDNAPackage into phage
Combinatorial
phage library
Infect
H and L chains are
produced in infected cells
E. coli
H and L chains associate
to form Fab molecules
Prepare replica filter
Add labeled antigen
to filter
H and L chain-encoding cDNAs
from reactive antibody are cloned
Heavy chainLight chain
Fab binds to filter
Fab binds
antigen
Isolate phage
DNA from
master plate
424 Animal Cell Technology

F(ab9)2 portion (Figure 17.4) normally last longer in circulation than dosmaller fragments (Fab, Fv, or scFv). If necessary, however, the half-life ofthe smaller fragments can be increased by mixing them with a PEG, or bychemical conjugation to form dimers, trimers, and tetramers (‘‘diabodies,‘‘triabodies’’, and ‘‘tetrabodies,’’ respectively (Figure 17.4). These poly-meric structures are obtained from the modulation of the length of theflexible peptide bridges of the scFv modules (Hudson and Souriau, 2003;Roque et al., 2004).
It is also possible to produce bi-specific antibodies (Figure 17.4), whichhave two variable regions, each with a distinct specificity, but which bind,for example, to two adjacent epitopes of a given antigen, thus increasingthe avidity of the connection of the antigen to the antibody. Bi-specificantibodies can also be generated so that they bind simultaneously to atumor antigen and a cytotoxic T lymphocyte, thus facilitating the elimina-tion of the tumor (Hudson and Souriau, 2003). These bi-specific antibodiescan be produced by hybrid hybridomas (‘‘quadromas’’), by either chemi-cal or genetic conjugation, as well as by the fusion of adhesive heterodimerdomains of two or more Fab modules (Roque et al., 2004).
Bi-functional antibodies can also be obtained from the fusion of naturalantibodies or recombinant antibodies with compounds that might carryout auxiliary functions after antibody binding to its specific target (Hud-son and Souriau, 2003; Roque et al., 2004). These compounds can beradioactive conjugates, cytotoxic drugs, proteins, toxins, enzymes, andviruses, any of which can have diagnostic or therapeutic uses.
17.5 Production systems
The development of a specific process for the production of an mAbrequires the selection of (a) a system of expression; (b) a bioprocess forobtaining the product, (c) a purification technique, and (d) analyticalmethods for determining purity and product quality. It is clear that all thechoices must be compatible. So, for example, the selection of a processmust be compatible with the expression system. Moreover, the processchosen must consider the specific conditions of the product in relation tothe competitive market, the quality required, and the total volume to beproduced.
Thus, for diagnostic or biogeneric industries, the production costdominates the choices, and the optimization of the productive process isextremely important (NAS, 1999). This is not true for the therapeuticindustry, or for products protected by patents, which are more dependenton the regulatory requirements.
Unlike the production of other proteins from animal cells, mAbs canalso be produced in vivo by inducing ascitic tumors in laboratory animals,
Figure 17.5 (opposite)
Construction of a mAb combinatory library expressed in a bacterial system (fromRecombinant DNA, 2/e by James D. Watson, et al. # 1992 by James D. Watson,Michael Gilman, Jan Wirkowski, and Mark Zoller. Used with permission).
Monoclonal antibodies 425

as described above. This is an option when using hybridomas (Falkenberg,1998; Hendriksen and Leeuw, 1998). However, there is a drive worldwideto find suitable in vitro production methods, to avoid the suffering oflaboratory animals, as well as minimizing the risks of contamination of thefinal product by adventitious substances. However, in certain specificsituations, the use of an in vivo system of production is unavoidable. Thisincludes the following: (a) when the mAb concentrations are low(, 5� g/ml in batch systems, 50 �g/ml in hollow-fiber bioreactors, or300� g/ml in membrane bioreactors, (b) when it has been proved that theuse of cell culture results in a loss or decrease of the specific function ofthe mAb; (c) when the hybridoma line can only grow and synthesize theproduct in vivo; and (d) when the quantity to be produced exceeds thelaboratory capacity of the producer (NAS, 1999). A noteworthy exampleof such a product generated in vivo is the therapeutic agent OKT3
1, which
can lose its biological activity when purified from the supernatant of a cellculture.
For antibodies produced in vitro, as is the case for many other proteinsobtained from animal cell cultures, the main question involves the lowlevel of expression of these products in the culture medium. This necessi-tates the use of large culture volumes for production, thus involving highercosts, especially for purification. In general, the optimization of these invitro processes attempts to increase the concentration of the product in themedium. This is often possible by using high cell densities. Typical valuesfor traditional processes are in the range of 20–100 mg/L, whereas foroptimized systems, this can rise to 4.6 g/L (Kretzmer, 2002; Wurm, 2004).
It is unusual to find an optimized generic process for obtaining mAbssince each producer cell has a unique pattern of response to stress,consumption of nutrients and synthesis of products and byproducts.However, it is clear that the systems utilized for the production of mAbdo not differ in any significant way from those using animal cells for thesynthesis of other products, as can be seen in various chapters of this book(Chapters 5, 9, 11, and 12). For this reason, only those aspects that areespecially relevant for obtaining mAbs from in vitro systems will bepresented here.
17.5.1 Cell lines
Although various systems have been developed for the production ofmAbs, only those involving cultures of animal cells will be presented inthis chapter, since this is the system used to produce most of the antibodieson the market today (van Dijk and van de Winkel, 2001). Those of murineorigin are produced directly from hybridomas, whereas the humanized orcompletely human ones come from the culture of animal cells transfectedwith specific genetic sequences, which are capable of following thepatterns of glycosylation and the desired structural conformation, requiredfor adequate drug performance.
Hybridomas constitute the most widely used cell lines for the produc-tion of mAbs, on both small and large scales. Section 17.4 of this chapterpresents details of methods used to construct this type of cell. However,these cells produce antibodies that have limited therapeutic application,
426 Animal Cell Technology

due to the immunological responses to murine antibodies that often arisein patients.
As discussed above, one solution for this problem is the geneticmanipulation of cell lines to enable them to synthesize humanized anti-bodies. In this situation, the hybridomas serve as an important source ofgene sequences that codify antibody molecules (or their fragments),although these are later transfected into other animal cells. In general, thecell lines used are more robust than hybridomas, due either to their greaterstability or even a reduced tendency for apoptosis.
The Chinese hamster ovary (CHO) cell line is now being used as astandard host cell for transfection with genes of interest for later use in theproduction of recombinant antibodies (Butler, 2005). Other cells withequivalent performance are the murine myelomas NS0 and Sp2/0, as wellas baby hamster kidney (BHK), human embryonic kidney (HEK-93), anda derivative of the human retina (PER.C6
1) (Chu and Robinson, 2001).
The selection of the best cell line should consider antibody productivity,as well as cell growth rate, although these parameters frequently followopposite trends (Wurm, 2004). For the production of large amounts ofmAb, it is fundamental that the productivity of the selected cell line ishigh. Otherwise, larger reaction volumes will be required, and the cost ofpurification will be increased. A reference value for specific proteinproductivity is 20 pg/cell per day.
Another important aspect involved in the selection of transfected lines isthe capacity to grow without physical support, since the scale-up of suchprocesses is much simpler than those designed for growth of anchorage-dependent cells. Thus, cells that grow naturally in suspension are pre-ferred, such as myeloma cells (Sp2/0 and NS0), or others that can be easilyadapted to this form of cultivation, such as CHO and BHK (Chu andRobinson, 2001).
17.5.2 Basic conditions for in vitro cultivation
Culture medium
Traditionally, the production of mAbs uses complex culture media con-taining glucose and amino acids as the main sources of carbon for cellmetabolism, as well as vitamins, micronutrients and sometimes animalserum, usually fetal bovine serum. Chapter 5 provides a discussion oncomposition of culture media and recent trends in the search for formulasthat do not require the use of animal serum, or of proteins of animalorigin. These serum-free formulations use substitutes such as peptones,epithelial and fibroblast growth factors, hydrolysates, yeast extract, cho-line, and inositol. For the production of mAbs, various serum-freeformulas are available, some of these developed specifically for a given cellline (Chu and Robinson, 2001). The development of those media is easierfor non-anchorage-dependent cells, such as those used for mAb produc-tion. Thus, approximately 50% of the antibodies for therapeutic use arealready produced using serum-free media. In some circumstances, theelimination of serum should be accompanied by the addition of othersubstances with the same shear stress protective effect of serum proteins,
Monoclonal antibodies 427

such as Pluronic1
F68 and carboxymethylcellulose (CMC) (Wu, 1995;Chu and Robinson, 2001).
Most of the cell culture media are formulated to attain a physiologicalosmolality in the range of 270–330 mOsm/kg. Under hypo-osmotic stress,hybridomas show a reduction in cell growth rate without any specificincrease in antibody productivity (Ryu and Lee, 1999). However, underhyperosmotic stress, some hybridomas show physiological changes suchas an increase in cell size, reduction in specific growth rate, and increase inspecific mAb synthesis (Cherlet and Marc, 2000). The overall effect ofthese changes is a function of the cell line, and may or not result in anincrease in the production of the antibody (Ozturk and Palsson, 1991;Bibila et al., 1994). The addition of osmoprotectors such as glycine, betain,sarcosine, glycine, and proline may attenuate the toxic effects of highosmolality on growth, with an overall positive effect.
Influence of oxygen
Oxygen is crucial for the production of energy during phosphorylationand for the synthesis of cell components. In most cases, adequate growthconditions require an excess of dissolved oxygen (DO), with the optimumdependent on the cell line, cultivation conditions, and growth phase. Thecritical range of DO, that is, that which limits growth and/or mAbproduction, also varies as a function of cell line and cultivation conditions,and usually is in the range of 10–20% of air saturation.
The best system for aeration and stirring of culture medium in abioreactor must minimize shear stress without significantly reducing theoxygen transfer (KLa) and yet avoiding the generation of foam. In somesystems, protectors such as serum, Pluronic1 F68, PEG, dextrans, lipids,and cholesterol, may have to be used to prevent shear stress. Sensitivity toshear depends on the cell line, and fortunately the lines most often utilizedindustrially for the production of mAbs, such as hybridomas, CHO, andBHK-21, are among the most resistant animal cells in relation to thesehydrodynamic forces (Chisti, 2000; Chu and Robinson, 2001; Wu, 1995).
17.5.3 Cell metabolism
As discussed in Chapter 4, glucose and glutamine are the two mainsubstrates in culture media used in animal cell processes, for generatingintermediate components of anabolism and catabolism (Doverskog et al.,1997). The fraction of the energy produced by the metabolism of each ofthe substrates depends on the cell line. Under conditions of excess glucose,the hybridomas normally obtain 90% of the ATP necessary for metabolicfunctions from glutamine, whereas CHO cells only obtain 40% (Jeongand Wang, 1995).
An excess of glucose and amino acids, especially glutamine, generateslactate and ammonia, respectively, and in many cases, these compoundsinhibit the growth of animal cells and the formation of the products ofinterest, although the rate of mAb formation is not necessarily affected(Schneider et al., 1996; Doverskog et al., 1997). Large quantities of thesemetabolites in the culture medium can also diminish the quality of the
428 Animal Cell Technology

final product. Some cells can eliminate some of the metabolites by excret-ing them in the form of alanine, which is a non-toxic byproduct.
Lactate reduces the internal pH of the cells or of the culture medium, aswell as increasing the osmolality of the medium. The mechanisms oftoxicity of ammonia are less well understood (Schneider et al., 1996). Thecritical concentrations of these compounds depend on the cell line and theculture conditions. Typical critical values for ammonia in the productionof mAbs are in the range of 2–10 mM (Schneider et al., 1996), whereas forlactate the range is much broader, varying from 1 to 300 mM.
17.5.4 Bioreactors and operation mode
Various combinations of bioreactors and operation mode have been usedfor the production of mAbs in several systems of expression, as shown inChapter 9. All cells utilized for the production of mAbs grow in suspen-sion. Those that did not initially have this capacity have been adapted (asis the case for CHO and BHK) (Butler, 2005). This results in a largenumber of options for production systems. Cells with this characteristicare easily cultivated in stirred-tank reactors, which have been scaled up toa volume of 10 000 L (Chu and Robinson, 2001; Kretzmer, 2002). Thiskind of bioreactor provides excellent homogeneity, facility for the imple-mentation of control techniques, and the principles of scaling up arerelatively well known. Other kinds of bioreactors for the production ofmAbs are also available, such as air-lift, with volumes up to 1000 L, andalso fixed-bed bioreactors (Moro et al., 1994; Irving et al., 1996; Kretzmer,2002).
Products with less demand, such as those used in diagnosis, are devel-oped in small-scale systems such as T-flasks, rollers, and hollow-fiberbioreactors (Kretzmer, 2002). The reduced size of these productionsystems makes it possible to operate various units in parallel to obtaindifferent products. A small increase in scale can be reached by the multi-plication of units.
Hollow-fiber bioreactors constitute an optimized production systemwhere it is possible to achieve higher cell concentrations (107 to 108 cells/ml), and the product concentration can reach a level of 0.7–2.3 g/L, whichis similar to what can be obtained with ascitic fluid (Hendriksen andLeeuw, 1998). This system can operate for over 3 months without affectingcell viability, but presents problems with mass transport, and the forma-tion of nutrient gradients, which require specific solutions (Kretzmer,2002).
The operation mode used in the industry is predominantly batch, giventhe simplicity and facility of control, good reproducibility, lower indicesof contamination, and low production costs (Xie and Wang, 1997). How-ever, this operation mode has some disadvantages, the low cell and productconcentration, because it permits the accumulation of ammonia andlactate, or the exhaustion of essential nutrients (Xie and Wang, 1997,2006). Typical antibody concentration values in a batch system using astirred-tank bioreactor or air-lift are in the range of 100� g/ml.
Two approaches are possible to maximize the concentration of anti-bodies in the culture. The first is based on an increase in the specific
Monoclonal antibodies 429

production rate by adding epidermal or fibroblast growth factors, IL-2(Jang and Barford, 2000), butyric acid (Cherlet and Marc, 2000), or cyclicnucleotides (Dalili and Ollis, 1988). Moreover, the addition of thymidine,the reduction or elimination of serum, suboptimal concentrations of oxy-gen, a reduction in pH, and the increase in osmolarity are situations thatcan disturb growth, resulting in an increase in the specific antibodyproduction rate (Ozturk and Palsson, 1991; Reddy et al., 1992).
The second focus is based on obtaining greater cell concentrations forlonger time periods to maximize the production of mAbs (Duval et al.,1991; Bibila and Robinson, 1995). In general, at least one of the followingfactors would discourage growth and/or production: (a) exhaustion ofnutrients, especially certain essential amino acids, vitamins, glucose orserum (Glassy et al., 1988; Duval et al., 1991; Jo et al., 1993a, 1993b; Hilleret al., 1994); (b) inhibition due to the formation of toxic byproducts, suchas lactate and ammonia (Ozturk et al., 1992); and (c) inadequate concen-tration of dissolved oxygen. Satisfactory results can be obtained simply byincreasing the concentration of nutrients and promoting an equilibrium ofsalts to guarantee adequate osmolality (Jo et al., 1993a). However, there isno way of avoiding the constant accumulation of inhibiting metabolites,which ends up leading the process to collapse.
The fed-batch operation mode has been widely used in the industry dueto the simplicity of operation and control possibilities, easy scaling-up,and efficiency in obtaining high cell and product concentrations (Jo et al.,1993b; Bibila and Robinson, 1995; Xie and Wang, 1997; Sauer et al., 2000).The increase in productivity is due to the manipulation and exploration ofthe physiological state of the cells, redistributing the available resourcesand rerouting the flow of metabolites. This avoids the synthesis of toxicbyproducts and, consequently, prolongs the phase of product accumula-tion. However, it is inevitable that a progressive reduction in viability willarise from problems of accumulation of toxic byproducts and highosmolality.
The continuous process is the only way of avoiding the accumulation ofinhibitors, since it guarantees their constant removal at the same time as itsupplies the system with the nutrients necessary for the performance ofthe cells. If perfusion is used, with cell retention, the system provides ahigh cell density that is controllable, without gradients, and which canmaintain optimal conditions of nutrient concentration and toxic by-products.
References
Abbas AK, Lichtman AH, Pober JS (2000), Cellular and Molecular Immunology, 4thEd., WB Saunders, Philadelphia.
Bibila T, Robinson DK (1995), In pursuit of the optimal fed-batch process formonoclonal antibody production, Biotechnol. Prog. 11:1–13.
Bibila T, Glazomitsky K, Ranucci CS, Robinson DK, Silberklang M, Buckland BC,Aunins JG (1994), Monoclonal antibody process development using mediumconcentrates, Biotechnol. Prog. 10:87–96.
Butler M (2005), Animal cell cultures: recent achievements and perspectives in theproduction of biopharmaceuticals, Appl. Microbiol. Biotechnol. 68:283–291.
430 Animal Cell Technology

Cherlet M, Marc A (2000), Stimulation of monoclonal antibody production ofhybridoma cells by butyrate: evaluation of a feeding strategy and characterizationof cell behavior, Cytotechnology 32:17–29.
Chisti Y (2000), Animal cell damage in sparged bioreactors, Trends Biotechnol.18:420–432.
Chu L, Robinson DK (2001), Industrial choices for protein production by large-scalecell culture, Curr. Opin. Biotechnol. 12:180–187.
Cotton RG, Milstein C (1973), Fusion of two immunoglobulin-producing myelomacells, Nature 244:42–43.
Dalili M, Ollis DF (1988), The influence of cyclic nucleotides on hybridoma growthand monoclonal antibody production, Biotechnol. Lett. 10:781–786.
De St Groth FS, Scheidegger D (1980), Production of monoclonal antibodies: strategiesand tactics, J. Immunol. Methods 35:1–21.
Doverskog M, Ljunggren J, Ohman L, Haggstron, L (1997), Physiology of culturedanimal cells, J. Biotechnol. 59:103–115.
Duval D, Demangel C, Jolain KM, Miossec S, Geahel I (1991), Factors controlling cellproliferation and antibody production in mouse hybridoma cells: I. Influence ofthe amino acid supply, Biotechnol. Bioeng. 38:561–570.
Emanuel PA, Dang J, Gebhardt JS, Aldrich J, Garber EAE, Kulaga H, Stopa P, ValdesJJ, Dion-Schultz A (2000), Recombinant antibodies: a new reagent for biologicalagent detection, Biosens. Bioelectron. 14:751–759.
Falkenberg FW (1998), Monoclonal antibody production: problems and solutions,Res. Immunol. 149:542–547.
Glassy MC, Tharakan JP, Chau PC (1988), Serum-free media in hybridoma cultureand monoclonal antibody production, Biotechnol. Bioeng. 32:1015–1028.
Hendriksen CFM, Leeuw W (1998), Production of monoclonal antibodies by theascites method in laboratory animals, Res. Immunol. 149:535–542.
Hiller GW, Clark DS, Blanch HW (1994), Transient response of hybridoma cells incontinuous culture to step changes in amino acid and vitamin concentrations,Biotechnol. Bioeng. 44:303–321.
Horibata K, Harris AW (1977), Mouse myelomas and lymphomas in culture, Exp. CellRes. 60:61–77.
Hudson PJ, Souriau C (2003), Engineered antibodies, Nat. Med. 9:129–134.Huhalov A, Chester KA (2004), Engineered single chain antibody fragments for
radioimmunotherapy, Q. J. Nucl. Med. Mol. Imag. 48:279–88.Irving RA, Hudson PJ, Goding JW (1996), Construction, screening and expression of
recombinant antibodies, In: Goding JW (Ed.), Monoclonal Antibodies: Principlesand Practice, 3rd Ed., Academic Press, Manchester, pp. 424–464.
Jang JD, Barford JP (2000), Effect of feed rate and antibody production in the fed-batch culture of murine hybridoma cells, Cytotechnology 32:229–242.
Jeong YH, Wang SS (1995), Role of glutamine in hybridoma cell culture: effects on cellgrowth, antibody production, and cell metabolism, Enzyme and Microbial Tech-nology 17:47–55.
Jo EC, Kim DI, Moon HM (1993a), Step-fortifications of nutrients in mammalian cellculture, Biotechnol. Bioeng. 42:1218–1228.
Jo EC, Park HJ, Kim DI, Moon HM (1993b), Repeated fed-batch culture ofhybridoma cells in nutrient- fortified high-density medium, Biotechnol. Bioeng.42:1229–1237.
Karpas A, Dremucheva A, Czepulkowski B H (2001), A human myeloma cell linesuitable for the generation of human monoclonal antibodies, Proc. Natl Acad. Sci.U S A 98:1799–1804.
Kohler G (1981), The technique of hybridoma production, In: Immunological Meth-ods, vol. II, Academic Press, pp. 285–308.
Kohler G, Milstein C (1975a), Continuous cultures of fused cells secreting antibody of
Monoclonal antibodies 431

predefined specificity, Nature 256:495–497.Kohler G, Milstein C (1975b), Derivation of specific antibody-producing tissue culture
and tumor lines by cell fusion, Eur. J. Immunol. 6:511–519.Kohler G, Shulman MJ (1978), Cellular and molecular restrictions of the lymphocyte
fusion, Curr. Top. Microbiol. Immunol. 81:143–148.Kretzmer G (2002), Industrial processes with animal cells, Appl. Microbiol. Biotech-
nol. 59:135–142.Lin MZ, Teitell MA, Schiller GJ (2005), The evolution of antibodies into versatile
tumor-targeting agents, Clin. Cancer Res. 11:129–38.Little M, Kipriyanov SM, Le Gall F, Moldenhauer G (2000), Of mice and men:
hybridoma and recombinant antibodies, Immunol. Today 21:364–370.Littlefield JW (1964), Selection of hybrids from matings of fibroblasts in vitro and their
presumed recombinants, Science 145:709–710.Maki R, Traunecker A, Sakano H, Roeder W, Tonegawa S (1980), Exon shuffling
generates an immunoglobulin heavy chain gene, Proc. Natl Acad. Sci. U S A77:2138–2142.
Moro AM, Rodrigues MTA, Gouveia MN, Silvestri MLZ, Kalil JE, Raw I (1994),Multi-parametric analyses of hybridoma growth on glass cylinders in a packed-bed bioreactor system with internal aeration. Serum-supplemented and serum-freemedia comparison for MAb production, J. Immunol. Methods 176:67–77.
NAS (1999), Monoclonal Antibody Production, National Academic Press, Washing-ton, DC.
Nelson PN, Reynolds GM, Waldron EE, Ward E, Giannopoulos K, Murray PG(2000), Demystified monoclonal antibodies, J. Clin. Pathol. Mol. Pathol. 53:111–117.
Ozturk SS, Palsson BO (1991), Growth, metabolic, and antibody production kineticsof hybridoma cell culture: 2. Effects of serum concentration, dissolved oxygenconcentration, and medium pH in a batch reactor, Biotechnol. Prog. 7:481–494.
Ozturk SS, Riley MR, Palsson BO (1992), Effects of ammonia and lactate onhybridoma growth, metabolism, and antibody production, Biotechnol. Bioeng.39:418–431.
Pernis B, Chiappino G, Kelus AS, Gell PGH (1965), Cellular localization of immuno-globulins with different allotypic specificities in rabbit lymphoid tissues, J. Exp.Med. 122:853–877.
Reddy S, Bauer KD, Miller WM (1992), Determination of antibody content in liveversus dead hybridoma cells: analysis of antibody production in osmoticallystressed cultures, Biotechnol. Bioeng. 40:947–964.
Reichert J, Pavlou A (2004), Monoclonal antibodies market, Nat. Rev. 3:383–384.Roque ACA, Lowe CR, Taipa MA (2004), Antibodies and genetically engineered
related molecules: production and purification, Biotechnol. Prog. 20:639–654.Ryu JS, Lee GM (1999), Application of hypoosmolar medium to fed-batch culture of
hybridoma cells for improvement of culture longevity, Biotechnol. Bioeng.62:120–123.
Sakano H, Maki R, Kurosawa Y, Roeder W, Tonegawa S (1980), Two types of somaticrecombination are necessary for the generation of complete immunoglobulinheavy-chain genes, Nature 286:676–83.
Sauer PW, Burky JE, Wesson MC, Sternard HD, Qu L (2000), A high yielding, genericfed-batch cell culture process for production of recombinant antibodies, Biotech-nol. Bioeng. 67:565–597.
Schneider M, Marison IW, von Stockar U (1996), The importance of ammonia inmammalian cell culture, J. Biotechnol. 46:161–185.
Shulman M, Wilde CD, Kohler G (1978), A better cell line for making hybridomassecreting specific antibodies, Nature 276:269–270.
Steinitz M, Klein JG, Koskimies S, Makel O (1977), EB virus-induced B lymphocyte
432 Animal Cell Technology

cell lines producing specific antibody, Nature 269:420–422.Tonegawa S, Maxamt AM, Tizardt R, Bernard O, Gilbertt W (1978), Sequence of a
mouse germ-line gene for a variable region of an immunoglobulin light chain,Proc. Natl Acad. Sci. U S A 75:1485–1489.
Vaisbourd M, Ignatovich O, Dremucheva A, Karpas A, Winter G (2001), Molecularcharacterization of human monoclonal antibodies derived from fusions of tonsillymphocytes with a human myeloma cell line, Hybrid Hybridomics 20:287–92.
van Dijk MA, van de Winkel JGJ (2001), Human antibodies as next generationtherapeutics, Curr. Opin. Chem. Biol. 5:368–374.
Vijayalakshmi MA (1989), Pseudobiospecific ligand affinity chromatography, TrendsBiotechnol. 7:71–76.
Watson JD, Gilman M, Witkowski J, Zoller M (1998), Recombinant DNA, 2nd Ed.,Scientific American Books, New York.
Wu J (1995), Mechanisms of animal cell damage associated with gas bubbles and cellprotection by medium additives, J. Biotechnol. 43:81–94.
Wurm FM (2004), Production of recombinant protein therapeutics in cultivatedmammalian cells, Nat. Biotechnol. 22:1393–1398.
Xie L, Wang DIC (1997), Integrated approaches to the design of media and feedingstrategies for fed-batch cultures of animal cells, Trends Biotechnol. 15:109–113.
Xie L, Wang DIC (2006), Fed-batch cultivation of animal cells using different mediumdesign concepts and feeding strategies, Biotechnol. Bioeng. 95:270–284.
Monoclonal antibodies 433


18Viral vaccines: concepts,principles, andbioprocessesIsabel Maria Vicente Guedes de Carvalho Mello,Mateus Meneghesso da Conceicao, Soraia Attie Calil Jorge,Pedro Estilita Cruz, Paula Maria Marques Alves,Manuel Jose Teixeira Carrondo, and Carlos Augusto Pereira
18.1 Introduction
Animal cell culture technology has always played a major role in thedevelopment of virology. Significant progress in the propagation of virusesand the consequent development of viral vaccines were only made possibleafter the 1950s, upon the establishment of cell culture technology. Animalcell culture gradually substituted live animals in the preparation of viralantigens used in vaccination, such as the vaccines against smallpox andrabies. At the same time, the production of viral antigens in cell culturesled to considerable progress in bioprocesses technology. Cell culturebioprocesses are now well established in bioreactors of up to 12 000 L.
Recent developments in virology and cell culture technology haveallowed research and development laboratories to engage in molecularmanipulation of viruses and cells for bioprocess production of viral geneproducts. Examples are the establishment of recombinant viral vectors forexpression in animal cells that have significant potential in producingrecombining vaccines and treatment by gene therapy. Thus, a recombinantvaccine against hepatitis B virus (HBV) has been developed and severalothers are in the final phases of clinical trials.
This chapter concerns the development of cell culture technology forviral vaccine production, which is related to: (a) a need for prophylaxisand/or treatment of the most important viral diseases, such as AIDS,hepatitis C, influenza, and papillomavirus; (b) the establishment of currentmolecular technologies, and (c) a reduction in risk factors for the manip-ulation of live viral particles.
Cell culture technology for the production of viral products is focusedon establishing protocols for recombinant products of low risk to preventviral diseases. In many countries, viruses are increasingly important asbiological agents for the control of agricultural pests (see Chapter 19).

18.2 Viral replication
The pathological effects of viral diseases are the consequence of variousfactors, such as the toxicity of the products of metabolism of infected cellsand host reaction to infected cells expressing viral protein, as well aschanges in the genetic expression of host cells through structural orfunctional interactions with genetic material or viral proteins. In somecases, the symptoms or acute signs of diseases caused by a virus can bedirectly related to the elimination of the infected cells.
For a better understanding of the pathological effects caused by viralinfections and of their control by vaccination or antiviral therapy, it isimportant to understand how viruses infect cells, express their genes,multiply, and change the cellular metabolism after the infection. Thegenetic characteristics of the host as well as its sensitivity, are factors thatmust be considered in evaluating the magnitude of viral replication.
Viruses are exclusively intracellular organisms and therefore depend onthe cells to multiply. A complete viral particle, or virion, consists of onenucleic acid molecule (RNA or DNA) covered by a protein layer (nucleo-capsid). Some virions have a lipid cover with a glycoprotein envelope. Themain function of the virion is to transport the viral genome to the interiorof the host cell to be replicated and amplified.
The infectivity of host cells varies considerably between viruses. Aspecific virus may have a great diversity of host cells, while another maybe capable of infecting only one type of cell. The sensitivity defines thecapacity of the cell or animal to be infected.
Viral multiplication involves different ways of replication. However,there are some common characteristics in the replicative cycles of viruses.Initially, viruses insert their genetic material (RNA or DNA) into the cell,and the size, composition, and genetic organization of this material varysignificantly between viruses, as well as the proteins that are needed forreplication. After the infection, there is a period called the eclipse phase,when only few viruses are found in the infected cells. During this phase,the genome and all the viral machinery is exposed to the host, but the viralprogeny is still small. Afterwards, there is a pause when virions accumulateinside or outside of the cell at an exponential rate. This pause is called thematuration phase. After some hours, lytic viruses cause cellular lysis withthe cessation of all metabolic activity and the cells lose their structuralintegrity. Cells infected by non-lytic viruses can continue virion synthesisover a long period of time.
The reproductive cycle of viruses may take hours or days. The infectionof cells does not guarantee the production of viral progeny, which may beproductive, restricted, aborted, or latent. A productive infection occurs inpermissible cells and results in infectious viral particles. An abortiveinfection may occur in two circumstances: firstly, although the cell issensitive to infection, it is not necessarily permissive, allowing the expres-sion of only a few viral genes. The second circumstance is when a sensitivecell, permissive or not, is infected by defective viruses that do not have allthe necessary viral genes for their replication. Furthermore, the cells canbe temporarily permissible. In this case, the viral particles may remain inthe cells until they become permissive or else some viral particles may be
436 Animal Cell Technology

produced for a limited period of time by a fraction of the cell population.This type of infection is called restricted. In a latent infection, the viralgenome persists in temporarily permissive cells without the destruction ofthe infected cells.
The following sections outline the stages of the replication used byviruses.
18.2.1 Adsorption
This stage consists of the virus binding to the cell. This involves thespecific binding of a glycoprotein that appears on the external structure ofa virus to a host cell receptor.
The sensitivity of a cell to a specific virus is frequently related to thepresence of these receptors in the cell membrane. The concept of sensitiv-ity is not related to permissiveness. A cell may not be sensitive to a certainvirus due to lack of receptor, but may produce viral progeny if its viralgenome is introduced into its cytoplasm.
18.2.2 Internalizing and unwrapping the viral particle
After the binding, the virus may use various means of penetration: (a)direct penetration, via the translocation of the entire virus through thecytoplasmic membrane; (b) endocytosis, which is mediated by receptors,resulting in the formation of intercytoplasmic vesicles containing manyviral particles; (c) direct fusion of the viral envelope with the cytoplasmicmembrane.
Non-enveloped viruses generally use the first two penetration mechan-isms, while the enveloped viruses enter a cell by endocytosis followed bybinding with the membrane of an endosome. In addition to this mechan-ism, the enveloped viruses fuse directly with the cell membrane. Thefusion of the viral envelope with the cell membrane requires the inter-action of the glycoproteins of the virus with a cell receptor. After theinternalization of the viral particle, the genome is freed for later expres-sion. This process is known as unwrapping and it involves both cellularand viral enzymes.
18.2.3 Structure and organization of viral genomes
Viral genomes consist of RNA or DNA, which can be single- or double-stranded, and may consist of one or more fragments. During viral replica-tion, both DNA and RNA viruses synthesize protein by translation ofmessenger RNA. The mRNA is then translated by the cell into the viralproteins that will constitute the viral particles.
Virus with single-strand RNA
There are three groups of virus with a single-stranded RNA genome(ssRNA). The first group comprises viruses with RNA that functions bothas genomic and messenger (for example, picornovirus and flavovirus). ThessRNA in these viruses is conventionally called positive-strand virus
Viral vaccines: concepts, principles, and bioprocesses 437

(+sRNA). After it enters the cell, the +sRNA functions as mRNA, bindingwith cellular ribosomes to complete its translation into proteins. Theproduct of this translation is a polyprotein that will later be cleaved.The second function of this RNA is genomic, to be used as a precursor forthe synthesis of a complementary negative RNA strand (RNA–) catalyzedby a polymerase derived from the polyprotein cleavage. The negativestrand will be transcribed once again as genomic RNA (RNA+) through aviral polymerase. During this process, several strands of genomic RNAwill be produced, as well as proteins that will be used to produce the viralparticles. One characteristic of the RNA+ virus replication is the capacityof its genomic RNA to function as mRNA after the infection, thus leadingto the synthesis of the enzymes responsible for the viral genome replica-tion, without need for the complete viral particle to carry the enzymes(Figure 18.1). This allows the RNA extracted from the virus to becomeinfectious, although less than the complete viral particle.
Another group of ssRNA viruses consists of those that have negativesingle-strand RNA (–sRNA). This group consists of orthomyxovirus,paramyxovirus, and rhabdovirus, among others. The genomic RNA ofthese viruses has two functions: to serve as a template for transcription andfor replication. The viral genome must translate its own mRNA in orderto synthesize viral proteins because the host cell does not have theappropriate enzymes. Therefore the –sRNA virus will have a transcriptasealong with its genome. The isolated viral genome is not infectious, becausethere must be a viral transcriptase to translate the genomic RNA intoseveral mRNA strands that will later be translated into viral proteins.These are used to make a copy of all its genome, producing a large strand
Viral progeny
Viral RNA
strand )(�Polyprotein coded by
viral genome
RNA
strand ( )�
Viral proteases
RNA
strand ( )�
Figure 18.1
Flow of events during the replication of a positive-strand RNA virus.
438 Animal Cell Technology

of +mRNA that will serve as a template for the synthesis of genomic –RNAs (Figure 18.2).
The retroviruses are the third group of single-strand RNA virus. Theseviruses have a more complex strategy for the production of mRNA. Theretroviruses have a diploid genome associated with a DNA-dependentRNA polymerase (reverse transcriptase) that transcribes RNA into ahybrid DNA–RNA. The RNA strand is digested by the viral ribonucleaseH and a complementary DNA is synthesized, thus producing a double-strand DNA (dsDNA) that will be inserted into the cellular genome withthe participation of the viral integrase enzyme, producing a provirus(Figure 18.3). After the integration, the cellular-dependent polymeraseRNA–DNA will initiate the synthesis of the proteins that are essential toreplicate the viral genome followed by the synthesis of proteins to producethe virus.
Virus with double-strand RNA
The genome of reoviruses is formed by double-strand RNA (dsRNA)composed of several dsRNA fragments (10–12). The RNA fragments aretranscribed inside a capsid by a polymerase, giving rise to several mRNAs.Here, the mRNA molecules have two functions: (a) they are translated asmonocistronic messengers, forming viral proteins; (b) they serve as atemplate for the synthesis of a complementary RNA strand, giving rise todouble-strand RNA genomic fragments (Figure 18.4).
Viral RNA
strand ( )��mRNA Proteins
RNA
strand ( )�
Progeny RNA
strand ( )�
Viral progeny
Viral enzymes
Figure 18.2
Flow chart of events during the replication of negative single-strand RNA virus.
Viral vaccines: concepts, principles, and bioprocesses 439

Viral progeny
tRNA
viral enzymes
RNA progeny
mRNA
Linear DNAViral RNA Integrate in
DNA
Proteins
Figure 18.3
Flow chart of events during the replication of retroviruses.
Double-strand
RNA progeny
Viral progeny
Partial production
Double-strand
viral RNAProteins
Viral enzymes
sRNA
( ) strand�
Figure 18.4
Flow chart of events during the replication of reovirus.
440 Animal Cell Technology

Virus with DNA
The double-strand DNA viruses are transported into the nucleus wherethey translate and replicate their genome using cellular enzymes toproduce mRNA. These mRNA strands are later translated into proteinsthat direct the synthesis of the proteins and genomes of the virus. Theisolated DNA of these viruses is considered infectious (Figure 18.5). Thereare some double-strand DNA viruses, such HBV, which have a differentreplication strategy that includes an intermediary RNA and a reversetranscription phase. In this case, after the viral DNA penetrates thenucleus of the cell, it is converted into a covalently closed circular DNAmolecule (cccDNA). Before the viral genome replication occurs, a cellularenzyme (DNA-dependent RNA II polymerase) translates several RNAsfrom cccDNA and genomic and subgenomic RNAs (Figure 18.5). MostDNA viruses replicate in the nucleus of the cell, except for poxviruses,which replicate in the cytoplasm. These viruses are practically autonomousin terms of translation factors. Parvoviruses have a single-strand DNAgenome and replicate inside the cellular nucleus using replicative-cyclecellular polymerases.
Circular genomic
DNACovalently closed
DNAmRNA
strand ( )�Protein
Genomic DNA
Viral enzymes
Viral progeny
Genomic RNA
Figure 18.5
Flow chart of events during the replication of the hepatitis B virus.
Viral vaccines: concepts, principles, and bioprocesses 441

18.2.4 Production and maturation of viral particles
Viruses use three strategies to assemble, mature, and release from infectedcells. With the first strategy, represented by picornavirus and adenovirus,the assembly and maturation are completed inside the cell, either in thecytoplasm or in the nucleus. As a rule, all non-enveloped viruses areproduced and become infectious inside the cell and depend on the cellularlysis for release.
The second strategy is used by enveloped viruses, such as togavirus andretrovirus, which are enveloped in the cytoplasmic membrane. They aregenerally released by the budding of cellular membranes or exocytosethrough a vacuole, usually without cellular lysis.
The third strategy is used by viruses whose nucleocapsids are producedin the nucleus of the cell, with assembly and maturation involving thenuclear membrane. The enveloped viruses accumulate in the endoplasmicreticulum and are carried to the cell surface via vacuoles. Some viruses thatuse this process, such as herpesvirus, are cytolytic (cause cell lysis).
Knowledge of viral replication strategies has helped to optimize theapproaches for the genetic modification of the viruses for better expressionof the heterologous genes. It has also led to the introduction of biopro-cesses for the production of infectious viral particles or viral-like particles,as will be discussed next.
18.3 Production of viral particles by cell culture
Viral particle production from cell cultures has several differences fromother bioprocesses. The production of molecules like enzymes, toxins, orother proteins synthesized by bacteria, fungi or animals, depend uponculture parameters, such as pH, temperature, dissolved oxygen, or nutri-ents. Product formation may occur through secondary metabolic path-ways, which are not related to the development or growth of the cell. Inthese situations, research and technological development must be directedto the specific cell and this involves the improvement of the cell as a bettermolecular production unit. So, there is a direct relation between nutrientconversion, cell growth, and the expected improvement of the finalproductivity.
Viral particle production processes by cell culture infection, cannot becharacterized in such a simple way, since the final product – ‘‘virus’’ –does not result from a secondary metabolic pathway. However, it can bebetter described as a process redirecting the cell machinery towards viralparticle production, which only happens after viral infection. The virusproduction process can be divided into two different steps. The firstinvolves cell multiplication, which results from the conversion of culturemedium substrates into cell mass. At the instant of viral infection, thecellular production unit no longer exists, since the viral genetic materialforms a new production unit, initiating the second step of the virusproduction process. This production unit is the infected cell and is theproducer of new viral particles. This production phase requires nutritionaland metabolic conditions that are not observed during cell growth. Theseconditions are normally studied separately. Nevertheless, virus production
442 Animal Cell Technology

essentially requires the development of the cell that is ‘‘consumed’’ duringthe virus production phase, and the metabolic status of the cell at themoment of infection is a key factor for the success of the viral particleproduction process.
Industrial production of viral vaccines preferably requires the use ofcontinuous or immortalized cell lines as the basis for viral multiplication.BHK-21, Vero, MDCK, MDBK, CHO, or HeLa cells are the mainplatforms used in the production of a huge variety of viral vaccines, sincethey are considered stable, do not suffer significant genetic modificationseven after numerous generations of growth, and have a great capacity forin vitro growth. In addition, these cell lines are susceptible to infection byseveral different viruses, irrespective of their origin. As an example, theVero cell line has been obtained from an African green monkey kidney.Although this cell immortalization process results in metabolic and func-tional changes not observed in normal cells, Vero cells still preserve sometypical kidney cell characteristics. Despite this, certain viruses, like rabiesor poliovirus, which naturally infect nervous tissues, are easily adapted toinfect Vero cells (Frazzatti-Galina et al., 2001). The multifunctionalproperty of continuous cell lines is important for establishing the bestplatforms for an industrial production process.
Even though there are many cell lines capable of cultivation in suspen-sion, the majority of cells isolated from animal tissues retain their adherentphysiological characteristics and must be grown on a solid surface. Theseare named adherent cells.
The basic need for a solid support guides all production choices invol-ving industrial processes for adherent cells. A large variety of vessels hasbeen developed for adherent cell cultures. Petri dishes, Roux bottles,T-flasks, and roller bottles are examples of cell culture vessels with a glassor polystyrene surface. The system of choice is dependent on the scal-ability of multiple steps, as well as the cost of equipment and qualifiedoperators.
As mentioned in Chapter 9, since production scale-up is related to theincrease of cell culture surface for adherent cells, consideration must begiven to the relationship between the surface area available for cell growthand the bioreactor volume (Kent and Mutharasani, 1992).
The first adherent cell culture industrial process was conducted in rollerbottles, a system with limited scale-up possibilities. However, a greatadvance in scale-up of high density cultures was achieved by Van Wezel in1967. This allowed the culture of adherent cell lines on the surface ofmicrospheres, called microcarriers. Even under low agitation conditions,microcarriers remain suspended in medium, which allows the culture to behomogeneous and to be controlled easily to maintain optimal physiologi-cal conditions, such as pH, temperature, and aeration. Besides, this is theonly system for adherent cells that allows constant monitoring of cellgrowth. This enables cell morphology to be monitored and combines allthe advantages of suspension culture systems with the requirements ofadherent cells (Griffiths et al., 1987). So, the process can be well monitoredand controlled with high density cell cultures obtained in small bioreactorvolumes.
Vaccine production based on cells can use different methods of culture.
Viral vaccines: concepts, principles, and bioprocesses 443

A classic way to produce viral vaccines consists of cultivating cells on anappropriate static support, infecting them with virus, collecting andpurifying the virus produced and formulating the vaccine.
Although many adherent cell lines have already been adapted to cultiva-tion in suspension, a large number of viral infection agents do not oftenallow the usage of those cells as a platform for prompt vaccinal antigenproduction. For this reason, overcoming roller bottles scale limits, micro-carrier systems have been developed as a faithful technological alternativefor simplifying the adherent cell scale-up process.
Nahapetian et al. (1986) obtained high density Vero cells cultures thatreached 3 3 107 cells/ml, when using a microcarriers system at a perfusionrate of eight volumes of medium per day, an amount 10 times higher thanthat usually obtained with repeated batch cultures. Similar results havebeen described by Mendonca et al. (1993, 1999, 2001) who also obtainedhigh density Vero cell cultures when using perfusion rates of 3 volumes ofmedium per day. According to Nahapetian et al. (1986), endogenoussynthesis of cellular growth factors is probably the growth-limiting factorof under-fed cultures, while factors related to culture conditions such asaeration and cell metabolite production are involved in the growth limita-tion of over-fed cultures.
Table 18.1 compares the relationship between cell culture surface areaand bioreactor volume in many different culture systems usually used withadherent cells. For microcarriers, this coefficient might reach 60 cm2/ml ofmedium for culture area prepared with 10 mg of microcarriers permilliliter. For Roux bottles, this coefficient is around 3 cm2/ml. In culturesinitiated with 2 mg of microcarriers per milliliter of medium, high celldensities of even 33 106 cells/ml are often reached, compared with smallercell densities from 2 to 3 3 105 cells/ml usually observed in Roux bottlesystems. Another great advantage of the use of microcarrier culturesystems is the possibility of preparing cell cultures with hundreds or eventhousands of liters (Montagnon et al., 1984).
According to Butler (1987), many materials have been used in theproduction of microcarrier particles, and they have specific requirementsthat allow appropriate cell adherence and growth:
(i) particle density should be between 1.02 and 1.05 g/cm3 to facilitatetheir maintenance in suspension at low agitation rates (40–150 rpm);
Table 18.1 Relationship between cell culture surface area and bioreactorvolume used with animal adherent cells
Cell culture systems Area/volume (cm2/cm3)
Roller bottle 0.2–0.7Cell factories 1.7Plastic bags 5.6Fixed-bed 10–15Hollow-fiber 31CytodexTM microcarriers (10 g/l) 34CultiSpher
1G microcarriers (30 g/l) – LF 120
444 Animal Cell Technology

(ii) particles should preferably be transparent, allowing microscopic eva-luation;
(iii) rigid materials (polystyrene and glass) are recommended because oftheir low porosity;
(iv) surface charge can be positive or negative, but it should not be toolow because of the risk of difficulties of cell adherence, and it shouldnot be too high because it could inhibit cell growth; the charge shouldbe equally distributed throughout the surface to insure homogeneouscell distribution.
Microcarrier particle diameter should ideally be between 100 and 400�m with a size distribution of � 25 �m to guarantee a homogeneousculture. According to Butler and Spier (1984), cells tend to adherepreferably to the smallest particles. However, Hu and Wang (1987)demonstrated that higher microcarrier diameter tended to promote cellgrowth. An increase of diameter from 185 to 265 �m resulted in a longerexponential growth phase, with a final cell concentration four times higherthan that observed with microcarriers with smaller diameter.
Adherent cells attached to microcarriers are particularly susceptible todamage caused by mechanical shear forces within agitated tanks. Thisvulnerability to damage is usually associated with cell immobilization andwith the increase in shear force sensitivity of suspended microcarriers.Croughan et al. (1987) demonstrated that FS-4 and Vero cells are highlysensitive to shear forces caused by an increase in the mechanical agitationof the cell culture. They showed a progressive reduction in cell growthwith higher agitation velocities and also cell lysis at an agitation rate over180 rpm.
A great variety of mammal, bird, fish, amphibian, and insect cells can becultivated in this system. To ensure that cells from so many differentorganisms and tissues can be cultivated with success in microcarriers, thesemicrocarriers should have a physicochemical composition and otherspecific characteristics appropriate to the specific cell line. The mostcommonly used microcarriers are composed of DEAE-dextran polymers,polyacrylamide, polystyrene, gelatin, or glass. These present a great varietyof density, size, weight, or electric charge that might have a significanteffect in cell culture (Varani et al., 1983; Reuveny et al., 1985). Someexamples are given in Figure 18.6.
Many different culture systems have demonstrated effectiveness for viralproduction. As previously described, these systems are based on thegrowth of cells in suspension or adherent to microcarriers, which are keptin suspension by agitation. After achieving high density the cultured cellscan be infected by virus, allowing intracellular viral multiplication untilthe viral products are finally collected and processed. After standardiza-tion and optimization, these systems allow consistent viral particle pro-duction, and these steps are called the synthesis or upstream phase. Figure18.7 shows a typical cell membrane structure when rabies viral particlesare leaving the surface of an infected cell.
For viral vaccine preparation or downstream processing, the cells andsupernatant of infected cultures should go through concentration andpurifying processes. These are important steps because there could be a
Viral vaccines: concepts, principles, and bioprocesses 445

A B
C D
E F
Figure 18.6
Scanning electron microscopy of Vero cells on microcarriers (Yokomizo et al.,2004). (A) Preparation of a CytoporeTM microcarrier without cells (originalmagnification 3242). (B) Preparation of a cell-loaded CytoporeTM microcarrier atday 6 (original magnification 3330). (C) Preparation of a CultiSpher
1G
microcarrier without cells (original magnification 3370). (D) Preparation of a cell-loaded CultiSpher
1G microcarrier at day 6 (original magnification 3295). (E)
Preparation of a CytodexTM I microcarrier without cells (original magnification3520). (F) Preparation of a cell-loaded CytodexTM I microcarrier at day 6 (originalmagnification 3485).
446 Animal Cell Technology
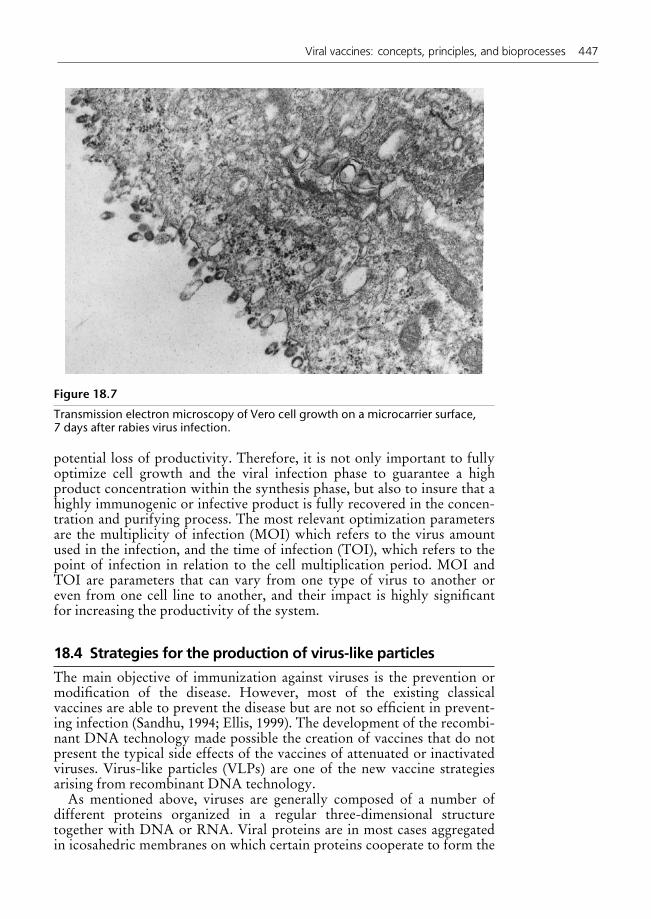
potential loss of productivity. Therefore, it is not only important to fullyoptimize cell growth and the viral infection phase to guarantee a highproduct concentration within the synthesis phase, but also to insure that ahighly immunogenic or infective product is fully recovered in the concen-tration and purifying process. The most relevant optimization parametersare the multiplicity of infection (MOI) which refers to the virus amountused in the infection, and the time of infection (TOI), which refers to thepoint of infection in relation to the cell multiplication period. MOI andTOI are parameters that can vary from one type of virus to another oreven from one cell line to another, and their impact is highly significantfor increasing the productivity of the system.
18.4 Strategies for the production of virus-like particles
The main objective of immunization against viruses is the prevention ormodification of the disease. However, most of the existing classicalvaccines are able to prevent the disease but are not so efficient in prevent-ing infection (Sandhu, 1994; Ellis, 1999). The development of the recombi-nant DNA technology made possible the creation of vaccines that do notpresent the typical side effects of the vaccines of attenuated or inactivatedviruses. Virus-like particles (VLPs) are one of the new vaccine strategiesarising from recombinant DNA technology.
As mentioned above, viruses are generally composed of a number ofdifferent proteins organized in a regular three-dimensional structuretogether with DNA or RNA. Viral proteins are in most cases aggregatedin icosahedric membranes on which certain proteins cooperate to form the
Figure 18.7
Transmission electron microscopy of Vero cell growth on a microcarrier surface,7 days after rabies virus infection.
Viral vaccines: concepts, principles, and bioprocesses 447

external and internal capsids. In several virus species, viral proteins areable to form three-dimensional aggregates in the absence of nucleic acids,thus creating VLPs. Similarly, the proteins that normally interact withnucleic acids can also aggregate in their absence and form core-likeparticles – CLPs. Therefore, in contrast to infectious viruses, VLPs consistof viral proteins aggregated in a three-dimensional structure similar to thatof the native virus but not containing viral DNA or RNA within thecapsid (Cruz et al., 2002).
18.4.1 Advantages of VLPs
The major advantage of VLPs over individual purified antigens is the moreefficient antigen presentation to the immune system, since the epitopesresulting from the three-dimensional structure of the capsid will be avail-able for recognition by the immune system. Also, many of the viruses forwhich immunogenic VLPs were developed are difficult to replicate in vitro(e.g. HBV, parvovirus B19, Norwalk calcivirus, and human papilloma-virus). Finally, it should be noted that VLPs are not infectious, thuseliminating the need for inactivation and subsequent epitope modificationdue to the inactivation agent, as in the case of inactivated viruses (Cruzet al., 2002).
18.4.2 VLP production technology
Due to the availability of the viral coding sequences, it has been possible todevelop methods for the production of the viral proteins using appropriateexpression vectors. The fact that VLPs are multimeric structures makes theuse of complex expression technologies mandatory. In addition, virusestypically infect eukaryotic cells and thus the use of such cells is required forcorrect viral protein production. Although this is not necessarily true forthe production of a single viral protein that does not have complex post-translational modifications, such as glycosylation and phosphorylation, forproduction of complete VLPs, the use of complex systems cannot beavoided. This is due to the fact that the processing of viral proteins withinthe cells and capsid assembly, require the mediation of host proteins – thechaperones. In recent years several systems were developed with the goal ofproducing viral proteins in yeast, insect, and mammalian cells. The use ofyeast was first demonstrated in the production of the HBV surface antigen(HBsAg) used as a vaccine against hepatitis B (Fu et al., 1996). The expres-sion of this specific protein had been previously shown using Escherichiacoli; however, the molecules did not form VLPs and their immunogenicitywas low. The vaccine against hepatitis B is an important milestone in the useof VLPs as a vaccination strategy, leading to replacement of the previouslyexisting inactivated virus vaccine.
A second milestone in the production of viral antigens was the develop-ment of the technology associated with insect cells – the baculovirusexpression system. The Autographa californica baculovirus produces viralparticles as a part of its life cycle. These particles accumulate in thepolyhedrin protein matrix, which confers protection from inactivation dueto environmental factors. The polyhedrin is produced in large amounts
448 Animal Cell Technology

(1 mg/106 cells) under the control of a very strong promoter. The use ofthis promoter to drive the expression of foreign proteins became theobvious next step in producing recombinant baculoviruses. The cellsderived from the ovary of the caterpillar Spodoptera frugiperda (Sf-9 andSf-21) are the most widely used for the production of heterologousproteins using baculoviruses (Table 18.2). Nevertheless, other insect cellshave also been used for this purpose, including Trichoplusia ni (High-FiveTM) (Jiang et al., 1998; Wang et al., 2000).
18.4.3 VLP composition
The proteins to be included in VLPs should be those necessary to conferthe desired degree of immunogenicity. As a consequence, VLPs are oftencomposed of more than one protein. In order to use baculovirus-infectedinsect cells to produce VLPs it is necessary to predefine the proteins to beincluded, since the expression of these proteins could determine thestability (Hyatt et al., 1993) and location – intra- or extracellular – of theparticle (French and Roy, 1990).
The antigenicity, rather than the immunogenicity, should drive theresearch and development of new VLP-based vaccines and thus antibodyreactivity tests should be performed as early in the process as possible. Forexample, a porcine parvovirus vaccine is composed of a single viral protein(VP2), which represents 95% of the native virus total protein and is abledo induce antibody production in immunized animals (Rueda et al., 1999).In contrast, the human parvovirus B19 contains the exact same proportionof VP2 in the native virus but VLPs made solely of VP2 are unable toinduce neutralizing antibodies (Brown et al., 1991; Tsao et al., 1996). Inthis case even a VLP containing VP1 and VP2 at a ratio of 1:24,respectively, which is very similar to that of the native virus, was not
Table 18.2 Virus-like particles (VLPs) produced in baculovirus-infected insectcells
VLPs Cell line Reference
Human parvovirus B19 Sf-9 Bansal et al., 1993Blue tongue virus Sf-9, Sf-21 Roy, 1990Epizootic hemorrhagic disease Sf-9 Le Blois et al., 1991Hepatitis B Sf-9 Lanford et al., 1989Hepatitis C Sf-9 Baumert et al. 1998HIV Sf-9 Cruz et al., 2002Infectious bursal disease Sf-9, HighFive Wang et al., 2000;
Hu and Bentley, 1999Norwalk virus Sf-9 White et al., 1997Papillomavirus Sf-9 Kirnbauer et al., 1992Minute virus of mice Sf-9 Hernando et al., 2000Polyomavirus Sf-9 Montross et al., 1991Porcine parvovirus Sf-9, Sf-21 Maranga et al., 2004;
Martinez et al., 1992Rotavirus Sf-9, HighFive Vieira et al., 2005;
Jiang et al., 1998SV40 Sf-9 Kosukegawa et al., 1996
Viral vaccines: concepts, principles, and bioprocesses 449

efficient in inducing an immune response. The final composition of theantigenic VLP included VP1 at a percentage between 25 and 40%, that is,6–10-fold higher than in the native viral particle (Tsao et al., 1996). Thisclearly shows that there is still a need for a better understanding of theimmunization phenomenon.
Therefore, to ensure antigenicity, the particle composition has to bestudied and will probably lead to different baculovirus infection strategies,using a different number of proteins per virus. For instance, the bluetongue virus (BTV), an Orbivirus from the Reoviridae family, is a non-enveloped virus that contains seven different structural proteins (VP1–VP7) (Hyatt et al., 1993). The outer capsid consists of two proteins, VP2and VP5, while the core is composed of the remaining five proteins, twomajor (VP3 and VP7) and three minor (VP1, VP4, and VP6), classifiedaccording to their abundance. The production of BTV VLPs can beperformed by co-infecting the cells with two dual-gene vectors expressingVP3 + VP5 and VP2 + VP7 (Brown et al., 1991) or through the infectionof a multigenic vector containing all four proteins (VP2, VP3, VP5, andVP7) (Martinez et al., 1992). The factors related to the VLP composition,including the use of multigenic vectors, production technology, and large-scale production VLPs, have been analyzed by Maranga et al. (2000a).
18.4.4 VLP production processes
Hepatitis B vaccine
HBV is transmitted among humans and is manifested as a chronicinfection that debilitates infected individuals and may cause severe liverdamage, primary carcinoma, and ultimately death. Although in most casesthe patients recover, there are large segments of the population that havechronic hepatitis B (especially in African and Asian countries) and cantransmit the disease as a pandemic.
HBV is an enveloped virus whose nucleocapsid involves one singleDNA molecule. Several surface antibodies have been found against thesurface antigens (HBsAg) in the serum of HBV-infected individuals. TheHBsAg is present in the blood of infected individuals in the form ofspherical particles with a diameter of 22 nm. Since these particles are ableto induce immunization in humans, a production process based on yeastcloned with the gene encoding the HBsAg monomer has been developed.However, since yeasts do not secrete the VLPs, sonication is used toextract the particles, which are subsequently purified.
The VLPs produced by yeast consist of about 100 HBsAg monomersand confer immunization when injected into humans in spite of thedifferent glycosylation as compared with the native virus (Fu et al., 1996).Nevertheless, the vaccine only confers immunity after three doses andrequires revaccination after 5 years.
Production of HIV-1 and porcine parvovirus VLPs
The production processes for HIV-1 and porcine parvovirus (PPV) VLPsare presented in Figure 18.8. In both cases, the insect cell–baculovirus
450 Animal Cell Technology

system was used but the production strategy has some significant differ-ences. In the case of HIV-1 VLPs, Sf-9 cells were infected with a highMOI (Cruz et al., 1998), while in the case of PPV VLPs, Sf-21 cells werepreferred and a low MOI was used for economic reasons, as these VLPsare developed as a veterinary vaccine (Maranga et al., 2004). Also, at thepurification level there are some differences, since the HIV-1 VLPs aresecreted and PPV VLPs are intracellular, thus requiring a cell disruptionstep. However, it should be noted that both downstream processingstrategies are based on the relatively larger size of the VLP in comparisonwith other contaminants, although chromatographic steps are used onlyfor HIV-1 VLPs (Cruz et al., 2002).
18.5 Development of viruses for DNA vaccines
Free DNA-mediated immunization, also referred to as genetic immuniza-tion, consists of the administration of genetic material (DNA in the formof a plasmid), which will lead to the in vivo expression of proteins thatinduce an immune response. This vaccination method is simple andconstitutes a relevant alternative to the classical vaccination, mainly due totwo important advantages. First, the long-term expression of smallamounts of antigens is possible, avoiding the need for re-administration, aslong as no allergies, tolerance, or autoimmunity occur. Second, theantigens are synthesized in vivo, no infection exists and therefore inad-vertent reactions are avoided and the treatment of infected individualsbecomes possible. The first animal studies using this type of vaccinesdemonstrated their potential in the protection against the flu virus. DNAvaccines also have other advantages, namely the higher thermal, chemical,
A
B
Bioreaction
.
Infection (high MOI)
Cell
growthProduction
Centri-
fugation
Micro-
filtration
Ultra-
filtration
Gel exclusion
chromatography
Baculovirusinactivation
.Cell
growth
Centri-
fugation
Cell
disruption
Preci-
pitation
Ultra-
filtrationProduction
(batch)
Purification
(batch) (0.45 m)µ (300 kDa)
Figure 18.8
Production and downstream processing of HIV-1(A) and PPV (B) VLPs (adapted from Cruz et al.,2002).
Viral vaccines: concepts, principles, and bioprocesses 451

and biological stability of DNA in comparison with classical vaccines.This lowers the requirements for storage at low temperature, thus reducingthe costs, especially for developing countries.
Nevertheless, the large-scale application in healthy individuals stillinvolves delicate safety issues, although clinical trials are expected forcancer and HIV infection.
The spectrum of target diseases can be expanded through the use of amix of different plasmids, a strategy that is difficult to implement whenusing proteins due to interference. Given the ease of modification of DNAsequences, a single gene may include several epitopes of more than oneantigen or different pathogenic strains.
There are several methods of administration. Free DNA can be directlyinjected into muscle cells (currently the most efficient method), linked togold particles which are then bombarded onto the tissue (difficult toprepare), pulverized without injection or administered orally. In spite ofthe low efficiency (in terms of modified cells), this new vaccinationmethod frequently leads to surprisingly high immune responses at boththe humoral and cellular level. The technology used in this type ofvaccination has the additional advantage of allowing research in the area ofmolecular immunology, as well as in the study of the immune system andnew vaccine development due to the ease of producing plasmids encodingdifferent proteins. This can be performed within a few weeks as comparedwith the months necessary for new viral vectors. Nevertheless, viralvectors, especially adenoviruses, are currently being used in DNA vaccina-tion. The ability of adenoviruses to very efficiently induce an immuneresponse has several advantages: (a) to provide high amounts of antigen tolymphoid tissue; (b) to induce a rapid T-cell expansion and migration inthe lymphatic system; and (c) to promote and prolong T-cell response(Yang et al., 2003). In addition, adenoviruses are non-integrating vectorsand their biology is well understood. In parallel, viral vectors based onother virus types have been developed, for example influenza virus (Ulmeret al., 1998). Currently, Crucell is developing two DNA vaccines againstmalaria and Ebola virus based on adenovirus Ad35 and Ad11, twoserotypes that are not common, thus eliminating the problem of existingimmunity against Ad5. In this case it is possible to obtain a good immuneresponse and an effective protection against infection. There are severalDNA vaccines under development against a number of infectious diseases(Table 18.3).
The application of the DNA vaccine technology is not limited toinfectious diseases and is currently being used in therapeutic vaccinesagainst cancer. Table 18.4 presents the therapeutic DNA vaccines underdevelopment (Powell, 2004).
Further detail on gene therapy is provided in Chapter 21, which focuseson the use of viruses for therapeutic applications instead of prophylaxis.
18.6 Perspectives for the evolution of viral vaccine production
Vaccination has prevented, in a safe and efficient way, more diseases anddeaths due to infectious agents than any other public health policy except
452 Animal Cell Technology

for clean water supply. Among the several international programslaunched in the 20th century to eradicate diseases, the only successful oneto date was based on vaccines – the eradication of smallpox. Poliomyelitismay be the next success within the next decade. Table 18.5 shows theevolution of the viral vaccines available on the market from live/attenuatedvaccines to the more recent subunit and recombinant DNA vaccines.
The major problem associated with recombinant vaccines is related tothe immune response that is often only humoral (antibody production)and not cellular (e.g. cytotoxic T-lymphocytes, CTL) (Ellis, 1999). Nor-mally, viral vaccines are able to stimulate both types of immune response,thus avoiding the need for revaccination (Ellis, 1996).
Another important issue concerns the number of vaccines used forchildren under 2 years of age; the vaccination program includes around 15injections causing some discomfort not only to the children but also totheir parents (Papaevangelou, 1998). It is therefore necessary to developcombined vaccines – live, inactivated or mixed with VLPs or othersubunits – for which the allergic reactivity is minimal.
To circumvent these two problems and taking advantage of the VLPstability, some methods have been developed to introduce multiple epi-topes in the same VLP. One example is the use of porcine parvovirus VLPcontaining epitopes to induce cellular immune response (B cells, CD4+,and CTL). This strategy should allow the production of cheaper and morepotent vaccines that will in turn induce a more effective immune response
Table 18.3 DNA vaccines under development
Vector type Target Company Development stage
Adenovirus Ebola Crucell/NIH PreclinicalHepatitis C Merck & Co. PreclinicalHIV Merck & Co. Phase IMalaria Crucell/GlaxoSmithKline PreclinicalRabies Vaxin PreclinicalWest Nile virus Pfizer/Kimron Vet. Inst Preclinical
Plasmids Ebola NIH Vaccine Research Center Phase IHIV Wyeth Lederle Phase I completeHIV Wyeth Lederle Phase IHIV Chiron Phase IHIV Epimmune Phase I
Table 18.4 Therapeutic DNA vaccines under development
Vaccine Company Development stage
HIV-1 Corixa Phase IMelanoma ImClone Systems Phase ILung cancer ImClone Systems Phase IIIProstate cancer Inovio Phase I/IIMelanoma M.D. Anderson Cancer Center Phase I/IIMelanoma Vical Phase III
Viral vaccines: concepts, principles, and bioprocesses 453
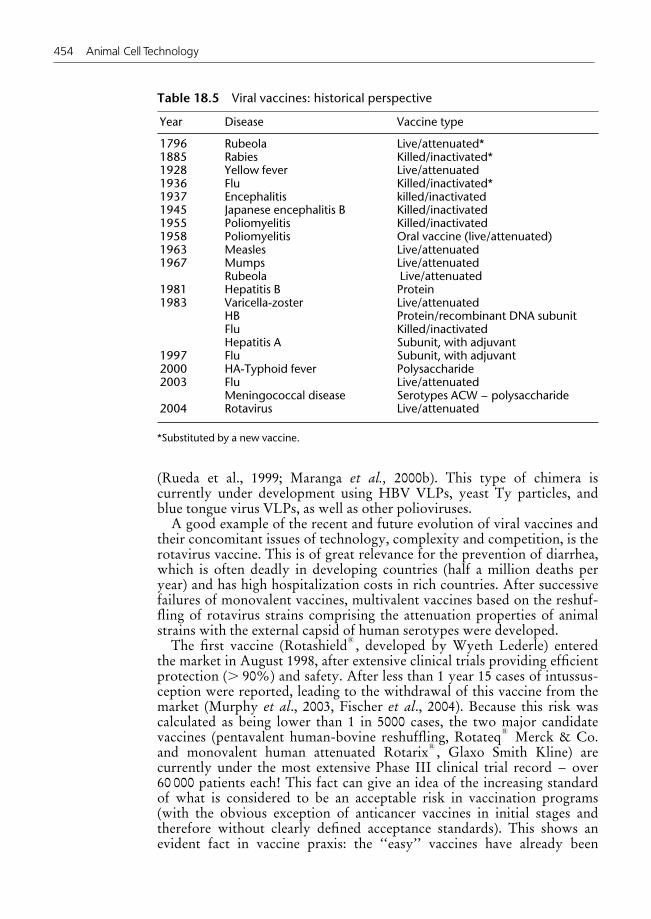
(Rueda et al., 1999; Maranga et al., 2000b). This type of chimera iscurrently under development using HBV VLPs, yeast Ty particles, andblue tongue virus VLPs, as well as other polioviruses.
A good example of the recent and future evolution of viral vaccines andtheir concomitant issues of technology, complexity and competition, is therotavirus vaccine. This is of great relevance for the prevention of diarrhea,which is often deadly in developing countries (half a million deaths peryear) and has high hospitalization costs in rich countries. After successivefailures of monovalent vaccines, multivalent vaccines based on the reshuf-fling of rotavirus strains comprising the attenuation properties of animalstrains with the external capsid of human serotypes were developed.
The first vaccine (Rotashield1, developed by Wyeth Lederle) entered
the market in August 1998, after extensive clinical trials providing efficientprotection (. 90%) and safety. After less than 1 year 15 cases of intussus-ception were reported, leading to the withdrawal of this vaccine from themarket (Murphy et al., 2003, Fischer et al., 2004). Because this risk wascalculated as being lower than 1 in 5000 cases, the two major candidatevaccines (pentavalent human-bovine reshuffling, Rotateq
1Merck & Co.
and monovalent human attenuated Rotarix1, Glaxo Smith Kline) are
currently under the most extensive Phase III clinical trial record – over60 000 patients each! This fact can give an idea of the increasing standardof what is considered to be an acceptable risk in vaccination programs(with the obvious exception of anticancer vaccines in initial stages andtherefore without clearly defined acceptance standards). This shows anevident fact in vaccine praxis: the ‘‘easy’’ vaccines have already been
Table 18.5 Viral vaccines: historical perspective
Year Disease Vaccine type
1796 Rubeola Live/attenuated*1885 Rabies Killed/inactivated*1928 Yellow fever Live/attenuated1936 Flu Killed/inactivated*1937 Encephalitis killed/inactivated1945 Japanese encephalitis B Killed/inactivated1955 Poliomyelitis Killed/inactivated1958 Poliomyelitis Oral vaccine (live/attenuated)1963 Measles Live/attenuated1967 Mumps Live/attenuated
Rubeola Live/attenuated1981 Hepatitis B Protein1983 Varicella-zoster Live/attenuated
HB Protein/recombinant DNA subunitFlu Killed/inactivatedHepatitis A Subunit, with adjuvant
1997 Flu Subunit, with adjuvant2000 HA-Typhoid fever Polysaccharide2003 Flu Live/attenuated
Meningococcal disease Serotypes ACW – polysaccharide2004 Rotavirus Live/attenuated
*Substituted by a new vaccine.
454 Animal Cell Technology

introduced in the market and the ‘‘difficult’’ vaccines, namely viralvaccines, are the only ones left.
For this reason, there are several groups in Europe (involving theauthors of this chapter) and in the USA looking for VLPs produced ininsect cells using multicystronic baculovirus presenting different comple-mentary DNA encoding the critical viral proteins VP2, VP6, VP7, and,eventually, VP4/VP8 in the same vector under the control of differentpromotors (Vieira et al., 2005). Using this technology, after validation ofthe humoral and cellular response, it is possible to consider systemsbiology strategies to understand the replication, stability, mRNA kinetics,protein production stoichiometry, and VLP packaging. Such knowledgewill allow the improvement of the molecular biology of the baculovirusvector and the number of proteins generating appropriate VLPs.
The use of DNA vaccines could also bring additional benefits since theyare based on technological platforms (such as the adenoviral platformAdVac from Crucell), thus providing great flexibility. It is possible inthese cases to add new antigens (derived from a virus, parasite of bacteria)to obtain a greater efficacy through the modulation of the immuneresponse to the mechanism of action of each pathogen. This type oftechnology is particularly useful in cases where the production of antigenis not only difficult but also dangerous (HIV-1, Ebola virus, and WestNile virus). Nevertheless, there are still important challenges, such as thedefinition of formulations that significantly increase the stability of thevaccine.
It is therefore expected that subunit vaccines will proliferate in themarket because they are predominantly safe, as long as their evolution issupported by the development of new technologies that ensure efficacy.
References
Bansal GP, Hatfield JA, Dunn FE, Kramer AA, Brady F, Riggin CH, Collett MS,Yoshimoto K, Kajigaya S, Young NS (1993), Candidate recombinant vaccine forhuman B19 parvovirus, J. Infect. Dis. 167:1034–1044.
Baumert TF, Ito S, Wong DT, Liang TJ (1998), Hepatitis C virus structural proteinsassemble into virus-like particles in insect cells, J. Virol. 72:3827–3836.
Brown CS, Van Lent JW, Vlak JM, Spaan WJ (1991), Assembly of empty capsids byusing baculovirus recombinants expressing human parvovirus B19 structuralproteins, J. Virol. 65:2702–2706.
Butler M (1987), Growth limitations in microcarrier cultures, Adv. Biochem. Eng.Biotechnol. 34:57–84.
Butler M, Spier RE (1984), The effects of glutamine utilization and ammonia produc-tion on the growth of BHK cells in microcarrier cultures, J. Biotechnol. 1:187–196.
Croughan MS, Hamel JF, Wang DIC (1987), Hydrodynamic effects on animal cellsgrown in microcarrier cultures, Biotechnol. Bioeng. 23:130–141.
Cruz PE, Cunha A, Peixoto CC, Clemente J, Moreira JL, Carrondo MJT (1998),Optimization of the production of virus-like particles in insect cells, Biotechnol.Bioeng. 60:408–418.
Cruz PE, Maranga L, Carrondo MJT (2002), Integrated process optimization: lessonsfrom retrovirus and virus-like particle production, J. Biotechnol. 99:199–214.
Viral vaccines: concepts, principles, and bioprocesses 455

Ellis RW (1996), The new generation of recombinant viral subunit vaccines, Curr.Opin. Biotechnol. 7:646–652.
Ellis RW (1999), New technologies for making vaccines, Vaccine 17:1596–1604.Fischer TK, Bresee JS, Glass RI (2004), Rotavirus vaccines and the prevention of
hospital acquired diarrhea in children, Vaccine 22( Suppl 1):S49–54.Frazzatti-Gallina NM, Paoli RL, Mourao-Fuches RM, Jorge SAC, Pereira CA (2001),
Higher production of rabies virus in serum-free medium cell cultures on micro-carriers, J. Biotechnol. 92:67–72.
French TJ, Roy P (1990), Synthesis of bluetongue virus (BTV) core-like particles by arecombinant baculovirus expressing the two major structural core proteins ofBTV, J. Virol. 64:1530–1536.
Fu J, VanDusen W, Kolodin DG, O’Keefe DO, Herber WK, George HA (1996),Continuous culture study of the expression of hepatitis B surface antigen and itsself-assembly into virus-like particles in Saccharomyces cerevisiae, Biotechnol.Bioeng. 49:578–586.
Griffiths JB, Cameron DR, Looby D (1987), A comparison of units process systemsfor anchorage dependent cells, Dev. Biol. Stand. 66:331–330.
Hernando E, Llamas-Saiz AL, Foces-Foces C, McKenna R, Portman I, Agbandje-McKenna M, Almendral JM (2000), Biochemical and physical characterization ofparvovirus minute virus of mice virus-like particles, Virology 267:299–309.
Hu YC, Bentley WE (1999), Enhancing yield of infectious Bursal disease virusstructural proteins in baculovirus expression systems: focus on media, proteaseinhibitors, and dissolved oxygen, Biotechnol Prog. 15:1065–1071.
Hu WS, Wang DIC (1987), Selection of microcarrier diameter for the cultivation ofmammalian cells on microcarriers, Biotechnol. Bioeng. 30:548-557.
Hyatt AD, Zhao Y, Roy P (1993), Release of bluetongue virus-like particles frominsect cells is mediated by BTV nonstructural protein NS3/NS3A, Virology193:592–603.
Jiang B, Barniak V, Smith RP, Sharma R, Corsaro B, Hu B, Madore HP (1998),Synthesis of rotavirus-like particles in insect cells: comparative and quantitativeanalysis, Biotechnol. Bioeng. 60:369–374.
Kent BL, Mutharasani R (1992), Cultivation of animal cells in a reticulated vitreouscarbon foam, J. Biotechnol. 22:311–328.
Kirnbauer R, Booy F, Cheng N, Lowy DR, Schiller JT (1992), Papillomavirus L1major capsid protein self-assembles into virus-like particles that are highlyimmunogenic, Proc. Natl Acad. Sci. U S A 89:12180–12184.
Kosukegawa A, Arisaka F, Takayama M, Yajima H, Kaidow A, Handa H (1996),Purification and characterization of virus-like particles and pentamers producedby the expression of SV40 capsid proteins in insect cells, Biochim. Biophys. Acta1290:37–45.
Lanford RE, Luckow V, Kennedy RC, Dreesman GR, Notvall L, Summers MD(1989), Expression and characterization of hepatitis B virus surface antigenpolypeptides in insect cells with a baculovirus expression system, J. Virol.63:1549–1557.
Le Blois H, Fayard B, Urakawa T, Roy P (1991), Synthesis and characterization ofchimeric particles between epizootic hemorrhagic disease virus and bluetonguevirus: functional domains are conserved on the VP3 protein, J. Virol. 65:4821–4831.
Maranga L, Cruz PE, Aunins JG, Carrondo MJT (2002a), Production of core andvirus-like particles with baculovirus infected insect cells, Adv. Biochem. Eng.Biotechnol. 74:183–206.
Maranga L, Rueda P, Antonis AF, Vela C, Langeveld JP, Casal JI, Carrondo MJT(2002b), Large scale production and downstream processing of a recombinantporcine parvovirus vaccine, Appl. Microbiol. Biotechnol. 59:45–50.
456 Animal Cell Technology

Maranga L, Cunha A, Clemente J, Cruz PE, Carrondo MJT (2004), Scale-up of virus-like particles production: effects of sparging, agitation and bioreactor scale on cellgrowth, infection kinetics and productivity, J. Biotechnol. 107:55–64.
Martinez C, Dalsgaard K, Lopez de Turiso JA, Cortes E, Vela C, Casal JI (1992),Production of porcine parvovirus empty capsids with high immunogenic activity,Vaccine 10:684–690.
Mendonca RZ, Ioshimoto LM, Mendonca RMZ, De Franco M, Valentini EJG, BecakW, Pereira CA (1993), Preparation of human rabies vaccine in VERO cell cultureusing a microcarrier system, Braz. J. Med. Biol. Res. 26:1305–1317.
Mendonca RZ, Prado JCM, Pereira CA (1999), Attachment, spreading and growth ofVERO cells on microcarriers for the optimization of large scale cultures, Biopro-cess Eng. 20:565–571.
Mendonca RZ, Arrozio SJ, Antoniazzi MM, Ferreira JMC Jr, Pereira CA (2001),Metabolic active-high density VERO cell cultures on microcarriers followingapoptosis prevention by galactose/glutamine feeding, J. Biotechnol. 97:13–22.
Montagnon B, Vincent-Falquet JC, Fanget B (1984), Thousand litre scale microcarrierculture of VERO cells, Dev. Biol. Stand. 55:37–42.
Montross L, Watkins S, Moreland RB, Mamon H, Caspar DL, Garcea RL (1991),Nuclear assembly of polyomavirus capsids in insect cells expressing the majorcapsid protein VP1, J. Virol. 65:4991–4998.
Murphy TV, Smith PJ, Gargiullo PM, Schwartz B (2003), The first rotavirus vaccineand intussusception: epidemiological studies and policy decisions, J. Infect. Dis.187:1309–1313.
Nahapetian AT, Thomas JN, Thilly WG (1986), Optimization of environment for highdensity VERO cell culture: effect of dissolved oxygen and nutrient supply on cellgrowth and changes in metabolites, J. Cell Sci. 81:65–103.
Papaevangelou G (1998), Current combined vaccines with hepatitis B, Vaccine 16:S69–72.
Powell K (2004) DNA vaccines – back in the saddle again?, Nat. Biotechnol. 22:799–801.
Reuveny S, Coret R, Freeman A, Kotler M (1985), Newly developed microcarrierculturing systems an overview, Dev. Biol. Stand. 60:243–253.
Roy P (1990), Use of baculovirus expression vectors: development of diagnosticreagents, vaccines and morphological counterparts of bluetongue virus, FEMSMicrobiol. Immunol. 2:223–234.
Rueda P, Martinez-Torrecuadrada JL, Sarraseca J, Sedlik C, del Barrio M, Hurtado A,Leclerc C, Casal JI (1999), Engineering parvovirus-like particles for the inductionof B-cell, CD4(+) and CTL responses, Vaccine 18:325–332.
Sandhu JS (1994), Engineered human vaccines, Crit. Rev. Biotechnol., 14:1–27.Tsao EI, Mason MR, Cacciuttolo MA, Bowen SH, Folena-Wasserman G (1996),
Production of parvovirus B19 vaccine in insect cells co-infected with doublebaculoviruses, Biotechnol. Bioeng. 49:130–138.
Ulmer JB, Fu TM, Deck RR, Friedman A, Guan L, DeWitt C, Liu X, Wang S, LiuMA, Donnelly JJ, Caulfield MJ (1998), Protective CD4+ and CD8+ T cells againstinfluenza virus induced by vaccination with nucleoprotein DNA, J. Virol.72:5648–5653.
Van Wezel AL (1967), Growth of strains and primary cells on microcarriers inhomogeneous culture, Nature 216:64–65.
Varani J, Dame M, Beals TF, Wass JA (1983), Growth of three established cell lines onglass microcarriers, Biotechnol. Bioeng. 25:1359–1372.
Vieira HLA, Estevao C, Roldao A, Peixoto C, Sousa M, Cruz PE, Carrondo MJT,Alves PM (2005), Triple layered rotavirus VLP assembly: kinetics of vectorreplication, mRNA stability and recombinant protein production, J. Biotechnol.120:72–82.
Viral vaccines: concepts, principles, and bioprocesses 457

Wang MY, Kuo YY, Lee MS, Doong SR, Ho JY, Lee LH (2000), Self-assembly of theinfectious bursal disease virus capsid protein, rVP2, expressed in insect cells andpurification of immunogenic chimeric rVP2H particles by immobilized metal-ionaffinity chromatography, Biotechnol. Bioeng. 67:104–111.
White LJ, Hardy ME, Estes MK (1997), Biochemical characterization of a smaller formof recombinant Norwalk virus capsids assembled in insect cells, J. Virol. 71:8066–8072.
Yang TC, Dayball K, Wan YH, Bramson J (2003), Detailed analysis of the CD8+T-cell response following adenovirus vaccination, J. Virol. 77:13407–13411.
Yokomizo AY, Antoniazzi MM, Galdino PL, Azambuja NJ, Jorge SAC, Pereira CA(2004), Rabies virus production in high Vero cell density cultures on macroporousmicrocarriers, Biotechnol. Bioeng. 85:506–515.
458 Animal Cell Technology
19BioinsecticidesMarcia Regina da Silva Pedrini andRonaldo Zucatelli Mendonca
19.1 Introduction
This chapter describes the application of animal cells, particularly insectcells, for baculovirus production and its use as a bioinsecticide. The use ofbaculovirus in the control of insect pests and its production in vitro arediscussed.
Brazil is one of the largest agricultural producers in the world. Accord-ing to data from the Institute of Agriculture (IEA), in 2003 the economicbalance of the Brazilian agro business was US$ 17.61 billion (Vicente etal., 2003). In 2005, the Brazilian production was about 113 million tons ofgrains, with soy accounting for about 48% of this production (IBGE,2005).
Pesticides have an important role in the development of agriculturalproduction, in controlling pests and insuring a sustainable agriculture.However, the constant use of chemical pesticides, in an indiscriminateway, causes a reduction of the population of beneficial organisms andinduces resistance of the targeted insect pests, which creates even moredependence on chemical products. Therefore, the reduction of the usage ofthese pesticides in agriculture is of great importance for commercial andenvironmental reasons.
The biological control of insect pests in agriculture is an old practice.More than 120 years ago, an infestation of citrus fruit production byIcerya purchasi in Florida State (USA) was treated using a ladybug fromAustralia, a procedure that was later used in other countries, includingBrazil (Carvalho et al., 1999). Currently, several bioinsecticides are usedfor biological control, the most common being insects (wasps, acarids,etc.), bacteria (Bacillus thuringiensis), fungi, or virus (baculovirus).
Bioinsecticides based on baculovirus have had a strong impact on theproduction of grain. Brazilian research on the use of baculovirus wasinitiated by EMBRAPA (Brazilian Agricultural Research Corporation)during the 1970s (Moscardi, 1993). Because of this research, currently, soyfarming is maintained entirely without the use of chemical pesticides. Thebiologically treated area exceeds two million hectares, distributed amongseveral different states of Brazil. This is the best worldwide example oflarge-scale viral biopesticide usage (Agencia Brasil, 2004).
In such a system, a species-specific virus is used. In the case of soycultivation, this virus is Baculovirus anticarsia, which specifically kills acaterpillar found on the soy – Anticarsia gemmatalis – a defoliating pestthat substantially reduces farming productivity. With this bioinsecticide,

the use of millions of liters of chemical insecticide per harvest is avoided,thus generating an enormous environmental and economical benefit to thecountry (EMBRAPA, 2002).
In addition to the economic and environmental gains, other advantagesof this product are the facts that the manipulation of chemicals can beavoided and that the virus is species-specific. It only affects invertebratesand causes no harm to other insects that could be natural bioinsecticides toother pests. Moreover, other factors that contribute to its success are: thehigh virulence of the virus and its infection efficiency, the low cost of theproduct compared with chemical insecticides, and the fact that this is aunique pest in most producing areas. The sum of these advantages makesthe baculovirus very attractive as a bioinsecticide (Moscardi, 1999;Moscardi and Souza, 2002; Szewczyk et al., 2006).
Nevertheless, the bioinsecticide has some limitations. Although the highspecificity is very important in ecological terms, this restricts its market.The bioinsecticide has low activity. However, this can be improvedthrough modification of the baculovirus genome, suppressing or incorpor-ating genes from other organisms, such as those that express hormones ortoxins. According to Szewczyk et al. (2006), genetically modified baculo-virus will be gradually introduced into countries that have a generalacceptance of genetically modified organisms (GMOs).
Another aspect to be considered is the need for increased production.At the moment, the production of the bioinsecticide is accomplished byharvesting infected caterpillars in the areas infected or by growing thecaterpillars in a laboratory. In the first case, there is great variability inproductivity from year to year, since the production depends on the insectabundance during each harvest, which varies with multiple factors. How-ever, there has been considerable progress in the production of the virusunder laboratory-controlled conditions (Moscardi and Santos, 2005). InMarch of 2005 EMBRAPA finished the construction of a pilot plant withthe capacity to inoculate about 30 000 caterpillars per day, and anotherinstitution, the COODETEC (Cascavel, PR), is enlarging its productioncapacity to 600 000 caterpillars per day. However, the caterpillars have tobe fed with artificial diets and the cost of production of a dose of thebiopesticide, based on Baculovirus anticarsia, using raw material producedlocally, is approximately 90% higher than that obtained by direct harvest-ing from the field. The use of alternative formulations, such as substitutingagar for carrageen as a gelling agent, has reduced production cost, makingit more economically feasible to produce the bioinsecticide in the labora-tory (Santos, 2003). However, this type of process has high labor demands.Large-scale virus production in cell culture in bioreactors is a desirabledevelopment, since it allows virus multiplication in a smaller area and itreduces labor requirement, in comparison with in vivo production in thelaboratory.
19.2 Baculovirus as a bioinsecticide: mechanism of action
Baculovirus belongs to the Baculoviridae family, which has two differentgenera: Nucleopolyhedrovirus (NPV) and Granulovirus (GV). Baculo-
460 Animal Cell Technology

virus exists as two phenotypes designated extracellular virus or buddedvirus (BV) and the occlusion bodies, also known as OBs, COPs, GDP, orpolyhedra (Figure 19.1). The occlusion bodies are structures that areformed inside the nucleus of the infected insect cells by baculovirus(Friesen and Miller, 2001). These are highly resistant and able to stayviable in the environment for several years under different climatic condi-tions. The protected viral particles (virions) are known as ODVs (occlu-sion-derived virus) (Harrap, 1972).
The protein contained in the GV OBs is called granulin and that in theNPV is called polyhedrin (Rohrmann, 1999; Winstanley and O’Reilly,1999). GVs are smaller than NPVs and possess rounded OBs with just onevirion occluded (Winstanley and O’Reilly, 1999). NPVs present a poly-hedral form and they can be multiple type (MNPV) (Figure 19.1A) orsimple type (SNPV) (Figure 19.1B), depending on the number of capsidsper virion (Rohrmann, 1999). Since most of the baculovirus used asbiopesticidas are NPVs, in this chapter the OBs will be referred aspolyhedra.
The names of different baculovirus species come from the host name inwhich the virus was initially identified in nature. In this way, eachbaculovirus species receives the name of this host and the name of thefamily to which the virus belongs.
The infection cycle is shown in Figure 19.2. When the polyhedra aredispersed in the environment, the viral particles inside them (ODVs) aredeposited on the plant leaves. When the caterpillars feed on the virus-contaminated foliage, they ingest the polyhedra. The alkaline environmentin the caterpillar medium intestine causes breakdown of the polyhedra andthe viral particles are released from the polyhedra. The infection of thecells occurs via a receptor-mediated fusion process. Once in the cytoplasm,the nucleocapsids without membrane are transported to the nucleus of thecell, where gene expression and genome replication begins.
A B
MNPV SNPV
Figure 19.1
Electron micrographs illustrating polyhedra produced by nucleopolyhedrovirus ininsect cell culture with multiple nucleocapsids per envelope (A), or with singlenucleocapsids per envelope (B).
Bioinsecticides 461

The nucleocapsids are envelopes that contain a nucleoprotein in thecenter, which transports the viral DNA to the cell nucleus. After replica-tion, new copies of the viral genome are encapsulated in the nucleus,creating new nucleocapsids. The nucleocapsids then migrate to the cyto-plasm and leave the cell by a budding process. In this process, thenucleocapsids become enveloped by the acquisition of the host cell plasmamembrane. The resulting virions are extracellular (budded virus, BV) andthese constitute the main products of the first stage of the infection processin the caterpillar, known as primary infection.
The BVs are taken to other tissues of the larva by the tracheal system,where they enter the cells by endocytosis, starting with the secondaryinfection process in which the infection is spread to all cells of the hostorganism. Two virion types are produced in this stage of the infection.Some of the newly synthesized nucleocapsids migrate to the cytoplasmand are released from the cytoplasmic membrane, forming new BVs.Other nucleocapsids are enveloped again in the nucleus. The virions thatare occluded (ODVs), are surrounded by the protein crystal structure,forming the polyhedra. In the final phase of infection, the larva becomescream in color and the outer covering (tegument) becomes fragile. The
Insect feeding on
virus-contaminated
foliage
Polyhedra
Polyhedra are
released upon cell
lysis and death
of the host
Lysis
Insect cell
Replication
Replication
Nucleus
Nucleus
Budding
BV
Secondaryinfection
endocytosis Budded virus
BV
Primaryinfection
Fusion
Cell
Dissolution of polyhedra
in the midgut releasing the
virions (occlusion-derived
virus)
Figure 19.2
Diagram of the life cycle of a nucleopolyhedrovirus.
462 Animal Cell Technology

rupture of the tegument causes the release of the polyhedra, which arethen available for the infection of other caterpillars (Federici, 1986;Granados and Federici, 1986; Adams and Bonami, 1991; Rohrmann, 1999;Winstanley and O’Reilly, 1999; Friesen and Miller, 2001).
19.3 Animal cell cultures for baculovirus production
The insect baculovirus–cell system has been widely used, mainly for theproduction of recombinant proteins (Maiorella et al., 1988; Jarvis, 1997).This system has several advantages, including the ability to producefunctional recombinant proteins that are immunogenically active, theability to make post-translation modifications, and the fact that it containsa powerful promoter (polyhedrin), as well as the fact that the virus is notpathogenic to plants and vertebrates (Caron et al., 1990; Nguyen et al.,1993; Godwin et al., 1996).
However, for bioinsecticide production there are specific factors to betaken into account:
(i) The large-scale cell production to be used in virus production, sincelarge volumes of cells are necessary, at a competitive cost.
(ii) Economic production processes and cheap culture media are neededto make production viable.
(iii) It is necessary to establish the most effective cell line for viralproduction with high virus per cell productivity. The productivitydepends on both the cell type and virus.
(iv) Mutant generation must be monitored and avoided. The risk increaseswith the number of passages of the virus in cells.
(v) It is necessary to maintain viral virulence when cultured in vitro. Ithas been shown that there is a tendency for a loss of virulence withviral passage in cell culture.
(vi) The activity of the polyhedra produced in vitro should be comparedwith those obtained in caterpillars.
19.4 Effect of culture medium, cell line, and virus isolate onbiopesticide production
Lepidoptera-derived insect cell lines are used for biopesticide production.Sf21 cells, originated from pupal ovarian tissue of the fall armywormSpodoptera frugiperda, and Sf9 cells, a subclone of the Sf21 cells, are themost widely used cell lines for biopesticide production (King and Possee,1992) (Figure 19.3). The availability of insect cell lines from Invitrogen (LaJolla, EUA) was an important step for increasing the use of these cell linesworldwide.
The establishment of insect cell line cultures allowed a detailed study ofthe infection cycle of many baculoviruses. These cell lines are easilycultured in vitro and their maintenance is relatively simple. The majorityof the cell lines can be cultivated using a temperature of 25–308C. How-ever, the best temperature for the growth and infection of Sf9 cells isaround 27–288C (King and Possee, 1992).
Bioinsecticides 463

An important aspect of biopesticide production using insect cell lines isthe maximization of cell growth. Culture media must satisfy the environ-mental and nutritional requirements of the cell line. Hence, many studieshave been carried out to characterize the nutrient requirements and meta-bolic pathways of these cells (see Chapters 4 and 5).
Polyhedra bioactivity can be compromised due to nutrient limitations,causing abnormalities in virion development and occlusion within poly-hedra (Rollinson et al., 1965; Slavicek et al., 1995; Belloncik et al., 1997).The most important aspects of culture medium selection are pH, osmolar-ity, and organic salt components. Components such as amino acids,vitamins, and carbon source (glucose for example), are typically found inthe basal culture medium formulation. However, these simple formula-tions cannot promote cell growth themselves, unless supplemented withanimal serum, normally 5–20% (v/v) fetal bovine serum (FBS) (Schlaeger,1996).
Lynn (1999) demonstrated that cell maintenance for long periods inserum-free medium can lead to a slight decline in viral production. How-ever, Chakraborty et al. (1999) obtained lower polyhedra productionwhen medium with FBS was used. Therefore, medium choice is not trivial.Even though FBS has great importance for cell growth, its usage has manydisadvantages. It is expensive, so its addition to the culture mediumincreases total costs substantially. Moreover, its quality can vary frombatch to batch, with an alteration of composition, which can affect cellgrowth and virus replication (Schlaeger, 1996).
Figure 19.3
Contrast micrograph of Sf9 cells.
464 Animal Cell Technology

Development of serum-free medium has great value for large-scalebiopesticide production. The latest formulations are serum-free, such asSF900II (GIBCO
1/Invitrogen) and EX-CELLTM (JRH Biosciences). Cell
culture medium supplementation using yeast extract (usually from alco-holic fermentation processes), milk, or soy protein concentrates, can alsobe an alternative to decrease cell culture medium costs (more details can befound in Chapter 5).
In vitro baculovirus production can also be affected by the cell line.Polyhedra production yield can vary between different tissues within thesame host as well as in different cell lines. Furthermore, the cell line itselfmay be a source of viral instability in the form of transposon-mediatedmutagenesis (Fraser et al., 1985). (Transposons are sequences of DNA thatcan move around to different positions within the genome, a process called‘‘transposition.’’ In the process, they can cause mutations, and change theamount of DNA in the genome.)
Insect cell lines present different susceptibilities to virus replication. Acell line is called permissive when it can support full virus replicationand all stages of viral cycle are completed, leading to polyhedra produc-tion and lysis of the host cell. Semi-permissive cell lines allow partialvirus replication, possibly due to a restriction at a particular viral cyclestage (Bilimoria et al., 1992). Abortive cell lines are those in which theresulting virus may have a cytopathic effect, but there are no infectiveparticles produced (Carpenter and Bilimoria, 1983; Liu and Bilimoria,1990).
In vitro infection can be established routinely using infected larvaehemolymph containing viral infectious particles (BVs). These particles canbe used to inoculate susceptible cells (see secondary infection, Figure19.2). NPV replication in insect cell lines seems to be more efficient thanGV replication in vitro. While many studies have demonstrated thesusceptibility of NPVs to different cell lines, few efficient replicationsystems have been obtained for GVs (Miltenburger et al., 1984; Winstanleyand Crook, 1993).
In a study carried out by Castro et al. (1997), the authors evaluated thesusceptibility of four different lepidopteran cell lines to AgMNPV virus.Anticarsia gemmatalis (UFL-AG-286) and Spodoptera frugiperda(IPLBSF-21) infected cells were productive, whereas Choristoneura fumi-ferana (IPRI-CF-124T) and Bombyx mori (BM-5) infected cells wereabortive.
In addition, even for permissive cells, virus yield can differ between celllines. In the same study (Castro et al, 1997), UFL-AG-286 cells wereshown to be more efficient than IPLBSF-21 cells in producing virus. Lynn(2003b) tested 12 insect cell lines for susceptibility to infection by threedifferent NPVs. The author observed that virus titer differed up to 104-fold between cell lines. Miltenburger et al. (1984) established more than200 Cydia pomonella primary cell lines. Of these, 81 were selected forreplication of two groups of baculovirus: Choristoneura murinana NPVand Cydia pomonella GV. Although the selected cell lines were from thesame insect species, a large difference in viral infection was noted, leadingto different polyhedra yields. Goodman et al. (2001) and Lynn (2003b)also found substantial differences in susceptibility to baculovirus infection
Bioinsecticides 465

between cell lines of the same insect species, probably due to the kind oftissues involved.
Other examples of in vitro baculovirus systems (virus–cell line) are:Helicoverpa armigera SNPV and Helicoverpa zea cells, with 222 polyhe-dra per cell (Lua et al., 2002); Trichoplusia ni NPV and Trichoplusia nicells, with 70 polyhedra per cell (Potter et al., 1976); Lymantria disparMNPV and Lymantria dispar cells, with 57 polyhedra per cell (Slaviceket al., 1996); Spodoptera frugiperda MNPV and Spodoptera frugiperda,with 399 polyhedra per cell (Almeida et al., 2005).
19.5 Polyhedra virulence and characteristics
Cell lines inoculated with OBs are not infectious because the virions arenot released into the neutral pH of the culture medium and thus notavailable for further infection (Elam et al., 1990). In contrast, it is relativelyeasy to establish continuous cultures of virus isolates in vitro withnonoccluded virions (BVs) from infected insect hemolymph or from thesupernatants of previously infected cell lines (King and Possee, 1992). In acomparative study, Volkman et al. (1976) estimated that BV is about1700–1900-fold more infectious than ODV. Therefore, the use of BV isusually the first choice to propagate a virus in cell culture (King andPossee, 1992).
It is possible to use ODVs as a source of infectious virions if they arereleased from the OBs using alkaline solutions. But when OBs aredissolved in alkaline solution before infection of cell lines, there is only alow level of in vitro activity (Vail et al., 1979; Elam et al., 1990).However, this process can be improved by using proteinases. McIntoshet al. (1988) achieved an improvement in the insect cell culture suscept-ibility to ODVs using a treatment with proteinase K to dissolve Helico-verpa zea NPV (HzSNPV) polyhedra, which could infect homologouscells. Lynn (1994) also achieved the same result when he used a treatmentof dissolving Lymantria dispar NPV (LdMNPV) polyhedra with trypsin.
How proteinase works to achieve this improvement has not yet beenelucidated. Lynn (2003a) demonstrated that, in spite of the fact that trypsintreatment can increase infectivity of baculovirus, this enhancement doesnot happen for all cell–virus systems. AcMNPV infectivity of Trichoplusiani (TN-368) cells increased 4750-fold using trypsin. For Anagraphafalcifera NPV (AfMNPV), the improvement was 77 000- fold. On theother hand, the infectivity of these two viruses for the Lymantria dispar(LIPLB-LdE) cell line was slightly reduced.
Some studies have demonstrated that the source of polyhedra does notaffect its lethality or the time necessary to kill the caterpillars (Faulknerand Henderson, 1972; Ignoffo et al., 1974; Wang et al., 1992; Chakrabortyet al., 1999). However, Bonning et al. (1995) found that polyhedraproduced from caterpillars kill Trichoplusia ni and Heliothis virescenscaterpillars faster than polyhedra from cell culture. This could suggestefficiency differences of these polyhedra produced from different sources.Nevertheless, there were no observed differences in lethal dose betweenthe polyhedra tested.
466 Animal Cell Technology

Morphological analysis showed different sizes for polyhedra producedfrom cell culture and caterpillar (Bonning et al., 1995). On other hand, thepolyhedra number is inversely proportional to cell size (Federici, 1986). Inaddition, the polyhedra produced in vitro is more sensitive to detergent(sodium dodecyl sulfate, SDS) treatment than polyhedra produced in vivo(Lua et al., 2003). All these differences may be related to biochemicaldifferences observed between the infected cells in vitro and in vivo(Bonning et al., 1995). Another characteristic of polyhedra produced invitro is the so-called ‘‘passage effect’’, which is discussed below.
19.6 Production of viral mutants in cell culture
Viral genomes, like all genomes, evolve and adapt to changes in environ-mental pressures. Furthermore, the rate of adaptation is specific toindividual genes exposed to a particular selective environment (Bulach andTribe, 1994). When conditions are radically altered, such as when baculo-viruses are switched from in vivo to in vitro propagation, rapid changes inthe phenotype may result as the selection of optimal genotypes takes place.An in vitro environment is radically different in many ways. This includesthe use of a specific cell type for virus propagation, the form and supply ofnutrients, and the use of BV as the sole means of genetic propagation.
Scaling up a baculovirus–insect cell process involves a large increase involumetric scale and requires multiple passages of the virus for completion(Rhodes, 1996). A major difficulty of in vitro production of baculovirusesis the development of virus instability or the so-called passage effect. Thepassage effect can result from a variety of mutations, where a decrease ofpolyhedra production and virulence are the main characteristics. Thesemutations can have a significant effect on commercial production in vitro.The most common mutations are: defective interfering particles (DIPs)and few polyhedra (FP) mutants.
FP mutants are characterized by reduced polyhedra and enhancedproduction of BV, resulting in a selection of the FP phenotype duringserial passage in cell culture (Hink and Vail, 1973; Mackinnon et al., 1974;Potter et al., 1976; Sohi et al., 1984; Chakraborty and Reid, 1999; Pedriniet al., 2004). The polyhedra that are produced have practically no occludedvirions (Figure 19.4), resulting in low or no infectivity of the target pest.
Spontaneously generated FP mutants are well documented among wild-type baculoviruses that are serially passed in cell cultures, such as:Autographa californica NPV (AcMNPV) (Hink and Vail, 1973; Wood,1980), Galleria mellonella NPV (GmMNPV) (Fraser and Hink, 1982),Trichoplusia ni NPV (TnMNPV) (Potter et al., 1976), Lymantria disparNPV (LdMNPV) (Slavicek et al., 1995), Orgyia pseudotsugata NPV(OpMNPV) (Russell and Rohrmann, 1993), Helicoverpa armigera NPV(HaSNPV) (Chakraborty and Reid, 1999; Lua et al., 2002), Bombyx moriNPV (BmMNPV) (Katsuma et al., 1999), and Spodoptera frugiperda NPV(SfMNPV) (Pedrini et al., 2004).
The mutations have been observed predominantly within a specificDNA region (map units 36–37) on the AcMNPV (Fraser et al., 1983;Beames and Summers, 1988, 1989) and GmMNPV genomes (Fraser et al.,
Bioinsecticides 467

1983, 1985). This region has the 25K FP gene, which encodes a 25 kDaprotein (Harrison and Summers, 1995; Braunagel et al., 1999). This proteinis essential for polyhedron formation and virion occlusion since deletionof this gene is sufficient to eliminate these processes (Beames andSummers, 1988, 1989, Wang et al., 1989; Harrison and Summers, 1995,Braunagel et al., 1999). These mutations have been correlated to largeinsertions of host DNA or deletions of the viral genome (Fraser and Hink,
cnu
nm
p
A1 mµ 1 mµ
1 mµ 1 mµ
c
nu
vs
nm
p
C
p
v
B
p
D
Figure 19.4
Electron micrographs illustrating the phenotypic characteristics of HaSNPVinfection of H. zea cells grown in suspension cultures, comparing the use of thewild-type MP isolate (A and B) with the plaque-purified FP8AS (C and D).Micrographs B and D are higher magnifications of micrographs A and C,respectively, to illustrate in greater detail the ultrastructure of polyhedra and theirembedded virions within the nucleus. The typical MP phenotype is that of manypolyhedra within the nucleus and the presence of numerous virions embeddedwithin these polyhedra, as exemplified by the wild-type MP isolate. In contrast, thetypical FP phenotype is that of considerably fewer polyhedra within the nucleus,with little or no virion embedment within these polyhedra, as shown by the FP8ASvariant. c, nucleus; nm, nuclear membrane; nu, nucleus; p, polyhedra; v, virion;vs, virogenic stroma. From Pedrini, M.R.S., et al. Properties of a Unique Mutant ofHelicoverpa armigera Single-nucleocapsid Nucleopolyhedrovirus that Exhibits aPartial Many Polyhedra and Few Polyhedra Phenotype on Extended SerialPassaging in Suspension Cell Cultures. In Vitro Cellular and Developmental Biology– Animal, Vol 41, pp 289–297. Copyright # 2005 by Society for In Vitro Biology.Reproduced with permission of the copyright owner.
468 Animal Cell Technology

1982; Fraser et al., 1983; Beames and Summers, 1988, 1989; Wang et al.,1989). However, for the HaSNPV (Lua et al., 2002) and LdMNPV(Slavicek et al., 1995; Bischoff and Slavicek, 1997b), point mutations orsimple base pair insertions were observed within the 25K FP gene. The FPmutation of HaSNPV and LdMNPV is likely to arise through a differentmechanism from AcMNPV and GmMNPV (Fraser et al., 1983; Beamesand Summers, 1988), but probably similar to both viruses (Lua et al.,2002).
When the virus has gone through a long period of multiple infectioncycles, the ability to infect insect cells decreases due to the formation ofdefective interfering particles (DIPs). DIPs are found in most animal virussystems (Huang and Baltimore, 1977) and are well documented in manybaculovirus systems that undergo in vitro serial passaging, such as:AcMNPV (Carstens, 1982; Kool et al., 1991; Lee and Krell, 1992; Pijlmanet al., 2001), BmMNPV (Hashimoto et al., 1993; Yanase et al., 1998),SeMNPV (Heldens et al., 1996), H. zea baculovirus subgroup C (Burandand Wood, 1986; Chao et al., 1990), and HaSNPV (Pedrini et al., 2005).Some of these data are summarized in Table 19.1.
Pijlman et al. (2001) demonstrated that DIP generation and accumula-tion are intrinsic characteristics of baculovirus propagation in insect cellcultures, leading to a dramatic loss of BV titer. However, the origin ofDIPs is not fully understood. Pijlman et al. (2001) proposed a mechanisminvolving continuous hetero- and homologous recombination of baculo-virus DNA within insect cells, the deletion mutants of which are thenselected for, depending on their relative replicative advantages. A highfrequency of recombination between homologous baculoviruses in insectcell cultures has been demonstrated previously (Hajos et al., 2000). It wasfound that AcMNPV mutant virions lack around 44% of the viral genome,including polyhedra and DNA polymerase genes (Kool et al., 1991;Wickham et al., 1991). These particles containing only part of their
Table 19.1. Defective interfering particles (DIPs) for many baculovirus submitted to successivepassages in insect cell cultures
Virus Cell line Native virussize (kb)
DIP size(kb)
% ofnative virus
Reference
A. californica NPV(AcMNPV)
S. frugiperda (Sf) 128 75 59 Carstens, 1982
A. californica NPV(AcMNPV)
S. frugiperda(Sf-AE-21)
130 100; 85; 70 77; 65; 54 Lee and Krell, 1992
A. californica NPV(AcMNPV BacmidbGFP)
S. frugiperda(Sf-AE-21)
Not given Not given 57 Piljman et al., 2001
B. mori NPV(BmMNPV D1)
B. mori (BmN4) Not given Not given 74 Hashimoto et al.,1993
S. exigua NPV(SeMNPV)
S. exigua(Se-UCR1)
134 109 81 Heldens et al., 1996
H. zea subgroup CBaculovirus (Hz-1)
T. ni (Tn-368) 228 176–204 77–89 Chao et al., 1990
H. armigera NPV(HaSNPV)
H. zea (Hz-AM1) 133.4 115.4; 92.3 87, 7 Pedrini et al. 2005
Bioinsecticides 469

genome need an intact virus as a helper (Lee and Krell, 1992), but replicatefaster than standard virus, and consequently, increase their yield withcontinuous serial passage.
DIP formation in virus stocks can be avoided by infecting insect cells ata low multiplicity of infection (MOI). According to Wickham et al.(1991), a low MOI is used to minimize the probability of a DIP enteringin a cell along with an intact helper virion. As a result, some cells receiveonly intact virus, others only defective virus, or no virus at all. Non-infected cells or cells infected only with defective virus will not produceany more virus, while cells infected with intact virus will produce moreintact and infectious viruses than the co-infected cells. Therefore, the DIPfraction will decrease compared with the original inoculum. This causes anincrease of virus titer.
Other genomic mutations can also affect the viral infectivity in cater-pillars, such as: enhancing genes (E1 and E2) (Bischoff and Slavicek, 1997a;Popham et al., 2001), SeMNPV ORF35 (Se35) gene (Pijlman et al., 2001),and the SeMNPV ORF36 (Se36), designated as per os infectivity factor(pif) (Kikhno et al., 2002). An understanding of how these genes affectviral infectivity may help to develop culture strategies that avoid thesemutations. This could improve the commercial prospects of biopesticidesproduced in vitro.
References
Adams JR, Bonami JR (1991), Atlas of Invertebrate Viruses, CRC Press, Boca Raton,FL, p. 684.
Agencia Brasil (2004), Brasil tem o maior e melhor programa de controle biologico domundo, Disponıvel em: Revista Biotecnologia Ciencia & Desenvolvimento. Avail-able at: http://www.biotecnologia.com.br/bionoticias/noticia.asp?id¼224 (acessedSeptember 2006).
Almeida AF, Silva SF, Macedo GR, Pedrini MRS (2005), Producao de biopesticidaviral Spodoptera frugiperda MNPV utilizando celulas Sf9, XV Simposio Nacionalde Bioprocessos, Recife, PE.
Beames B, Summers MD (1988), Comparisons of host cell DNA insertions and alteredtranscription at the site of insertions in few polyhedra bacilovirus mutants,Virology 162:206–220.
Beames B, Summers MD (1989), Location and nucleotide sequence of the 25K proteinmissing from baculovirus few polyhedra (FP) mutants, Virology 168:344–353.
Belloncik S, Akoury WE, Cheroutre M (1997), Importance of cholesterol for nuclearpolyhedrosis virus (NPV) replication in cell cultures adapted to serum-freemedium, In: Maramorosh K, Mitsubashi J (Eds), Invertebrate Cell Culture: NovelDirections and Biotechnology Applications, Science Publishers, Enfield, NH, pp.141–147.
Bilimoria SL, Demirbag Z, Ng H (1992), Abortive cell culture infections of nuclearpolyhedrosis viruses as model systems for host specificity, Pesquisa AgropecuariaBrasileira 27:123–141.
Bischoff DS, Slavicek JM (1997a), Molecular analysis of an enhancing gene in theLymantria dispar nuclear polyhedrosis virus, J. Virol. 71:8133–8140.
Bischoff DS, Slavicek JM (1997b), Phenotypic and genetic analysis of Lymantria disparnucleopolyhedrovirus few polyhedra mutants: mutations in the 25K FP gene maybe caused by DNA replication errors, J. Virol. 71:1097–1106.
Bonning BC, Hoover K, Duffey S, Hammock BD (1995), Production of polyhedra of
470 Animal Cell Technology

the Autographa californica nuclear polyhedrosis virus using the Sf21 and Tn5B1-4cell lines and comparison with host-derived polyhedra by bioassay, J. Invertebr.Pathol. 66:224–230.
Braunagel SC, Burks JK, Rosas-Acosta G, Harrison RL, Ma H, Summers MD (1999),Mutations within the Autographa californica nucleopolyhedrovirus FP25K genedecrease the accumulation of ODV-E66 and alter its intranuclear transport,J. Virol. 73:8559–8570.
Bulach D, Tribe D (1994), Tools for tracking insect virus variation in nature and duringbiopesticide manufacturing. Proceedings of the 1st Brisbane Symposium – Bio-pesticides: Opportunities for Australian Industry, 9–10, Brisbane, Australia.
Burand JP, Wood HA (1986), Intracellular protein synthesis during standard anddefective Hz-1virus replication, J. Gen. Virol. 67:167–173.
Caron AW, Archambault J, Massie B (1990), High-level recombinant protein produc-tion in bioreactors using the baculovirus-insect cell expression system, Biotechnol.Bioeng. 36:1133–1140.
Carpenter WM, Bilimoria SL (1983), A semi-permissive nuclear polyhedrosis virusinfection: characterization of infection kinetics and morphogenesis, Virology130:227–231.
Carstens EB (1982), Mapping the mutation site of an Autographa californica nuclearpolyhedrosis virus polyhedron morphology mutant, J. Virol. 43:809–818.
Carvalho RS, Nascimento AS, Matrangolo WJR (1999), Inseto exotico controla mosca-das-frutas, A Lavoura 628:40–43.
Castro MEB, Souza ML, Araujo S, Bilimoria, SL (1997), Replication of Anticarsiagemmatalis nuclear polyhedrosis virus in four lepidopteran cell lines, J. Invertebr.Pathol. 69:40–45.
Chakraborty S, Reid S (1999), Serial passage of a Helicoverpa armigera nucleopolyhe-drovirus in Helicoverpa zea cell cultures, J. Invertebr. Pathol. 73:303–308.
Chakraborty S, Monsour C, Teakle R, Reid S (1999), Yield, biological activity, andfield performance of a wild-type Helicoverpa nucleopolyhedrovirus produced inH. zea cell cultures, J. Invertebr. Pathol. 73:199–205.
Chao YC, Hamblin M, Wood HA (1990), Physical map of Hz-1 baculovirus genomefrom standard and defective interfering particles, J. Gen. Virol. 71:1265–1270.
Elam P, Vail PV, Schreiber F (1990), Infectivity of Autographa californica nuclearpolyhedrosis virus extracted with digestive fluids of Heliothis zea, Estigmeneacrea, and carbonate solutions, J. Invertebr. Pathol. 55:278–283.
EMBRAPA (2002), Relatorio Ambiental, EMBRAPA, Brasılia, DF, Brazil, p. 67.Faulkner P, Henderson JF (1972), Serial passage of a nuclear polyhedrosis disease virus
of the cabbage looper (Trichoplusia ni) in a continuous tissue culture cell line,Virology 50:920–924.
Federici, B. A. (1986), Ultrastructure of baculoviruses, In: Granados RR, Federici BA(Eds), The Biology of Baculoviruses: Biological Properties and Molecular Biology,CRC Press, Boca Raton, FL, pp. 61–88.
Fraser MJ, Hink WF (1982), The isolation and characterization of the MP and FPplaque variants ofGalleria mellonella polyhedrosis virus, Virology 117:366–378.
Fraser MJ, Smith GE, Summers MD (1983), Acquisition of host cell DNA sequencesby baculovirus: relationship between host DNA insertion and FP mutants ofAutographa californica and Galleria mellonella nuclear polyhedrosis viruses,Virology 47:287–300.
Fraser MJ, Brusca JS, Smith GE, Summers MD (1985), Transposon-mediated mutagen-esis of a baculovirus, Virology 145:356–361.
Friesen PD, Miller LK (2001), Insect viruses, In: Knipe DM, Howley PM (Eds), Fields’Virology, 4th Ed., Lippincott Williams & Wilkins, Philadelphia, pp. 599–621.
Godwin GP, Danner DJ, Gorfien SF (1996), Development of concentrated nutrientsupplements to enhance recombinant protein expression in BEVS, BIOT 99,
Bioinsecticides 471

Abstracts of the 211th American Chemical Society National Meeting, March24–28, New Orleans, LA.
Goodman CL, McIntosh AH, El Sayed GN, Grasela JJ, Stiles B (2001), Production ofselected baculoviruses in newly established lepidopteran cell lines, In Vitro Cell.Dev. Biol. (Animal) 37:374–379.
Granados RR, Federici BA (1986), The Biology of Baculoviruses, vol. 2, CRC Press,Boca Raton, FL.
Hajos JP, Pijnenburg J, Usmany M, Zuidema D, Zavodszky P, Vlak JM (2000), Highfrequency recombination between homologous baculoviruses in cell culture, ArchVirol. 145:159–164.
Harrap KA (1972), The structure of nuclear polyhedrosis viruses. III Virus assembly,Virology 50:133–139.
Harrison RL, Summers MD (1995), Biosynthesis and localization of the Autographacalifornica nuclear polyhedrosis virus 25K gene product, Virology 208:279–288.
Hashimoto Y, Hatanaka E, Ishizaki A, Matsumoto T (1993), Production of defectivegenomes of the Bombyx mori nuclear polyhedrosis virus by serial passage throughcultured cells, Jpn J. Appl. Entomol. Zool. 37:240–243.
Heldens JG, van Strien EA, Feldmann AM, Kulcsar P, Munoz D, Leisy DJ, ZuidemaD, Goldbach RW, Vlak JM (1996), Spodoptera exigua multicapsid nucleopoly-hedrovirus deletion mutants generated in cell culture lack virulence in vivo, J.Gen. Virol. 77:3127–3134.
Hink WF, Vail PV (1973), A plaque assay for titration of alfalfa lopper nuclearpolyhedrosis virus in a cabbage lopper (TN 368) cell line, J. Inverteb. Pathol.22:168–174.
Huang AS, Baltimore D (1977), Defective interfering animal viruses, In: Fraenkel-Conrat H, Wagner RR (Eds), Comprehensive Virology: Regulation and Genetics,Plenum Press, New York, pp. 73–116.
IBGE (2005), Levantamento Sistematico da Producao Agrıcola Disponıvel em. Avail-able at: http://www1.ibge.gov.br/home/presidencia/noticias/noticia_visualiza.php?id_noticia¼423&id_pagina¼1 (accessed September 2006).
Ignoffo CM, Hostetter DL, Shapiro M (1974), Efficacy of insect viruses propagated invivo and in vitro, J. Invertebr. Pathol. 24:184–187.
Jarvis AW (1997), Baculovirus expression vectors. In: Miller LK (Ed.), The Baculo-viruses, Plenum Press, New York, pp. 389–431.
Katsuma S, Noguchi Y, Zhou CL, Kobayashi M, Maeda S (1999), Characterization ofthe 25K FP gene of the baculovirus Bombyx mori nucleopolyhedrovirus: implica-tions for post-mortem host degradation, J. Gen. Virol. 80:783–791.
Kikhno I, Gutierrez S, Croizier L, Croizier G, Ferber, ML (2002), Characterization ofpif, a gene required for the per os infectivity of Spodoptera littoralis nucleopoly-hedrovirus, J. Gen. Virol. 83:3013–3022.
King LA, Possee RD (1992), The Baculovirus Expression System: A LaboratoryGuide, Chapman & Hall, London.
Kool M, Voncken JW, van Lier FL, Tramper J, Vlak JM (1991), Detection and analysisof Autographa californica nuclear polyhedrosis virus mutants with defectiveinterfering properties, Virology 183:739–746.
Lee HY, Krell PJ (1992), Generation and analysis of defective genomes of Autographacalifornica nuclear polyhedrosis virus, J. Virol. 66:4339–4347.
Liu HS, Bilimoria SL (1990), Infected cell specific protein and viral DNA synthesis inproductive and abortive infections of Spodoptera frugiperda nuclear polyhedrosisvirus, Arch Virol. 115:101–113.
Lua LHL, Pedrini MRS, Reid S, Robertson A, Tribe DE (2002), Phenotypic andgenotypic analysis of Helicoverpa armigera nucleopolyhedrovirus serially pas-saged in cell culture, J. Gen. Virol. 83:945–955.
472 Animal Cell Technology

Lua LHL, Nielsen LK, Reid S (2003), Sensitivity of Helicoverpa armigera nucleopoly-hedrovirus polyhedra to sodium dodecyl sulfate, Biol. Control 26:57–67.
Lynn DE (1994), Enhanced infectivity of occluded virions of Gypsy Moth nuclearpolyhedrosis virus for cell cultures, J. Invertebr. Pathol. 63:268–274.
Lynn DE (1999), Comparison of cell line maintenance procedures on insect cells usedfor producing baculoviruses, In Vitro Cell Dev. Biol. (Animal) 35:248–251.
Lynn DE (2003a), Comparative susceptibilities of insect cell lines to infection by theocclusion-body derived phenotype of baculoviruses, J. Invertebr. Pathol. 83:215–222.
Lynn DE (2003b), Comparative susceptibilities of twelve insect cell lines to infectionby three baculoviruses, J. Invertebr. Pathol. 82:129–131.
McIntosh AH, Ignoffo CM, Carlo M (1988), Effect of larval extract and protease K onthe in vitro infectivity of Heliothis zea nonoccluded and alkali-liberated virions,Appl. Ent. Zool. 23:175–180.
Mackinnon EA, Henderson JF, Stoltz DB, Faulkner P (1974), Morphogenesis ofnuclear polyhedrosis virus under conditions of prolonged passage in vitro,J. Ultrastruct. Res. 49:419–435.
Maiorella B, Inlow D, Shauger A, Harano D (1988), Large-scale insect cell culture forrecombinant protein production, Bio-Technology 6:1406–1410.
Miltenburger HG, Naser WL, Harvey JP, Huber J, Huger AM (1984), The cellularsubstrate: a very important requirement for baculovirus in vitro replication,Z. Naturforsch. 39:993–1002.
Moscardi F (1993), Soybean integrated pest management in Brazil, FAO Plant Protec-tion Bulletin 41:91–100.
Moscardi F (1999), Assessment of the application of baculoviruses for control ofLepidoptera, Annu. Rev. Entomol. 44:257–289.
Moscardi F, Santos B (2005), Producao comercial do nucleopoliedrovirus de Anticarsiagemmatalis Huber (Lep.: Noctuidae) em laboratorio, 9o Simposio de ControleBiologico (Siconbiol 2005), Recife, PE.
Moscardi F, Souza ML (2002), Baculovırus para o controle de pragas: Panaceia ourealidade? Biotecnologia Ciencia & Desenvolvimento 24:22–29.
Nguyen B, Jarnagin K, Williams S, Chan H, Barnett J (1993), Fed-batch culture ofinsect cells: a method to increase the yield of recombinant human nerve growthfactor (rhNGF) in the baculovirus expression system, J. Biotechnol. 31:205–217.
Pedrini MRS, Wolff JLC, Reid S (2004), Fast accumulation of few polyhedra mutantsduring passage of a Spodoptera frugiperda multicapsid nucleopolyhedrovirus(Baculoviridae) in Sf9 cell cultures, Ann. Appl. Biol. 145:107–112.
Pedrini MRS, Nielsen LK, Reid S, Chan LCL (2005), Properties of a unique mutant ofHelicoverpa armigera single-nucleocapsid nucleopolyhedrovirus that exhibits apartial many polyhedra and few polyhedra phenotype on extended serial passa-ging in suspension cell cultures, In Vitro Cell Dev. Biol. (Animal) 41:289–297.
Pijlman GP, Born, EVD, Martens DE, Vlak JM (2001), Autographa californicabaculoviruses with large genomic deletions are rapidly generated in infected insectcells, Virology 283:132–138.
Popham HJR, Bischoff DS, Slavicek JM (2001), Both Lymantria dispar nucleopoly-hedrovirus Enhancin genes contribute to viral potency, J. Virol. 75:8639–8648.
Potter KN, Faulkner P, Mackinnon EA (1976), Strain selection during serial passage ofTrichoplusia ni nuclear polyhedrosis virus, J. Virol. 18:1040–1050.
Rhodes DJ (1996), Economics of baculovirus-insect cell production systems, Cyto-technology 20:291–297.
Rohrmann GF (1999), Nucleopolyhedrovirus, In: Granoff A, Webster RG (Eds),Encyclopedia of Virology, Academic Press, New York, pp. 146–152.
Rollinson WD, Lweis FB, Waters WE (1965), The successful use of a nuclearpolyhedrosis virus against the gypsy moth. J. Invertebr. Pathol. 7:515–517.
Bioinsecticides 473

Russell RQL, Rohrmann GF (1993), A 25-kDa protein is associated with the envelopesof occluded baculovirus virions, Virology 195:532–540.
Santos B (2003), Avancos na producao massal de lagartas de Anticarsia gemmatalisHubner 1818 (Lepidoptera: Noctuidae) infectadas com o seu vırus de poliedrosenuclear, em laboratorio e do bioinseticida a base desse vırus, Tese de Doutorado,Universidade Federal do Parana, Curitiba, PR.
Schlaeger EJ (1996), Medium design for insect cell culture, Cytotechnology 20:57–70.Slavicek JM, Hayes-Plazolles N, Kelly ME (1995), Rapid formation of few polyhedra
mutants of Lymantria dispar multinucleocapsid nuclear polyhedrosis virus duringserial passage in cell culture, Biol. Control. 5:251–261.
Slavicek JM, Mercer MJ, Kelly ME, Hayes-Plazolles N (1996), Isolation of a Baculo-virus variant that exhibits enhanced polyhedra production stability during serialpassage in cell culture, J. Invertebr. Pathol. 67:153–160.
Sohi SS, Percy J, Arif BM, Cunningham JC (1984), Replication and serial passage of asingly enveloped baculovirus of Orgyia leucostigma in homologous cell lines,Intervirology 21:50–60.
Szewczyk B, Hoyos-Carvajal L, Paluszek M, Skrzecz I, Souza LM (2006), Baculo-viruses – re-emerging biopesticides, Biotechnol. Adv. 24:143–160.
Vail PV, Romine CL, Vaughn JL (1979), Infectivity of nuclear polyhedrosis virusextract with digestive juices, J. Invertebr. Pathol. 33:328–330.
Vicente JR, Goncalves JS, Martin NB, Souza SAM (2003), Balanca comercial dosagronegocios, Janeiro a Setembro de 2003. Available at: http://www.iea.sp.gov.br/out/verTexto.php?codTexto¼1533 (acessed September 2006).
Volkman LE, Summers MD, Hsieh CH (1976), Occluded and non-occluded nuclearpolyhedrosis virus grown in Trichoplusia ni: comparative neutralization compara-tive infectivity, and in vitro growth studies, J. Virol. 19:820–832.
Wang HH, Fraser MJ, Cary LC (1989), Transposon mutagenesis of baculoviruses:analysis of TFP3 lepidopteran transposon insertions at the FP locus of nuclearpolyhedrosis viruses, Gene 81:97–108.
Wang P, Granados RR, Shuler ML (1992), Studies on serum-free culture of insect cellsfor virus propagation and recombinant protein production, J. Invertebr. Pathol.59:46–53.
Wickham TJ, Davis T, Granados RR, Hammer DA, Shuler ML, Wood HA (1991),Baculovirus defective interfering particles are responsible for variations in recom-binant protein production as a function of multiplicity of infection, Biotechnol.Lett. 13:483–488.
Winstanley D, Crook NE (1993), Replication of Cydia pomonella granulosis virus incell cultures, J. Gen. Virol. 74:1599–1609.
Winstanley D, O’Reilly DR (1999), Granuloviruses, In: Granoff A, Webster RG (Eds),Encyclopedia of Virology, 2nd Ed., Academic Press, New York, pp. 140–146.
Wood HA (1980), Isolation and replication of an occlusion body-deficient mutant ofthe Autographa californica nuclear polyhedrosis virus, Virology 105:338–344.
Yanase T, Hashimoto Y, Matsumoto T (1998), Analysis of defective genomes ofBombyx mori nucleopolyhedrovirus generated by serial undiluted passage in cellculture, Acta Virol. 42:65–70.
474 Animal Cell Technology

20Cell therapies and stemcellsHamilton da Silva Jr and Radovan Borojevic
20.1 Introduction
Cell therapy is a medical procedure that rebuilds structures and restoresfunctions of deteriorated tissues or organs by stem cells. This approachis feasible in treatments of tissue dysfunction generated by trauma,infectious disease, degenerative processes caused by natural fatigue orenvironmental insults, or a natural consequence of senescence. The cell-mediated regenerative medical interventions have a number of technicaland biological limitations, which have stimulated new studies in bio-logical processes and engineering. The advances in these two domainshave created a multidisciplinary new field of biotechnology and bioengi-neering. The innovative work in this field has the potential for improv-ing the quality of life of humans and significantly decreasing healthcarecosts. The traditional use of cell therapy has been in bone marrowtransplantation and treatment of autoimmune diseases. More recently,cell therapies have been applied with success in reparative surgery ofsoft tissues, skin and mucosa, peripheral nerve lesions, orthopedicsincluding degenerative processes and trauma, angiogenesis, heart dis-eases, and stroke.
The application of cell therapies is based on histological (homotopicor heterotopic) and immunological (autologous transplants, allotrans-plants or xenotransplants) principles. Homotopic therapies are definedas procedures that use cells for repair and regeneration of the tissuefrom which they have been harvested. Good examples of homotopictherapies are: skin repair with in vitro expanded epidermal cells, isola-tion and implantation of pancreatic Langerhans islets (Eliaschewitz etal., 2004), and bone marrow aspiration to restore the hematopoietictissue (Shizuru et al., 2005). Heterotopic therapies use stem cellsobtained from a source different from that in which they are used. Themost frequent source of stem cells used in repair of peripheral tissues isbone marrow. However, it is now known that many tissues, such asadipose or blood vessel walls, harbor pluripotent stem cells that can beused in repair and regeneration. This procedure depends upon thepluripotency of stem cells or their transdifferentiation, and the under-lying molecular mechanisms are not well understood. The paracrineeffect of implanted cells that may activate the resident cell progenitors

has to be taken into consideration, as well as modification of theintercellular environment following cell injection.
Autologous transplants involve the transfer of cells, tissues, or organsfrom the same individual. Conversely, allotransplants or allogeneictransplants use cells from different individuals within the same species.Xenotransplants involve transplantation or temporary use of organs ortissues from a different species (e.g. porcine to human). In cases ofallotransplants and xenotransplants, the implanted cells are necessarilyidentified as foreign by the receptor’s immune system, which triggers animmune rejection process. In the case of bone marrow transplantation,the new immune system will be formed by transplanted cells of thedonor. Therefore, the rejection will be donor versus receptor (graftversus host disease, GVHD). Allotransplants and xenotransplants aremaintained by immunosuppressive therapies, which are aggressive andhave to be maintained for long periods. Notwithstanding this drawback,allogeneic transplants are necessary to correct pathologies associatedwith modifications in the genome, mutations leading to cancer, or inwhich the patient’s cells are not able to promote repair and tissueregeneration.
Heterotopic autologous therapies are at present the most frequentlyexplored in basic, preclinical, and clinical research. Since 1990, the multi-potency of adult stem cells, mainly from the bone marrow, has allowedthe possibility of repair and regeneration of different tissues using the cellsof the patient. The best example of heterotopic autologous therapy is theuse of stem cells from the bone marrow in the treatment of cardiacischemia. The rationale for this application is the capacity of such stemcells to differentiate in situ into cell lineages of the receptor site. The maingoal of this kind of therapy is to offer tissue repair as close as possible tothe physiologically normal tissue without restrictions of histocompatibil-ity, which is a problem in allotransplants and xenotransplants. It is hopedthat in the future these therapies will be able to restore an entire organ,such as pancreas, heart, or kidney, without the immune rejection and therequired immunosuppressive treatments.
20.2 Primary material
The concept of cellular therapy involves manipulation and use of cells as aprimary material, and this requires extensive knowledge of their structureand function (Orkin, 2000). A cell from any part of an organism does notexist as an isolated entity. It coexists in a three-dimensional system, highlyorganized and physiologically dependent upon the reciprocity of cell–celland extracellular matrix–cell interactions. The understanding of all theelements related to the organization of a tissue structure is the majorchallenge for biological engineering. The tissue structures must be recon-structed, or at least equivalent structures have to be generated, to granttissue function, using essentially three elements: the cells, the molecularmediators that promote and control cell growth, differentiation and tissueintegration, as well as the three-dimensional matrices or scaffolds thatprovide the spatial organization.
476 Animal Cell Technology

20.2.1 Stem and mature cells
Any stem cell is defined by being able to maintain its own population byself-renewal and to differentiate into one or several types of mature fullydifferentiated cells. Stem cell proliferation can be modulated between lowand high proliferation kinetics. Embryonic stem cells have a high prolif-eration rate, since they must rapidly construct an entire new organism.Adult stem cells are generally quiescent or proliferate slowly, but they canbe mobilized upon demand, and induced to actively proliferate, as occurswith hematopoietic stem cells (Kondo et al., 2003). The properties of stemcells are associated with their ability to undergo symmetrical or asymme-trical division (Figure 20.1). Classical symmetrical divisions are operationalin the self-renewal or expansion of the original stem cell pool. Asymme-trical division depends upon the existence of intracellular segregatedmicrodomains and organization of genetic elements, as observed in ovo-cytes. This organization allows micro-compartmentalized elements to bepartially or totally segregated during cytoplasm division upon mitosis.Thus, a stem cell (mother cell) in mitotic division can generate an identicalunit and another one with a different profile (daughter cell), which isgenerally engaged and committed into differentiation along a requiredpathway.
Differentiation
Self-renewal
Endosteal stromal cell
Subendosteal stromal cell
Asymmetric division
Figure 20.1
Schematic representation of an asymmetric cell division. This figure shows ahematopoietic stem cell under the influence of cell components within its niche.Between the stromal endosteal and subendosteal cell layers, the hematopoieticstem cell is stimulated into distinct polarities that split cytoplasmic componentsinto microdomains. The cell division that is able to promote a different distributionof these intracellular elements, generates distinct offspring. The asymmetricdivision explains the phenomena of simultaneous self-renewal and differentiation.
Cell therapies and stem cells 477

Stem cells can be characterized into three main classes: embryonic,germinal, and somatic or adult stem cells. Embryonic stem cells (ESCs) arederived from early stages of an embryo, from the morula, or from theinner cell mass of the blastocyst. Both are able to produce an entireorganism. From the morula, the source of cells can be derived duringblastic cleavages, which occur just after fertilization. Each cell up to thestage of 2 cells in humans, and up to 32 cells in animals, depending uponthe species, is able to generate a complete new embryo. On the other hand,stem cells can be harbored by isolating the inner cell mass of blastocysts.This stage corresponds to the period of implantation into the uterus. Inhumans, they may be obtained from left-over embryos generated by invitro fertilization.
The cells of the inner cell mass can take part in the generation of all thetissues with the exception of the extra-embryonic structures such astrophoblast and placenta. They are the main target of the worldwideresearch on ESCs. To obtain these cells requires disintegration of theblastocyst. This fact has generated ethical and religious questions concern-ing human embryos.
Moreover, scientists are still concerned about how to control the highcapacity of ESCs for proliferation and their apparently erratic differentia-tion. The goal is to be able to control maturation towards a predeterminedcell lineage. These issues have to be solved before the use of ESCs inhumans, particularly because of their high tendency to develop intoteratocarcinomas.
The germinal stem cells or EGCs (embryonic germ cells) are found inreproductive tissues during embryo development. They populate gonadsthat harbor progenitors of gametes. Similar cells are found in male adultgonads. Apparently, they have the potential to generate multiple celllineages, but the disadvantage for therapy is the difficulty of obtainingthese cells, which would involve invasive surgery during embryo develop-ment. This is associated with further ethical questions.
Cells derived from an embryo implanted into a recipient are recog-nized as non-self, and upon transplantation they are identified by therecipient’s immune system. Thus, transplantation causes rejection, andthis limits their use in cell therapy. Advances in reproductive techniqueshave emerged recently with the possibility of therapeutic cloning as anew option for cell therapy. The proposal is to substitute the nucleus ofan ovocyte or an embryonic cell established in vitro, with the nucleus ofa somatic cell from the recipient, generating new ESC lineages. Theovocyte or embryonic progenitor cells will be able to combine thecapacity to generate any tissue within the host genome, with the appro-priate immunologic characteristics to prevent rejection. However, thedefects of the genome will also be transferred, thus preventing the use ofthis technique for genomic defects. Nevertheless, the extensively manipu-lated nuclei generally develop unpredictable random chromosomal de-fects, which may modify the cellular phenotypes. However, in view ofthe size of the genome and the interactivity of its diverse regions, anassessment of the potential dangers of any alteration is not feasible, andthe medical risk of using progenitor cells generated by cloning in human
478 Animal Cell Technology

beings is unacceptably high. Furthermore, human cloning is technicallydifficult and also involves many religious and ethical dilemmas. There-fore, somatic or adult stem cells seem to be the best current solution forcellular therapies.
Somatic (from the Greek somatikos ¼ bodily) stem cells are presentin almost all the tissues (Jiang et al., 2002a). The most well-knownsystem is the hematopoietic tissue. The hematopoietic system in adultsis lodged within the bone marrow and its stem cells are specificallylocated in the endosteal region, that is, close to the internal bonesurface. Moreover, bone marrow has at least three stem cell lineages:hematopoietic, mesenchymal, and endothelial stem cells (Figure 20.2).Among these, mesenchymal stem cells display the broadest capacity fordifferentiation. Mesenchymal cells are associated with the inner cellmass and are not in direct contact with the external environment.Although these cells are most frequently of mesodermal origin, they canalso be derived from the ectoderm and endoderm, in a process termedthe ‘‘epithelio-mesenchymal transition.’’ Mesenchymal stem cells areable to restore tissue structural elements, called the cellular stroma andthe corresponding extracellular matrix. They influence differentiation ofother stem cells, as described below. Descriptions of many mesenchymalcell populations in different tissues can be found in the scientificliterature, but there are controversies as to whether they belong todifferent lineages (Figure 20.2). The fact that mesenchymal cell progeni-tors can circulate in blood makes this question even more difficult.Mesenchymal stem cells are apparently pluripotent and, therefore, theycan generate many cell types, with the possible exception of germlinecells (Jiang et al., 2002b).
Studies of stem cell progression towards the completely differentiatedmature cells have already identified several intermediary precursors, orga-nized in a cascade (Shizuru et al., 2005). The best known and studiedcellular differentiation cascade is the hematopoietic system (Figure 20.3).Within hematopoiesis, it is possible to identify many intermediary pre-cursors between the hematopoietic stem cell and mature blood cells. Thisidentification is based mainly on the phenotypic profile of cellular surfaceproteins, using flow cytometry as the main tool. This is a relatively simpletechnique that involves coupling a monoclonal antibody (mAb) with afluorescent marker (fluorochrome). In this way, diverse cellular markerscan be combined and thus a cellular subpopulation can be defined, asshown in Figure 20.3.
The ideal protocol for tissue regeneration is the use of autologous cellsin the heterotopic context. This approach allows the stem cells to producea tissue or organ for autologous repair and tissue regeneration. The firststep is to define the primary source and to identify the cells to betransplanted. Later, it is necessary to ensure that the transplanted cellsrecognize the target tissue and acquire the specific functions. This is theobject of cell therapy in vivo, or bioengineering ex vivo or in vitro. It isnecessary to understand the physiology of the cells to be generated. Thatis: how, where, when, and what it is necessary to do to convert the stemcells into functional differentiated tissue cells.
Cell therapies and stem cells 479

Ep
ibla
st
cell
Ec
tod
erm
icp
rog
en
ito
r
En
do
derm
icp
rog
en
ito
r
Meso
derm
al
pro
ge
nit
or
Mesen
ch
ym
al
pre
cu
rso
r
PD
MP
C
MA
PC
MS
C
Pe
ricy
te
En
do
thelial
Lym
ph
ati
c
pro
gen
ito
r
pre
cu
rso
r
Meso
-an
gio
bla
st
Hem
an
gio
bla
st
Hem
ato
po
ieti
cp
rog
en
ito
r(L
T-H
SC
)
?
?
?
?
??
?
?
?
?
?
?
??
mic
eLi
nK
DR
Bra
chyu
ryC
D41
CD
105
-/lo
-
+
+ +
mic
eLi
nK
DR
CD
117
CD
34-/lo
+
+ +B
rach
yury
+
mic
eLi
nK
DR
CD
117
CD
106
CD
31-/lo
+
+ + +
Tie
-2+
mic
eLi
nK
DR
CD
117
CD
144
CD
31S
ca-1
vWF-/
lo
+
+ + + +
+
Tie
-2C
D14
6+
+
CD
34K
DR
CD
117
CD
44C
D90
Sca
-1S
SE
A-I
CD
13
+ lo
+ + lo lo
h
hi
Tie
-2C
D45
+ +
CD
13C
D44
CD
90C
D73
CD
105
HLA
-II+ + + +
+ +
Lin
MH
C-I
I
-
-
Lin
CD
34C
D31
CD
45H
LA-D
R
-
- - -
-
mic
eLi
nK
DR
CD
144
CD
31vW
F-/lo
+
+ + +
Tie
-2C
D14
6+
+
hu
mLi
nK
DR
CD
133
CD
117
CD
34
CD
144
CD
31C
XC
R4
vWF-/
lo
+
+ hi + +
+
++ +C
D14
6
hu
mLi
nK
DR
CD
133
CD
34
CD
144
CD
31C
XC
R4
vWF-/
lo
+
- + +
+
++ +C
D14
6
Oste
ob
last
Ch
on
dro
bla
st
Ten
do
cy
te
Ad
ipo
cy
te
Fib
rob
last
Sk
ele
tal
mu
scle
Ca
rdia
cm
us
cle
Olig
od
en
dro
cyte
CB
F1
Op
nO
cnA
LP
CB
F1
Co
lI/IX
+
FG
F-R
sB
MP
-12
RC
ol.I
I+
-SM
ATr
opo
myo
sin
+
CD
100
CD
81G
M-1
+kx-2
.5cT
n-I
c-T
n-T
-MH
C+
PPA
R-
LP
L2+
+
Co
lIF
GF
-Rs
?+
+
Sm
oo
thm
us
cle
Re
tic
ulo
cy
te(m
yo
fib
rob
las
t)
-SM
AS
M2
2D
esm
in-M
HC
+
=To
tipot
ent
!?
mic
e
hu
m
hu
m
Str
o-1
CD
49C
D54
CD
105
CD
56C
D10
6C
D90
+ lo lo
+
lo
+
+
CD
73C
D14
6�
α+
+
Str
o-1
CD
13H
LA-I
CD
29C
D10
5C
D33
CD
166+ + + +
+
+
+
Lin
CD
34C
D10
4C
D45
HLA
-DR
CD
133
CD
62L
-
- - -
-
- -
Lin
CD
34C
D14
CD
45-
- - -
bo
ne
marr
ow
um
bilic
al
co
rd
En
do
thelial
pre
cu
rso
rE
nd
oth
elial
Ce
ll
γ γ γ
γ γ
γ
++
++
+
++
+
γ+
++
γ+
++
++
480 Animal Cell Technology

Figure
20.2
Schematicrepresentationofthemesench
ymalandendothelialcascadeofdifferentiationin
amurinemodel(mice)andin
humans(hum).All
mesench
ymalandendothelia
lce
llsare
negativefortheantigenCD45.Basedonthis,thedynamicsofsurface
antigenexpressionalong
developmentofdifferentmature
cellsderive
dfrom
themesench
ymalandendothelialsystemscanbeobserved.Roundedarrowsindicate
self-
renewalpotential.Smooth,thinnerarrowsindicate
directionsofce
llulardifferentiation,anddottedarrowsindicate
possible
hierarchies,butyet
tobeprove
dexperimentally
.Thequestionmarksindicate
lack
ofdata
onthepathwayoronce
llularidentity.TheidentificationofCDs(clusters
ofdifferentiation)andotherantigence
llmarkerscanbefoundin
thelistofabbreviations:LT
-HSC,long-term
hematopoieticstem
cell;EC,
endothelialce
ll;PDMPC,place
ntal-derive
dmesench
ymalprogenitorce
ll;MSC,mesench
ymalstem
cell;MAPC,mesench
ymaladultprogenitor
cell.
Cell therapies and stem cells 481

LT-H
SC
ST-H
SC
MP
P
CM
P
CL
P
mic
eLi
nC
D11
7C
D90
Sca
-1C
D13
5C
D13
3V
EG
F-R
1C
D31-/
lo
hi lo hi
- +
+
+
mic
eLi
nC
D11
7S
ca-1
CD
90C
D12
7C
D34
CD
16/3
2
-/lo
lo
+ +
-
mic
eLi
nC
D11
7S
ca-1
CD
90C
D12
7C
D34
CD
16/3
2
-/lo
lo
-
+
lo
mic
eE
PO
-RC
D1
27C
D3
4C
D1
6/32
GM
-CS
F-R- -
+/h
i lo
+
mic
e+
hu
m
EP
O-R
CD
127
CD
34
CD
16/3
2C
D11
0
- -
+/h
i lo
+
hu
mLi
nC
D13
3C
D7
CD
45R
A
-
+
+
hi
hu
mLi
nC
D13
3C
D33
CD
13
-
+
+ +h
um
CD
123
CD
117
CD
34C
D13
CD
33
hi + + + +
mic
eLi
nC
D11
7S
ca-1
CD
90C
D13
5C
D13
3
-/lo
hi hi lo
+ +
mic
eLi
nC
D11
7C
D90
Sca
-1C
D13
5
-/lo
hi - hi
+
hu
mLi
nC
D11
7C
D90
CD
133
-
-/lo
+ +
GM
P
ME
P
Pro
-T
Pro
-NK
Tly
mp
ho
cyte
NK
cell
Bly
mp
ho
cyte
Den
dri
tic
lym
ph
oid
Den
dri
tic
mye
loid
As
tro
cyte
Oste
ocla
st
Mac
rop
hag
e
Ne
utr
op
hil
Eo
sin
op
hil
Ba
so
ph
il
Mas
tc
ell
Pla
tele
ts
Ery
thro
cyte
Pro
-B
Pro
-DC
Mon
ocyt
e
Po
lym
orp
honu
clea
r
Meg
aka
ryo
cyte
Re
ticu
locy
te(e
ryth
rocy
te)
mic
eh
umC
D4
4C
D25
CD
117
CD
34
CD
1a
CD
38C
D11
7
+-
+
+-
--
mic
eh
umC
D3
CD
16N
K1.
1D
X-5
CD
3C
D16
CD
56
-+
++
-+
+
mic
eh
umC
D11
cC
D11
bC
D8
+-
+
+C
D11
cH
LA
-DR
CD
8+
mic
eh
umC
D11
cC
D11
bC
D8
++
-
-C
D11
cH
LA
-DR
CD
8+
mic
eh
umC
D11
bC
D60
GFA
P+
++
+C
D1
4C
D6
0G
FAP
++
mic
eh
umC
D11
bG
r-1
CD
16/3
2F
4/8
0+
lo/+
++
+C
D11
bC
D1
4C
D64
++
mic
eh
umC
D11
bG
r-1
IgE
-R7/
4+
++
+
+C
D6
6aC
D35
CD
87Ig
E-R
++
+
mic
ehu
mIL
-5R
Gr-
1Ig
E-R
MM
P-9
++
++
CD
14C
D1
25Ig
E-R
++
+
mic
ehu
mC
D11
bG
r-1
IgE
-RM
MC
P-8
++
++
CD
11b
CD
14
IgE
-RC
D2
03c
++
++
mic
ehu
mC
D11
bG
r-1
IgE
-RM
MC
P-4
++
++
CD
34C
D1
4Ig
E-R
IC
D12
3+
++
+
mic
ehu
mTe
r-11
9+
CD
235
aC
D71
+-/
lo
mic
eh
umC
D1
35M
HC
-II
CD
11c
CD
4H
LA-D
RC
D7
CD
3
+
+
mic
e+
hum
CD
3C
D4/
8TC
R+
mic
e+
hum
CD
19
BC
R+
+
mic
e+
hum
CD
11b
CD
11c
RA
NK
+-
+
mic
e+
hum
CD
41+
mic
ehu
mC
D11
0E
PO
-RC
D11
0E
PO
-RC
D71
++
+
mic
eh
umC
D11
0E
PO
-RC
D11
0C
D34
CD
38C
D41
+ ++
++
mic
eh
umC
D4
3B
220
CD
34
CD
10
CD
19T
dT
++
++
--
mic
eh
umC
D1
22
NK
1.1
DX
-5cC
D3
CD
7
++
+
++
G-C
SF
-R+
M-C
SF
-R+
++
+ +
++
-
-lo
++
482 Animal Cell Technology

Figure
20.3
Schematicrepresentationofthehematopoieticcascadein
miceandhuman(hum).Allthece
llsofthehematopoieticsystem
are
positive
for
antigenCD45.Basedonthis,thedynamicsofsurface
antigenexpressionalongdevelopmentofdifferentmature
cellsderive
dfrom
the
hematopoieticstem
cellsystem
canbeobserved.Roundedarrowsindicate
self-renewalp
otential.Smooth
thinnerarrowsindicate
directionsof
cellulardifferentiation.TheidentificationofCDs(clusters
definition)andotherantigence
llmarkers
are
listedin
theglossary.(LT-H
SC-long
term
hematopoieticstem
cell;ST-H
SC-shortterm
hematopoieticstem
cell;
MPP-multipotentprogenitor;CLP
-co
mmonlymphoid
precu
rsor;CMP-co
mmonmyeloid
precu
rsor;GMP-granulocyte-m
onocyte
precu
rsor;MEP-megacaryocyte-erythrocyte
precu
rsor;T-T
lymphocyte;B-Blymphocyte;NK-naturalkillerce
ll;DC-dendriticce
ll).
Cell therapies and stem cells 483

20.2.2 Tissue environment and specific niches
The three-dimensional organization of a tissue is fundamental for thephysiology and behavior of any cell. The local and peculiar structure of atissue is called the tissue microenvironment (Spradling et al., 2001). Thespatial architecture around a cell is associated with the interstitial compo-nents, or extracellular matrix, which consist of structural glycoproteins,carbohydrates (collagens, elastin, proteoglycans, glycosaminoglycans), andadhesion compounds (fibronectin, laminin, thrombospondin, etc.), perme-ated by biological fluids. The cells have a broad range of accessory surfaceelements, consisting of the glycocalyx, rich in glycoproteins and glycoli-pids that interact with extracellular matrix. Finally, intercellular mediatorssuch as hormones, cytokines, and inflammatory and growth factors allowcellular communication and proliferation control. These mediators interactwith the intercellular matrix, which can generate gradients or hot spotswith high concentrations of molecules that can interact with cell receptorsand provide information on the quality of the tissue and on the necessityto promote repair or regeneration. Cell differentiation is a result of thecombination of all these elements and interactions. The set of thesemolecular interactions characterizes the tissue microenvironment and thisorganization gives identity to a tissue. Since an ectopically transferred cellcan modify its physiological activity in response to the new microenviron-ment, a stem cell of a heterotopic origin differentiates according to theenvironmental stimulus (Kai and Spradling, 2003).
Since tissues are spatially ordered by interfaces with solid supportstructures, blood vessels or external surfaces, the interactions amongdifferent types of cells determine the behavior of cells introduced duringcell therapy. These interactions control differentiation and facilitate theformation of functional structures. It is important that a fraction oftransplanted cells keeps the original properties of immature or stem cells,in order to be able to guarantee the physiological turnover, maintenance oftissue homeostasis, and natural renewal. In this context, the intercellularmediators, such as the chemokines, can guide the migration of thetransplanted cell, directing it into an appropriate niche. The molecularcomposition of these niches allows some of the stem cells to maintain theirpluripotency, while others respond to the demands for new differentiatedcells. In the bone marrow, this niche is composed mainly of osteoblasts.The physical contact of these osteoblasts with hematopoietic stem cells isnecessary to support hematopoiesis (Calvi et al., 2003; Zhang et al., 2003;Balduino et al., 2005; Taichman, 2005).
Once out of the microenvironment, the absence of specific signals forthe retention of multipotency and self-renewal inevitably induces irrever-sible and specific differentiation, leading to the generation of terminallydifferentiated cells. Stem cells thus loose their ‘‘stemness’’ and theirprimitive or undifferentiated identity (reviewed in Cabrita et al., 2003).The understanding of fine controls for the maintenance of stemness is theprimary goal for the development of systems that can sustain expansion ofstem cells. Currently, the great challenge is to understand the complexsystem involved in the modulation of the intrinsic genetic programs of astem cell. Once this information is available, it may be possible by
484 Animal Cell Technology

bioengineering to construct entire fragments of tissues or organs in thelaboratory. These constructs would then be available for implantation intopatients who need repair or regeneration of lost tissues following traumaor degeneration.
20.3 Applications
Many scientific groups are now working on cell therapies based on stemcells. It is difficult to imagine all the possible clinical applications thatcould be developed considering the great potential and plasticity of thesecells. Medicine still lacks immediate and efficient solutions for situationsof trauma, tissue dysfunction, or degeneration. Current knowledge is suchthat it is possible to produce the necessary cell mass in vitro for therapy,or to stimulate growth of tissue cells in vivo. It is also possible to constructin the laboratory, three-dimensional extracellular structures able to pro-duce biological interactions among cellular elements.
20.3.1 Bioexpansion and biostorage
Finding a way around the shortage of primary material is one of the majorchallenges for bioengineering. The most widely studied system is the bonemarrow. Hematopoietic stem cells comprise approximately 0.02% of thetotal cells obtained in a good bone marrow aspirate. A similar fraction isobtained in an umbilical cord blood sample, and a single sample can beused for transplantation in a 40 kg patient (Cohen and Nagler, 2004).Current methods proposed for in vitro hematopoietic stem cell expansionstill represent a complex problem, since induction of proliferation isassociated with the loss of stemness. By contrast, skin therapies areperformed with a small healthy biopsy from the patient, since dissociated,isolated cells can be expanded ex vivo. These expanded cells are useful forregeneration or fulfilling other therapeutic procedures. The same principlecan be applied to mesenchymal cells, which can be expanded in vitro toregenerate bone tissue.
Currently, several strategies for progenitor cell expansion already exist.However, the most advanced protocols for hematopoietic cell expansionstill show limited success. Tests with small volumes may work withconventional culture systems for proliferating blood cells such as lympho-cytes, in T-flasks under a carbon dioxide (CO2)-rich atmosphere, whilehigher volumes are generally used in controlled bioreactors (Nollet al., 2002; Cabrita et al., 2003). In these systems, fine control is necessaryfor all the physicochemical factors, such as pH, temperature, trace ele-ments, cytokines (Noll et al., 2002). Each cell type requires specificconditions.
The key to expanding a stem cell population is to understand therequirements for proliferation without inducing differentiation. In the caseof self-renewal some elements seem to be essential. Examples are thehomeotic gene HOXB4, the cytokines FLT-3L (fms-related tyrosinekinase ligand), LIF (leukemia inhibitor factor), interleukin (IL)-3, VEGF(vascular endothelial growth factor), and proteins of the WNT and
Cell therapies and stem cells 485

NOTCH families, with their ligands (reviewed in Noll et al., 2002;Cabrita et al., 2003; Sorrentino, 2004).
Once it is possible to expand a clinically defined and safe cell lineage fortransplant, it is also necessary to be able to store the viable cells forsubsequent attempts or procedures. This can avoid further surgery on thesame patient. This demands the development of crypreservation methodsfor cells and tissues, involving a tissue bank (blood, skin, bones, cornea,bone marrow, umbilical cord blood, etc.). Cryopreservation must beefficient for long periods of storage, since the frozen cells may be requiredyears after the initial deposit.
20.3.2 Bioengineering
Bioengineering and biomimetics seek to develop tissue scaffolds similar tothe natural ones, in terms of composition and biological behavior. Effortsare being made to develop products and processes that can substitute tissuethat is biocompatible and allows biointegration.
These objectives are being sought for through distinct models ofreparative cell therapies. For example, hydroxyapatite (HA), a naturalbone constituent, can be synthesized to mold or to fill bone (Marcacciet al., 1999a, 1999b). The rational strategy for the use of HA is osteocon-duction and osteoinduction, since it is found in the normal bone tissue andelicits both adhesion and proliferation of bone cells. This fact also favorsthe final goal of cell therapy in the bone system, in which the progenitorsare mesenchymal cell that can differentiate into osteoblasts responsible forthe desired ossification. In the process of production of HA, it is possibleto create a microporous texture that serves to facilitate the mesenchymalcell repopulation with autologous bone marrow source. Moreover, thiscomposition represents an optimum biomimetic system in restorativetherapies. Therefore, it can be produced on an industrial scale, and thebiomaterial interacts well with autologous cell samples.
Another promising example is the use of composite dermo-epidermisplates whose dermis layer comes from plastic surgery waste or post-mortem donation. The skin fragment can be acellularized to eliminate thehisto-incompatible cellular components from donor origin. The processgives an acellular skin structure that can be reconstituted with autologousepithelial stem cells or autologous keratinocytes in vitro. The final dermo-epidermal graft is appropriate to restore surfaces after severe burns orremoval of tattooing, and to fill cavities in plastic and odontologicalsurgeries.
A number of other processes are in continuous development. Clinicalapplications of these therapies in the urogenital and cardiovascular sys-tems, in peripheral and central nervous systems, pancreas, joint cartilagerestoration, etc., are being studied. However, almost all procedures sufferfrom a common limitation: the availability of donor cells. Cell therapieshave to begin with a relatively high number of cells, and stem cells,irrespective of their origin, are always a minor subpopulation in tissues.
486 Animal Cell Technology

20.4 Conclusions and perspectives
Reparative medicine and bioprocess engineering are major issues forcurrent applied biotechnology. Development in these areas is advancingtowards the use of stem cells for therapy. However, the elements andmechanisms involved in the intrinsic and extrinsic biological control ofthese cells are poorly known. All clinical situations performed with auto-logous transplants of stem cells up to now have generally demonstratedimprovement, or total or partial recovery of tissue function. Refiningtechniques in these therapeutic procedures will be necessary to bettercharacterize and to understand the cellular subpopulations that participatein restoring the normal physiology of tissues. Concomitantly, engineeringof biomaterials and the associated nanotechnology are appearing as im-portant tools to speed up this scientific knowledge. The ultimate goal is tobe able to totally or partially generate an organ with normal physiology, ina short time period.
References
Balduino A, Hurtado SP, Frazao P, Takiya CM, Alves LM, Nasciutti LE, El-CheikhMC, Borojevic R (2005), Bone marrow subendosteal microenvironment harboursfunctionally distinct haemosupportive stromal cell populations, Cell Tissue Res.319:255–266.
Cabrita GJ, Ferreira BS, da Silva CL, Goncalves R, Almeida-Porada G, Cabral JM(2003), Hematopoietic stem cells: from the bone to the bioreactor, TrendsBiotechnol. 21:233–240.
Calvi LM, Adams GB, Weibrecht KW, Weber JM, Olson DP, Knight MC, Martin RP,Schipani E, Divieti P, Bringhurst FR, Milner LA, Kronenberg HM, Scadden DT(2003), Osteoblastic cells regulate the haematopoietic stem cell niche, Nature425:841–846.
Cohen Y, Nagler A (2004), Umbilical cord blood transplantation – how, when and forwhom?, Blood Rev. 18:167–179.
Eliaschewitz FG, Aita CA, Genzini T, Noronha IL, Lojudice FH, Labriola L, KroghK, Oliveira EM, Silva IC, Mendonca Z, Franco D, Miranda MP, Noda E, deCastro LA, Andreolli M, Goldberg AC, Sogayar MC (2004), First Brazilianpancreatic islet transplantation in a patient with type 1 diabetes mellitus, Trans-plant. Proc. 36:1117–1118.
Jiang Y, Vaessen B, Lenvik T, Blackstad M, Reyes M, Verfaillie CM (2002a), Multi-potent progenitor cells can be isolated from postnatal murine bone marrow,muscle, and brain, Exp. Hematol. 30:896–904.
Jiang Y, Jahagirdar BN, Reinhardt RL, Schwartz RE, Keene CD, Ortiz-Gonzalez XR,Reyes M, Lenvik T, Lund T, Blackstad M, Du J, Aldrich S, Lisberg A, Low WC,Largaespada DA, Verfaillie CM (2002b), Pluripotency of mesenchymal stem cellsderived from adult marrow, Nature 418:41–49.
Kai T, Spradling A (2003), An empty Drosophila stem cell niche reactivates theproliferation of ectopic cells, Proc. Natl Acad. Sci. U S A 100:4633–4638.
Kondo M, Wagers AJ, Manz MG, Prohaska SS, Scherer DC, Beilhack GF, Shizuru JA,Weissman IL (2003), Biology of hematopoietic stem cells and progenitors:implications for clinical application, Annu. Rev. Immunol. 21:759–806.
Marcacci M, Kon E, Zaffagnini S, Giardino R, Rocca M, Corsi A, Benvenuti A, BiancoP, Quarto R, Martin I, Muraglia A, Cancedda R (1999a), Reconstruction ofextensive long-bone defects in sheep using porous hydroxyapatite sponges, Calcif.Tissue Int. 64:83–90.
Cell therapies and stem cells 487

Marcacci M, Kon E, Zaffagnini S, Visani A (1999b), Use of autologous grafts forreconstruction of osteochondral defects of the knee, Orthopedics 22:595–600.
Noll T, Jelinek N, Schmid S, Biselli M, Wandrey C (2002), Cultivation of hematopoie-tic stem and progenitor cells: biochemical engineering aspects, Adv. Biochem.Eng. Biotechnol. 74:111–128.
Orkin SH (2000), Diversification of haematopoietic stem cells to specific lineages, Nat.Rev. Genet. 1:57–64.
Shizuru JA, Negrin RS, Weissman IL (2005), Hematopoietic stem and progenitor cells:clinical and preclinical regeneration of the hematolymphoid system, Annu. Rev.Med. 56:509–538.
Sorrentino BP (2004), Clinical strategies for expansion of haematopoietic stem cells,Nat. Rev. Immunol. 4:878–888.
Spradling A, Drummond-Barbosa D, Kai T (2001), Stem cells find their niche, Nature414:98–104.
Taichman RS (2005), Blood and bone: two tissues whose fates are intertwined to createthe hematopoietic stem-cell niche, Blood 105:2631–2639.
Zhang J, Niu C, Ye L, Huang H, He X, Tong WG, Ross J, Haug J, Johnson T, FengJQ, Harris S, Wiedemann LM, Mishina Y, Li L (2003), Identification of thehaematopoietic stem cell niche and control of the niche size, Nature 425:836–841.
488 Animal Cell Technology

21Gene therapyCelio Lopes Silva, Karla de Melo Lima,Sandra Aparecida dos Santos, and Jose Maciel Rodrigues Jr
21.1 Introduction
Gene therapy means the introduction of a gene into a cell to correct adefect. This is intended to slow the progression of a disease and conse-quently improve an individual’s quality of life. The availability of thehuman genome map in 2000 was the first major step to enhance thepotential impact of gene therapy as well as cell therapy and tissueengineering (Romano et al 2000). However, establishing these technologiesrequires ex vivo cell cultivation, and one of the challenges is to adapt theculture from the laboratory to a clinically relevant scale. Thus, thedevelopment of animal cell culture technology has been essential foradvances in gene therapy.
21.2 Gene therapy
With the advent of new knowledge in cell and molecular biology, it hasbecome evident that the causes of many human diseases are related tochanges in genes. Genes represent the starting point for all events thatsubsequently lead to changes in expression of proteins in cells. Proteinfunction determines, in turn, the cell phenotype and cell function. Whengenes are changed in such a way that the proteins encoded by them areunable to perform their normal function, a genetic disorder may occur.The cumulative effect of events triggered by atypical or defective genes inan organ leads to the disease phenotype. Gene therapy is a technique usedto correct genetic defects that may cause the development of diseases, andconsists of blocking an undesirably activated gene, or correcting orreplacing the defective gene with a normal gene (Figure 21.1). The diseasesprimarily targeted by human gene therapy are monogenic, that is, thosecaused by defects in a single gene (Anderson, 1998). Since the 1990s, thedevelopment of DNA vaccines has led to the concept of gene therapybeing extended to prophylaxis and treatment of infectious diseases (Brun-nell and Morgan, 1998).
The first step in gene therapy is to identify the gene causing theproblem. Then the appropriate genetic material is introduced into thetarget cells, with the aim of correcting the problem. Two main strategiesare used: (i) in vivo therapy, in which the genetic material is introduceddirectly into the individual by a systemic route, or when possible, at aspecific site; (ii) ex vivo therapy, in which the target cells are treated with

the gene product outside the individual. The cells are expanded and thentransferred back to the patient (Figure 21.2).
The key to successful in vivo gene therapy is the transfer of the geneticmaterial to the target cells or tissues and the effective expression of thegene in question. However, this is a complex process, requiring severalbarriers to be overcome. Ex vivo gene therapy involves the transfer ofgenes to cells maintained in culture and their subsequent transplantationto the target tissue. The cells to be transfected must be available in largeamounts, have a long life after transfer to the host, express the gene ofinterest for a long time period, and not trigger any kind of immuneresponse. The advantages of ex vivo therapy include the possibility ofcharacterizing the modified cell population before transfer. This makes iteasier to introduce the genetic material into the cells and it can be insuredthat the clonal population of cells expresses a high amount of the productencoded by the transgene before transfer back into the patient.
DNA
mRNA
Protein
Protein
A
B
DNA
mRNA
Figure 21.1
In a normal cell, genes are transcribed into messenger RNA (mRNA), andthereafter, translated into proteins with specific functions (A). When the generesponsible for encoding a protein has a defect, this may cause the translation of adefective protein, unable to perform its function and leading to a disease (B). Genetherapy aims to rectify the defect, by blocking, correcting, or replacing the gene.
490 Animal Cell Technology

21.3 Vectors used in gene therapy
The development of vectors applicable in gene therapy has been the objectof many studies. The vectors that have been developed can be divided intotwo categories: synthetic and viral vectors. Synthetic vectors depend ondirect transfer of the genetic information into the target cell, and includeplasmid DNA, naked DNA or DNA associated with some release system.Some may be applied as DNA vaccines (Ferber, 2001; Niidome andHuang, 2002). The viral vectors use the capacity of viruses for infection tointroduce the genetic material into the target cells, and are most widelyused in preclinical and clinical protocols for therapies in which a highlystable transfection is desired. Both systems have advantages and disadvan-tages, which must be considered depending on the intended therapy(Cristiano, 1998).
21.3.1 Viral vectors
The concept of viral vectors is based on the innate capacity of viruses torelease their genetic material into infected cells. However, the biggestconcern in using viruses as gene vectors for therapy is that viral infectionmay lead to undesired effects such as host tissue destruction. This destruc-tion may be caused by the induction of genes whose products are harmfulto the host cell, or by the insertion of the viral genetic material into thehost cell genome, leading to pathogeneses, which could include tumor-
Gene
therapy
ex vivo
Gene
therapy
in vivo
Figure 21.2
Strategies applied to gene therapy. Ex vivo – the target cells are treated with thegene product outside the individual, expanded by cell culture, and then re-introduced into the patient; or in vivo – the genetic material is introduced directlyinto the individual by a systemic route, or, whenever possible, site-specifically.
Gene therapy 491

igenesis. Other disadvantages include the limitation on the size of genesthat viruses can carry, the difficulty of standardizing the production ofviral particles by cell culture, and the higher cost when compared withplasmid DNA production.
The basis for the use of viruses as gene vectors is the possibility ofseparating the components required for replication from those causingdiseases (Hendrie and Russel, 2005). As discussed in Chapters 3 and 18,some initial information is required:
(i) identification of the viral sequence required for replication;(ii) viral particle construction;(iii) viral genome packing;(iv) release of the heterologous gene into the host cell.
Among the viruses widely used for gene therapy are those used toobtain heterologous proteins from animal cells, particularly RNA viruses(retrovirus and lentivirus) and DNA viruses (adenovirus, adeno-associatedviruses, and herpesvirus). Table 21.1 summarizes the advantages anddisadvantages of each virus as a carrier in gene therapy.
Adenoviruses are widely distributed in nature, and infect birds andmany mammals, including man. They cause upper respiratory tract infec-tion, in addition to other infections. Adenoviruses are non-envelopedviruses with a linear genome composed of double-stranded DNA. Sub-types 2 or 5 from subgroup C are predominantly used as vectors in genetherapy. During viral propagation, episomal replication occurs. Thismeans that the virus genome does not integrate to the host genome, thuseliminating the risks of mutagenesis due to genomic insertion. Theadenovirus genome is about 35 kb, from which 30 kb may be replacedwith the transgene. Adenoviral vectors are highly effective upon transduc-tion of target cells, and may be produced in high titre.
Adeno-associated viruses (AVVs) are non-pathogenic human parvo-viruses. The application of these viruses depends on an auxiliary virus,usually an adenovirus. AVVs are able to infect dividing or non-dividing
Table 21.1 Advantages and disadvantages of use of different viral vectors ingene therapy
Viral vectors Advantages Disadvantages
Adenovirus Infection of non-dividing cells Highly immunogenicAttaining high titre in culture Short-term expression
AVV Infection of non-dividing cells Limited integrationInfection of different cell types Short-term expression
HSV Infection of different cell types Attain low titre in cultureCytotoxicityShort-term expression
Lentivirus Attain high titre in culture May cause undesirable effectsPermanent infection ofnon-dividing cells
Retrovirus Integration of viral DNA in thehost genome
Infection of dividing cells only
AVV, adeno-associated virus; HSV, herpes simplex virus.
492 Animal Cell Technology

cells and, in the absence of an auxiliary virus, they may integrate into aspecific site in the host genome. The AVV genome is composed of asingle-stranded DNA molecule. The transgene contained in an AVV maynot exceed 4.7 kb (Zaiss and Muruve, 2005).
Herpes simplex type 1 virus (HSV-1) is a human neurotropic virus, usedas a vector for gene transfer in the nervous system. The HSV genome islinear, composed of a double-stranded, 152 kb DNA molecule, and able tocontain 40–50 kb of a transgene.
Retroviruses represent a large family of enveloped RNA viruses.Endogenous retroviruses have been found in all vertebrate species. Theviral particle contains two copies of viral genomic RNA in a conic nucleus.The viral RNA contains three essential genes, gag, pol, and env. The gaggene encodes the capsid, matrix, and nucleocapsid proteins, which aregenerated by proteolytic cleavage of the precursor protein gag. The polgene encodes the viral enzymes: protease, reverse transcriptase, andintegrase. The env gene encodes the envelope glycoproteins that mediatethe virus entry in the cell. After connecting with the receptors on the cellsurface, the capsid containing the genomic RNA enters the cell by fusingwith the membrane. Thereafter, the genomic RNA is converted intodouble-stranded DNA by viral reverse transcriptase. The DNA is asso-ciated with the viral proteins in a complex that is translocated to thenucleus. An integrase enzyme mediates its integration into the hostgenome (Morizono and Chen, 2005). Retroviruses are the most widelyused in gene therapy to date and have the advantage of promoting stabletransfection, because the virus genome is inserted into the host cellgenome. The disadvantages are that this insertion occurs randomly, whichmay modify cell genes in a harmful way, and that its particle is fragile,making handling and attainment of high titre difficult. Additionally, theyinfect only dividing cells (Nardi and Ventura, 2004).
Lentiviruses are a subclass of retroviruses expressing a complex thatcontrols important nuclear functions in the infected cells. Lentiviruses areable to replicate in non-dividing cells, resulting in infection lasting thewhole life of the host (Quinonez and Sutton, 2002).
21.3.2 Synthetic vectors: plasmid DNA
The advantages of using plasmid DNA as a gene vector are its capacity tocarry a large amount of genetic material, the absence of risk of infection ormutagenesis, and easy large-scale production from cultivation of bacterialcells (Brown et al., 2001). The plasmid is a circular DNA, which replicatesindependently from the cell chromosome. The plasmid used in genetherapy should have the following properties:
(i) replication origin in bacteria, to allow efficient replication of plasmidsreaching hundreds of copies per cell;
(ii) a selection gene, which usually provides resistance to an antibiotic, toallow selection of clones carrying the plasmid;
(iii) a multiple cloning site, which may be cleaved with restriction en-zymes, allowing insertion of the gene of interest;
Gene therapy 493

(iv) a promoter, usually a viral promoter, which allows the transcriptionof the gene of interest in eukaryotic cells.
After the gene of interest is cloned into the plasmid, it is transferred to ahost bacterium, usually Escherichia coli, by the process of bacterialtransformation, to produce plasmids on a large scale and to obtain asufficient amount of DNA for therapeutic use.
Carrier systems for plasmid DNA
Plasmid DNA may be administered to several animal species, includinghumans, by several routes and schedules. In addition to intramuscularinjection, it may be administered orally, intranasally (as an airspray), or byan intradermal route, by bombing gold microparticles covered with thegenetic material (Lima et al., 2003a). Although plasmid intramuscularinjection is a simple and widely used technique, there are some problems,such as the presence of enzymes (nucleases) able to degrade the plasmidDNA, making it ineffective. Another limitation is the size of the DNAmolecule and its superficial molecular charge, which limits its penetrationinto the target cell. A prerequisite for use of DNA as a vaccine or genetherapy is that the nucleic acid is released effectively in the target cell. Anestimation is that only one in every 1000 plasmid molecules administeredis able to reach the nucleus and express the message for the desired proteinsynthesis, meaning that a treatment usually requires the administration ofhigh plasmid DNA doses, of possibly several hundred micrograms up tomilligrams (Friedman, 1997).
Several investigators have shown that intramuscular injection requiresup to 100 times higher the amount of plasmid to generate an expressionequivalent to one produced by DNA carrying systems, as discussed in thenext few paragraphs. In contrast, with adsorption or encapsulation techni-ques in non-viable systems, the plasmid release may occur preferentially inthe intracellular environment, avoiding functional plasmid degradation.Among the strategies used, we will mention the use of biobalistics,liposomes, lipoplexes, and polyplexes, in addition to the use of biodegrad-able polymeric microparticles.
Bioballistics or ‘‘gene gun’’ consists of transfecting individual cells,using DNA adsorbed onto gold particles (0.6–2 �m in diameter). For thetransfection, the particles are placed in a device known as a gene gun(Figure 21.3), which, by means of an acceleration process using helium gasdischarge under high pressure, is projected at an individual’s skin, enablingthe particles to reach the epidermis (Haynes et al., 1996). Transfectionusing a gene gun requires a 100 times lower the amount of plasmid togenerate an expression corresponding to one produced by intramuscularadministration (Barry and Johnston, 1997), because bioballistics enablesthe release of the plasmid inside the cells, avoiding its degradation. Thistechnique of introducing a vector by bioballistics, although effective forseveral transfection procedures, requires a specialized device for its use.However, promising clinical results have motivated companies to invest inimproving this technology.
494 Animal Cell Technology

An alternative method for introducing a plasmid DNA vector is to useliposomes. As they are composed of aqueous vesicles surrounded by aphospholipid bilayer, liposomes allow encapsulation and transportation ofmany substances, both hydrophilic and lipophilic, along with the plasmid.Liposomes also allow molecules such as antibodies, proteins, and sugars tobe incorporated into their surface, to target them to specific sites. Due tothe structural versatility shown by these systems, the chances of effectivetransfection may be increased by changes in the lipid composition, whichmay alter the superficial charge or the vesicle size (Bramwell and Perrie,2005). Cationic liposomes have wide applications in gene transfection.
Lipoplexes and polyplexes are DNA–cationic molecular complexes,formed, respectively, by DNA interaction with lipids or polymers. Themain property of these complexes is to allow easier passage of DNAthrough the cell plasma membrane, by means of two mechanisms: DNAcharge neutralization and plasmid condensation, which reduces its size.Such complexes are formed by an excess of positive charges to neutralizeDNA phosphate groups, resulting in transfecting particles with a net
DNA is adsorbed onto gold particles Particles are placed in a cartridge
The cartridge is coupled to the “gene gun”, and the particles are
accelerated against the animal’s skin
On hitting the cell, the DNA is released from
the particle and gets to the nucleus, where it
controls the protein synthesis
Cytoplasm
Nucleus
Chromosome
Plasmid
Gold particle
Figure 21.3
Use of bioballistics as a plasmid DNA carrier.
Gene therapy 495

positive charge. The effectiveness of this approach is associated withadsorptive endocytosis between the positive particle and the cell’s negativesurface. Once inside the cell, the complexes containing the DNA arereleased from the endocytotic vesicle and spread through the cytosolleading to the nucleus. However, this electrostatic adsorption may alsoresult in low bioavailability in vivo, and the absence of cellular specificity,probably due to interactions with the cell surface proteoglycans and topolyanionic glycans present in the extracellular matrix (Mislick andBaldeschwieler, 1996). Thus, the use of this method may be limited byseveral factors: its variable plasma binding when the complexes are admin-istered systemically; its association to macromolecules present in theextracellular matrix; the low efficacy of membrane penetration throughendocytosis; and its passage from cytoplasm to nucleus.
Some charged polymers, such as polyethyleneimine (PEI) have a prop-erty known as proton sponge. When at an acidic pH, as in an endolysoso-mal compartment, PEI expands, which may cause the organelle it is in tobreak, resulting in DNA release into the cytosol. Thus, some complexes,in addition to allowing easier DNA penetration into the cell, may alsomake their traffic to the nucleus easier, and contribute to reduced plasmiddegradation.
Recently, biodegradable polymeric spheres have been developed as aninteresting strategy to be used in the transfection process (Lima et al,2003b). These microspheres are composed of lactic and glycolic acidpolyesters, and have the advantage of being biodegradable, with no adverseeffects at the site of administration, if used by the parenteral route. In theorganism, these polymers are hydrolyzed, and once degraded, they releaselactic and glycolic acid, which are innocuous substrates for the organism(Figure 21.4). The potential of these systems as carriers is associated with:
(i) the protection of encapsulated plasmid, allowing a reduction in theamount to be used;
A B
Figure 21.4
Electron scanning micrograph showing intact polymeric microspheres (A) ormatrix degradation (B).
496 Animal Cell Technology

(ii) interaction with mononuclear phagocytic cells, since particles with adiameter under 10 �m are easily phagocytosed by macrophages,which could contribute to triggering the immune response, makingthem good vehicles to carry DNA;
(iii) the possibility of administering the plasmid by other routes, such asoral, nasal, and pulmonary;
(iv) easy administration;(v) stability, once the spheres are stored as lyophilized powder, which
may be reconstituted immediately before administration.
21.4 Principles of gene therapy
As shown in Figure 21.5, gene therapy is based on three basic principles:(i) replacement or correction of a gene for the purpose of generatingproducts appropriate to cell or organ function; (ii) the introduction of aheterologous gene into the target cell, leading it to produce something thatis not innate; (iii) inactivation of a gene causing a cell dysfunction.
21.4.1 Replacement or correction of a mutant gene
The replacement of an abnormal gene with a normal copy of the same genemay restore the cell capacity to produce functional proteins, contributingto cell homeostasis (Figure 21.5B). This type of gene therapy is one of the
Nucleus
Nucleus Nucleus
Heterologous
protein
1
2 4
3
A B C
Figure 21.5
Basic principles of gene therapy. (A) Gene inactivation by interference RNA (iRNA).The DNA encoding the iRNA is introduced in the cell. The iRNA forms the silencingcomplex with proteins present in the cytoplasm (1). The mRNA generated by thechanged gene is homologous to the iRNA and connects to the silencing complex(2), being destroyed by it (3). The mRNA generated by normal genes is notaffected by the iRNA (4). (B) Gene replacement. The defective gene is replacedwith a normal copy of the same gene. (C) Introduction of a heterologous gene.The gene encoding a protein from another organism is introduced into the targetcell, allowing it to produce the heterologous protein.
Gene therapy 497

most widely used, and may be applied to different types of diseases.Usually, viral vectors are used in this kind of therapy, since in most caseslong-lasting transgene expression is required.
21.4.2 Introduction of a heterologous gene
This technique is especially used in DNA vaccine protocols or therapiesfor infectious diseases, where the objective is to trigger an immuneresponse against a specific antigen. In this case, the gene encoding anantigenic protein of a pathogen is identified and inserted into an expressionvector, which is then transferred to the target cell to make it startproducing the heterologous protein in question (Figure 21.5c). In this case,the plasmid DNA-based synthetic vectors are the most commonly used,due to safety reasons and because these are generally prophylactic inter-ventions.
21.4.3 Gene inactivation
When the expression of the product of an abnormal gene leads to cellimbalance, and the gene expression is not fundamental for the cell or forthe individual, one of the therapeutic alternatives is its inactivation. Theinactivation of a gene may be performed at the DNA, messenger RNA, orprotein level. In several organisms, the introduction of double-strandedRNA has proved to be a powerful tool to suppress gene expression, in aprocess known as interference RNA (iRNA), and has been largely used ingene therapy research. The use of iRNA is a process in which the double-stranded RNA induces degradation of the homologous messenger RNA(Figure 21.5A). However, in most mammalian cells, this causes a strongcytotoxic response, which may be controlled by using synthetic iRNAable to mediate a highly specific suppression of the target gene. Althougheffective, the silencing caused by the synthetic iRNA is transient, limitingits application. To mitigate this problem, plasmid and viral vectors havebeen created, to produce the iRNA inside the cells.
21.5 Gene therapy and clinical studies
From 1989 up to the present, over 500 clinical studies of gene therapy havealready been approved and are being conducted worldwide, as shown inFigure 21.6. About 70% of these studies are intended for cancer treatment,and most (97%) are conducted in Phase I and II in terminal patients.About 3% are conducted in Phases II/III or III. So far, only a singleproduct (Gendicine
1) was approved in 2003 for marketing, and is cur-
rently in assessment Phase IV. Although it is not part of that statistic, inBrazil there is only one Phase I study, started in 2004 and currently inprogress, to assess the effectiveness of plasmid DNA encoding the thermalshock protein hsp65 of Mycobacterium leprae for head and neck epidermalcancer treatment (non-published data). Table 21.2 shows the number ofapproved clinical studies and the study phases.
498 Animal Cell Technology

Year
Number of clinical trials in gene therapy
1989NE
1990199119921993199419951996199719981999200020012002200320042005
0 25 50 75 100 125
Figure 21.6
Number of clinical trials in gene therapy approved worldwide between 1989 and2005 (www.wiley.co.uk/genmed/clinical). NE, not established.
Table 21.2 Gene therapy protocols classified by clinical study phase
Phase Gene therapy clinical studies
Number %
Phase I 714 62.4Phase I/II 234 20.4Phase II 161 14.1Phase II/III 12 1Phase III 24 2.1Total 1145 100
Adapted from Journal of Gene Medicine 2006 (www.wiley.co.uk/genmed/clinical).
Table 21.3 Gene therapy clinical trials classified by the type of disease
Indications Gene therapy clinical trials
Number %
Cancer 762 66.6Marking genes 52 4.5Healthy volunteers 19 1.7Infectious diseases 75 6.6Monogenic diseases 100 8.7Others 37 3.2Vascular diseases 100 8.7Total 1145 100
Adapted from Journal of Gene Medicine 2006 (www.wiley.co.uk/genmed/clinical).
Gene therapy 499

Table 21.3 shows the clinical studies that have been conducted world-wide, with their different applications, showing that therapies intended formonogenic disease treatment are the second most assessed group, aftertherapies for tumor treatment. The most used vectors in gene therapyclinical studies are viral vectors (68%), and among those, retroviruses andadenoviruses are the viruses of choice. Synthetic vectors were used in 25%of the studies performed, and about 16% correspond to the use of nakedplasmid DNA (Table 21.4).
Although many gene therapy protocols have been approved for clinicaltrial in humans, gene therapy safety has been questioned, due to twoadverse events. The first event involved the death, in 1999, of a young manwho underwent experimental therapy in the United States. This patienthad a rare genetic disorder known as ornithine transcarbamylase (OTC)deficiency, which affects the individual’s capacity to eliminate ammonia, atoxic product resulting from protein metabolism. The second event oc-curred in 2002, when it was announced that children treated for severecombined immunodeficiency (SCID) syndrome had signs of leukemiaafter receiving the treatment (Hacein-Bey-Abina et al., 2003). This syn-drome, also known as ‘‘bubble boy disease,’’ is caused by a single mutated
Table 21.4 Vectors used in gene therapy clinical trials
Vector Gene therapy clinical trials
Number %
Adeno-associated viruses 38 3.32Adenovirus 287 25.07Gene gun 5 0.44Flavivirus 5 0.44Herpes simplex virus 38 3.32Lentivirus 5 0.44Lipofection 95 8.30Listeria monocytogenes 1 0.09Measles virus 2 0.17Naked plasmid DNA 192 16.77Naked plasmid DNA + adenovirus 1 0.09Newcastle disease virus 1 0.09Poliovirus 1 0.09Recombinant Poxvirus 1 0.09Poxvirus 59 5.15Retrovirus 276 24.10Transference RNA 14 1.22Saccharomyces cerevisiae 2 0.17Salmonella typhimurium 2 0.17Semliki Forest virus 1 0.09Simian 40 virus 1 0.09Vaccinia virus 51 4.45Adenovirus + retrovirus 3 0.26Poxvirus + vaccinia virus 21 1.83Not commented 43 3.76Total 1145 100
Adapted from Journal of Gene Medicine 2006 (www.wiley.co.uk/genmed/clinical).
500 Animal Cell Technology

gene, and forces the individual to live under sterile conditions, since he/shedoes not have an effective defense against infections. Tumor cells werefound in the blood of the patients following the gene therapy, containingan intact copy of the retroviral vector that had integrated near or in theLMO2 gene. Although the exact mechanism by which the LMO2 geneactivation may have been responsible for the origin of leukemic cells is notclear, discussions led to debates about the safety of using viral genevectors. These questions are reflected in the sharp fall in the number ofnew clinical trial protocols approved recently, as shown in Figure 21.6.
Other causes for failure of gene therapy in clinical trials up to nowinclude: short-lasting therapeutic effect; triggering of host’s immuneresponse mainly against viral vectors; problems with viral vectors, such astreatment of patients with SCID, which caused the development ofcomplications, leading to death; multigenic disorders, such as heart condi-tions, Alzheimer’s disease, arthritis, and diabetes.
21.5.1 The first gene therapy product
Despite all these questions related to the safety of gene therapy, efforts arestill being made to eliminate the existing problems. These efforts reachedtheir highest point for the approval of the first product for gene therapy,which is based on an adenoviral vector. It is Gendicine
1, a medication
produced by the Chinese company, Shenzhen Sibiono GeneTech. Themedication is intended for head and neck carcinoma treatment, and wasapproved for marketing in 2003 by China’s regulatory agency (China’sState Food and Drug Administration – SFDA). Recombinant adenovirus,in the form of 90 nm particles, contain the tumor-suppressing gene p53.p53 gene is mutated in about 50–70% of human tumors. The mutant genesare not necessarily inactive, but may have oncogenic functions thatcontribute to tumor genesis. Proteins originating from the mutant gene arealso associated with over-regulation of a multidrug-resistant gene, whichresults in resistance to several chemotherapeutics. The exogenous intro-duction of gene p53 and subsequent expression of protein p53 leads totumor control and elimination. A synergistic effect may also be obtainedwhen the gene therapy is associated with radiotherapy and chemotherapy.
Gendicine1
is produced in SBN cells, a cell lineage subcloned fromhuman embryonic renal cells, lineage 239 (HEK-293). As these areadherent cells, culture was at first assessed in roller bottles, but this did notprove satisfactory for production. As an alternative, a parallel plate reactor(CellCube
1) was used. In this kind of system, the production obtained
was low (about 4.9 3 109 viral particles/cm2). Subsequently, the develop-ment of a perfusion culture process in packed-bed bioreactors using disks(Fibra-CelTM Disks) as support provided a 15-fold higher production,compared with the CellCube
1. In addition, a batch culture using sus-
pended cells and fetal bovine serum-free medium is being developed. Themost important point in the production process was the preparation ofreference and working cell banks. After production of adenoviral vectorsin bioreactors, they are submitted to clarification and ultrafiltration, andfinally purified in automated systems. After the whole downstreamprocess, the recovery rate of viral particles is about 65%. The purified and
Gene therapy 501

formulated product is dispensed in sterile glass bottles and stored frozen,up to the time of use.
21.6 Perspectives
Gene therapy is still new, and its scientific base will be established withfurther preclinical and clinical tests. Although many patients are currentlybeing evaluated, several questions are posed about vector safety. Theadvent of non-viable vectors with biodegradable substances and construc-tion of mimetic systems will be of great value for solving the problemsassociated with the viral vectors. Nanotechnology tools, as well as new cellvisualization and characterization tools, will allow the advent of safertransfection techniques. As there are several disciplines involved, advancesin gene therapy depend on different technologies, which may be obtainedonly by multidisciplinary research.
The collection of toxicological data is important to allow the clarifica-tion of the level of risk of different classes of viral vectors. The approval ofthe first medication intended for gene therapy opens new perspectives toobtain such essential data at a critical time for discussion about the safetyof these vectors. Such data are very valuable for regulating agencies. It isimportant to emphasize that investigators and businessmen interested inthis area are responsible for ensuring that the patients’ health and well-being are the paramount objectives, and strict adherence to currentlyavailable rules and guidelines is required. Additionally, the increasingavailability of new data will form the basis of future guidelines forproduction, marketing, clinical trials, and safety for these products.
Detailed knowledge of the human genome, which has been achieved inthe last few years, provide a rapid development tool and targets for genetherapy. A great impact is expected on human healthcare with this newknowledge, creating high expectations concerning the genesis of newproducts intended for the treatment of infectious diseases and tumors,which do not have alternative treatments.
On the other hand, from the technological point of view, several barriershave already been overcome, allowing production of viral or plasmidDNA vectors at a cost that enables clinical application. Safe manufacturingprocesses are already available, and the production capacity for thesesystems is easily accessible worldwide.
Thus, it is possible to conclude that this therapy, still in its early phases,will cause a great impact on human health in the next few decades.Furthermore, the scale-up of biomanufacture of products for clinical usefrom technologies for animal cell cultures will be an important step in theapplication of gene therapy,
References
Anderson WF (1998), Human gene therapy, Nature 392(6679 Suppl):25–30.Barry MA, Johnston SA (1997), Biological features of genetic immunization,
Vaccine 15:788–791.Bramwell VW, Perrie Y (2005), Particulate delivery systems for vaccines,
Crit. Rev. Ther. Drug. Carrier Syst. 22:151–214.
502 Animal Cell Technology

Brown MD, Schatzlein AG, Uchegbu IF (2001), Gene delivery with synthetic (non-viral) carriers, Int. J. Pharm. 229:1–21.
Brunnell A, Morgan R (1998), Gene therapy for infectious diseases, Clin. Microbiol.Rev. 11:42–56.
Cristiano, RJ (1998), Viral and non-viral vectors for cancer gene therapy, AnticancerRes. 18:3241–3245.
Ferber D (2001), Gene therapy. Safer and virus free?, Science 294:1638–1642.Friedman T (1997), Overcoming the obstacles to gene therapy, Sci. Am. 97:80–85.Hacein-Bey-Abina S, von Kalle C, Schimidt M, Le Deist F, Wulffraat N, McIntyre E,
Radford I, Villeval JL, Fraser C, Cavazzana-Calvo M, Fischer A (2003), A seriousadverse event after successful gene-therapy for X-linked severe combinedimmunodeficiency, N. Engl. J. Med. 348:255–256.
Haynes JR, McCabe DE, Swain WF, Widera G, Fuller JT (1996), Particle-mediatednucleic acid immunization, J. Biotechnol. 44:37–42.
Hendrie PC, Russell DW (2005), Gene targeting with viral vectors, Mol. Ther. 12:9–17.
Journal of Gene Medicine (2005). Available at: www.wiley.co.uk/genmed/clinical(accessed May 2006).
Lima KM, dos Santos SA, Santos RR, Brandao IT, Rodrigues JM Jr, Silva CL (2003a),Efficacy of DNA-hsp65 vaccination for tuberculosis varies with method of DNAintroduction in vivo, Vaccine 22:49–56.
Lima KM, dos Santos SA, Lima VM, Coelho-Castelo AA, Rodrigues JM Jr, Silva CL(2003b), Single dose of a vaccine based on DNA encoding mycobacterial hsp65protein plus TDM-loaded PLGA microspheres protects mice against a virulentstrain of Mycobacterium tuberculosis, Gene Ther. 10:678–685.
Mislick KA, Baldeschwieler JD (1996), Evidence for the role of proteoglycans incation-mediated gene transfer, Proc. Natl Acad. Sci. U S A 93:12349–12354.
Morizono K, Chen IS (2005), Targeted gene delivery by intravenous injection ofretroviral vectors, Cell Cycle 4:231–237.
Nardi NB, Ventura AM (2004), Terapia genica, In: Mir L (Ed.), Genomica, EditoraAtheneu, Sao Paulo, pp. 625–542.
Niidome T, Huang L (2002), Gene therapy progress and prospects: non-viral vectors,Gene Ther. 9:1647–1652.
Quinonez R, Sutton RE (2002), Lentiviral vectors for gene delivery into cells, DNACell Biol. 21:937–951.
Romano G, Michell P, Pacilio C, Giordano A (2000), Latest development in genetransfer technology: achievements, perspectives and controversies over therapeuticapplications, Stem Cells 18:19–39.
Zaiss AK, Muruve DA (2005), Immune responses to adeno-associated virus vectors,Curr. Gene Ther. 5:323–331.
Gene therapy 503


Appendix
Case study: Mathematical modeling of the growth of ahybridoma
From a set of three experiments (initial conditions in Table A1) conductedin batch mode, employing a secreting monoclonal anti-TNP (trinitro-phenyl) hybridoma, various phenomena were observed and detailed be-low.
(i) The specific growth rate is limited by glutamine and inhibited bysecreted ammonium and lactate (Equation A.1).
(ii) The specific death rate is inhibited by glutamine and limited bylactate and ammonium (Equation A.2).
(iii) The viable cell production rate is equal to the difference between thegrowth rate of viable cells and the death rate (Equation A.3).
(iv) The glucose consumption rate is divided in cell growth, first equationterm, and lactate formation (Equation A.5).
(v) The glutamine consumption rate is divided in a first order chemicaldecomposition, first equation term, viable cell formation, secondequation term, and ammonium formation (Equation A.6).
(vi) The variation of monoclonal concentration is partially associatedwith cellular growth (Equation A.7).
(vii) The lactate production rate is partially associated with cell growth(Equation A.8).
(viii) The ammonium production rate is associated with cell growth (Equa-tion A.9).
The proposed mathematical modeling to fit the experimental data isbased on Bree et al. (1988), and is represented by a set of differentialEquations A.1 to A.9, consisting of seven state variables (Table A2) and 20fitted parameters (Table A3).
Table A1 Initial conditions for tests
Test XV,0 (cel/ml) GLC0 (g/L) GLN0 (g/L) NHþ4,0 (mg/L) LAC0 (g/L)
1 4.5 0.582 1.0 3 105 5.6 1.45 0.0 0.03 11.3 2.90
Adapted from Lee, 2003.

�X ¼ �X,max:GLN
kGLN þGLN
� �:
ki,NHþ4
ki,NH4þNHþ
4
" #:
ki,LAC
ki,LAC þ LAC
" #(A:1)
kd ¼ kd,max:NHþ
4
kdNH4þNHþ
4
" #:
LAC
kdLAC þ LAC
" #:
kdi,GLN
kdi,GLN þGLN
" #(A:2)
dXV
dt¼ �X:XV � kd:XV (A:3)
dXd
dt¼ kd:XV (A:4)
Table A2 Model state variables
Xv Viable cells concentration (cel/ml)
Xd Non-viable concentration (cel/ml)GLC Glucose concentration (g/L)GLN Glutamine concentration (mg/L)mAb Monoclonal antibody concentration (mg/L)LAC Lactate concentration (g/L)NHþ
4 Ammonium concentration (mg/L)
Table A3 Fitted parameters
Parameters Description Fitted value
�X,max Maximum specific cell growth rate (h–1) 0.0630
kGLN Glutamine limitation constant for growth (mg/L) 2.65
ki,NHþ4
Ammonium inhibition constant for growth (mg/L) 65.73
ki,LAC Lactate inhibition constant for growth (g/L) 15.14
kd,max Maximum specific cell death rate (h–1) 0.0763
kdNHþ
4
Ammonium limitation constant for death (mg/L) 21.86
kdLAC Lactate limitation constant for death (g/L) 6.114
kdi,GLN Glutamine inhibition constant for death (mg/L) 778.2
YXv=GLC Glucose-to-viable cells yield coefficient(106 cell/10–3 g)
1.16
YLAC=GLC Glucose-to-lactate yield coefficient (g/g) 1.00Æ1 Constant (10–3 g/106 cell) 0.520YXV=GLN Glutamine-to-viable cells yield coefficient
(106 cell/10–3 g)20.85
YNHþ4=GLN Glutamine-to-ammonium yield coefficient (mg/mg) 0.0210
�1 Constant (103 mg/106 cell) 7.05Æ2 Constant (10–3 g/106 cell) 8.67Æ3 Constant (10–3 g/106cell.h) 1.15Æ4 Constant (10–3 mg/106 cell) 24.99� Parameter no associated to growth (10–3 g/106 cell.h) 0.389�2 Constant (10–3 g/106cell.h) 0.312 3 10–3
K First order constant for glutamine decomposition(h–1)
0.334 3 10–2
506 Animal Cell Technology

dGLC
dt¼ � �X:XV
YXV=GLC� Æ1:�X:XV
YLAC=GLC(A:5)
dGLN
dt¼ �k:GLN� �X:XV
YXv=GLN� �1:�X:Xv
YNHþ4 =GLN
(A:6)
dMAb
dt¼ Æ2:�X:XV
YMAb=Xvþ �:XV (A:7)
dLAC
dt¼ Æ3:�X:XV þ �2:XV (A:8)
dNHþ4
dt¼ Æ4:�X:XV (A:9)
Figure A1 illustrates the model simulation results with the final fittedparameters of one of the experiment 2. The proposed model representsadequately the characteristic phenomena of the process.
0.0E 00�
4.0E 05�
8.0E 05�
1.2E 06�
1.6E 06�
2.0E 06�
2.4E 06�
2.8E 06�
X (
cel/m
l)
Xv Xd
0
20
40
60
80
100
120
mA
b (
g/m
l)µ
0.0
2.0
4.0
6.0
Time (h)
GLC
ou
LAC
(g/
L)
GLC LAC
0.0
0.4
0.8
1.2
1.6
GLN
(g/
L)
0
20
40
60
80
100
NH
(mg/
L)�
4
GLN NH4
0
0
20
20
40
40
60
60
80
80
100
100
120
120
0 20 40 60 80 100 120
Time (h)0 20 40 60 80 100 120
Figure A1
Experimental data simulation: (symbols) experimentals data; (line) model simulation.
Appendix 507


Index
2-oxoglutarate 1423T3 cells 4, 120
Abbokinase1398
Acetyl CoA 79, 81–82, 88Acetylation 134Acoustic separators 290Acridine orange 157, 158Activase
1394, 402
Active transport 98, 100Acute myocardial infarction 394, 398Adeno-associated virus 492, 500, 503Adenovirus 9, 31, 442, 452, 453, 492, 500, 501Adherent cells 19–23, 27, 112, 118, 443, 444, 445Adventitious agents (see Product contaminants)Aeration (see alsoOxygen supply) 26, 246, 261,
263, 265Affinity chromatography 301, 314–319, 323,
335, 418Affinity ligands 314–318
Biospecific 316Matrix coupling 317–318Pseudo-biospecific 316
Aggregation of product 330, 331, 336, 337, 338Agitation 246Alanine 76, 79, 82, 85–91, 94–95, 99, 101, 112,
114, 123 184, 186, 201, 429Alemtuzumab 3Allosteric regulation 75, 89Allotransplants 475–476Alpha-ketoglutarate 79, 82, 84, 86, 88, 97, 101Amadori re-arrangement 140Amino acid 75–78, 80–82, 84–90, 112, 114,
116–117, 118, 120, 122, 123, 124, 130,133–134, 140, 351, 316, 366, 425Sequence 331, 336–337, 339, 341, 423
Ammonia/Ammonium 76, 84–87, 91, 94–102,116, 123, 138, 184, 186, 192, 200, 201, 203,209, 214, 215, 428, 429, 500
Ammonium sulfate 302, 313Amyloid 139Anaplerotic reaction 82Anchorage-dependent cells 20, 21Anemia 392, 394Angiogenesis 475Anion exchangers 311–312Annexin V 158Antennarity 98–99, 133
Antibiotics 30, 114, 120Antibodies 338, 339, 341, 343, 396, 399, 411–415
Affinity 416, 419, 420, 422Antigenic determinant 409, 412, 413, 422Bi-functional 425Bi-specific 425Chimeric 420, 421Domains 411, 412, 419, 422, 423, 425Gene recombination 412, 413, 423, 427Half life 423, 425Humanized 420, 421Specificity 409, 410, 415, 419, 420, 425Variety 410, 412, 413
Antibody fragments 410, 420, 421, 422–425Diabodies 421, 425Tetrabodies 421, 425Triabodies 421, 425
Antigen 6, 316, 374, 380, 381, 383, 435, 444, 448,450, 451, 455
Antioxidant enzymes 102Apligraf
18
Apoptosis 23, 27, 122, 124, 151, colour plate/Fig. 7.3Molecular aspects 159Morphological characteristics 151, 156, 157,
160, 162, 168Control 171Definition 151Detection 155Induction 152
Apoptosome 167, 168, 169, 170, 171Apoptotic pathways 160
Intrinsic mitochondrial pathway 162Intrinsic ER stress-induced pathway 169Extrinsic death receptor-induced
pathway 170Aranesp1 394, 406Arginine 79, 88–89, 112, 139, 142Ascorbate 142Asparagine 84–85, 87–90, 130, 138, 142ATP 10, 16, 75–80, 83, 89, 92, 102Autoimmune diseases 389, 391, 399, 400, 475Avastin
13, 396, 399, 419
Avonex13, 391, 394, 402
B lymphocyte 409, 410, 412, 413, 414, 416, 419,420, 422, 482–483

Baculovirus 6, 32, 135, 136, 300, 448, 449, 450,451,455, 459–470
Baculovirus expression vector system 6Baculovirus infection cycle 461–462, 463, 464,
468Passage effect 467, 470
BAE-1 20Balb/c 125 415Basiliximab 3Bcl-2 153, 154, 162, 164, 169, 171Benefix
13, 394, 399, 402
Betaferon1391
Beta-hydroxyaspartate 130Beta-oxidation 92Betaseron
1391
Bevacizumab 3Bexxar
1419
BHK cells 2, 3, 4, 6, 10, 20, 30, 55, 81, 83, 86–90,93, 95–96, 99, 103, 130, 141, 120, 125, 443,427, 429
Bioassays 330, 331, 341–345Bioballistics 494–495Biogenerics 366–367Bioinsecticide 459–474
Comparison to chemical pesticides 459–460Comparison to in vivo production 460Mechanism of action 460–463Virulence 460, 463, 466–467
Biopesticide (see Bioinsecticide)Biopharmaceuticals 1, 2, 3, 6, 30, 122, 383, 388,
389, 394, 400, 402, 404Characterization 404Formulation and delivery 402Market 400Second-generation molecules 405Stability 402, 403
BioreactorsAir-lift bioreactors 225, 227Bioreactors for attached cell growth 225,
231Cell concentration ranges 254Classification of bioreactors 225Economic aspects 252Fluidized-bed bioreactors 225, 231Heterogeneous bioreactors 228Hollow-fiber bioreactors 225, 231Homogeneous bioreactors 225Microcarrier-based systems 225, 229Packed-bed bioreactors 225, 230Roller bottles 225Scale of operation 221, 225, 226, 230, 252Small-scale culture systems 221, 223Stirred-tank bioreactors 225Types of bioreactors 224, 225Wave bioreactors 225, 226
Biosafety 330, 331, 333, 335, 341, 342, 354Blood coagulation 140Blood coagulation factors 394, 398Blood serum (see serum)BSE (bovine spongiform encephalopathy) 357Buffer exchange 305By-product synthesis 185, 186, 188, 191, 192,
195, 199, 200, 201, 203, 208, 209, 210, 215,426, 430
Caco-2 cells 4Campath
13, 396, 419
Cancer 389, 391, 392, 396, 399Capillary electrophoresis 362Capsid 340, 341, 439, 448, 450, 454Carbohydrate 76, 80, 83–84, 99, 115, 130, 136,
335, 340, 484Carbon dioxide 26, 79, 101, 103–104, 111,
115, 116, 262, 485Dissolved, 267
Carboxylation 103, 130, 141Carcinogenicity 363–364Carnitine 92Carticel
18
Caspases 151, 160Activation 160Classification 160, 161Structure 161
Cation exchangers 311–312CBER 352CDER 352CDR (Complementarity-determining regions)
411, 420, 422Grafting 420, 421
Cell banks 4, 28, 29, 125, 332–333, 334, 355, 360,501
Cell concentration measurement 23Cell cycle 13, 77, 88, 96, 147, 148, 149, 150Cell disruption (see cell lysis)Cell factory 7, 8, 444Cell growth phases 21–23
Death phase 23Exponential or log phase 22Lag phase 22Stationary phase 23
Cell line storage 28–29Cell lines 54Cell lysis 298–299Cell maintenance 20Cell monitoring 263, 264, 265–267
Flow cytometry 217, 267Image analysis 266, 267Respiration 263, 264, 265Size distribution 266, 267, 275, 276, 278
Cell morphology 20
510 Animal Cell Technology

Cell proliferation 147Cell propagation 222
Adherent cells 224Suspension cells 223
Cell structureCytosol 14–15Endosome 14Golgi complex 14, 16Lysosome 14, 16Mitochondria 14, 16, 17Nucleous 14, 17Peroxisome 14, 17Plasma membrane 14Polyribosome 14Rough endoplasmic reticulum 14, 15
Cell therapy 4, 7, 8, 11, 475, 478–479, 484, 486,489
CellCube1225, 231, 501
CellFactory1225, 231
Centrifugation 281Multi-chamber centrifuges 281, 282Disc centrifuges 281, 282Tubular centrifuges 281, 282Centritech
1centrifuges 282
Cerezyme1394, 398
Chemostat 83, 85, 103Chimeric antibodies 401, 419, 420Chimeric viral particles 454CHO cells 2, 3, 4, 6, 10, 20, 30, 54, 55, 83, 89, 93,
95, 99–102, 125, 129, 133–134, 138, 141,320, 322, 358, 427, 428, 429, 443
Cholesterol 91, 118, 120Chromatin 152, 155, 156, 157, 158Chromosomal integration 41, 53
Positioning effect 41, 44, 53, 57Random recombination 44, 53Site-specific integration 57
Chromosome 17, 76, 493, 495CHSE cells 81Citrate 79, 81–82Cleaning validation 359Clinical trials 330, 344, 350, 352, 363–365Clusters of differentiation (CDs) 480–483CMP-NANA 99–100Collagen 27, 117, 118, 119, 125, 142, 484Collagenase 17, 21Computational fluid dynamics 288Continuous cell lines 443Control (process control) 259–270
Actuator 260, 269, 270Adaptive 270Cascade 262, 269Loop 260, 269On-off 261, 269PID 260, 269, 270,
Strategies 268–270Copper 139Core-like particles 444Cornea 486CPMP 352Cryopreservation 28, 355, 486Cryoprotector 28CultiSpher
1230, 444
Culture conditions 152, 153, 154, 155Culture media
Contaminants 29Degradation by light 29
Culture media typesBasal media 111Chemically defined media 111, 124Classical formulations 112For insect cells 112, 463For mammalian cells 112Growth media 111Maintenance media 111Protein-free media 2, 4, 123Serum-free media 2, 4, 32, 111, 112, 117,
122–125, 300, 464–465Cut size 278
Reduced cut size 278Cystathionine pathway 90Cystine 87–90, 113Cytochrome C 155, 156, 159, 166, 167, 168, 171CytodexTM 229, 230, 444Cytokines 94, 352, 390, 392, 394, 400, 406,
484–485Cytomegalovirus 357Cytosol 14, 15, 77, 80–84, 87, 92, 94–95, 100,
496
DACS1SC 8
DAPI 157Data treatment 186, 190–191, 192
Experimental error 190, 213Rate estimation 180–191Smoothing methods 190–191
Deamidation 138–140Deamination 85, 139Density gradient 304Deoxyglucosone 139Desalting 305, 309Diabodies (see Antibody fragments)Diafiltration 305, 306Dialysis 301, 305Dipeptides 86–87DISC (death-inducing signaling complex) 170Disulfide bonds 130, 132, 351, 362DMSO 28DNA fingerprinting 356DNA vaccines 9, 451–452
Index 511

Dolichol 130, 132, 137Doubling time 22Downstream processing 295–324, 445, 451Dye exclusion 23
E. coli 49–51, 62, 134–135, 494ECGF 118Economic aspects 400EDTA 17, 21, 299Efficacy of products 330, 331, 340, 342EGF 118, 119, 120, 125Eicosanoid 91Elastin 484Electrode (see Sensor)Electrofocusing (see isoelectric focusing)Electron microscopy 358, 496Electrophoresis 156Electrophoresis 310, 337–339, 341Embryonated chicken eggs 357Embryonic germ cells 478Embryonic stem cells 7, 8EMEA 350, 352, 366–367Enbrel
1396, 406
Endoplasmic reticulum 14, 15, 130–131Endothelial cells 4, 119, 120, 125, 479–481, 485Endotoxin 115, 120, 360, 362Env gene 493Epogen
13, 394, 402
Epstein-barr virus 5, 357, 375Erbitux
1419
Erythropoietin 3, 6, 83, 366–367, 384, 392, 394,400, 402, 406
Ethidium bromide 157, 158Expanded bed adsorption 319–321Expression systems 44–48, 55, 61, 66, 404Extracellular matrix 27, 118, 119, 125Exubera
1403
Fabrazyme1394, 398
FACS (see Flow cytometry)Factor IX 3, 394, 399, 402Factor VII/VIIa 394, 399Factor VIII 3, 139, 394, 398, 402Factor X 129, 140–141, 399FAD 78–80, 92Fatty acid 79, 80, 91–95, 114FDA 122, 351–352, 355–363, 366–367, 501Fed-batch cultures 83, 85–86, 90–91, 138, 237FGF 118, 119, 125FIA (see Flow Injection Analysis)Fibra-CelTM 501Fibroblast 4, 10, 19, 20, 24, 30, 31, 119, 120, 125Fibronectin 21, 27, 118, 119, 125, 484Filtration 285
Dynamic filters 287
Filter medium 285, 287Spin-filters 288Tangential flow filtration 285Rotating disc filters 288
Finite cells 4Flavivirus 500Flow cytometry 263, 267Flow injection analysis (FIA) 267Flow ratio 276Fluorochrome 479Follicle-stimulating hormoneFructosamine 139–140Fructose 77–78, 83, 116, 140Fucosylation 133–135Fungi 132, 136
Gag gene 493Galactose 83, 101, 116, 131, 137Galactosylation 99, 138Galactosyltransferase 136GalNac 100, 133–134, 136Gamma-carboxylation 130, 140–141G-CSF 366, 392, 394, 400, 402, 403GDP 79, 89, 130Gel filtration (see molecular exclusion
chromatography)Gel permeation chromatography (see molecular
exclusion chromatography)Gendicine
1498, 501
Gene expression 40Gene gun 494–495, 500Gene therapy 4, 9, 11, 31, 435, 489–493,
497–502Genetic elements 40
39 untranslated region 42, 4359 untranslated region 42, 43Capping 40, 41Codon usage 43Chromosomal elements 40Enhancer 40, 41, 43, 51Introns 41, 42Polyadenylation signals 41, 42, 48, 51Promoter 40, 41, 50, 51, 52Termination codon 43Transcription-termination sequences 41,
42, 51Genetic engineering 374, 375, 376GlcNac 99–100, 130–138Glucose 24, 76–106, 113, 115–116, 118, 122, 123,
131, 137–140Glucose transporters 77, 107Glucosidase 130–131Glutamate 79, 84–90, 94, 107, 114Glutamate dehydrogenase 79, 84, 89, 101
512 Animal Cell Technology

Glutamine 76, 81–84, 91, 94–105, 113, 114, 116,123, 137–138
Glutamine thermal degradation 116Glutaminolysis 76, 84, 94, 99, 103Glutathione 102Glycation 139–140Glycerol 28Glycine 85, 87–89, 101, 112, 140Glycocalyx 22, 484Glycolic acid 496Glycolysis 22, 35, 76–77, 79–83, 85, 89, 94–95,
97–99, 102–103, 116Glycoproteins 405Glycosaminoglycans 484Glycosylation 31, 83, 97, 99–100, 103, 116,
130–138, 142, 351, 339, 340, 390, 404, 406,448, 450
Glycosyltransferase 134–137GM-CSF 392, 400, 402, 404GMOs 354GMP 349–355, 358–359Golgi 99, 129, 131–134, 136–137, 142, 328Gonal-f
13, 393, 394
Granulocyte-colony stimulating factor 366, 392,394, 400, 402, 403
Gravity settling 280Lamella settlers 280Vertical settlers 280
Growth factors 118–122, 124, 125, 149, 152, 153,392
Growth hormone 138, 349, 366–367Guinea pigs 357
HACA (see Human anti-chimeric antibody)HAMA (see Human anti-murine antibody)Hayflick limit 19, 150HBsAg 303, 304, 448, 450HBV 435, 441, 448, 450, 453, 454Heart 91, 95, 475–476, 501HEK-293 cells 4, 20, 30, 31, 141, 501HeLa cells 20, 139, 443Hematopoiesis 479, 484Hematopoietic
Cascade 483Growth factors 392Stem cells 477, 479, 481, 483–485Tissue 474
Hemofilia 394, 398, 399Hemolymph 116, 118, 124, 465, 466HEPA filters 353–354Hepatitis 366–367, 450Hepatitis B vaccine 3, 448, 449, 450Hepatitis virus 357, 440Hepatocyte 84, 96HEPG2 cells 20
Herceptin13, 396, 419
Herpes virus 357, 442, 492, 500Heterologous gene expression 44
Baculovirus 48DNA virus 45Expression vectors 44Inducible promoters 50Multiple gene expression 53Plasmid vectors 50Quantitation of recombinant proteins 66RNA virus 47Signal peptide 52Stable expression 55, 56, 57Tags 52Transient expression 54, 55, 56, 57Viral vectors 44
Hexanoic acid 93Hexokinase 77–78, 81, 83, 100, 110Hexose 83High-FiveTM 32, 124, 449Histidine 79, 88–89, 113HIV 133, 358, 360, 452HL-60 cell 20, 86Hollow fiber membrane modules 286, 287Hormones 393, 394Human anti-chimeric antibody (HACA) 420Human anti-murine antibody (HAMA) 418Human genome 489, 502Human neurotropic virus 493Human parvovirus B19 449Humanized antibodies 401, 419, 420Humatrope
1402
Humira1419
Humulin1402
Hybridization 375Hybridoma 2, 3, 5, 14, 30, 31, 83–86, 89–91, 93–
94, 96–97, 102, 104, 119, 120, 125, 319, 375,380, 381, 383, 410, 414, 415–418Hybridoma technology 410, 415–418, 420
Hydrocyclones 274, 283Hydrodynamic stress 154Hydrolysates 116, 123, 124Hydrophobic interaction chromatography 301,
313–314Hydroxyapatite 486Hydroxylation 142Hydroxyproline 142Hyperglycemia 139Hypoxia 102, 142Hypoxia-inducible factor (HIF) 142
ICH 350, 352–353, 355IGF-1 118, 119, 120IGF-2 119, 120IL-mu6 99
Index 513

Immortal cell lines 4, 150Immortalization 4, 150, 443Immunoadhesin 99Immunoelectrophoresis 362Immunogenicity 403, 404, 406Immunoglobulin 138, 411, 413, 416, 422In vitro assays
Comparison to in vivo cell growth 1, 10, 11Cytotoxicity assays 10, 33–36
In vivo diagnosis 394, 396, 399InductOsTM 393, 394Industrial cell lines 30–31Inoculum propagation 221Insect cells 4, 6, 24, 25, 26, 31–33, 89, 91,
103–104, 112, 116, 118, 120, 122, 124,135–136, 262, 422, 445, 448, 449, 455 459,461, 462, 463, 464, 465, 466, 467, 469, 470
Insulin 118, 120, 121, 124, 125Insulin 88, 119, 120, 121, 124, 125, 375, 383, 349,
366–367Integrity of product 331Intellectual property 373–388Interference RNA 497–498Interferons 2, 3, 6, 366–368, 375, 378, 379, 384,
390, 394, 402Interleukin 99, 118, 119, 120, 485Introduction of exogenous DNA 58
Calcium phosphate co-precipitation 58DEAE-dextran 59Electroporation 60Lipofection 60PEI 59
Intron A1402
Ion exchange chromatography 301, 310–313,314, 319, 321, 323Anion exchangers 311–312Cation exchangers 311–312
Isoaspartate 138–139Isoelectric focusing 301, 310 338, 339, 341, 362Isoleucine 79, 87–89Isozyme profile 356
Karyotype 356Keratinocytes 8, 486Kidney 81, 96, 476Kinetic analysis 182, 184, 185–200Kogenate
13, 394, 398, 399
L mouse fibroblasts 89L929 cells 20Labeling 404Lactate 76, 78–87, 94–97, 101–103, 114, 116,
123, 184, 186, 188, 189, 201, 214, 496Lactate dehydrogenase 78, 81–82, 188, 357Laminin 27, 118, 125, 484
Langerhans islets 475Lauric acid 93LDH (see lactate dehydrogenase)Lentivirus 9, 358, 492–493, 500Lepidopteran 135–136Leucine 79, 87–89, 113, 117Leukemia 3, 500Leukemia inhibitor factor (LIF) 485Linoleic acid 91, 93–94, 113, 121Linolenic acid 91, 93Lipids 14, 15, 17, 75–76, 81–82, 91–93, 114, 116,
117, 118, 120, 125, 130, 436, 495Lipofection 60, 500Liposomes 9, 494–495Liquid-liquid extraction 301, 303–304Listeria noncytogenes 500LLC-PK cells (porcine kidney cell) 81Luveris
1393, 394
Lymphoblastoid cell 20, 33, 90, 102Lymphocyte 5, 31, 94, 119, 120, 375, 454, 482,
485Lymphocyte choriomeningitis virus 357Lysine 87–89, 113, 139, 142, 322
Macrophages 482, 497Maillard reaction 139Maintenance coefficient 196, 204Malate 79, 81–83, 101Malate-aspartate shuttle 80–81, 95Malic enzyme 81Malignant transformation 19Maltose 83, 116Mannose 100, 116, 130–133, 135–138Mannosidase 130–131, 137Margaric acid 93Mass balance 182Master cell bank (MCB) 355–358Mathematical model formulation 192–209
Models for animal cell cultivation 199–209Mathematical model types 183–185
Non-Segregated 183, 185, 214–215Non-structured 183, 192–214, 215–218Population balance model 183, 215–218Segregated 215–218Structured 183, 185, 214–215
Mathematical model validation 213–214MCB (seemaster cell bank)McCoy cells 86MDBK cells 443MDCK cells 4, 86–87, 90, 443Membrane adsorption 321–322Membrane fluidity 93Mesenchymal cells 479–481, 486Metabolite monitoring 190, 267Methionine 87–90, 113, 116
514 Animal Cell Technology

Methyl glyoxal 139Methylation 134MGH-U1 (human bladder cancer) cells 102Microcarriers 27, 96, 229, 230, 443–446
Macroporous 229, 230Manufacturers 230Materials 230Microporous 229, 230
Microfiltration 301, 305Micro-injection 375Mitochondria 14, 15, 16, 23, 77, 80–82, 84, 89,
91–92, 95–99, 155, 159, 162, 167, 169, 171Mitosis 17, 75, 147–149, 477Modes of operation 234
Batch cultivation 235Continuous cultivation 240Continuous cultivation with cell retention
(perfusion) 242Fed-batch cultivation 237
Molecular cloning 39Molecular exclusion chromatography 301,
307–309, 323Monitoring, process monitoring 184, 217, 259,
270In situ 260Off line 259, 263, 266, 267Online 217, 260, 265, 266, 267Real-time 259–260
Monoclonal antibodies 93, 139, 349, 355, 409–433, 479, 487Chimeric 419, 420, 421, 423Human 419, 421–425Humanized 410, 419, 420–421Recombinant 418–425Transgenic 421, 422
Monoclonal antibody production 425–430In vivo 410, 425, 426Transgenic animals 420
MRC-5 cells 4, 5, 20, 30, 31Multiple sclerosis 391, 394Multiplicity of infection 447, 451Mutagenesis 492–493Mutagenic activity 363–364Mycobacterium leprae 498Mycoplasma 29, 31, 121, 355–356, 360Myeloma cell 3, 5, 20, 31, 83, 89–92, 103, 125,
358, 375, 409, 410, 414, 415, 416, 427Human myeloma 410
Mylotarg1419
N-acetylglucosamine 100–101, 131N-acetylglucosaminidase 136N-acetylglucosamintransferase 137N-acetylneuraminic acid 99–100NAD 76, 79
Namalwa cells 2, 20, 124Necrosis 23, 27, 151, colour plate/Fig. 7.3Neulasta
1403
Neupogen1402
Neural networks 270Newcaste disease virus 500NGF 119, 125NIH 3T3 cells 20, 125Non-viral vectors 9
Liposomes 9Plasmid DNA 9, 50
Norwalk calcivirus 448Norwalk virus 449Notch 486Novolin
1402
NovoSeven1394, 399
NS0 cells 4, 20, 30, 31, 55, 427Nucleases 494Nucleotide sugars 130Nutropin
1402
Octanoic acid 93OK cells (opossum kidney cell) 81OKT3
1418, 419, 426
Oleic acid 91, 93–94Omalizumab 3OmnitropeTM 367Optimization 181, 182, 217, 426Organ culture 34Ornithine 85, 88–90Ornithine transcarbamylase 500Orthoclone
1419
Osigraft1393, 394
Osmolality 24, 25–26, 29, 33, 111, 117, 123, 155Osmolarity 96Osteoblast 480, 484, 486Ovitrelle
1393, 394
Oxidative phosphorylation 79–80, 92Oxoaldehydes 139Oxygen 23, 24, 26, 27, 33, 77, 80, 101–103, 111,
116, 121, 123, 139, 141–142, 189–190, 246,261, 263–265, 428, 442Monitoring 259, 263–264Control 264, 265, 269
Oxygen supply 26–27Bubble free 26, 261, 263, 265Gas bubbling 26, 27Membrane diffusion 26, 263, 265Pressure increases 26Surface aeration 26, 27
Palmitic acid 93Pancreas 476, 486Panorex
1419
Papillomavirus 435, 448, 449
Index 515

Parameter fitting 182, 184, 185, 190, 192, 193,201, 202, 204, 206, 208, 209–213
Parvovirus 441, 448, 449, 450, 453Patentable materials 382–384Patents 373, 374, 375, 402, 403
Grace period 378Requirements for 376–382Sufficiency of disclosure 381
PBM (see Mathematical model types)pCO2 (see Carbon dioxide, dissolved)PDGF 118, 119, 120, 125Peg-IntronTM 403Pegylation 401, 403Pentose phosphate pathway 77, 102–103Peptide mapping 337, 340, 341Per.C6 cells 4, 30, 31, 85Perfusion cultivation 242Permissible cells 436–437pH 20, 24–26, 82, 85, 95–99, 101–104, 123, 139,
262–263, 362, 485, 496Buffers 24, 25Carbon dioxide 24, 25Control 24, 262Sodium bicarbonate 24, 25
Pharmacokinetics 365, 406Phenylalanine 79, 88–89, 113Phosphofructokinase 77–78, 81, 97, 100Phospholipids 91, 93–94, 114Phosphorylation 448Plant cells 76, 137Plastic bags 226–227, 444Plate-and-frame membrane modules 286, 287Pluronic
1F68 94, 27, 120, 249
Pol gene 493Poliovirus 443, 454, 500Polyethylene glycol 303, 302, 314Polyethyleneimine (PEI) 496Polyomavirus 357, 449Polystyrene 443, 445Porcine parvovirus 449, 450, 453Poxvirus 441, 500Precipitation 300, 301, 302, 303, 304, 313, 314,
323Primary cells 2, 4, 5, 10, 450Primary cultures 4, 5, 17, 18, 19, 20, 119Prions 121, 142, 357Probe (see Sensor)Process validation 129, 359Product contaminants 329, 330, 331, 333,
335–336, 338, 340–341, 426Product specification 335–336Productivity 252, 253, 255Proline 79, 85, 88–90, 101, 113, 130, 133,
139–142Prolyl-4-hydroxylase 142
Prophylaxis 489Propidium iodide 157, 158Prostaglandin 91, 93Protease 21, 298, 300, 438Protease inhibitors 119, 300Protein C 140–141Protein content 337Protein extraction 298–300Protein hydrolysates (see hydrolysates)Protein precipitation 301–303
Precipitating agents 302Salting-out 302
Protein purity ranges 297Proteoglycans 21, 484, 496Proteolysis 297, 300, 302, 362Protropin
1402
Puregon1393, 394
Purification 295–324, 329, 330, 331, 335–336,339, 340, 418, 423, 427, 445, 451
Purity 295–324, 330, 335, 336, 337, 338, 339, 342Pyruvate 77–78, 80–83, 87, 91, 93–95, 103, 113,
115, 116, 118Carboxylase 81, 83Dehydrogenase 80–81Kinase 77, 81Phosphoenol carboxykinase 81
Quality assurance (QA) 350–351, 358–359Quality control (QC)
Materials 331–333Process 334–335Product 335–342
Raptiva1419
Rebif1391, 394
Recombinant vaccines 436, 453Regulatory agencies 389, 404Regulatory aspects 329, 331, 349–372Remicade
1396, 401, 419
ReoPro1419
Reporter markers 64Alkaline phosphatase (AP) 65Beta-galactosidase (�-gal) 64Chloramphenicol acetyl transferase
(CAT) 64Green fluorescent protein (GFP) 65Luciferase 65
Residual cellular DNA 361Retractable housing 263Retrovirus 5, 9, 31, 119, 358, 439, 440, 442,
492–493, 500Reverse phase chromatography 313–314Reverse transcriptase 358, 439, 493Ribosome 15, 16, 17, 130, 133, 438Rituxan
1419
516 Animal Cell Technology

Roller bottle 444Rotavirus 449, 454
S2 cells 32Saccharomyces cerevisiae 83, 136, 500Salmonella typhimurium 500Salts 112, 113, 114, 117, 122, 124Scale-up 250, 444Schiff’s base 139SCID mice- 422SCID syndrome 9, 500SDS-PAGE 301, 310, 338, 341, 362Selection markers 61
Biochemical markers 61Gene amplification 61Morphological changes 61
Semi-adherent cells 21Semliki forest virus 500Senescence 150Sensors, principle of 263, 264, 266, 267, 417Separation efficiency 274
Total separation efficiency 275, 276Reduced total efficiency 276Grade efficiency 277Reduced grade efficiency 278
Sequon 130–133Serine 85, 87, 89–90, 113, 130, 133–134Serum 117–121
As a cell protecting agent 118, 121Components 118Functions 117Risks associated to its use 121Substitutes 27
Serum albumin 92, 125Serum-free media 2, 4, 32, 85, 87, 92–94, 102,
111, 112, 117, 122–125, 300, 358, 501Set-point 260, 269, 270Sf-21 cells 449–451Sf-9 cells 32, 89, 135, 449–451Shear sensitivity 349, 445Shear stress 154SH-SY5Y cells 20Sialic acid 100–101, 131, 135, 137–138Sialylation 98–99, 103, 133–134, 136, 138Sialyltransferases 136–137Simian 40 virus 500Simulect
13, 396, 419
Site-directed mutagenesis 406Size exclusion chromatography (seemolecular
exclusion chromatography)Solid support (see substrata for cell adhesion)Sp2/0 cells 4, 55, 83, 416, 417, 427SP2Ag14/0 cells 416, 417, 427Specific rate 182, 186–188, 261, 266
Death 186, 187, 203, 205, 211
Growth 183, 184, 187, 191, 193–196, 428Product synthesis 181, 187, 188, 198, 199,
201, 205, 207, 208Substrate consumption 188, 189, 190,
196–197, 204–205Spheroids 34Sphingolipids 91Spodoptera frugiperda cells 32, 89, 135, 449, 451Stability 330–333, 335, 337, 339, 423Stearic acid 93Stem cells 4, 7, 8, 475–487Sterols 91Stirring (see Agitation, Oxygen supply)Substrata for cell adhesion 27Substrate monitoring 190, 267Succinamide 138Sulfation 134Superoxide dismutase 102Suspended cells 21SV-40 42, 45, 49, 51, 55, 449Synagis
1419
T antigen 136T lymphocytes 418, 422, 425TCA cycle 78–85, 87–92, 97, 99, 101, 103, 115Temperature 26, 28, 101, 103, 110, 138–139, 259,
261–262, 355, 362, 485Cell growth 26Control 260, 261–262, 269Cryopreservation 28Upon thawing 28
TenecteplaseTM 394, 398, 406Teratogenic activity 364Teratomas 8Terminal settling velocity 274, 280, 281Tetrahydrofolate 89TGF 119Therapeutic enzymes 393, 394Therapeutic proteins 389–408Thermal degradation 86Threonine 88–89, 101, 113, 133–134Thrombospondin 484Time of infection 447Time-to-market 390, 402Tissue engineering 8Tissue plasminogen activator 2, 101, 133, 322Toxicity 363–364, 492Transamination 94Transdifferentiation 475Transesterification 92Transformed cells 19Trastuzumab 3, 6Trimera mouse 422Trypsin 17, 21, 356–357
inhibitor 118
Index 517

trypsinization 22, 32, 33Tryptophan 29, 88–89, 113Tumor necrosis factor 99Tumor-suppressing gene (p53) 501TUNEL 156
U 266B1 cells 20U937 cells 20UDP-GlcNAc 100, 130, 138UDP-GNAc 97, 99Ultrafiltration 301, 305–306Ultrasonic separators 290Umbilical cord 485–486Urea 96
Vaccinia virus 500Valine 88–89, 113VEGF 485Vectors (see Heterologous gene expression,
Non-viral vectors, Viral vectors)Vero cells 2, 4, 20, 86, 443, 444, 445, 446, 447Viral antigens 435Viral vaccines 2, 435, 454Viral vectors 9, 44–50, 435, 491–492, 498,
500–502Virus 2, 4, 44–50, 121, 436–442, 140, 355–361,
371, 491–493, 500Adsorption to cells 437
Genome structure 437–441Infection 442Internalization 437Replication 436–437Structure 436, 447
Virus-like particles (VLPs) 2, 7, 447, 453–455Vitamin K 117, 141Vitamins 113, 114, 117, 120, 122, 123, 125
Water quality 114–115WCB (see Working cell bank)WEHI 231 cells 20Western blotting 362WHO 350, 353–362WI-38 cells 2, 4, 5, 102Working cell bank (WCB) 355–357
Xenotransplants 475–476Xigris
1394, 402
Xolair13, 396, 419
Xylose 135, 137
YAC 1 cells 20Yield coefficient 186, 188–189
Zenapax1396, 400, 419
Zevalin1419
518 Animal Cell Technology