ANHUI GUJING DISTILLERY COMPANY LIMITED INTERIM …
196
ANHUI GUJING DISTILLERY COMPANY LIMITED INTERIM REPORT 2021 August 2021
Transcript of ANHUI GUJING DISTILLERY COMPANY LIMITED INTERIM …

ANHUI GUJING DISTILLERY COMPANY LIMITED
INTERIM REPORT 2021
August 2021

Interim Report 2021
~ 2 ~
Part I Important Notes, Table of Contents and Definitions
The Board of Directors (or the “Board”), the Supervisory Committee as well as the directors,
supervisors and senior management of Anhui Gujing Distillery Company Limited (hereinafter
referred to as the “Company”) hereby guarantee the factuality, accuracy and completeness of
the contents of this Report and its summary, and shall be jointly and severally liable for any
misrepresentations, misleading statements or material omissions therein.
Liang Jinhui, the Company’s legal representative, Zhu Jiafeng, the Company’s Chief
Accountant, and head of the Company’s financial department (equivalent to financial
manager) hereby guarantee that the Financial Statements carried in this Report are factual,
accurate and complete.
All the Company’s directors have attended the Board meeting for the review of this Report
and its summary.
Any plans for the future and other forward-looking statements mentioned in this Report shall
NOT be considered as absolute promises of the Company to investors. Investors, among
others, shall be sufficiently aware of the risk and shall differentiate between plans/forecasts
and promises. Again, investors are kindly reminded to pay attention to possible investment
risks.
Investors’ attention is kindly directed to the risk factors that might have an adverse impact on
the fulfillment of the Company’s development strategies and business objectives for the future,
as well as to the countermeasures intended to be taken, which have been detailed in “X Risks
Facing the Company and Countermeasures” in “Part III Management Discussion and
Analysis” of this Report.
The Company has no interim dividend plan, either in the form of cash or stock.
This Report and its summary have been prepared in both Chinese and English. Should there
be any discrepancies or misunderstandings between the two versions, the Chinese versions
shall prevail.

Interim Report 2021
~ 3 ~
Part I Important Notes, Table of Contents and Definitions 2
Part II Corporate Information and Key Financial Information 6
Part III Management Discussion and Analysis 9
Part IV Corporate Governance 26
Part V Environmental and Social Responsibility 27
Part VI Significant Events 31
Part VII Share Changes and Shareholder Information 36
Part VIII Preferred Shares 42
Part IX Corporate Bonds 43
Part X Financial Statements 44

Interim Report 2021
~ 4 ~
Documents Available for Reference
(I) Financial statements signed and sealed by the Company’s legal representative, the
Company’s Chief Accountant and the head of the Company’s financial department
(equivalent to financial manager);
(II) All originals of the Company’s documents and announcements that have been
publicly disclosed in the Reporting Period on the media designated by the China
Securities Regulatory Commission; and
(III) The interim report disclosed in other securities markets.

Interim Report 2021
~ 5 ~
Term Definition
The “Company”, “ Gu Jing” or “we” Anhui Gujing Distillery Company Limited inclusive of its consolidated
subsidiaries, except where the context otherwise requires
The Company as the parent Anhui Gujing Distillery Company Limited exclusive of subsidiaries, except
where the context otherwise requires
Gujing Group Anhui Gujing Group Co., Ltd.
Yellow Crane Tower Yellow Crane Tower Distillery Co., Ltd.
Definitions

Interim Report 2021
~ 6 ~
Part II Corporate Information and Key Financial Information
I Corporate Information
Stock name Gujing Distillery, Gujing
Distillery-B Stock code 000596, 200596
Stock exchange for stock listing Shenzhen Stock Exchange
Company name in Chinese 安徽古井贡酒股份有限公司
Abbr. (if any) 古井
Company name in English (if any) ANHUI GUJING DISTILLERY COMPANY LIMITED
Abbr. (if any) GU JING
Legal representative Liang Jinhui
II Contact Information
Board Secretary Securities Representative
Name Zhu Jiafeng(Acting responsibilities) Mei Jia
Address Gujing Town, Bozhou City, Anhui
Province, P.R.China
Gujing Town, Bozhou City, Anhui
Province, P.R.China
Tel. (0558)5712231 (0558)5710057
Fax (0558)5710099 (0558)5710099
Email address [email protected] [email protected]
III Other Information
1. Contact Information of the Company
Indicate by tick mark whether any change occurred to the registered address, office address and their zip codes, website address and
email address of the Company in the Reporting Period.
□ Applicable √ Not applicable
No change occurred to the said information in the Reporting Period, which can be found in the 2020 Annual Report.
2. Media for Information Disclosure and Place where this Report is Kept
Indicate by tick mark whether any change occurred to the information disclosure media and the place for keeping the Company’s
periodic reports in the Reporting Period.

Interim Report 2021
~ 7 ~
□ Applicable √ Not applicable
The newspapers designated by the Company for information disclosure, the website designated by the CSRC for disclosing the
Company’s periodic reports and the place for keeping such reports did not change in the Reporting Period. The said information can
be found in the 2020 Annual Report.
IV Key Financial Information
Indicate by tick mark whether there is any retrospectively restated datum in the table below.
□ Yes √ No
H1 2021 H1 2020 Change (%)
Operating revenue (RMB) 7,007,496,467.74 5,519,621,000.62 26.96%
Net profit attributable to the listed
company’s shareholders (RMB) 1,378,803,828.46 1,024,936,604.36 34.53%
Net profit attributable to the listed
company’s shareholders before exceptional
gains and losses (RMB)
1,338,285,260.99 1,007,918,868.52 32.78%
Net cash generated from/used in operating
activities (RMB) 263,967,132.26 2,341,638,100.64 -88.73%
Basic earnings per share (RMB/share) 2.74 2.04 34.31%
Diluted earnings per share (RMB/share) 2.74 2.04 34.31%
Weighted average return on equity (%) 12.85% 10.84% 2.01%
30 June 2021 31 December 2020 Change (%)
Total assets (RMB) 22,774,349,848.99 15,186,625,708.79 49.96%
Equity attributable to the listed company’s
shareholders (RMB) 15,621,511,888.56 10,043,288,013.73 55.54%
V Accounting Data Differences under Chinese Accounting Standards (CAS) and
International Financial Reporting Standards (IFRS) and Foreign Accounting Standards
1. Net Profit and Equity Differences under CAS and IFRS
□ Applicable √ Not applicable
No such differences for the Reporting Period.
2. Net Profit and Equity Differences under CAS and Foreign Accounting Standards
□ Applicable √ Not applicable
No such differences for the Reporting Period.

Interim Report 2021
~ 8 ~
XI Exceptional Gains and Losses
√ Applicable □ Not applicable
Unit: RMB
Item Amount Note
Gain or loss on disposal of non-current assets (inclusive of
impairment allowance write-offs) -2,117,355.04
Government grants through profit or loss (exclusive of government
grants given in the Company’s ordinary course of business at fixed
quotas or amounts as per the government’s uniform standards)
34,716,270.46
Gain or loss on fair-value changes on held-for-trading and
derivative financial assets and liabilities & income from disposal
of held-for-trading and derivative financial assets and liabilities
and other investments in debt obligations (exclusive of the
effective portion of hedges that arise in the Company’s ordinary
course of business)
6,470,100.21
Reversed portions of impairment allowances for receivables and
contract assets which are tested individually for impairment 1,949,809.53
Non-operating income and expense other than the above 25,569,436.70
Less: Income tax effects 16,593,381.40
Non-controlling interests effects (net of tax) 9,476,312.99
Total 40,518,567.47 --
Explanation of why the Company classifies a gain/loss item as exceptional according to the definition in the Explanatory
Announcement No. 1 on Information Disclosure for Companies Offering Their Securities to the Public—Exceptional Gain/Loss
Items, or reclassifies any exceptional item listed in the said explanatory announcement as recurrent:
□ Applicable √ Not applicable
No such cases for the Reporting Period.

Interim Report 2021
~ 9 ~
Part III Management Discussion and Analysis
I Principal Activity of the Company in the Reporting Period
The Company is subject to the Guideline No. 14 of the Shenzhen Stock Exchange on Information Disclosure by Industry—for Listed
Companies Engaging in Food and Liquor & Wine Production.
(I) Pricipal Activity of the Company
The Company primarily produces and markets liquor and spirits. According to the Industry Categorization Guide for Listed
Companies (Revised in 2012) issued by the CSRC, liquor and spirits making belongs to the “liquor, beverage and refined tea making
industry" (C15). During the reporting period, there was no change in the company's main business.
(II) Status of the Industry and Position of the Company in the Industry
1. Status of the Liquor and Spirits Industry
Since the beginning of the 21st century, China's liquor and spirits industry has experienced three development stages. Before 2012,
with rapid economic growth, the income of urban and rural residents rose fast, and the demand for liquor and spirits continued to
increase, while production and sales of liquor and spirits continuously expanded at a fast pace. As a result, the liquor and spirits
industry witnessed booming supply and demand. During that period, national liquor and spirits brands and local regional renowned
liquor enterprises achieved rapid development. In the context of the rise in both the demand and price of liquor and spirits, the sales
income and total profits of liquor enterprises increased quickly.
From the second half of 2012 to 2016, China's economy once again entered a period of adjustment, as the Chinese government
introduced a string of policies to restrict the spending on official overseas visits, official vehicles and official hospitality, such as the
"Eight-point Decision" and "Six Prohibitions", which include restrictions on the consumption of high-end alcohol with public funds.
Consumption scenarios such as commercial consumption and government consumption were limited, leading to a drop in consumer
demand in a short time. Moreover, liquor prices were under huge pressure. China's liquor and spirits industry entered a period of
profound adjustment. After 2012, both the output growth and income growth of China's liquor and spirits industry slowed down.
The liquor and spirits industry began to recover in the second half of 2016, with a rise in consumption demand by end-users,
propelling the growth of the overall income and profits of the industry. Since 2017, the overall demand and price of liquor and spirits
have increased, and the recovery of mid- and high-end liquor and spirits has picked up. In the future, benefiting from the
consumption upgrade and the change of consumption concept, the growth of sub-high-end liquor and spirits will be the key driver for
the development of the liquor and spirits industry. The consumption upgrade is the major driving force for the development of the
liquor and spirits industry. Liquor enterprises need to fully grasp the great opportunities from the extensive consumption upgrade and
strive to better meet the consumption needs of the market through quality improvement, market segmentation and product innovation
and other means, so as to advance the transformation and upgrade of the product structure.
2. Position of the Company in the Industry
China has a long history of liquor. There are a large number of liquor production enterprises in the country, but the regional
distribution of liquor consumers is particularly evident. The liquor and spirits industry is characterized by full competition, with a
high degree of marketization. The market competition is fierce, and the industry adjustments are constantly deepening. In the national
market, the competitive edges of the enterprises come from their brand influence, product style and marketing & operation models. In
a single regional market, the competitive strengths of the enterprises depend on their brand influence in the region, the recognition of
the companies by regional consumers and comprehensive marketing capacity.
As one of China’s traditional top eight liquor brands, the Company is the first listed liquor and spirits company with both A and B

Interim Report 2021
~ 10 ~
stocks. It is located in Bozhou City, Anhui Province in China, the hometown of historic figures Cao Cao and Hua Tuo, as well as one
of the world’s top 10 liquor-producing areas. No changes have occurred to the main business of the Company in the Reporting Period.
As the main product of the Company, the Gujing spirit originated as a “JiuYunChun Spirit”, together with its making secrets, being
presented as a hometown specialty by Cao Cao, a famous warlord in China’s history, to Emperor Han Xiandi (name: Liu Xie) in A.D.
196, and was continually presented to the royal house since then. With crystalline liquid, rich aroma, a fine flavor and a lingering
aftertaste, the Gujing spirit has helped the Company win four national distilled spirit golden awards, a golden award at the 13th SIAL
Paris, the title of China’s “Geographical Indication Product”, the recognition as a “Key Cultural Relics Site under the State
Protection”, the recognition with a “National Intangible Cultural Heritage Protection Project”, a Quality Award from the Anhui
provincial government, a title of “National Quality Benchmark”, among other honors. In 2020, Gujing Distillery ranked fourth in
China's liquor and spirits industry with a brand value of RMB197,136 million in the "Hua Liquor Cup" (list of Chinese liquor brands
by value).
In April 2016, Gujing gongjiu signed a strategic cooperation agreement with Huanghelou Liquor Co., Ltd., opening a new era of
cooperation in China's famous liquor industry. Yellow Crane Tower Baijiu is the only famous Chinese liquor in Hubei. Its unique
style is "soft, mellow, elegant and cool, and has a long lingering fragrance". It won the two China gold medal in liquor appreciation in
1984 and 1989. At present, Huanghelou liquor industry has three bases: Wuhan, Xianning and Suizhou. Among them, Huanghelou
Liquor Culture Expo Park in Wuhan base has been approved as national AAA scenic spot, and Huanghelou forest wine town in
Xianning base has been approved as national AAA scenic spot.
In January 2021, Gujing Distillery and Mingguang signed a strategic cooperation agreement. The unique mung bean flavor adds to
the famous liquor family of Gujing. This makes Gujing become a famous Chinese liquor maker with "three brands", "four flavors"
and "three production areas".
(Ⅲ)Main business conditions
During the reporting period, the company realized an operating revenue of 7.007 billion yuan,up 26.96% compared to the same
period of last year;a net profit attributable to owners of the Company as the parent of 1.379 billion yuan, representing a year-on-year
growth of 34.53%.
Brand operations:
The Company's Principal Product System
Principal product series Key representative products
Aged Original Liquor Series
Gu 26, Gu 20, Gu 16, Gu 8, Gu 5, and Tribute. Positioned as a high-end, sub-high-end, and
middle-end product series, Aged Original Liquor represents the key direction of the Company's
structural adjustment, and its main consumption scenarios are high-end business, family, daily
drinking, and banquet settings.
Gujing Liquor Series
Gujing Liquor V9, Gujing Liquor V6, Gujing Liquor 6th Gen, and Gujing Light Bottle. Positioned as
a mid/low-priced product series, Gujing Liquor Series is an effective supplement to Aged Original
Liquor Series, and its main consumption scenarios are banquets in some urban areas/towns and
holiday gifts.
Yellow Crane Tower Liquor
Series
Fragrant 900, Aged 1979, Ecological 15, and Floor Series-5 Floor. With a focus on the market of
Hubei Province, the product series forges a synergy with the Company's original brand in a
dual-brand matrix.
Main sales model
The Company's key sales model is dealer model. Under the dealer model, the Company will select one or more dealers for sales of a
product brand (or product sub-brand) according to the market capacity.
Distribution model:
√ Applicable □ Not applicable
1. Operating Performance by Distribution Channel and Product Category
Unit: RMB

Interim Report 2021
~ 11 ~
By Operating revenue Cost of sales Gross profit margin
YoY
change in
operating
revenue
(%)
YoY
change in
cost of
sales (%)
YoY
change
in gross
profit
margin
(%)
Channel
Online 278,464,746.88 66,280,349.19 76.20% 89.44% 91.77% -0.29%
Offline 6,729,031,720.86 1,587,537,998.12 76.41% 25.25% 24.09% 0.22%
Total 7,007,496,467.74 1,653,818,347.31 76.40% 26.96% 25.87% 0.20%
By Operating revenue Cost of sales Gross profit margin
YoY
change in
operating
revenue
(%)
YoY
change in
cost of
sales (%)
YoY
change
in gross
profit
margin
(%)
Product series
Aged Original Liquor 5,069,696,056.94 889,635,061.87 82.45% 15.49% 4.08% 1.92%
Gujinggong Liquor 806,233,596.57 326,766,742.30 59.47% 14.09% 16.14% -0.71%
Yellow Crane Tower 581,367,130.91 143,320,696.30 75.35% 319.60% 255.14% 4.47%
Total 6,457,296,784.42 1,359,722,500.47 78.94% 23.35% 15.58% 1.42%
2. Number of Distributors by Geographical Segment
Segment Increase Decrease Ending number
North China 166 83 929
South China 95 63 412
Central China 447 234 2,370
International 1 0 9
Total 709 380 3,720
3. Settlement Method and Dealing Mode
The Company mainly adopts the settlement in spot exchange and bank acceptance bills, and its dealing mode is mainly dealer agency
system.
Information about sales of top five dealers at the end of the period
No. Customer
Sales revenue
contributed for the
Reporting Period (RMB)
As % of total sales revenue (%) Ending accounts
receivable
1 Customer A 405,922,602.43 5.79% 0.00
2 Customer B 332,114,750.04 4.74% 0.00
3 Customer C 308,681,593.54 4.41% 0.00

Interim Report 2021
~ 12 ~
4 Customer D 127,440,788.33 1.82% 0.00
5 Customer E 95,650,783.14 1.36% 0.00
Total 1,269,810,517.48 18.12% 0.00
Proportion of store sales terminal exceeds 10%
□ Applicable √ Not applicable
Online direct sales
√ Applicable □ Not applicable
The major product varieties sold online are Aged Original Liquor Series, and Gujinggong Liquor Series, among others. The main
online sales platforms are Gujing Distillery platform, Tmall, JD.com, and Suning.com.
Any over 30% YoY movements in the selling price of main products contributing over 10% of current total operating revenue
□ Applicable √ Not applicable
Model and contents of purchase
The Company primarily adopts the bidding and strategic cooperation models. It also adopts the base planting model in order to
ensure the quality of some raw materials.
Major suppliers:
No. Supplier Purchase in the Reporting
Period (RMB) As % of total purchases (%)
1 Supplier A 182,709,628.22 11.07%
2 Supplier B 116,419,556.09 7.05%
3 Supplier C 83,020,171.96 5.03%
4 Supplier D 66,434,636.76 4.02%
5 Supplier E 50,344,694.17 3.05%
Total 498,928,687.20 30.22%
Purchase contents
Purchase contents Purchase model Amount (RMB’0,000)
1 Raw materials
Strategic purchasing 8,558.72
Tendering purchasing 45,123.55
2 Packing materials Tendering purchasing 111,391.56
Total 165,073.83
The proportion of raw materials purchased from cooperations or farmers to total purchase amount exceeds 30%
□ Applicable √ Not applicable
Any over 30% YoY movements in prices of main purchased raw materials
□ Applicable √ Not applicable
Main production model
The Company's existing production model is sales-based production. Specifically, the Logistics Control Center is responsible for

Interim Report 2021
~ 13 ~
coordinating the implementation of production plans, release of material production plans, and delivery and tracking of products, and
prepares balanced production plans on a quarterly basis according to the product inventory. The logistics distribution system is
coordinated according to the production schedule and inventory with a view to ensuring timely delivery of products.
Commissioned production
□ Applicable √ Not applicable
Breakdown of cost of sales
Item
H1 2021 H1 2020 Change
(%) Cost of sales (RMB) As % of total cost of
sales Cost of sales (RMB)
As % of total cost of
sales
Direct
materials 1,196,640,235.94 72.36% 973,724,541.41 74.11% 22.89%
Direct labor
cost 165,954,324.17 10.03% 153,910,567.38 11.71% 7.83%
Manufacturing
expenses 95,017,857.07 5.75% 83,318,785.82 6.34% 14.04%
Fuels 50,979,904.41 3.08% 49,878,003.58 3.80% 2.21%
Total 1,508,592,321.59 91.22% 1,260,831,898.19 95.96% 19.65%
Output and inventory
1. Output, sales volume and inventory of main products for the Reporting Period and respective YoY changes thereof
Unit: ton
Main product Output Sales volume inventory YoY changes
of output
YoY changes
of sales
volume
YoY
changes of
inventory
Aged Original Liquor Series 23,518.66 23,222.99 6,832.55 35.72% -7.33% 321.00%
Gujinggong Liquor Series 14,277.34 12,863.67 3,491.87 41.59% 14.13% 192.00%
Yellow Crane Tower Liquor
Series
3,858.38 4,782.75 690.57 75.53% 203.91% -49.00%
Other series 12,056.23 9,366.98 3184.83 78.26% 23.65% 372.00%
2. Ending inventory of finished liquor and semi-product
Category Ending quantity (ton)
Finished liquor 14,199.82
Semi-product 177,145.28
3. Capacity
Unit: ton
Main product Designed capacity Actual capacity Capacity in progress
Finished liquor 115,000 53,710.61 130,000

Interim Report 2021
~ 14 ~
II Core Competitiveness Analysis
No significant changes occurred to the Company’s core competitiveness in the Reporting Period.
III Analysis of Core Businesses
See contents under the heading “I Principal Activity of the Company in the Reporting Period”.
Year-on-year changes in key financial data:
Unit: RMB
H1 2021 H1 2020 Change (%) Main reason for change
Operating revenue 7,007,496,467.74 5,519,621,000.62 26.96%
Cost of sales 1,653,818,347.31 1,313,925,592.48 25.87%
Selling expense 2,028,265,595.93 1,618,049,637.27 25.35%
Administrative expense 467,727,393.70 395,687,673.15 18.21%
Finance costs -68,690,117.73 -68,208,467.94 -0.71%
Income tax expense 478,730,726.66 370,635,522.24 29.16%
Net cash generated
from/used in operating
activities
263,967,132.26 2,341,638,100.64 -88.73%
Increase in structured
deposits purchased in the
current period
Net cash generated
from/used in investing
activities
-355,501,003.11 61,995,665.31 -673.43% Increase in payments for
investments
Net cash generated
from/used in financing
activities
4,097,019,275.25 49,803,791.67 8,126.32% Arrival of raised funds
Net increase in cash and
cash equivalents 4,005,485,404.40 2,453,437,557.62 63.26% Arrival of raised funds
Material changes to the profit structure or sources of the Company in the Reporting Period:
□ Applicable √ Not applicable
No such changes in the Reporting Period.
Breakdown of operating revenue:
Unit: RMB
H1 2021 H1 2020
Change (%) Operating revenue
As % of total
operating revenue
(%)
Operating revenue
As % of total
operating revenue
(%)
Total 7,007,496,467.74 100.00% 5,519,621,000.62 100.00% 26.96%
By operating division

Interim Report 2021
~ 15 ~
Manufacturing 7,007,496,467.74 100.00% 5,519,621,000.62 100.00% 26.96%
By product category
Liquor and spirits 6,808,931,206.29 97.17% 5,432,930,105.02 98.43% 25.33%
Hotel services 37,407,083.13 0.53% 21,665,219.12 0.39% 72.66%
Other 161,158,178.32 2.30% 65,025,676.48 1.18% 147.84%
By operating segment
North China 504,700,256.97 7.20% 359,730,201.59 6.52% 40.30%
Central China 6,025,392,454.99 85.99% 4,877,164,641.53 88.36% 23.54%
South China 471,816,171.82 6.73% 281,661,275.86 5.10% 67.51%
Overseas 5,587,583.96 0.08% 1,064,881.64 0.02% 424.71%
Operating division, product category or operating segment contributing over 10% of operating revenue or operating profit:
√ Applicable □ Not applicable
Unit: RMB
Operating
revenue Cost of sales
Gross profit
margin
YoY change in
operating revenue
(%)
YoY change in
cost of sales (%)
YoY change in
gross profit
margin (%)
By operating division
Manufacturing 7,007,496,467.74 1,653,818,347.31 76.40% 26.96% 25.87% 0.20%
By product category
Liquor and spirits 6,808,931,206.29 1,508,592,321.59 77.84% 25.33% 19.65% 1.05%
Hotel services 37,407,083.13 20,502,666.17 45.19% 72.66% 58.98% 4.72%
Other 161,158,178.32 124,723,359.55 22.61% 147.84% 210.28% -15.57%
By operating segment
North China 504,700,256.97 132,704,568.25 73.71% 40.30% 32.24% 1.60%
Central China 6,025,392,454.99 1,410,414,975.52 76.59% 23.54% 23.13% 0.08%
South China 471,816,171.82 109,511,567.29 76.79% 67.51% 62.88% 0.66%
Overseas 5,587,583.96 1,187,236.25 78.75% 424.71% 36.28% 60.56%
Core business data of the prior year restated according to the changed statistical caliber for the Reporting Period:
□ Applicable √ Not applicable
Any over 30% YoY movements in the data above and why:
√ Applicable □ Not applicable
Due to a low base comparison as a result of the pandemic, exports and the hotel business both saw a year-on-year growth.
The Company is subject to the Guideline No. 14 of the Shenzhen Stock Exchange on Information Disclosure by Industry—for Listed
Companies Engaging in Food and Liquor & Wine Production.
Breakdown of selling expense:
Unit: RMB

Interim Report 2021
~ 16 ~
Item H1 2021 H1 2020 Change
(%) Reason
Employee
benefits 385,703,329.21 269,309,951.20 43.22%
Increase in employee benefits
Travel fees 79,727,177.78 55,722,038.26 43.08% Increase in business trips due to the improvement of
the pandemic
Advertisement
fees 467,467,773.39 453,767,973.19 3.02%
Transportation
charges 0.00 24,048,795.64 -100.00%
The transportation charges were turned into the item of
cost of sales to account as required by the new
standards governing revenue.
Comprehensive
promotion costs 685,618,164.57 475,881,977.13 44.07%
Increase in unrecognized expenses in more frequent
sales promotions
Service fees 359,748,787.06 299,367,311.62 20.17%
Others 50,000,363.92 39,951,590.23 25.15%
Total 2,028,265,595.93 1,618,049,637.27 25.35%
Details about advertisement
No. Main way Amount (RMB’0,000)
1 TV 28,276.58
2 Offline 15,874.68
3 Online 2,595.52
Total 46,746.78
IV Analysis of Non-Core Businesses
□ Applicable √ Not applicable
V Analysis of Assets and Liabilities
1. Significant Changes in Asset Composition
Unit: RMB
30 June 2021 31 December 2020 Change in
percentage
(%)
Reason for any significant
change Amount As % of total
assets Amount
As % of total
assets
Monetary assets 12,144,304,489.85 53.32% 5,971,212,569.66 39.32% 14.00%
Accounts
receivable 65,349,125.90 0.29% 67,933,735.91 0.45% -0.16%
Inventories 3,969,932,350.43 17.43% 3,416,880,808.96 22.50% -5.07%

Interim Report 2021
~ 17 ~
Investment
property 4,234,372.30 0.02% 4,392,943.54 0.03% -0.01%
Long-term
equity
investments
4,975,862.87 0.02% 4,915,575.83 0.03% -0.01%
Fixed assets 1,829,551,984.09 8.03% 1,797,789,271.62 11.84% -3.81%
Construction in
progress 425,876,594.64 1.87% 279,169,201.60 1.84% 0.03%
Right-of-use
assets 50,181,080.29 0.22% 0.00 0.00% 0.22%
Short-term
borrowings 72,231,000.00 0.32% 70,665,500.00 0.47% -0.15%
Contract
liabilities 2,213,592,055.02 9.72% 1,206,573,886.26 7.94% 1.78%
Long-term
borrowings 150,125,972.22 0.66% 60,117,638.89 0.40% 0.26%
Lease liabilities 47,677,911.46 0.21% 0.00 0.00% 0.21%
2. Major Assets Overseas
□ Applicable √ Not applicable
3. Assets and Liabilities at Fair Value
√ Applicable □ Not applicable
Unit: RMB
Item Beginning
amount
Gain/loss on
fair-value
changes in
the
Reporting
Period
Cumulative
fair-value
changes
charged to
equity
Impairment
allowance
for the
Reporting
Period
Purchased in
the Reporting
Period
Sold in the
Reporting
Period
Other
changes Ending amount
Financial assets
1.
Held-for-trading
financial assets
(exclusive of
derivative
financial assets)
203,877,915.51
5,237,242.40
209,115,157.91
Subtotal of 203,877,915.51 5,237,242.40 209,115,157.91

Interim Report 2021
~ 18 ~
financial assets
Total of the
above
203,877,915.51
5,237,242.40
209,115,157.91
Financial
liabilities 0.00 0.00 0.00
Significant changes to the measurement attributes of the major assets in the Reporting Period:
□ Yes √ No
4. Restricted Asset Rights as at the Period-End
Unit: RMB
Item Ending carrying value Reasons
Monetary assets 2,501,915,391.71 Structured deposit not available for advance withdrawal and
security deposits
Receivables financing 24,300,000.00 As pledge for banker’s acceptance bill
Total 2,526,215,391.71

Interim Report 2021
~ 19 ~
VI Investments Made
1. Total Investments Made
□ Applicable √ Not applicable
2. Significant Equity Investments Made in the Reporting Period
□ Applicable √ Not applicable
3. Significant Non-Equity Investments Ongoing in the Reporting Period
□ Applicable √ Not applicable
4. Financial Investments
(1) Securities Investments
√ Applicable □ Not applicable
Unit: RMB
Variety
of
securities
Code of
securities
Name of
securities
Initial
investment cost
Accounting
measurement
model
Beginning
carrying value
Gain/loss on
fair value
changes in
the
Reporting
Period
Cumulative
fair value
changes
charged to
equity
Purchased
in the
Reporting
Period
Sold in the
Reporting
Period
Gain/loss
in the
Reporting
Period
Ending
carrying value
Accounting title Funding
source
Fund DAPU Asset
Management 200,000,000.00
Fair value
method 203,877,915.51 5,237,242.40 0.00 0.00 0.00 1,625.42 209,115,157.91
Held-for-trading
financial assets
Self-owned
funds
Other ending holding securities
investments -- -- --

Interim Report 2021
~ 20 ~
Total 200,000,000.00 -- 203,877,915.51 5,237,242.40 0.00 0.00 0.00 1,625.42 209,115,157.91 -- --
Disclosure date of the
announcement about the board’s
consent for the securities
investment
Naught
Disclosure date of the
announcement about the general
meeting’s consent for the
securities investment (if any)
Naught
(2) Investments in Derivative Financial Instruments
√ Applicable □ Not applicable
Unit: RMB’0,000
Operator
Relationship
with the
Company
Related-party
transaction
Type of
derivative
Initial
investment
amount
Starting date Ending date
Beginning
investment
amount
Purchased in
the Reporting
Period
Sold in
the
Reporting
Period
Impairment
provision
(if any)
Ending
investment
amount
Proportion
of closing
investment
amount in
the
Company’s
ending net
assets
Actual
gain/loss
in the
Reporting
Period
Reverse
repurchase of
national debt
Naught No
Reverse
repurchase of
national debt
0.00 27 January
2021 1 July 2021 0.00 40,490 39,490 1,000 0.06% 46.44
Total 0.00 -- -- 0.00 40,490 39,490 1,000 0.06% 46.44
Capital source for derivative investment Company’s own funds

Interim Report 2021
~ 21 ~
Lawsuits involved (if applicable) N/A
Disclosure date of board announcement approving derivative
investment (if any) 30 August 2013
Disclosure date of shareholders’ meeting announcement
approving derivative investment (if any) N/A
Analysis of risks and control measures associated with
derivative investments held in the Reporting Period
(including but not limited to market risk, liquidity risk, credit
risk, operational risk, legal risk, etc.)
The Company had controlled the relevant risks strictly according to the Derivatives Investment Management System.
Changes in market prices or fair value of derivative
investments during the Reporting Period (fair value analysis
should include measurement method and related assumptions
and parameters)
Naught
Significant changes in accounting policies and specific
accounting principles adopted for derivative investments in
the Reporting Period compared to previous reporting period
Naught
Opinion of independent directors on derivative investments
and risk control
Based on the sustainable development of the main business and the sufficient free idle money, the Company increased the profits
through investing in the reasonable financial derivative instruments, which was in favor of improving the service efficiency of the
idle funds; in order to reduce the investment risks of the financial derivative instruments, the Company had set up corresponding
supervision mechanism for the financial derivative instrument business and formulated reasonable accounting policy as well as
specific principles of financial accounting; the derivative Investment business developed separately took national debts as
mortgage object, which was met with the cautious and steady risks management principle and the interest of the Company and
shareholders. Therefore, agreed the Company to develop the derivative Investment business of reverse repurchase of national debt
not more than the limit of RMB0.3 billion.

Interim Report 2021
~ 22 ~
VII Sale of Major Assets and Equity Interests
1. Sale of Major Assets
□ Applicable √ Not applicable
No such cases in the Reporting Period.
2. Sale of Major Equity Interests
□ Applicable √ Not applicable
VIII Main Controlled and Joint Stock Companies
√ Applicable □ Not applicable
Main subsidiaries and joint stock companies with an over 10% influence on the Company’s net profits
Unit: RMB
Company
name
Relationship with
the Company
Main business
scope Registered capital Total assets Net assets Operating
revenues
Operating
profit Net profit
Bozhou
Gujing Sales
Co., Ltd
Subsidiary
Wholesales of
distilled spirit,
construction
materials,
feeds,
assistant
materials, etc.
84,864,497.89 5,031,652,902.16 619,156,126.49 6,104,874,556.03 657,619,561.02 488,704,287.19
Anhui
Longrui
Glass Co.,
Subsidiary
Manufacture
and sale of
glass
86,660,268.98 410,741,113.04 348,456,392.89 141,077,429.68 26,188,902.74 22,078,147.50

Interim Report 2021
~ 23 ~
Ltd products, etc.
Yellow Crane
Tower Wine
Industry Co.,
Ltd
Subsidiary
Production
and sales of
distilled spirit,
etc.
400,000,000.00 1,297,092,584.41 634,897,821.96 690,959,858.06 121,300,166.54 93,504,686.38
Shanghai
Gujing
Jinhao Hotel
Management
Co., Ltd.
Subsidiary
Hotel
management,
house lease,
etc.
54,000,000.00 194,723,292.59 79,241,483.77 33,009,451.53 3,039,938.91 2,264,225.90
Subsidiaries obtained or disposed in the Reporting Period:
√ Applicable □ Not applicable
Subsidiary How subsidiary was obtained or disposed Effects on overall operations and performance
Anhui Mingguang Distillery Co., Ltd. Business combination not under conmmon control Boosting the development of the Company’s core business of liquor,
increase brand recognition and business size
Anhui Jiuhao China Railway Construction Engineering Co.,
Ltd. Incorporated with investment
Optimizing internal operation structure and enhancing endogenous
impetus
Anhui Jiuan Mechanical Electrical Equipment Co., Ltd. Incorporated with investment Optimizing internal operation structure and enhancing endogenous
impetus
Bozhou Gujing Waste Recycling Co., Ltd. De-registered
Notes to main controlled and joint stock companies:
Not applicable.
IX Structured Bodies Controlled by the Company
□ Applicable √ Not applicable

Interim Report 2021
~ 24 ~
X Risks Facing the Company and Countermeasures
(I) Operating Risk of the Company
1. The adverse effect of the systematic risk in macro-economic environment on the development of the industry and the Company.
2. Impact of industrial policy adjustment and change on the sustainable development of the Company.
3. Impact of normalization of COVID-19 epidemic on the consumption behaviors and habits.
(II) Operating Measures
1. Marketing
The Company accelerated efforts to promote its “sub-high-end products nationwide” by strengthening its presence in all provinces and regions, expanding market share and customer base, and
launching more individual products and outlets. As for brand building, the Company focused on increasing advertising and offline secondary promotion on CCTV, provincial satellite TV
stations, the Internet and new media outlets. To expand international market, it actively participated in major international events to promote its brand and products.
2. Product Management
In adherence to the “quality first” principle, the Company enhanced the spirit of craftsmen and awareness of quality and took solid actions to carry forward the Nie Guangrong Spirit in Gujing.
It furthered the deep integration of technical quality and liquor production, continuously carried out optimization research on production process concerning liquor making and yeast making,
and further optimized liquor making production technology. It conducted in-depth special inspection of quality management, strengthened the handling of production process and market
feedback, and effectively exercised closed-loop management. Upholding the green brewing principle, the Company continued to make procurement from raw grain base. Besides, it continued
to adopt the "strategic cooperation + grain base planting" model.
3. Engineering Construction
The Company accelerated the construction of the smart technology transformation project (smart park) for liquor production, and adhered to high standards and high quality to promote the
construction of smart park projects.
4. Informatization Construction
It accelerated the digital transformation and intensified the application and promotion of digital means. It actively pushed forward projects such as the integration of industry and financial
resources, while ensuring effective technical undertaking to further speed up the digital transformation and upgrading of Gujing.
5. Human Resource
Based on the demands of the Company’s strategic development, the Company continuously optimized the channels for talents introduction, further improved talent structure and salary
structure; strengthened the orientation of performance appraisal, continuously innovated performance management model; incessantly cemented talent echelon construction, conducted talent
training and cultivation in a comprehensive, multidimensional and targeted way.
6. Internal Management

Interim Report 2021
~ 25 ~
The Company regularly carried out special actions to "change work style, change methods, and strengthen implementation", raised ideological understanding and political position, listened to
the opinions of grass-roots business lines, ensured steady progress in work in strict accordance with the policies and the law, and actively cemented inter-departmental coordination and
collaboration. The Company actively guided managers to emancipate their minds, organized more training and study programs, thought outside the box, and adopted creative ways to address
problems.
7. Corporate Culture Construction
The Company upheld strict governance over the Party and strengthened party spirit education as per strict standards and requirements to establish and carry forward excellent work style. Work
style was into routine management. Actions were taken against unhealthy tendencies in a bid to create a culture featuring pragmatic thinking, simple life, and solid work style. The Company
should continue to strengthen the leadership team’s construction, temper the core team of “loyalty and cleanness”; continue to carry out warning education on integrity, and further build an
ideological line of defense against corruption; continue to rectify formalism, bureaucracy, and “laziness, randomness, fatigue, glibness and complacency” and dogmatism, cultivate pragmatic
and rigorous work style of cadres and employees; continue to strengthen ideological and political work, maintain the main position of cultural propaganda and ideological work; continue to
strengthen the leadership of Party building, and gather the strong power of the revolution.
In 2021, the Company will continue to be guided by Xi Jinping Thought on Socialism with Chinese Characteristics for a New Era and thoroughly implement the spirit of the 19th CPC
National Congress and the Second, Third, Fourth and Fifth Plenary Sessions of the 19th CPC Central Committee. Under the strong leadership of the Bozhou Municipal CPC Committee and
Municipal Government, the Company will firmly keep in alignment, boost the morale, strengthen the execution capacity, deeply practice the socialist core values, and uphold its values of "Be
Honest, Offer Quality Liquor, Be Stronger and Be Helpful to the Society". It will advocate and adhere to long-term perspective mindset, pursue excellence, produce high-quality products,
maintaining strategic resolve, enhance corporate management, work harder, and take concrete actions. It will strive to seek steady progress based on civilized management and technological
advances and become an enterprise with “digital and global operations and law-based management”.

Interim Report 2021
~ 26 ~
Part IV Corporate Governance
I Annual and Extraordinary General Meeting Convened during the Reporting Period
1. General Meetings Convened during the Reporting Period
Meeting Type Investor
participation ratio Convened date Disclosure date
Index to disclosed
information
The 2020 Annual
General Meeting
Annual General
Meeting 59.34% 25 May 2021 26 May 2021
For details, see
Announcement about
Resolutions of 2020
Annual General Meeting
of the Company disclosed
on China Securities
Journal, Shanghai
Securities News, Ta Kung
Pao (HK), and
http://www.cninfo.com.cn
on 26 May 2021.
2. Extraordinary General Meetings Convened at the Request of Preference Shareholders with Resumed
Voting Rights
□ Applicable √ Not applicable
II Change of Directors, Supervisors and Senior Management
□ Applicable √ Not applicable
No changes occurred to the Company’s directors, supervisors and senior management during the Reporting Period. For their
information, see the 2020 Annual Report.
III Interim Dividend Plan
□ Applicable √ Not applicable
The Company has no interim dividend plan, either in the form of cash or stock.
IV Equity Incentive Plans, Employee Stock Ownership Plans or Other Incentive Measures for
Employees
□ Applicable √ Not applicable
No such cases in the Reporting Period.

Interim Report 2021
~ 27 ~
Part V Environmental and Social Responsibility
I Major Environmental Issues
Indicate by tick mark whether the Company or any of its subsidiaries is a heavily polluting business identified by the environmental
protection authorities of China.
√ Yes □ No
Name of
polluter
Name of
major
pollutants
Way of
discharge
Numbe
r of
dischar
ge
outlets
Distribution
of discharge
outlets
Discharge
concentratio
n
Discharge
standards
implemente
d
Total
discharge
Approved total
discharge
Excessive
discharge
Anbui
Gujing
Distillery
Co., Ltd.
COD Directly
discharge 3
Gujing plant,
Zhangji plant,
Headquarter
plant
30.36mg/L
30.37mg/L
35.13mg/L
Gujing
plant≦50m
g/L
Zhangji
plant、
Headquarter
plant≦100
mg/L
Gujing
plant:14.76t
Zhangji
plant:3.03t
Headquarter
plant:27.38t
Gujing plant:
105.916t
Zhangji plant:
26.504t
Headquarter
plant:116.0596t
Naught
Anbui
Gujing
Distillery
Co., Ltd.
NH3-N Directly
discharge 3
Gujing plant,
Zhangji plant,
Headquarter
plant
0.62mg/L
0.79mg/L
0.86mg/L
Gujing
plant≦5mg/
L
Zhangji
plant、
Headquarter
plant≦10m
g/L
Gujing
plant:0.3t
Zhangji
plant:0.08t
Headquarter
plant:0.67t
Gujing plant:
10.5916t
Zhangji plant:
2.6504t
Headquarter
plant:11.60596t
Naught
Anbui
Gujing
Distillery
Co., Ltd.
Smoke
Organize
d
discharge
through
chimney
3
Gujing plant,
Zhangji plant,
Headquarter
plant
1.01mg/m³
1.7mg/m³
1.04mg/m³
Gujing
plant、
Headquarter
plant≦10m
g/m3
Zhangji
plant≦20m
g/ m3
Gujing
plant:0.14t
Zhangji
plant:0.02t
Headquarter
plant:0.38t
Gujing plant :
4.301t
Zhangji plant:/
Headquarter
plant:5.01t
Naught
Anbui
Gujing
Distillery
Co., Ltd.
Sulfur Diox
ide
Organize
d
discharge
through
3
Gujing plant,
Zhangji plant,
Headquarter
plant
5.71mg/m³
0.94mg/m³
11.58mg/m³
Gujing
plant、
Headquarter
plant≦35m
Gujing
plant:0.8t
Zhangji
plant:0.01t
Gujing plant :
15.055t
Zhangji plant:/
Headquarter
Naught

Interim Report 2021
~ 28 ~
chimney g/m3
Zhangji
plant≦50m
g/ m3
Headquarter
plant:4.33t
plant:17.536t
Anbui
Gujing
Distillery
Co., Ltd.
Nitrogen
oxide
Organize
d
discharge
through
chimney
3
Gujing plant,
Zhangji plant,
Headquarter
plant
10.07mg/m³
28.69mg/m³
23.67mg/m³
Gujing
plant、
Headquarter
plant≦50m
g/m3
Zhangji
plant≦150
mg/ m3
Gujing
plant:1.4t
Zhangji
plant:0.35t
Headquarter
plant:8.85t
Gujing plant :
21.056t
Zhangji plant:
10.318t
Headquarter
plant:25.051t
Naught
Anhui
Longrui
Glass Co.,
Ltd
Smoke
Organize
d
discharge
through
chimney
2 1# furnace
2# furnace
1.2mg/m³
1.2mg/m³ ≦10mg/m³
1# furnace:
0.124t
2# furnace:
0.19t
/ Naught
Anhui
Longrui
Glass Co.,
Ltd
Sulfur Diox
ide
Organize
d
discharge
through
chimney
2 1# furnace
2# furnace
5.6mg/m³
22.5mg/m³ ≦50mg/m³
1# furnace:
0.7t
2# furnace:
3.75t
/ Naught
Anhui
Longrui
Glass Co.,
Ltd
Nitrogen
oxide
Organize
d
discharge
through
chimney
2 1# furnace
2# furnace
61.4mg/m³
63.7mg/m³ ≦200mg/m³
1# furnace:
7.63t
2# furnace:
11t
/ Naught
Construction and operation of facilities for preventing pollution:
1. Construction and operation of the sewage control facilities of the listed Company and its subsidiary companies
(1) The sewage treatment capacity of the sewage treatment station of Zhangji plant of Anhui Gujing Distillery Co., Ltd is about 550
tons per day. IC anaerobic jar, improved A²/O and in-depth treatment process has been adopted. The sewage is discharged after
treatment and up to the standard, and discharge of sewage is in compliance with the direct discharge requirements in GB27631-2011
Discharge Standard of Water Pollutants for Fermentation Alcohol and Distilled Spirits Industry.
(2) The sewage treatment capacity of the sewage treatment station of the headquarters of Anhui Gujing Distillery Co., Ltd is about
4300 tons per day. IC anaerobic jar, A²/O and in-depth treatment process has been adopted. The sewage is discharged after treatment
and up to the standard, and discharge of sewage is in compliance with the direct discharge requirements in GB27631-2011 Discharge
Standard of Water Pollutants for Fermentation Alcohol and Distilled Spirits Industry.
(3) The sewage treatment capacity of the sewage treatment station of Gujing Subsidiary under Anhui Gujing Distillery Co., Ltd is
about 2600 tons per day. IC anaerobic jar, A²/O and in-depth treatment process is adopted. The sewage is discharged after treatment
and up to the standard, and discharge of sewage is in compliance with the direct discharge requirements in GB27631-2011 Discharge
Standard of Water Pollutants for Fermentation Alcohol and Distilled Spirits Industry.

Interim Report 2021
~ 29 ~
(4) The production and living sewage of Anhui Longrui Glass Co., Ltd is discharged into the sewage treatment station of Zhangji
Plant under Anhui Gujing Distillery Company Limited, and it is discharged after treatment and up to the standard.
2. Construction and operation situation of waste gas control facilities of the listed Company and its subsidiaries
(1) The flue gas control facilities of thermal power stations of the Headquarters and Gujing Subsidiary of Anhui Gujing Distillery
Company Limited run well, and waste gas is discharged through the 65-meter-tall exhaust funnel after the waste gas treatment is up
to the standard, adopting the process of cloth-bag dust removal + Limestone - Wet flue gas Desulfurization+ SNCR Denitrification by
non-catalytic reduction + SCR Denitrification by catalytic reduction + Wet electrostatic precipitator, and discharge of flue gas meets
the super-low discharge requirements (smoke ≤10mg/m3, SO2≤35mg/m3, NOx≤50mg/m3).
(2) The gas-fired boilers at Zhangji Plant under Anhui Gujing Distillery Company Limited operate in a steady manner, and waste gas
is discharged through the 20-meter-tall exhaust funnel, of which and discharge of flue gas meets the requirements for gas-fired boiler
in GB13271-2014 Emission Standard of Air Pollutants for Industrial Kiln and Furnace.
(3) 1#, 2# furnace flue gas treatment facilities of Anhui Longrui Glass Co., Ltd. are operating well. For 1# furnace, the company uses
bag dust removal + dry desulfurization + SCR catalytic reduction denitrification process. After it meets the standard, the exhaust gas
will be discharged through a 48-meter high exhaust pipe. The flue gas emission is in line with the glass industry A-class enterprise
emission requirements as set out in Technical Guide for the Development of Emergency Emission Reduction Measures for Key
Industries in Heavy Pollution Weather (soot ≤ 10 mg/m3, SO2 ≤ 50 mg/m3, NOx ≤ 200 mg/m3). For 2# furnace, the company adopts
bag dust removal + desulfurization tank + SCR low-temperature denitrification process, and the exhaust gas is discharged through a
50-meter high exhaust pipe after it meets the standard. The flue gas emission meets the glass industry A-class enterprise emission
requirements as set out in Technical Guide for the Development of Emergency Emission Reduction Measures for Key Industries in
Heavy Pollution Weather (soot ≤ 10 mg/m3, SO2 ≤ 50mg/m3, NOx ≤ 200 mg/m3).
(4) The Headquarter of Anhui Gujing Distillery Company Limited and Gujing Branch finished product coding machine exhaust gas
treatment facilities are operating well. By adopting photocatalytic oxidation technology, the Company’s flue gas emissions comply
with the Table 1 standard requirements of DB12/524-2014 Emission Standard for Industrial Enterprises Volatile Organic Compounds.
(5) The Headquarters of Anhui Gujing Distillery Company Limited and the odor treatment facilities of Zhangji Sewage Station are
operating well. By adopting technologies like photocatalytic oxidation and activated carbon adsorption, and the Company’s emission
of exhaust gas meets the requirements of Table 2 of the Standard for Emission of Pollutants.
In H1 2021, the environment protection facilities of the Company and its subsidiaries ran normally in general, main pollutants can
achieve up-to-standard discharge, environment information is opened to the public normally, and they have performed their social
responsibilities properly.
Environmental impact assessment of construction project and other administrative license situation in respect of
environmental protection
No. Item Category of EIA EIA approval (filing) time EIA approval (filing)
number
1
Intelligent Technical Transformation
Project of Liquor Production of
Anhui Gujing Distillery Co., Ltd.
Environment
affection report 2 February 2021 BHS【2021】No. 4
2
12# Intelligent Integrated Storage
Center Construction Project of
Anhui Gujing Distillery Co., Ltd.
Environment
affection form 17 March 2021 BHB【2021】No. 5
3 VOCs Advanced Treatment Project
of Anhui Longrui Glass Co., Ltd
Environment
affection form 14 April 2021 20213416000100000018
Emergency plan for sudden environment affairs

Interim Report 2021
~ 30 ~
The Company has formulated the Emergency Plan of Anhui Gujing Distillery Company Limited for Sudden Environmental Pollution
Accident, which has been filed with Bureau of Ecology and Environment of Bozhou (File No. 341602-2021-006-H). Emergency plan
drills have been carried out as planned.
Anhui Longrui Glass Co., Ltd has formulated the Emergency Plan of Anhui Longrui Glass Co., Ltd for Sudden Environmental
Pollution Accident, which has been filed with Bureau of Ecology and Environment of Bozhou (File No. 341602-2021-006-M).
Emergency plan drills have been carried out as planned.
Environmental self-monitoring scheme
Anhui Gujing Distillery Co., Ltd. has formulated the Self-Monitoring Scheme of Anhui Gujing Distillery Company Limited and
published it on the relevant website of Anhui Province.
Anhui Longrui Glass Co., Ltd has formulated the Self-Monitoring Scheme of Anhui Longrui Glass Co., Ltd and published it on the
relevant website of Anhui Province.
Administrative punishments received with respect to environmental issues in the Reporting Period
Naught
Other environment information that should be disclosed
Naught
Other related environment protection information
Naught
II Social Responsibility
During the Reporting Period, the Company, in accordance with the requirements for high-quality development of listed companies in
the new era, focused on its established strategies, actively responded to the expectations of society, shareholders and other
stakeholders, continuously improved its corporate governance structure, standardized its operations, attached importance to investor
relations, and took the initiative to fulfill its social responsibilities in the areas of protection of the rights and interests of suppliers,
customers and employees, and environmental protection and sustainable development. The Company upholds the core values of "Be
Honest, Offer Quality Liquor, Be Stronger and Be Helpful to the Society", actively builds and develops strategic partnerships with
suppliers and customers. Also, the Company focuses on communication and coordination with all relevant parties, jointly builds a
platform of trust and cooperation, and effectively fulfills the Company's social responsibility to suppliers and customers. The
Company continues to carry out training on vocational skills and production safety to improve the professional ability of employees
and the ability to prevent risks in their positions, and to establish a sound market-oriented compensation system. The Company and
its subsidiaries attach great importance to and continue to proceed with the improvement of ecological and environmental protection.
The Company has improved and implemented various environmental and ecological systems in accordance with the relevant
requirements of national laws and regulations, and has effectively performed its environmental protection duties.
Interim Report 2021
~ 31 ~
Part VI Significant Events
I Commitments of the Company’s De Facto Controller, Shareholders, Related Parties and
Acquirers, as well as the Company Itself and Other Entities Fulfilled in the Reporting Period
or Ongoing at the Period-End
□ Applicable √ Not applicable
No such cases in the Reporting Period.
II Occupation of the Company’s Capital by the Controlling Shareholder or any of Its Related
Parties for Non-Operating Purposes
□ Applicable √ Not applicable
No such cases in the Reporting Period.
III Irregularities in the Provision of Guarantees
□ Applicable √ Not applicable
No such cases in the Reporting Period.
IV Engagement and Disengagement of Independent Auditor
Are the interim financial statements audited?
□ Yes √ No
The interim financial statements have not been audited.
V Explanations Given by the Board of Directors and the Supervisory Committee Regarding
the Independent Auditor's “Modified Opinion” on the Financial Statements of the Reporting
Period
□ Applicable √ Not applicable
VI Explanations Given by the Board of Directors Regarding the Independent Auditor's
“Modified Opinion” on the Financial Statements of Last Year
□ Applicable √ Not applicable
VII Insolvency and Reorganization
□ Applicable √ Not applicable
No such cases in the Reporting Period.

Interim Report 2021
~ 32 ~
VIII Legal Matters
Significant lawsuits and arbitrations:
□ Applicable √ Not applicable
No such cases in the Reporting Period.
Other legal matters:
□ Applicable √ Not applicable
IX Punishments and Rectifications
□ Applicable √ Not applicable
No such cases in the Reporting Period.
X Credit Quality of the Company as well as its Controlling Shareholder and De Facto
Controller
□ Applicable √ Not applicable
XI Major Related-Party Transactions
1. Continuing Related-Party Transactions
□ Applicable √ Not applicable
No such cases in the Reporting Period.
2. Related-Party Transactions Regarding Purchase or Disposal of Assets or Equity Investments
□ Applicable √ Not applicable
No such cases in the Reporting Period.
3. Related-Party Transactions Regarding Joint Investments in Third Parties
□ Applicable √ Not applicable
No such cases in the Reporting Period.
4. Amounts Due to and from Related Parties
□ Applicable √ Not applicable
No such cases in the Reporting Period.
5. Transactions with Related Finance Companies, or Finance Companies Controlled by the Company
□ Applicable √ Not applicable

Interim Report 2021
~ 33 ~
The Company did not make deposits in, receive loans or credit from and was not involved in any other finance business with any
related finance company, finance company controlled by the Company or any other related parties.
6. Other Major Related-Party Transactions
□ Applicable √ Not applicable
No such cases in the Reporting Period.
XII Major Contracts and Execution thereof
1. Entrustment, Contracting and Leases
(1) Entrustment
□ Applicable √ Not applicable
No such cases in the Reporting Period.
(2) Contracting
□ Applicable √ Not applicable
No such cases in the Reporting Period.
(3) Leases
□ Applicable √ Not applicable
No such cases in the Reporting Period.
2. Major Guarantees
□ Applicable √ Not applicable
No such cases in the Reporting Period.
3. Cash Entrusted for Wealth Management
√ Applicable □ Not applicable
Unit: RMB’0,000
Type Funding source Amount Undue amount Unrecovered overdue
amount
Others Self-funded 20,000.00 20,000.00 0.00
Total 20,000.00 20,000.00 0.00
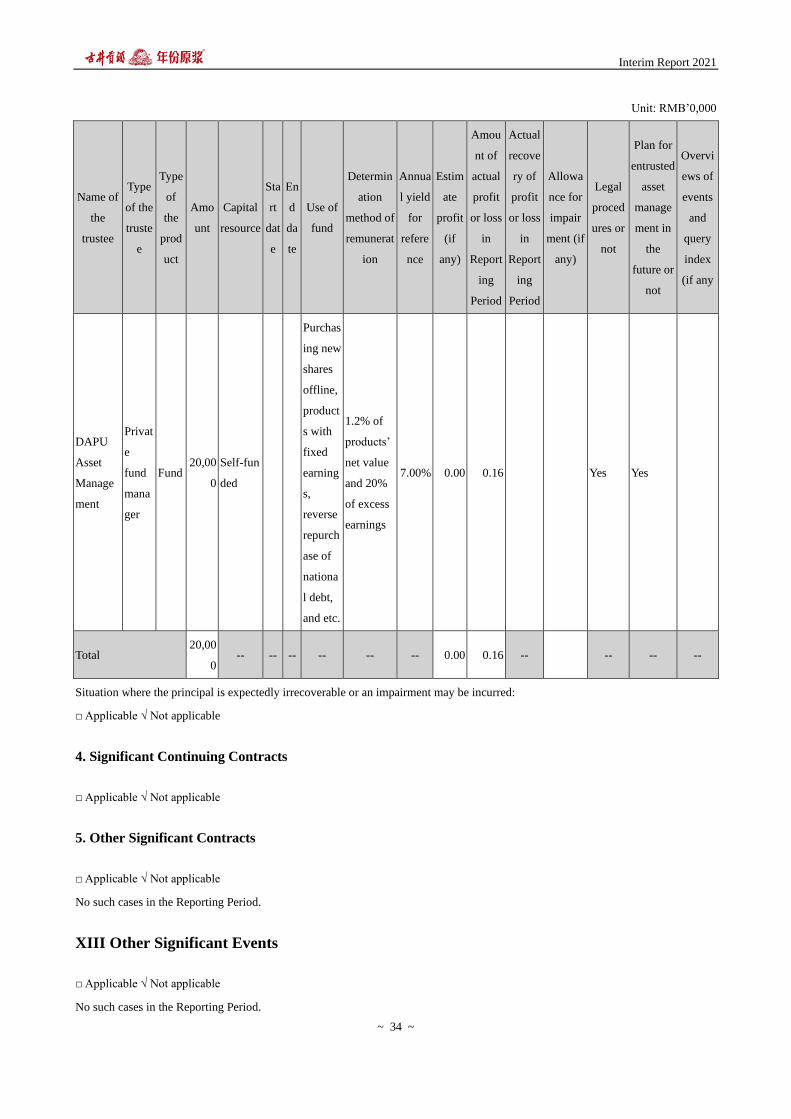
High-risk wealth management transactions with a significant single amount, or with low security, low liquidity or no principal
protection:
√ Applicable □ Not applicable
Interim Report 2021
~ 34 ~
Unit: RMB’0,000
Name of
the
trustee
Type
of the
truste
e
Type
of
the
prod
uct
Amo
unt
Capital
resource
Sta
rt
dat
e
En
d
da
te
Use of
fund
Determin
ation
method of
remunerat
ion
Annua
l yield
for
refere
nce
Estim
ate
profit
(if
any)
Amou
nt of
actual
profit
or loss
in
Report
ing
Period
Actual
recove
ry of
profit
or loss
in
Report
ing
Period
Allowa
nce for
impair
ment (if
any)
Legal
proced
ures or
not
Plan for
entrusted
asset
manage
ment in
the
future or
not
Overvi
ews of
events
and
query
index
(if any
DAPU
Asset
Manage
ment
Privat
e
fund
mana
ger
Fund 20,00
0
Self-fun
ded
Purchas
ing new
shares
offline,
product
s with
fixed
earning
s,
reverse
repurch
ase of
nationa
l debt,
and etc.
1.2% of
products’
net value
and 20%
of excess
earnings
7.00% 0.00 0.16 Yes Yes
Total 20,00
0 -- -- -- -- -- -- 0.00 0.16 -- -- -- --
Situation where the principal is expectedly irrecoverable or an impairment may be incurred:
□ Applicable √ Not applicable
4. Significant Continuing Contracts
□ Applicable √ Not applicable
5. Other Significant Contracts
□ Applicable √ Not applicable
No such cases in the Reporting Period.
XIII Other Significant Events
□ Applicable √ Not applicable
No such cases in the Reporting Period.

Interim Report 2021
~ 35 ~
XIV Significant Events of Subsidiaries
□ Applicable √ Not applicable

Interim Report 2021
~ 36 ~
Part VII Share Changes and Shareholder Information
I Share Changes
1. Share Changes
Unit: share
Before Increase/decrease (+/-) After
Percentage
(%)
New
issues
Shares as
dividend
converted
from
profit
Shares as
dividend
converted
from
capital
reserves
Other Subtotal Shares Percentage
(%)
Percentage
(%)
I. Restricted shares 0 0.00% 0 0.00%
II. Non-restricted shares 503,600,000 100.00% 503,600,000 100.00%
1 RMB ordinary shares 383,600,000 76.17% 383,600,000 76.17%
2 Domestically listed
foreign shares 120,000,000 23.83% 120,000,000 23.83%
III. Total shares 503,600,000 100.00% 503,600,000 100.00%
Reasons for share changes:
□ Applicable √ Not applicable
Approval of share changes:
□ Applicable √ Not applicable
Transfer of share ownership:
□ Applicable √ Not applicable
Effects of share changes on the basic and diluted earnings per share, equity per share attributable to the Company’s ordinary
shareholders and other financial indicators of the prior year and the prior accounting period, respectively:
□ Applicable √ Not applicable
Other information that the Company considers necessary or is required by the securities regulator to be disclosed:
□ Applicable √ Not applicable
2. Changes in Restricted Shares
□ Applicable √ Not applicable
II Issuance and Listing of Securities
√ Applicable □ Not applicable

Interim Report 2021
~ 37 ~
Name of
stock and its
derivative
securities
Issue date
Issue price
(or interest
rate)
Issued
number Listing date
Number
approved for
public trading
Termination
date of
transaction
Index to
disclosed
information
Disclosure
date
Stocks
Private
placement 23 June 2021
RMB200/sha
re 25,000,000 22 July 2021 25,000,000
For details,
see the
Report on the
Issuance of
the Private
Placement of
A-shares &
Announceme
nt on the
Listing of
These Shares
disclosed by
the Company
on
www.cninfo.
com.cn
21 July 2021
Particulars about the securities issued in the Reporting Period:
Approved by the China Securities Regulatory Commission under CSRC Permit [2021] No. 1422, the Company issued
RMB25,000,000 ordinary shares (A shares) to specific targets on 23 June 2021 at an issuing price of RMB200.00 per share, raising
total proceeds of RMB5,000,000,000.00. After deducting the expenses related to the issue of RMB45,657,925.15 (excluding VAT),
the actual net proceeds raised were RMB4,954,342,074.85. RSM (special ordinary partnership) has audited the availability of the
funds raised from the non-public offering of shares of the Company on 29 June 2021 and issued Capital Verification Report R.C.Y.Z
[2021] No. 518Z0050. The above shares were registered with the Shenzhen Branch of CSDC on 12 July 2021 and listed on the
Shenzhen Stock Exchange on 22 July 2021.
III Shareholders and Their Holdings as at the Period-End
Unit: share
Number of ordinary
shareholders 33,189
Number of preference shareholders with
resumed voting rights (if any) (see note 8) 0
5% or greater ordinary shareholders or the top 10 ordinary shareholders
Name of
shareholder
Nature of
shareholder
Shareholding
percentage
Total
ordinary
shares held
at the
period-end
Increase/decrease
in the Reporting
Period
Restricted
ordinary
shares
held
Non-restricted
ordinary
shares held
Shares in pledge or
frozen
Status Shares
ANHUI GUJING State-owned 53.89% 271,404,022 271,404,022 In pledge 114,000,000

Interim Report 2021
~ 38 ~
GROUP
COMPANY
LIMITED
legal person
GAOLING
FUND,L.P.
Foreign legal
person 2.47% 12,446,408 12,446,408
INDUSTRIAL
AND
COMMERCIAL
BANK OF CHINA
LIMITED-
INVESCO GREAT
WALL
EMERGING
GROWTH
HYBRID
SECURITIES
INVESTMENT
FUND
Other 1.89% 9,505,500 9,505,500
CHINA INT'L
CAPITAL CORP
HONG KONG
SECURITIES LTD
Foreign legal
person 1.77% 8,918,052 8,918,052
BANK OF
CHINA-CHINA
MERCHANTS
CHINA
SECURITIES
LIQUOR INDEX
CLASSIFICATION
SECURITIES
INVESTMENT
FUND
Other 1.60% 8,055,209 8,055,209
AGRICULTURAL
BANK OF CHINA
- E FUND
CONSUMPTION
SECTOR STOCK
SECURITIES
INVESTMENT
FUND
Other 1.58% 7,972,456 7,972,456
UBS (LUX)
EQUITY FUND -
Foreign legal
person 1.40% 7,048,161 7,048,161

Interim Report 2021
~ 39 ~
CHINA
OPPORTUNITY
(USD)
HONG KONG
SECURITIES
CLEARING
COMPANY LTD.
Foreign legal
person 1.19% 5,991,640 5,991,640
BANK OF
CHINA-
INVESCO GREAT
WALL DINGYI
HYBRID
SECURITIES
INVESTMENT
FUND (LOF)
Other 0.99% 4,995,403 4,995,403
GREENWOODS
CHINA ALPHA
MASTER FUND
Foreign legal
person 0.92% 4,614,326 4,614,326
Strategic investor or general legal
person becoming a top-10
ordinary shareholder due to rights
issue (if any) (see note 3)
N/A
Related or acting-in-concert
parties among the shareholders
above
Among the shareholders above, the Company’s controlling shareholder—Anhui Gujing Group
Company Limited—is not a related party of other shareholders; nor are they parties acting in
concert as defined in the Administrative Measures on Information Disclosure of Changes in
Shareholding of Listed Companies. As for the other shareholders, the Company does not know
whether they are related parties or whether they belong to parties acting in concert as defined in
the Administrative Measures on Information Disclosure of Changes in Shareholding of Listed
Companies.
Explain if any of the shareholders
above was involved in
entrusting/being entrusted with
voting rights or waiving voting
rights
N/A
Special account for share
repurchases (if any) among the
top 10 shareholders (see note 11)
N/A
Top 10 non-restricted ordinary shareholders
Name of shareholder Non-restricted shares held at the period-end Shares by type
Type Shares
ANHUI GUJING GROUP 271,404,022 RMB ordinary 271,404,022

Interim Report 2021
~ 40 ~
COMPANY LIMITED stock
GAOLING FUND,L.P. 12,446,408
Domestically
listed foreign
stock
12,446,408
INDUSTRIAL AND
COMMERCIAL BANK OF
CHINA LIMITED- INVESCO
GREAT WALL EMERGING
GROWTH HYBRID
SECURITIES INVESTMENT
FUND
9,505,500 RMB ordinary
stock 9,505,500
CHINA INT'L CAPITAL CORP
HONG KONG SECURITIES
LTD
8,918,052
Domestically
listed foreign
stock
8,918,052
BANK OF CHINA-CHINA
MERCHANTS CHINA
SECURITIES LIQUOR INDEX
CLASSIFICATION
SECURITIES INVESTMENT
FUND
8,055,209 RMB ordinary
stock 8,055,209
AGRICULTURAL BANK OF
CHINA - E FUND
CONSUMPTION SECTOR
STOCK SECURITIES
INVESTMENT FUND
7,972,456 RMB ordinary
stock 7,972,456
UBS (LUX) EQUITY FUND -
CHINA OPPORTUNITY (USD) 7,048,161
Domestically
listed foreign
stock
7,048,161
HONG KONG SECURITIES
CLEARING COMPANY LTD. 5,991,640
RMB ordinary
stock 5,991,640
BANK OF CHINA- INVESCO
GREAT WALL DINGYI
HYBRID SECURITIES
INVESTMENT FUND (LOF)
4,995,403 RMB ordinary
stock 4,995,403
GREENWOODS CHINA
ALPHA MASTER FUND 4,614,326
Domestically
listed foreign
stock
4,614,326
Related or acting-in-concert
parties among top 10 unrestricted
ordinary shareholders, as well as
between top 10 unrestricted
Among the shareholders above, the Company’s controlling shareholder—Anhui Gujing Group
Company Limited—is not a related party of other shareholders; nor are they parties acting in
concert as defined in the Administrative Measures on Information Disclosure of Changes in
Shareholding of Listed Companies. As for the other shareholders, the Company does not know

Interim Report 2021
~ 41 ~
ordinary shareholders and top 10
ordinary shareholders
whether they are related parties or whether they belong to parties acting in concert as defined in
the Administrative Measures on Information Disclosure of Changes in Shareholding of Listed
Companies.
Top 10 ordinary shareholders
involved in securities margin
trading (if any) (see note 4)
N/A
Indicate by tick mark whether any of the top 10 ordinary shareholders or the top 10 unrestricted ordinary shareholders of the
Company conducted any promissory repo during the Reporting Period.
□ Yes √ No
No such cases in the Reporting Period.
IV Change in Shareholdings of Directors, Supervisors and Senior Management
□ Applicable √ Not applicable
V Change of the Controlling Shareholder or the De Facto Controller
Change of the controlling shareholder in the Reporting Period
□ Applicable √ Not applicable
No such cases in the Reporting Period.
Change of the de facto controller in the Reporting Period
□ Applicable √ Not applicable
No such cases in the Reporting Period.

Interim Report 2021
~ 42 ~
Part VIII Preference Shares
□ Applicable √ Not applicable
No preference shares in the Reporting Period.

Interim Report 2021
~ 43 ~
Part IX Convertible Corporate Bonds
□ Applicable √ Not applicable
No convertible corporate bonds in the Reporting Period.

Interim Report 2021
~ 44 ~
Part X Financial Statements
I Independent Auditor’s Report
Are these interim financial statements audited by an independent auditor?
□ Yes √ No
These interim financial statements have not been audited by an independent auditor.
II Financial Statements
Currency unit for the financial statements and the notes thereto: RMB
1. Consolidated Balance Sheet
Prepared by Anhui Gujing Distillery Company Limited
30 June 2021
Unit: RMB
Item 30 June 2021 31 December 2020
Current assets:
Monetary assets 12,144,304,489.85 5,971,212,569.66
Settlement reserve
Interbank loans granted
Held-for-trading financial assets 209,115,157.91 203,877,915.51
Derivative financial assets
Notes receivable
Accounts receivable 65,349,125.90 67,933,735.91
Accounts receivable financing 2,003,302,090.64 1,673,510,794.51
Prepayments 113,375,594.34 55,575,543.21
Premiums receivable
Reinsurance receivables
Receivable reinsurance contract
reserve
Other receivables 86,173,732.22 33,451,121.48
Including: Interest receivable
Dividends receivable
Financial assets purchased under

Interim Report 2021
~ 45 ~
resale agreements
Inventories 3,969,932,350.43 3,416,880,808.96
Contract assets
Assets held for sale
Current portion of non-current assets
Other current assets 56,469,996.22 97,412,681.26
Total current assets 18,648,022,537.51 11,519,855,170.50
Non-current assets:
Loans and advances to customers
Investments in debt obligations
Investments in other debt obligations
Long-term receivables
Long-term equity investments 4,975,862.87 4,915,575.83
Investments in other equity
instruments 54,910,856.74 0.00
Other non-current financial assets
Investment property 4,234,372.30 4,392,943.54
Fixed assets 1,829,551,984.09 1,797,789,271.62
Construction in progress 425,876,594.64 279,169,201.60
Productive living assets
Oil and gas assets
Right-of-use assets 50,181,080.29 0.00
Intangible assets 1,023,016,905.08 934,711,977.79
Development costs
Goodwill 538,969,677.36 478,283,495.29
Long-term prepaid expense 65,781,236.57 64,591,933.65
Deferred income tax assets 126,821,441.54 96,972,421.95
Other non-current assets 2,007,300.00 5,943,717.02
Total non-current assets 4,126,327,311.48 3,666,770,538.29
Total assets 22,774,349,848.99 15,186,625,708.79
Current liabilities:
Short-term borrowings 72,231,000.00 70,665,500.00
Borrowings from the central bank
Interbank loans obtained
Held-for-trading financial liabilities

Interim Report 2021
~ 46 ~
Derivative financial liabilities
Notes payable 17,730,000.00 140,614,535.60
Accounts payable 469,238,592.62 505,206,561.86
Advances from customers
Contract liabilities 2,213,592,055.02 1,206,573,886.26
Financial assets sold under
repurchase agreements
Customer deposits and interbank
deposits
Payables for acting trading of
securities
Payables for underwriting of
securities
Employee benefits payable 362,172,696.63 498,129,114.76
Taxes payable 549,835,380.19 349,142,692.10
Other payables 1,794,127,565.68 1,396,599,161.14
Including: Interest payable
Dividends payable
Handling charges and commissions
payable
Reinsurance payables
Liabilities directly associated with
assets held for sale
Current portion of non-current
liabilities
Other current liabilities 675,219,788.39 320,792,383.03
Total current liabilities 6,154,147,078.53 4,487,723,834.75
Non-current liabilities:
Insurance contract reserve
Long-term borrowings 150,125,972.22 60,117,638.89
Bonds payable
Including: Preferred shares
Perpetual bonds
Lease liabilities 47,677,911.46 0.00
Long-term payables
Long-term employee benefits
payable

Interim Report 2021
~ 47 ~
Provisions
Deferred income 95,344,263.32 75,111,997.53
Deferred income tax liabilities 159,346,410.21 114,821,451.24
Other non-current liabilities
Total non-current liabilities 452,494,557.21 250,051,087.66
Total liabilities 6,606,641,635.74 4,737,774,922.41
Owners’ equity:
Share capital 528,600,000.00 503,600,000.00
Other equity instruments
Including: Preferred shares
Perpetual bonds
Capital reserves 6,224,747,667.10 1,295,405,592.25
Less: Treasury stock
Other comprehensive income 477,971.52 0.00
Specific reserve
Surplus reserves 256,902,260.27 256,902,260.27
General reserve
Retained earnings 8,610,783,989.67 7,987,380,161.21
Total equity attributable to owners of
the Company as the parent 15,621,511,888.56 10,043,288,013.73
Non-controlling interests 546,196,324.69 405,562,772.65
Total owners’ equity 16,167,708,213.25 10,448,850,786.38
Total liabilities and owners’ equity 22,774,349,848.99 15,186,625,708.79
Legal representative: Liang Jinhui The Company’s chief accountant: Zhu Jiafeng
Head of the Company’s financial department: Zhu Jiafeng
2. Balance Sheet of the Company as the Parent
Unit: RMB
Item 30 June 2021 31 December 2020
Current assets:
Monetary assets 8,863,352,312.80 4,287,808,756.66
Held-for-trading financial assets 209,115,157.91 203,877,915.51
Derivative financial assets

Interim Report 2021
~ 48 ~
Notes receivable
Accounts receivable 1,179,822.50 494,976.27
Accounts receivable financing 1,171,454,770.74 1,399,214,331.97
Prepayments 65,827,793.88 11,737,580.47
Other receivables 278,778,850.21 141,378,010.40
Including: Interest receivable
Dividends receivable
Inventories 3,197,095,753.40 2,976,360,208.66
Contract assets
Assets held for sale
Current portion of non-current assets
Other current assets 10,395,729.97 9,734,249.41
Total current assets 13,797,200,191.41 9,030,606,029.35
Non-current assets:
Investments in debt obligations
Investments in other debt obligations
Long-term receivables
Long-term equity investments 1,312,692,241.38 1,118,213,665.32
Investments in other equity
instruments
Other non-current financial assets
Investment property 4,234,372.30 4,392,943.54
Fixed assets 1,250,097,272.57 1,322,818,855.86
Construction in progress 211,265,074.95 139,865,487.21
Productive living assets
Oil and gas assets
Right-of-use assets 46,286,878.62 0.00
Intangible assets 403,977,549.81 369,163,089.18
Development costs
Goodwill
Long-term prepaid expense 46,153,493.43 44,072,241.78
Deferred income tax assets 24,343,790.14 30,716,488.80
Other non-current assets 75,999.80
Total non-current assets 3,299,050,673.20 3,029,318,771.49

Interim Report 2021
~ 49 ~
Total assets 17,096,250,864.61 12,059,924,800.84
Current liabilities:
Short-term borrowings
Held-for-trading financial liabilities
Derivative financial liabilities
Notes payable 0.00 74,535.60
Accounts payable 358,440,748.35 397,554,006.51
Advances from customers
Contract liabilities 1,169,598,913.91 1,130,074,436.39
Employee benefits payable 88,167,585.28 127,974,331.78
Taxes payable 336,741,977.34 200,876,134.49
Other payables 441,176,218.39 524,000,730.59
Including: Interest payable
Dividends payable
Liabilities directly associated with
assets held for sale
Current portion of non-current
liabilities
Other current liabilities 161,917,575.75 160,738,917.51
Total current liabilities 2,556,043,019.02 2,541,293,092.87
Non-current liabilities:
Long-term borrowings
Bonds payable
Including: Preferred shares
Perpetual bonds
Lease liabilities 43,739,404.14 0.00
Long-term payables
Long-term employee benefits
payable
Provisions
Deferred income 29,654,139.35 31,601,732.51
Deferred income tax liabilities 18,296,746.56 19,407,895.89
Other non-current liabilities
Total non-current liabilities 91,690,290.05 51,009,628.40
Total liabilities 2,647,733,309.07 2,592,302,721.27

Interim Report 2021
~ 50 ~
Owners’ equity:
Share capital 528,600,000.00 503,600,000.00
Other equity instruments
Including: Preferred shares
Perpetual bonds
Capital reserves 6,176,504,182.20 1,247,162,107.35
Less: Treasury stock
Other comprehensive income
Specific reserve
Surplus reserves 251,800,000.00 251,800,000.00
Retained earnings 7,491,613,373.34 7,465,059,972.22
Total owners’ equity 14,448,517,555.54 9,467,622,079.57
Total liabilities and owners’ equity 17,096,250,864.61 12,059,924,800.84
3. Consolidated Income Statement
Unit: RMB
Item H1 2021 H1 2020
1. Revenue 7,007,496,467.74 5,519,621,000.62
Including: Operating revenue 7,007,496,467.74 5,519,621,000.62
Interest income
Insurance premium income
Handling charge and
commission income
2. Costs and expenses 5,170,893,817.52 4,162,705,858.66
Including: Cost of sales 1,653,818,347.31 1,313,925,592.48
Interest expense
Handling charge and
commission expense
Surrenders
Net insurance claims paid
Net amount provided as
insurance contract reserve
Expenditure on policy
dividends
Reinsurance premium
expense

Interim Report 2021
~ 51 ~
Taxes and surcharges 1,069,811,252.05 887,997,040.72
Selling expense 2,028,265,595.93 1,618,049,637.27
Administrative expense 467,727,393.70 395,687,673.15
R&D expense 19,961,346.26 15,254,382.98
Finance costs -68,690,117.73 -68,208,467.94
Including: Interest
expense 4,457,905.49 28,973,275.97
Interest
income 72,689,006.99 96,891,173.45
Add: Other income 34,701,412.82 14,974,353.66
Return on investment (“-” for loss) -5,122,111.50 18,485,972.20
Including: Share of profit or loss
of joint ventures and associates 60,287.04 -53,631.34
Income from the
derecognition of financial assets at
amortized cost (“-” for loss)
Exchange gain (“-” for loss)
Net gain on exposure hedges (“-”
for loss)
Gain on changes in fair value (“-”
for loss) 5,237,242.40 -3,596,160.61
Credit impairment loss (“-” for
loss) 1,945,965.69 -388,444.57
Asset impairment loss (“-” for loss) 2,464,519.26 -5,693,185.77
Asset disposal income (“-” for
loss) 1,014,902.90 77,867.25
3. Operating profit (“-” for loss) 1,876,844,581.79 1,380,775,544.12
Add: Non-operating income 25,707,115.31 20,575,161.54
Less: Non-operating expense 3,255,078.91 24,273,656.49
4. Profit before tax (“-” for loss) 1,899,296,618.19 1,377,077,049.17
Less: Income tax expense 478,730,726.66 370,635,522.24
5. Net profit (“-” for net loss) 1,420,565,891.53 1,006,441,526.93
5.1 By operating continuity
5.1.1 Net profit from continuing
operations (“-” for net loss) 1,420,565,891.53 1,006,441,526.93
5.1.2 Net profit from discontinued
operations (“-” for net loss)
5.2 By ownership

Interim Report 2021
~ 52 ~
5.2.1 Net profit attributable to
owners of the Company as the parent 1,378,803,828.46 1,024,936,604.36
5.2.1 Net profit attributable to
non-controlling interests 41,762,063.07 -18,495,077.43
6. Other comprehensive income, net of
tax 796,619.20 0.00
Attributable to owners of the Company
as the parent 477,971.52 0.00
6.1 Items that will not be
reclassified to profit or loss 477,971.52 0.00
6.1.1 Changes caused by
remeasurements on defined benefit
schemes
6.1.2 Other comprehensive
income that will not be reclassified to
profit or loss under the equity method
6.1.3 Changes in the fair value of
investments in other equity instruments 477,971.52 0.00
6.1.4 Changes in the fair value
arising from changes in own credit risk
6.1.5 Other
6.2 Items that will be reclassified to
profit or loss
6.2.1 Other comprehensive
income that will be reclassified to profit
or loss under the equity method
6.2.2 Changes in the fair value of
investments in other debt obligations
6.2.3 Other comprehensive
income arising from the reclassification
of financial assets
6.2.4 Credit impairment
allowance for investments in other debt
obligations
6.2.5 Reserve for cash flow
hedges
6.2.6 Differences arising from the
translation of foreign
currency-denominated financial
statements
6.2.7 Other
Attributable to non-controlling
interests 318,647.68 0.00

Interim Report 2021
~ 53 ~
7. Total comprehensive income 1,421,362,510.73 1,006,441,526.93
Attributable to owners of the Company
as the parent 1,379,281,799.98 1,024,936,604.36
Attributable to non-controlling
interests 42,080,710.75 -18,495,077.43
8. Earnings per share
8.1 Basic earnings per share 2.74 2.04
8.2 Diluted earnings per share 2.74 2.04
Legal representative: Liang Jinhui The Company’s chief accountant: Zhu Jiafeng
Head of the Company’s financial department: Zhu Jiafeng
4. Income Statement of the Company as the Parent
Unit: RMB
Item H1 2021 H1 2020
1. Operating revenue 3,596,233,135.46 3,297,117,172.49
Less: Cost of sales 1,388,312,451.57 1,317,059,263.62
Taxes and surcharges 912,790,380.44 826,730,898.61
Selling expense 26,922,520.17 22,901,348.42
Administrative expense 274,336,727.36 287,708,363.27
R&D expense 12,595,670.28 9,137,959.37
Finance costs -33,519,413.78 -44,796,771.26
Including: Interest expense 1,102,140.59 28,288,982.29
Interest income 34,468,139.72 73,155,252.32
Add: Other income 4,448,910.21 4,622,731.11
Return on investment (“-” for
loss) -3,772,871.47 12,434,590.21
Including: Share of profit or
loss of joint ventures and associates
Income from the
derecognition of financial assets at
amortized cost (“-” for loss)
Net gain on exposure hedges (“-”
for loss)
Gain on changes in fair value (“-”
for loss) 5,237,242.40 -3,596,160.61

Interim Report 2021
~ 54 ~
Credit impairment loss (“-” for
loss) 1,815,211.93 540,745.12
Asset impairment loss (“-” for
loss) 2,968,599.03 -5,693,185.77
Asset disposal income (“-” for
loss) 1,217,988.71 60,176.99
2. Operating profit (“-” for loss) 1,026,709,880.23 886,745,007.51
Add: Non-operating income 17,347,810.40 15,201,396.26
Less: Non-operating expense 1,424,712.54 20,488,855.01
3. Profit before tax (“-” for loss) 1,042,632,978.09 881,457,548.76
Less: Income tax expense 260,679,576.97 232,611,329.35
4. Net profit (“-” for net loss) 781,953,401.12 648,846,219.41
4.1 Net profit from continuing
operations (“-” for net loss) 781,953,401.12 648,846,219.41
4.2 Net profit from discontinued
operations (“-” for net loss)
5. Other comprehensive income, net of
tax
5.1 Items that will not be reclassified
to profit or loss
5.1.1 Changes caused by
remeasurements on defined benefit
schemes
5.1.2 Other comprehensive income
that will not be reclassified to profit or
loss under the equity method
5.1.3 Changes in the fair value of
investments in other equity instruments
5.1.4 Changes in the fair value
arising from changes in own credit risk
5.1.5 Other
5.2 Items that will be reclassified to
profit or loss
5.2.1 Other comprehensive income
that will be reclassified to profit or loss
under the equity method
5.2.2 Changes in the fair value of
investments in other debt obligations
5.2.3 Other comprehensive income
arising from the reclassification of
financial assets

Interim Report 2021
~ 55 ~
5.2.4 Credit impairment allowance
for investments in other debt
obligations
5.2.5 Reserve for cash flow hedges
5.2.6 Differences arising from the
translation of foreign
currency-denominated financial
statements
5.2.7 Other
6. Total comprehensive income 781,953,401.12 648,846,219.41
7. Earnings per share
7.1 Basic earnings per share 1.55 1.29
7.2 Diluted earnings per share 1.55 1.29
5. Consolidated Cash Flow Statement
Unit: RMB
Item H1 2021 H1 2020
1. Cash flows from operating activities:
Proceeds from sale of commodities
and rendering of services 8,064,793,672.94 6,336,568,642.45
Net increase in customer deposits and
interbank deposits
Net increase in borrowings from the
central bank
Net increase in loans from other
financial institutions
Premiums received on original
insurance contracts
Net proceeds from reinsurance
Net increase in deposits and
investments of policy holders
Interest, handling charges and
commissions received
Net increase in interbank loans
obtained
Net increase in proceeds from
repurchase transactions
Net proceeds from acting trading of
securities
Tax rebates 3,388,614.96 3,020,222.21

Interim Report 2021
~ 56 ~
Cash generated from other operating
activities 1,598,870,662.08 1,323,750,535.31
Subtotal of cash generated from
operating activities 9,667,052,949.98 7,663,339,399.97
Payments for commodities and
services 1,273,004,707.79 733,871,614.50
Net increase in loans and advances to
customers
Net increase in deposits in the central
bank and in interbank loans granted
Payments for claims on original
insurance contracts
Net increase in interbank loans
granted
Interest, handling charges and
commissions paid
Policy dividends paid
Cash paid to and for employees 1,492,074,698.56 1,250,084,349.76
Taxes paid 2,121,640,018.53 1,853,009,320.89
Cash used in other operating
activities 4,516,366,392.84 1,484,736,014.18
Subtotal of cash used in operating
activities 9,403,085,817.72 5,321,701,299.33
Net cash generated from/used in
operating activities 263,967,132.26 2,341,638,100.64
2. Cash flows from investing activities:
Proceeds from disinvestment 396,849,809.53 309,070,000.00
Return on investment 1,258,176.12 18,539,603.54
Net proceeds from the disposal of
fixed assets, intangible assets and other
long-lived assets
1,570,219.30 92,400.01
Net proceeds from the disposal of
subsidiaries and other business units
Cash generated from other investing
activities
Subtotal of cash generated from
investing activities 399,678,204.95 327,702,003.55
Payments for the acquisition of fixed
assets, intangible assets and other
long-lived assets
285,092,874.96 220,906,338.24
Payments for investments 404,900,000.00 44,800,000.00

Interim Report 2021
~ 57 ~
Net increase in pledged loans granted
Net payments for the acquisition of
subsidiaries and other business units 65,186,333.10 0.00
Cash used in other investing
activities
Subtotal of cash used in investing
activities 755,179,208.06 265,706,338.24
Net cash generated from/used in
investing activities -355,501,003.11 61,995,665.31
3. Cash flows from financing activities:
Capital contributions received 4,962,827,169.81 0.00
Including: Capital contributions by
non-controlling interests to subsidiaries 5,280,000.00 0.00
Borrowings raised 130,330,000.00 50,094,500.00
Cash generated from other financing
activities
Subtotal of cash generated from
financing activities 5,093,157,169.81 50,094,500.00
Repayment of borrowings 228,437,703.59
Interest and dividends paid 759,464,406.09 290,708.33
Including: Dividends paid by
subsidiaries to non-controlling interests
Cash used in other financing
activities 8,235,784.88 0.00
Subtotal of cash used in financing
activities 996,137,894.56 290,708.33
Net cash generated from/used in
financing activities 4,097,019,275.25 49,803,791.67
4. Effect of foreign exchange rates
changes on cash and cash equivalents
5. Net increase in cash and cash
equivalents 4,005,485,404.40 2,453,437,557.62
Add: Cash and cash equivalents,
beginning of the period 5,636,903,693.74 2,944,749,918.09
6. Cash and cash equivalents, end of the
period 9,642,389,098.14 5,398,187,475.71
6. Cash Flow Statement of the Company as the Parent
Unit: RMB
Item H1 2021 H1 2020

Interim Report 2021
~ 58 ~
1. Cash flows from operating activities:
Proceeds from sale of commodities
and rendering of services 7,096,307,729.01 3,777,524,502.26
Tax rebates 0.00
Cash generated from other operating
activities 2,341,213,371.64 936,783,738.07
Subtotal of cash generated from
operating activities 9,437,521,100.65 4,714,308,240.33
Payments for commodities and
services 1,352,698,829.10 1,149,042,873.79
Cash paid to and for employees 501,300,793.46 450,118,968.16
Taxes paid 1,342,951,770.60 1,415,720,556.26
Cash used in other operating
activities 7,545,117,742.35 508,102,703.30
Subtotal of cash used in operating
activities 10,742,069,135.51 3,522,985,101.51
Net cash generated from/used in
operating activities -1,304,548,034.86 1,191,323,138.82
2. Cash flows from investing activities:
Proceeds from disinvestment 386,849,809.53 276,900,000.00
Return on investment 438,267.56 12,434,590.21
Net proceeds from the disposal of
fixed assets, intangible assets and other
long-lived assets
1,475,459.30 68,000.00
Net proceeds from the disposal of
subsidiaries and other business units 3,123,346.37 0.00
Cash generated from other investing
activities
Subtotal of cash generated from
investing activities 391,886,882.76 289,402,590.21
Payments for the acquisition of fixed
assets, intangible assets and other
long-lived assets
203,961,053.06 160,840,403.43
Payments for investments 394,900,000.00 21,800,000.00
Net payments for the acquisition of
subsidiaries and other business units 205,920,000.00 0.00
Cash used in other investing
activities
Subtotal of cash used in investing
activities 804,781,053.06 182,640,403.43
Net cash generated from/used in -412,894,170.30 106,762,186.78
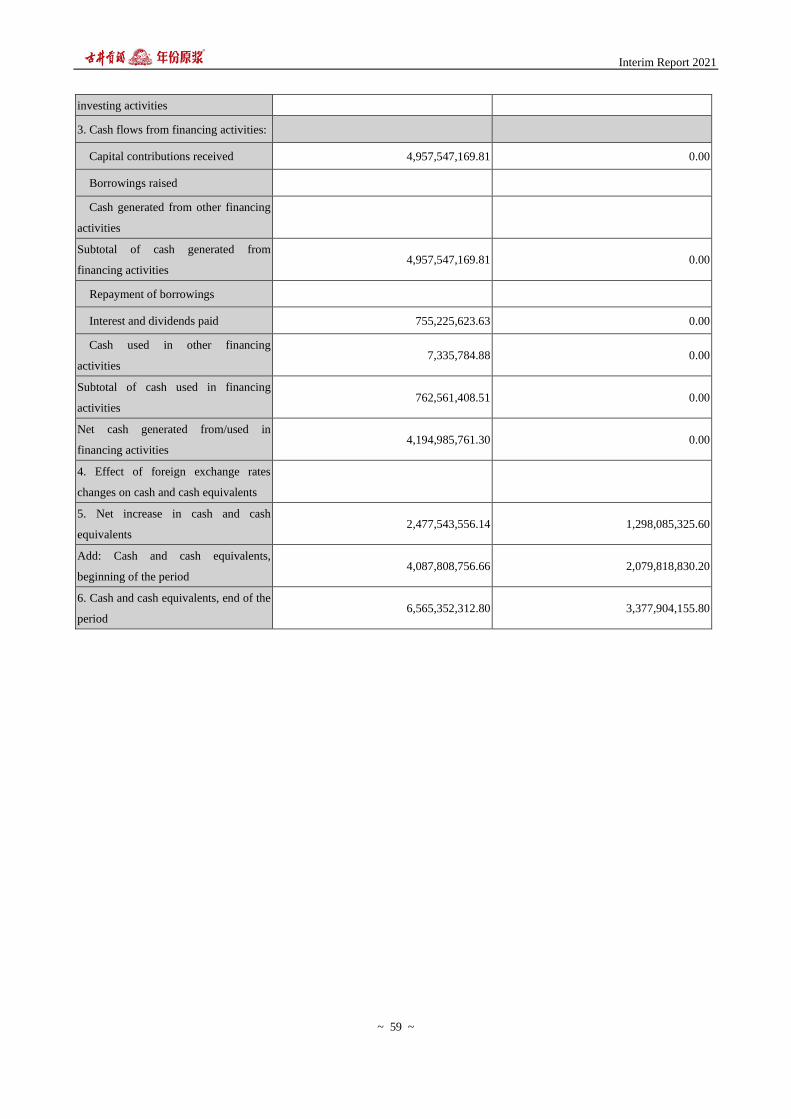
Interim Report 2021
~ 59 ~
investing activities
3. Cash flows from financing activities:
Capital contributions received 4,957,547,169.81 0.00
Borrowings raised
Cash generated from other financing
activities
Subtotal of cash generated from
financing activities 4,957,547,169.81 0.00
Repayment of borrowings
Interest and dividends paid 755,225,623.63 0.00
Cash used in other financing
activities 7,335,784.88 0.00
Subtotal of cash used in financing
activities 762,561,408.51 0.00
Net cash generated from/used in
financing activities 4,194,985,761.30 0.00
4. Effect of foreign exchange rates
changes on cash and cash equivalents
5. Net increase in cash and cash
equivalents 2,477,543,556.14 1,298,085,325.60
Add: Cash and cash equivalents,
beginning of the period 4,087,808,756.66 2,079,818,830.20
6. Cash and cash equivalents, end of the
period 6,565,352,312.80 3,377,904,155.80
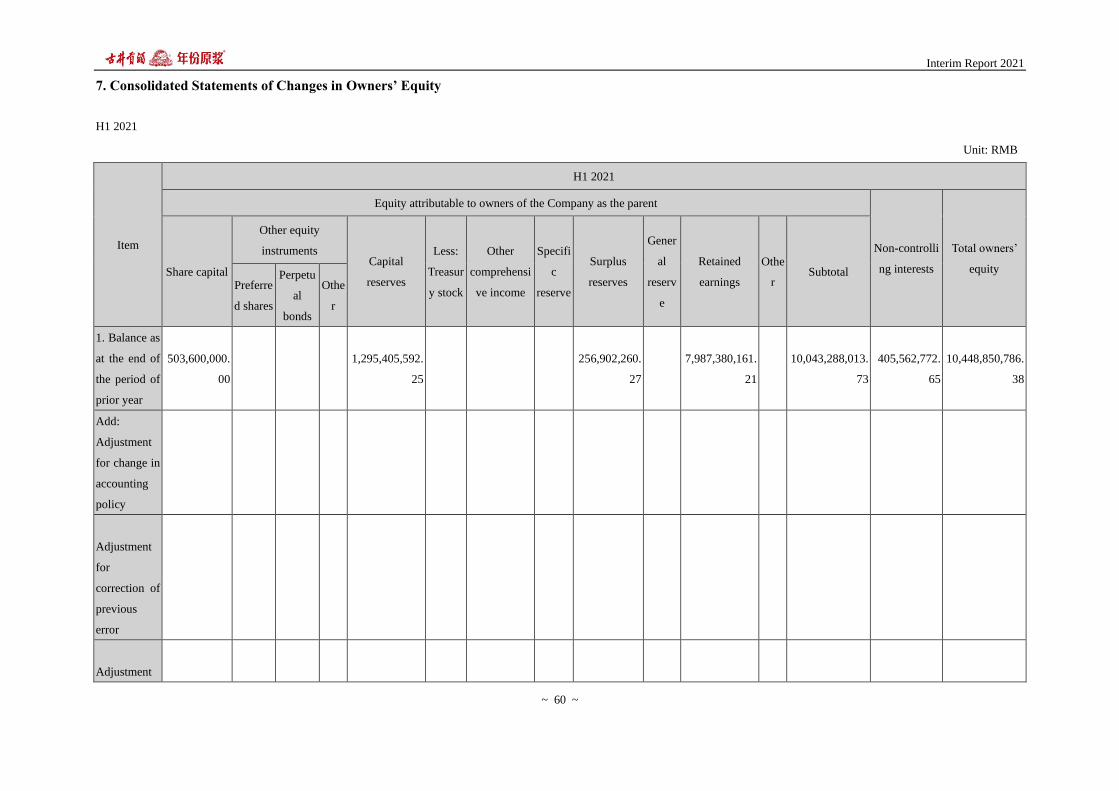
Interim Report 2021
~ 60 ~
7. Consolidated Statements of Changes in Owners’ Equity
H1 2021
Unit: RMB
Item
H1 2021
Equity attributable to owners of the Company as the parent
Non-controlli
ng interests
Total owners’
equity Share capital
Other equity
instruments Capital
reserves
Less:
Treasur
y stock
Other
comprehensi
ve income
Specifi
c
reserve
Surplus
reserves
Gener
al
reserv
e
Retained
earnings
Othe
r Subtotal
Preferre
d shares
Perpetu
al
bonds
Othe
r
1. Balance as
at the end of
the period of
prior year
503,600,000.
00
1,295,405,592.
25
256,902,260.
27
7,987,380,161.
21 10,043,288,013.
73
405,562,772.
65
10,448,850,786.
38
Add:
Adjustment
for change in
accounting
policy
Adjustment
for
correction of
previous
error
Adjustment

Interim Report 2021
~ 61 ~
for business
combination
under
common
control
Other
adjustments
2. Balance as
at the
beginning of
the
Reporting
Period
503,600,000.
00
1,295,405,592.
25
256,902,260.
27
7,987,380,161.
21 10,043,288,013.
73
405,562,772.
65
10,448,850,786.
38
3. Increase/
decrease in
the period
(“-” for
decrease)
25,000,000.0
0
4,929,342,074.
85 477,971.52
623,403,828.4
6 5,578,223,874.8
3
140,633,552.
04
5,718,857,426.8
7
3.1 Total
comprehensi
ve income
477,971.52 1,378,803,828.
46 1,379,281,799.9
8
42,080,710.7
5
1,421,362,510.7
3
3.2
Capital
increased
and reduced
by owners
25,000,000.0
0
4,929,342,074.
85
4,954,342,074.8
5
98,552,841.2
9
5,052,894,916.1
4
3.2.1
Ordinary
shares
25,000,000.0
0
4,929,342,074.
85
4,954,342,074.8
5 4,954,342,074.8
5

Interim Report 2021
~ 62 ~
increased by
owners
3.2.2
Capital
increased by
holders of
other equity
instruments
3.2.3
Share-based
payments
included in
owners’
equity
3.2.4
Other
98,552,841.2
9 98,552,841.29
3.3 Profit
distribution
-755,400,000.0
0 -755,400,000.00 -755,400,000.00
3.3.1
Appropriatio
n to surplus
reserves
3.3.2
Appropriatio
n to general
reserve
3.3.3
Appropriatio
-755,400,000.0
0 -755,400,000.00 -755,400,000.00
Interim Report 2021
~ 63 ~
n to owners
(or
shareholders
)
3.3.4
Other
3.4
Transfers
within
owners’
equity
3.4.1
Increase in
capital (or
share capital)
from capital
reserves
3.4.2
Increase in
capital (or
share capital)
from surplus
reserves
3.4.3
Loss offset
by surplus
reserves
3.4.4
Changes in

Interim Report 2021
~ 64 ~
defined
benefit
schemes
transferred to
retained
earnings
3.4.5
Other
comprehensi
ve income
transferred to
retained
earnings
3.4.6
Other
3.5
Specific
reserve
3.5.1
Increase in
the period
3.5.2
Used in the
period
3.6 Other
4. Balance as
at the end of
the
Reporting
528,600,000.
00
6,224,747,667.
10 477,971.52
256,902,260.
27
8,610,783,989.
67
15,621,511,888.
56
546,196,324.
69
16,167,708,213.
25

Interim Report 2021
~ 65 ~
Period
H1 2020
Unit: RMB
Item
H1 2020
Equity attributable to owners of the Company as the parent
Non-controlli
ng interests
Total owners’
equity Share capital
Other equity
instruments Capital
reserves
Less:
Treasur
y stock
Other
comprehensi
ve income
Specifi
c
reserve
Surplus
reserves
Gener
al
reserv
e
Retained
earnings
Othe
r Subtotal
Preferre
d shares
Perpetu
al bonds
Othe
r
1. Balance as
at the end of
the period of
prior year
503,600,000.
00
1,295,405,592.
25
256,902,260.
27
6,888,203,911.
92
8,944,111,764.
44
488,042,947.3
0
9,432,154,711.
74
Add:
Adjustment
for change in
accounting
policy
Adjustment
for
correction of
previous
error
Adjustment
for business
combination

Interim Report 2021
~ 66 ~
under
common
control
Other
adjustments
2. Balance as
at the
beginning of
the
Reporting
Period
503,600,000.
00
1,295,405,592.
25
256,902,260.
27
6,888,203,911.
92
8,944,111,764.
44
488,042,947.3
0
9,432,154,711.
74
3. Increase/
decrease in
the period
(“-” for
decrease)
269,536,604.36 269,536,604.36 -18,495,077.4
3 251,041,526.93
3.1 Total
comprehensi
ve income
1,024,936,604.
36
1,024,936,604.
36
-18,495,077.4
3
1,006,441,526.
93
3.2 Capital
increased
and reduced
by owners
3.2.1
Ordinary
shares
increased by
owners
3.2.2

Interim Report 2021
~ 67 ~
Capital
increased by
holders of
other equity
instruments
3.2.3
Share-based
payments
included in
owners’
equity
3.2.4
Other
3.3 Profit
distribution
-755,400,000.0
0
-755,400,000.0
0
-755,400,000.0
0
3.3.1
Appropriatio
n to surplus
reserves
3.3.2
Appropriatio
n to general
reserve
3.3.3
Appropriatio
n to owners
(or
shareholders)
-755,400,000.0
0
-755,400,000.0
0
-755,400,000.0
0

Interim Report 2021
~ 68 ~
3.3.4
Other
3.4
Transfers
within
owners’
equity
3.4.1
Increase in
capital (or
share capital)
from capital
reserves
3.4.2
Increase in
capital (or
share capital)
from surplus
reserves
3.4.3
Loss offset
by surplus
reserves
3.4.4
Changes in
defined
benefit
schemes
transferred to

Interim Report 2021
~ 69 ~
retained
earnings
3.4.5
Other
comprehensi
ve income
transferred to
retained
earnings
3.4.6
Other
3.5
Specific
reserve
3.5.1
Increase in
the period
3.5.2
Used in the
period
3.6 Other
4. Balance as
at the end of
the
Reporting
Period
503,600,000.
00
1,295,405,592.
25
256,902,260.
27
7,157,740,516.
28
9,213,648,368.
80
469,547,869.8
7
9,683,196,238.
67

Interim Report 2021
~ 70 ~
8. Statements of Changes in Owners’ Equity of the Company as the Parent
H1 2021
Unit: RMB
Item
H1 2021
Share capital
Other equity instruments
Capital reserves
Less:
Treasury
stock
Other
comprehensive
income
Specific
reserve
Surplus
reserves
Retained
earnings Other
Total owners’
equity Preferred
shares
Perpetual
bonds Other
1. Balance as at the
end of the period of
prior year
503,600,000.00 1,247,162,107.35 251,800,000.00 7,465,059,972.22 9,467,622,079.57
Add: Adjustment for
change in accounting
policy
Adjustment for
correction of previous
error
Other adjustments
2. Balance as at the
beginning of the
Reporting Period
503,600,000.00 1,247,162,107.35 251,800,000.00 7,465,059,972.22 9,467,622,079.57
3. Increase/ decrease
in the period (“-” for
decrease)
25,000,000.00 4,929,342,074.85 26,553,401.12 4,980,895,475.97
3.1 Total
comprehensive income 781,953,401.12 781,953,401.12
3.2 Capital
increased and reduced 25,000,000.00 4,929,342,074.85 4,954,342,074.85

Interim Report 2021
~ 71 ~
by owners
3.2.1 Ordinary
shares increased by
owners
25,000,000.00 4,929,342,074.85 4,954,342,074.85
3.2.2 Capital
increased by holders of
other equity
instruments
3.2.3 Share-based
payments included in
owners’ equity
3.2.4 Other
3.3 Profit
distribution -755,400,000.00 -755,400,000.00
3.3.1
Appropriation to
surplus reserves
3.3.2
Appropriation to
owners (or
shareholders)
-755,400,000.00 -755,400,000.00
3.3.3 Other
3.4 Transfers within
owners’ equity
3.4.1 Increase in
capital (or share
capital) from capital
reserves

Interim Report 2021
~ 72 ~
3.4.2 Increase in
capital (or share
capital) from surplus
reserves
3.4.3 Loss offset
by surplus reserves
3.4.4 Changes in
defined benefit
schemes transferred to
retained earnings
3.4.5 Other
comprehensive income
transferred to retained
earnings
3.4.6 Other
3.5 Specific reserve
3.5.1 Increase in
the period
3.5.2 Used in the
period
3.6 Other
4. Balance as at the
end of the Reporting
Period
528,600,000.00 6,176,504,182.20 251,800,000.00 7,491,613,373.34 14,448,517,555.54
H1 2020
Unit: RMB
Item H1 2020

Interim Report 2021
~ 73 ~
Share capital
Other equity instruments
Capital reserves
Less:
Treasury
stock
Other
comprehensive
income
Specific
reserve
Surplus
reserves
Retained
earnings Other
Total owners’
equity Preferred
shares
Perpetual
bonds Other
1. Balance as at the
end of the period of
prior year
503,600,000.00 1,247,162,107.35 251,800,000.00 6,397,131,020.62 8,399,693,127.97
Add: Adjustment for
change in accounting
policy
Adjustment for
correction of
previous error
Other adjustments
2. Balance as at the
beginning of the
Reporting Period
503,600,000.00 1,247,162,107.35 251,800,000.00 6,397,131,020.62 8,399,693,127.97
3. Increase/ decrease
in the period (“-” for
decrease)
-106,553,780.59 -106,553,780.59
3.1 Total
comprehensive
income
648,846,219.41 648,846,219.41
3.2 Capital
increased and
reduced by owners
3.2.1 Ordinary
shares increased by
owners
Interim Report 2021
~ 74 ~
3.2.2 Capital
increased by holders
of other equity
instruments
3.2.3
Share-based
payments included in
owners’ equity
3.2.4 Other
3.3 Profit
distribution -755,400,000.00 -755,400,000.00
3.3.1
Appropriation to
surplus reserves
3.3.2
Appropriation to
owners (or
shareholders)
-755,400,000.00 -755,400,000.00
3.3.3 Other
3.4 Transfers
within owners’ equity
3.4.1 Increase in
capital (or share
capital) from capital
reserves
3.4.2 Increase in
capital (or share
capital) from surplus

Interim Report 2021
~ 75 ~
reserves
3.4.3 Loss offset
by surplus reserves
3.4.4 Changes in
defined benefit
schemes transferred
to retained earnings
3.4.5 Other
comprehensive
income transferred to
retained earnings
3.4.6 Other
3.5 Specific
reserve
3.5.1 Increase in
the period
3.5.2 Used in
the period
3.6 Other
4. Balance as at the
end of the Reporting
Period
503,600,000.00 1,247,162,107.35 251,800,000.00 6,290,577,240.03 8,293,139,347.38

Interim Report 2021
~ 76 ~
Anhui Gujing Distillery Company Limited
Notes to Financial Statements for H1 2021
(Currency Unit Is RMB Unless Otherwise Stated)
1. BASIC INFORMATION ABOUT THE COMPANY
1.1 Corporate Information
Authorized by document WGZGZ (1996) No.053 of Anhui Administrative Bureau of State-owned Property,
Anhui Gujing Distillery Company Limited (“the Company”) was established as a limited liability company with
net assets of RMB377,167,700 and state-owned shares of 155,000,000 shares and considered Anhui Gujing
Company as the only promoter. The registration place was Bozhou Anhui China. The Company was established
on 5 March 1996 by document of WZM (1996) No.42 of Anhui People’s Government. The Company set up
plenary session on 28 May 1996 and registered in Anhui on 30 May 1996 with business license of 14897271-1.
The Company has issued 60,000,000 domestic listed foreign shares (“B” shares) in June 1996 and 20,000,000
ordinary shares (“A shares) on September 1996, ordinary shares are listed in national and par value is RMB1.00
per share. Those A shares and B shares are listed in Shenzhen Stock exchange.
Headquarter of the Company is located in Gujing Bozhou Anhui. The Company and its subsidiaries (the Company)
specialize in producing and selling white spirit.
Registered capitals of the Company were RMB235,000,000 with stocks of 235,000,000, of which 155,000,000
shares were issued in China, B shares of 60,000,000 shares and A shares of 20,000,000 shares. The book value of
the stocks of the Company was of RMB1 per share.
On 29 May 2006, a shareholder meeting was held to discuss and approval a program of equity division of A share,
the program was implement in June 2006. After implementation, all shares are outstanding share, which include
147,000,000 shares with restrict condition on disposal, represent 62.55% of total equity, and 88,000,000 shares
without restrict condition on disposal, represent 37.45% of total equity.
The Company issued <Announcement of release restriction shares by Anhui Gujing Distillery Company Limited>
on 27 June 2007, 11,750,000 outstanding shares with restrict condition on disposal are listed in stock market on 29
June 2007. Up to that day, outstanding shares with restrict condition on disposal are 135,250,000, representing
57.55% of total equity, the share without restrict condition are 99,750,000, representing 42.45% of total equity.
The Company issued <Announcement of release restriction shares by Anhui Gujing Distillery Company Limited>
on 17 July 2008, 11,750,000 outstanding shares with restrict condition on disposal are listed in stock market on 18
July 2008. Up to that day, outstanding shares with restrict condition on disposal are 123,500,000, representing
52.55% of total equity, the share without restrict condition are 111,500,000, representing 47.45% of total equity.
The Company issued <Announcement of release restriction shares by Anhui Gujing Distillery Company Limited>
on 24 July 2009, 123,500,000 outstanding shares with restrict condition on disposal are listed in stock market on

Interim Report 2021
~ 77 ~
29 July 2009. Up to that day, the Company’s all shares are all tradable.
Approved by the CSRC Document Zheng-Jian-Xu-Ke [2011] No. 943, the Company privately offered 16,800,000
ordinary shares (A-shares) to special investors on 15 July 2011, with a par value of RMB1 and the price of
RMB75.00 per share, raising RMB1,260,000,000.00 in total, the net amount of raised funds stood at
RMB1,227,499,450.27 after deducting RMB32,500,549.73 of various issuance expenses. Certified Public
Accountants verified the raised capital upon its arrival and issued the Capital Verification Report Reanda-Yan-Zi
[2011] No. 1065. After private issuance, the share capital of the Company increased to RMB251.8 million.
Pursuant to the Resolution of The 2011 Annual General Meeting, the Company that considered 251,800,000
shares as base number on 31 December 2011 transferred capital reserve into share capital at a rate of “10 shares
for per 10 shares” accounting for 251,800,000 shares and implemented in the year of 2012. Upon the transference,
the registered capitals increased to RMB503,600,000.
In April 2016, the Company entered a strategic cooperation agreement with Wuhan Tianlong Yellow Crane Tower
Co., Ltd., creating a new age for cooperation related to Chinese famous spirit. As the only Chinese famous spirit
in Hubei Province, it features unique mellow taste, elegant appearance and tempting smell. Moreover, Yellow
Crane Tower White Spirit won the Golden Prize respectively in 1984 and 1989 National White Spirit Appraisal
Competition as one of the business card representing Hubei Province’s economy. At present, the Company has
established three major bases in Wuhan, Xianning and Suizhou, of which, Xianning Base has integrated
modernism, ecologism and high technology as a new spirit-making base, known as “the most beautiful chateau in
China”. In 2016, Yellow Crane Tower Spirit won “2015 Top 10 Star Product in Hubei Province”.
In January 2021, the Company and Mingguang Distillery signed a strategic cooperation agreement. The unique
mung bean flavor adds to the famous liquor family of Gujing. This makes Gujing become a famous Chinese liquor
maker with "three brands", "four flavors" and "three production areas".
By 30 June 2021, the Company issued 528,600,000 shares.
The Company is registered at Gujing Town, Bozhou City, Anhui Province.
The approved business of the Company including procurement of grain (operating with business license),
manufacture of distilled spirits, wine distilling facilities, packaging material, bottles, alcohol, grease (limited to
byproducts from wine manufacture), and research and development of high-tech, biotechnology development,
agricultural and sideline products deep processing, as well as sale of self-manufacturing products.
The Company as the parent and the final company as the parent is Anhui Gujing Company Co., Ltd in China.
Financial statement of the Company will be released on 27 August 2021 by the Board of Directors.
1.2 Scope of Consolidation and Changes Thereof
(1) Incorporated subsidiaries of the Company
Name of Subsidiaries
Proportion of Shareholding (or similar equity interest)
(%)
Direct Indirect

Interim Report 2021
~ 78 ~
Name of Subsidiaries
Proportion of Shareholding (or similar equity interest)
(%)
Direct Indirect
Bozhou Gujing Sales Co., Ltd. 100.00 -
Anhui Longrui Glass Co., Ltd 100.00 -
Bozhou Gujing Waste Reclamation Co., Ltd. (cancelled) 100.00 -
Anhui Jinyunlai Culture & Media Co., Ltd. 100.00 -
Anhui Ruisiweier Technology Co., Ltd. 100.00 -
Shanghai Gujing Jinhao Hotel Management Co., Ltd. 100.00 -
Bozhou Gujing Hotel Co., Ltd 100.00 -
Anhui Yuanqing Environmental Protection Co., Ltd. 100.00 -
Anhui Gujing Yunshang E-commerce Co., Ltd. 100.00 -
Anhui Zhenrui Construction Engineering Co., Ltd - 52.00
Anhui RunAnXinKe Testing Technology Co., Ltd. 100.00 -
Anhui Jiudao Culture Media Co., Ltd. 100.00 -
Anhui Jiuan Mechanical Electrical Equipment Co., Ltd. 100.00
Anhui Jiuhao China Railway Construction Engineering Co., Ltd. 52.00
Anhui Mingguang Wine Co., Ltd. 60.00
Mingguang Tiancheng Ming Wine Sales Co., Ltd. 60.00
Fengyang Xiaogang Village Ming Wine Distillery Co., Ltd. 42.00
Yellow Crane Tower Distillery Co., Ltd. 51.00 -
Yellow Crane Tower Distillery (Xianning) Co., Ltd. - 51.00
Yellow Crane Tower Distillery (Suizhou) Co., Ltd. - 51.00
Hubei Junlou Cultural Tourism Co., Ltd. - 51.00
Hubei Yellow Crane Tower Beverage Co., Ltd. - 51.00
Wuhan Yashibo Technology Co., Ltd. - 51.00
Hubei Xinjia Testing Technology Co., Ltd. - 51.00
Wuhan Tianlong Jindi Technology Development Co., Ltd - 51.00
Xianning Junhe Sales Co., Ltd - 51.00
Wuhan Junya Sales Co., Ltd - 51.00

Interim Report 2021
~ 79 ~
Name of Subsidiaries
Proportion of Shareholding (or similar equity interest)
(%)
Direct Indirect
Suizhou Junhe Commercial Co., Ltd. - 51.00
For details of the subsidiaries mentioned above, please refer to Note 7 INTEREST IN OTHER ENTITIES
(2) Change of the scope of consolidation
Compared with the previous period, the newly incorporated subsidiaries during the reporting period were Anhui
Mingguang Distillery Co., Ltd., Mingguang Tiancheng Ming Wine Sales Co., Ltd., Fengyang Xiaogang Village
Ming Wine Distillery Co., Ltd., Anhui Jiuhao China Railway Construction Engineering Co., Ltd., Anhui Jiuan
Mechanical Electrical Equipment Co., Ltd., and one subsidiary Bozhou Gujing Waste Reclamation Co., Ltd. was
cancelled.
2. BASIS OF PREPARATION OF THE FINANCIAL STATEMENTS
2.1 Basis for Preparation
On the basis of continuous operations, the Company shall confirm and measure actual transactions and events in
accordance with the Accounting Standards for Business Enterprises and its Application Guidelines and
Interpretation of the Standards, and prepare financial statements. Besides, the Company also discloses relevant
financial information in accordance with the China Securities Regulatory Commission (CSRC) Rules No. 15 on
the Compilation and Reporting of Corporate Information on Public Offerings -- General Provisions on Financial
Reports (2014 Revision).
2.2 Continuation
The Company has assessed its ability to continually operate for the next twelve months from the end of the
reporting period, and no any matters that may result in doubt on its ability as a going concern were noted.
Therefore, it is reasonable for the Company to prepare financial statements on the going concern basis.
3. Important Accounting Policies and Estimations
The following important accounting policies and estimates of the Company shall be formulated in accordance
with the Accounting Standards for Business Enterprises. The business not mentioned shall be carried out in
accordance with the relevant accounting policies in the Accounting Standards for Business Enterprises.
3.1 Statement of Compliance with the Accounting Standards for Business Enterprises
The financial statements prepared by the Company are in compliance with in compliance with the Accounting
Standards for Business Enterprises, which factually and completely present the Company’s financial positions on
30 June 2021, changes of owners’ equity, business results and cash flows and other relevant information for H1
2021.
3.2 Fiscal Period

Interim Report 2021
~ 80 ~
The accounting year of the Company is from January 1 to December 31 in calendar year.
3.3 Operating Cycle
The normal operating cycle of the Company is one year.
3.4 Currency Used in Bookkeeping
The Company's functional currency is RMB, and its overseas subsidiaries are operated in the currency of the main
economic environment in which they operate.
3.5 Accounting Treatment of Business Combinations under and not under Common Control
(a) Business combinations under common control
The assets and liabilities that the Company obtains in a business combination under common control shall be
measured at their carrying amount of the acquired entity at the combination date. If the accounting policy adopted
by the acquired entity is different from that adopted by the acquiring entity, the acquiring entity shall, according to
accounting policy it adopts, adjust the relevant items in the financial statements of the acquired party based on the
principal of materiality. As for the difference between the carrying amount of the net assets obtained by the
acquiring entity and the carrying amount of the consideration paid by it, the capital reserve (capital premium or
share premium) shall be adjusted. If the capital reserve (capital premium or share premium) is not sufficient to
absorb the difference, any excess shall be adjusted against retained earnings.
For the accounting treatment of business combination under common control by step acquisitions, please refer to
Note 3.6 (6).
(b) Business combinations not under common control
The assets and liabilities that the Company obtains in a business combination not under common control shall be
measured at their fair value at the acquisition date. If the accounting policy adopted by the acquired entity is
different from that adopted by the acquiring entity, the acquiring entity shall, according to accounting policy it
adopts, adjust the relevant items in the financial statements of the acquired entity based on the principal of
materiality. The acquiring entity shall recognise the positive balance between the combination costs and the fair
value of the identifiable net assets it obtains from the acquired entity as goodwill. The acquiring entity shall,
pursuant to the following provisions, treat the negative balance between the combination costs and the fair value
of the identifiable net assets it obtains from the acquired entity:
(i) It shall review the measurement of the fair values of the identifiable assets, liabilities and contingent liabilities
it obtains from the acquired entity as well as the combination costs;
(ii) If, after the review, the combination costs are still less than the fair value of the identifiable net assets it
obtains from the acquired entity, the balance shall be recognised in profit or loss of the reporting period.
For the accounting treatment of business combination under the same control by step acquisitions, please refer to
Note 3.6 (f).
(c) Treatment of business combination related costs

Interim Report 2021
~ 81 ~
The intermediary costs such as audit, legal services and valuation consulting and other related management costs
that are directly attributable to the business combination shall be charged in profit or loss in the period in which
they are incurred. The costs to issue equity or debt securities for the consideration of business combination shall
be recorded as a part of the value of the respect equity or debt securities upon initial recognition.
3.6 Method of Preparing the Consolidated Financial Statements
(a) Scope of consolidation
The scope of consolidated financial statements shall be determined on the basis of control. It not only includes
subsidiaries determined based on voting power (or similar) or other arrangement, but also structured entities under
one or several contract arrangements.
Control exists when the Company has all the following: power over the investee; exposure, or rights to variable
returns from the Company’s involvement with the investee; and the ability to use its power over the investee to
affect the amount of the investor’s returns. Subsidiaries are the entities that controlled by the Company (including
enterprise, a divisible part of the investee, and structured entity controlled by the enterprise). A structured entity
(sometimes called a Special Purpose Entity) is an entity that has been designed so that voting or similar rights are
not the dominant factor in deciding who controls the entity.
(b) Special requirement as the parent company is an investment entity
If the parent company is an investment entity, it should measure its investments in particular subsidiaries as
financial assets at fair value through profit or loss instead of consolidating those subsidiaries in its consolidated
and separate financial statements. However, as an exception to this requirement, if a subsidiary provides
investment-related services or activities to the investment entity, it should be consolidated.
The parent company is defined as investment entity when meets following conditions:
a. Obtains funds from one or more investors for the purpose of providing those investors with investment
management services;
b. Commits to its investors that its business purpose is to invest funds solely for returns from capital appreciation,
investment income or both; and
c. Measures and evaluates the performance of substantially all of its investments on a fair value basis.
If the parent company becomes an investment entity, it shall cease to consolidate its subsidiaries at the date of the
change in status, except for any subsidiary which provides investment-related services or activities to the
investment entity shall be continued to be consolidated. The deconsolidation of subsidiaries is accounted for as
though the investment entity partially disposed subsidiaries without loss of control.
When the parent company previously classified as an investment entity ceases to be an investment entity,
subsidiary that was previously measured at fair value through profit or loss shall be included in the scope of
consolidated financial statements at the date of the change in status. The fair value of the subsidiary at the date of
change represents the transferred deemed consideration in accordance with the accounting for business

Interim Report 2021
~ 82 ~
combination not under common control.
(c) Method of preparing the consolidated financial statements
The consolidated financial statements shall be prepared by the Company based on the financial statements of the
Company and its subsidiaries, and using other related information.
When preparing consolidated financial statements, the Company shall consider the entire group as an accounting
entity, adopt uniform accounting policies and apply the requirements of Accounting Standard for Business
Enterprises related to recognition, measurement and presentation. The consolidated financial statements shall
reflect the overall financial position, operating results and cash flows of the group.
(i) Like items of assets, liabilities, equity, income, expenses and cash flows of the parent are combined with those
of the subsidiaries.
(ii) The carrying amount of the parent’s investment in each subsidiary is eliminated (off-set) against the parent’s
portion of equity of each subsidiary.
(iii) Eliminate the impact of intragroup transactions between the Company and the subsidiaries or between
subsidiaries, and when intragroup transactions indicate an impairment of related assets, the losses shall be
recognised in full.
(iv) Make adjustments to special transactions from the perspective of the group.
(d) Method of preparation of the consolidated financial statements when subsidiaries are acquired or
disposed in the reporting period
(i) Acquisition of subsidiaries or business
Subsidiaries or business acquired through business combination under common control
When preparing consolidated statements of financial position, the opening balance of the consolidated balance
sheet shall be adjusted. Related items of comparative financial statements shall be adjusted as well, deeming that
the combined entity has always existed ever since the ultimate controlling party began to control.
Incomes, expenses and profits of the subsidiary incurred from the beginning of the reporting period to the end of
the reporting period shall be included into the consolidated statement of profit or loss. Related items of
comparative financial statements shall be adjusted as well, deeming that the combined entity has always existed
ever since the ultimate controlling party began to control.
Cash flows from the beginning of the reporting period to the end of the reporting period shall be included into the
consolidated statement of cash flows. Related items of comparative financial statements shall be adjusted as well,
deeming that the combined entity has always existed ever since the ultimate controlling party began to control.
Subsidiaries or business acquired through business combination not under common control
When preparing the consolidated statements of financial position, the opening balance of the consolidated
statements of financial position shall not be adjusted.
Incomes, expenses and profits of the subsidiary incurred from the acquisition date to the end of the reporting

Interim Report 2021
~ 83 ~
period shall be included into the consolidated statement of profit or loss.
Cash flows from the acquisition date to the end of the reporting period shall be included into the consolidated
statement of cash flows.
(ii) Disposal of subsidiaries or business
When preparing the consolidated statements of financial position, the opening balance of the consolidated
statements of financial position shall not be adjusted.
Incomes, expenses and profits incurred from the beginning of the subsidiary to the disposal date shall be included
into the consolidated statement of profit or loss.
Cash flows from the beginning of the subsidiary to the disposal date shall be included into the consolidated
statement of cash flows.
(e) Special consideration in consolidation elimination
(i) Long-term equity investment held by the subsidiaries to the Company shall be recognised as treasury stock of
the Company, which is offset with the owner’s equity, represented as “treasury stock” under “owner’s equity” in
the consolidated statement of financial position.
Long-term equity investment held by subsidiaries between each other is accounted for taking long-term equity
investment held by the Company to its subsidiaries as reference. That is, the long-term equity investment is
eliminated (off- set) against the portion of the corresponding subsidiary’s equity.
(ii) Due to not belonging to paid-in capital (or share capital) and capital reserve, and being different from retained
earnings and undistributed profit, “Specific reserves” and “General risk provision” shall be recovered based on the
proportion attributable to owners of the parent company after long-term equity investment to the subsidiaries is
eliminated with the subsidiaries’ equity.
(iii) If temporary timing difference between the book value of the assets and liabilities in the consolidated
statement of financial position and their tax basis is generated as a result of elimination of unrealized
inter-company transaction profit or loss, deferred tax assets of deferred tax liabilities shall be recognised, and
income tax expense in the consolidated statement of profit or loss shall be adjusted simultaneously, excluding
deferred taxes related to transactions or events directly recognised in owner’s equity or business combination.
(iv) Unrealised inter-company transactions profit or loss generated from the Company selling assets to its
subsidiaries shall be eliminated against “net profit attributed to the owners of the parent company” in full.
Unrealized inter-company transactions profit or loss generated from the subsidiaries selling assets to the Company
shall be eliminated between “net profit attributed to the owners of the parent company” and “non-controlling
interests” pursuant to the proportion of the Company in the related subsidiaries. Unrealized inter-company
transactions profit or loss generated from the assets sales between the subsidiaries shall be eliminated between
“net profit attributed to the owners of the parent company” and “non-controlling interests” pursuant to the
proportion of the Company in the selling subsidiaries.

Interim Report 2021
~ 84 ~
(v) If loss attributed to the minority shareholders of a subsidiary in current period is more than the proportion of
non-controlling interest in this subsidiary at the beginning of the period, non-controlling interest is still to be
written down.
(f) Accounting for Special Transactions
(i) Purchasing of non-controlling interests
Where, the Company purchases non-controlling interests of its subsidiary, in the separate financial statements of
the Company, the cost of the long-term equity investment obtained in purchasing non-controlling interests is
measured at the fair value of the consideration paid. In the consolidated financial statements, difference between
the cost of the long-term equity investment newly obtained in purchasing non-controlling interests and share of
the subsidiary’s net assets from the acquisition date or combination date continuingly calculated pursuant to the
newly acquired shareholding proportion shall be adjusted into capital reserve (capital premium or share premium).
If capital reserve is not enough to be offset, surplus reserve and undistributed profit shall be offset in turn.
(ii) Gaining control over the subsidiary in stages through multiple transactions
Business combination under common control in stages through multiple transactions
On the combination date, in the separate financial statement, initial cost of the long-term equity investment is
determined according to the share of carrying amount of the acquiree’s net assets in the ultimate controlling
entity’s consolidated financial statements after combination. The difference between the initial cost of the
long-term equity investment and the carrying amount of the long -term investment held prior of control plus book
value of additional consideration paid at acquisition date is adjusted into capital reserve (capital premium or share
premium). If the capital reserve is not enough to absorb the difference, any excess shall be adjusted against
surplus reserve and undistributed profit in turn.
In the consolidated financial statements, the assets and liabilities acquired during the combination should be
recognized at their carrying amount in the ultimate controlling entity’s consolidated financial statements on the
combination date unless any adjustment is resulted from the difference in accounting policies. The difference
between the carrying amount of the investment held prior of control plus book value of additional consideration
paid on the acquisition date and the net assets acquired through the combination is adjusted into capital reserve
(capital premium or share premium). If the capital reserve is not enough to absorb the difference, any excess shall
be adjusted against retained earnings.
If the acquiring entity holds equity investment in the acquired entity prior to the combination date and the equity
investment is accounted for under the equity method, related profit or loss, other comprehensive income and other
changes in equity which have been recognised during the period from the later of the date of the Company
obtaining original equity interest and the date of both the acquirer and the acquiree under common control of the
same ultimate controlling party to the combination date should be offset against the opening balance of retained
earnings at the comparative financial statements period respectively.
Interim Report 2021
~ 85 ~
Business combination not under common control in stages through multiple transactions
On the consolidation date, in the separate financial statements, the initial cost of long-term equity investment is
determined according to the carrying amount of the original long-term investment plus the cost of new
investment.
In the consolidated financial statements, the equity interest of the acquired entity held prior to the acquisition date
shall be re-measured at its fair value on the acquisition date. Difference between the fair value of the equity
interest and its book value is recognised as investment income. The other comprehensive income related to the
equity interest held prior to the acquisition date calculated through equity method, should be transferred to
current investment income of the acquisition period, excluding other comprehensive income resulted from the
remeasurement of the net assets or net liabilities under defined benefit plan. The Company shall disclose
acquisition-date fair value of the equity interest held prior to the acquisition date, and the related gains or losses
due to the remeasurement based on fair value.
(iii) Disposal of investment in subsidiaries without a loss of control
For partial disposal of the long-term equity investment in the subsidiaries without a loss of control, when the
Company prepares consolidated financial statements, difference between consideration received from the disposal
and the corresponding share of subsidiary’s net assets cumulatively calculated from the acquisition date or
combination date shall be adjusted into capital reserve (capital premium or share premium). If the capital reserve
is not enough to absorb the difference, any excess shall be offset against retained earnings.
(iv) Disposal of investment in subsidiaries with a loss of control
Disposal through one transaction
If the Company loses control in an investee through partial disposal of the equity investment, when the
consolidated financial statements are prepared, the retained equity interest should be re-measured at fair value at
the date of loss of control. The difference between i) the fair value of consideration received from the disposal
plus non-controlling interest retained; ii) share of the former subsidiary’s net assets cumulatively calculated from
the acquisition date or combination date according to the original proportion of equity interest, shall be recognised
in current investment income when control is lost.
Moreover, other comprehensive income and other changes in equity related to the equity investment in the former
subsidiary shall be transferred into current investment income when control is lost, excluding other
comprehensive income resulted from the remeasurement of the movement of net assets or net liabilities under
defined benefit plan.
Disposal in stages
In the consolidated financial statements, whether the transactions should be accounted for as “a single transaction”
needs to be decided firstly.
If the disposal in stages should not be classified as “a single transaction”, in the separate financial statements, for

Interim Report 2021
~ 86 ~
transactions prior of the date of loss of control, carrying amount of each disposal of long-term equity investment
need to be recognized, and the difference between consideration received and the carrying amount of long-term
equity investment corresponding to the equity interest disposed should be recognized in current investment
income; in the consolidated financial statements, the disposal transaction should be accounted for according to
related policy in “Disposal of long-term equity investment in subsidiaries without a loss of control”.
If the disposal in stages should be classified as “a single transaction”, these transactions should be accounted for
as a single transaction of disposal of subsidiary resulting in loss of control. In the separate financial statements, for
each transaction prior of the date of loss of control, difference between consideration received and the carrying
amount of long-term equity investment corresponding to the equity interest disposed should be recognised as
other comprehensive income firstly, and transferred to profit or loss as a whole when control is lost; in the
consolidated financial statements, for each transaction prior of the date of loss of control, difference between
consideration received and proportion of the subsidiary’s net assets corresponding to the equity interest disposed
should be recognised in profit or loss as a whole when control is lost.
In considering of the terms and conditions of the transactions as well as their economic impact, the presence of
one or more of the following indicators may lead to account for multiple transactions as a single transaction:
(a) The transactions are entered into simultaneously or in contemplation of one another.
(b) The transactions form a single transaction designed to achieve an overall commercial effect.
(c) The occurrence of one transaction depends on the occurrence of at least one other transaction.
(d) One transaction, when considered on its own merits, does not make economic sense, but when considered
together with the other transaction or transactions would be considered economically justifiable.
(v) Diluting equity share of parent company in its subsidiaries due to additional capital injection by the
subsidiaries’ minority shareholders.
Other shareholders (minority shareholders) of the subsidiaries inject additional capital in the subsidiaries, which
resulted in the dilution of equity interest of parent company in these subsidiaries. In the consolidated financial
statements, difference between share of the corresponding subsidiaries’ net assets calculated based on the parent’s
equity interest before and after the capital injection shall be adjusted into capital reserve (capital premium or share
premium). If the capital reserve is not enough to absorb the difference, any excess shall be adjusted against
retained earnings.
3.7 Classification of Joint Arrangements and Accounting for Joint Operation
A joint arrangement is an arrangement of which two or more parties have joint control. Joint arrangement of the
Company is classified as either a joint operation or a joint venture.
(a) Joint operation
A joint operation is a joint arrangement whereby the parties that have joint control of the arrangement have rights
to the assets, and obligations for the liabilities, relating to the arrangement.

Interim Report 2021
~ 87 ~
The Company shall recognise the following items in relation to shared interest in a joint operation, and account
for them in accordance with relevant accounting standards of the Accounting Standards for Business Enterprises:
(i) its assets, including its share of any assets held jointly;
(ii) its liabilities, including its share of any liabilities incurred jointly;
(iii) its revenue from the sale of its share of the output arising from the joint operation;
(iv) its share of the revenue from the sale of the output by the joint operation; and
(v) its expenses, including its share of any expenses incurred jointly.
(b) Joint venture
A joint venture is a joint arrangement whereby the parties that have joint control of the arrangement have rights to
the net assets of the arrangement.
The Company accounts for its investment in the joint venture by applying the equity method of long-term equity
investment.
3.8 Cash and Cash Equivalents
Cash comprises cash on hand and deposits that can be readily withdrawn on demand. Cash equivalents include
short-term (generally within three months of maturity at acquisition), highly liquid investments that are readily
convertible into known amounts of cash and which are subject to an insignificant risk of changes in value.
3.9 Foreign Currency Transactions and Translation of Foreign Currency Financial Statements
(a) Determination of the exchange rate for foreign currency transactions
At the time of initial recognition of a foreign currency transaction, the amount in the foreign currency shall be
translated into the amount in the functional currency at the spot exchange rate of the transaction date, or at an
exchange rate which is determined through a systematic and reasonable method and is approximate to the spot
exchange rate of the transaction date (hereinafter referred to as the approximate exchange rate).
(b) Translation of monetary items denominated in foreign currency on the balance sheet date
The foreign currency monetary items shall be translated at the spot exchange rate on the balance sheet date. The
balance of exchange arising from the difference between the spot exchange rate on the balance sheet date and the
spot exchange rate at the time of initial recognition or prior to the balance sheet date shall be recorded into the
profits and losses at the current period. The foreign currency non-monetary items measured at the historical cost
shall still be translated at the spot exchange rate on the transaction date; for the foreign currency non-monetary
items restated to a fair value measurement, shall be translated into the at the spot exchange rate at the date when
the fair value was determined, the difference between the restated functional currency amount and the original
functional currency amount shall be recorded into the profits and losses at the current period.
(c) Translation of foreign currency financial statements
Before translating the financial statements of foreign operations, the accounting period and accounting policy
shall be adjusted so as to conform to the Company. The adjusted foreign operation financial statements

Interim Report 2021
~ 88 ~
denominated in foreign currency (other than functional currency) shall be translated in accordance with the
following method:
(i) The asset and liability items in the statement of financial position shall be translated at the spot exchange rates
at the date of that statement of financial position. The owners’ equity items except undistributed profit shall be
translated at the spot exchange rates when they are incurred.
(ii) The income and expense items in the statement of profit and other comprehensive income shall be translated at
the spot exchange rates or approximate exchange rate at the date of transaction.
(iii)Foreign currency cash flows and cash flows of foreign subsidiaries shall be translated at the spot exchange rate
or approximate exchange rate when the cash flows are incurred. The effect of exchange rate changes on cash is
presented separately in the statement of cash flows as an adjustment item.
(iv) The differences arising from the translation of foreign currency financial statements shall be presented
separately as “other comprehensive income” under the owners’ equity items of the consolidated statement of
financial position.
When disposing a foreign operation involving loss of control, the cumulative amount of the exchange differences
relating to that foreign operation recognised under other comprehensive income in the statement of financial
position, shall be reclassified into current profit or loss according to the proportion disposed.
3.10 Financial Instruments
Financial instrument is any contract which gives rise to both a financial asset of one entity and a financial liability
or equity instrument of another entity.
(a) Recognition and derecognition of financial instrument
A financial asset or a financial liability should be recognised in the statement of financial position when, and only
when, an entity becomes party to the contractual provisions of the instrument.
A financial asset can only be derecognised when meets one of the following conditions:
(i) The rights to the contractual cash flows from a financial asset expire
(ii) The financial asset has been transferred and meets one of the following derecognition conditions:
Financial liabilities (or part thereof) are derecognised only when the liability is extinguished—i.e., when the
obligation specified in the contract is discharged or cancelled or expires. An exchange of the Company (borrower)
and lender of debt instruments that carry significantly different terms or a substantial modification of the terms of
an existing liability are both accounted for as an extinguishment of the original financial liability and the
recognition of a new financial liability.
Purchase or sale of financial assets in a regular-way shall be recognised and derecognised using trade date
accounting. A regular-way purchase or sale of financial assets is a transaction under a contract whose terms
require delivery of the asset within the time frame established generally by regulations or convention in the
market place concerned. Trade date is the date at which the entity commits itself to purchase or sell an asset.
Interim Report 2021
~ 89 ~
(b) Classification and measurement of financial assets
At initial recognition, the Company classified its financial asset based on both the business model for managing
the financial asset and the contractual cash flow characteristics of the financial asset: financial asset at amortised
cost, financial asset at fair value through profit or loss (FVTPL) and financial asset at fair value through other
comprehensive income (FVTOCI). Reclassification of financial assets is permitted if, and only if, the objective of
the entity’s business model for managing those financial assets changes. In this circumstance, all affected
financial assets shall be reclassified on the first day of the first reporting period after the changes in business
model; otherwise the financial assets cannot be reclassified after initial recognition.
Financial assets shall be measured at initial recognition at fair value. For financial assets measured at FVTPL,
transaction costs are recognised in current profit or loss. For financial assets not measured at FVTPL, transaction
costs should be included in the initial measurement. Notes receivable or accounts receivable that arise from sales
of goods or rendering of services are initially measured at the transaction price defined in the accounting standard
of revenue where the transaction does not include a significant financing component.
Subsequent measurement of financial assets will be based on their categories:
(i)Financial asset at amortised cost
The financial asset at amortised cost category of classification applies when both the following conditions are met:
the financial asset is held within the business model whose objective is to hold financial assets in order to collect
contractual cash flows, and the contractual term of the financial asset gives rise on specified dates to cash flows
that are solely payment of principal and interest on the principal amount outstanding. These financial assets are
subsequently measured at amortised cost by adopting the effective interest rate method. Any gain or loss arising
from derecognition according to the amortization under effective interest rate method or impairment are
recognised in current profit or loss.
(ii)Financial asset at fair value through other comprehensive income (FVTOCI)
The financial asset at FVTOCI category of classification applies when both the following conditions are met: the
financial asset is held within the business model whose objective is achieved by both collecting contractual cash
flows and selling financial assets, and the contractual term of the financial asset gives rise on specified dates to
cash flows that are solely payment of principle and interest on the principal amount outstanding. All changes in
fair value are recognised in other comprehensive income except for gain or loss arising from impairment or
exchange differences, which should be recognised in current profit or loss. At derecognition, cumulative gain or
loss previously recognised under OCI is reclassified to current profit or loss. However, interest income calculated
based on the effective interest rate is included in current profit or loss.
The Company make an irrevocable decision to designate part of non-trading equity instrument investments as
measured through FVTOCI. All changes in fair value are recognised in other comprehensive income except for
dividend income recognised in current profit or loss. At derecognition, cumulative gain or loss are reclassified to

Interim Report 2021
~ 90 ~
retained earnings.
(iii)Financial asset at fair value through profit or loss (FVTPL)
Financial asset except for above mentioned financial asset at amortised cost or financial asset at fair value through
other comprehensive income (FVTOCI), should be classified as financial asset at fair value through profit or loss
(FVTPL). These financial assets should be subsequently measured at fair value. All the changes in fair value are
included in current profit or loss.
(c) Classification and measurement of financial liabilities
The Company classified the financial liabilities as financial liabilities at fair value through profit or loss (FVTPL),
loan commitments at a below-market interest rate and financial guarantee contracts and financial asset at
amortised cost.
Subsequent measurement of financial assets will be based on the classification:
(i)Financial liabilities at fair value through profit or loss (FVTPL)
Held-for-trading financial liabilities (including derivatives that are financial liabilities) and financial liabilities
designated at FVTPL are classified as financial liabilities at FVTP. After initial recognition, any gain or loss
(including interest expense) are recognised in current profit or loss except for those hedge accounting is applied.
For financial liability that is designated as at FVTPL, changes in the fair value of the financial liability that is
attributable to changes in the own credit risk of the issuer shall be presented in other comprehensive income. At
derecognition, cumulative gain or loss previously recognised under OCI is reclassified to retained earnings.
(ii)Loan commitments and financial guarantee contracts
Loan commitment is a commitment by the Company to provide a loan to customer under specified contract terms.
The provision of impairment losses of loan commitments shall be recognised based on expected credit losses
model.
Financial guarantee contract is a contract that requires the Company to make specified payments to reimburse the
holder for a loss it incurs because a specified debtor fails to make payment when due in accordance with the
original or modified terms of a debt instrument. Financial guarantee contracts liability shall be subsequently
measured at the higher of: The amount of the loss allowance recognised according to the impairment principles of
financial instruments; and the amount initially recognised less the cumulative amount of income recognised in
accordance with the revenue principles.
(iii)Financial liabilities at amortised cost
After initial recognition, the Company measured other financial liabilities at amortised cost using the effective
interest method.
Except for special situation, financial liabilities and equity instrument should be classified in accordance with the
following principles:
(i) If the Company has no unconditional right to avoid delivering cash or another financial instrument to fulfill a

Interim Report 2021
~ 91 ~
contractual obligation, this contractual obligation meet the definition of financial liabilities. Some financial
instruments do not comprise terms and conditions related to obligations of delivering cash or another financial
instrument explicitly, they may include contractual obligation indirectly through other terms and conditions.
(ii) If a financial instrument must or may be settled in the Company's own equity instruments, it should be
considered that the Company’s own equity instruments are alternatives of cash or another financial instrument, or
to entitle the holder of the equity instruments to sharing the remaining rights over the net assets of the issuer. If the
former is the case, the instrument is a liability of the issuer; otherwise, it is an equity instrument of the issuer.
Under some circumstances, it is regulated in the contract that the financial instrument must or may be settled in
the Company's own equity instruments, where, amount of contractual rights and obligations are calculated by
multiplying the number of the equity instruments to be available or delivered by its fair value upon settlement.
Such contracts shall be classified as financial liabilities, regardless that the amount of contractual rights and
liabilities is fixed, or fluctuate totally or partially with variables other than market price of the entity’s own equity
instruments
(d) Derivatives and embedded derivatives
At initial recognition, derivatives shall be measured at fair value at the date of derivative contracts are signed and
subsequently measured at fair value. The derivative with a positive fair value shall be recognized as an asset, and
with a negative fair value shall be recognised as a liability.
Gains or losses arising from the changes in fair value of derivatives shall be recognised directly into current profit
or loss except for the effective portion of cash flow hedges which shall be recognised in other comprehensive
income and reclassified into current profit or loss when the hedged items affect profit or loss.
An embedded derivative is a component of a hybrid contract with a financial asset as a host, the Company shall
apply the requirements of financial asset classification to the entire hybrid contract. If a host that is not a financial
asset and the hybrid contract is not measured at fair value with changes in fair value recognised in profit or loss,
and the economic characteristics and risks of the embedded derivative are not closely related to the economic
characteristics and risks of the host, and a separate instrument with the same terms as the embedded derivative
would meet the definition of a derivative, the embedded derivative shall be separated from the hybrid instrument
and accounted for as a separate derivative instrument. If the Company is unable to measure the fair value of the
embedded derivative at the acquisition date or subsequently at the balance sheet date, the entire hybrid contract is
designated as financial assets or financial liabilities at fair value through profit or loss.
(e) Impairment of financial instrument
The Company shall recognise a loss allowance based on expected credit losses on a financial asset that is
measured at amortised cost, a debt investment at fair value through other comprehensive income, a contract asset,
a lease receivable, a loan commitment and a financial guarantee contract.
(i) Measurement of expected credit losses

Interim Report 2021
~ 92 ~
Expected credit losses are the weighted average of credit losses of the financial instruments with the respective
risks of a default occurring as the weights. Credit loss is the difference between all contractual cash flows that are
due to the Company in accordance with the contract and all the cash flows that the Company expects to receive,
discounted at the original effective interest rate or credit- adjusted effective interest rate for purchased or
originated credit-impaired financial assets.
Lifetime expected credit losses are the expected credit losses that result from all possible default events over the
expected life of a financial instrument.
12-month expected credit losses are the portion of lifetime expected credit losses that represent the expected credit
losses that result from default events on a financial instrument that are possible within the 12 months after the
reporting date (or the expected lifetime, if the expected life of a financial instrument is less than 12 months).
At each reporting date, the Company classifies financial instruments into three stages and makes provisions for
expected credit losses accordingly. A financial instrument of which the credit risk has not significantly increased
since initial recognition is at stage 1. The Company shall measure the loss allowance for that financial instrument
at an amount equal to 12-month expected credit losses. A financial instrument with a significant increase in credit
risk since initial recognition but is not considered to be credit-impaired is at stage 2. The Company shall measure
the loss allowance for that financial instrument at an amount equal to the lifetime expected credit losses. A
financial instrument is considered to be credit-impaired as at the end of the reporting period is at stage 3. The
Company shall measure the loss allowance for that financial instrument at an amount equal to the lifetime
expected credit losses.
The Company may assume that the credit risk on a financial instrument has not increased significantly since initial
recognition if the financial instrument is determined to have low credit risk at the reporting date and measure the
loss allowance for that financial instrument at an amount equal to 12-month expected credit losses.
For financial instrument at stage 1, stage 2 and those have low credit risk, the interest revenue shall be calculated
by applying the effective interest rate to the gross carrying amount of a financial asset. For financial instrument at
stage 3, interest revenue shall be calculated by applying the effective interest rate to the amortised cost after
deducting of impairment loss.
For notes receivable, accounts receivable and accounts receivable financing, no matter it contains a significant
financing component or not, the Company shall measure the loss allowance at an amount equal to the lifetime
expected credit losses.
Receivables
For the notes receivable, accounts receivable, other receivables, accounts receivable financing and long-term
receivables which are demonstrated to be impaired by any objective evidence, or applicable for individual
assessment, the Company shall individually assess for impairment and recognise the loss allowance for expected
credit losses. If the Company determines that no objective evidence of impairment exists for notes receivable,

Interim Report 2021
~ 93 ~
accounts receivable, other receivables, accounts receivable financing and long-term receivables, or the expected
credit loss of a single financial asset cannot be assessed at reasonable cost, such notes receivable, accounts
receivable, other receivables, accounts receivable financing and long-term receivables shall be divided into
several groups with similar credit risk characteristics and collectively calculated the expected credit loss. The
determination basis of groups is as following:
Determination basis of notes receivable is as following:
Group 1: Commercial acceptance bills
Group 2: Bank acceptance bills
For each group, the Company calculates expected credit losses through default exposure and the lifetime expected
credit losses rate, taking reference to historical experience for credit losses and considering current condition and
expectation for the future economic situation.
Determination basis of accounts receivable is as following:
Group 1: Accounts receivables due from the company within the scope of consolidation
Group 2: Accounts receivables due from other customers
For each group, the Company calculates expected credit losses through preparing an aging analysis schedule with
the lifetime expected credit losses rate, taking reference to historical experience for credit losses and considering
current condition and expectation for the future economic situation.
Determination basis of other receivables is as following:
Group 1: Other receivables due from the company within the scope of consolidation
Group 2: Other receivables due from others
For each group, the Company calculates expected credit losses through default exposure and the 12-months or
lifetime expected credit losses rate, taking reference to historical experience for credit losses and considering
current condition and expectation for the future economic situation.
Debt investment and other debt investment
For debt investment and other debt investment, the Company shall calculate the expected credit loss through the
default exposure and the 12-month or lifetime expected credit loss rate based on the nature of the investment,
counterparty and the type of risk exposure.
(ii) Low credit risk
If the financial instrument has a low risk of default, the borrower has a strong capacity to meet its contractual cash
flow obligations in the near term and adverse changes in economic and business conditions in the longer term may,
but will not necessarily, reduce the ability of the borrower to fulfill its contractual cash flow obligations.
(iii) Significant increase in credit risk
The Company shall assess whether the credit risk on a financial instrument has increased significantly since initial
recognition, using the change in the risk of a default occurring over the expected life of the financial instrument,

Interim Report 2021
~ 94 ~
through the comparison of the risk of a default occurring on the financial instrument as at the reporting date with
the risk of a default occurring on the financial instrument as at the date of initial recognition.
To make that assessment, the Company shall consider reasonable and supportable information, that is available
without undue cost or effort, and that is indicative of significant increases in credit risk since initial recognition,
including forward-looking information. The information considered by the Company are as following:
⚫ Significant changes in internal price indicators of credit risk as a result of a change in credit risk since
inception
⚫ Existing or forecast adverse change in the business, financial or economic conditions of the borrower that
results in a significant change in the borrower’s ability to meet its debt obligations;
⚫ An actual or expected significant change in the operating results of the borrower; An actual or expected
significant adverse change in the regulatory, economic, or technological environment of the borrower;
⚫ Significant changes in the value of the collateral supporting the obligation or in the quality of third-party
guarantees or credit enhancements, which are expected to reduce the borrower’s economic incentive to make
scheduled contractual payments or to otherwise have an effect on the probability of a default occurring;
⚫ Significant change that are expected to reduce the borrower’s economic incentive to make scheduled
contractual payments;
⚫ Expected changes in the loan documentation including an expected breach of contract that may lead to
covenant waivers or amendments, interest payment holidays, interest rate step-ups, requiring additional
collateral or guarantees, or other changes to the contractual framework of the instrument;
⚫ Significant changes in the expected performance and behaviour of the borrower;
⚫ Contractual payments are more than 30 days past due.
Depending on the nature of the financial instruments, the Company shall assess whether the credit risk has
increased significantly since initial recognition on an individual financial instrument or a group of financial
instruments. When assessed based on a group of financial instruments, the Company can group financial
instruments on the basis of shared credit risk characteristics, for example, past due information and credit risk
rating.
Generally, the Company shall determine the credit risk on a financial asset has increased significantly since initial
recognition when contractual payments are more than 30 days past due. The Company can only rebut this
presumption if the Company has reasonable and supportable information that is available without undue cost or
effort, that demonstrates that the credit risk has not increased significantly since initial recognition even though
the contractual payments are more than 30 days past due.
(iv) Credit-impaired financial asset
The Company shall assess at each reporting date whether the credit impairment has occurred for financial asset at
amortised cost and debt investment at fair value through other comprehensive income. A financial asset is

Interim Report 2021
~ 95 ~
credit-impaired when one or more events that have a detrimental impact on the estimated future cash flows of that
financial asset have occurred. Evidences that a financial asset is credit-impaired include observable data about the
following events:
Significant financial difficulty of the issuer or the borrower;a breach of contract, such as a default or past due
event; the lender(s) of the borrower, for economic or contractual reasons relating to the borrower’s financial
difficulty, having granted to the borrower a concession(s) that the lender(s) would not otherwise consider;it is
becoming probable that the borrower will enter bankruptcy or other financial reorganisation;the disappearance of
an active market for that financial asset because of financial difficulties;the purchase or origination of a financial
asset at a deep discount that reflects the incurred credit losses.
(v) Presentation of impairment of expected credit loss
In order to reflect the changes of credit risk of financial instrument since initial recognition, the Company shall at
each reporting date remeasure the expected credit loss and recognise in profit or loss, as an impairment gain or
loss, the amount of expected credit losses addition (or reversal). For financial asset at amortised cost, the loss
allowance shall reduce the carrying amount of the financial asset in the statement of financial position; for debt
investment at fair value through other comprehensive income, the loss allowance shall be recognised in other
comprehensive income and shall not reduce the carrying amount of the financial asset in the statement of financial
position.
(vi) Write-off
The Company shall directly reduce the gross carrying amount of a financial asset when the Company has no
reasonable expectations of recovering the contractual cash flow of a financial asset in its entirety or a portion
thereof. Such write-off constitutes a derecognition of the financial asset. This circumstance usually occurs when
the Company determines that the debtor has no assets or sources of income that could generate sufficient cash
flow to repay the write-off amount.
Recovery of financial asset written off shall be recognised in profit or loss as reversal of impairment loss.
(f) Transfer of financial assets
Transfer of financial assets refers to following two situations:
⚫ Transfers the contractual rights to receive the cash flows of the financial asset;
⚫ Transfers the entire or a part of a financial asset and retains the contractual rights to receive the cash flows of
the financial asset, but assumes a contractual obligation to pay the cash flows to one or more recipients.
(i) Derecognition of transferred assets
If the Company transfers substantially all the risks and rewards of ownership of the financial asset, or neither
transfers nor retains substantially all the risks and rewards of ownership of the financial asset but has not retained
control of the financial asset, the financial asset shall be derecognised.
Whether the Company has retained control of the transferred asset depends on the transferee’s ability to sell the

Interim Report 2021
~ 96 ~
asset. If the transferee has the practical ability to sell the asset in its entirety to an unrelated third party and is able
to exercise that ability unilaterally and without needing to impose additional restrictions on the transfer, the
Company has not retained control.
The Company judges whether the transfer of financial asset qualifies for derecognition based on the substance of
the transfer.
If the transfer of financial asset qualifies for derecognition in its entirety, the difference between the following
shall be recognised in profit or loss:
⚫ The carrying amount of transferred financial asset;
⚫ The sum of consideration received and the part derecognised of the cumulative changes in fair value
previously recognised in other comprehensive income (The financial assets involved in the transfer are
classified as financial assets at fair value through other comprehensive income in accordance with Article 18
of the Accounting Standards for Business Enterprises No.22 - Recognition and Measurement of Financial
Instruments).
If the transferred asset is a part of a larger financial asset and the part transferred qualifies for derecognition, the
previous carrying amount of the larger financial asset shall be allocated between the part that continues to be
recognised (For this purpose, a retained servicing asset shall be treated as a part that continues to be recognised)
and the part that is derecognised, based on the relative fair values of those parts on the date of the transfer. The
difference between following two amounts shall be recognised in profit or loss:
⚫ The carrying amount (measured at the date of derecognition) allocated to the part derecognised;
⚫ The sum of the consideration received for the part derecognised and part derecognised of the cumulative
changes in fair value previously recognised in other comprehensive income (The financial assets involved in
the transfer are classified as financial assets at fair value through other comprehensive income in accordance
with Article 18 of the Accounting Standards for Business Enterprises No.22 - Recognition and Measurement
of Financial Instruments).
(ii) Continuing involvement in transferred assets
If the Company neither transfers nor retains substantially all the risks and rewards of ownership of a transferred
asset, and retains control of the transferred asset, the Company shall continue to recognise the transferred asset to
the extent of its continuing involvement and also recognise an associated liability.
The extent of the Company’s continuing involvement in the transferred asset is the extent to which it is exposed to
changes in the value of the transferred asset
(iii) Continue to recognise the transferred assets
If the Company retains substantially all the risks and rewards of ownership of the transferred financial asset, the
Company shall continue to recognise the transferred asset in its entirety and the consideration received shall be
recognised as a financial liability.

Interim Report 2021
~ 97 ~
The financial asset and the associated financial liability shall not be offset. In subsequent accounting period, the
Company shall continuously recognise any income (gain) arising from the transferred asset and any expense (loss)
incurred on the associated liability.
(g) Offsetting financial assets and financial liabilities
Financial assets and financial liabilities shall be presented separately in the statement of financial position and
shall not be offset. When meets the following conditions, financial assets and financial liabilities shall be offset
and the net amount presented in the statement of financial position:
The Company currently has a legally enforceable right to set off the recognised amounts; The Company intends
either to settle on a net basis, or to realise the asset and settle the liability simultaneously.
In accounting for a transfer of a financial asset that does not qualify for derecognition, the Company shall not
offset the transferred asset and the associated liability.
(h) Determination of fair value of financial instruments
Determination of financial assets and financial liabilities please refer to Note 3.11
3.11 Fair Value Measurement
Fair value refers to the price that would be received to sell an asset or paid to transfer a liability in an orderly
transaction between market participants at the measurement date.
The Company determines fair value of the related assets and liabilities based on market value in the principal
market, or in the absence of a principal market, in the most advantageous market price for the related asset or
liability. The fair value of an asset or a liability is measured using the assumptions that market participants would
use when pricing the asset or liability, assuming that market participants act in their economic best interest.
The principal market is the market in which transactions for an asset or liability take place with the greatest
volume and frequency. The most advantageous market is the market which maximizes the value that could be
received from selling the asset and minimizes the value which is needed to be paid in order to transfer a liability,
considering the effect of transport costs and transaction costs both.
If the active market of the financial asset or financial liability exists, the Company shall measure the fair value
using the quoted price in the active market. If the active market of the financial instrument is not available, the
Company shall measure the fair value using valuation techniques.
A fair value measurement of a non-financial asset takes into account a market participant’s ability to generate
economic benefits by using the asset in its highest and best use or by selling it to another market participant that
would use the asset in its highest and best use.
⚫ Valuation techniques
The Company uses valuation techniques that are appropriate in the circumstances and for which sufficient data are
available to measure fair value, including the market approach, the income approach and the cost approach. The
Company shall use valuation techniques consistent with one or more of those approaches to measure fair value. If

Interim Report 2021
~ 98 ~
multiple valuation techniques are used to measure fair value, the results shall be evaluated considering the
reasonableness of the range of values indicated by those results. A fair value measurement is the point within that
range that is most representative of fair value in the circumstances.
When using the valuation technique, the Company shall give the priority to relevant observable inputs. The
unobservable inputs can only be used when relevant observable inputs is not available or practically would not be
obtained. Observable inputs refer to the information which is available from market and reflects the assumptions
that market participants would use when pricing the asset or liability. Unobservable Inputs refer to the information
which is not available from market and it has to be developed using the best information available in the
circumstances from the assumptions that market participants would use when pricing the asset or liability.
⚫ Fair value hierarchy
To Company establishes a fair value hierarchy that categorises into three levels the inputs to valuation techniques
used to measure fair value. The fair value hierarchy gives the highest priority to Level 1 inputs and second to the
Level 2 inputs and the lowest priority to Level 3 inputs. Level 1 inputs are quoted prices (unadjusted) in active
markets for identical assets or liabilities that the entity can access at the measurement date. Level 2 inputs are
inputs other than quoted prices included within Level 1 that are observable for the asset or liability, either directly
or indirectly. Level 3 inputs are unobservable inputs for the asset or liability.
3.12 Inventories
(a) Classification of inventories
Inventories are finished goods or products held for sale in the ordinary course of business, in the process of
production for such sale, or in the form of materials or supplies to be consumed in the production process or in the
rendering of services, including raw materials, work in progress, semi-finished goods, finished goods, goods in
stock, turnover material, etc.
(b) Measurement method of cost of inventories sold or used
Inventories are initially measured at the actual cost. Cost of inventories includes purchase cost, processing cost,
and other costs. Cost of the issue is measured using the weighted average method.
(c) Inventory system
The perpetual inventory system is adopted. The inventories should be counted at least once a year, and surplus or
losses of inventory stocktaking shall be included in current profit and loss.
(d) Provision for impairment of inventory
Inventories are stated at the lower of cost and net realizable value. The excess of cost over net realizable value of
the inventories is recognised as provision for impairment of inventory, and recognised in current profit or loss.
Net realizable value of the inventory should be determined on the basis of reliable evidence obtained, and factors
such as purpose of holding the inventory and impact of post balance sheet event shall be considered.
(i) In normal operation process, finished goods, products and materials for direct sale, their net realizable values

Interim Report 2021
~ 99 ~
are determined at estimated selling prices less estimated selling expenses and relevant taxes and surcharges; for
inventories held to execute sales contract or service contract, their net realizable values are calculated on the basis
of contract price. If the quantities of inventories specified in sales contracts are less than the quantities held by the
Company, the net realizable value of the excess portion of inventories shall be based on general selling prices. Net
realizable value of materials held for sale shall be measured based on market price.
(ii) For materials in stock need to be processed, in the ordinary course of production and business, net realisable
value is determined at the estimated selling price less the estimated costs of completion, the estimated selling
expenses and relevant taxes. If the net realisable value of the finished products produced by such materials is
higher than the cost, the materials shall be measured at cost; if a decline in the price of materials indicates that the
cost of the finished products exceeds its net realisable value, the materials are measured at net realisable value and
differences shall be recognised at the provision for impairment.
(iii) Provisions for inventory impairment are generally determined on an individual basis. For inventories with
large quantity and low unit price, the provisions for inventory impairment are determined on a category basis.
(iv) If any factor rendering write-downs of the inventories has been eliminated at the reporting date, the amounts
written down are recovered and reversed to the extent of the inventory impairment, which has been provided for.
The reversal shall be included in profit or loss.
(e) Amortization method of low-value consumables
Low-value consumables: One-off writing off method is adopted
Package material: One-off writing off method is adopted
3.13 Contract assets and contract liabilities
Effective from 1 January 2020
Contract assets and contract liabilities are reocgnised on the basis of fulfilment of performance obligations and
payment received from clients. A right to receive a promised consideration from a client resulting from goods
transferred to or services provided to the client (where the right to consideration is dependent on factors other than
the passage of time) is reocgnised a contract asset. A payment received from a client for which goods shall be
transferred to or services shall be provided to the client is recognised as a contract liability.
See Note 3.10 for the determination method and accounting treatment method of impairment of contract assets.
Contract assets and contract liabilities are presentd as line items on the statement of financial position. A contract
asset and contract liability arising from one contract are presented in net; while the net amount is a debit balance,
it is presented in contract assets or other non-current assets depending on liquidity; while the net amount is a
credit balance, it is presented in contract liabilities or other non-current liabilities depending on liquidity. Contract
assets and contract liabilities arising form different contracts are not be offset.
3.14 Contract costs

Interim Report 2021
~ 100 ~
Effective at 1 January 2020
Costs for a contract include costs to fulfill the contract and costs to obtain the contract.
An asset is recognised for the costs incurred to fulfill a contract on if those costs meet all of the following criteria:
I. the costs are directly associated with a contract or an anticipated contract, explicitly chargeable to the client
under the contract, incurred only for the contract;
II. the costs generate or enhance resouces of the Company that will be used in satisfying performance
obligations in the future; and
III. the costs are expected to be recovered.
An asset is recognised for the costs incurred to obtained a contract with a client if those costs are expected to be
recovered.
An asset recognised for the costs of a contract are amortised on a systematic basis that is consistent with
recognition of revenue arising from the contract. Where the costs incurred to obtain a contract would be amortised
for a period less than one year should they be recognised as an asset, the costs are recognised in the current profit
or loss as incurred.
An impairment is recognised for an asset recognised for the costs of a contract to the extent that the carrying
amount of the asset exceeds:
I. the remaining amount of consideration that is expected to be received in exchange for the goods or services
to which the asset relates; less
II. the costs that relate directly to providing those goods or services and that have not been recognised as
expenses.
Upon recognition of the impairment, further consideration is given for provision for an onerous contract, in
necessary.
A reversal of some or all of an impairment loss previously recognised for an asset for the costs of a contract when
the impairment conditions no longer exist or have improved. The increased carrying amount of the asset is
cappted by the amount that would have been determined (net of amortisation) if no impairment loss had been
recognised previously.
An asset recognised for the costs to fulfill a contract is presented in inventories if its amortisation is not longer
than 1 year or an operating cycle upon initial recognition; otherwise, it is presented in other non-current assets.
An asset recognised for the costs to obtain a contract is presented in other current assets if its amortisation is not
longer than 1 year or an operating cycle upon initial recognition; otherwise, it is presented in other non-current

Interim Report 2021
~ 101 ~
assets.
3.15 Long-term Equity Investments
Long-term equity investments refer to equity investments where an investor has control of, or significant influence
over, an investee, as well as equity investments in joint ventures. Associates of the Company are those entities
over which the Company has significant influence.
(a) Determination basis of joint control or significant influence over the investee
Joint control is the relevant agreed sharing of control over an arrangement, and the arranged relevant activity must
be decided under unanimous consent of the parties sharing control. In assessing whether the Company has joint
control of an arrangement, the Company shall assess first whether all the parties, or a group of the parties, control
the arrangement. When all the parties, or a group of the parties, considered collectively, are able to direct the
activities of the arrangement, the parties control the arrangement collectively. Then the Company shall assess
whether decisions about the relevant activities require the unanimous consent of the parties that collectively
control the arrangement. If two or more groups of the parties could control the arrangement collectively, it shall
not be assessed as have joint control of the arrangement. When assessing the joint control, the protective rights are
not considered.
Significant influence is the power to participate in the financial and operating policy decisions of the investee but
is not control or joint control of those policies. In determination of significant influence over an investee, the
Company should consider not only the existing voting rights directly or indirectly held but also the effect of
potential voting rights held by the Company and other entities that could be currently exercised or converted,
including the effect of share warrants, share options and convertible corporate bonds that issued by the investee
and could be converted in current period.
If the Company holds, directly or indirectly 20% or more but less than 50% of the voting power of the investee, it
is presumed that the Company has significant influence of the investee, unless it can be clearly demonstrated that
in such circumstance, the Company cannot participate in the decision-making in the production and operating of
the investee.
(b) Determination of initial investment cost
(i) Long-term equity investments generated in business combinations
For a business combination involving enterprises under common control, if the Company makes payment in cash,
transfers non-cash assets or bears liabilities as the consideration for the business combination, the share of
carrying amount of the owners’ equity of the acquiree in the consolidated financial statements of the ultimate
controlling party is recognised as the initial cost of the long-term equity investment on the combination date. The
difference between the initial investment cost and the carrying amount of cash paid, non-cash assets transferred
and liabilities assumed shall be adjusted against the capital reserve; if capital reserve is not enough to be offset,
undistributed profit shall be offset in turn.

Interim Report 2021
~ 102 ~
For a business combination involving enterprises under common control, if the Company issues equity securities
as the consideration for the business combination, the share of carrying amount of the owners’ equity of the
acquiree in the consolidated financial statements of the ultimate controlling party is recognised as the initial cost
of the long-term equity investment on the combination date. The total par value of the shares issued is recognised
as the share capital. The difference between the initial investment cost and the carrying amount of the total par
value of the shares issued shall be adjusted against the capital reserve; if capital reserve is not enough to be offset,
undistributed profit shall be offset in turn.
For business combination not under common control, the assets paid, liabilities incurred or assumed and the fair
value of equity securities issued to obtain the control of the acquiree at the acquisition date shall be determined as
the cost of the business combination and recognised as the initial cost of the long-term equity investment. The
audit, legal, valuation and advisory fees, other intermediary fees, and other relevant general administrative costs
incurred for the business combination, shall be recognised in profit or loss as incurred.
(ii) Long-term equity investments acquired not through the business combination, the investment cost shall be
determined based on the following requirements:
For long-term equity investments acquired by payments in cash, the initial cost is the actually paid purchase cost,
including the expenses, taxes and other necessary expenditures directly related to the acquisition of long-term
equity investments.
For long-term equity investments acquired through issuance of equity securities, the initial cost is the fair value of
the issued equity securities.
For the long-term equity investments obtained through exchange of non-monetary assets, if the exchange has
commercial substance, and the fair values of assets traded out and traded in can be measured reliably, the initial
cost of long-term equity investment traded in with non-monetary assets are determined based on the fair values of
the assets traded out together with relevant taxes. Difference between fair value and book value of the assets
traded out is recorded in current profit or loss. If the exchange of non-monetary assets does not meet the above
criterion, the book value of the assets traded out and relevant taxes are recognised as the initial investment cost.
For long-term equity investment acquired through debt restructuring, the initial cost is determined based on the
fair value of the equity obtained and the difference between initial investment cost and carrying amount of debts
shall be recorded in current profit or loss.
(c) Subsequent measurement and recognition of profit or loss
Long-term equity investment to an entity over which the Company has ability of control shall be accounted for at
cost method. Long-term equity investment to a joint venture or an associate shall be accounted for at equity
method.
(i) Cost method
For Long-term equity investment at cost method, cost of the long-term equity investment shall be adjusted when

Interim Report 2021
~ 103 ~
additional amount is invested or a part of it is withdrawn. The Company recognises its share of cash dividends or
profits which have been declared to distribute by the investee as current investment income.
(ii) Equity method
If the initial cost of the investment is in excess of the share of the fair value of the net identifiable assets in the
investee at the date of investment, the difference shall not be adjusted to the initial cost of long-term equity
investment; if the initial cost of the investment is in short of the share of the fair value of the net identifiable assets
in the investee at the date investment, the difference shall be included in the current profit or loss and the initial
cost of the long-term equity investment shall be adjusted accordingly.
The Company recognises the share of the investee’s net profits or losses, as well as its share of the investee’s
other comprehensive income, as investment income or losses and other comprehensive income respectively, and
adjusts the carrying amount of the investment accordingly. The carrying amount of the investment shall be
reduced by the share of any profit or cash dividends declared to distribute by the investee. The investor’s share of
the investee’s owners’ equity changes, other than those arising from the investee’s net profit or loss, other
comprehensive income or profit distribution, shall be recognised in the investor’s equity, and the carrying amount
of the long-term equity investment shall be adjusted accordingly. The Company recognises its share of the
investee’s net profits or losses after making appropriate adjustments of investee’s net profit based on the fair
values of the investee’s identifiable net assets at the investment date. If the accounting policy and accounting
period adopted by the investee is not in consistency with the Company, the financial statements of the investee
shall be adjusted according to the Company’s accounting policies and accounting period, based on which,
investment income or loss and other comprehensive income, etc., shall be adjusted. The unrealized profits or
losses resulting from inter-company transactions between the company and its associate or joint venture are
eliminated in proportion to the company’s equity interest in the investee, based on which investment income or
losses shall be recognised. Any losses resulting from inter-company transactions between the investor and the
investee, which belong to asset impairment, shall be recognised in full.
Where the Company obtains the power of joint control or significant influence, but not control, over the investee,
due to additional investment or other reason, the relevant long-term equity investment shall be accounted for by
using the equity method, initial cost of which shall be the fair value of the original investment plus the additional
investment. Where the original investment is classified as investments in other equity instrument, difference
between its fair value and the carrying value, in addition to the cumulative gains or losses previously recorded in
other comprehensive income, shall be transferred from other comprehensive income and recorded in retained
earnings during the current period using equity method.
If the Company loses the joint control or significant influence of the investee for some reasons such as disposal of
equity investment, the retained interest shall be measured at fair value and the difference between the carrying
amount and the fair value at the date of loss the joint control or significant influence shall be recognised in profit

Interim Report 2021
~ 104 ~
or loss. When the Company discontinues the use of the equity method, the Company shall account for all amounts
previously recognised in other comprehensive income under equity method in relation to that investment on the
same basis as would have been required if the investee had directly disposed of the related assets or liabilities.
(d) Equity investment classified as held for sale
Any retained interest in the equity investment not classified as held for sale, shall be accounted for using equity
method.
When an equity investment in an associate or a joint venture previously classified as held for sale no longer meets
the criteria to be so classified, it shall be accounted for using the equity method retrospectively as from the date of
its classification as held for sale. Financial statements for the periods since classification as held for sale shall be
amended accordingly.
(f) Impairment testing and provision for impairment loss
For investment in subsidiaries, associates or a joint venture, provision for impairment loss please refer to Note
3.21.
3.16 Investment Properties
(a) Classification of investment properties
Investment properties are properties to earn rentals or for capital appreciation or both, including:
(i)Land use right leased out
(ii)Land held for transfer upon appreciation
(iii)Buildings leased out
(b) The measurement model of investment property
The Company adopts the cost model for subsequent measurement of investment properties. For provision for
impairment please refer to Note 3.21.
The Company calculates the depreciation or amortization based on the net amount of investment property cost less
the accumulated impairment and the net residual value using straight-line method.
3.17 Fixed Assets
Fixed assets refer to the tangible assets with higher unit price held for the purpose of producing commodities,
rendering services, renting or business management with useful lives exceeding one year.
(a) Recognition criteria of fixed assets
Fixed assets will only be recognised at the actual cost paid when obtaining as all the following criteria are
satisfied:
(i) It is probable that the economic benefits relating to the fixed assets will flow into the Company;
(ii) The costs of the fixed assets can be measured reliably.
Subsequent expenditure for fixed assets shall be recorded in cost of fixed assets, if recognition criteria of fixed
assets are satisfied, otherwise the expenditure shall be recorded in current profit or loss when incurred.

Interim Report 2021
~ 105 ~
(b) Depreciation methods of fixed assets
The Company begins to depreciate the fixed asset from the next month after it is available for intended use using
the straight-line-method. The estimated useful life and annual depreciation rates which are determined according
to the categories, estimated economic useful lives and estimated net residual rates of fixed assets are listed as
followings:
Category Depreciation
method
Estimated useful life
(year)
Residual
rates (%)
Annual depreciation rates
(%)
Buildings and constructions straight-line-method 8.00-35.00 3.00-5.00 2.70-12.10
Machinery equipment straight-line-method 5.00-10.00 3.00-5.00 9.50-19.40
Vehicles straight-line-method 4.00 3.00 24.25
Office equipment and others straight-line-method 3.00 3.00 32.33
For the fixed assets with impairment provided, the impairment provision should be excluded from the cost when
calculating depreciation.
At the end of reporting period, the Company shall review the useful life, estimated net residual value and
depreciation method of the fixed assets. Estimated useful life of the fixed assets shall be adjusted if it is changed
compared to the original estimation.
(c) Recognition criteria, valuation and depreciation methods of fixed assets obtained through a finance
lease
If the entire risk and rewards related to the leased assets have been substantially transferred, the Company shall
recognise the lease as a finance lease. The cost of the fixed assets obtained through a finance lease is determined
at the lower of the fair value of the leased assets and the present value of the minimum lease payment on the date
of the lease. The fixed assets obtained by a finance lease are depreciated in the method which is consistent with
the self-owned fixed assets of the Company. For fixed assets obtained through a finance lease, if it is reasonably
certain that the ownership of the leased assets will be transferred to the lessee by the end of the lease term, they
shall be depreciated over their remaining useful lives; otherwise, the leased assets shall be depreciated over the
shorter of the lease terms or their remaining useful lives.
3.18 Construction in Progress
(a) Classification of construction in progress
Construction in progress is measured on an individual project basis.
(b) Recognition criteria and timing of transfer from construction in progress to fixed assets
The initial book values of the fixed assets are stated at total expenditures incurred before they are ready for their
intended use, including construction costs, original price of machinery equipment, other necessary expenses
incurred to bring the construction in progress to get ready for its intended use and borrowing costs of the specific

Interim Report 2021
~ 106 ~
loan for the construction or the proportion of the general loan used for the constructions incurred before they are
ready for their intended use. The construction in progress shall be transferred to fixed asset when the installation
or construction is ready for the intended use. For construction in progress that has been ready for their intended
use but relevant budgets for the completion of projects have not been completed, the estimated values of project
budgets, prices, or actual costs should be included in the costs of relevant fixed assets, and depreciation should be
provided according to relevant policies of the Company when the fixed assets are ready for intended use. After the
completion of budgets needed for the completion of projects, the estimated values should be substituted by actual
costs, but depreciation already provided is not adjusted.
3.19 Right-of-use assets
The Company initially measures right-of-use assets at cost, which includes:
(1) The initial measurement amount of the lease obligation.
(2) If a lease incentive exists for lease payments made on or before the commencement date of the lease term, the
amount related to the lease incentive already taken is deducted.
(3) Initial direct costs incurred by the Company.
(4) Costs expected to be incurred by the Company to disassemble and remove the leasehold property, restore the
site where the leasehold property is located, or restore the leasehold property to the condition agreed upon under
the terms of the lease (excluding costs incurred to produce inventory). Subsequent to the commencement date of
the lease term, the Company uses the cost model for subsequent measurement of right-of-use assets.
If it is reasonably certain that ownership of the leasehold property will be obtained at the end of the lease term, the
Company depreciates the leasehold property over its remaining service life.
If it may not be reasonably ascertained that ownership of the leasehold property can be obtained at the end of the
lease term, the Company will depreciate the leasehold property over the shorter of
the lease term or the remaining service life of the leasehold property. Right-of-use assets for which depreciation
reserves have been made are depreciated in future periods at their carrying amounts net of depreciation reserves,
with reference to the above principles.
3.20 Borrowing Costs
(a) Recognition criteria and period for capitalization of borrowing costs
The Company shall capitalize the borrowing costs that are directly attributable to the acquisition, construction or
production of qualifying assets when meet the following conditions:
(i) Expenditures for the asset are being incurred;
(ii) Borrowing costs are being incurred, and;
(iii) Acquisition, construction or production activities that are necessary to prepare the assets for their intended use

Interim Report 2021
~ 107 ~
or sale are in progress.
Other borrowing cost, discounts or premiums on borrowings and exchange differences on foreign currency
borrowings shall be recognized into current profit or loss when incurred.
Capitalization of borrowing costs is suspended during periods in which the acquisition, construction or production
of a qualifying asset is interrupted abnormally and the interruption is for a continuous period of more than 3
months.
Capitalization of such borrowing costs ceases when the qualifying assets being acquired, constructed or produced
become ready for their intended use or sale. The expenditure incurred subsequently shall be recognised as
expenses when incurred.
(b) Capitalization rate and measurement of capitalized amounts of borrowing costs
When funds are borrowed specifically for purchase, construction or manufacturing of assets eligible for
capitalization, the Company shall determine the amount of borrowing costs eligible for capitalisation as the actual
borrowing costs incurred on that borrowing during the period less any interest income on bank deposit or
investment income on the temporary investment of those borrowings.
Where funds allocated for purchase, construction or manufacturing of assets eligible for capitalization are part of a
general borrowing, the eligible amounts are determined by the weighted-average of the cumulative capital
expenditures in excess of the specific borrowing multiplied by the general borrowing capitalization rate. The
capitalization rate will be the weighted average of the borrowing costs applicable to the general borrowing.
3.21 Intangible Assets
(a) Measurement method of intangible assets
Intangible assets are recognised at actual cost at acquisition.
(b) The useful life and amortisation of intangible assets
(i) The estimated useful lives of the intangible assets with finite useful lives are as follows:
Category Estimated useful life Basis
Land use right 50 years Legal life
Patent right 10 years The service life is determined by reference to the period that
can bring economic benefits to the Company
Software 3-5 years The service life is determined by reference to the period that
can bring economic benefits to the Company
Trademark 10 years The service life is determined by reference to the period that
can bring economic benefits to the Company
For intangible assets with finite useful life, the estimated useful life and amortisation method are reviewed
annually at the end of each reporting period and adjusted when necessary. No change incurred in current year in
the estimated useful life and amortisation method upon review.

Interim Report 2021
~ 108 ~
(ii) Assets of which the period to bring economic benefits to the Company are unforeseeable are regarded as
intangible assets with indefinite useful lives. The Company reassesses the useful lives of those assets at every year
end. If the useful lives of those assets are still indefinite, impairment test should be performed on those assets at
the balance sheet date.
(iii) Amortisation of the intangible assets
For intangible assets with finite useful lives, their useful lives should be determined upon their acquisition and
systematically amortised on a straight-line basis over the useful life. The amortisation amount shall be recognized
into current profit or loss according to the beneficial items. The amount to be amortised is cost deducting residual
value. For intangible assets which has impaired, the cumulative impairment provision shall be deducted as well.
The residual value of an intangible asset with a finite useful life shall be assumed to be zero unless: there is a
commitment by a third party to purchase the asset at the end of its useful life; or there is an active market for the
asset and residual value can be determined by reference to that market; and it is probable that such a market will
exist at the end of the asset’s useful life.
Intangible assets with indefinite useful lives shall not be amortised. The Company reassesses the useful lives of
those assets at every year end. If there is evidence to indicate that the useful lives of those assets become finite,
the useful lives shall be estimated and the intangible assets shall be amortised systematically and reasonably
within the estimated useful lives.
(c) Criteria of classifying expenditures on internal research and development projects into research phase
and development phase
Preparation activities related to materials and other relevant aspects undertaken by the Company for the purpose
of further development shall be treated as research phase. Expenditures incurred during the research phase of
internal research and development projects shall be recognised in profit or loss when incurred.
Development activities after the research phase of the Company shall be treated as development phase.
(d) Criteria for capitalization of qualifying expenditures during the development phase
Expenditures arising from development phase on internal research and development projects shall be recognised
as intangible assets only if all of the following conditions have been met:
(i) Technical feasibility of completing the intangible assets so that they will be available for use or sale;
(ii) Its intention to complete the intangible asset and use or sell it;
(iii) The method that the intangible assets generate economic benefits, including the Company can demonstrate
the existence of a market for the output of the intangible assets or the intangible assets themselves or, if it is to be
used internally, the usefulness of the intangible assets;
(iv) The availability of adequate technical, financial and other resources to complete the development and to use
or sell the intangible asset; and
(v) Its ability to measure reliably the expenditure attributable to the intangible asset.

Interim Report 2021
~ 109 ~
3.22 Impairment of Long-Term Assets
Impairment loss of long-term equity investment in subsidiaries, associates and joint ventures, investment
properties, fixed assets and constructions in progress subsequently measured at cost, intangible assets, shall be
determined according to following method:
The Company shall assess at the end of each reporting period whether there is any indication that an asset may be
impaired. If any such indication exists, the Company shall estimate the recoverable amount of the asset and test
for impairment. Irrespective of whether there is any indication of impairment, the Company shall test for
impairment of goodwill acquired in a business combination, intangible assets with an indefinite useful life or
intangible assets not yet available for use annually.
The recoverable amounts of the long-term assets are the higher of their fair values less costs to dispose and the
present values of the estimated future cash flows of the long-term assets. The Company estimate the recoverable
amounts on an individual basis. If it is difficult to estimate the recoverable amount of the individual asset, the
Company estimates the recoverable amount of the groups of assets that the individual asset belongs to.
Identification of an group of asset is based on whether the cash inflows from it are largely independent of the cash
inflows from other assets or groups of assets.
If, and only if, the recoverable amount of an asset or a group of assets is less than its carrying amount, the carrying
amount of the asset shall be reduced to its recoverable amount and the provision for impairment loss shall be
recognised accordingly.
For the purpose of impairment testing, goodwill acquired in a business combination shall, from the acquisition
date, be allocated to relevant group of assets based on reasonable method; if it is difficult to allocate to relevant
group of assets, good will shall be allocated to relevant combination of asset groups. The relevant group of assets
or combination of asset groups is a group of assets or combination of asset groups that is benefit from the
synergies of the business combination and is not larger than the reporting segment determined by the Company.
When test for impairment, if there is an indication that relevant group of assets or combination of asset groups
may be impaired, impairment testing for group of assets or combination of asset groups excluding goodwill shall
be conducted first, and calculate the recoverable amount and recognize the impairment loss. Then the group of
assets or combination of asset groups including goodwill shall be tested for impairment, by comparing the
carrying amount with its recoverable amount. If the recoverable amount is less than the carrying amount, the
Company shall recognise the impairment loss.
The mentioned impairment loss will not be reversed in subsequent accounting period once it had been recognised.
3.23 Long-term Deferred Expenses
Long-term deferred expenses are various expenses already incurred, which shall be amortised over current and
subsequent periods with the amortisation period exceeding one year. Long-term deferred expenses are evenly
amortised over the beneficial period

Interim Report 2021
~ 110 ~
3.24 Employee Benefits
Employee benefits refer to all forms of consideration or compensation given by the Company in exchange for
service rendered by employees or for the termination of employment relationship. Employee benefits include
short-term employee benefits, post-employment benefits, termination benefits and other long-term employee
benefits. Benefits provided to an employee's spouse, children, dependents, family members of decreased
employees, or other beneficiaries are also employee benefits.
According to liquidity, employee benefits are presented in the statement of financial position as “Employee
benefits payable” and “Long-term employee benefits payable”.
(a) Short-term employee benefits
(i) Employee basic salary (salary, bonus, allowance, subsidy)
The Company recognises, in the accounting period in which an employee provides service, actually occurred
short-term employee benefits as a liability, with a corresponding charge to current profit except for those
recognised as capital expenditure based on the requirement of accounting standards.
(ii) Employee welfare
The Company shall recognise the employee welfare based on actual amount when incurred into current profit or
loss or related capital expenditure. Employee welfare shall be measured at fair value as it is a non-monetary
benefit.
(iii) Social insurance such as medical insurance and work injury insurance, housing funds, labor union fund and
employee education fund
Payments made by the Company of social insurance for employees, such as medical insurance and work injury
insurance, payments of housing funds, and labor union fund and employee education fund accrued in accordance
with relevant requirements, in the accounting period in which employees provide services, is calculated according
to required accrual bases and accrual ratio in determining the amount of employee benefits and the related
liabilities, which shall be recognised in current profit or loss or the cost of relevant asset.
(iv) Short-term paid absences
The company shall recognise the related employee benefits arising from accumulating paid absences when the
employees render service that increases their entitlement to future paid absences. The additional payable amounts
shall be measured at the expected additional payments as a result of the unused entitlement that has accumulated.
The Company shall recognise relevant employee benefit of non-accumulating paid absences when the absences
actually occurred.
(v) Short-term profit-sharing plan
The Company shall recognise the related employee benefits payable under a profit-sharing plan when all of the
following conditions are satisfied:
(i) The Company has a present legal or constructive obligation to make such payments as a result of past events;

Interim Report 2021
~ 111 ~
and
(ii) A reliable estimate of the amounts of employee benefits obligation arising from the profit- sharing plan can be
made.
(b) Post-employment benefits
(i) Defined contribution plans
The Company shall recognise, in the accounting period in which an employee provides service, the contribution
payable to a defined contribution plan as a liability, with a corresponding charge to the current profit or loss or the
cost of a relevant asset.
When contributions to a defined contribution plan are not expected to be settled wholly before twelve months
after the end of the annual reporting period in which the employees render the related service, they shall be
discounted using relevant discount rate (market yields at the end of the reporting period on high quality corporate
bonds in active market or government bonds with the currency and term which shall be consistent with the
currency and estimated term of the defined contribution obligations) to measure employee benefits payable.
(ii) Defined benefit plan
The present value of defined benefit obligation and current service costs
Based on the expected accumulative welfare unit method, the Company shall make estimates about demographic
variables and financial variables in adopting the unbiased and consistent actuarial assumptions and measure
defined benefit obligation, and determine the obligation period. The Company shall discount the obligation arising
from defined benefit plan using relevant discount rate (market yields at the end of the reporting period on high
quality corporate bonds in active market or government bonds with the currency and term which shall be
consistent with the currency and estimated term of the defined benefit obligations) in order to determine the
present value of the defined benefit obligation and the current service cost.
The net defined benefit liability or asset
The net defined benefit liability (asset) is the deficit or surplus recognised as the present value of the defined
benefit obligation less the fair value of plan assets (if any).
When the Company has a surplus in a defined benefit plan, it shall measure the net defined benefit asset at the
lower of the surplus in the defined benefit plan and the asset ceiling.
The amount recognised in the cost of asset or current profit or loss
Service cost comprises current service cost, past service cost and any gain or loss on settlement. Other service cost
shall be recognised in profit or loss unless accounting standards require or allow the inclusion of current service
cost within the cost of assets.
Net interest on the net defined benefit liability (asset) comprising interest income on plan assets, interest cost on
the defined benefit obligation and interest on the effect of the asset ceiling, shall be included in profit or loss.
The amount recognised in other comprehensive income

Interim Report 2021
~ 112 ~
Changes in the net liability or asset of the defined benefit plan resulting from the remeasurements including:
⚫ Actuarial gains and losses, the changes in the present value of the defined benefit obligation resulting from
experience adjustments or the effects of changes in actuarial assumptions;
⚫ Return on plan assets, excluding amounts included in net interest on the net defined benefit liability or asset;
⚫ Any change in the effect of the asset ceiling, excluding amounts included in net interest on the net defined
benefit liability (asset).
Remeasurements of the net defined benefit liability (asset) recognised in other comprehensive income shall not be
reclassified to profit or loss in a subsequent period. However, the Company may transfer those amounts
recognised in other comprehensive income within equity.
(c) Termination benefits
The Company providing termination benefits to employees shall recognise an employee benefits liability for
termination benefits, with a corresponding charge to the profit or loss of the reporting period, at the earlier of the
following dates:
(i) When the Company cannot unilaterally withdraw the offer of termination benefits because of an employment
termination plan or a curtailment proposal.
(ii) When the Company recognises costs or expenses related to a restructuring that involves the payment of
termination benefits.
If the termination benefits are not expected to be settled wholly before twelve months after the end of the annual
reporting period, the Company shall discount the termination benefits using relevant discount rate (market yields
at the end of the reporting period on high quality corporate bonds in active market or government bonds with the
currency and term which shall be consistent with the currency and estimated term of the defined benefit
obligations) to measure the employee benefits.
(d) Other long-term employee benefits
(i) Meet the conditions of the defined contribution plan
When other long-term employee benefits provided by the Company to the employees satisfies the conditions for
classifying as a defined contribution plan, all those benefits payable shall be accounted for as employee benefits
payable at their discounted value.
(ii) Meet the conditions of the defined benefit plan
At the end of the reporting period, the Company recognised the cost of employee benefit from other long-term
employee benefits as the following components:
⚫ Service costs;
⚫ Net interest cost for net liability or asset of other long-term employee benefits
⚫ Changes resulting from the remeasurements of the net liability or asset of other long-term employee benefits
In order to simplify the accounting treatment, the net amount of above items shall be recognised in profit or loss

Interim Report 2021
~ 113 ~
or relevant cost of assets.
3.25 Lease Liabilities
The Company initially measures the lease obligation at the present value of the lease payments outstanding at the
commencement date of the lease term. When calculating the present value of lease payments,
the Company uses the interest rate implicit in lease as the rate of discount. If the interest rate implicit in lease
cannot be determined, the Company's incremental lending rate is used as the rate of discount. Lease payments
include:
(1) The amount of fixed payments, net of amounts related to lease incentives, and the amount of substantive fixed
payments.
(2) Variable lease payments that depend on indexation or ratio.
(3) The lease payment amount includes the exercise price of the purchase option if the Company is reasonably
certain that the option will be exercised.
(4) Where the lease term reflects that the Company will exercise the option to terminate the lease, the lease
payment amount includes the amount required to be paid to exercise the option to terminate the lease.
(5) Estimated amount payable based on the residual value of the guarantee provided by the Company.
The Company calculates the interest expense on the lease obligation for each period of the lease term at a fixed
rate of discount and includes it in the current profit or loss or cost of the related assets. Variable lease payments
that are not included in the measurement of the lease obligation should be charged to current profit or loss or the
cost of the related assets when they are actually incurred.
3.26 Estimated Liabilities
(a) Recognition criteria of estimated liabilities
The Company recognises the estimated liabilities when obligations related to contingencies satisfy all the
following conditions:
(i) That obligation is a current obligation of the Company;
(ii) It is likely to cause any economic benefit to flow out of the Company as a result of performance of the
obligation; and
(iii) The amount of the obligation can be measured reliably.
(b) Measurement method of estimated liabilities
The estimated liabilities of the Company are initially measured at the best estimate of expenses required for the
performance of relevant present obligations. The Company, when determining the best estimate, has had a
comprehensive consideration of risks with respect to contingencies, uncertainties and the time value of money.
The carrying amount of the estimated liabilities shall be reviewed at the end of every reporting period. If
conclusive evidences indicate that the carrying amount fails to be the best estimate of the estimated liabilities, the

Interim Report 2021
~ 114 ~
carrying amount shall be adjusted based on the updated best estimate.
3.27 Revenue Recognition Principle and Measurement
3.25.1 General principle
Revenue is the total inflow of economic benefits formed in the company's daily activities that will increase
shareholders' equity and does not relate to the capital invested by shareholders.
The Company has fulfilled the performance obligation in the contract, that is, the revenue is recognised when the
customer obtains the control right of relevant goods. To obtain the control right of the relevant commodity means
to be able to dominate the use of the commodity and obtain almost all the economic benefits from it.
If there are two or more performance obligations in the contract, the Company will allocate the transaction price
to each performance obligation based on the relative proportion of the separate selling price of the goods or
services promised by each performance obligation on the start date of the contract, and measure the income based
on the transaction price allocated to each single performance obligation.
The transaction price refers to the amount of consideration that the Company is expected to be entitled to receive
due to the transfer of goods or services to customers, excluding payments collected on behalf of third parties.
When determining the transaction price of the contract, the Company determines the transaction price according
to the terms of the contract and in combination with its historical practices. When determining the transaction
price, the Company takes into account the influence of variable considerations, significant financing elements in
the contract, the non-cash considerations, the considerations payable to customers and other factors. The
Company determines the transaction price including variable consideration at an amount that does not exceed the
amount at which the accumulated recognized income is unlikely to have a significant reversal when the relevant
uncertainty is eliminated. If there is a significant financing component in the contract, the Company will
determine the transaction price based on the amount payable in cash when the customer obtains the control right
of the commodity. The difference between the transaction price and the contract consideration will be amortised
by the effective interest method during the contract period. If the interval between the control right transfer and
the customer's payment is less than one year, the company will not consider the financing component.
If one of the following conditions is met, the performance obligation shall be fulfilled within a certain period of
time; otherwise, the performance obligation shall be fulfilled at a certain point of time:
(a) The customer obtains and consumes the economic benefits brought by the Company's fulfillment of contract
when the Company performs the obligations;
(b) The customer can control the commodities under construction during the Company's execution of the
contract;

Interim Report 2021
~ 115 ~
(c) The commodities produced by the Company during the performance of the contract have irreplaceable uses,
and the Company has the right to collect payment for the cumulative performance part that has been completed
so far during the entire contract period.
For performance obligations fulfilled within a certain period of time, the Company recognises revenue in
accordance with the performance progress during that period, except where the performance progress cannot be
reasonably determined. The Company determines the progress of the performance of services in accordance with
the input method (or output method). When the progress of the contract performance cannot be reasonably
determined, if the cost incurred by the Company is expected to be compensated, the revenue shall be recognised
according to the amount of the cost incurred until the progress of the contract performance can be reasonably
determined.
For performance obligations fulfilled at a certain point in time, the Company recognises revenue at the point when
the customer obtains control of the relevant commodities. The Company considers the following signs when
judging whether a customer has obtained control of goods or services:
(a)The Company has the current right to receive payment for the goods or services, that is, the customer has the
current obligation to pay for the goods;
(b) The Company has transferred the legal ownership of the goods to the customer, that is, the customer has the
legal ownership of the goods;
(c) The Company has transferred the goods in kind to the customer, that is, the customer has possessed the
goods in kind;
(d) The company has transferred the main risks and rewards of the ownership of the goods to the customers, that
is, the customers have obtained the main risks and rewards of the ownership of the goods;
(e) The customer has accepted the goods or services.
(f) Other indications that the customer has obtained control of the product
3.25.2 Specific methods
The specific methods of the Company's revenue recognition are as follows:
(a) Revenue from sale of goods
Revenue from sale of goods shall be recognised when the following criteria are satisfied:
(i) Significant risks and rewards related to ownership of the goods have been transferred to the buyer;
(ii) The Company retains neither continuous management rights associated with ownership of the goods sold nor
effective control over the goods sold;

Interim Report 2021
~ 116 ~
(iii) Relevant amount of revenue can be measured reliably;
(iv) It is probable that the economic benefits associated with the transaction will flow into the Company; and
(v) Relevant amount of cost incurred or to be incurred can be measured reliably.
Revenue arising from domestic sales of goods is recognized when goods are dispatched and delivered to the buyer,
when significant risks and rewards attached to the ownership of the goods sold are passed to the buyer, when
neither continual involvement in the rights normally associated with the ownership of the goods sold nor effective
control over the goods controls are retained, when revenue arising from the goods sold is reliably measurable,
when inflow of future economic benefits is probable, and when cost incurred or to be incurred associated with the
goods sold is reliably measurable. Revenue arising from non-domestic sales of goods is recognized when goods
are loaded on board and when the export clearance with the custom is completed.
(b) Revenue from rendering of services
When the outcome of rendering of services can be estimated reliably at the balance sheet date, revenue associated
with the transaction is recognised using the percentage of completion method. Percentage of completion is
determined based on the measurement of the work completed
The outcome of rendering of services can be estimated reliably when all of the following conditions are satisfied: i)
the amount of revenue can be measured reliably; ii) it is probable that the associated economic benefits will flow
to the Company; iii) the percentage of completion of the transaction can be measured reliably; iv) the costs
incurred and to be incurred for the transaction can be measured reliably.
The Company shall determine the total revenue from rendering of services based on the received or receivable
price stipulated in the contract or agreement, unless the received or receivable amount as stipulated in the contract
or agreement is unfair. At the end of the reporting period, the Company shall recognise the revenue from
rendering of the services in current period, based on the amount of multiplying the total amount of revenues from
rendering of the services by the percentage of completion then deducting the accumulative revenues from
rendering of the services that have been recognised in the previous accounting periods. At the same time, the
Company shall recognise the current cost incurred for rendering of the services based on the amount of
multiplying the total estimated cost for rendering of the services by the percentage of completion and then
deducting the accumulative costs from rendering of the services that have been recognised in the previous
accounting periods.
If the outcome of rendering of services cannot be estimated reliably at the balance sheet date, the accounting
treatment shall be based on the following circumstances, respectively:
(i) When the costs incurred are expected to be recovered, revenue shall be recognised to the extent of costs

Interim Report 2021
~ 117 ~
incurred and charge an equivalent amount of cost to the profit and loss;
(ii) When the costs incurred are not expected to be recovered, revenue shall not be recognised and the costs
incurred are recognised into current profit or loss
(c) Revenue from alienating the right to use assets
When it is probable that the economic benefits associated with the transaction will flow into the Company and
amount of revenue can be measured reliably, the Company shall recognise the amount of revenue from the
alienating of right to use assets based on the following circumstances, respectively:
(i) Interest revenue should be calculated in accordance with the period for which the enterprise's cash is used by
others and the effective interest rate; or
(ii) The amount of royalty revenue should be calculated in accordance with the period and method of charging as
stipulated in the relevant contract or agreement.
3.28 Government Grants
(a) Recognition of government grants
A government grant shall not be recgonised until there is reasonable assurance that:
(i) The Company will comply with the conditions attaching to them; and
(ii) The grants will be received.
(b) Measurement of government grants
Monetary grants from the government shall be measured at amount received or receivable, and non-monetary
grants from the government shall be measured at their fair value or at a nominal value of RMB 1.00 when reliable
fair value is not available.
(c) Accounting for government grants
(i) Government grants related to assets
Government grants pertinent to assets mean the government grants that are obtained by the Company used for
purchase or construction, or forming the long-term assets by other ways. Government grants pertinent to assets
shall be recognised as deferred income, and should be recognised in profit or loss on a systematic basis over the
useful lives of the relevant assets. Grants measured at their nominal value shall be directly recognised in profit or
loss of the period when the grants are received. When the relevant assets are sold, transferred, written off or
damaged before the assets are terminated, the remaining deferred income shall be transferred into profit or loss of
the period of disposing relevant assets.
(ii) Government grants related to income
Government grants other than related to assets are classified as government grants related to income. Government
grants related to income are accounted for in accordance with the following principles:

Interim Report 2021
~ 118 ~
If the government grants related to income are used to compensate the enterprise’s relevant expenses or losses in
future periods, such government grants shall be recognised as deferred income and included into profit or loss in
the same period as the relevant expenses or losses are recognised;
If the government grants related to income are used to compensate the enterprise’s relevant expenses or losses
incurred, such government grants are directly recognised into current profit or loss
For government grants comprised of part related to assets as well as part related to income, each part is accounted
for separately; if it is difficult to identify different part, the government grants are accounted for as government
grants related to income as a whole.
Government grants related to daily operation activities are recognised in other income in accordance with the
nature of the activities, and government grants irrelevant to daily operation activities are recognised in
non-operating income.
(iii) Loan interest subsidy
When loan interest subsidy is allocated to the bank, and the bank provides a loan at lower-market rate of interest
to the Company, the loan is recognised at the actual received amount, and the interest expense is calculated based
on the principal of the loan and the lower-market rate of interest.
When loan interest subsidy is directly allocated to the Company, the subsidy shall be recognised as offsetting the
relevant borrowing cost.
(iv) Repayment of the government grants
Repayment of the government grants shall be recorded by increasing the carrying amount of the asset if the book
value of the asset has been written down, or reducing the balance of relevant deferred income if deferred income
balance exists, any excess will be recognised into current profit or loss; or directly recognised into current profit
or loss for other circumstances.
3.29 Deferred Tax Assets and Deferred Tax Liabilities
Temporary differences are differences between the carrying amount of an asset or liability in the statement of
financial position and its tax base at the balance sheet date. The Company recognise and measure the effect of
taxable temporary differences and deductible temporary differences on income tax as deferred tax liabilities or
deferred tax assets using liability method. Deferred tax assets and deferred tax liabilities shall not be discounted.
(a) Recognition of deferred tax assets
Deferred tax assets should be recognised for deductible temporary differences, the carryforward of unused tax
losses and the carryforward of unused tax credits to the extent that it is probable that taxable profit will be
available against which the deductible temporary differences, the carryforward of unused tax losses and the
carryforward of unused tax credits can be utilised at the tax rates that are expected to apply to the period when the
asset is realised, unless the deferred tax asset arises from the initial recognition of an asset or liability in a
Interim Report 2021
~ 119 ~
transaction that:
(i) Is not a business combination; and
(ii) At the time of the transaction, affects neither accounting profit nor taxable profit (tax loss)
The Company shall recognise a deferred tax asset for all deductible temporary differences arising from
investments in subsidiaries, associates and joint ventures, only to the extent that, it is probable that:
(i) The temporary difference will reverse in the foreseeable future; and
(ii) Taxable profit will be available against which the deductible temporary difference can be utilised.
At the end of each reporting period, if there is sufficient evidence that it is probable that taxable profit will be
available against which the deductible temporary difference can be utilized, the Company recognises a previously
unrecognised deferred tax asset.
The carrying amount of a deferred tax asset shall be reviewed at the end of each reporting period. The Company
shall reduce the carrying amount of a deferred tax asset to the extent that it is no longer probable that sufficient
taxable profit will be available to allow the benefit of part or all of that deferred tax asset to be utilised. Any such
reduction shall be reversed to the extent that it becomes probable that sufficient taxable profit will be available.
(b) Recognition of deferred tax liabilities
A deferred tax liability shall be recognised for all taxable temporary differences at the tax rate that are expected to
apply to the period when the liability is settled.
(i) No deferred tax liability shall be recognised for taxable temporary differences arising from:
⚫ The initial recognition of goodwill; or
⚫ The initial recognition of an asset or liability in a transaction which: is not a business combination; and at the
time of the transaction, affects neither accounting profit nor taxable profit (tax loss)
(ii) An entity shall recognise a deferred tax liability for all taxable temporary differences associated with
investments in subsidiaries, associates, and joint ventures, except to the extent that both of the following
conditions are satisfied:
⚫ The Company is able to control the timing of the reversal of the temporary difference; and
⚫ It is probable that the temporary difference will not reverse in the foreseeable future.
(c) Recognition of deferred tax liabilities or assets involved in special transactions or events
(i) Deferred tax liabilities or assets related to business combination
For the taxable temporary difference or deductible temporary difference arising from a business combination not
under common control, a deferred tax liability or a deferred tax asset shall be recognised, and simultaneously,
goodwill recognised in the business combination shall be adjusted based on relevant deferred tax expense
(income).
(ii) Items directly recognised in equity
Current tax and deferred tax related to items that are recognised directly in equity shall be recognised in equity.

Interim Report 2021
~ 120 ~
Such items include: other comprehensive income generated from fair value fluctuation of investments in other
debt obligations; an adjustment to the opening balance of retained earnings resulting from either a change in
accounting policy that is applied retrospectively or the correction of a prior period (significant) error; amounts
arising on initial recognition of the equity component of a compound financial instrument that contains both
liability and equity component.
(iii) Unused tax losses and unused tax credits
Unsused tax losses and unused tax credits generated from daily operation of the Company itself
Deductible loss refers to the loss calculated and permitted according to the requirement of tax law that can be
offset against taxable income in future periods. The criteria for recognising deferred tax assets arising from the
carryforward of unused tax losses and tax credits are the same as the criteria for recognising deferred tax assets
arising from deductible temporary differences. The Company recognises a deferred tax asset arising from unused
tax losses or tax credits only to the extent that there is convincing other evidence that sufficient taxable profit will
be available against which the unused tax losses or unused tax credits can be utilised by the Company. Income
taxes in current profit or loss shall be deducted as well.
Unsused tax losses and unused tax credits arising from a business combination
Under a business combination, the acquiree’s deductible temporary differences which do not satisfy the criteria at
the acquisition date for recognition of deferred tax asset shall not be recognised. Within 12 months after the
acquisition date, if new information regarding the facts and circumstances exists at the acquisition date and the
economic benefit of the acquiree’s deductible temporary differences at the acquisition is expected to be realised,
the Company shall recognise acquired deferred tax benefits and reduce the carrying amount of any goodwill
related to this acquisition. If goodwill is reduced to zero, any remaining deferred tax benefits shall be recognised
in profit or loss. All other acquired deferred tax benefits realised shall be recognised in profit or loss.
(iv) Temporary difference generated in consolidation elimination
When preparing consolidated financial statements, if temporary difference between carrying value of the assets
and liabilities in the consolidated financial statements and their taxable bases is generated from elimination of
inter-company unrealized profit or loss, deferred tax assets or deferred tax liabilities shall be recognised in the
consolidated financial statements, and income taxes expense in current profit or loss shall be adjusted as well
except for deferred tax related to transactions or events recognised directly in equity and business combination.
(v) Share-based payment settled by equity
If tax authority permits tax deduction that relates to share-based payment, during the period in which the expenses
are recognised according to the accounting standards, the Company estimates the tax base in accordance with
available information at the end of the accounting period and the temporary difference arising from it. Deferred
tax shall be recognised when criteria of recognition are satisfied. If the amount of estimated future tax deduction

Interim Report 2021
~ 121 ~
exceeds the amount of the cumulative expenses related to share-based payment recognised according to the
accounting standards, the tax effect of the excess amount shall be recognised directly in equity.
3.30 Leases
(1) Accounting treatment of operating leases
a) When the Company acts as a lessee under an operating lease, the rental expense of the operating lease is
charged to current profit or loss on a straight-line basis or based on the usage of the leasehold property in each
period of the lease term. If the lessor provides a rent-free period, the Company apportions the total rent on a
straight-line basis or by other reasonable method over the entire lease term without deducting the rent-free period,
and recognizes the rental expense and the corresponding liability during the rent-free period. If the lessor bears
certain expenses of the lessee, the Company apportions the balance of the rental expense over the lease term after
such expenses are deducted from the total rental expense.
The initial direct costs are included in current profit or loss. If the agreement agrees to contingent rentals, they are
included in current profit or loss when they are actually incurred.
b) When the Company acts as a lessor under an operating lease, the rent received is recognized as income over the
lease term using the straight-line method. If the lessor provides a rent-free period, the lessor allocates the total
rentals over the entire lease term without deducting the rent-free period by the straight-line method or other
reasonable method, and the lessor also recognizes rental income during the rent-free period. If certain expenses of
the lessee are borne, the Company allocates the balance of rental income over the lease term after such expenses
are deducted from the gross rental income.
The initial direct costs are included in current profit or loss. Larger amounts are capitalized and recognized in
current profit or loss on the same basis as rental income throughout the term of the operating lease. Contingent
rentals, if agreed, are recognized in current income when they are actually incurred.
(2) Accounting treatment of finance leases
a) When the Company is a lessee under a finance lease, the lower of the fair value of the leasehold property and
the present value of the minimum lease payments at the commencement date of the lease is recorded as the value
of the leasehold property, and the minimum lease payments are recorded as the value of the long-term account
payable, and the difference is recorded as unrecognized financing expense. The effective interest rate method is
used to apportion the amount over each period of the lease term and is recognized as current financing expenses,
which are included in financial expenses.
The initial direct costs incurred are included in the value of the leasehold property.
When depreciating financing leasehold property, the Company adopts a depreciation policy consistent with that of
its own depreciable assets, and the depreciation period is determined by the lease contract. If it may be reasonably
ascertained that the Company will obtain ownership of the leasehold property at the end of the lease term, the life
of the leasehold property at the commencement date of the lease term is used as the depreciation period; if it is not

Interim Report 2021
~ 122 ~
reasonably certain that the Company will obtain ownership of the leasehold property at the end of the lease term,
the shorter of the lease term and the life of the leasehold property is used as the depreciation period.
b) When the Company acts as a financing lessor, the sum of the minimum lease receivable and the initial direct
costs as of the lease commencement date is recorded as the recorded value of the finance lease receivable in the
long-term receivables on the balance sheet, and the unguaranteed residual value is also recorded. The difference
between the sum of the minimum lease receivable, the initial direct costs and the unguaranteed residual value and
the sum of their present values is recognized as unrealized financing income and recognized as rental receipt using
the effective interest method in each period of the lease term.
3.31 Changes in Significant Accounting Policies and Accounting Estimates
(1) Changes in accounting polices
√ Applicable □ Not applicable
Contents of changes in accounting policies
and reasons thereof Approval procedures Note
On 7 December 2018, the Ministry of
Finance revised and issued the Accounting
Standards for Business Enterprises
No.21-Leases (CK(2018)No.35)
(hereinafter referred to as the new
standards governing leases) and required
those enterprises both listed in domestic
and aboard and those enterprises overseas
listed with International Financial
Reporting Standards or Accounting
Standards for Business Enterprises for
preparation of financial statements to
implement it since 1 January 2019,
required other enterprises carrying out the
Accounting Standards for Business
Enterprises to implement it since 1 January
2021.
Reviewed and approved on the 7th Meeting
of the 9th Board of Directors and the 5th
Meeting of the 9th Supervisory Committee
For details, please refer to the
announcement on changes in accounting
policies disclosed on
http://www.cninfo.com.cn dated 30 April
2021.
(2) Changes in Accounting Estimates
□Applicable √Not applicable
(3) Adjustments to the Financial Statements at the Beginning of the First Execution Year of any New
Standards Governing Leases since 2021
Applicable
Whether items of balance sheets at the beginning of the year need adjustment
√ Yes □ No

Interim Report 2021
~ 123 ~
Consolidated Balance Sheet
Unit: RMB
Item 31 December 2020 1 January 2021 Adjusted
Current assets:
Monetary assets 5,971,212,569.66 5,971,212,569.66
Settlement reserve
Interbank loans granted
Held-for-trading financial
assets 203,877,915.51 203,877,915.51
Derivative financial assets
Notes receivable
Accounts receivable 67,933,735.91 67,933,735.91
Accounts receivable
financing 1,673,510,794.51 1,673,510,794.51
Prepayments 55,575,543.21 51,399,808.11 -4,175,735.10
Premiums receivable
Reinsurance receivables
Receivable reinsurance
contract reserve
Other receivables 33,451,121.48 33,451,121.48
Including: Interest
receivable
Dividends
receivable
Financial assets purchased
under resale agreements
Inventories 3,416,880,808.96 3,416,880,808.96
Contract assets
Assets held for sale
Current portion of
non-current assets
Other current assets 97,412,681.26 97,412,681.26
Total current assets 11,519,855,170.50 11,515,679,435.40 -4,175,735.10
Non-current assets:
Loans and advances to
customers
Investments in debt

Interim Report 2021
~ 124 ~
obligations
Investments in other debt
obligations
Long-term receivables
Long-term equity
investments 4,915,575.83 4,915,575.83
Investments in other equity
instruments
Other non-current financial
assets
Investment property 4,392,943.54 4,392,943.54
Fixed assets 1,797,789,271.62 1,797,789,271.62
Construction in progress 279,169,201.60 279,169,201.60
Productive living assets
Oil and gas assets
Right-of-use assets 0.00 57,402,412.53 57,402,412.53
Intangible assets 934,711,977.79 934,711,977.79
Development costs
Goodwill 478,283,495.29 478,283,495.29
Long-term prepaid
expense 64,591,933.65 64,591,933.65
Deferred income tax assets 96,972,421.95 96,972,421.95
Other non-current assets 5,943,717.02 5,943,717.02
Total non-current assets 3,666,770,538.29 3,724,172,950.82 57,402,412.53
Total assets 15,186,625,708.79 15,239,852,386.22 53,226,677.43
Current liabilities:
Short-term borrowings 70,665,500.00 70,665,500.00
Borrowings from the
central bank
Interbank loans obtained
Held-for-trading financial
liabilities
Derivative financial
liabilities
Notes payable 140,614,535.60 140,614,535.60
Accounts payable 505,206,561.86 505,206,561.86
Advances from customers

Interim Report 2021
~ 125 ~
Contract liabilities 1,206,573,886.26 1,206,573,886.26
Financial assets sold under
repurchase agreements
Customer deposits and
interbank deposits
Payables for acting trading
of securities
Payables for underwriting
of securities
Employee benefits payable 498,129,114.76 498,129,114.76
Taxes payable 349,142,692.10 349,142,692.10
Other payables 1,396,599,161.14 1,396,599,161.14
Including: Interest
payable
Dividends
payable
Handling charges and
commissions payable
Reinsurance payables
Liabilities directly
associated with assets held
for sale
Current portion of
non-current liabilities
Other current liabilities 320,792,383.03 320,792,383.03
Total current liabilities 4,487,723,834.75 4,487,723,834.75
Non-current liabilities:
Insurance contract reserve
Long-term borrowings 60,117,638.89 60,117,638.89
Bonds payable
Including: Preferred
shares
Perpetual
bonds
Lease liabilities 0.00 53,226,677.43 53,226,677.43
Long-term payables
Long-term employee
benefits payable
Provisions

Interim Report 2021
~ 126 ~
Deferred income 75,111,997.53 75,111,997.53
Deferred income tax
liabilities 114,821,451.24 114,821,451.24
Other non-current
liabilities
Total non-current liabilities 250,051,087.66 303,277,765.09 53,226,677.43
Total liabilities 4,737,774,922.41 4,791,001,599.84 53,226,677.43
Owners’ equity:
Share capital 503,600,000.00 503,600,000.00
Other equity instruments
Including: Preferred
shares
Perpetual
bonds
Capital reserves 1,295,405,592.25 1,295,405,592.25
Less: Treasury stock
Other comprehensive
income
Specific reserve
Surplus reserves 256,902,260.27 256,902,260.27
General reserve
Retained earnings 7,987,380,161.21 7,987,380,161.21
Total equity attributable to
owners of the Company as
the parent
10,043,288,013.73 10,043,288,013.73
Non-controlling interests 405,562,772.65 405,562,772.65
Total owners’ equity 10,448,850,786.38 10,448,850,786.38
Total liabilities and owners’
equity 15,186,625,708.79 15,239,852,386.22 53,226,677.43
Note
The Ministry of Finance issued the Accounting Standard for Business Enterprises No. 21 - Leases (C.K. [2018] No. 35) in 2018, and
the Company implemented the new leasing standard since 1 January 2021, and adjusted the amounts of relevant items in the financial
statements at the beginning of the year of first implementation based on the cumulative effect of the first implementation of the new
leasing standard, without adjusting the information of the comparable period. The above policy change increased right-of-use assets
by RMB57,402,412.53, increased lease liabilities by RMB53,226,677.43 and decreased prepayments by RMB4,175,735.10.
Balance Sheet of the Company as the Parent
Unit: RMB
Item 31 December 2020 1 January 2021 Adjusted
Current assets:

Interim Report 2021
~ 127 ~
Monetary assets 4,287,808,756.66 4,287,808,756.66
Held-for-trading financial
assets 203,877,915.51 203,877,915.51
Derivative financial assets
Notes receivable
Accounts receivable 494,976.27 494,976.27
Accounts receivable
financing 1,399,214,331.97 1,399,214,331.97
Prepayments 11,737,580.47 7,561,845.37 -4,175,735.10
Other receivables 141,378,010.40 141,378,010.40
Including: Interest
receivable
Dividends
receivable
Inventories 2,976,360,208.66 2,976,360,208.66
Contract assets
Assets held for sale
Current portion of
non-current assets
Other current assets 9,734,249.41 9,734,249.41
Total current assets 9,030,606,029.35 9,026,430,294.25 -4,175,735.10
Non-current assets:
Investments in debt
obligations
Investments in other debt
obligations
Long-term receivables
Long-term equity
investments 1,118,213,665.32 1,118,213,665.32
Investments in other equity
instruments
Other non-current financial
assets
Investment property 4,392,943.54 4,392,943.54
Fixed assets 1,322,818,855.86 1,322,818,855.86
Construction in progress 139,865,487.21 139,865,487.21
Productive living assets
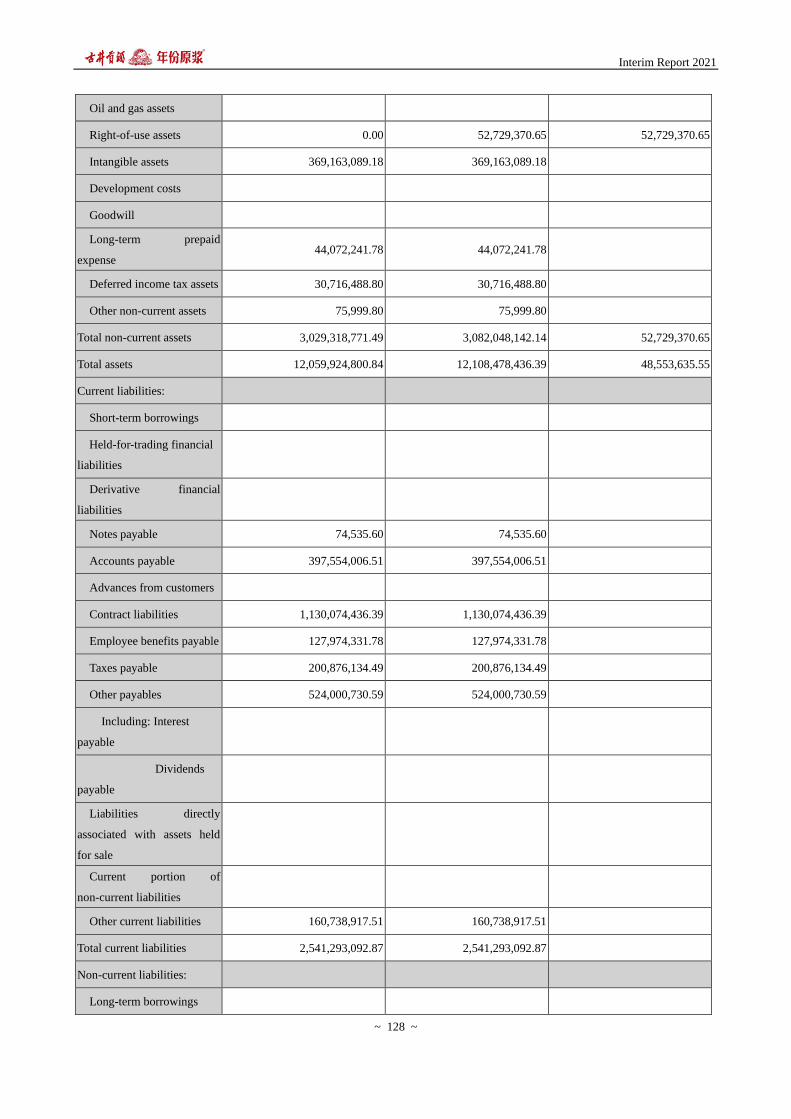
Interim Report 2021
~ 128 ~
Oil and gas assets
Right-of-use assets 0.00 52,729,370.65 52,729,370.65
Intangible assets 369,163,089.18 369,163,089.18
Development costs
Goodwill
Long-term prepaid
expense 44,072,241.78 44,072,241.78
Deferred income tax assets 30,716,488.80 30,716,488.80
Other non-current assets 75,999.80 75,999.80
Total non-current assets 3,029,318,771.49 3,082,048,142.14 52,729,370.65
Total assets 12,059,924,800.84 12,108,478,436.39 48,553,635.55
Current liabilities:
Short-term borrowings
Held-for-trading financial
liabilities
Derivative financial
liabilities
Notes payable 74,535.60 74,535.60
Accounts payable 397,554,006.51 397,554,006.51
Advances from customers
Contract liabilities 1,130,074,436.39 1,130,074,436.39
Employee benefits payable 127,974,331.78 127,974,331.78
Taxes payable 200,876,134.49 200,876,134.49
Other payables 524,000,730.59 524,000,730.59
Including: Interest
payable
Dividends
payable
Liabilities directly
associated with assets held
for sale
Current portion of
non-current liabilities
Other current liabilities 160,738,917.51 160,738,917.51
Total current liabilities 2,541,293,092.87 2,541,293,092.87
Non-current liabilities:
Long-term borrowings

Interim Report 2021
~ 129 ~
Bonds payable
Including: Preferred
shares
Perpetual
bonds
Lease liabilities 0.00 48,553,635.55 48,553,635.55
Long-term payables
Long-term employee
benefits payable
Provisions
Deferred income 31,601,732.51 31,601,732.51
Deferred income tax
liabilities 19,407,895.89 19,407,895.89
Other non-current
liabilities
Total non-current liabilities 51,009,628.40 99,563,263.95 48,553,635.55
Total liabilities 2,592,302,721.27 2,640,856,356.82 48,553,635.55
Owners’ equity:
Share capital 503,600,000.00 503,600,000.00
Other equity instruments
Including: Preferred
shares
Perpetual
bonds
Capital reserves 1,247,162,107.35 1,247,162,107.35
Less: Treasury stock
Other comprehensive
income
Specific reserve
Surplus reserves 251,800,000.00 251,800,000.00
Retained earnings 7,465,059,972.22 7,465,059,972.22
Total owners’ equity 9,467,622,079.57 9,467,622,079.57
Total liabilities and owners’
equity 12,059,924,800.84 12,108,478,436.39 48,553,635.55
Note
The Ministry of Finance issued the Accounting Standard for Business Enterprises No. 21 - Leases (C.K. [2018] No. 35) in 2018, and
the Company implemented the new leasing standard since 1 January 2021, and adjusted the amounts of relevant items in the financial
statements at the beginning of the year of first implementation based on the cumulative effect of the first implementation of the new
leasing standard, without adjusting the information of the comparable period. The above policy change increased right-of-use assets

Interim Report 2021
~ 130 ~
by RMB52,729,370.65, increased lease liabilities by RMB48,553,635.55 and decreased prepayments by RMB4,175,735.10.
(4) Retroactive Adjustments to Comparative Data of Prior Years when First Execution of any New
Standards Governing Leases since 2021
□ Applicable √ Not applicable
4. Taxation
4.1 Main Taxes and Tax Rate
Category of taxes Basis of tax assessment Tax rate
VAT VAT are paid on added value of
product sales 13%, 9%, 6%
Consumption tax
Consumption taxes are paid
onsales volume of taxable
consumer goods
Sales of wine RMB1 per 1000 ml or per kg to calculate the amount of
consumption tax, a flat rate, 20% of the annual turnover to calculate the
amount of consumption tax at valorem.
Urban maintenance and
construction tax
Urban maintenance and
construction taxes are paid on
turnover taxes
7%、5%
Education expenses
surcharge
Educational surcharges are paid
on turnover taxes
3%
Local education
surcharge
Local educational surcharges are
paid on turnover taxes
2%
Enterprise income tax Business taxes are calculated
and paid on taxable revenues
25%
The basic income tax rate of the company is 25%, and the effective income tax rate of some subsidiaries is other
tax rates, as shown in the table below:
Name of the entities Income tax rate
Anhui Longrui Glass Co., Ltd 15%
Anhui Ruisiweier Technology Co., Ltd 15%
Wuhan Yashibo Technology Co., Ltd 2.5%
Bozhou Gujing hotel Co., Ltd 2.5%
Hubei Junlou Cultural Tourism Co., Ltd.
The portion of the taxable income which does
not exceed RMB1 million: 2.5%
The portion of the taxable income which is more
than RMB1 million but not more than RMB3
million: 10%
Hubei Yellow Crane Tower Beverage Co., Ltd. 2.5%

Interim Report 2021
~ 131 ~
Hubei Xinjia Testing Technology Co., Ltd.
The portion of the taxable income which does
not exceed RMB1 million: 2.5%
The portion of the taxable income which is more
than RMB1 million but not more than RMB3
million: 10%
4.2 Tax Preference
(1) According to Response Letter for the First Batch of High-tech Enterprises to be put on record in Anhui
Province for 2019 (guokehuozi [2019] No.216) issued by Department of Science and Technology of Anhui
province, Department of Finance of Anhui province, and Anhui Provincial Taxation Bureau of State
Administration of Taxation, the subsidiary Longrui Glass was identified as a high-tech enterprise in 2019,
therefore was given High-tech Enterprise Certificate (Certificate Number: GR201934001625) which is valid for 3
years. According to Enterprise Income Tax Law and other relevant regulations, the company is subject to a
national high-tech enterprise income tax rate at 15% for three years from 1 January 2019 to 31 December 2021.
(2) According to Response Letter for the First Batch of High-tech Enterprises to be put on record in Anhui
Province for 2019 (guokehuozi [2019] No.216) issued by Department of Science and Technology of Anhui
province, Department of Finance of Anhui province, and Anhui Provincial Taxation Bureau of State
Administration of Taxation, the subsidiary Ruisiweier was identified as a high-tech enterprise in 2019, therefore
was given High-tech Enterprise Certificate (Certificate Number: GR201934000355) which is valid for 3 years.
According to Enterprise Income Tax Law and other relevant regulations, the company is subject to a national
high-tech enterprise income tax rate at 15% for three years from 1 January 2019 to 31 December 2021.
(3) According to the Announcement of the State Taxation Administration and the Ministry of Finance on the
Implementation of Preferential Income Tax Policies for Small- and Micro-sized Enterprises and Individual
Industrial and Commercial Entities (No. 12 of 2021), from 1 January 2021 to 31 December 2022, the portion of
the annual taxable income of small- and micro-sized enterprises not exceeding RMB1 million, the taxable income
shall be reduced by 12.5% and subject to enterprise income tax at a rate of 20%. For the portion of annual taxable
income exceeding RMB1 million but not exceeding RMB3 million, the taxable income shall be reduced by 50%
and subject to enterprise income tax at a rate of 20%. Subsidiaries Gujing Hotel, Junlou Culture, Yellow Crane
Tower Beverage, Xinjia Testing and Yashibo shall observe the relevant provisions of the preferential income tax
policy for small micro-profit enterprises.
5. Notes to Major Items in the Consolidated Financial Statements of the Company
5.1 Monetary Assets
Item Ending balance Beginning balance
Cash on hand 175,509.59 178,127.77
Cash in bank 12,139,953,541.32 5,936,406,199.84

Interim Report 2021
~ 132 ~
Item Ending balance Beginning balance
Other monetary assets 4,175,438.94 34,628,242.05
Total 12,144,304,489.85 5,971,212,569.66
At 30 June 2021, the structural deposits that cannot be withdrawn in advance amounted to RMB2,498.00 million,
and security deposit that cannot be withdrawn in advance in other monetary funds amounted to RMB3.9154
million. Except for that, no other monetary funds are restricted to use or in some potential risks of recovery due to
the mortgage, pledge or freezing.
Liquor manufacturing enterprises shall disclose whether there exists special interest arrangements such as establishing a joint fund
account with related parties
□ Applicable √ Not applicable
5.2 Trading Financial Assets
Item Ending balance Beginning balance
Financial assets at fair value through profit or
loss
209,115,157.91 203,877,915.51
Including: bank financial products -
Fund investment 209,115,157.91 203,877,915.51
Total 209,115,157.91 203,877,915.51
The ending balance as of 30 June 2021 has increased RMB5,237,200 compared with that as of 1 January 2021,
mainly due to the increase in the market value of the Company's fund investments.
5.3 Accounts Receivable
(1) Disclosure by aging
Aging Ending balance Beginning balance
Within one year 65,490,049.59 64,157,166.51
Of which:1-6 months 53,061,182.15 61,367,773.81
7-12 months 12,428,867.44 2,789,392.70
1-2 years 876,218.55 4,953,687.55
2-3 years 445,069.62 142,796.00
Over 3 years 980,982.55 -
Subtotal 67,792,320.31 69,253,650.06
Less: Bad debt provision 2,443,194.41 1,319,914.15

Interim Report 2021
~ 133 ~
Aging Ending balance Beginning balance
Total 65,349,125.90 67,933,735.91
(2) Disclosure by withdrawal method of bad debt provision
①Ending balance
Category
Ending balance
Carrying amount Bad debt provision
Carrying value Amount Proportion (%) Amount
Withdrawal
proportion (%)
Bad debt provision withdrawn
separately
Bad debt provision withdrawn by
group 67,792,320.31 100.00 2,443,194.41 3.60
65,349,125.90
Of which: Group 1
Group 2 67,792,320.31 100.00 2,443,194.41 3.60 65,349,125.90
Total 67,792,320.31 100.00 2,443,194.41 3.60 65,349,125.90
②Beginning balance
Category
Beginning balance
Carrying amount Bad debt provision
Carrying value Amount Proportion (%) Amount
Withdrawal
proportion (%)
Bad debt provision withdrawn
separately - - - - -
Bad debt provision withdrawn by
group 69,253,650.06 100.00 1,319,914.15 1.91 67,933,735.91
Of which: Group 1 - - - - -
Group 2 69,253,650.06 100.00 1,319,914.15 1.91 67,933,735.91
Total 69,253,650.06 100.00 1,319,914.15 1.91 67,933,735.91
On 30 June 2021, Accounts receivable with bad debt provision withdrawn by group 2
Aging
Ending balance
Carrying amount Bad debt provision Withdrawal proportion
(%)
Within one year 65,490,049.59 1,152,055.19 1.76
Of which:1-6 months 53,061,182.15 530,611.82 1.00

Interim Report 2021
~ 134 ~
Aging
Ending balance
Carrying amount Bad debt provision Withdrawal proportion
(%)
7-12 months 12,428,867.44 621,443.37 5.00
1-2 years 876,218.55 87,621.86 10.00
2-3 years 445,069.62 222,534.81 50.00
Over 3 years 980,982.55 980,982.55 100.00
Total 67,792,320.31 2,443,194.41 3.60
On 31 December 2020, Accounts receivable with bad debt provision withdrawn by group 2
Aging
Beginning balance
Carrying amount Bad debt provision Withdrawal proportion
(%)
Within one year 64,157,166.51 753,147.38 1.17
Of which:1-6 months 61,367,773.81 613,677.74 1.00
7-12 months 2,789,392.70 139,469.64 5.00
1-2 years 4,953,687.55 495,368.77 10.00
2-3 years 142,796.00 71,398.00 50.00
Over 3 years - - -
Total 69,253,650.06 1,319,914.15 1.91
(3) Changes of bad debt provision during the Reporting Period
Category Beginning
amount
Changes in the Reporting Period
Ending balance Business
combination Withdrawal
Recovery or
reversal Write-off
Accounts receivable with
insignificant amount but bad
debt provision withdrawn
separately
- - - - - -
Group 2: Bad debt provision
withdrawn by aging group 1,319,914.15 1,166,733.53 43,453.27 2,443,194.41
Total 1,319,914.15 1,166,733.53 43,453.27 2,443,194.41
(4) Top five ending balances by entity
Entity name Ending balance Proportion to total ending balance
of accounts receivable (%)
Ending balance of
bad debt provision

Interim Report 2021
~ 135 ~
Entity name Ending balance Proportion to total ending balance
of accounts receivable (%)
Ending balance of
bad debt provision
No. 1 11,747,565.00 17.33 117,475.65
No. 2 10,243,957.73 15.11 493,138.43
No. 3 4,766,144.95 7.03 47,661.45
No. 4 2,784,090.69 4.11 27,840.91
No. 5 2,498,381.20 3.69 24,983.81
Total 32,040,139.57 47.27 711,100.25
(5) The ending balance has decreased by 3.80% compared to the beginning balance, mainly due to the decline of
accounts receivable of the subsidiary Gujing Yunshang.
5.4 Accounts Receivable Financing
Category
Ending balance Beginning balance
Carrying amount Bad debt
provision Carrying value Carrying amount
Bad debt
provision Carrying value
Bank acceptance
bills
2,003,302,090.64 2,003,302,090.64 1,673,510,794.51 - 1,673,510,794.51
Commercial
acceptance bills
- - -
Total 2,003,302,090.64 2,003,302,090.64 1,673,510,794.51 - 1,673,510,794.51
(1) The Company's pledged notes receivable as of 31 December 2021
Items Pledged amount
Bank acceptance bills 24,300,000.00
Total 24,300,000.00
(2) The Company’s notes receivable discounted or endorsed to third parties but not yet matured as of 31
December 2021
Items Amount of derecognition Amount of recognition
Bank acceptance bills 1,348,049,640.36 -
Total 1,348,049,640.36 -
The issuing bank of the bank acceptance bill of the Company for endorsement or discount are commercial banks
with higher credit. Therefore, when the bank acceptance bills are mature, they are likely to get paid. The interest
rate risk related to the bill has been transferred to the bank, so it can be judged that the main risks and rewards of

Interim Report 2021
~ 136 ~
the bill ownership have been transferred, so need to be derecogised.
(3) The company has no notes receivable transferred to accounts receivable due to drawers’ inability of fulfillment
at 31 December 2021
(4) Notes receivable by bad debt provision method
Category
Ending balance
Carrying amount Bad debt provision
Carrying value Amount Proportion (%) Amount
Withdrawal
proportion (%)
Bad debt provision
withdrawn separately - - - - -
Bad debt provision
withdrawn by group 2,003,302,090.64 100.00 2,003,302,090.64
Of which: Group 1
Group 2 2,003,302,090.64 100.00 2,003,302,090.64
Total 2,003,302,090.64 100.00 2,003,302,090.64
①On 30 June 2021, notes receivable with provision for bad debt recognised by group 1
None.
②Notes receivable with provision for bad debt recognised by group 2
On 30 June 2021, the Company measured provision for bad debt of bank acceptance bill according to the lifetime
expected credit loss. The Company believes that no significant credit risk exists in the bank acceptance bills and
no significant losses arise from default risk of banks or other issuer’ failure of fulfillment.
(5) Changes of bad debt provision during the Reporting Period
None.
5.5 Prepayment
(1) Disclosure by aging
Aging Ending balance Beginning balance
Amount Proportion (%) Amount Proportion (%)
Within one year 112,456,597.78 99.19 50,894,162.75 99.02
1 to 2 years 912,996.56 0.80 505,645.36 0.98
2 to 3 years 6,000.00 0.01 - -
Over 3 years - - - -

Interim Report 2021
~ 137 ~
Aging Ending balance Beginning balance
Amount Proportion (%) Amount Proportion (%)
Total 113,375,594.34 100.00 51,399,808.11 100.00
(2) Top five ending balances by entity
Entity name Ending balance Proportion of the balance to the
total prepayment (%)
No. 1 24,114,779.80 21.27
No. 2 8,655,660.98 7.63
No. 3 5,336,595.80 4.71
No. 4 4,342,303.58 3.83
No. 5 3,700,289.11 3.26
Total 46,149,629.27 40.70
5.6 Other Receivables
(1) Listed by category
Item Ending balance Beginning balance
Interest receivable - -
Dividends receivable - -
Other receivables 86,173,732.22 33,451,121.48
Total 86,173,732.22 33,451,121.48
(2) Other Receivables
①Disclosure by aging
Aging Ending balance Beginning balance
Within one year 83,426,906.55 31,014,800.18
Of which:1-6 months 76,350,461.06 29,186,461.60
7-12 months 7,076,445.49 1,828,338.58
1-2 years 3,406,781.00 2,842,287.06
2-3 years 1,596,075.56 523,089.00
Over 3 years 43,189,137.94 42,535,188.41
Subtotal 131,618,901.05 76,915,364.65
Less: Bad debt provision 45,445,168.83 43,464,243.17

Interim Report 2021
~ 138 ~
Aging Ending balance Beginning balance
Total 86,173,732.22 33,451,121.48
②Disclosure by nature
Nature Ending balance Beginning balance
Investment in securities 38,857,584.88 40,807,394.41
Deposit and guarantee 47,596,554.26 5,266,477.91
Borrowing for business trip expenses 300,260.03 795,646.51
Rent, utilities and gasoline charges 8,820,226.93 8,962,876.17
Other 36,044,274.95 21,082,969.65
Subtotal 131,618,901.05 76,915,364.65
Less: Bad debt provision 45,445,168.83 43,464,243.17
Total 86,173,732.22 33,451,121.48
③Disclosure by withdrawal method of bad debt provision
A. As of 30 June 2021, bad debt provision withdrawn based on three stages model:
Stage Carrying amount Bad debt provision Carrying value
Stage 1 92,761,316.17 6,587,583.95 86,173,732.22
Stage 2
Stage 3 38,857,584.88 38,857,584.88 -
Total 131,618,901.05 45,445,168.83 86,173,732.22
A1. As of 30 June 2021, bad debt provision at stage 1:
Category Carrying amount
12-month expected
credit losses rate
(%)
Bad debt provision Carrying value
Bad debt provision withdrawn separately
Bad debt provision withdrawn by group 92,761,316.17 7.10 6,587,583.95 86,173,732.22
Of which: Group 1
Group 2 92,761,316.17 7.10 6,587,583.95 86,173,732.22
Total 92,761,316.17 7.10 6,587,583.95 86,173,732.22
On 30 June 2021, other receivables with bad debt provision withdrawn by group 2
Aging Ending balance

Interim Report 2021
~ 139 ~
Carrying amount Bad debt provision Withdrawal proportion
(%)
Within one year 83,426,906.55 1,117,315.00 1.34
Of which:1-6 months 76,350,461.06 763,492.73 1.00
7-12 months 7,076,445.49 353,822.27 5.00
1-2 years 3,406,781.00 340,678.10 10.00
2-3 years 1,596,075.56 798,037.79 50.00
Over 3 years 4,331,553.06 4,331,553.06 100.00
Total 92,761,316.17 6,587,583.95 7.10
A2. As of 30 June 2021, bad debt provision at stage 3:
Category Carrying amount
12-month expected
credit losses rate
(%)
Bad debt provision Carrying value
Bad debt provision withdrawn separately 38,857,584.88 100.00 38,857,584.88 -
Bad debt provision withdrawn by group -
Of which: Group 1 -
Group 2 -
Total 38,857,584.88 100.00 38,857,584.88 -
On 30 June 2021, other receivables with bad debt provision withdrawn separately:
Name
Ending balance
Carrying amount Bad debt provision Withdrawal
proportion (%) Withdrawal reason
Hengxin Securities Co., Ltd.
28,966,894.41 28,966,894.41 100.00
The enterprise enters the
bankruptcy liquidation
procedure
Jianqiao Securities Co., Ltd.
9,890,690.47 9,890,690.47
100.00 The enterprise enters the
bankruptcy liquidation
procedure
Total 38,857,584.88 38,857,584.88 100.00 --
B. As of 31 December 2020, bad debt provision withdrawn based on three stages model:
Stage Carrying amount Bad debt provision Carrying value
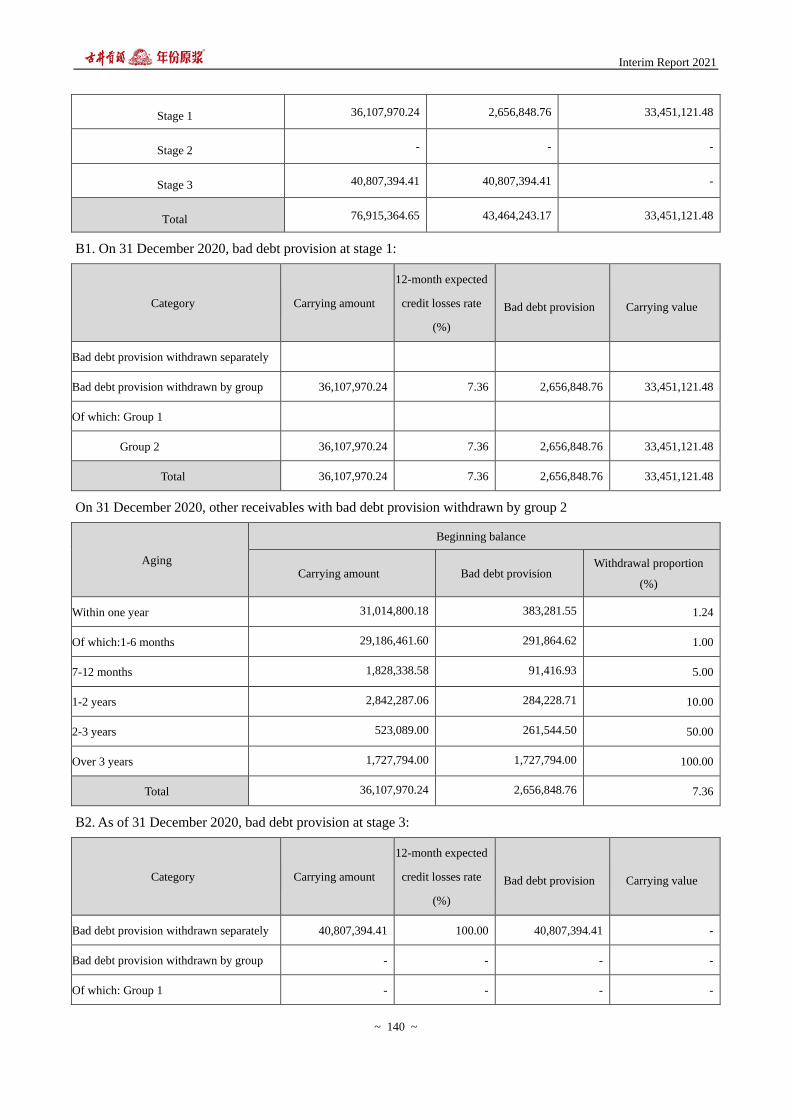
Interim Report 2021
~ 140 ~
Stage 1 36,107,970.24 2,656,848.76 33,451,121.48
Stage 2 - - -
Stage 3 40,807,394.41 40,807,394.41 -
Total 76,915,364.65 43,464,243.17 33,451,121.48
B1. On 31 December 2020, bad debt provision at stage 1:
Category Carrying amount
12-month expected
credit losses rate
(%)
Bad debt provision Carrying value
Bad debt provision withdrawn separately
Bad debt provision withdrawn by group 36,107,970.24 7.36 2,656,848.76 33,451,121.48
Of which: Group 1
Group 2 36,107,970.24 7.36 2,656,848.76 33,451,121.48
Total 36,107,970.24 7.36 2,656,848.76 33,451,121.48
On 31 December 2020, other receivables with bad debt provision withdrawn by group 2
Aging
Beginning balance
Carrying amount Bad debt provision Withdrawal proportion
(%)
Within one year 31,014,800.18 383,281.55 1.24
Of which:1-6 months 29,186,461.60 291,864.62 1.00
7-12 months 1,828,338.58 91,416.93 5.00
1-2 years 2,842,287.06 284,228.71 10.00
2-3 years 523,089.00 261,544.50 50.00
Over 3 years 1,727,794.00 1,727,794.00 100.00
Total 36,107,970.24 2,656,848.76 7.36
B2. As of 31 December 2020, bad debt provision at stage 3:
Category Carrying amount
12-month expected
credit losses rate
(%)
Bad debt provision Carrying value
Bad debt provision withdrawn separately 40,807,394.41 100.00 40,807,394.41 -
Bad debt provision withdrawn by group - - - -
Of which: Group 1 - - - -

Interim Report 2021
~ 141 ~
Category Carrying amount
12-month expected
credit losses rate
(%)
Bad debt provision Carrying value
Group 2 - - - -
Total 40,807,394.41 100.00 40,807,394.41 -
On 31 December 2020, other receivables with bad debt provision withdrawn separately:
Name
Beginning balance
Carrying amount Bad debt provision Withdrawal
proportion (%) Withdrawal reason
Hengxin Securities Co., Ltd.
28,966,894.41 28,966,894.41 100.00
The enterprise enters the
bankruptcy liquidation
procedure
Jianqiao Securities Co., Ltd.
11,840,500.00 11,840,500.00 100.00
The enterprise enters the
bankruptcy liquidation
procedure
Total 40,807,394.41 40,807,394.41 100.00 --
④Changes of bad debt provision during the Reporting Period
Category Beginning balance
Changes in the Reporting Period
Ending balance
Withdrawal Recovery or
reversal Write-off
Bad debt provision
withdrawn separately 40,807,394.41 - 1,949,809.53 38,857,584.88
Bad debt provision
withdrawn by group 2,656,848.76 3,930,735.19 6,587,583.95
Total 43,464,243.17 3,930,735.19 1,949,809.53 45,445,168.83
⑤Top five ending balances by entity
Entity name Nature Ending balance Aging
Proportion of the
balance to the total
other receivables
(%)
Bad debt provision
No. 1 Deposit 42,020,000.00 Within 6
months
31.93 420,200.00
No. 2 Securities
investment
28,966,894.41
Over 3 years
22.01 28,966,894.41

Interim Report 2021
~ 142 ~
Entity name Nature Ending balance Aging
Proportion of the
balance to the total
other receivables
(%)
Bad debt provision
No. 3 Securities
investment
9,890,690.47
Over 3 years
7.51 9,890,690.47
No. 4 Other 6,534,593.50
Within 6
months
4.96 65,345.94
No. 5 Other 6,147,036.14
Within 6
months
4.67 61,470.36
Total -- 93,559,214.52 71.08 39,404,601.18
(1) The ending balance of other receivables has increased by 157.61% compared to the beginning balance, which
was mainly due to the increase in prepaid land deposit for smart part.
5.7 Inventories
(1) Category of inventories
Item Ending balance
Carrying amount Falling price reserves Carrying value
Raw materials and package
materials
154,374,930.07 18,882,888.72 135,492,041.35
Semi-finished goods and work
in process
3,310,434,002.43 - 3,310,434,002.43
Finished goods 534,600,583.37 10,594,276.72 524,006,306.65
Total 3,999,409,515.87 29,477,165.44 3,969,932,350.43
(Continued)
Item Beginning balance
Carrying amount Falling price reserves Carrying value
Raw materials and package
materials
191,873,650.49 13,274,081.73 178,599,568.76
Semi-finished goods and work
in process
2,861,343,683.53 - 2,861,343,683.53
Finished goods 387,506,042.80 10,568,486.13 376,937,556.67
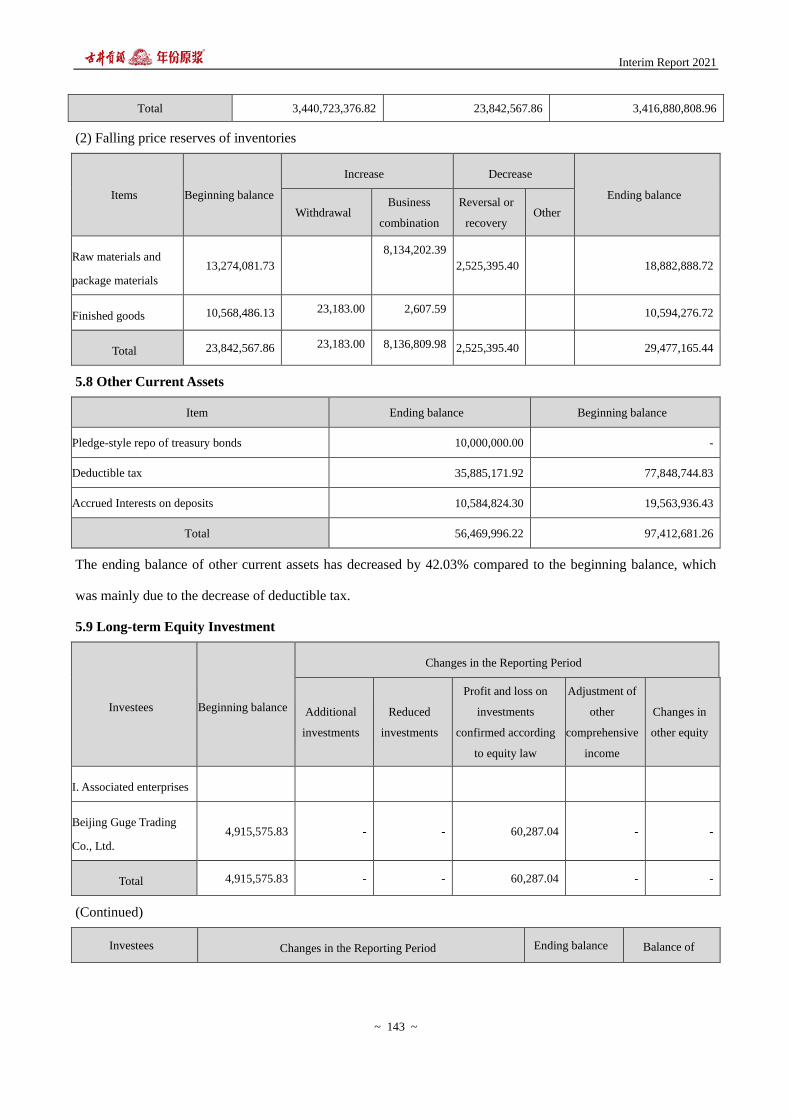
Interim Report 2021
~ 143 ~
Total 3,440,723,376.82 23,842,567.86 3,416,880,808.96
(2) Falling price reserves of inventories
Items Beginning balance
Increase Decrease
Ending balance
Withdrawal Business
combination
Reversal or
recovery Other
Raw materials and
package materials
13,274,081.73
8,134,202.39
2,525,395.40 18,882,888.72
Finished goods 10,568,486.13 23,183.00 2,607.59 10,594,276.72
Total 23,842,567.86 23,183.00 8,136,809.98 2,525,395.40 29,477,165.44
5.8 Other Current Assets
Item Ending balance Beginning balance
Pledge-style repo of treasury bonds 10,000,000.00 -
Deductible tax 35,885,171.92 77,848,744.83
Accrued Interests on deposits 10,584,824.30 19,563,936.43
Total 56,469,996.22 97,412,681.26
The ending balance of other current assets has decreased by 42.03% compared to the beginning balance, which
was mainly due to the decrease of deductible tax.
5.9 Long-term Equity Investment
Investees Beginning balance
Changes in the Reporting Period
Additional
investments
Reduced
investments
Profit and loss on
investments
confirmed according
to equity law
Adjustment of
other
comprehensive
income
Changes in
other equity
I. Associated enterprises
Beijing Guge Trading
Co., Ltd.
4,915,575.83 - - 60,287.04 - -
Total 4,915,575.83 - - 60,287.04 - -
(Continued)
Investees Changes in the Reporting Period Ending balance Balance of

Interim Report 2021
~ 144 ~
Declaration of cash
dividends or
distribution of profit
Withdrawal of
impairment
provision
Other
impairment
provision
I. Associated enterprises
Beijing Guge Trading
Co., Ltd.
- - - 4,975,862.87 -
Total - - - 4,975,862.87 -
5.10 Other Equity Instrument Investment
Item Ending balance Beginning balance
Anhui Mingguang Rural Commercial Bank Co.,
Ltd. 54,910,856.74 -
Total 54,910,856.74 -
Disclosure of non-trading equity instrument investment by items
Unit: RMB
Item Dividend income
recognized
Accumulative
gains
Accumulative
losses
Amount of other
comprehensive
income
transferred to
retained earnings
Reason for
assigning to
measure in fair
value and the
changes included
in other
comprehensive
income
Reason for other
comprehensive
income
transferred to
retained earnings
Anhui
Mingguang Rural
Commercial
Bank Co., Ltd.
809,860.62 809,860.62
Assigned to
measure in fair
value and the
changes included
in other
comprehensive
income according
to the holding
purpose of the
management
5.11 Investment Property
(1) Investment property adopting cost measurement mode
Items Building and plants Land use rights Total
I. Original carrying value

Interim Report 2021
~ 145 ~
Items Building and plants Land use rights Total
1. Beginning balance 8,680,555.75 2,644,592.00 11,325,147.75
2. Increase during the Reporting Period - - -
3. Decrease during the Reporting Period - - -
4. Ending balance 8,680,555.75 2,644,592.00 11,325,147.75
II. Accumulated depreciation and amortization:
1. Beginning balance 6,176,477.79 755,726.42 6,932,204.21
2. Increase during the Reporting Period 130,557.96 28,013.28 158,571.24
(1) Withdrawal or amortization 130,557.96 28,013.28 158,571.24
3. Decrease during the Reporting Period
4. Ending balance 6,307,035.75 783,739.70 7,090,775.45
III. Impairment provision
1. Beginning balance - - -
2. Increase during the Reporting Period - - -
3. Decrease during the Reporting Period - - -
4. Ending balance - - -
IV. Carrying value
1. Ending carrying value 2,373,520.00 1,860,852.30 4,234,372.30
2. Beginning carrying value 2,504,077.96 1,888,865.58 4,392,943.54
5.12 Fixed Assets
(1) Listed by category
Item Ending balance Beginning balance
Fixed assets 1,829,551,984.09 1,797,789,271.62
Disposal of fixed assets -
Total 1,829,551,984.09 1,797,789,271.62
(2) Fixed assets
①General information of fixed assets
Items Buildings and
constructions
Machinery
equipments Vehicles
Office equipment
and other Total
I. Original carrying value
1. Beginning balance 2,110,023,036.54 1,137,831,234.61 63,055,889.31 202,211,609.80 3,513,121,770.26
2. Increase during the
Reporting Period
106,966,334.19 67,167,821.39 10,037,666.02 40,438,838.52 224,610,660.12

Interim Report 2021
~ 146 ~
Items Buildings and
constructions
Machinery
equipments Vehicles
Office equipment
and other Total
(1) Acquisition 395,492.59 12,587,735.69 1,687,942.42 7,692,169.96 22,363,340.66
(2) Transfer from
construction in progress 0.00 7,829,813.95 0.00 7,611,275.72 15,441,089.67
(3) Enterprise
combination increase 106,180,428.27 41,102,879.77 8,269,210.78 7,457,866.91 163,010,385.73
(4) Other increase 390,413.33 5,647,391.98 80,512.82 17,677,525.93 23,795,844.06
3. Decrease during the
Reporting Period
49,046,254.38 24,000,847.17 2,070,578.87 7,298,861.18 82,416,541.60
(1) Disposal or scrap 37,622,502.94 12,586,744.17 2,070,578.87 1,200,943.05 53,480,769.03
(2) Other decrease 11,423,751.44 11,414,103.00 0.00 6,097,918.13 28,935,772.57
4. Ending balance 2,167,943,116.35 1,180,998,208.83 71,022,976.46 235,351,587.14 3,655,315,888.78
II. Accumulated
depreciation
1. Beginning balance 887,885,451.17 652,893,081.63 54,246,302.02 115,239,124.54 1,710,263,959.36
2. Increase during the
Reporting Period
58,432,549.95 74,926,291.05 9,315,451.02 35,157,392.56 177,831,684.58
(1) Withdrawal 40,853,347.04 54,410,088.52 2,991,694.26 17,872,169.15 116,127,298.97
(2) Enterprise
combination increase 17,200,513.98 15,123,646.39 6,249,135.23 4,805,171.31 43,378,466.91
(3) Other increase 378,688.93 5,392,556.14 74,621.53 12,480,052.10 18,325,918.70
3. Decrease during the
Reporting Period
39,415,962.42 18,989,073.56 1,766,170.03 6,954,931.84 67,126,137.85
(1) Disposal or scrap 35,345,372.01 10,573,387.77 1,766,170.03 1,115,289.34 48,800,219.15
(2) Other decrease 4,070,590.41 8,415,685.79 0.00 5,839,642.50 18,325,918.70
4. Ending balance 906,902,038.70 708,830,299.12 61,795,583.01 143,441,585.26 1,820,969,506.09
III. Impairment provision
1. Beginning balance 2,804,324.86 1,674,420.09 7,047.07 582,747.26 5,068,539.28
2. Increase during the
Reporting Period 0.00 0.00 0.00 0.00 0.00
(1) Withdrawal 0.00 0.00 0.00 0.00 0.00
3. Decrease during the
Reporting Period 0.00 232,441.13 7,047.07 34,652.48 274,140.68
(1) Disposal or scrap 0.00 232,441.13 7,047.07 34,652.48 274,140.68
4. Ending balance 2,804,324.86 1,441,978.96 0.00 548,094.78 4,794,398.60

Interim Report 2021
~ 147 ~
Items Buildings and
constructions
Machinery
equipments Vehicles
Office equipment
and other Total
IV. Carrying value
1. Ending carrying value 1,258,236,752.79 470,725,930.75 9,227,393.45 91,361,907.10 1,829,551,984.09
2. Beginning carrying
value 1,219,333,260.51 483,263,732.89 8,802,540.22 86,389,738.00 1,797,789,271.62
②Idle fixed assets
Item Original carrying
value
Accumulated
depreciation Impairment provision Carrying value Note
Buildings and
constructions 8,137,031.10 5,246,394.21 2,804,324.86 86,312.03
Machinery equipments 9,269,447.36 7,694,093.44 1,441,978.96 133,374.96
Vehicles 0.00 0.00 0.00 0.00
Office equipment and
others 791,758.54 216,525.51 548,094.78 27,138.25
Total 18,198,237.00 13,157,013.16 4,794,398.60 246,825.24
③Fixed assets without certificate of title
Items Carrying value Reason
Buildings and constructions 649,916,416.61 In process
Total 649,916,416.61 --
④There are no fixed assets with limited on use such as mortgage at the end of the reporting period.
5.13 Construction in Progress
(1) Listed by category
Item Ending balance Beginning balance
Construction in progress 425,876,594.64 279,169,201.60
Engineering materials -
Total 425,876,594.64 279,169,201.60
(2) Construction in progress
①General information of construction in progress
Item
Ending balance Beginning balance
Carrying amount Depreciation
reserve Carrying value Carrying amount
Depreciation
reserve Carrying value

Interim Report 2021
~ 148 ~
Suizhou new plant project 211,480,987.42 - 211,480,987.42 135,930,812.66 - 135,930,812.66
Smart park project 98,042,609.99 - 98,042,609.99 54,494,827.90 - 54,494,827.90
Brewing automatization
technological
improvement
project
66,427,530.42 - 66,427,530.42 42,832,649.99
-
42,832,649.99
Liquid filling
line renovation
project
14,835,486.72 - 14,835,486.72 14,835,486.72
-
14,835,486.72
Gujing plant
area 11#
liquor warehouse
19,382,788.21 - 19,382,788.21 11,166,144.14
-
11,166,144.14
Experience
center project 2,219,508.43 - 2,219,508.43 8,064,287.27
- 8,064,287.27
Gujing academy project 6,441,931.82 - 6,441,931.82 5,538,005.31 - 5,538,005.31
Other individual project 7,045,751.63 - 7,045,751.63 6,306,987.61 - 6,306,987.61
Total 425,876,594.64 - 425,876,594.64 279,169,201.60 - 279,169,201.60
②Changes in significant projects of construction in progress
Project Budget
(RMB’0,000) Beginning balance
Increase during
the Reporting
Period
Amount transferred
to fixed asset
Decrease
during the
Reporting
Period
Ending balance
Suizhou new plant project 60,000.00 135,930,812.66 75,550,174.76 0.00 0.00 211,480,987.42
Smart park project 828,965.74 54,494,827.90 44,923,928.88 1,376,146.79 0.00 98,042,609.99
Brewing automatization
technological
improvement
project
27,430.00 42,832,649.99 31,294,651.73 7,699,771.30 0.00 66,427,530.42
Liquid filling
line renovation
project
4,000.00 14,835,486.72 0.00 0.00 0.00 14,835,486.72
Gujing plant
area 11#
liquor warehouse
9,000.00 11,166,144.14 8,216,644.07 0.00 0.00 19,382,788.21
Experience
center project 2,950.00 8,064,287.27 7,123,208.78 0.00 12,967,987.62 2,219,508.43

Interim Report 2021
~ 149 ~
Gujing academy project 49,900.00 5,538,005.31 903,926.51 0.00 0.00 6,441,931.82
Other individual project 2,994.65 6,306,987.61 8,214,735.67 6,365,171.58 1,110,800.07 7,045,751.63
Total 985,240.39 279,169,201.60 176,227,270.40 15,441,089.67 14,078,787.69 425,876,594.64
(Continued)
Project
Proportion of
project input to
budgets (%)
Schedule (%)
Cumulative
amount of
interest
capitalization
Of which: Interest
capitalized during
the reporting
period
Interest
capitalization
during the
Reporting
Period (%)
Source of funds
Suizhou new plant project 35.25 35.25 833,750.01 833,750.01 3.45-
Self-owned
fund and
borrowings
Smart park project 1.20 5.00 - - -
Self-owned
fund and raised
fund
Brewing automatization
technological
improvement
project
82.27 97.00 - - - Self-owned
fund
Liquid filling
line renovation
project
38.83 95.00 - - - Self-owned
fund
Gujing plant
area 11#
liquor warehouse
21.54 97.00 - - - Self-owned
fund
Experience
center project 66.96 91.00 - - -
Self-owned
fund
Gujing academy project 1.29 2.00 - - - Self-owned
fund
Other individual project 88.00 88.00 - - - Self-owned
fund
Total -- -- -- -- -- --
(3) The carrying amount of construction in progress on 30 June 2021 has increased by 52.55% compared to that
on 1 January 2021, which was mainly due to the increasing investment in Suizhou new plant project, Smart park
project and brewing automatization technological improvement project.
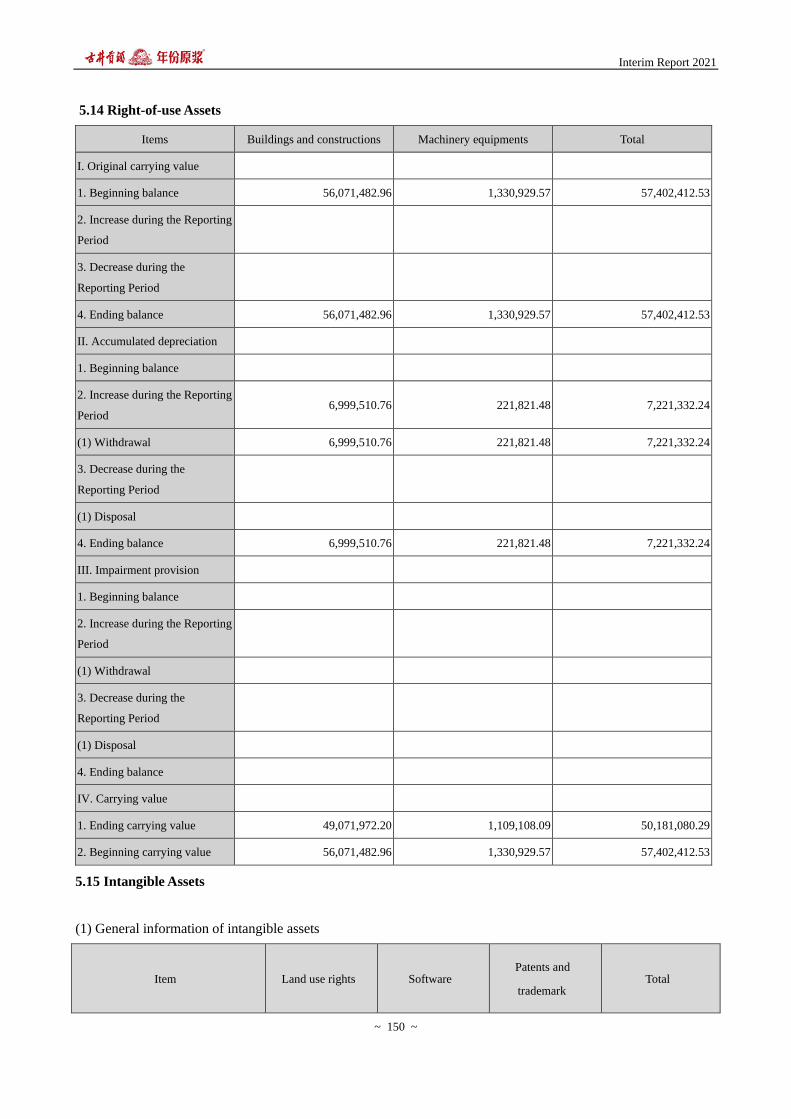
Interim Report 2021
~ 150 ~
5.14 Right-of-use Assets
Items Buildings and constructions Machinery equipments Total
I. Original carrying value
1. Beginning balance 56,071,482.96 1,330,929.57 57,402,412.53
2. Increase during the Reporting
Period
3. Decrease during the
Reporting Period
4. Ending balance 56,071,482.96 1,330,929.57 57,402,412.53
II. Accumulated depreciation
1. Beginning balance
2. Increase during the Reporting
Period 6,999,510.76 221,821.48 7,221,332.24
(1) Withdrawal 6,999,510.76 221,821.48 7,221,332.24
3. Decrease during the
Reporting Period
(1) Disposal
4. Ending balance 6,999,510.76 221,821.48 7,221,332.24
III. Impairment provision
1. Beginning balance
2. Increase during the Reporting
Period
(1) Withdrawal
3. Decrease during the
Reporting Period
(1) Disposal
4. Ending balance
IV. Carrying value
1. Ending carrying value 49,071,972.20 1,109,108.09 50,181,080.29
2. Beginning carrying value 56,071,482.96 1,330,929.57 57,402,412.53
5.15 Intangible Assets
(1) General information of intangible assets
Item Land use rights Software Patents and
trademark Total

Interim Report 2021
~ 151 ~
Item Land use rights Software Patents and
trademark Total
I. Original carrying value
1. Beginning balance 846,743,730.35 125,206,832.57 215,006,066.19 1,186,956,629.11
2. Increase during the Reporting
Period
98,580,103.19 2,468,867.94 38,039,080.00 139,088,051.13
(1) Acquisition 53,623,208.85 2,468,867.94 - 56,092,076.79
(2) Transfer from construction in
progress
(3) Enterprise combination increase 44,956,894.34 - 38,039,080.00 82,995,974.34
3. Decrease during the Reporting
Period
2,640,707.04 - 2,640,707.04
(1) Disposal - - -
(2) Other decrease 2,640,707.04 - 2,640,707.04
4. Ending balance 945,323,833.54 125,034,993.47 253,045,146.19 1,323,403,973.20
II. Accumulated amortization:
1. Beginning balance 158,016,689.40 48,008,475.16 46,219,486.76 252,244,651.32
2. Increase during the Reporting
Period
13,291,667.01 11,529,765.44 23,320,984.35 48,142,416.80
(1) Withdrawal 9,959,352.12 11,529,765.44 31,904.35 21,521,021.91
(2) Enterprise combination increase 3,332,314.89 - 23,289,080.00 26,621,394.89
3. Decrease during the Reporting
Period
- -
(1) Disposal
4. Ending balance 171,308,356.41 59,538,240.60 69,540,471.11 300,387,068.12
III. Impairment provision
1. Beginning balance - - - -
2. Increase during the Reporting
Period - - - -
3. Decrease during the Reporting
Period - - - -
4. Ending balance - - - -
IV. Carrying value
1. Ending carrying value 774,015,477.13 65,496,752.87 183,504,675.08 1,023,016,905.08
2. Beginning carrying value 688,727,040.95 77,198,357.41 168,786,579.43 934,711,977.79

Interim Report 2021
~ 152 ~
(2) No Intangible Assets used for mortgage or guarantee at 30 June 2021
(3) No Land use rights without certificate of title at 30 June 2021
5.16 Goodwill
(1) Original carrying value of goodwill
Investees or matters that
goodwill arising from Beginning balance
Increase Decrease
Ending balance Formed by
business
combination
Other Disposal Other
Yellow Crane Tower Distillery
Co., Ltd. 478,283,495.29 - - - - 478,283,495.29
Anhui Mingguang Distillery Co.,
Ltd. 60,686,182.07 60,686,182.07
Total 478,283,495.29 60,686,182.07 - - - 538,969,677.36
5.17 Long-term Deferred Expenses
Item Beginning
balance Increase
Decrease Ending balance
Amortization Other decrease
Experience center 25,368,080.45 12,967,987.62 5,672,214.27 317,922.04 32,345,931.76
Sewage treatment project 2,844,754.10 461,311.48 - 2,383,442.62
Yellow Crane Tower chateau and
museum 7,937,278.72
1,709,659.36 - 6,227,619.36
Gujing party building cultural
center 3,545,454.55
590,909.09 - 2,954,545.46
Yantai wine museum project 937,109.64 244,463.38 - 692,646.26
Other individual project with
insignificant amounts 23,959,256.19 4,163,190.98
6,945,396.06 - 21,177,051.11
Total 64,591,933.65 17,131,178.60 15,623,953.64 317,922.04 65,781,236.57
5.18 Deferred Tax Assets and Deferred Tax Liabilities
(1) Deferred tax assets before offsetting
Item
Ending balance Beginning balance
Deductible temporary
differences Deferred tax assets
Deductible temporary
differences Deferred tax assets
Asset impairment provision 34,271,564.04 8,567,891.01 28,911,107.14 7,211,407.41
Credit impairment provision 47,888,363.24 11,972,177.58 44,784,157.32 11,179,541.79

Interim Report 2021
~ 153 ~
Item
Ending balance Beginning balance
Deductible temporary
differences Deferred tax assets
Deductible temporary
differences Deferred tax assets
Unrealized intergroup profit 38,407,786.77 9,601,946.69 31,616,173.72 7,904,043.43
Deferred income 95,344,263.32 23,836,065.83 75,111,997.53 18,270,618.94
Deductible losses 23,924,111.57 5,981,027.89 43,272,801.87 10,777,899.23
Carry-over of payroll
payables deductible during
the next period
21,874,338.70 5,468,584.68
Accrued expenses 267,449,330.17 66,862,332.54 144,731,955.22 36,160,326.47
Total 507,285,419.11 126,821,441.54 390,302,531.50 96,972,421.95
(2) Deferred tax liabilities before offsetting
Item
Ending balance Beginning balance
Taxable temporary
differences Deferred tax liabilities
Taxable temporary
differences Deferred tax liabilities
Difference in accelerated
depreciation of fixed
assets
64,071,828.33 16,017,957.08 73,753,668.04 18,438,417.01
Assets appreciation
arising from business
combination not under
the same control
563,136,495.64 140,784,123.91 381,654,221.40 95,413,555.35
Changes in fair value of
investments in other
equity instruments
1,062,158.94 265,539.74
Changes in fair value of
trading financial assets 9,115,157.91 2,278,789.48 3,877,915.51 969,478.88
Total 637,385,640.82 159,346,410.21 459,285,804.95 114,821,451.24
3.19 Other Non-current Assets
Item Ending balance Beginning balance
Prepayments for equipment and constructions 2,007,300.00 5,943,717.02
Total 2,007,300.00 5,943,717.02
3.20 Short-term Borrowings
Category Ending balance Beginning balance

Interim Report 2021
~ 154 ~
Category Ending balance Beginning balance
Credit borrowings 70,665,500.00
Mortgage borrowings 72,000,000.00
Accrued interest 231,000.00
Total 72,231,000.00 70,665,500.00
3.21 Notes Payable
(1) Listed by nature
Category Ending balance Beginning balance
Bank acceptance bills 17,730,000.00 140,540,000.00
Commercial acceptance bills - 74,535.60
Total 17,730,000.00 140,614,535.60
(2) At the end of the reporting period, there is no notes payable matured but not yet paid.
(2) The ending balance of notes payable has decreased by 87.39% compared with that the beginning balance,
which was mainly due to the payment for bank acceptance bills at maturity.
5.22 Accounts Payable
(1) Listed by nature
Item Ending balance Beginning balance
Payments for goods 324,028,348.71 299,936,875.62
Payments for constructions and equipment 95,487,400.59 135,720,442.04
Other 49,722,843.32 69,549,244.20
Total 469,238,592.62 505,206,561.86
(2) Significant accounts payable aging over one year
Item Ending balance Reason
No. 1 2,902,005.29 Final payment
No. 2 2,252,093.02 Final payment
No. 3 2,116,587.78 Final payment
No. 4 490,485.32 Quality guarantee deposit
No. 5 244,551.74 Payment for equipment
Total 8,005,723.15 --
5.23 Contract Liabilities
(1) General information of contract liabilities

Interim Report 2021
~ 155 ~
Item Ending balance Beginning balance
Payment for goods 2,213,592,055.02 1,206,573,886.26
Total 2,213,592,055.02 1,206,573,886.26
5.24 Employee Benefits Payable
(1) List of employee benefits payable
Item Beginning balance Increase Decrease Ending balance
I. Short-term employee benefits 496,473,581.57 1,353,623,407.43 1,488,413,900.62 361,683,088.38
II. Post-employment
benefits-defined contribution plans
1,655,533.19
62,083,389.53 63,249,314.47 489,608.25
III. Termination benefits -
IV. Other benefits due within one
year -
Total 498,129,114.76 1,415,706,796.96 1,551,663,215.09 362,172,696.63
(2) List of short-term employee benefits
Item Beginning balance Increase Decrease Ending balance
I. Salaries, bonuses, allowances and
subsidies 418,034,813.69 1,185,787,528.46 1,322,087,726.77 281,734,615.38
II. Employee benefits - 48,058,819.80 48,058,819.80 0.00
III. Social insurance 486,019.58 27,203,382.29 27,186,976.35 502,425.52
Of which: Health insurance 486,019.58 26,186,276.42 26,173,119.43 499,176.57
Injury insurance - 1,017,105.87 1,013,856.92 3,248.95
IV. Housing accumulation fund 4,342,621.32 41,362,968.43 41,031,668.65 4,673,921.10
V. Labor union funds and employee
education funds 70,812,311.30 16,128,670.23 14,960,192.03 71,980,789.50
VI. Enterprise annuity 2,797,815.68 35,082,038.22 35,088,517.02 2,791,336.88
Total 496,473,581.57 1,353,623,407.43 1,488,413,900.62 361,683,088.38
(3) Defined contribution plans
Item Beginning balance Increase Decrease Ending balance
1. Basic endowment insurance 1,655,533.19 60,103,063.02 61,303,035.87 455,560.34

Interim Report 2021
~ 156 ~
Item Beginning balance Increase Decrease Ending balance
2. Unemployment insurance - 1,980,326.51 1,946,278.60 34,047.91
Total 1,655,533.19 62,083,389.53 63,249,314.47 489,608.25
5.25 Taxes Payable
Item Ending balance Beginning balance
VAT 142,144,490.50 93,836,793.23
Consumption tax 180,631,030.63 144,069,975.35
Enterprise income tax 173,355,594.61 78,334,425.91
Individual income tax 6,960,546.44 2,966,503.37
Urban maintenance and construction tax 16,625,998.59 12,449,531.95
Stamp duty 3,381,966.09 909,983.20
Educational surcharge 16,137,203.65 11,829,108.81
Other 10,598,549.68 4,746,370.28
Total 549,835,380.19 349,142,692.10
5.26 Other Payables
(1) Listed by category
Item Ending balance Beginning balance
Interest payable - -
Dividends payable - -
Other payables 1,794,127,565.68 1,396,599,161.14
Total 1,794,127,565.68 1,396,599,161.14
(2) Other payables
①Listed by nature
Item Ending balance Beginning balance
Security deposit and guarantee 1,672,608,979.39 1,280,042,883.26
Warranty 44,076,391.82 41,210,694.26
Personal housing fund paid by company 4,673,921.10 4,342,621.32
Other 72,768,273.37 71,002,962.30
Total 1,794,127,565.68 1,396,599,161.14
②Significant other payables aging over one year
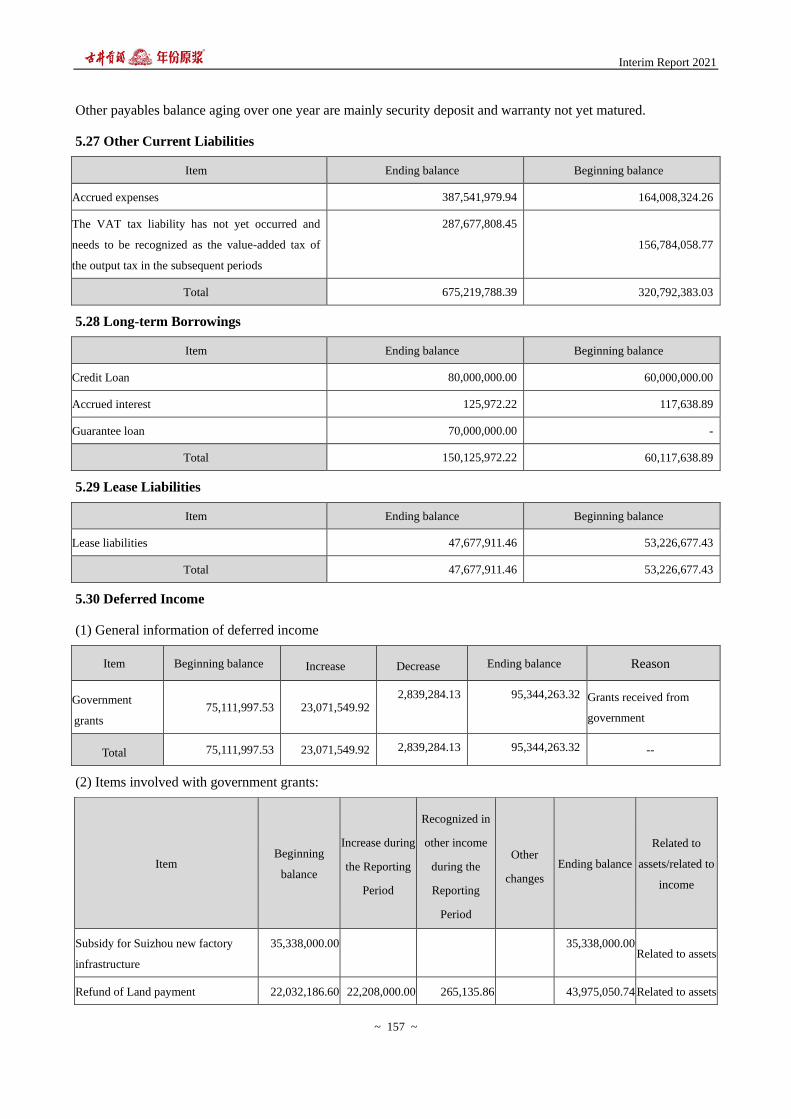
Interim Report 2021
~ 157 ~
Other payables balance aging over one year are mainly security deposit and warranty not yet matured.
5.27 Other Current Liabilities
Item Ending balance Beginning balance
Accrued expenses 387,541,979.94 164,008,324.26
The VAT tax liability has not yet occurred and
needs to be recognized as the value-added tax of
the output tax in the subsequent periods
287,677,808.45
156,784,058.77
Total 675,219,788.39 320,792,383.03
5.28 Long-term Borrowings
Item Ending balance Beginning balance
Credit Loan 80,000,000.00 60,000,000.00
Accrued interest 125,972.22 117,638.89
Guarantee loan 70,000,000.00 -
Total 150,125,972.22 60,117,638.89
5.29 Lease Liabilities
Item Ending balance Beginning balance
Lease liabilities 47,677,911.46 53,226,677.43
Total 47,677,911.46 53,226,677.43
5.30 Deferred Income
(1) General information of deferred income
Item Beginning balance Increase Decrease Ending balance Reason
Government
grants 75,111,997.53 23,071,549.92
2,839,284.13 95,344,263.32 Grants received from
government
Total 75,111,997.53 23,071,549.92 2,839,284.13 95,344,263.32 --
(2) Items involved with government grants:
Item Beginning
balance
Increase during
the Reporting
Period
Recognized in
other income
during the
Reporting
Period
Other
changes
Ending balance
Related to
assets/related to
income
Subsidy for Suizhou new factory
infrastructure
35,338,000.00 35,338,000.00 Related to assets
Refund of Land payment 22,032,186.60 22,208,000.00 265,135.86 43,975,050.74 Related to assets

Interim Report 2021
~ 158 ~
Funds for strategic emerging industry
agglomeration development base
2,375,360.02 311,359.98 2,064,000.04 Related to assets
Comprehensive subsidy fund for air
pollution prevention and control
2,379,469.47 145,928.39 2,233,541.08 Related to assets
Instrument subsidy 1,681,178.20 119,531.68 1,561,646.52 Related to assets
Subsidy funds for strong
manufacturing province and private
economy development projects in
2019
1,558,837.69 155,581.14 1,403,256.55
Related to assets
Anhui province subsidy of innovative
province construction capacity for
independent innovation
1,217,575.00 365,272.50 852,302.50
Related to assets
Funds for research projects of
koji-making Technology
1,130,000.00 - 1,130,000.00 Related to assets
Subsidy for technical transformation
of No.2 boiler
981,481.48 111,111.12 870,370.36 Related to assets
Equipment subsidy 795,911.83 144,706.83 651,205.00 Related to assets
Gujing Zhangji wine cellar
optimization and reconstruction
project
787,708.47 23,749.98 763,958.49
Related to assets
Subsidy for key technical cooperation
project on the authenticity of
important food isotopes
600,000.00 600,000.00 -
Related to assets
Subsidy for food safety improvement
project
551,724.25 68,965.50 482,758.75 Related to assets
Anhui province development of
direct funds of service industry
502,439.24 146,341.44 356,097.80 Related to assets
Specific funds for side management
of power demand
372,000.00 72,000.00 300,000.00 Related to assets
Automation of check and storage,
on-line monitoring of product quality
171,875.00 46,875.00 125,000.00 Related to assets
Motor and boiler energy-saving
technical transformation project
137,500.28 68,749.98 68,750.30 Related to assets
Wine production system technical
transformation
2,410,208.51 114,743.94 2,295,464.57 Related to assets
Intelligent solid brewing technology
innovation project
88,541.49 15,625.02 72,916.47 Related to assets
Specific funds for transformation of 232,500.00 20,000.00 212,500.00 Related to assets

Interim Report 2021
~ 159 ~
gas-fired boilers in 2017
Recognition awards for Industrial
enterprise technical transformation
investments
631,049.92 43,605.77 587,444.15
Related to assets
Total 75,111,997.53 23,071,549.92 2,839,284.13 - 95,344,263.32 ——
5.31 Share Capital
Item Beginning balance
Changes during the Reporting Period (+,-)
Ending balance New issues
Bonus
issues
Capitalization
of reserves Others Subtotal
The sum of
shares 503,600,000.00 25,000,000.00 - - - - 528,600,000.00
5.32 Capital Reserves
Item Beginning balance Increase Decrease Ending balance
Capital premium (share
premium) 1,262,552,456.05 4,929,342,074.85 - 6,191,894,530.90
Other capital reserves 32,853,136.20 - - 32,853,136.20
Total 1,295,405,592.25 4,929,342,074.85 - 6,224,747,667.10
5.33 Other Comprehensive Income
Item Beginning
balance
Reporting Period
Ending
balance
Income
before
taxation in
the Current
Period
Less:
Recorded in
other
comprehensive
income in
prior period
and transferred
to profit or
loss in the
Current
Period
Less:
Recorded in
other
comprehensive
income in
prior period
and transferred
to retained
earnings in the
Current
Period
Less:
Income tax
expense
Attributable
to owners
of the
Company
as the
parent after
tax
Attributable to
non-controlling
interests after
tax
I. Other comprehensive
income that may not
subsequently be
reclassified to profit or
loss
1,062,158.94 265,539.74 477,971.52 318,647.68 477,971.52
Of which: Changes

Interim Report 2021
~ 160 ~
caused by
remeasurements on
defined benefit
schemes
Other
comprehensive income
that will not be
reclassified to profit or
loss under the equity
method
Changes in
fair value of other
equity instrument
investment
1,062,158.94 265,539.74 477,971.52 318,647.68 477,971.52
Changes in
the fair value arising
from changes in own
credit risk
II. Other
comprehensive income
that may subsequently
be reclassified to profit
or loss
Of which: Other
comprehensive income
that will be reclassified
to profit or loss under
the equity method
Changes in
the fair value of
investments in other
debt obligations
Other
comprehensive income
arising from the
reclassification of
financial assets
Credit
impairment allowance
for investments in
other debt obligations
Reserve for

Interim Report 2021
~ 161 ~
cash flow hedges
Differences
arising from translation
of foreign
currency-denominated
financial statements
Total of other
comprehensive income 1,062,158.94 265,539.74 477,971.52 318,647.68 477,971.52
5.34 Surplus Reserves
Item Beginning balance Increase Decrease Ending balance
Statutory surplus reserve 256,902,260.27 - - 256,902,260.27
Total 256,902,260.27 - - 256,902,260.27
5.35 Retained Earnings
Item Reporting Period Same period of last year
Beginning balance of retained earnings before adjustments 7,987,380,161.21 6,888,203,911.92
Total beginning balance of retained earnings before
adjustment (increase+, decrease-) -
Beginning balance of retained earnings after adjustments 7,987,380,161.21 6,888,203,911.92
Add: Net profit attributable to owners of the Company as the
parent 1,378,803,828.46 1,854,576,249.29
Dividend of ordinary shares payable 755,400,000.00 755,400,000.00
Ending retained earnings 8,610,783,989.67 7,987,380,161.21
5.36 Operating Revenue and Cost of Sales
Item
Reporting Period Same period of last year
Operating revenue Costs of sales Operating revenue Costs of sales
Main operations 6,962,693,789.52 1,637,770,675.38 5,495,370,627.67 1,301,529,714.81
Other operations 44,802,678.22 16,047,671.93 24,250,372.95 12,395,877.67
Total 7,007,496,467.74 1,653,818,347.31 5,519,621,000.62 1,313,925,592.48
5.37 Taxes and Surcharges
Item Reporting Period Same period of last year
Consumption tax 879,116,923.82 731,743,604.96
Urban maintenance and construction tax and
educational surcharge
159,895,059.56 129,960,286.58
Land use tax 9,091,340.70 6,984,861.27

Interim Report 2021
~ 162 ~
Item Reporting Period Same period of last year
Property tax 9,172,552.52 8,847,804.72
Stamp duty 5,877,488.03 4,724,705.33
Other 6,657,887.42 5,735,777.86
Total 1,069,811,252.05 887,997,040.72
5.38 Selling Expense
Item Reporting Period Same period of last year
Employment benefits 385,703,329.21 269,309,951.20
Travel fees 79,727,177.78 55,722,038.26
Advertisement fees 467,467,773.39 453,767,973.19
Transportation charges 0.00 24,048,795.64
Comprehensive promotion costs 685,618,164.57 475,881,977.13
Service fees 359,748,787.06 299,367,311.62
Other 50,000,363.92 39,951,590.23
Total 2,028,265,595.93 1,618,049,637.27
5.39 Administrative Expenses
Item Reporting Period Same period of last year
Employee benefits 284,582,789.99 253,062,668.21
Office fees 25,800,540.36 22,537,545.08
Maintenance expenses 33,180,815.29 26,618,712.24
Depreciation 41,487,748.11 36,411,144.00
Amortization of intangible assets 17,277,135.76 12,940,993.85
Pollution discharge 10,238,085.66 7,786,943.40
Travel expenses 5,959,737.83 3,183,652.98
Water and electricity charges 3,949,046.33 3,790,246.91
Other 45,251,494.37 29,355,766.48
Total 467,727,393.70 395,687,673.15
5.40 Development Costs
Item Reporting Period Same period of last year
Labor cost 13,713,853.14 11,741,116.01
Direct input costs 2,156,217.53 383,301.13

Interim Report 2021
~ 163 ~
Item Reporting Period Same period of last year
Depreciation expense 1,666,681.97 1,658,315.10
Other 2,424,593.62 1,471,650.74
Total 19,961,346.26 15,254,382.98
5.41 Finance Costs
Item Reporting Period Same period of last year
Interest expenses 4,457,905.49 28,973,275.97
Less: Interest income 72,689,006.99 96,891,173.45
Net interest expenses -68,231,101.50 -67,917,897.48
Net foreign exchange losses -171,646.25 13,095.11
Bank charges and others -287,369.98 -303,665.57
Total -68,690,117.73 -68,208,467.94
5.42 Other Income
Item Reporting Period Same period of last
year Related to assets /income
I. Government grants recorded to other income
Of which: Government grant related to deferred
income
2,839,284.13 2,264,012.84 Related to assets
Government grant recorded to current
profit or loss
31,862,128.69 12,710,340.82 Related to income
Total 34,701,412.82 14,974,353.66 --
5.43 Investment Income
Item Reporting Period Same period of last year
Investment income from long-term equity
investments under equity method
60,287.04 -53,631.34
Dividend income from holding of other equity
instrument investments 809,860.62
Investment income from disposal of financial
assets at fair value through other
comprehensive income
-6,415,106.49
Investment income from holding of trading
financial assets 1,625.42
Other 421,221.91 18,539,603.54

Interim Report 2021
~ 164 ~
Total -5,122,111.50 18,485,972.20
5.44 Gains on Changes in Fair Values
Sources Reporting Period Same period of last year
Trading financial assets
Of which: Changes in fair value of designated as trading
financial assets
5,237,242.40 -3,596,160.61
Total 5,237,242.40 -3,596,160.61
5.45 Credit Impairment Loss
Item Reporting Period Same period of last year
Bad debt of notes receivable -14,753.46
Bad debt of accounts receivable 34,837.84 -414,861.96
Bad debt of other receivables 1,911,127.85 41,170.85
Total 1,945,965.69 -388,444.57
5.46 Asset Impairment Loss
Item Reporting Period Same period of last year
I. Inventory falling price loss 2,464,519.26 -5,693,185.77
II. Impairment loss of fixed assets
Total 2,464,519.26 -5,693,185.77
5.47 Gains on Disposal of Assets
Item Reporting Period Same period of last year
Gains/losses from disposal of fixed assets, construction in
progress, productive biological assets and intangible assets not
classified as held for sale
1,014,902.90 77,867.25
Of which: Fixed assets 1,014,902.90 77,867.25
Total 1,014,902.90 77,867.25
5.48 Non-operating Income
(1) Details of non-operating income
Item Reporting Period Same period of last year
Recognized in current
non-recurring profit or
loss
Gains from damage or scrapping of
non-current asset
588.35
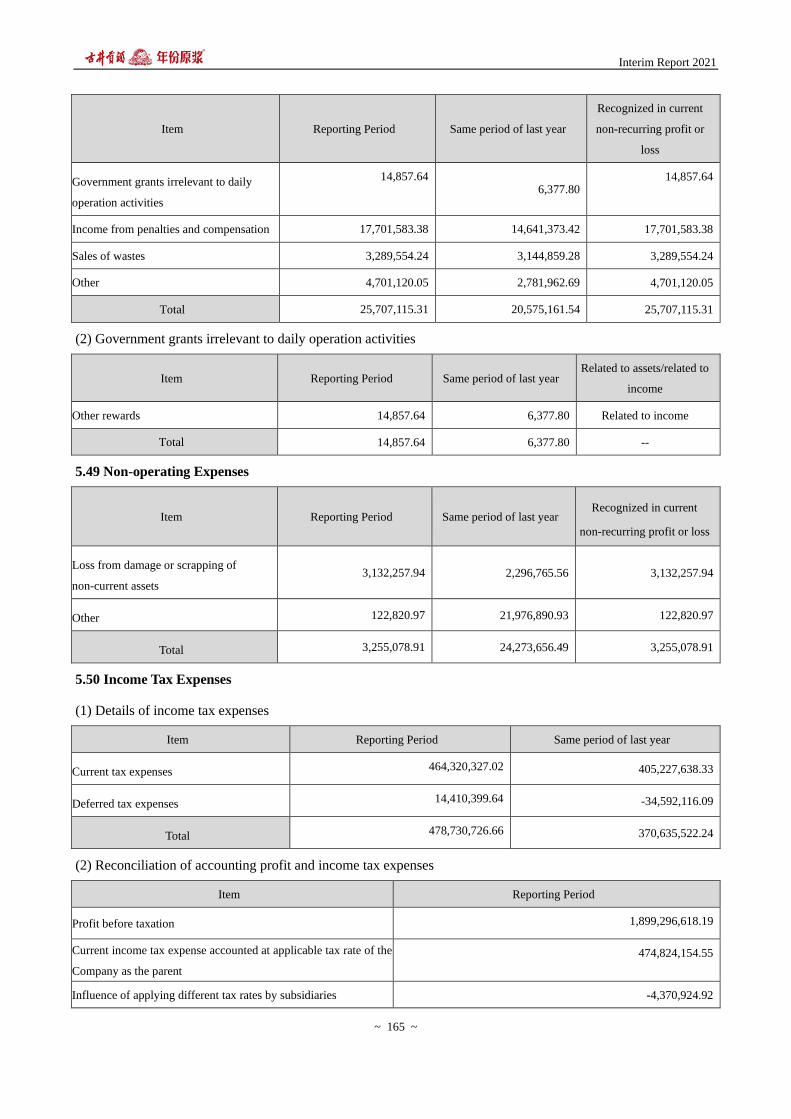
Interim Report 2021
~ 165 ~
Item Reporting Period Same period of last year
Recognized in current
non-recurring profit or
loss
Government grants irrelevant to daily
operation activities
14,857.64 6,377.80
14,857.64
Income from penalties and compensation 17,701,583.38 14,641,373.42 17,701,583.38
Sales of wastes 3,289,554.24 3,144,859.28 3,289,554.24
Other 4,701,120.05 2,781,962.69 4,701,120.05
Total 25,707,115.31 20,575,161.54 25,707,115.31
(2) Government grants irrelevant to daily operation activities
Item Reporting Period Same period of last year Related to assets/related to
income
Other rewards 14,857.64 6,377.80 Related to income
Total 14,857.64 6,377.80 --
5.49 Non-operating Expenses
Item Reporting Period Same period of last year Recognized in current
non-recurring profit or loss
Loss from damage or scrapping of
non-current assets 3,132,257.94 2,296,765.56 3,132,257.94
Other 122,820.97 21,976,890.93 122,820.97
Total 3,255,078.91 24,273,656.49 3,255,078.91
5.50 Income Tax Expenses
(1) Details of income tax expenses
Item Reporting Period Same period of last year
Current tax expenses 464,320,327.02 405,227,638.33
Deferred tax expenses 14,410,399.64 -34,592,116.09
Total 478,730,726.66 370,635,522.24
(2) Reconciliation of accounting profit and income tax expenses
Item Reporting Period
Profit before taxation 1,899,296,618.19
Current income tax expense accounted at applicable tax rate of the
Company as the parent
474,824,154.55
Influence of applying different tax rates by subsidiaries -4,370,924.92

Interim Report 2021
~ 166 ~
Influence of income tax before adjustment 10,929,022.12
Influence of non-taxable income
Influence of non-deductable costs, expenses and losses 1,183,384.24
Influence of deductable losses of unrecognized deferred income
tax at the beginning of the Reporting Period
Influence of deductable temporary difference or deductable
losses of unrecognized deferred income tax in the Reporting
Period
Influence of development expense deduction -3,834,909.33
Tax rate adjustment to the beginning balance of deferred income
tax assets/liabilities
Income tax credits
Total 478,730,726.66
5.51 Notes to the Statement of Cash Flows
(1) Other cash received relating to operating activities
Item Reporting Period Same period of last year
Security deposit, guarantee and warranty 101,445,152.98 118,873,747.83
Government grants 51,606,278.86 11,109,436.15
Interest income 81,668,119.12 88,199,155.94
Release of restricted monetary assets 1,331,277,878.92 1,085,000,000.00
Other 32,873,232.20 20,568,195.39
Total 1,598,870,662.08 1,323,750,535.31
(2) Other cash payments relating to operating activities
Item Reporting Period Same period of last year
Cash paid in sales and distribution expenses and
general and administrative expense 856,443,548.71 1,031,070,499.98
Security deposit, guarantee and warranty 90,125,562.91
Time deposits or deposits pledged for the
issuance of notes payable 884,394.71 30,000,000.00
Structured time deposits that cannot be
withdrawn in advance 3,498,000,000.00 400,000,000.00
Others 70,912,886.51 23,665,514.20
Total 4,516,366,392.84 1,484,736,014.18
(3) Other cash payments relating to financing activities

Interim Report 2021
~ 167 ~
Item Reporting Period Same period of last year
Rental fee 8,235,784.88
Total 8,235,784.88
5.52 Supplementary Information to the Statement of Cash Flows
(1) Supplementary information to the statement of cash flows
Supplementary information Reporting Period Same period of last year
1. Reconciliation of net profit to net cash flows generated from
operating activities:
Net profit 1,420,565,891.53 1,006,441,526.93
Add: Provisions for impairment of assets -4,410,484.95 6,081,630.34
Depreciation of fixed assets, investment properties, oil and gas assets
and productive biological assets 116,285,870.21 107,774,202.21
Depreciation of right-of-use assets 7,221,332.24
Amortization of intangible assets 21,521,021.91 17,144,478.37
Amortization of long-term deferred expenses 15,623,953.64 12,662,778.88
Losses from disposal of fixed assets, intangible assets and other
long-term assets (gains: negative) -1,014,902.90 -77,867.25
Losses on scrapping of fixed assets (gains: negative) 3,132,257.94 2,296,177.21
Losses on changes in fair value (gains: negative) -5,237,242.40 3,596,160.61
Finance costs (gains: negative) -171,646.25 290,708.33
Investment losses (gains: negative) 5,122,111.50 -18,485,972.20
Decreases in deferred tax assets (increase: negative) -29,849,019.59 -31,454,590.26
Increases in deferred tax liabilities (decrease: negative) 44,524,958.97 -3,137,525.83
Decreases in inventories (increase: negative) -553,051,541.47 88,585,890.97
Decreases in operating receivables (increase: negative) -437,729,347.99 -350,818,607.86
Increases in operating payables (decrease: negative) 1,829,040,435.66 415,739,110.19
Amortization of deferred income
Other*1 -2,167,606,515.79 1,085,000,000.00
Net cash flows from operating activities 263,967,132.26 2,341,638,100.64
2. Significant investing and financing activities without involvement of
cash receipts and payments

Interim Report 2021
~ 168 ~
Supplementary information Reporting Period Same period of last year
Conversion of debt into capital -
Current portion of convertible corporate bonds -
Fixed assets acquired under finance leases -
3. Net increase/decrease of cash and cash equivalents:
Ending balance of cash 9,642,389,098.14 5,398,187,475.71
Less: Beginning balance of cash 5,636,903,693.74 2,944,749,918.09
Add: Ending balance of cash equivalents
Less: Beginning balance of cash equivalents
Net increase in cash and cash equivalents 4,005,485,404.40 2,453,437,557.62
*1: Refer to impact of restricted funds on net cash flow generated from operating activities of the reporting period.
(2) Net cash paid for acquisition of subsidiaries
Amount
Cash or cash equivalents paid during the Reporting Period for the
business combination occurring during the Reporting Period 200,200,000.00
Including: --
Less: Cash and cash equivalents held by subsidiaries on the
purchase date 135,013,666.90
Including: --
Add: Cash or cash equivalents paid during the Reporting Period for
the business combination occurring during previous period
Including: --
Net cash paid for acquisition of subsidiaries 65,186,333.10
(3) The components of cash and cash equivalents
Item Reporting Period Same period of last year
I. Cash 9,642,389,098.14 5,398,187,475.71
Including: Cash on hand 175,509.59 254,747.79
Bank deposit on demand 9,641,953,541.32 5,397,660,747.68
Other monetary assets on demand 260,047.23 271,980.24
II. Cash equivalents
Of which: Bond investments maturing within three months
III. Ending balance of cash and cash equivalents 9,642,389,098.14 5,398,187,475.71
Of which: cash and cash equivalents with restriction to use in the - -

Interim Report 2021
~ 169 ~
Item Reporting Period Same period of last year
subsidies of the Company as the parent or Group
5.53 Assets with Restricted Ownership or Right of Use
Item Ending carrying value Reason
Cash and cash equivalents 2,501,915,391.71
Structured deposit which cannot be
withdrawn in advance as well as security
deposit
Accounts receivable financing 24,300,000.00 Pledged for issuance of bank acceptance
bills
Total 2,526,215,391.71 --
5.54 Government Grants
(1) Government grants related to assets
Item Amount
Item
presented in
the
statement of
financial
position
Recognized in current profit or loss or as
deduct of related cost Presented item
recorded to current
profit or loss or as
deduct of related
cost
Reporting Period Same period of last year
Suizhou new plant infrastructure
subsidy
35,338,000.00 Deferred
income
- -
Other income
Refund for land payment 43,975,050.74 Deferred
income
265,135.86 275,103.09
Other income
Funds for strategic emerging
industry agglomeration
development base
2,064,000.04 Deferred
income
311,359.98 111,360.00
Other income
Comprehensive subsidy fund for
air pollution prevention and
control
2,232,287.08 Deferred
income
145,928.39 131,500.02
Other income
Equipment subsidy 1,561,646.52 Deferred
income
119,531.68 76,329.89
Other income
Subsidy funds for strong
manufacturing province and
private economy development
projects in 2019
1,404,510.55 Deferred
income 155,581.14 156,208.20 Other income
Subsidy for the construction of
independent innovation capacity
of Anhui Province
852,302.50 Deferred
income 365,272.50 365,272.50 Other income

Interim Report 2021
~ 170 ~
Research funds of intelligent koji
making technology
1,130,000.00 Deferred
income
- -
Other income
Subsidy for technical
transformation of No.2 boiler
870,370.36 Deferred
income
111,111.12 -
Other income
Equipment subsidy 651,205.00 Deferred
income
144,706.83 102,807.24
Other income
Optimization and reconstruction
project of Gujing Zhangji liquor
store
763,958.49 Deferred
income
23,749.98 23,749.98
Other income
Subsidy for key technology
cooperation project of important
food isotope authenticity
- Deferred
income 600,000.00 - Other income
Subsidy for food safety
improvement project
482,758.75 Deferred
income
68,965.50 68,965.50
Other income
Anhui province development of
direct funds of service industry
356,097.80 Deferred
income
146,341.44 146,341.44
Other income
Specific funds for side
management of power demand
300,000.00 Deferred
income
72,000.00 72,000.00
Other income
Whole process online monitoring
of hook and store automation and
product quality
125,000.00 Deferred
income 46,875.00 46,875.00 Other income
Electric motor and boiler energy
saving technology transformation
project
68,750.30 Deferred
income
68,749.98 68,749.98
Other income
Wine production system technical
transformation
2,295,464.57 Deferred
income
114,743.94 31,249.98
Other income
Intelligent solid brewing
technology innovation project
72,916.47 Deferred
income
15,625.02 15,625.02
Other income
Enterprise development funds - Deferred
income
15,000.00
Other income
Internet of things traceability
system project
- Deferred
income
556,875.00
Other income
Specific fund for transformation
of gas-fired boilers in 2017
212,500.00 Deferred
income
20,000.00 -
Other income
Recognition awards for industrial
enterprise technical
transformation investments
587,444.15 Deferred
income
43,605.77 -
Other income
Total 95,344,263.32 - 2,839,284.13 2,264,012.84 --
(2) Government grants related to income

Interim Report 2021
~ 171 ~
Item Amount
Item presented in the
statement of
financial position
Recognized in current profit or loss or
as deduct of related cost
Presented item
recorded to
current profit
or loss or as
deduct of
related cost
Reporting Period Same period of
last year
Tax refund 4,775,517.47 Other income 4,775,517.47 2,937,700.91 Other income
Hubei University of
Science and Technology
Industrialization Funds
9,541,000.00 Other income 9,541,000.00 - Other income
Manufacturing Power
Province Construction
Fund and Digital Economy
Development Policy
Incentives
1,000,000.00 Other income 1,000,000.00 - Other income
2020 Provincial
Manufacturing
High-Quality
Development Projects
Special Fund of Suizhou
1,000,000.00 Other income 1,000,000.00 - Other income
Relocation Project Tax
Incentives of State
Treasury Section of
Finance Bureau of the
High-tech Industrial Park
of Suizhou
6,946,300.00 Other income 6,946,300.00 - Other income
Wuhan Financial Special
Fund to Work for Training
Subsidies
664,500.00 Other income 664,500.00 - Other income
Financial Contribution
Progress Award 500,000.00 Other income 500,000.00 - Other income
2021 Standardization
Incentives of Bozhou
Municipal Market
Supervision and
Administration Bureau
400,000.00 Other income 400,000.00 - Other income
Wuhan 2021 Special
Funds for Technological
Transformation of Science
and Technology and
400,000.00 Other income 400,000.00 - Other income

Interim Report 2021
~ 172 ~
Economic Information
Bureau of Hanyang
District
VAT add-on deduction 2,615,664.17 Other income 2,615,664.17 2,539,581.56 Other income
Financial Support from the
State Treasury Collection
and Payment Center in
Hanyang District, Wuhan
- Other income - 2,364,000.00 Other income
Unemployment Insurance
Premium Refunds Other income 2,314,709.05 Other income
Subsidy from the Social
Security Bureau for
Stabilization of Jobs
- Other income - 910,749.30 Other income
2019 Manufacturing
Power Province and
Private Economic
Development Policy
Award Funds
- Other income - 600,000.00 Other income
Others 4,019,147.05 Other income 4,019,147.05 1,043,600.00 Other income
Other not related to daily
operation 14,857.64
Non operating
income 14,857.64 -
Non operating
income
Discounted loans 94,491.13 Finance expense 94,491.13 - Finance
expense
Total 31,971,477.46 -- 31,971,477.46 12,710,340.82 --
6. Changes of Consolidation Scope
6.1 Business Combination Not under the Same Control
(1) Business Combination Not under the Same Control in the Reporting Period
Unit: RMB
Name of
acquiree
Time and
place of
gaining the
equity
Cost of gaining
the equity
Proportion
of equity
Way to gain
the equity
Purchase
date
Recognition
basis of
purchase date
Income of
acquiree from
the purchase date
to period-end
Net profits of
acquiree from
the purchase
date to
period-end
Anhui
Mingguang
Distillery
Co., Ltd.
2021.1.10 200,200,000.00 60% Purchase 2021.1.10
Payment,
transfer of share
ownership,
transfer of right
to administer
properties
137,448,767.50 6,887,903.80

Interim Report 2021
~ 173 ~
(2) Combination Cost and Goodwill
Unit: RMB
Combination cost Anhui Mingguang Distillery Co., Ltd.
Combination cost
—Cash 200,200,000.00
Total combination cost 200,200,000.00
Less: share of fair value of gained identifiable net assets 139,513,817.93
Amount that the goodwill/combination cost is lower than the share
of fair value of gained identifiable net assets 60,686,182.07
(3) The Identifiable Assets and Liabilities of Acquiree on Purchase Date
Unit: RMB
Item Anhui Mingguang Distillery Co., Ltd.
Fair value on purchase date Carrying value on purchase date
Monetary assets 135,013,666.90 135,013,666.90
Accounts receivable 10,711,363.41 10,711,363.41
Prepayments 1,596,899.47 1,596,899.47
Other receivables 6,122,501.16 6,122,501.16
Inventories 281,633,786.01 211,852,592.58
Other current assets 2,546.37 2,546.37
Investments in other equity instruments 53,848,697.80 14,530,000.00
Fixed assets 119,631,918.83 72,638,969.35
Construction in progress 557,987.45 557,987.45
Intangible assets 56,327,165.76 9,123,081.42
Long-term prepaid expense 2,929,439.00 2,929,439.00
Deferred income tax assets 3,498,516.13 3,498,516.13
Short-term borrowings 94,000,000.00 94,000,000.00
Accounts payable 43,654,530.85 43,654,530.85
Advances from customers 53,061,162.81 53,061,162.81
Employee benefits payable 4,147,589.59 4,147,589.59
Taxes payable 38,825,770.24 38,825,770.24
Other payables 141,767,461.40 141,767,461.40
Other current liabilities 12,000,000.00 12,000,000.00
Deferred income 807,082.92 807,082.92
Deferred income tax liabilities 50,824,231.26 0.00

Interim Report 2021
~ 174 ~
Net assets 232,786,659.22 80,313,965.43
Non-controlling interests 93,272,841.29 32,283,763.77
Gained net assets 139,513,817.93 48,030,201.66
6.2 Changes in Combination Scope for Other Reasons
Compared with the previous period, the Company added subsidiaries Anhui Jiuhao China Railway Construction
Engineering Co., Ltd. and Anhui Jiuan Mechanical Electrical Equipment Co., Ltd., and cancelled one subsidiary
Bozhou Gujing Waste Reclamation Co., Ltd.
7. Equity in Other Entities
7.1 Equity in Subsidiaries
(1) Composition of corporate group
Name Main operating
place
Registration
place
Nature of
business
Holding percentage (%) Way of gaining
Directly Indirectly
Bozhou Gujing Sales Co., Ltd. Anhui Bozhou Anhui Bozhou Commercial
trade 100.00 -
Investment
establishment
Anhui Longrui Glass Co., Ltd Anhui Bozhou Anhui Bozhou Manufacture 100.00 - Investment
establishment
Bozhou Gujing Waste Reclamation
Co., Ltd. (Cancelled) Anhui Bozhou Anhui Bozhou Waste recycle 100.00 -
Investment
establishment
Anhui Jinyunlai Culture & Media
Co., Ltd. Anhui Hefei Anhui Hefei
Advertisement
marketing 100.00 -
Investment
establishment
Anhui Ruisiweier Technology Co.,
Ltd. Anhui Bozhou Anhui Bozhou
Technical
research 100.00 -
Investment
establishment
Shanghai Gujing Jinhao Hotel
Management Co., Ltd. Shanghai Shanghai
Hotel
management 100.00 -
Business
combination
under common
control
Bozhou Gujing Hotel Co., Ltd Anhui Bozhou Anhui Bozhou Hotel operating 100.00 -
Business
combination
under common
control
Anhui Yuanqing Environmental
Protection Co., Ltd. Anhui Bozhou Anhui Bozhou
Sewage
treatment 100.00 -
Investment
establishment
Anhui Gujing Yunshang
E-commerce Co., Ltd Anhui Hefei Anhui Hefei
Electronic
commerce 100.00 -
Investment
establishment
Anhui Zhenrui Construction
Engineering Co., Ltd Anhui Bozhou Anhui Bozhou Construction 52.00
Investment
establishment

Interim Report 2021
~ 175 ~
Name Main operating
place
Registration
place
Nature of
business
Holding percentage (%) Way of gaining
Directly Indirectly
Anhui RunAnXinKe Testing
Technology Co., Ltd. Anhui Bozhou Anhui Bozhou Food testing 100.00 -
Investment
establishment
Anhui Jiudao Culture Media Co.,
Ltd. Anhui Hefei Anhui Hefei
Advertisement
marketing 100.00 -
Investment
establishment
Anhui Jiuan Mechanical Electrical
Equipment Co., Ltd. Anhui Bozhou Anhui Bozhou
Construction
installation 100.00
Investment
establishment
Anhui Jiuhao China Railway
Construction Engineering Co., Ltd. Anhui Bozhou Anhui Bozhou Construction 52.00
Investment
establishment
Anhui Mingguang Distillery Co.,
Ltd.
Anhui
Chuzhou
Anhui
Mingguang Manufacture 60.00
Business
combination not
under common
control
Mingguang Tiancheng Ming Wine
Sales Co., Ltd.
Anhui
Chuzhou
Anhui
Mingguang
Commercial
trade 60.00
Business
combination not
under common
control
Fengyang Xiaogang Village Ming
Wine Distillery Co., Ltd.
Anhui
Chuzhou
Anhui
Fengyang Manufacture 42.00
Business
combination not
under common
control
Yellow Crane Tower Distillery
Co., Ltd.
Hubei Wuhan Hubei Wuhan Manufacture 51.00 -
Business
combination not
under common
control
Yellow Crane Tower Distillery
(Xianning) Co., Ltd.
Hubei
Xianning
Hubei
Xianning Manufacture - 51.00
Business
combination not
under common
control
Yellow Crane Tower Distillery
(Suizhou) Co., Ltd. Hubei Suizhou Hubei Suizhou Manufacture - 51.00
Business
combination not
under common
control
Hubei Junlou Cultural Tourism
Co., Ltd.
Hubei
Wuhan
Hubei
Wuhan
Advertising
marketing - 51.00
Business
combination not
under common
control
Hubei Yellow Crane Tower
Beverage Co., Ltd
Hubei
Xianning
Hubei
Xianning Manufacture - 51.00
Investment
establishment

Interim Report 2021
~ 176 ~
Name Main operating
place
Registration
place
Nature of
business
Holding percentage (%) Way of gaining
Directly Indirectly
Wuhan Yashibo Technology Co.,
Ltd. Hubei Wuhan Hubei Wuhan
Technology
development
- 51.00
Investment
establishment
Hubei Xinjia Testing Technology
Co., Ltd.
Hubei
Xianning
Hubei
Xianning Food testing
- 51.00
Investment
establishment
Wuhan Tianlong Jindi Technology
Development Co., Ltd Hubei Wuhan Hubei Wuhan
Commercial
trade - 51.00
Business
combination not
under common
control
Xianning Junhe Sales Co., Ltd Hubei
Xianning
Hubei
Xianning
Commercial
trade - 51.00
Business
combination not
under common
control
Wuhan Junya Sales Co., Ltd Hubei Wuhan Hubei Wuhan Commercial
trade
- 51.00
Investment
establishment
Suizhou Junhe Commercial Co.,
Ltd. Hubei Suizhou Hubei Suizhou
Commercial
trade
- 51.00
Investment
establishment
(2) Significant non-wholly owned subsidiaries
Name
Shareholding
proportion of
non-controlling
interests
The profit or loss
attributable to the
non-controlling interests
Declaring dividends
distributed to
non-controlling interests
Balance of
non-controlling interests
at the period-end
Yellow Crane Tower
Distillery Co., Ltd. 49.00 44,387,465.24 449,950,237.89
(3) Main financial information of significant non-wholly owned subsidiaries
Name
Ending balance
Current assets Non-current
assets Total assets
Current
liabilities
Non-current
liability Total liabilities
Yellow Crane
Tower Distillery
Co., Ltd.
750,411,154.65 924,490,280.52 1,674,901,435.17 449,940,812.14 306,694,831.42 756,635,643.56
(Continued)
Name
Beginning balance
Current assets Non-current
assets Total assets
Current
liabilities
Non-current
liability Total liabilities

Interim Report 2021
~ 177 ~
Name
Beginning balance
Current assets Non-current
assets Total assets
Current
liabilities
Non-current
liability Total liabilities
Yellow Crane Tower
Distillery Co., Ltd. 633,542,317.24 868,332,173.16 1,501,874,490.40 482,603,067.57 191,592,294.97 674,195,362.54
(Continued)
Name
Reporting Period
Operating revenue Net profit Total comprehensive
income
Cash flows from operating
activities
Yellow Crane Tower Distillery
Co., Ltd. 690,959,858.06 90,586,663.75 90,586,663.75 196,719,144.40
(Continued)
Name
Same period of last year
Operating revenue Net profit Total comprehensive
income
Cash flows from
operating activities
Yellow Crane Tower Distillery
Co., Ltd. 181,381,939.34 -37,745,055.98 -37,745,055.98 -107,245,907.79
7.2 Equity in joint ventures or associated enterprises
There was no significant joint venture or associated enterprise.
8. The Risk Related to Financial Instruments
Risks related to the financial instruments of the Company arise from the recognition of various financial assets
and financial liabilities during its operation, including credit risk, liquidity risk and market risk.
Management of the Company is responsible for determining risk management objectives and policies related to
financial instruments. Operational management is responsible for the daily risk management through functional
departments. Internal audit department is responsible for the daily supervision of implementation of the risk
management policies and procedures, and report their findings to the audit committee in a timely manner.
Overall risk management objective of the Company is to establish risk management policies to minimize the risks
without unduly affecting the competitiveness and resilience of the Company.
8.1 Credit Risk
Credit risk is the risk of one party of the financial instrument face to a financial loss because the other party of the
financial instrument fails to fulfill its obligation. The credit risk of the Company is related to cash and equivalent,
notes receivable, accounts receivables, other receivables, and long-term receivables. Credit risk of these financial

Interim Report 2021
~ 178 ~
assets is derived from the counterparty’s breach of contract. The maximum risk exposure is equal to the carrying
amount of these financial instruments.
Cash and cash equivalent of the Company has lower credit risk, as they are mainly deposited in such financial
institutions as commercial bank, of which the Company thinks with higher reputation and financial position.
Notes receivable held by the Company are mainly bank acceptance bills, which have strong liquidity. The
Company has formulated corresponding bill management and control procedures and has been effectively
implemented, which greatly ensures the safety of bill storage and use to ensure the low credit risks. The Company
only conducts business with customers with good credit rating, and will continue to monitor the balance of
accounts receivable to ensure that the Company avoids the risk of major bad debt losses. The company's largest
credit risk exposure is the book value of each financial asset (including derivative financial instruments) in the
balance sheet, and the overall credit risk evaluation is low.
8.2 Liquidity Risk
Liquidity risk is the risk of shortage of funds when fulfilling the obligation of settlement by delivering cash or
other financial assets. The Company is responsible for the capital management of all of its subsidiaries, including
short-term investment of cash surplus and dealing with forecasted cash demand by raising loans. The Company’s
policy is to monitor the demand for short-term and long-term floating capital and whether the requirement of loan
contracts is satisfied so as to ensure to maintain adequate cash and cash equivalents.
8.3 Market Risk
The market risk of financial instruments refers to the risk that the fair value or future cash flows of financial
instruments will fluctuate due to changes in market prices. Market risks mainly include foreign exchange risk and
interest rate risk.
(1) Foreign currency risk
Foreign exchange risk refers to the risk of loss due to exchange rate fluctuations generally. The core business of
the Company is on the mainland of China and trading with CNY. Foreign exchange risk is minimal.
(2) Interest rate risk
Interest rate risk refers to the risk that the fair value of financial instruments or future cash flows will fluctuate due
to changes in market interest rates. The Company's interest rate risk mainly comes from long-term and short-term
bank borrowings. As of 30 June 2021, the Company has no liabilities calculated with floating interest rates.
(3) Other price risk

Interim Report 2021
~ 179 ~
The Held-for-trading financial assets of the Company are measured by fair value. As a result of that, the Company
bears the risk of the change of security market. To decrease the risk, the management decided that the Company
held a combination of several equities and securities.
9. The Disclosure of Fair Value
The inputs used in the fair value measurement in its entirety are to be classified in the level of the hierarchy in
which the lowest level input that is significant to the measurement is classified:
Level 1: Inputs consist of unadjusted quoted prices in active markets for identical assets or liabilities
Level 2: Inputs for the assets or liabilities (other than those included in Level 1) that are either directly or
indirectly observable.
Level 3: Inputs are unobservable inputs for the assets or liabilities
1. Assets and liabilities measured at fair value on 30 June 2021
Item Fair value on 30 June 2021
Level 1 Level 2 Level 3 合计
一、Recurring fair value
measurements -- -- -- --
(一)Held-for-trading
financial assets
1. Financial assets at fair
value through profit or
loss
209,115,157.91 209,115,157.91
(1)Debt instruments
(2)Bank financial
products
(3)Fund investment 209,115,157.91 209,115,157.91
2. Financial assets
designated to be measured
at fair value through profit
or loss
(1)Debt instruments
(2)Equity instrument
investment
(二)Receivables
financing - - 2,003,302,090.64 2,003,302,090.64
(三)Investment in other
equity instruments 54,910,856.74 54,910,856.74

Interim Report 2021
~ 180 ~
Total assets measured at
fair value on a recurring
basis
- 264,026,014.65 2,003,302,090.64 2,267,328,105.29
The fair value of financial instruments traded in an active market is based on quoted market prices at the reporting
date. The fair value of financial instruments not traded in an active market is determined by using valuation
techniques. Specific valuation techniques used to value the above financial instruments include discounted cash
flow and market approach to comparable company model. Inputs in the valuation technique include risk-free
interest rates, benchmark interest rates, exchange rates, credit spreads, liquidity premiums, discount for lack of
liquidity.
9.2 Valuation Technique(s), Qualitative and Quantitative Information about the Significant Inputs Used for
Fair Value Measurement in Level 2 on a Recurring or Nonrecurring Basis
The second level fair value measurement items of the company are mainly fund investment and other equity
instrument investment. For fund investment, the company shall recognize the corresponding profit and loss from
changes in fair value and the value of trading financial assets according to the securities investment fund valuation
statement provided by the asset management company; For other equity instrument investment, the company
recognizes the corresponding fair value of other comprehensive income and other equity instrument investment
according to the book net assets provided by the invested company.
9.3 Valuation Technique(s), Qualitative and Quantitative Information about the Significant Inputs Used for
Fair Value Measurement in Level 3 on a Recurring or Nonrecurring Basis
The items of fair value measurement in Level 2 of the Company are mainly about received notes. Since the
maturity of the received notes is mostly shorter than one year, and the cash is expected to be recovered at the
denomination when due, we determine its fair value based on the denomination.
10. Related Party and Related-party Transactions
Recognition of related parties: The Company has control or joint control of, or exercise significant influence over
another party; or the Company is controlled or jointly controlled, or significant influenced by another party.
10.1 General Information of the Parent Company
Name Registration
place Nature of business Registered capital
Proportion of share
held by the
Company as the
parent against the
Company (%)
Proportion of
voting rights
owned by the
Company as the
parent against the
Company (%)

Interim Report 2021
~ 181 ~
Name Registration
place Nature of business Registered capital
Proportion of share
held by the
Company as the
parent against the
Company (%)
Proportion of
voting rights
owned by the
Company as the
parent against the
Company (%)
Anhui Gujing Group
Co., Ltd.
Anhui
Bozhou
Beverages, construction
materials, manufacturing
plastic production
1,000,000,000.00 53.89 53.89
The ultimate controller of the Company: The ultimate controller is State-owned Assets Supervision and
Administration Commission of the Government of Bozhou City, Anhui Province.
10.2 General Information of Subsidiaries
Refer to Note 7.1 Equity in joint ventures or associated enterprises for details.
10.3 Joint ventures and associated enterprises of the Company
(1) General information of significant joint ventures and associates
Refer to Note 7.2 Equity in joint ventures or associated enterprises for details.
10.4 Other Related Parties of the Company
Name Relationship with the Company
Anhui Hengxin Pawn Co., Ltd. An affiliate of the actual controller and controlling
shareholder
Anhui Gujing Hotel Development Co., Ltd. An affiliate of the actual controller and controlling
shareholder
Anhui Haochidian Catering Co., Ltd. An affiliate of the actual controller and controlling
shareholder
Anhui Huixin Finance Investment Group Co., Ltd An affiliate of the actual controller and controlling
shareholder
Anhui Ruijing Business Travel (Group) Co., Ltd. An affiliate of the actual controller and controlling
shareholder
Bozhou Hotel Co., Ltd. An affiliate of the actual controller and controlling
shareholder
Anhui Jiuan Engineering Management Consulting Co., Ltd. An affiliate of the actual controller and controlling
shareholder
Anhui Ruijing Business Travel (Group) Co., Ltd.Hefei Gujing
Holiday Hotel
An affiliate of the actual controller and controlling
shareholder
Anhui Gujing International Development Co., Ltd. An affiliate of the actual controller and controlling
shareholder
Anhui Lejiu Home Tourism Management Co., Ltd. An affiliate of the actual controller and controlling
shareholder

Interim Report 2021
~ 182 ~
Anhui Gujing Health Industry Co., Ltd. An affiliate of the actual controller and controlling
shareholder
Anhui Ruixin Pawn Co. Ltd. An affiliate of the actual controller and controlling
shareholder
Anhui Shenglong Commercial Co., Ltd. An affiliate of the actual controller and controlling
shareholder
Anhui Youxin Financing Guarantee Co., Ltd. An affiliate of the actual controller and controlling
shareholder
Anhui Zhongxin Finance Leasing Co. Ltd. An affiliate of the actual controller and controlling
shareholder
Bozhou Anxin Micro Finance Co., Ltd. An affiliate of the actual controller and controlling
shareholder
Anhui Gujing Huishenglou Catering Co., Ltd. An affiliate of the actual controller and controlling
shareholder
Hefei Longxin Business Management Consulting Co., Ltd. An affiliate of the actual controller and controlling
shareholder
Anhui Lixin E-commerce Co., Ltd. An affiliate of the actual controller and controlling
shareholder
Dazhongyuan Wine Valley Culture Tourism Development Co.,
Ltd.
An affiliate of the actual controller and controlling
shareholder
Shanghai Beihai Hotel Co., Ltd An affiliate of the actual controller and controlling
shareholder
Nanjing Suning Real Estate Development Co., Ltd. Enterprise controlled by Zhang Guiping, who is an
independent director of the Company
10.5 Related Party Transactions
(1) Purchases or sales of goods, rendering or receiving of services
Purchases of goods, receiving of services:
Related party Content Reporting
Period
Same period of
last year
Anhui Gujing Hotel Development Co., Ltd. Catering and accommodation
service 526,809.78
121,508.00
Anhui Haochidian Catering Co., Ltd. Purchase of materials 13,998,153.7
4 8,757,860.85
Anhui Haochidian Catering Co., Ltd. Purchase of assets 135,398.23
Anhui Haochidian Catering Co., Ltd. Catering and accommodation
service 272,361.80 884,017.40
Anhui Haochidian Catering Co., Ltd. Labor service 1,252,375.80 991,145.50
Anhui Jiuan Engineering Management Consulting Co., Ltd. Consultation and assurance 1,762,765.33
Anhui Ruijing Business Travel (Group) Co., Ltd. Catering and accommodation
service 251,426.22
Anhui Ruijing Business Travel (Group) Co., Ltd. Purchase of materials 46,390.00 525,535.82

Interim Report 2021
~ 183 ~
Bozhou Hotel Co., Ltd. Catering and accommodation
service 2,767,466.43 1,439,005.95
Bozhou Gujing Huishenglou Catering Co., Ltd. Catering and accommodation
service 1,016,638.00 416,771.00
Anhui Ruijing Business Travel (Group) Co., Ltd.Hefei
Gujing Holiday Hotel Purchase of materials 511,520.21 149,618.90
Anhui Ruijing Business Travel (Group) Co., Ltd.Hefei
Gujing Holiday Hotel
Catering and accommodation
service 79,499.36 63,570.78
Anhui Gujing International Development Co., Ltd. Labor service 103,773.58
Anhui Gujing Group Co., Ltd. Purchase of materials 56,952.00
Anhui Gujing Health Industry Co., Ltd. Purchase of materials 191,893.81
Anhui Gujing Hotel Development Co., Ltd. Labor service 3,413.21
Dazhongyuan Wine Valley Culture Tourism Development
Co., Ltd.
Purchase of materials and
labor service 201,143.63
Anhui Lejiu Home Tourism Management Co., Ltd. Purchase of materials and
labor service 99,546.43
Total -- 22,620,804.9
0 14,005,756.86
Sales of goods and rendering of services:
Related party Content Reporting Period Same period of last
year
Anhui Gujing Group Co., Ltd.
Catering and
accommodatio
n service
64,573.00 28,125.00
Anhui Gujing Group Co., Ltd. Sales of small
materials 17,892.09 35,549.10
Anhui Gujing Health Industry Co., Ltd. Sales of liquor -690,974.69 5,738,435.24
Anhui Gujing Health Industry Co., Ltd.
Catering and
accommodatio
n service
1,250.00
Anhui Gujing Hotel Development Co., Ltd. Sales of liquor 104,830.09 94,938.00
Anhui Gujing Hotel Development Co., Ltd. Utilities 117,827.75
Anhui Haochidian Catering Co., Ltd. Sales of liquor 19,115.04 48,584.08
Anhui Hengxin Pawn Co., Ltd. Sales of liquor 5,925.67 6,244.25
Anhui Huixin Finance Investment Group Co., Ltd Sales of liquor 20,692.03 21,225.67
Anhui Jiuan Engineering Management Consulting Co., Ltd.
Catering and
accommodatio
n service
630.00
Anhui Jiuan Engineering Management Consulting Co., Ltd. Sales of liquor 3,568.14
Anhui Lejiu Home Tourism Management Co., Ltd. Utilities 3,433.85 51,180.85
Anhui Lejiu Home Tourism Management Co., Ltd. Sales of liquor 4,890.26 4,539.82
Anhui Ruijing Business Travel (Group) Co., Ltd. Catering and 38,145.75

Interim Report 2021
~ 184 ~
accommodatio
n service
600.00
Anhui Ruijing Business Travel (Group) Co., Ltd. Sales of liquor 587,517.41 251,495.58
Anhui Ruixin Pawn Co. Ltd. Sales of liquor 3,703.54 3,512.39
Anhui Shenglong Commercial Co., Ltd.
Catering and
accommodatio
n service
2,470.00 3,800.00
Anhui Shenglong Commercial Co., Ltd. Sales of liquor 624,187.6 1,450,295.22
Anhui Youxin Financing Guarantee Co., Ltd. Sales of liquor 1,712.39 3,122.12
Anhui Zhongxin Finance Leasing Co. Ltd. Sales of liquor 8,147.79 8,115.92
Bozhou Anxin Micro Finance Co., Ltd. Sales of liquor 7,407.08 8,506.19
Bozhou Hotel Co., Ltd. Sales of liquor 32,973.46 50,575.23
Bozhou Gujing Huishenglou Catering Co., Ltd. Sales of liquor 30,106.20 68,654.87
Hefei Gujing Holiday Hotel Co., Ltd. Sales of liquor 44,442.47 14,336.28
Hefei Longxin Business Management Consulting Co., Ltd Sales of liquor 509.73
Anhui Gujing Health Industry Co., Ltd. Labor service 232,430.19
Anhui Gujing Health Industry Co., Ltd. Sales of small
materials 1,314.60
Anhui Lejiu Home Tourism Management Co., Ltd. Labor service 7,620.00
Anhui Lixin E-commerce Co., Ltd. Sales of liquor 7,461.93
Bozhou Ruineng Thermal Power Co., Ltd. Sales of liquor 74,150.45
Dazhongyuan Wine Valley Culture Tourism Development Co.,
Ltd.
Sales of small
materials 2,631.13
Dazhongyuan Wine Valley Culture Tourism Development Co.,
Ltd.
Catering and
accommodatio
n service
420.00
Dazhongyuan Wine Valley Culture Tourism Development Co.,
Ltd. Labor service 2,889.91
Dazhongyuan Wine Valley Culture Tourism Development Co.,
Ltd. Sales of liquor 88,799.29
Shanghai Beihai Hotel Co., Ltd Sales of liquor 8,601.77
Anhui Gujing International Development Co., Ltd. Sales of small
materials 5,437.89
Anhui Gujing International Development Co., Ltd.
Catering and
accommodatio
n service
2,820.00
Anhui Gujing International Development Co., Ltd. Sales of liquor 1,700,563.88
Total -- 1,053,726.65 10,028,226.85
(2) Related-party leases
The Company as lessor:
Name of lessee Category of leased
assets
The lease income confirmed in
the Reporting Period
The lease income confirmed in
the same period of last year

Interim Report 2021
~ 185 ~
Anhui Gujing Hotel Development Co., Ltd. Houses and buildings 543,941.93 417,153.83
Total -- 543,941.93 417,153.83
The Company as lessee:
Name of lessor Category of leased
assets
The lease fee confirmed in the
Reporting Period
The lease fee confirmed in
the same period of last year
Anhui Gujing Group Co., Ltd. Houses and buildings 594,333.78 749,786.08
Nanjing Suning Real Estate Development Co., Ltd. Houses and buildings 1,290,102.21 -
Total -- 1,884,435.99 749,786.08
10.6 Receivables and Payables with Related Parties
(1) Payables
Item Related party Ending balance Beginning balance
Contract
liabilities Anhui Gujing Health Industry Co., Ltd. 608,339.50 658,339.50
Contract
liabilities Anhui Ruijing Business Travel (Group) Co., Ltd. 600,828.67 342,484.96
Contract
liabilities Anhui Gujing International Development Co., Ltd. 186,083.60 186,083.60
Contract
liabilities Bozhou Gujing Huishenglou Catering Co., Ltd. 15,300.00
Accounts
payable Anhui Gujing Group Co., Ltd. 4,804,012.50
Accounts
payable Anhui Haochidian Catering Co., Ltd. 2,723,533.27 2,479,131.69
Accounts payable Anhui Ruijing Business Travel (Group) Co., Ltd. 86,129.55 -
Other payables Anhui Gujing Group Co., Ltd. 98,817.71 1,050,004.75
Other payables Anhui Ruijing Business Travel (Group) Co., Ltd. 115,533.60 114,660.00
Other payables Anhui Gujing Hotel Development Co., Ltd. 100,000.00 100,000.00
11. Commitments and Contingency
11.1 Significant Commitments
As of June 30, 2021, the company has no important commitments to be disclosed.
11.2 Contingencies
As of 30 June 2021, The Company has no contingencies need to be disclosed.
12. Events after Balance Sheet Date
Approved by the China Securities Regulatory Commission under CSRC Permit [2021] No. 1422, the Company

Interim Report 2021
~ 186 ~
issued RMB25,000,000 ordinary shares (A shares) to specific targets on 23 June 2021 at an issuing price of
RMB200.00 per share, raising total proceeds of RMB5,000,000,000.00. After deducting the expenses related to
the issue of RMB45,657,925.15 (excluding VAT), the actual net proceeds raised were RMB4,954,342,074.85.
RSM (special ordinary partnership) has audited the availability of the funds raised from the non-public offering of
shares of the Company on 29 June 2021 and issued Capital Verification Report R.C.Y.Z [2021] No. 518Z0050.
The above shares were registered with the Shenzhen Branch of CSDC on 12 July 2021 and listed on the Shenzhen
Stock Exchange on 22 July 2021.
13. Other Significant Events
Segment Information
The Company did not determine the operating segment in accordance with the internal organizational structure,
management requirements, and internal reporting system, so there was no need to disclose segment information
report based on the operating segments.
14. Notes of Main Items in the Financial Statements of the Company as the Parent
14.1 Accounts Receivable
(1) Disclosure by aging
Aging Ending balance Beginning balance
Within one year 1,179,822.50 494,976.27
Of which:1-6 months 1,179,822.50 494,976.27
7-12 months -
1-2 years -
2-3 years -
Over 3 years -
Subtotal 1,179,822.50 494,976.27
Less: Bad debt provision 0.00
Total 1,179,822.50 494,976.27
(2) Disclosure by withdrawal method of bad debt provision
Item
Ending balance
Carrying amount Bad debt provision
Carrying value Amount Proportion (%) Amount
Withdrawal
proportion
(%)
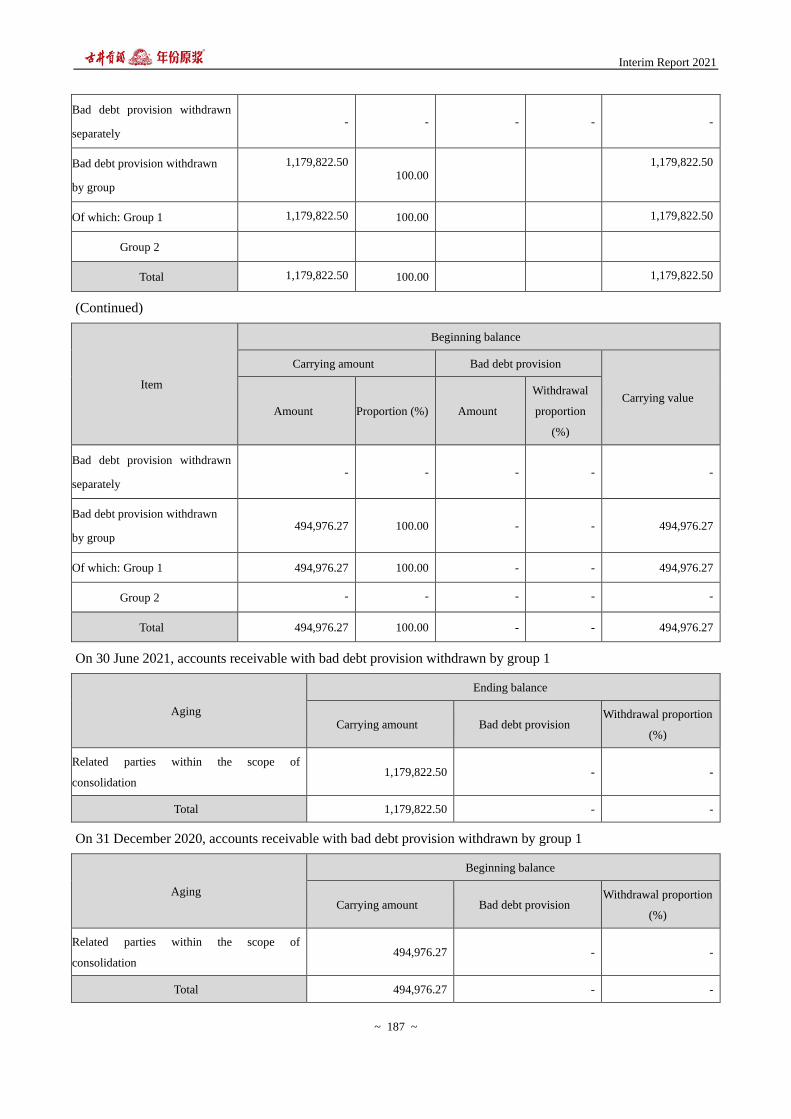
Interim Report 2021
~ 187 ~
Bad debt provision withdrawn
separately - - - - -
Bad debt provision withdrawn
by group
1,179,822.50 100.00
1,179,822.50
Of which: Group 1 1,179,822.50 100.00 1,179,822.50
Group 2
Total 1,179,822.50 100.00 1,179,822.50
(Continued)
Item
Beginning balance
Carrying amount Bad debt provision
Carrying value Amount Proportion (%) Amount
Withdrawal
proportion
(%)
Bad debt provision withdrawn
separately - - - - -
Bad debt provision withdrawn
by group 494,976.27 100.00 - - 494,976.27
Of which: Group 1 494,976.27 100.00 - - 494,976.27
Group 2 - - - - -
Total 494,976.27 100.00 - - 494,976.27
On 30 June 2021, accounts receivable with bad debt provision withdrawn by group 1
Aging
Ending balance
Carrying amount Bad debt provision Withdrawal proportion
(%)
Related parties within the scope of
consolidation 1,179,822.50 - -
Total 1,179,822.50 - -
On 31 December 2020, accounts receivable with bad debt provision withdrawn by group 1
Aging
Beginning balance
Carrying amount Bad debt provision Withdrawal proportion
(%)
Related parties within the scope of
consolidation 494,976.27 - -
Total 494,976.27 - -
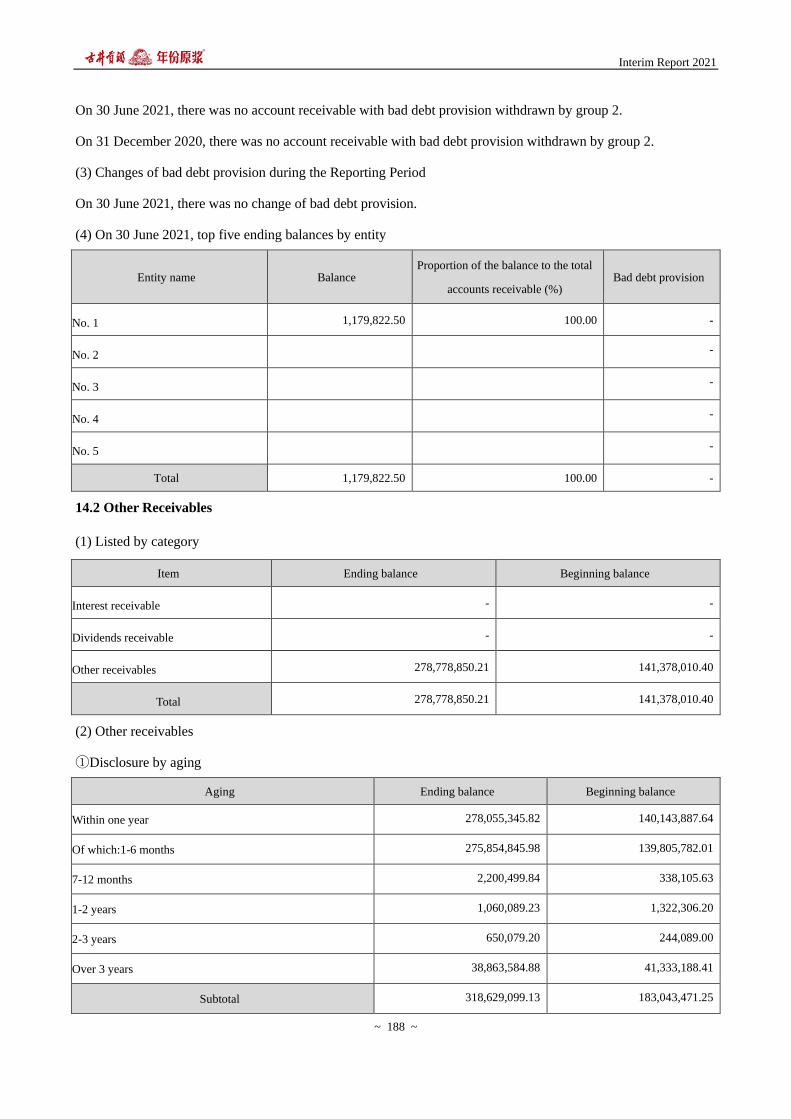
Interim Report 2021
~ 188 ~
On 30 June 2021, there was no account receivable with bad debt provision withdrawn by group 2.
On 31 December 2020, there was no account receivable with bad debt provision withdrawn by group 2.
(3) Changes of bad debt provision during the Reporting Period
On 30 June 2021, there was no change of bad debt provision.
(4) On 30 June 2021, top five ending balances by entity
Entity name Balance Proportion of the balance to the total
accounts receivable (%) Bad debt provision
No. 1 1,179,822.50 100.00 -
No. 2 -
No. 3 -
No. 4 -
No. 5 -
Total 1,179,822.50 100.00 -
14.2 Other Receivables
(1) Listed by category
Item Ending balance Beginning balance
Interest receivable - -
Dividends receivable - -
Other receivables 278,778,850.21 141,378,010.40
Total 278,778,850.21 141,378,010.40
(2) Other receivables
①Disclosure by aging
Aging Ending balance Beginning balance
Within one year 278,055,345.82 140,143,887.64
Of which:1-6 months 275,854,845.98 139,805,782.01
7-12 months 2,200,499.84 338,105.63
1-2 years 1,060,089.23 1,322,306.20
2-3 years 650,079.20 244,089.00
Over 3 years 38,863,584.88 41,333,188.41
Subtotal 318,629,099.13 183,043,471.25

Interim Report 2021
~ 189 ~
Aging Ending balance Beginning balance
Less: Bad debt provision 39,850,248.92 41,665,460.85
Total 278,778,850.21 141,378,010.40
②Disclosure by nature
Nature Ending balance Beginning balance
Related parties within the scope of consolidation 231,295,793.74 133,696,578.89
Security investment 38,857,584.88 40,807,394.41
Security deposit and guarantee 43,727,658.09 1,879,230.29
Rent, water, electricity and gas 1,363,672.14 1,275,238.93
Other 3,384,390.28 5,385,028.73
Total 318,629,099.13 183,043,471.25
③Disclosure by withdrawal method of bad debt provision
A. As of 30 June 2021, bad debt provision withdrawn based on three stages model:
Stage Carrying amount Bad debt provision Carrying value
Stage 1 279,771,514.25 992,664.04 278,778,850.21
Stage 2
Stage 3 38,857,584.88 38,857,584.88
Total 318,629,099.13 39,850,248.92 278,778,850.21
A1. As of 30 June 2021, bad debt provision at stage 1:
Category Carrying amount 12-month expected credit
losses rate (%) Bad debt provision Carrying value
Bad debt provision withdrawn
separately - - - -
Bad debt provision withdrawn
by group 279,771,514.25 0.35 992,664.04 278,778,850.21
Of which: Group 1 231,295,793.74 231,295,793.74
Group 2 48,475,720.51 2.05 992,664.04 47,483,056.47
Total 279,771,514.25 0.35 992,664.04 278,778,850.21
On 30 June 2021, other receivables with bad debt provision withdrawn by group 2
Aging Ending balance

Interim Report 2021
~ 190 ~
Carrying amount Bad debt provision Withdrawal proportion
(%)
Within one year 46,759,552.08 555,615.51 1.19
Of which:1-6 months 44,559,052.24 445,590.52 1.00
7-12 months 2,200,499.84 110,024.99 5.00
1-2 years 1,060,089.23 106,008.93 10.00
2-3 years 650,079.20 325,039.60 50.00
Over 3 years 6,000.00 6,000.00 100.00
Total 48,475,720.51 992,664.04 2.05
A2. As of 30 June 2021, bad debt provision at stage 3:
Category Carrying amount 12-month expected credit
losses rate (%) Bad debt provision Carrying value
Bad debt provision withdrawn
separately 38,857,584.88 100.00 38,857,584.88 -
Bad debt provision withdrawn
by group
-
Of which: Group 1 -
Group 2 -
Total 38,857,584.88 100.00 38,857,584.88 -
On 30 June 2021, other receivables with bad debt provision withdrawn separately:
Name
Ending balance
Carrying amount Bad debt provision
Withdrawal
proportion
(%)
Withdrawal reason
Hengxin Securities Co., Ltd. 28,966,894.41 28,966,894.41 100.00 The enterprise enters the
bankruptcy liquidation procedure
Jianqiao Securities Co., Ltd. 9,890,690.47 9,890,690.47
100.00 The enterprise enters the
bankruptcy liquidation procedure
Total 38,857,584.88 38,857,584.88 100.00 --
B. As of 31 December 2020, bad debt provision withdrawn based on three stages model:
Stage Carrying amount Bad debt provision Carrying value
Stage 1 142,236,076.84 858,066.44 141,378,010.40

Interim Report 2021
~ 191 ~
Stage Carrying amount Bad debt provision Carrying value
Stage 2 - - -
Stage 3 40,807,394.41 40,807,394.41 -
Total 183,043,471.25 41,665,460.85 141,378,010.40
B1. On 31 December 2020, bad debt provision at stage 1:
Category Carrying amount 12-month expected credit
losses rate (%) Bad debt provision Carrying value
Bad debt provision withdrawn
separately - - - -
Bad debt provision withdrawn
by group 142,236,076.84 0.60 858,066.44 141,378,010.40
Of which: Group 1 133,696,578.89 - - 133,696,578.89
Group 2 8,539,497.95 10.05 858,066.44 7,681,431.51
Total 142,236,076.84 0.60 858,066.44 141,378,010.40
On 31 December 2020, other receivables with bad debt provision withdrawn by group 2
Aging
Beginning balance
Carrying amount Bad debt provision Withdrawal proportion
(%)
Within one year 6,447,308.75 77,997.31 1.21
Of which:1-6 months 6,109,203.12 61,092.03 1.00
7-12 months 338,105.63 16,905.28 5.00
1-2 years 1,322,306.20 132,230.63 10.00
2-3 years 244,089.00 122,044.50 50.00
Over 3 years 525,794.00 525,794.00 100.00
Total 8,539,497.95 858,066.44 10.05
B2. As of 31 December 2020, bad debt provision at stage 3:
Category Carrying amount 12-month expected credit
losses rate (%) Bad debt provision Carrying value
Bad debt provision withdrawn
separately 40,807,394.41 100.00 40,807,394.41 -
Bad debt provision withdrawn - - - -

Interim Report 2021
~ 192 ~
Category Carrying amount 12-month expected credit
losses rate (%) Bad debt provision Carrying value
by group
Of which: Group 1 - - - -
Group 2 - - - -
Total 40,807,394.41 100.00 40,807,394.41 -
On 31 December 2020, other receivables with bad debt provision withdrawn separately:
Name
Beginning balance
Carrying amount Bad debt provision
Withdrawal
proportion
(%)
Withdrawal reason
Hengxin Securities Co., Ltd.
28,966,894.41 28,966,894.41 100.00
The enterprise enters the
bankruptcy liquidation
procedure
Jianqiao Securities Co., Ltd.
11,840,500.00 11,840,500.00 100.00
The enterprise enters the
bankruptcy liquidation
procedure
Total 40,807,394.41 40,807,394.41 100.00 --
④Changes of bad debt provision during the Reporting Period
Category Beginning balance
Changes in the Reporting Period
Ending balance Withdrawal
Reversal or
recovery Write-off
Bad debt provision withdrawn
separately
40,807,394.41 - 1,949,809.53 38,857,584.88
Bad debt provision withdrawn by
group
858,066.44 134,597.60 992,664.04
Total 41,665,460.85 134,597.60 1,949,809.53 39,850,248.92
⑤ On 30 June 2021, top five ending balance by entity
No. Nature Ending balance Aging
Proportion of
the balance to
the total other
receivables
(%)
Bad debt
provision
No. 1 Related party within the 90,000,000.00 Within 6 months 28.25 -

Interim Report 2021
~ 193 ~
No. Nature Ending balance Aging
Proportion of
the balance to
the total other
receivables
(%)
Bad debt
provision
scope of consolidation
No. 2 Related party within the
scope of consolidation 79,101,073.03 Within 6 months 24.83 -
No. 3 Related party within the
scope of consolidation 50,469,478.21 Within 6 months 15.84 -
No. 4 Cash deposit 42,020,000.00 Within 6 months 13.19 420,200.00
No. 5 Securities Investment 28,966,894.41 Over 3 years 9.09 28,966,894.41
Total -- 290,557,445.65 91.20 29,387,094.41
14.3 Long-term Equity Investments
Item
Ending balance Beginning balance
Carrying amount Depreciation
reserve Carrying value Carrying amount
Depreciation
reserve Carrying value
Investment in
subsidiaries 1,312,692,241.38 1,312,692,241.38 1,118,213,665.32 - 1,118,213,665.32
Total 1,312,692,241.38 1,312,692,241.38 1,118,213,665.32 - 1,118,213,665.32
(1) Investments in subsidiaries
Investees Beginning
balance
Increase during
the Reporting
Period
Decrease
during the
Reporting
Period
Ending balance
Impairment
provision
during the
Reporting
Period
Provision for
impairment at 30
June 2021
Bozhou Gujing Sales Co.,
Ltd.
68,949,286.89 - - 68,949,286.89
-
Anhui Longrui Glass Co.,
Ltd.
85,267,453.06 - - 85,267,453.06
-
Shanghai Gujing Jinhao
Hotel Management Co.,
Ltd.
49,906,854.63 - - 49,906,854.63
-

Interim Report 2021
~ 194 ~
Investees Beginning
balance
Increase during
the Reporting
Period
Decrease
during the
Reporting
Period
Ending balance
Impairment
provision
during the
Reporting
Period
Provision for
impairment at 30
June 2021
BozhouGujing Hotel Co.,
Ltd.
648,646.80 - - 648,646.80
-
Anhui Ruisiweier
Technology Co., Ltd.
40,000,000.00 - - 40,000,000.00
-
Anhui Yuanqing
Environmental Protection
Co., Ltd.
16,000,000.00 - - 16,000,000.00
-
Anhui Gujing Yunshang
E-commerce Co., Ltd.
5,000,000.00 - - 5,000,000.00
-
Anhui Zhenrui
Construction Engineering
Co., Ltd.
10,000,000.00 - 10,000,000.00 - -
Yellow Crane Tower
Distillery Co., Ltd.
816,000,000.00 - - 816,000,000.00 -
Anhui Jinyunnlai Cultural
Media Co., Ltd.
15,000,000.00 - - 15,000,000.00 -
Bozhou Gujing Waste
Recycling Co., Ltd.
1,441,423.94 - 1,441,423.94 - -
Anhui RunanXinke Testing
Technology Co., Ltd. 10,000,000.00 - 10,000,000.00 -
Anhui Mingguang
Distillery Co., Ltd. - 200,200,000.00 - 200,200,000.00 -
Anhui Jiuhao China
Railway Construction
Engineering Co., Ltd.
- 5,720,000.00 - 5,720,000.00 -
Total 1,118,213,665.32 205,920,000.00 11,441,423.94 1,312,692,241.38 -
14.4 Operating Revenue and Cost of Sales
Item Reporting Period Same period of last year

Interim Report 2021
~ 195 ~
Operating revenue Cost of sales Operating revenue Cost of sales
Main operations 3,545,448,721.46 1,360,995,592.21 3,264,418,953.05 1,298,189,995.07
Other operations 50,784,414.00 27,316,859.36 32,698,219.44 18,869,268.55
Total 3,596,233,135.46 1,388,312,451.57 3,297,117,172.49 1,317,059,263.62
14.5 Investment Income
Item Reporting Period Same period of last year
Investment income from long-term equity investments under cost
method 2,228,838.58
Gains on disposal of financial assets at fair value through other
comprehensive income -6,415,106.49 -
Investment income from trading financial assets during the holding
period 1,625.42
Other investment income 411,771.02 12,434,590.21
Total -3,772,871.47 12,434,590.21
15. Supplementary Materials
15.1 Items and Amounts of Non-recurring Profit or Loss
Item Amount Note
Gains/losses on the disposal of non-current
assets -2,117,355.04
Government grants recognised in current
profit or loss 34,716,270.46
Gain/loss from change of fair value of
trading financial assets and liabilities, and
derivative financial assets and liabilities, and
investment gains from disposal of trading
financial assets and liabilities, and derivative
financial assets and liabilities, and
investment in other debt obligations, other
than valid hedging related to the Company’s
common businesses
6,470,100.21
Depreciation reserves returns of receivables
and contract assets with separate
depreciation test
1,949,809.53
Other non-operating income and expense
other than the above 25,569,436.70
Less: Income tax effects 16,593,381.40

Interim Report 2021
~ 196 ~
Non-controlling interests effects 9,476,312.99
Total 40,518,567.47 --
15.2 Return on Net Assets and Earnings Per Share
Profit as of Reporting Period Weighted average ROE
(%)
EPS (Yuan/share)
EPS-basic EPS-diluted
Net profit attributable to ordinary shareholders of the
Company 12.85 2.74 2.74
Net profit attributable to ordinary shareholders of the
Company after deduction of non-recurring profit and
loss
12.47 2.66 2.66
Chairman of the Board: (Liang Jinhui)
Anhui Gujing Distillery Company Limited
27 August 2021