Palestra: Comércio Eletrônico - Gestão e Estratégias Avançadas de Sucesso (Anhanguera Educacional)

CFA Investment Research Challenge
Anhanguera Educacional S.A.
December 3rd, 2011
Team: Insper
Type: Partial Presentation1
Note:
1. This is only a preview. This presentation wiil suffer changes until the presentation day (12/06/2011)

18.05
15
20
25
30
35
40
45
Dec-10 Jan-11 Feb-11 Mar-11 Apr-11 May-11 Jun-11 Jul-11 Aug-11 Sep-11 Oct-11 Nov-11
Introduction
Anhanguera’s stock history1 and target price
Based on a DCF model, we rate Anhanguera with a buy recommendation
Source: Bloomberg / INSPER student’s estimates
Upside 72%
Target Price: R$ 31
BUY Rating
Note:
1. Data until 12/02/2011

SECTION 1
SECTION 2
SECTION 3
SECTION 4
SECTION 5
Education Sector’s Drivers
Anhanguera’s Business’ Drivers
Financial Analysis
Valuation
Risks
Contents
4
7
12
16
20
Disclaimers 24

SECTION 1
Education Sector’s Drivers

82%
75%
67%
59%
52%
27% 23%
20%
1 2 3 4 5 6 7 8
1.1 Penetration Rate on Post Secondary Education
Education in Brazil is a promissing sector, with large future growth possibilities
Brazilian education sector offers a huge growth opportunity
Source: SEMESP
Post Secondary Penetration Rate (%)1 Penetration of Post Secondary Education in Brazil (%)1
1. Education Sector’s Drivers
77%
35%
9%
3%
A B C D/E
There’s a large
educational gap in
Brazil to be
fulfilled...
Avg. 51%
Underpenetration
mainly due to
middle and low
class
...and we believe
FIES and Brazil’s
GDP growth are
crucial factors to
diminish it
Note:
1. Data from 2008
Source: Hoper Consultoria

1.2 GDP Growth and FIES
The two main drivers to develop the educational sector
Sectors Elasticities
For those reasons, education sector shows great potential for growth
Brazil’s GDP Growth
FIES Effects
1.6x
1.3x
1.3x
1.1x
1.1x
1x
0.7x
Education
Transportation
Healthcare
Culture &…
Personal Expenses
Housing
Food
1 Enrollments growth
2 Dropouts decrease
3 Delinquency minimized
4.2%
3.7% 3.8%
07 - 10 11 - 15e 16 - 20e
Having a high
elasticity, the
Brazilian
educational sector
will benefit from the
robust future
economic growth...
...while FIES will
also help to boost
enrollments,
reducing dropouts
and delinquency
Source: Company’s Data
FIES Eligibility
Course materials aproved
by regulators
Quality test scores
above 60%
Family income below 2
minimum wages
Pay a fraction of the course
while enrolled
Entertaiment
1. Education Sector’s Drivers
Source: SEMESP Source: Bacen / LCA Consultores
SECTION 2
Anhanguera’s Business’ Drivers

2.1 Anhanguera’s Business Drivers Overview
Anhanguera’s three competitive advantage pillars
2007 – 2010 Comparative Enrollment (‘000) Anhanguera’s Competitive Advantages
Price and Quality
Lower comparative tuition price
Greater comparative quality
Distance Learning Centers
Broader target audience
Greater economies of scale
Acquisition and Integration Teams
Great acquisition track record
5 - year margin integration with AEDU’s standards
1
2
3
2. Anhanguera Business Drivers
57
175
18
358
248
94
1 2 3
CAGR
130% CAGR
12%
CAGR
73%
07’ 10’ 07’ 10’ 07’ 10’
Source: Companies’ Data
...mainly due to
three competitive
advantages: lower
price and high
quality, DLC’s
participation and
acquisitions
Anhanguera is able
to deliver a higher
enrollment growth
compared to its
peers...
Anhanguera stands out among its peers, making it the sector’s top choice

Economies of scale
Partnerships with quality suppliers
Standardized course structure
Teachers’ salary based on ENADE results
288
386
536
1 2 3
2.2 Price and Quality
Anhanguera has the best quality and the greatest affordability compared to its peers
Average Tuition Price (BRL) National Student Performance (ENADE)
2.86
2.69 2.67
1 2 3
2. Anhanguera Business Drivers
2.65
2.7
2.75
2.8
2.85
2.9
0 150 300 450 600
ENADE scores
Tuition
Despite having the
lowest tuition,
Anhanguera offers a
better service when
compared to its
peers...
Comparative Quality and Price Price and Quality
...This results in the
competitive
advantage of having
the best quality to
cost ratio
Source: Companies’ Data Source: Companies’ Data
2.90
2.85
2.80
2.75
2.70
2.65
Greater Performance
Lowe P
rice
Anhanguera is able to offer the best of both worlds to its customers

Campus
Distance
Learning
Center
42%
16%
4%
1 2 3
2.3 Distance Learning Centers
Distance Learning Center is one of Anhanguera’s engine
Great convenience delivering high margins
Percentage of Total Students on DLCs Target Audience
42-48
36-42
30-36
24-30
18-24
12-18
12 and under
48+
Distance Learning Centers Characteristics
Wider target audience
Higher margins
Located in cities with less than 100,000 inhabitants
Hybrid program (students attend centers once a week)
Distance Learning
Centers have a
wider target
audience because
of its greater
convenience...
...And have a higher
gross margin (55%),
due to its great cost
dillution
2. Anhanguera Business Drivers
41%
55%
2010 Campus 2010 Distance Learning
Comparative 2010 Gross Margin
Source: Companies’ Data

227
66 57
1 2 3
2.4 Acquisitions
M&A Team deliver great execution with fast integration of acquired units
Number of Students Acquired (‘000)
Acquisition and Integration teams are valuable assets to the company
Acquisition EBITDA Margin Evolution
Anhanguera’s Expected Acquisition Targets1
Acquisitions track
record explicits the
efficiency of the
execution team...
... And the margins
evolution shows an
able integration
team
Source: Companies’ Data
0
10%
17%
23%
27% 30%
Year 0 Year 1 Year 2 Year 3 Year 4 Year 5Source: Insper Student’s Estimates
Note:
1. Ilustrative view. Targets not precisely positioned.
Source: Insper Student’s Estimates

SECTION 3
Financial Analysis

3.1 Revenue Model
Those 4 channels deliver our expected revenue rise
Anhanguera’s 4 enrollment growth channels
Net Revenue (BRL Million) Anhanguera’s Enrollment and Capacity Channels
1
2
3
4
112
1,558
3,468
4,236
2006 2011E 2016E 2021E
CAGR
69%
CAGR
17%
CAGR
4%
3. Financial Analysis
Source: Company’s Data
Acquisitions
Great acquisition track record
Greenfields
• Projection of 7 new campuses in the next years
Campus’ Organic Growth
FIES and GDP growth support this channel
Distance Learning Centers’ Organic Growth
Broader target audience
Revenue growth
sustained by
enrollment
increase...
...Since we forecast
Anhanguera’s
tuition using just
the inflation rate
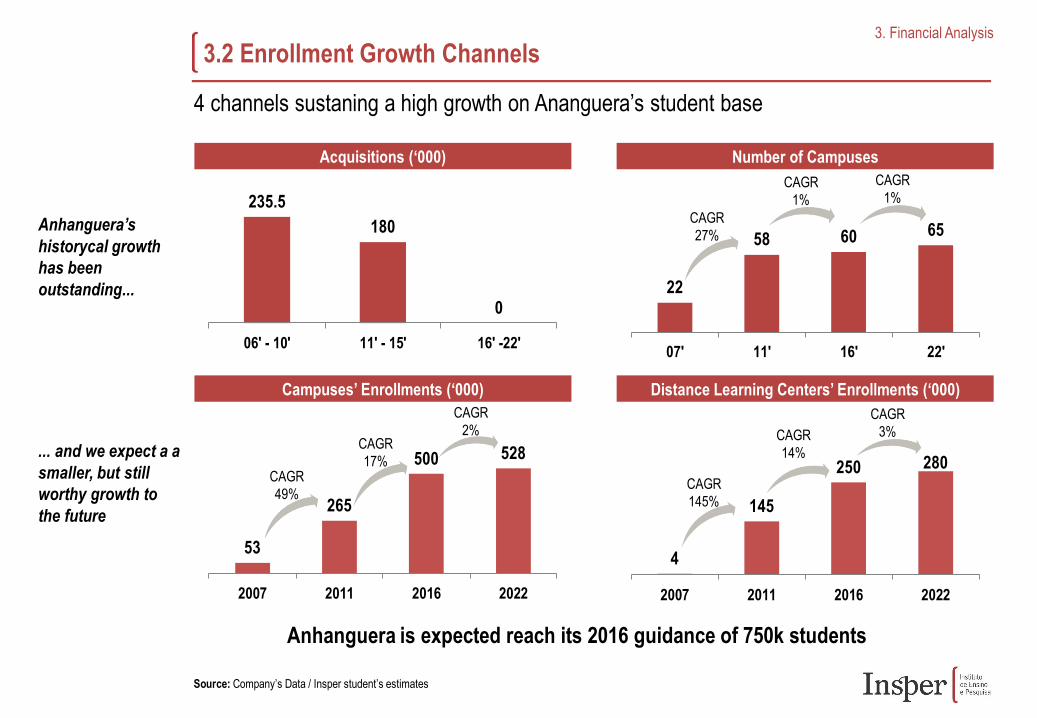
4 channels sustaning a high growth on Ananguera’s student base
Acquisitions (‘000)
Anhanguera is expected reach its 2016 guidance of 750k students
Campuses’ Enrollments (‘000)
Number of Campuses
Distance Learning Centers’ Enrollments (‘000)
235.5
180
0
06' - 10' 11' - 15' 16' -22'
22
58 60 65
07' 11' 16' 22'
3. Financial Analysis
4
145
250 280
2007 2011 2016 2022
53
265
500 528
2007 2011 2016 2022
Source: Company’s Data / Insper student’s estimates
3.2 Enrollment Growth Channels
Anhanguera’s
historycal growth
has been
outstanding...
... and we expect a a
smaller, but still
worthy growth to
the future
CAGR
49%
CAGR
17%
CAGR
2%
CAGR
145%
CAGR
14%
CAGR
3%
CAGR
27%
CAGR
1%
CAGR
1%

188 235
328
381
501
584
705
818
2009 2010 2011E 2012E 2013E 2014E 2015E 2016E16%
18%
20%
22%
24%
26%
28%
2009 2011E 2013E 2015E
3.3 Projected EBITDA and EBITDA Margin
Margin growth will sustain our expected EBITDA growth
Increases in margins sustain expected EBITDA growth
EBITDA Margin Evolution EBITDA (BRL Million)
Low margin
acquired units
- M&A Integration
- Campuses Maturation
3. Financial Analysis
Source: Company’s Data / Insper student’s estimates
Initial decrease in
EBITDA margin, due
to inefficient
acquired units...
... Next, acquisitions
integration and
campuses
maturation sustain a
4 percentage points
expansion
Forecast

SECTION 4
Valuation
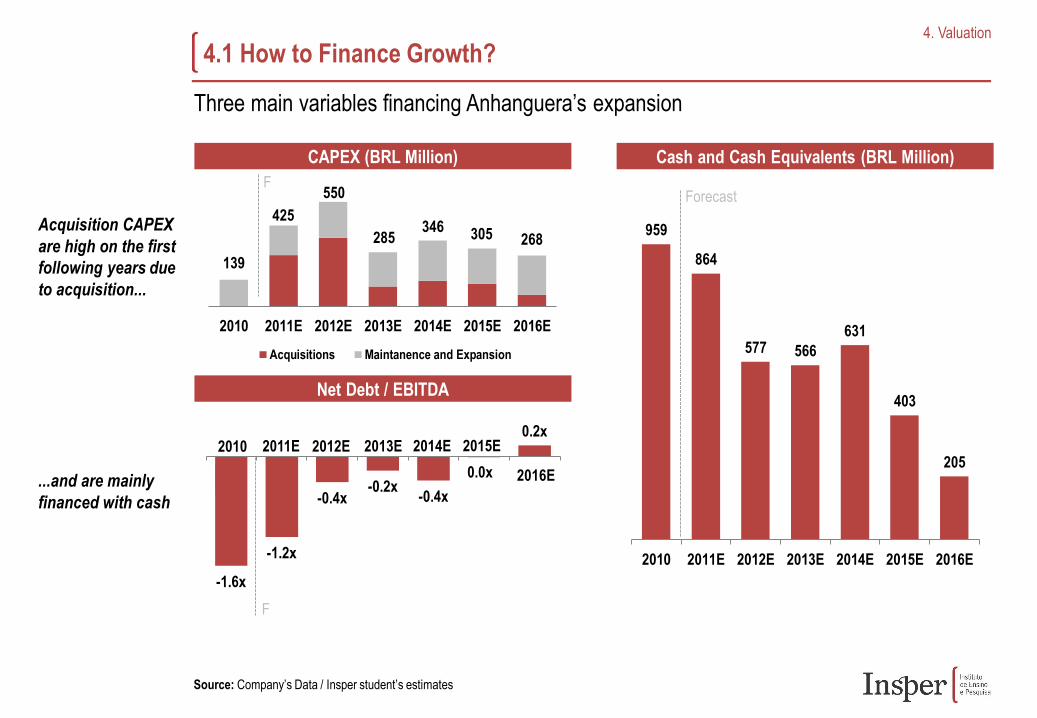
4.1 How to Finance Growth?
Three main variables financing Anhanguera’s expansion
CAPEX (BRL Million)
Net Debt / EBITDA
Cash and Cash Equivalents (BRL Million)
-1.6x
-1.2x
-0.4x -0.2x
-0.4x
0.0x
0.2x
2010
4. Valuation
959
864
577 566
631
403
205
2010 2011E 2012E 2013E 2014E 2015E 2016E
2010 2011E 2012E 2013E 2014E 2015E 2016E
Acquisitions Maintanence and Expansion
Source: Company’s Data / Insper student’s estimates
2010 2011E 2012E 2013E 2014E 2015E
2016E
139
425
550
285 346
268 305
Forecast F
F
Acquisition CAPEX
are high on the first
following years due
to acquisition...
...and are mainly
financed with cash

4.2 Weighted Average Cost of Capital
Cost of
Equity
Risk Free Rate1
(US$)
3.5%
Country Risk
Premium2 (US$)
2.0%
Market Risk
Premium3 (US$)
5.0%
Beta4
1.20
Cost of
Debt
Cost of Debt
Before Taxes5
(BRL)
12.5%
Cost of Equity
(BRL)
14.7%
WACC (BRL
Nominal)
14.0%
80%
20% Tax Rate 8%
Cost of Debt
After Taxes
(BRL)
11.5%
4. Valuation
WACC’s Breakdown
Notes:
1. Based on the American 10 year T-bond – Source: Bloomberg
2. Based on the JPM EMBI+ Brazil – Source: JPM Hub
3. Based on the historical difference between the S&P returns and the American 10 year T-bond – Source: Bloomberg
4. Based on the average beta of comparable companies – Source: Bloomberg / Insper Student’s Estimates
5. Based on the weighted average of Anhanguera’s nominal rate debt – Source: Company Data / Insper Student’s Estimates

4.3 Results From DCF Valuation
Considering a 14% WACC and a 5.5% nominal perpetuity growth
Free Cash Flow to Firm (R$ Million)
Value of Discounted Cash Flow Target Price Sensibility (BRL)
Perpetuity Growth (%) - R$ Nominal
WA
CC
(%
) -
R$
No
min
al
4.50% 5.00% 5.50% 6.00% 6.50%
13.0% 34.7 35.5 37.1 38.9 41.0
13.5% 31.5 32.7 34.0 35.6 37.7
14.0% 29.2 30.2 31.4 32.7 34.1
14.5% 27.1 28.0 29.0 30.1 31.4
15.0% 25.3 26.1 26.9 27.9 28.9
4. Valuation
Present Value of Free Cash Flow (BRL Million) 1,811
Present Value of Terminal Value (BRL Million) 2,799
EV (BRL Million) $4,611
(-) Net Debt (BRL Million) 44
Equity Value (BRL Million) 4,566
# Shares (Millions) 146
2012 Target Price (BRL) 31
Current Stock Price (BRL) 18
Upside 72%
Source: Company’s Data / Insper student’s estimates
Discounted cash flow results in a 2012 BRL 31 target price for Anhanguera.
FCFF (BRLmn) 2009 2010 2011E 2012E 2013E 2014E 2015E 2016E 2017E 2018E 2019E 2020E 2021E 2022E
EBITDA 188.4 235.5 328.5 381.1 501.8 584.8 705.8 818.5 921.3 992.9 1,067.2 1,181.1 1,262.8 1,311.5
(-) D&A -27.8 -34.6 -67.5 -83.6 -83.7 -95.2 -91.6 -86.5 -94.2 -99.6 -105.0 -110.6 -116.4 -122.2
EBIT 160.6 200.9 261.0 297.4 418.0 489.6 614.3 732.0 827.1 893.3 962.1 1,070.5 1,146.5 1,189.3
(-) Tax -12.8 -16.1 -20.9 -23.8 -33.4 -39.2 -49.1 -58.6 -66.2 -71.5 -77.0 -85.6 -91.7 -135.1
NOPAT 147.8 184.8 240.1 273.6 384.6 450.4 565.1 673.5 760.9 821.9 885.2 984.9 1,045.8 1054.2
(+) D&A 27.8 34.6 67.5 83.6 83.7 95.2 91.6 86.5 94.2 99.6 105.0 110.6 116.4 122.2
(-) CHG in NWC -78.2 -49.3 -90.6 -59.2 -91.4 -80.8 -101.9 -94.5 -37.7 -39.2 -40.0 -51.8 -42.4 -92.0
(-) CAPEX -108.8 -139.7 -425.8 -550.8 -285.3 -346.7 -305.6 -268.1 -247.0 -188.5 -196.1 -204.1 -211.8 -122.2
FCFF -11.4 30.4 -208.8 -252.7 91.6 118.2 249.2 397.3 570.4 693.8 754.1 839.6 916.9 962.2

SECTION 5
Risks

4.1 Risks Oveview
Risks and affected variables
From the six risks presented above, we highlight: receivables, FIES and acquisition
Receivables
Macro
FIES
Tax Incentives
Acquisitions
Management
Anhanguera’s Main Risks
Receivables
Cash position weakened
M&A capability diminished
FIES
Decrease in enrollment growth
Increase in dropouts
Acquisition
Guidance not achieved
Rise in Capex
1
2
3
Risks
Source: Insper student’s estimates
5. Risks

Disclaimers
Ownership and material conflicts of interest:
The authors, or a member of their household, of this report do not hold a financial interest in the securities of this company.
The authors, or a member of their household, of this report are not aware of the existence of any conflicts of interest that might bias
the content or publication of this report.
Receipt of compensation:
Compensation of the authors of this report is not based on investment banking revenue.
Position as an officer or director:
The authors, or a member of their household, do not serve as an officer, director or advisory board member of Anhanguera.
Market making:
The authors do not act as a market maker in shares of Anhanguera.
Rating guide:
Banks rate companies as either a BUY, HOLD or SELL. A BUY rating is given when the security is expected to deliver absolute
returns of 15% or more over the next twelve-month period, and recommends that investors take a position above the stock’s
weighting in the IBOVESPA or any other relevant index. A SELL rating is given when the security is expected to deliver negative
returns over the next twelve months, while a HOLD rating implies flat returns over the next twelve months.
Disclaimer:
The information set forth herein has been obtained or derived from sources generally available to the public and believed by the
authors to be reliable, but the authors do not make any representation or warranty, express or implied, as to its accuracy or
completeness. The information is not intended to be used as the basis of any investment decisions by any person or entity. This
information does not constitute investment advice, nor is it an offer or a solicitation of an offer to buy or sell any security. This report
should not be considered to be a recommendation by any individual affiliated with CFA Society of Brazil, CFA Institute or the CFA
Institute Research Challenge with regard to this company’s stock..