ANGRY ENTREPRENEURS: A NOTE ON NETWORKS PRONE TO CHARACTER...
36
ANGRY ENTREPRENEURS: A NOTE ON NETWORKS PRONE TO CHARACTER ASSASSINATION 1 April 2019 © Ronald S. Burt, University of Chicago and Jar-Der Luo, Tsinghua University Much attention is given to the benefits of bridging structural holes in a network, but little is given to the costs involved in building the bridge. Here we study the risk of character assassination. Bridge relations are prone to difficulty from conflicting interests, indifference, and misunderstandings. When the bridge is adjacent to a closed network, difficulty is likely to escalate into character assassination. Sympathetic gossip within the closed network encourages ego to blame bridge difficulty on the character of the person on the other side of the bridge. We propose a character assassination index, a “CA index,” measuring the extent to which a person’s network increases the odds of him or her blaming difficulty on the character of a specific colleague. The index refines aggregate closure measures used in prior research, and does well in predicting who entrepreneurs cite as their most difficult contact, and predicting which entrepreneurs blame the difficulty on the contact’s character (rather than the difficulty of the situation, or the contact’s competence). We have all suffered difficult colleagues. Some are difficult because they and we have to coordinate across contradictory understandings, or compete for scarce resources. Some are difficult simply because they are incompetent for the tasks expected of them. There are a few who are difficult because of their poor character: irresponsible, corrupt, duplicitous, self-serving individuals too often spreading malicious gossip about others to make themselves look better than they are, or to draw attention away from the certain knowledge that they did not turn out to be all that they hoped. To be sure, there are genuinely difficult people whose character deserves to be discussed to establish their 1 Ronald Burt is grateful to the University of Chicago Booth School of Business and Bocconi University for financial support during the work reported here. We are both grateful to the Jan Wallander and Tom Hedelius Foundation for the grant to Sonja Opper that funded the coding and fieldwork in China providing the data analyzed here, and to Ke Zeng and Na Zou for their work coding explanations why colleagues are difficult. This manuscript, and the network instrument (in English) are available online: http://faculty.chicagobooth.edu/ronald.burt/research.
Transcript of ANGRY ENTREPRENEURS: A NOTE ON NETWORKS PRONE TO CHARACTER...
ANGRY ENTREPRENEURS: A NOTE ON NETWORKS PRONE TO CHARACTER ASSASSINATION1 April 2019 © Ronald S. Burt, University of Chicago and Jar-Der Luo, Tsinghua University
Much attention is given to the benefits of bridging structural holes in a network, but little is given to the costs involved in building the bridge. Here we study the risk of character assassination. Bridge relations are prone to difficulty from conflicting interests, indifference, and misunderstandings. When the bridge is adjacent to a closed network, difficulty is likely to escalate into character assassination. Sympathetic gossip within the closed network encourages ego to blame bridge difficulty on the character of the person on the other side of the bridge. We propose a character assassination index, a “CA index,” measuring the extent to which a person’s network increases the odds of him or her blaming difficulty on the character of a specific colleague. The index refines aggregate closure measures used in prior research, and does well in predicting who entrepreneurs cite as their most difficult contact, and predicting which entrepreneurs blame the difficulty on the contact’s character (rather than the difficulty of the situation, or the contact’s competence).
We have all suffered difficult colleagues. Some are difficult because they and we have
to coordinate across contradictory understandings, or compete for scarce resources.
Some are difficult simply because they are incompetent for the tasks expected of them.
There are a few who are difficult because of their poor character: irresponsible, corrupt,
duplicitous, self-serving individuals too often spreading malicious gossip about others to
make themselves look better than they are, or to draw attention away from the certain
knowledge that they did not turn out to be all that they hoped. To be sure, there are
genuinely difficult people whose character deserves to be discussed to establish their
1Ronald Burt is grateful to the University of Chicago Booth School of Business and
Bocconi University for financial support during the work reported here. We are both grateful to the Jan Wallander and Tom Hedelius Foundation for the grant to Sonja Opper that funded the coding and fieldwork in China providing the data analyzed here, and to Ke Zeng and Na Zou for their work coding explanations why colleagues are difficult. This manuscript, and the network instrument (in English) are available online: http://faculty.chicagobooth.edu/ronald.burt/research.
Networks Prone to Character Assassination, Page 2
bad reputation in order to protect the innocent, and provide scarecrow warning to others
who might stray down the same path. Regardless, there is wisdom in remembering that
only a small portion of variation in colleague evaluations is agreement between raters.
Most evaluation variance can be traced to the source of the evaluation, and the specific
pair of people involved.2
This chapter is two things: First, we propose a character assassination index, a
“CA index,” that measures the extent to which the network around a person predisposes
them to blame difficulty on the character of a specific colleague. In complement to
research on brokers as a source of bad behavior (Lee, Jung & Casciaro, 2019; Lee, Lee
& Kilduff, 2019; Burt & Wang, 2019), we focus here on the source of accusations. What
is bad behavior in one situation can be perfectly acceptable in another, however,
accusations of bad behavior, and attributing the bad behavior to poor character, are
especially likely in certain network locations. The general idea for this chapter is that
interpersonal difficulty is more likely with people outside one’s own group, and the more
cohesive the group, the more likely that sympathetic gossip within the group amplifies
difficulty into character assassination. Opinion amplified in closed networks is familiar in
network analysis (Festinger, Schachter & Back, 1950; Coleman, 1957; Friedkin, 1999;
Burt, 2005; Baldassarri & Bearman, 2007), with implications for social control
(Bergemann, 2017, 2019). Our goal in this chapter is to refine the closure argument to a
more precise network prediction of who is prone to assassinating colleague character,
and who is most likely to be targeted.
Second, the chapter is part of a broader effort to compare and contrast network
mechanisms in Chinese and Western business. The research focus to date has been
on positive correlates of networks. Achievement in East and West increases with
2For example, analysis of variance in colleague evaluations among investment bankers
shows that 25% of the variance is due to differences in standard of evaluation (some colleagues give high evaluations on average, some give low), and 62% of the variance is unique to the pair of colleagues rating one another (Burt, 2001:47). Only 13% of the evaluation variance is agreement between people rating a colleague. The 13% can be useful to guide compensation and promotion decisions, but the point remains that the bulk of evaluation variance, 87%, is due to variables other than colleague agreement about the person evaluated (see Kenny & Albright 1987:399, for a similar result with relations between college students).
Networks Prone to Character Assassination, Page 3
access to structural holes (Batjargal et al., 2013; Burt, 2019a; Burt & Burzynska, 2017;
Burt & Opper, 2017). Associations between trust and network closure are similar,
allowing for Chinese guanxi relations, which turn out to have an analogue in the
networks around Western business managers (Burt & Batjargal, 2019; Burt &
Burzynska, 2017; Burt, Bian & Opper, 2018). With this chapter, we add to the
comparison a negative correlate of networks: the character assassination associated
with closed networks in the West is also apparent in the East.
DATA We have data on the networks around 700 Chinese entrepreneurs whose businesses
are a stratified random sample of private enterprises in three provinces surrounding the
Yangtze River Delta: China’s financial center, Shanghai, with Nanjing the capital of
Jiangsu Province to the north, and Hangzhou the capital of Zhejiang Province to the
south. The three provinces account in 2013 for 20.2% of China’s gross domestic
product, and 31.9% of China’s imports and exports. The sample businesses were
founded around the turn of the century on average (Nee & Opper, 2012: Chap. 2, and
Bian, 2019: Chap. 4, provides succinct overview of business foundings in the recent
history of the Chinese economy). Two thirds (65%) of the founders paid all start-up
costs with their own money. Most of the other third were primary investors (29% of
founders paid less than all of their start-up costs, but they paid an average of 58%).
Only 6% of founders used none of their own money for the start-up (for these few, 65%
of start-up costs were covered by bank loans).
Network Data The 2012 survey included a network instrument composed of name generator and
name interpreter items. Such items are routine in survey network research (Marsden,
2011), familiar in network surveys of management populations (Burt, 2010:281ff.), and
have precedent in China (Ruan, 1998, the 2003 Chinese General Social Survey, Bian &
Li, 2012; Xiao & Tsui, 2007; Batjargal et al., 2013). The survey instrument and interview
materials are available in the original English (see acknowledgement note). Our name
generators asked for (a) people most valuable to the respondent’s business this year,
Networks Prone to Character Assassination, Page 4
(b) the most valuable employee in the business this year, and (c) the person most
difficult to deal with in the respondent’s business this year. To stretch the network data
back in time, we also asked about contacts associated with up to five significant events
since the firm’s founding. Cited events include replacing a lost supplier, getting a big
contract, raising money for equipment purchase, introducing new production
technology, getting preferential land or tax treatment, managing a quality-control
disaster (Burt & Opper, 2017:505). Contacts cited in association with significant events
we reference as “event contacts.”
Name interpreter items elicited information on the kind and strength of relations
with and among the cited contacts. Respondents were asked to indicate which of
multiple roles are played by each contact (immediate family, extended family, childhood
friend, classmate, colleague, co-member of a business association, military, party). We
measured relation strength in terms of emotional closeness, duration, frequency, and
trust. To scale relations, we asked respondents whether their relation with each contact
was “especially close,” “close,” “less close,” or “distant,” and asked them to describe
whether the connection between each named contact was “especially close, “distant,” or
something in between (“neither distant nor especially close,” see Burt & Burzynska,
2017:256, for scaling). Duration was measured by asking: “How long have you known
each person?” (years). Frequency was measured by asking: “On average, how often do
you talk to each person?” (daily, weekly, monthly, less often). Event contacts are cited
in association with the history of the business, so it could seem reasonable to discuss
them as contacts from an entrepreneur’s past, but more than half of them are currently
met daily.
——— Insert Figure 1 About Here ———
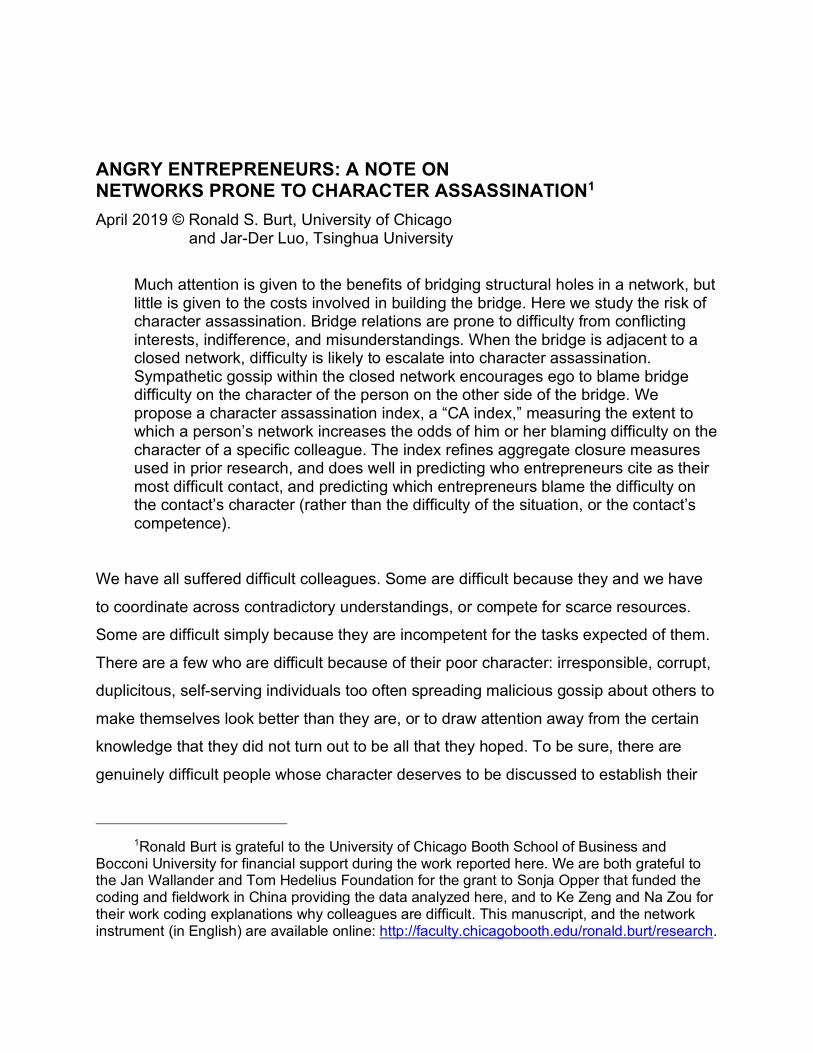
Figure 1 displays the recorded network around one of the 700 survey respondents.
The respondent’s business was founded 16 years ago, and had grown to 62 employees
by the time of the survey. The respondent named six contacts, largely interconnected by
close relations (thin lines), with a few especially close relations (heavy lines). Two
contacts are close together in the figure to the extent that the relation between them is
strong, and their relations with others are similar (spring embedding, Borgatti, 2002).
Networks Prone to Character Assassination, Page 5
The figure contains brief text descriptions for each contact, illustrating the richness of
the network data. The Figure 1 network is about average in size (average size is 6.38
contacts), but less densely connected than average (average connection between cited
contacts is .469, versus .337 in Figure 1).
Difficult Colleague and Blame We are interested in the black-dot colleague to the lower right in Figure 1 — the person
named as most difficult by the respondent. Here is the name generator: “In contrast to
people who help and are valued in your business activities, there are usually some
people who make life difficult. Without mentioning the person's name, who was the most
difficult person to deal with in your business activities this year? Just jot a name or
initials in the box below. Only you are going to know who this person is.” The interview
was conducted such that confidentiality was assured, with the respondent taking from
the interview the only written copy of the names elicited in the survey. Respondents
were asked to name one “most difficult” contact, and each respondent named one, so
there are 700 difficult contacts in the data (of 4,464 contacts in total). Of the difficult
contacts, 22 were named on another name generator as valuable, 12 were named as
most valued during a significant event, and the majority (66%) are connected with one
or more of the respondent’s other cited contacts.
After the respondent named a most difficult colleague, the follow-up question
asked what the colleague did to warrant being named most difficult: “In what way did
this person make things difficult for your business activities this year?” Personal
character is the explanation in Figure 1. The cited difficult colleague was “drunk on night
duty during a significant theft from the factory.” A wide variety of explanations are
offered for citing colleagues as most difficult. Table 1 contains example explanations
sorted by the categories into which the explanations were assigned by two Mainland
Chinese research assistants. The column distinction in Table 1 is between difficulty
inside and outside the business. Internal difficulty involves accidents, quality control,
difficulty hanging on to employees, theft, misuse of authority, etc. External difficulty
involves problems with suppliers, customers, competitors, the government, or market
conditions in general. We wondered whether difficulty outside the business would be
Networks Prone to Character Assassination, Page 6
particularly prone to character assassination since the source is further removed from
the respondent and his or her central colleagues. The distinction between internal and
external is reliable: The two coders make the same assignment for 94.9% of responses.
A senior professor in the project resolved the cases in which the coders disagreed. We
get similar results with either coder’s data.
——— Insert Table 1 About Here ———
Row distinctions in Table 1 concern blame. In an effort to replicate findings from a
previous analysis of character assassination among American senior managers and
staff officers (Burt, 1999; 2005:188-196), coders were asked to distinguish explanations
that blame difficulty on the situation (no characteristics of person, but situation difficulty
is mentioned; e.g., sales difficult, plant leaks, poor raw supplies, weather, peer
competition, supply prices increasing too quickly), a colleague’s incompetence (no
mention of character, but incompetence is mentioned; e.g., could not do his job,
improper storage, poor quality product, severe quality accident), or a colleague’s
character (respondent mentions something about ethics, honesty, trust; e.g.,
irresponsible, malicious incident, theft, copy company products, default on payments,
spread rumors, leaked company information, former employee stole customers). Coding
the explanations was challenging because the Chinese explanations were more
discrete than the American explanations studied earlier. The examples in Table 1 are
among the most clear and direct explanations offered by the Chinese respondents, but
they pale in comparison to the character explanations offered by Americans, some
examples of which are given in the first column of the table.
Explanations blaming colleague character were the most reliably distinguished.
The two coders agreed 85% of the time. There is less agreement on explanations
blaming colleague competence (53% agreement), or explanations blaming situational
factors (34% agreement). In Table 1, for example, there is a subtle difference between
the explanations “plant roof suffered a typhoon” and “warehouse accident damaged raw
material.” The first is coded a “difficult situation” explanation. It was unclear how the
person cited was responsible for the damaged roof. The second explanation is coded as
a “competence” explanation because the person cited was blamed for failing to secure
Networks Prone to Character Assassination, Page 7
the warehouse against a coming typhoon. We focus on the reliable distinction between
explanations blaming a person’s character versus other explanations. We relied on a
senior Chinese professor to adjudicate coding where the coders disagree, and replicate
our results with each coder’s data.
THEORY The behavior to be explained is a person, ego, citing someone as a source of difficulty,
and blaming the difficulty on the cited person’s character. This is what we mean by
character assassination: ego verbally blames ego difficulty on alter’s character. If not for
alter’s poor character, I would not be suffering the difficulty. The problem is not ego and
alter having to deal with a situation that any two people would find difficult. The problem
is not alter’s emotional, physical, or intellectual incompetence for the task at hand. The
problem is alter’s personal character.
The immediate question is whether alter deserves to be blamed. For the purposes
here, we assume that no one deserves to have their character assassinated. Stating the
assumption more modestly, but to similar effect, we leave the question of who deserves
character assassination to others. Of course there is extreme behavior that warrants
derision, but so much of what we see derided in the workplace seems modest in
comparison. We see character assassination most often socially motivated (as
discussed below), and, as many have observed, what passes for reasonable behavior
in one group can be abhorred in another (e.g., Erikson’s, 1966, empirical work with
Durkheim’s classic argument, see esp. pages 4 and 26 in Erikson’s book).
We also put aside, for the purposes here, variation in ego’s tendency to engage in
character assassination. There are unpleasant people whose insecurities or
aggressions lead them to too often impugn the character of colleagues, as there are
individuals who abstemiously refrain from such behavior. Most people, however, seem
to be of moderate temperament ready to praise worthy colleagues, and deride the
unworthy.
How does the social situation encourage ego to deride alter’s character? Even the
innocent can face difficulty in certain situations, and that difficulty can fester into

Networks Prone to Character Assassination, Page 8
character assassination. Truth can be elusive in the cacophony of what ego believes others think, and what ego believes they believe ego thinks (Moldoveanu & Baum, 2014). This is not claim that people are entirely a social construction. It is likely that
certain personalities are prone to character assassination, as certain personalities are
likely targets of character assassination. We share Tasselli, Kilduff & Menges’ (2015)
perspective on the network-person duality: opinions and behaviors are shaped by social
context at the same time that social context is shaped by individuals pursuing their
interests. Such is the essence of classical social psychology.
As an analytical strategy, however, we begin with social context. We believe that
we can get a solid research handle on the way in which the network structure of a social
situation encourage character assassination, which is a position from which to study
kinds of people who rise above, or fall prey to, the situational inducements with which
they are presented.
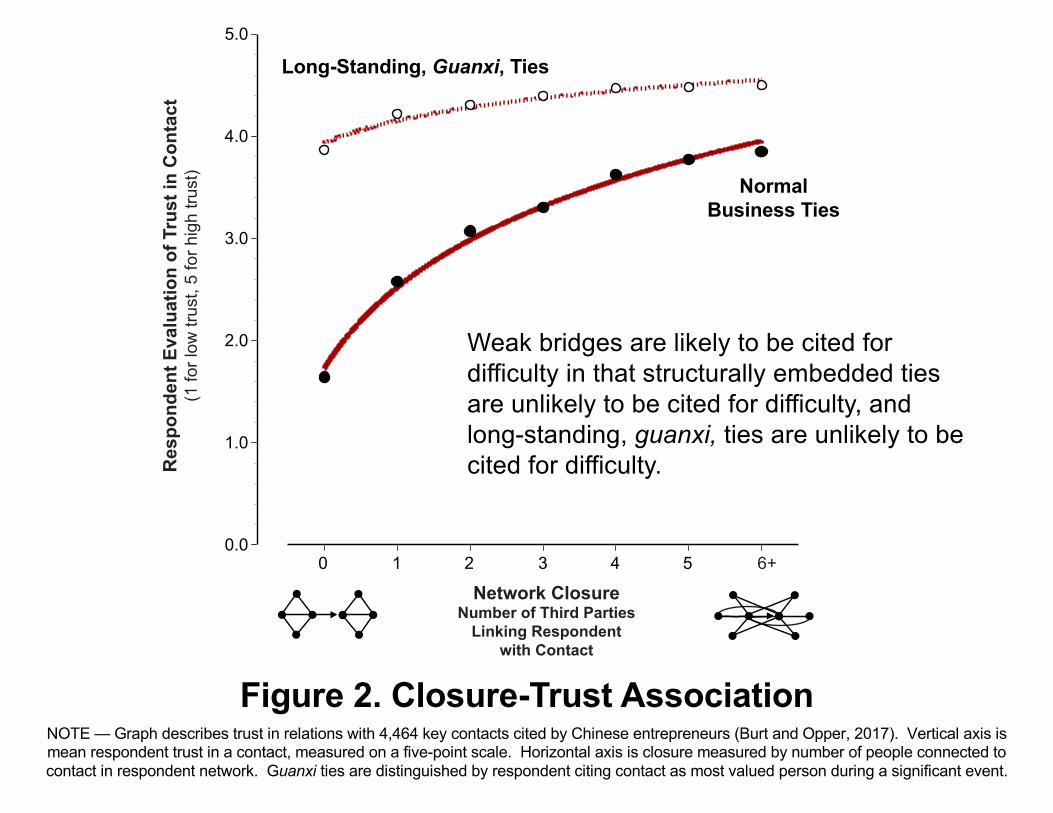
Weak Bridges Figure 2 illustrates the association in theory between trust and network closure. The
specific curves are taken from analysis elsewhere (Burt & Opper, 2017: 515; Burt et al.,
2018:14). The unit of analysis is a relationship. The vertical axis is a measure of trust
within the relationship, used here as a reverse indicator of negative sentiment. The two
lines in Figure 2 show trust increasing across the horizontal axis, on which relations are
distinguished by the extent to which they are embedded in a network of mutual
contacts. The more mutual friends two people have, the more closed the network
around their relationship, and the more likely the two people are members of the same
group. When two people have no mutual friends, their relationship is a bridge between
their respective groups, illustrated by the diagram below the zero point on the horizontal
axis. Separate groups increase the likelihood of contradictory opinion or behavior
between the connected people. Contradictory opinion and behavior have more
opportunity to arise within groups because of more frequent interaction within groups,
but mutual friends within the group mollify ego anger toward alter by offering pre-
emptory explanations such as: “I’m sure he didn’t mean to offend,” or “I know he was

Networks Prone to Character Assassination, Page 9
having a bad day,” or “He probably regrets his behavior.” More, offensive contradiction
is less likely within group than between groups. A first principle of social capital is that
mutual friends facilitate trust by creating a reputation cost for disruptive opinion and
behavior. Connected people within a closed network are aware of one another’s
behavior, which is carried through time in shared stories about one another, so people
are careful to behave appropriately to avoid negative stories, which makes them more
trustworthy than outsiders, who are presumed to be less concerned about their in-group
reputation. This is an imagery widely circulated in the social sciences (Granovetter,
1985, and Coleman, 1988, sociology; Greif, 1989, in economics; Bernstein, 1992;
Ellickson, 1991, in law; Putnam, 1993, in political science; Burt, 2005:Chps 3-4, for
review).
The solid line in Figure 2 is often found in the networks around Western managers.
Trust increases quickly with the first few mutual contacts, then less quickly with
additional ones (Burt, 2005: Chps. 3-4, for review). The solid line also describes in the
aggregate the closure-trust association for business relations in China (Burt &
Burzynska, 2017:234; Burt & Opper, 2017:514-519; Burt et al., 2018).
——— Figure 2 About Here ———
A further consideration is the strength of a relationship. The dashed line in Figure
2 describes relationships that have survived significant events over a long period of time
so they do not require support from mutual friends. Once you really get to know and
trust someone, you give the trusted person the benefit of the doubt when difficulty
arises. In contrast, one jumps easily to negative conclusions when interpreting difficulty
with a distrusted person. Burt & Burzynska (2017) distinguish the strong ties at the top
of Figure 2 by their Chinese label as guanxi ties. About one in ten relations correspond
to such guanxi ties for the Western bankers Burt & Burzynska analyze, and tend to
occur between people in continuous contact for more than two years. Guanxi ties are
more numerous in the Chinese networks, numbering two out of three contacts, and tend
to be long-standing relationships with people helpful during a significant event in the
respondent’s business (see Burt & Batjargal, 2019, for discussion of the comparative
analysis).
Networks Prone to Character Assassination, Page 10
Combining bridge and strength considerations, our first point is that being cited as
a difficult colleague is most likely in a weak bridge relationship. As illustrated by
Labianca, Brass & Gray (1998) using data on employees in a North American university
health center, negative interpersonal sentiment is more likely in a weak relationship than
a strong one, and all the more so when the weak relationship is a bridge.3 In network
terms, the weak-bridge predictor associates interpersonal difficulty with low structural
and relational embedding (Granovetter, 1992). Structural embedding refers to having
mutual friends. Relational embedding refers to a relationship today embedded in its
history; a long, positive history for the guanxi ties in Figure 2. Weak relations are more
likely within groups than between groups (friends of friends, Burt, 1992:25-30), but
relations that bridge the structural holes between groups are likely to be weak rather
than strong (Granovetter, 1973). A relationship that is structurally embedded is likely to
be relationally embedded, which coordinates the two network conditions in our weak-
bridge predictor. The two conditions are evident in the Figure 1 example network. The
black-dot contact is cited for difficulty, which was blamed on the cited person’s poor
character. Consistent with our argument, the respondent has a weak relationship with
the difficult person (low relational embedding) and most of the respondent’s other
contacts have no relationship with the difficult person (low structural embedding).
For less abstract illustration, imagine an American running our company’s U.S.
operations, and you are German, running our company’s E.U. operations. The less
often you and the American talk with one another (low relational embedding), or the
more recently you and he became acquainted (low relational embedding), and the more
often you and he work with different people in your respective groups (low structural
embedding), the more likely you will misunderstand one another — opinion and
3We see recent corroboration in Tasselli & Kilduff's (2018) evidence of variable trust within
cliques of students and hospital employees. Tasselli & Kilduff exclude weak and strong bridge relations from their analysis, but show that trust is significantly lower toward clique members who have strong connections outside the clique ("brokers" in their analysis), especially if the broker to the outside is outspoken ("blirtatious" in their analysis). They report a statistically significant -5.5 test statistic for their study students (Table 3, Model 4), and -3.6 test statistic for hospital employees in their study (Table 4, Model 5).
Networks Prone to Character Assassination, Page 11
behavior familiar to an American working in the U.S. can differ from opinion and
behavior familiar to a German working in the E.U. If the two of you meet socially over a
drink, your different understandings can be humorous, entertaining. However, if you and
he are trying to coordinate your respective operations, recurring miscommunication can
quickly become irritating.
Adjacent Closure There is more in Figure 2 than the absence of structural embedding around the bridge
to the person cited as difficult. Structural embedding is significant for where it is, as well
as for where it is not. The respondent’s other contacts are largely interconnected with
each other, providing a closed network around the respondent, a closed network that
excludes the person cited as most difficult. Supportive gossip within the closed network
can be expected to give the respondent an exaggerated sense of the difficult person’s
culpability. When the respondent tells his friends about the night guard who was drunk
on the job when a major theft occurred, his friends share sympathetic stories about the
irresponsibility of such employees. “I had employee just like that. I fired him on the spot,
but I’m still recovering from the damage done.” The function of the stories is to display
empathy, letting the respondent know he is not alone. Deepening their social support,
friends in the closed network embellish the stories about such drunks, shading
ambiguous behavior into malignant intent. Over time, the repeated stories create a
shared feeling of having had more experience than has actually occurred, amplifying
negative opinion of the drunk employee, justifying angry rhetoric deriding the
employee’s character (Burt, 1999; 2005:188-196). In sum, a weak bridge relationship
adjacent to a closed network is prone to difficulty blamed on the other’s character.
Figure 3 illustrates the argument. Consider colleague opinions of the network
broker. Network brokers are people disproportionately involved in bridge relations. The
broker in Figure 3 is a “T-shaped” manager — nestled in a closed group of colleagues
A, B, and C, with bridge ties to colleagues D, E, and F in other groups (Hansen & von
Oetinger, 2001). Exposure to opinion and behavior in other groups provides the broker
with information breadth, timing and arbitrage advantages associated with creativity,
innovation, and achievement (the imagery emerged primarily in sociology via
Networks Prone to Character Assassination, Page 12
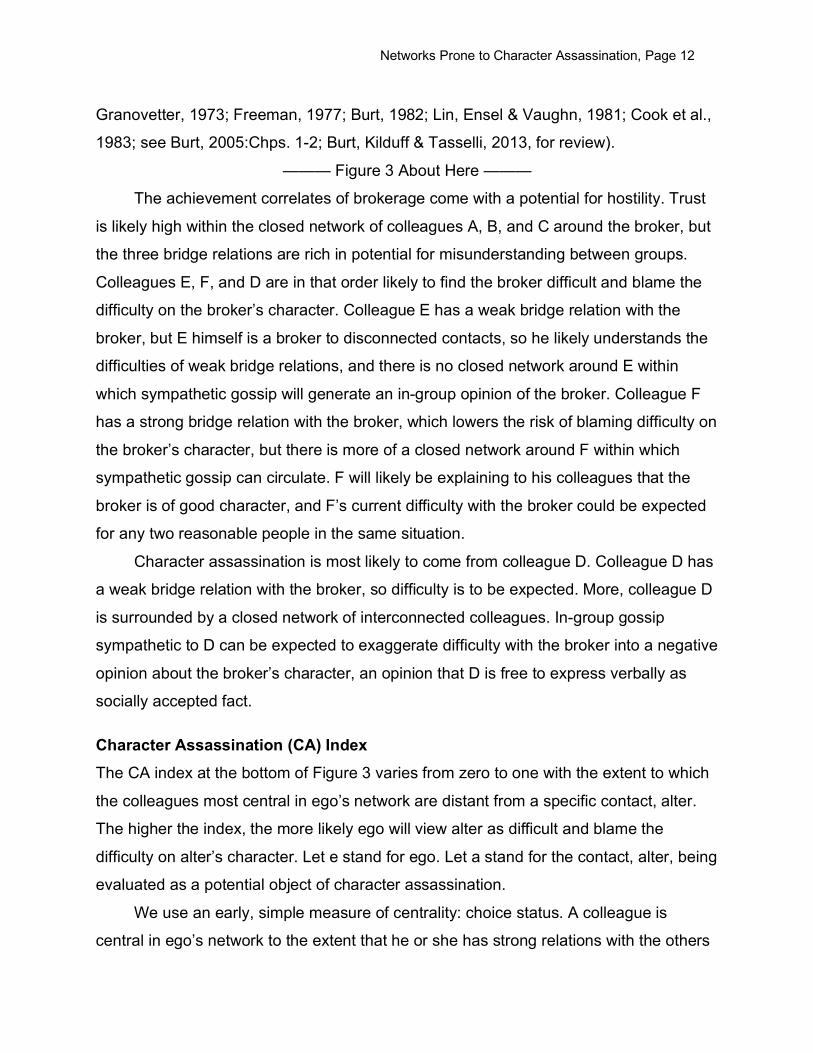
Granovetter, 1973; Freeman, 1977; Burt, 1982; Lin, Ensel & Vaughn, 1981; Cook et al.,
1983; see Burt, 2005:Chps. 1-2; Burt, Kilduff & Tasselli, 2013, for review).
——— Figure 3 About Here ———
The achievement correlates of brokerage come with a potential for hostility. Trust
is likely high within the closed network of colleagues A, B, and C around the broker, but
the three bridge relations are rich in potential for misunderstanding between groups.
Colleagues E, F, and D are in that order likely to find the broker difficult and blame the
difficulty on the broker’s character. Colleague E has a weak bridge relation with the
broker, but E himself is a broker to disconnected contacts, so he likely understands the
difficulties of weak bridge relations, and there is no closed network around E within
which sympathetic gossip will generate an in-group opinion of the broker. Colleague F
has a strong bridge relation with the broker, which lowers the risk of blaming difficulty on
the broker’s character, but there is more of a closed network around F within which
sympathetic gossip can circulate. F will likely be explaining to his colleagues that the
broker is of good character, and F’s current difficulty with the broker could be expected
for any two reasonable people in the same situation.
Character assassination is most likely to come from colleague D. Colleague D has
a weak bridge relation with the broker, so difficulty is to be expected. More, colleague D
is surrounded by a closed network of interconnected colleagues. In-group gossip
sympathetic to D can be expected to exaggerate difficulty with the broker into a negative
opinion about the broker’s character, an opinion that D is free to express verbally as
socially accepted fact.
Character Assassination (CA) Index The CA index at the bottom of Figure 3 varies from zero to one with the extent to which
the colleagues most central in ego’s network are distant from a specific contact, alter.
The higher the index, the more likely ego will view alter as difficult and blame the
difficulty on alter’s character. Let e stand for ego. Let a stand for the contact, alter, being
evaluated as a potential object of character assassination.
We use an early, simple measure of centrality: choice status. A colleague is
central in ego’s network to the extent that he or she has strong relations with the others

Networks Prone to Character Assassination, Page 13
in the network. With respect to gossip about alter in particular, colleague j is central in
ego’s network to the extent that he or she has strong relations with everyone in the
network excluding alter and colleague j himself: (∑k zkj) / N-2, k ≠ a, j, where zkj is the
strength of relation between k and j (0 ≤ zjk ≤ 1), and N is the number of people in ego’s
network, including ego (N is 5 for colleague D in Figure 3).
The CA index combines the centrality scores for ego’s colleagues j. First, the raw
sum of centrality scores, weighted by the lack of connection between colleague j and
alter, 1 – zja, varies from zero to N-1 with the extent to which ego and his close
colleagues are distant from alter. Second, dividing the sum by its maximum, N-1,
creates the CA index that varies from zero to one. The index is zero when all of ego’s
contacts are strongly interconnected. The index reaches its maximum of one when ego
has a weak bridge relation to alter and the strongly interconnected colleagues around
ego have no connection with alter.
Figure 1 contains CA index scores for each of the respondent’s six contacts. The
maximum score is for contact six, who indeed was the person cited as difficult, and the
difficulty was attributed to the person’s character.
Figure 3 shifts the frame of reference to take each contact as ego. The figure
contains index scores for each of a hypothetical broker’s colleagues blaming difficulty
on the broker’s character. Individual colleagues know only their portion of the broker’s
network, so the whole network is not the frame of reference for colleague evaluations.
The frame of reference for each colleague’s opinion and behavior is the network around
that colleague. Taking colleagues A, B, or C as ego, blaming difficulty on the broker’s
character is unlikely because of strong, embedded connections with the broker. CA
index scores are zero for colleagues A, B, and C. Blame is more likely from colleague E,
still more likely from F, and most likely from colleague D, as discussed above.
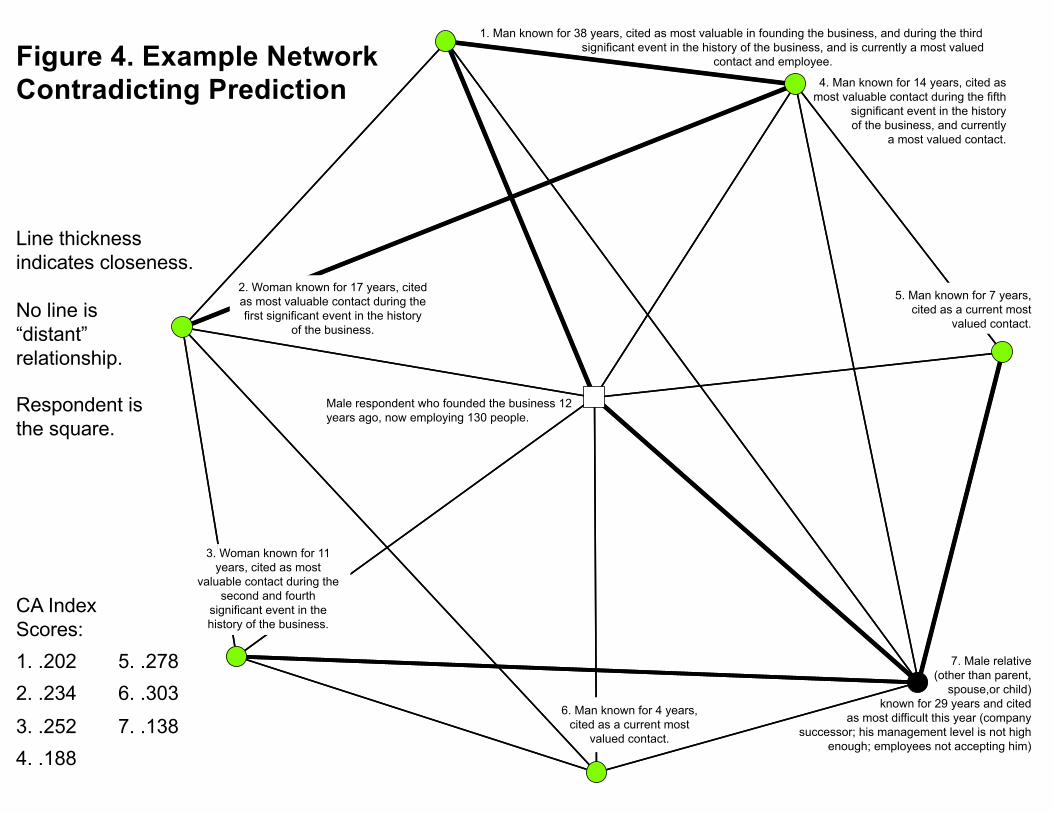
Figure 4 contains CA index scores for an example Chinese entrepreneur whose
survey response is less well predicted. The person cited for difficulty is a member of the
respondent’s family (black dot in lower-right corner of Figure 4). The cited person has
good connections with the respondent’s other contacts, so the CA index for the cited
person is lower than for any other contact, in contrast to expectations. The index does

Networks Prone to Character Assassination, Page 14
better predicting blame. The difficulty is that the cited person is scheduled to take over
the company, but he is not perceived by employees as having the skill to run the
company (according to the respondent). This is coded as a competence explanation by
both coders, so the low CA index score is correct in predicting that the difficulty is not
blamed on the cited person’s character. The example highlights the importance of
holding constant role relations, such as family, when studying correlates of the CA
index.
——— Figure 4 About Here ———
While we believe that the network conditions prone to character assassination
increase the likelihood of ego spreading stories deriding alter’s character, we are not
asserting a causal effect. Our concern is to establish a correlation between the CA
index and character assassination. A great many behaviors could result in the expected
correlation. Ego could be in conflict with alter, repeating negative stories about alter to
recruit colleagues to ego’s position (Coleman, 1957). Ego could be pandering to higher
authority encouraging denunciations (Bergemann, 2017, 2019; Pontikes, Negro & Rao,
2010; Volk & Beeman, 1998). Ego’s colleagues could be pulling away from alter in
response to community-building negative stories they have heard and circulated about
alter (Erikson, 1966:Chp. 1; Pontikes et al., 2010). Regardless of how the network
around ego came about, the end result should be positive correlation between the CA
index and declarations of difficulty with alter, and denunciations of alter’s poor
character.
Relation to Earlier Work Burt & Knez (1995) showed for managers in Europe and North America that closed
networks are associated with amplified positive and negative feelings toward colleagues
(also Burt, 1999; 2005:188ff.). The goal was to identify networks around people likely to
engage in character assassination. An inaccuracy in the work is that two contradictory
forces are combined, potentially obscuring one another. Closure around ego’s
relationship with a difficult colleague can inhibit blame on the colleague’s character.
Closure around ego more generally is likely to encourage such blame through ego-
sympathetic gossip. We here disaggregate the two components. The measure we
Networks Prone to Character Assassination, Page 15
propose is that ego in a closed network that excludes alter is surrounded by
sympathetic gossip about alter, so that difficulties associated with a weak bridge relation
to alter are likely to be amplified into blaming alter's character. Instead of casting ego as
a person more or less likely to engage in character assassination, we end up with a CA
index score for each of ego’s contacts that indicates the likelihood ego will blame
difficulty with the contact on contact character.
The proposed index preserves blame asymmetry from earlier work. Blame is not
inherent in a relationship. Difficulty is likely in a weak bridge relation, but blame is an
interpretation of the difficulty. Either person connected by the relationship, or an
observing third party, is free to interpret the difficulty in a way that suits their interests.
Interpretations need not be symmetric between the people involved, or observers
opining. In Figure 3, for example, the index for colleague D blaming difficulty on the
broker’s character is a high .875, but the index for the broker blaming difficulty on
colleague D is less than half that (.425). D lives in a single closed group within which the
broker is socially interpreted. The broker also lives in a closed group of his colleagues
A, B, and C, but beyond that, he is connected to colleagues E and F in other groups.
Colleagues E and F are separate sources of opinion, which undercuts the monopoly the
broker’s group would otherwise have on broker exposure to sympathetic, inflammatory,
in-group gossip about colleague D.
RESULTS The CA index has strong associations with who gets cited as most difficult, and which
respondents blame difficulty on the cited person’s character. Across 4,464 people cited
as contacts, Figure 5A shows how the probability of being cited as difficult increases
with the CA index (21.49 logistic test statistic with respondent fixed effects). Across 700
respondents interpreting the difficulty, Figure 5B shows how the probability of blaming
the difficulty on the cited person’s character increases systematically with increasing CA
index scores. One of the coders sees character blamed more often (54% of
respondents blame character according to Coder 1, 66% according to Coder 2).
However, the data from either coder show a strong positive association between the CA
Networks Prone to Character Assassination, Page 16
index and character blame (logistic test statistics of 8.53 and 6.20). The solid dots in
Figure 5B pool the two coders. The coders agreed in their coding of 594 explanations. A
senior professor in the project read the original explanations to adjudicate between
conflicting codes on the other 106 explanations to produce a single coding across the
coders. We use the pooled coding for our tests, but all three codings of the explanations
have strong, positive associations with the CA index.
——— Insert Figure 5 About Here ———
Who Gets Cited for Difficulty Each respondent could name multiple contacts, but only one “most difficult” contact, so
the probability that a contact is cited as difficult decreases with the number of contacts
named. We hold network size and other respondent differences constant with
respondent fixed effects to estimate associations within networks.
Three points are illustrated in Table 2. First, the kinds of relations so often
mentioned as sources of business contacts in China are largely irrelevant here. This is a
point highlighted in analyses of who the entrepreneurs trust (Burt & Burzynska, 2017;
Burt & Opper, 2017; Burt et al., 2018), so it is not surprising to see it repeated here for
character assassination. Respondents were asked to indicate which of a variety of roles
applied to their cited contacts. A contact could be a childhood friend, a classmate, a
member with the respondent in the same business association, a member of the
respondent’s family (nuclear and extended are combined here given low frequencies), a
neighbor, or someone known from the military, or the Communist Party. Childhood
friends and contacts known from the military were never cited as most difficult, so they
are not in the Table 2 predictions. The primary sources for difficult contacts are people
met in local and industry business associations (4.05 logit test statistic), and people
beyond the seven roles distinguished in the table (2.40 test statistic). Covariation with
role differences are accounted for by network variables. With the network variables
added in Models B and C, the roles have no association with being cited as difficult.4
4Given the importance of gender to relations in China, we also checked for gender
homophily effects. Merluzzi (2017) reports that women are more likely to cite other women as
Networks Prone to Character Assassination, Page 17
——— Insert Table 2 About Here ———
Second, Model B shows that weak bridges are likely to be cited as difficult, as
expected. With respect to strong relations, event contacts (guanxi ties) are rarely cited
as difficult (-12.17 logistic test statistic in Model B, 12 event contacts among 700 people
cited as difficult). These are people cited by the respondent for their valued help during
one or more significant events in the history of the business. On a related dimension of
strength, event contacts tend to be people known for a long time (Burt et al., 2018:17),
and Model B shows that event and nonevent contacts known for many years are
unlikely to be cited as difficult (-6.10 test statistic). Finally, the people cited as difficult
tend to have a bridge relationship with the respondent (9.80 test statistic). The bridge
measure in Table 2 is a dummy variable equal to one if contact and respondent have no
mutual friends within the respondent’s network. We get the same result if we measure
bridge continuously, by the log number of mutual contacts as displayed in Figure 2 (-
12.47 test statistic).5 their most difficult colleague. As in Merluzzi's data, the Chinese entrepreneurs could name one difficult colleague. As in Merluzzi's results, women are less likely to be named as the difficult colleague: Merluzzi (2017:Table 1) reports 33 of 107 difficult colleagues are women, and we find 82 women among the 700 cited difficult colleagues. In contrast to Merluzzi's results, however, we find no gender difference in naming women as difficult. We added to Model C in Table 2 a dummy variable distinguishing contacts who are female and a dummy variable indicating that respondent and contact are female. The first has a strong negative association (-3.73 test statistic), measuring the tendency for women to be less often cited as difficult. The second has no association (0.76 test statistic), showing no tendency for women to cite other women as difficult. Looking ahead, gender is irrelevant to blaming difficulty on the contact's character (2.12 chi-square, 2 d.f., P ~ .35 for gender homophily and contact gender variables added to Model B in Table 3). We cannot rule out the possibility that women are more supportive of other women in China, but that is not our impression (see Burt, 2019b). We wait to see in future work whether women are more or less likely to cite other women as their most difficult contact.
5We checked for respondent perceptions biased by presumptions of loyalty. Our data on connections between contacts come from the respondent’s perceptions. It would be natural for a respondent to believe that his closest contacts also find difficult the person that the respondent cites as most difficult – regardless of the contact’s actual opinion of the person difficult for the respondent. It would be natural because of cognitive consistency (my enemies are enemies to by friends) and because of etiquette (my friends share stories they believe to be consistent with their understanding of my views). We tested for this bias as follows: Let alter be the colleague cited as most difficult. Let colleague j be a contact cited for any reason other than most difficult. The relation between colleague j and alter should be weak — if respondents are biased by friends who are loyal — to the extent that the relation is strong between colleague j and the respondent. We predicted the strength of the alter relation with colleague j using closure around
Networks Prone to Character Assassination, Page 18
The third point illustrated in Table 2 is the strength of the CA index in predicting
who gets cited for difficulty. Model C shows that the bridge distinction is not significant
when the CA index is added to the prediction (-0.08 test statistic), and years known
becomes marginally significant (2.04 test statistic). The two primary predictors of who
gets cited as difficult are the CA index (11.67 test statistic) and an adjustment for the
low odds of citing a guanxi tie as difficult (-10.98 test statistic).
Who Blames Difficulty on the Other’s Character? Three points are illustrated in Table 3. First, the CA index is the strongest predictor of
character blame. The higher the CA index for a person cited as difficult, the more likely
difficulty is blamed on the person’s character (6.37 logit test statistic). The index
association with blaming character differs when the dependent variable in Table 3 is
replaced with either coder’s interpretation of respondent explanations, but the
association remains strong and positive (5.80 test statistic for Coder 1 in Figure 5B,
7.14 for Coder 2).6
——— Insert Table 3 About Here ———
the respondent’s relationship with colleague j (number of mutual contacts), and the years for which respondent and colleague j have known one another. There is no association with either when we estimate using fixed effects to remove respondent differences in networks (respective t-tests of -0.26 and 0.48). Within the average respondent’s network, in sum, there is no systematic tendency for the respondent’s closest colleagues to be distant from the person the respondent cites as most difficult.
6Respondents are the sampling unit for the survey, so we estimate results in Table 2 using respondent fixed effects, and results in Table 3 treating as a respondent variable the tendency to blame difficulty on the other’s character. However, only one contact is at risk of character assassination in our data – the one cited as most difficult, so an alternative view would be to treat the difficulty citation as a selection bias. It is reassuring to know that we also get the Table 3 results if we predict character blame with a Heckman correction for who gets cited as difficult. Our selection equation is Model C in Table 2 excluding the CA index. Our prediction equation contingent on selection is then Model B in Table 3, excluding the variables in the selection equation and estimated across 4,464 dyads with the binary dependent variable equal to 1 if difficulty was blamed on the contact’s character. As in Table 3, the CA index is the variable most strongly associated with blaming difficulty on the other’s character (7.12 test statistic), with happy respondents less likely to blame character (-2.14 test statistic), and blame independent of the difficulty being outside the respondent’s firm or having a large, prevalent family (respectively 0.23 and 1.30 test statistics). The index association with blaming character remains strong and positive if the pooled coding is replaced by either coder’s coding (6.60 test statistic for Coder 1 in Figure 5B, 8.02 for Coder 2).
Networks Prone to Character Assassination, Page 19
Second, only one of the control variables in the table matters when the CA index is
held constant (Model B). We do not have an exhaustive set of controls, but we have
controls expected to matter. From Table 1, there is a control for whether the cited
difficulty originates inside or outside the respondent’s firm. We expected respondents to
more easily blame difficulty on the character of a difficult person outside the firm, which
turned out to be true, but only before the CA index is held constant (2.14 test statistic in
Model A, 0.14 in Model B). From Table 2, we added two statistically significant
predictors of who gets cited for difficulty, but both are statistically negligible when the
CA index is held constant. In Model A, difficulty is slightly less likely to be blamed on
character if the person cited as difficult is an event contact (a person who was
especially valuable to the respondent during an earlier significant business event), and
respondents are less likely to blame difficulty on the character of a person they have
known for a long time. With the CA index held constant in Model B, neither condition is
relevant to character attributions.
——— Insert Figure 6 About Here ———
We also added two controls from an analysis elsewhere of trust by the Chinese
entrepreneurs. In a search through business, demographic, political, and emotional
respondent differences argued to affect trust, Burt et al. (2018) find two respondent
differences with statistically significant trust associations after network structure is held
constant.
People who feel happy and healthy are more likely to distinguish the high trust
characteristic of guanxi ties. We use the happiness indicator here. Respondents were
asked: “Considering all aspects of your life, how happy would you say you are, on the
whole?” Responses were on a five-point scale but few people were extremely unhappy,
so the Table 3 differences in respondent happiness are a contrast between three
categories: 1 for very happy, 0 for happy, and -1 for less than happy. As happy people
are more likely to distinguish guanxi ties, Figure 6A shows that they are less likely to
blame difficulty on the other’s character. Model A in Table 3 shows that the tendency
remains statistically significant when other controls are introduced (-2.35 test statistic),
and the tendency is the only control variable that remains significant when the CA index
Networks Prone to Character Assassination, Page 20
is held constant (-2.12 test statistic in Model B) — bearing in mind that the tendency for
unhappy people to blame difficulty on the other’s character is much less pronounced
than the association with the CA index.
Also, Burt et al. (2018:21) report that people with large, prevalent families are less
likely to distinguish the high trust characteristic of guanxi ties (and suggest that family
social norms could be governance rules that substitute for governance by reputation
within a closed network). After looking at the way trust is associated with family
differences, they create the contrast used in Table 3: respondents with large, prevalent
families (1 if the respondent had more than 3 siblings and 20% or more of his or her
business contacts are kin), versus average families (3 siblings and 20% or less of
business contacts are kin), versus respondents with small, marginal families (-1 if the
respondent had fewer than 3 siblings and cited no kin as business contacts). As people
with large, prevalent families are less likely to distinguish guanxi ties, Figure 6B shows
that they are more likely to blame difficulty on the other’s character, and Model A in
Table 3 shows that the tendency remains statistically significant when other controls are
introduced (2.23 test statistic in Model A). The tendency disappears when the CA index
is held constant (1.25 test statistic in Model B).
Relation to Earlier Work The third point illustrated in Table 3 is the improvement over earlier work. Begin with the
zero-order association between blame and aggregate closure around ego. Figure 7 is a
graph of the tendency for the Chinese entrepreneurs to blame difficulty on the other’s
character across increasing levels of closure in the network around a respondent. We
measure closure with the network constraint index, which increases as a function of
connectivity among a respondent’s colleagues (Burt, 1992; 2010:293-305). Closed
networks are to the right in Figure 7, where network constraint is high, and as illustrated
in Burt (2005:191), respondents with more closed networks are more likely to blame
difficulty on the other’s character. The positive association between closure and
character blame is evident in all three codings of the respondent explanations.
——— Insert Figure 7 About Here ———
Networks Prone to Character Assassination, Page 21
But compare the Figure 7 associations to the Figure 5B associations with the
proposed CA index. In Figure 7, there is more variation around the regression line: The
correlation in Figure 7 for the regression line through the black dots is .60, versus .98 for
the regression line in Figure 5B. Also, the proposed CA index correctly distinguishes
many respondents who do not engage in blaming the other’s character: The vertical
axes in Figures 7 and 5B are identical. Note the low-blame, low-index cluster of
respondents in the lower-left corner of Figure 5B. There is no corresponding cluster in
Figure 7.
Back to Table 3, the CA index in Model B is replaced in Model C with the network
constraint measure of aggregate closure in Figure 7. The network association with
blame disappears, and statistically significant blame associations with the control
variables reappear (6.37 test statistic for CA index in Model B drops to 0.99 for network
constraint in Model C). The CA index is far more accurate than aggregate constraint in
predicting who blames the other’s character.
CONCLUSIONS Much attention is given to the benefits of bridging structural holes in a network, but little
is given to the costs involved in building the bridge. Here we study the risk of character
assassination. Bridge relations are prone to difficulty from conflicting interests,
indifference, and misunderstandings. When the bridge is adjacent to a closed network,
difficulty is likely to escalate into character assassination. Sympathetic gossip within the
closed network encourages ego to blame bridge difficulty on the character of the person
on the other side of the bridge. We propose a character assassination index, a “CA
index,” measuring the extent to which a person’s network increases the odds of him or
her blaming difficulty on the character of a specific colleague. The index refines
aggregate closure measures used in prior research, and does well in predicting who
entrepreneurs cite as their most difficult contact, and predicting which entrepreneurs
blame the difficulty on the contact’s character (rather than the difficulty of the situation,
or the contact’s competence).
Networks Prone to Character Assassination, Page 22
We see two next steps for research. One is to bring people and behavior back into
the picture. It is likely that certain personalities are prone to character assassination, as
certain personalities are likely targets of character assassination. The CA index is a
research handle on the way in which social context encourages character
assassination, which means context can be held constant to more clearly distinguish
kinds of people who tend to be found in assassination-prone situations, versus kinds of
people prone to promulgating, or eliciting, character assassination. Second, there is a
wealth of correlates to feeling negative toward a colleague (Burt & Wang, 2019;
Labianca, 2014:252ff.; Lee et al., 2019; Lee et al. 2019), chief among them that people
avoid seeking advice from colleagues perceived to be unpleasant, regardless of
competence (Casciaro & Lobo, 2008), and that people will pay a premium to deal with a
reputable exchange partner (Diekmann, Jann & Wyder, 2009). Negative affect can be
destructive (inhibiting coordination and obscuring decision criteria), and in some ways
productive (fueling aspirations and maintaining reputations). In this chapter, we put
aside known correlates assuming that much of negative affect is spurious — social
difficulty blown out of proportion by people maintaining a sense of community through
supportive stories exaggerated as they circulate. A next step is to bring known
correlates back into the analysis. The CA index indicates the extent to which a person’s
network is prone to character assassination, so we can move more clearly to see how
much known correlates of negative affect are a function of situations in which they occur
versus the other person’s behavior proclaimed to generate them.
REFERENCES Baldassarri, D. & Bearman, P. (2007). “Dynamics of political polarization.” American
Sociological Review, 72, 784-811.
Batjargal, B., Hitt, M. A., Tsui, A. S., Arregle, J., Webb, J. W. & Miller, T. L. (2013).
Institutional polycentrism, entrepreneur’s social networks, and new venture growth.
Academy of Management Journal, 56, 1024-1049.
Bergemann, P. (2017). Denunciation and social control. American Sociological Review,
82, 384-406.
Networks Prone to Character Assassination, Page 23
Bergemann, P. (2019). Judge thy neighbor: denunciations in the Spanish Inquisition,
Romanov Russia, and Nazi Germany. New York: Columbia University Press.
Bernstein, L. (1992). Opting out of the legal system: extralegal contractual relations in
the diamond industry. Journal of Legal Studies, 21, 115-157.
Bian, Y. (2019). Guanxi: how China works. Cambridge, UK: Polity Press.
Bian, Y., & Li, L. (2012). “The Chinese General Social Survey (2003-8).” Chinese
Sociological Review, 45, 70-97.
Borgatti, S. P. (2002). NetDraw. Boston, MA: Analytic Technologies.
Burt, R. S. (1982). Toward a structural theory of action: network models of social
structure, perception, and action. New York: Academic Press.
Burt, R. S. (1992). Structural holes: the social structure of competition. Cambridge, MA:
Harvard University Press.
Burt, R. S. (1999). Entrepreneurs, distrust, and third parties. In L. Thompson, J. Levine
& D. Messick (Eds.), Shared Cognition in Organizations (pp. 213-243). Hillsdale,
NJ: Lawrence Erlbaum.
Burt, R. S. (2001). Bandwidth and echo: trust, information, and gossip in social
networks. In J. E. Rauch & A. Casella (Eds.), Networks and Markets (pp. 30-74).
New York: Russell Sage Foundation.
Burt, R. S. (2005). Brokerage and Closure: an introduction to social capital. Oxford:
Oxford University Press.
Burt, R. S. (2010). Neighbor networks: competitive advantage local and personal.
Oxford: Oxford University Press.
Burt, R. S. (2019a). Network disadvantaged entrepreneurs: density, hierarchy, and
success in China and the West. Entrepreneurship Theory and Practice, 43, 19-50.
Burt, R. S. (2019b). The networks and success of female entrepreneurs in China. Social
Networks, 58, 37-49.
Burt, R. S. & Batjargal, B. (2019). Comparative network analysis in China. Management
and Organization Review, 15, 3-29.
Burt, R. S., Bian, Y. & Opper, S. (2018). More or less guanxi: trust is 80% network, 10%
individual differences. Social Networks, 54, 12-25.
Networks Prone to Character Assassination, Page 24
Burt, R. S. & Burzynska, K. (2017). Chinese entrepreneurs, social networks, and
guanxi.” Management and Organization Review, 12, 221-260.
Burt, R. S., Kilduff, M. & Tasselli, S. (2013). “Social network analysis: foundations and
frontiers on network advantage. Annual Review of Psychology, 64, 537-547.
Burt, R. S. & Knez, M. (1995). Kinds of third-party effects on trust. Rationality and
Society, 7, 255-292.
Burt, R. S. & Opper, S. (2017). Early network events in the later success of Chinese
entrepreneurs. Management and Organization Review, 12, 497-537.
Burt, R. S. & Wang, S. (2019). Network brokers and bad behavior. Paper presented at
the 2019 annual meetings of the Academy of Management, Boston, MA.
Casciaro, T. & Lobo, M. S. (2008). When competence is irrelevant: the role of
interpersonal affect in task-related ties. Administrative Science Quarterly, 51, 655-
684.
Coleman, J. S. (1957). Community conflict. New York: Bobbs-Merrill.
Coleman, J. S. 1988. Social capital in the creation of human capital. American Journal
of Sociology, 94, S95-S120.
Cook, K. S., Emerson, R. M., Gillmore, M. R. & Yamagishi, T. (1983). The distribution of
power in exchange networks: theory and experimental results. American Journal
of Sociology, 89, 275-305
Diekmann, A., Jann, B. & Wyder, D. 2009. Trust and reputation in internet auctions. In
K. S. Cook, C. Snijders, V. Buskens & C. Cheshire (Eds.), eTRUST (pp. 139-165).
New York: Russell Sage.
Ellickson, R. C. (1991). Order without law: how neighbors settle disputes. Cambridge,
MA: Harvard University Press.
Erikson, K. T. (1966). Wayward Puritans: a study in the sociology of deviance. New
York: Wiley.
Festinger, L., Schachter, S. & Back, K. (1950). Social pressures in informal groups: a
study of human factors in housing. New York: Harper.
Freeman, L. C. (1977). A set of measures of centrality based on betweenness.
Sociometry, 40, 35-40.
Networks Prone to Character Assassination, Page 25
Friedkin, N. E. (1999). Choice shift and group polarization. American Sociological
Review, 64, 856-875.
Granovetter, M. (1973). The strength of weak ties. American Journal of Sociology, 78,
1360-1380.
Granovetter, M. (1985). Economic action, social structure, and embeddedness."
American Journal of Sociology, 91, 481-510.
Granovetter, M. (1992). Problems of explanation in economic sociology. In N. Nohria &
R. G. Eccles (Eds.), Networks and organizations: structure, form, and action (pp.
29-56). Boston, MA: Harvard Business School Press.
Greif, A. (1989). Reputation and coalitions in medieval trade: evidence on the Maghribi
traders. Journal of Economic History, 49, 857-882.
Hanson, M. T. & von Oetinger, B. (2001). Introducing t-shaped managers: knowledge
management’s next generation. Harvard Business Review, 79, 106-116.
Kenny, D. A. & Albright, L. (1987). Accuracy in interpersonal perception: a social
relations analysis. Psychological Bulletin, 102, 390-402.
Labianca, G. (2014). Negative ties in organizational networks. Research in the
Sociology of Organizations, 40, 239-259.
Labianca, G., Brass, D. J. & Gray, B. (1998). Social networks and perceptions of
intergroup conflict: the role of negative relationships and third parties. Academy of
Management Journal, 41, 55-67.
Lee, Y., Jung, H. & Casciaro, T. (2019). The mind of the network broker. Paper
presented at the 2019 annual meetings of the Academy of Management, Boston,
MA.
Lee, J. W., Lee, S. Y. & Kilduff, M. (2019). Brokers who burn out: how divide between
brokerage leads to abusive behavior. Paper presented at the 2019 annual
meetings of the Academy of Management, Boston, MA.
Lin, N., Ensel, W. & Vaughn, J. (1981). Social resources and strength of ties: structural
factors in occupational status attainment. American Sociological Review, 46, 393-
405.

Networks Prone to Character Assassination, Page 26
Marsden, P. V. (2011). Survey methods for network data. In J. P. Scott & P. J.
Carrington (Eds.), The SAGE Handbook of Social Network Analysis (pp. 370-388).
Thousand Oaks, CA: Sage.
Merluzzi, J. (2017). Gender and negative network ties: exploring difficult work
relationships within and across gender. Organization Science, 28, 636-652.
Moldoveanu, M. C. & Baum, J. A. C. (2014). Epinets: the epistemic structure and
dynamics of social networks. Stanford, CA: Stanford University Press.
Nee, V. & Opper, S. (2012). Capitalism from below: markets and institutional change in
China. Cambridge, MA: Harvard University Press.
Pontikes, E., Negro, G. & Rao, H. (2010). Stained red: a study of stigma by association
to blacklisted artists during the “Red Scare” in Hollywood. American Sociological
Review, 75, 456-478.
Putnam, R. D. (1993). Making democracy work: civic traditions in modern Italy.
Princeton, NJ: Princeton University Press.
Ruan, D. (1998). The content of the General Social Survey discussion networks: an
exploration of General Social Survey discussion name generator in a Chinese
context. Social Networks, 20, 247-264.
Tasselli, S. & Kilduff, M. (2018). When brokerage between friendship cliques endangers
trust: a personality-network fit perspective. Academy of Management Journal, 61,
802-825.
Tasselli, S., Kilduff, M. & Menges, J. I. (2015). The microfoundations of organizational
social networks: a review and agenda for future research. Journal of Management,
41, 1361-1387.
Volk, R. W. & Beeman, M. (1998). “The Eye of the Storm”: The subtleties of gender
bias. Teaching Sociology, 26, 38-48.
Xiao, Z. & Tsui, A. S. (2007). When brokers may not work: the cultural contingency of
social capital in Chinese high-tech firms. Administrative Science Quarterly, 52, 1-
31.

Table 1.Example Explanations for the Difficulty
Source of the Difficulty?
CasesBlame for the Difficulty? Inside the Business Outside the BusinessDifficult Situation (e.g., Language barrier was difficult, Conflict of goals; What was good for him was bad for my group)
Plant roof suffered a typhoonCannot recruit workers
Brain drainRequires salary increase
Raw material prices going up fastLarger increase in raw material prices
The industry makes price warFierce market competition
103
Contact’s Competence(e.g., Promoted too high, too fast, Plans do not take into account time difference between NY & Europe)
Warehouse accident damaged raw materialToo many low-quality products
Severe quality accident Work injury
Particular supplier delivers faulty productSupplier delay in delivery
Delivery delay brings big troubleOEM cannot complete order; lost
customers
203
Contact’s Character (e.g., Egotistical self-oriented liar, My boss and a charlatan, Unethical, Nasty ill-tempered bitch, Most territorial uncooperative person I know)
Say bad things to stir up employeesOften asks for leave with no reason
Old fogy, young don’t understand marketMisappropriated customer sales
Stole company products to sell outsideDrove customer’s car without ok
Stole products when plant was relocatingUsed job authority for personal vendetta
Competitor counterfeiting our productsAlly with other suppliers to raise our costs
Competitor steals our technologyCustomer defaulted on payments
Secretly stir up trouble with governmentBribe to get state-funded project
Previous worker gave tech. to competitorSupplier has honesty problems
394
Number of Cases 413 287 700
NOTE — Example explanations in first column are from western managers (Burt, 1999:Table 1). Example explanations in other two columns are from the 700 Chinese entrepreneurs.
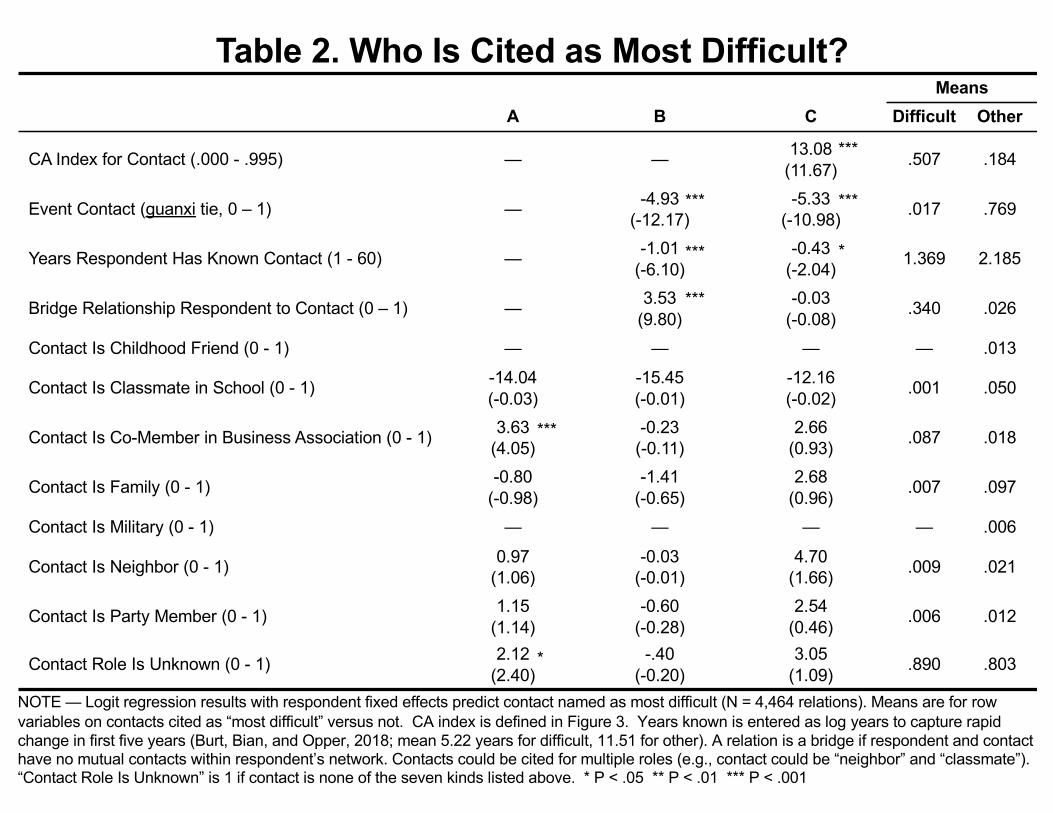
Table 2. Who Is Cited as Most Difficult?Means
A B C Difficult Other
CA Index for Contact (.000 - .995) — — 13.08(11.67) .507 .184
Event Contact (guanxi tie, 0 – 1) — -4.93(-12.17)
-5.33(-10.98) .017 .769
Years Respondent Has Known Contact (1 - 60) — -1.01(-6.10)
-0.43(-2.04) 1.369 2.185
Bridge Relationship Respondent to Contact (0 – 1) — 3.53(9.80)
-0.03(-0.08) .340 .026
Contact Is Childhood Friend (0 - 1) — — — — .013
Contact Is Classmate in School (0 - 1) -14.04(-0.03)
-15.45(-0.01)
-12.16(-0.02) .001 .050
Contact Is Co-Member in Business Association (0 - 1) 3.63(4.05)
-0.23(-0.11)
2.66(0.93) .087 .018
Contact Is Family (0 - 1) -0.80(-0.98)
-1.41(-0.65)
2.68(0.96) .007 .097
Contact Is Military (0 - 1) — — — — .006
Contact Is Neighbor (0 - 1) 0.97(1.06)
-0.03(-0.01)
4.70(1.66) .009 .021
Contact Is Party Member (0 - 1) 1.15(1.14)
-0.60(-0.28)
2.54(0.46) .006 .012
Contact Role Is Unknown (0 - 1) 2.12(2.40)
-.40(-0.20)
3.05(1.09) .890 .803
NOTE — Logit regression results with respondent fixed effects predict contact named as most difficult (N = 4,464 relations). Means are for row variables on contacts cited as “most difficult” versus not. CA index is defined in Figure 3. Years known is entered as log years to capture rapid change in first five years (Burt, Bian, and Opper, 2018; mean 5.22 years for difficult, 11.51 for other). A relation is a bridge if respondent and contact have no mutual contacts within respondent’s network. Contacts could be cited for multiple roles (e.g., contact could be “neighbor” and “classmate”). “Contact Role Is Unknown” is 1 if contact is none of the seven kinds listed above. * P < .05 ** P < .01 *** P < .001
***
***
*
***
***
***
***
*
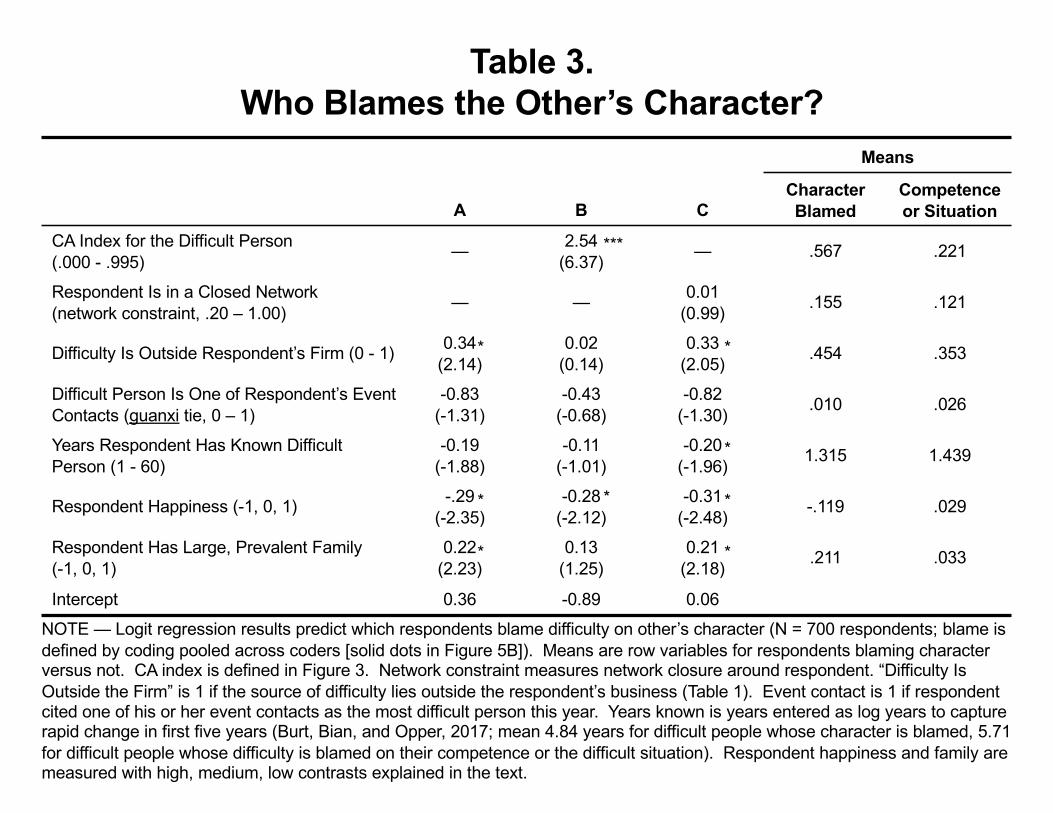
Table 3.Who Blames the Other’s Character?
Means
A B CCharacter Blamed
Competenceor Situation
CA Index for the Difficult Person(.000 - .995)
— 2.54(6.37)
— .567 .221
Respondent Is in a Closed Network(network constraint, .20 – 1.00)
— — 0.01(0.99)
.155 .121
Difficulty Is Outside Respondent’s Firm (0 - 1) 0.34(2.14)
0.02(0.14)
0.33(2.05)
.454 .353
Difficult Person Is One of Respondent’s Event Contacts (guanxi tie, 0 – 1)
-0.83(-1.31)
-0.43(-0.68)
-0.82(-1.30)
.010 .026
Years Respondent Has Known Difficult Person (1 - 60)
-0.19(-1.88)
-0.11(-1.01)
-0.20(-1.96)
1.315 1.439
Respondent Happiness (-1, 0, 1) -.29(-2.35)
-0.28(-2.12)
-0.31(-2.48)
-.119 .029
Respondent Has Large, Prevalent Family(-1, 0, 1)
0.22(2.23)
0.13(1.25)
0.21(2.18)
.211 .033
Intercept 0.36 -0.89 0.06
NOTE — Logit regression results predict which respondents blame difficulty on other’s character (N = 700 respondents; blame is defined by coding pooled across coders [solid dots in Figure 5B]). Means are row variables for respondents blaming characterversus not. CA index is defined in Figure 3. Network constraint measures network closure around respondent. “Difficulty Is Outside the Firm” is 1 if the source of difficulty lies outside the respondent’s business (Table 1). Event contact is 1 if respondent cited one of his or her event contacts as the most difficult person this year. Years known is years entered as log years to capture rapid change in first five years (Burt, Bian, and Opper, 2017; mean 4.84 years for difficult people whose character is blamed, 5.71 for difficult people whose difficulty is blamed on their competence or the difficult situation). Respondent happiness and family are measured with high, medium, low contrasts explained in the text.
***
*
*
*
*
*
*
*
*

1. Man known for 25 years, cited as most valuable in founding the business, and during the first and second significant events in the history of the business, and is currently a most valued contact.
2. Man known for 14 years, cited as most valuableduring the third significant event in the history of the business.
3. Man known for 27 years, cited as most valuable during the fourth and fifth significant events in the history of the business, and is currently the most valued employee.
4. Woman known for 18
years, cited as a most valued
current contact.
Male respondent, a current owner of the business founded 16 years ago, now employing 62 people.
6. Man cited as most difficult
this year, known 7 years (drunk on night
duty during significant theft from
factory)
5. Woman known for 11 years, cited as a most valued current contact.
Figure 1. Example Network
Line thicknessindicates closeness.
No line is “distant” relationship.
Respondent is the square.
CA IndexScores:1. .159 4. .2502. .214 5. .1203. .147 6. .409
Res
pond
ent E
valu
atio
n of
Tru
st in
Con
tact
(1 fo
r low
trus
t, 5
for h
igh
trust
)
6+
Network ClosureNumber of Third Parties
Linking Respondentwith Contact
Figure 2. Closure-Trust AssociationNOTE — Graph describes trust in relations with 4,464 key contacts cited by Chinese entrepreneurs (Burt and Opper, 2017). Vertical axis is mean respondent trust in a contact, measured on a five-point scale. Horizontal axis is closure measured by number of people connected to contact in respondent network. Guanxi ties are distinguished by respondent citing contact as most valued person during a significant event.
Weak bridges are likely to be cited for difficulty in that structurally embedded ties are unlikely to be cited for difficulty, and long-standing, guanxi, ties are unlikely to be cited for difficulty.
Long-Standing, Guanxi, Ties
NormalBusiness Ties
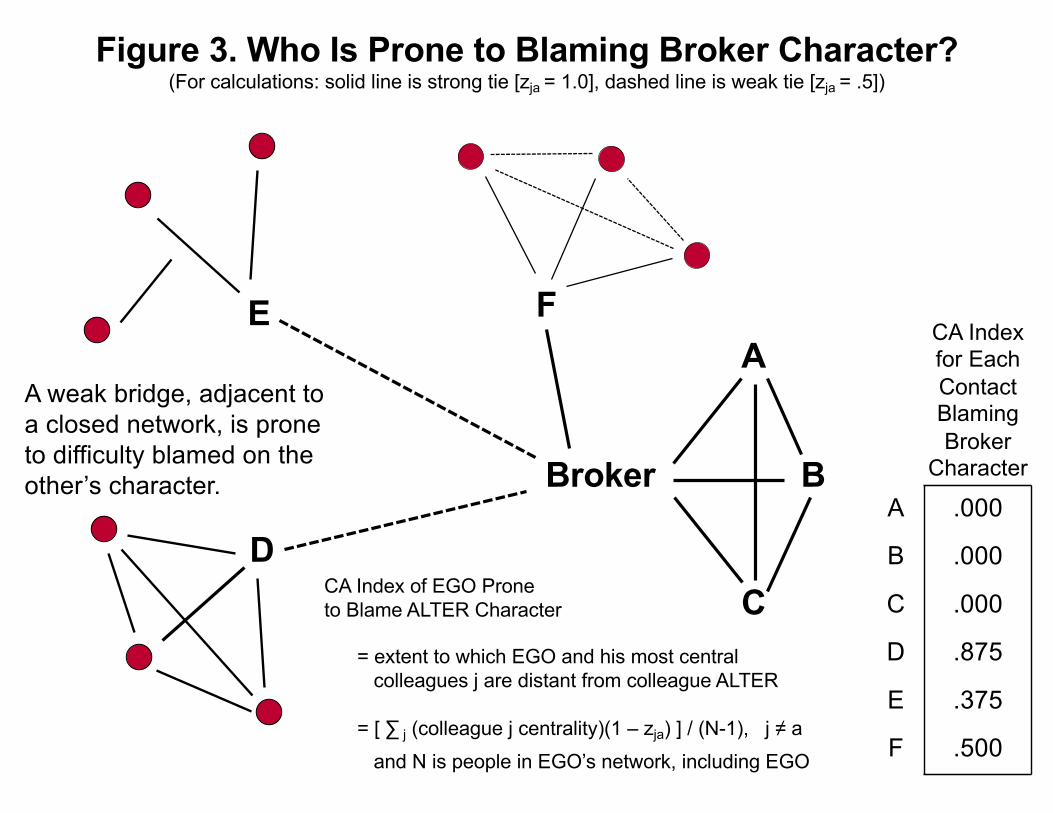
Figure 3. Who Is Prone to Blaming Broker Character?(For calculations: solid line is strong tie [zja = 1.0], dashed line is weak tie [zja = .5])
Broker
FA
B
CD
A weak bridge, adjacent to a closed network, is prone to difficulty blamed on the other’s character.
CA Index of EGO Prone to Blame ALTER Character
= extent to which EGO and his most central colleagues j are distant from colleague ALTER
= [ ∑ j (colleague j centrality)(1 – zja) ] / (N-1), j ≠ aand N is people in EGO’s network, including EGO
CA Indexfor Each ContactBlaming Broker
Character
A .000
B .000
C .000
D .875
E .375
F .500
E
1. Man known for 38 years, cited as most valuable in founding the business, and during the third significant event in the history of the business, and is currently a most valued contact and employee.
4. Man known for 14 years, cited as most valuable contact during the fifth
significant event in the history of the business, and currently
a most valued contact.
Male respondent who founded the business 12 years ago, now employing 130 people.
7. Male relative (other than parent,
spouse,or child) known for 29 years and cited
as most difficult this year (company successor; his management level is not high
enough; employees not accepting him)
5. Man known for 7 years, cited as a current most
valued contact.
6. Man known for 4 years, cited as a current most
valued contact.
3. Woman known for 11 years, cited as most
valuable contact during the second and fourth
significant event in the history of the business.
2. Woman known for 17 years, cited as most valuable contact during the first significant event in the history
of the business.
Figure 4. Example NetworkContradicting Prediction
Line thicknessindicates closeness.
No line is “distant” relationship.
Respondent is the square.
CA IndexScores:1. .202 5. .2782. .234 6. .3033. .252 7. .1384. .188
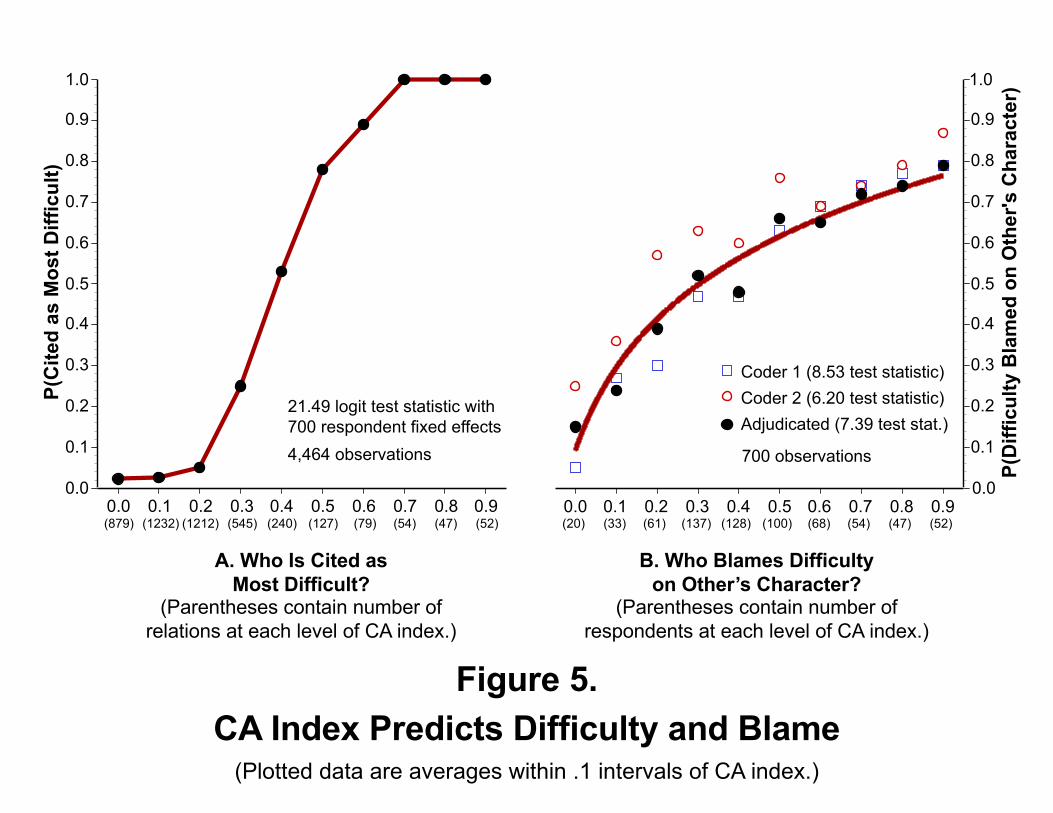
Figure 5.CA Index Predicts Difficulty and Blame
(Plotted data are averages within .1 intervals of CA index.)
A. Who Is Cited asMost Difficult?
(Parentheses contain number of relations at each level of CA index.)
B. Who Blames Difficultyon Other’s Character?
(Parentheses contain number of respondents at each level of CA index.)
21.49 logit test statistic with700 respondent fixed effects4,464 observations
Coder 1 (8.53 test statistic)Coder 2 (6.20 test statistic)Adjudicated (7.39 test stat.)
700 observations
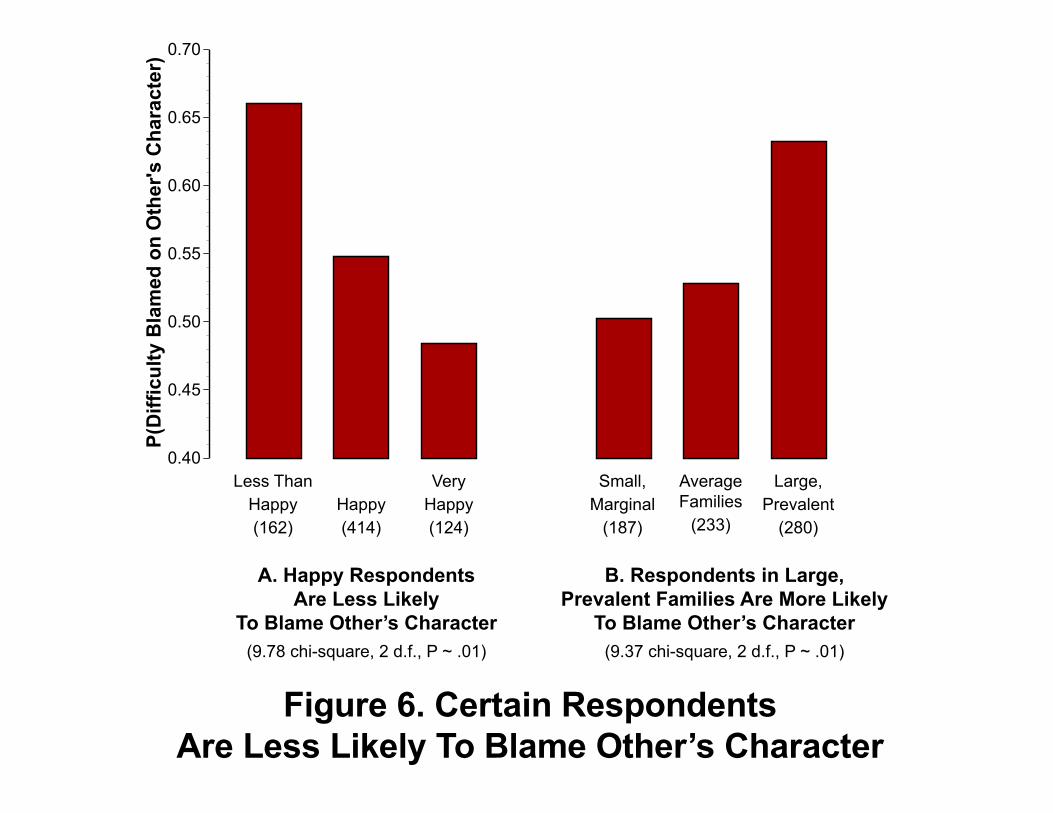
Figure 6. Certain RespondentsAre Less Likely To Blame Other’s Character
A. Happy RespondentsAre Less Likely
To Blame Other’s Character(9.78 chi-square, 2 d.f., P ~ .01)
VeryHappy(124)
Happy(414)
Less ThanHappy(162)
B. Respondents in Large, Prevalent Families Are More Likely
To Blame Other’s Character(9.37 chi-square, 2 d.f., P ~ .01)
Large,Prevalent
(280)
Average Families
(233)
Small,Marginal
(187)

Figure 7.Aggregate Network Closure and Blaming Other’s Character
(Correlations are computed from averages in graph within .1 intervals of network constraint.)
Coder 1 (0.66 correlation)
Coder 2 (0.62 correlation)
Adjudicated (0.60 correlation)
OpenNetworks
ClosedNetworks
NetworkConstraint