Anexo 8. icsg 5 things_to_look for_in_2017 (april 2017)_wood mackenzie (1)
17
Copper: Five things to look for in 2017 International Copper Study Group Industry Advisory Panel Thursday 27 April 2017 Lisbon, Portugal Trusted commercial intelligence www.woodmac.com
-
Upload
oscar-frias-martinelli -
Category
Business
-
view
133 -
download
2
Transcript of Anexo 8. icsg 5 things_to_look for_in_2017 (april 2017)_wood mackenzie (1)

Copper: Five things to look
for in 2017
International Copper Study Group
Industry Advisory Panel
Thursday 27 April 2017
Lisbon, Portugal
Trusted commercial intelligence www.woodmac.com
Trusted commercial intelligence www.woodmac.com
2
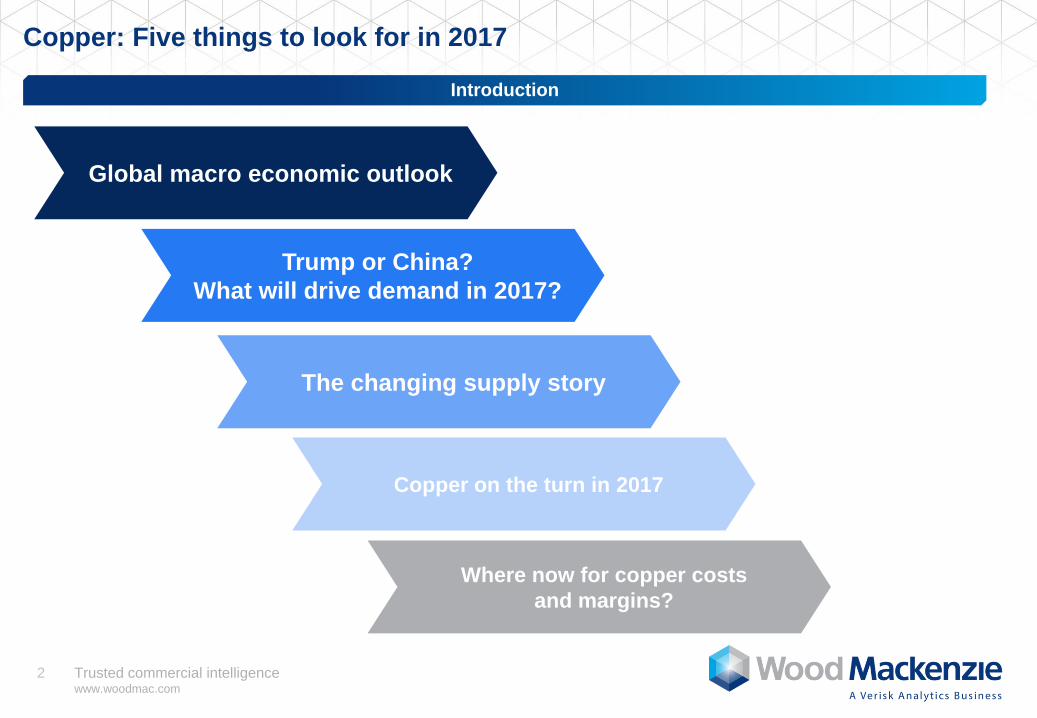
Copper: Five things to look for in 2017
Introduction
Trump or China?
What will drive demand in 2017?
Where now for copper costs
and margins?
Global macro economic outlook
The changing supply story
Copper on the turn in 2017
Trusted commercial intelligence www.woodmac.com
3
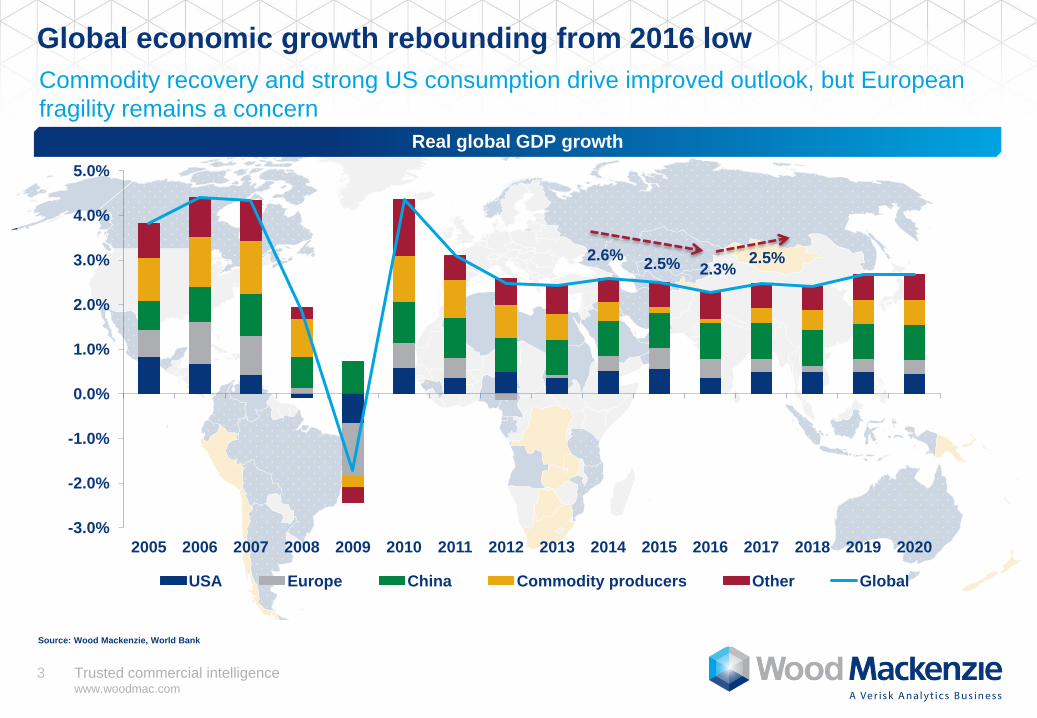
Global economic growth rebounding from 2016 low
Real global GDP growth
Source: Wood Mackenzie, World Bank
Commodity recovery and strong US consumption drive improved outlook, but European
fragility remains a concern
-3.0%
-2.0%
-1.0%
0.0%
1.0%
2.0%
3.0%
4.0%
5.0%
2005 2006 2007 2008 2009 2010 2011 2012 2013 2014 2015 2016 2017 2018 2019 2020
USA Europe China Commodity producers Other Global
2.3% 2.5% 2.5%
2.6%

Trusted commercial intelligence www.woodmac.com
4
Global risks weighted to the downside
The rise of the autocrat
and increased
nationalism
Backlash: what if
Trump cannot
deliver on promises
Automation and robotics drive
productivity surge
European
fragmentation
China
leadership
reshuffle Protectionism leads
to trade wars
Radical policy reform
OPEC behaviour
Source: Wood Mackenzie

Trusted commercial intelligence www.woodmac.com
5
Refined copper consumption
N. America
L. America
Africa
M. East
Europe Russia & Caspian
Asia ex-China
China
Oceania
Outlook for first use refined consumption to 2020
2014 2015 2016 2017 2018-20
World 4.6% 1.5% 2.2% 1.8% 1.8%
China 7.3% 3.7% 4.6% 2.2% 1.9%
World Ex-China 2.4% -0.4% 0.1% 1.4% 1.7%
Source: Wood Mackenzie
China surprises in 2016 but will be hard to repeat…
Trusted commercial intelligence www.woodmac.com
6
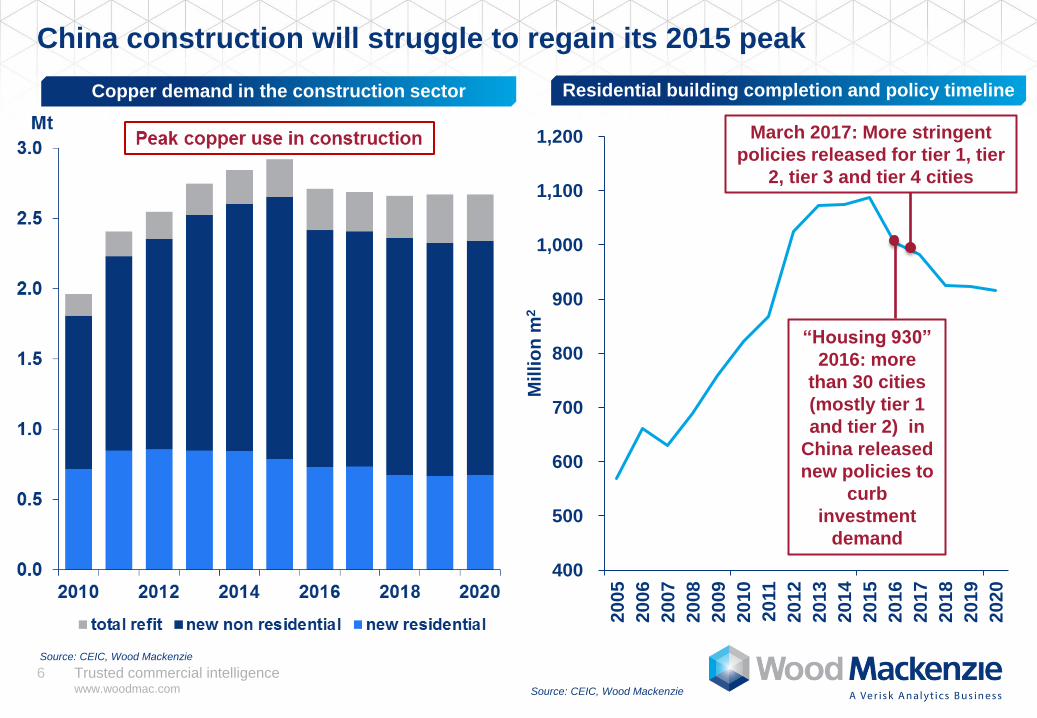
China construction will struggle to regain its 2015 peak
Residential building completion and policy timeline
400
500
600
700
800
900
1,000
1,100
1,200
20
05
20
06
20
07
20
08
20
09
20
10
20
11
20
12
20
13
20
14
20
15
20
16
20
17
20
18
20
19
20
20
Milli
on
m2
“Housing 930”
2016: more
than 30 cities
(mostly tier 1
and tier 2) in
China released
new policies to
curb
investment
demand
March 2017: More stringent
policies released for tier 1, tier
2, tier 3 and tier 4 cities
Source: CEIC, Wood Mackenzie
Copper demand in the construction sector
Source: CEIC, Wood Mackenzie

Trusted commercial intelligence www.woodmac.com
7
Auto: copper demand from passenger cars will grow much
faster than production growth due to increasing EV penetration
Passenger car production vs copper consumption
Source: CEIC, Wood Mackenzie
Increasing share of public service and commercial
building
Passenger car production
Copper
Passenger car prod.

Trusted commercial intelligence www.woodmac.com
8
Trump policies have caused uncertainty over North American demand
2017 US infrastructure rating - in need of an upgrade Current auto output forecast – US and Mexico
0
2
4
6
8
10
12
14
2000 2005 2010 2015 2020
Mn units
US Mexico
Source: Wood Mackenzie

Trusted commercial intelligence www.woodmac.com
9
Despite lower growth, on a tonnage basis, it’s still all about China
Source: Wood Mackenzie
Changes in refined copper consumption by region: 2016-2020
22.4
0.9
0.4 0.1 0.1 0.1 0.0 (0.1) 0.1 24.0
20
21
22
23
24
2520
16
Ch
ina
Ind
ia &
Ase
an
Mid
dle
Eas
t
La
tin
Am
eri
ca
No
rth
Am
eri
ca
Eu
rop
e
No
rth
Ea
st
As
ia RO
W
20
20
Millio
n to
nn
es

Trusted commercial intelligence www.woodmac.com
10
Mine production growth set to pause this year
Mine production (forecasts after 5% disruption allowance)
Source: Wood Mackenzie
15
16
17
18
19
20
21
22
23
24
25
26
2012 2013 2014 2015 2016 2017 2018 2019 2020 2021 2022
Min
e s
up
ply
(M
t c
op
per)
ProbableProjects
HighlyProbableProjects
Existingsupply
Kamoto/KOV Restart (+365kt/a)
Cobre Panama (+320kt/a)
Escondida 3rd Mill (+250kt/a)
Las Bambas (+100kt/a)
Sentinel (+135kt/a)
Mopani (+100kt/a)
Toquepala Expn (+100kt/a)
Aktogay (+80kt/a)
Trusted commercial intelligence www.woodmac.com
11
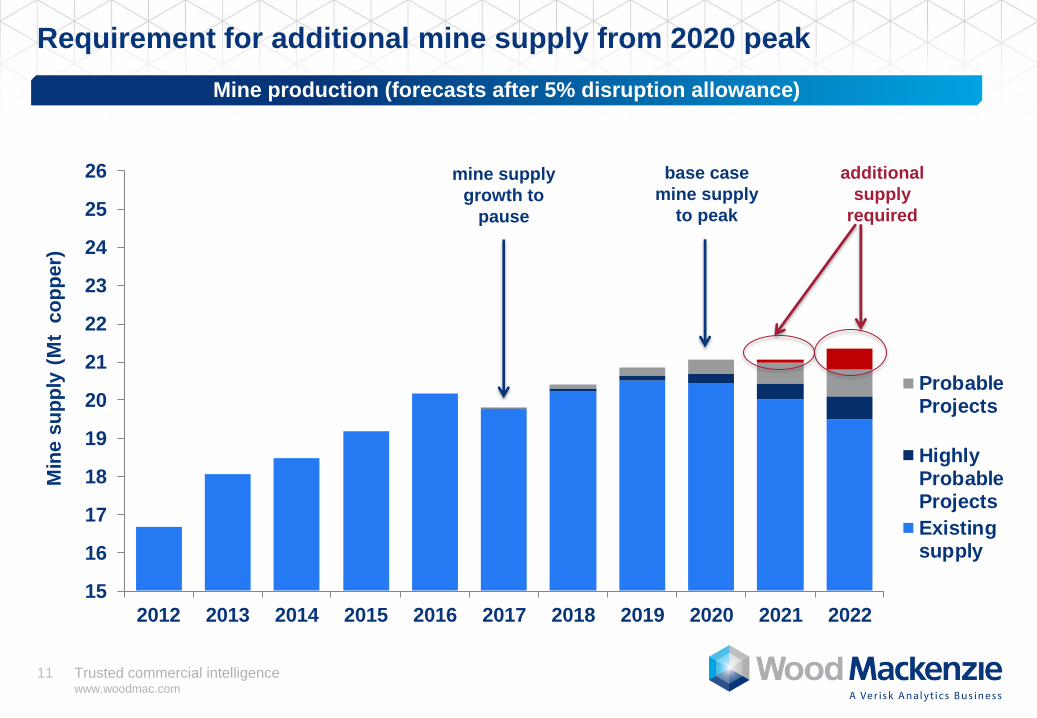
Requirement for additional mine supply from 2020 peak
Mine production (forecasts after 5% disruption allowance)
15
16
17
18
19
20
21
22
23
24
25
26
2012 2013 2014 2015 2016 2017 2018 2019 2020 2021 2022
Min
e s
up
ply
(M
t c
op
per)
ProbableProjects
HighlyProbableProjects
Existingsupply
mine supply
growth to
pause
base case
mine supply
to peak
additional
supply
required
Trusted commercial intelligence www.woodmac.com
12
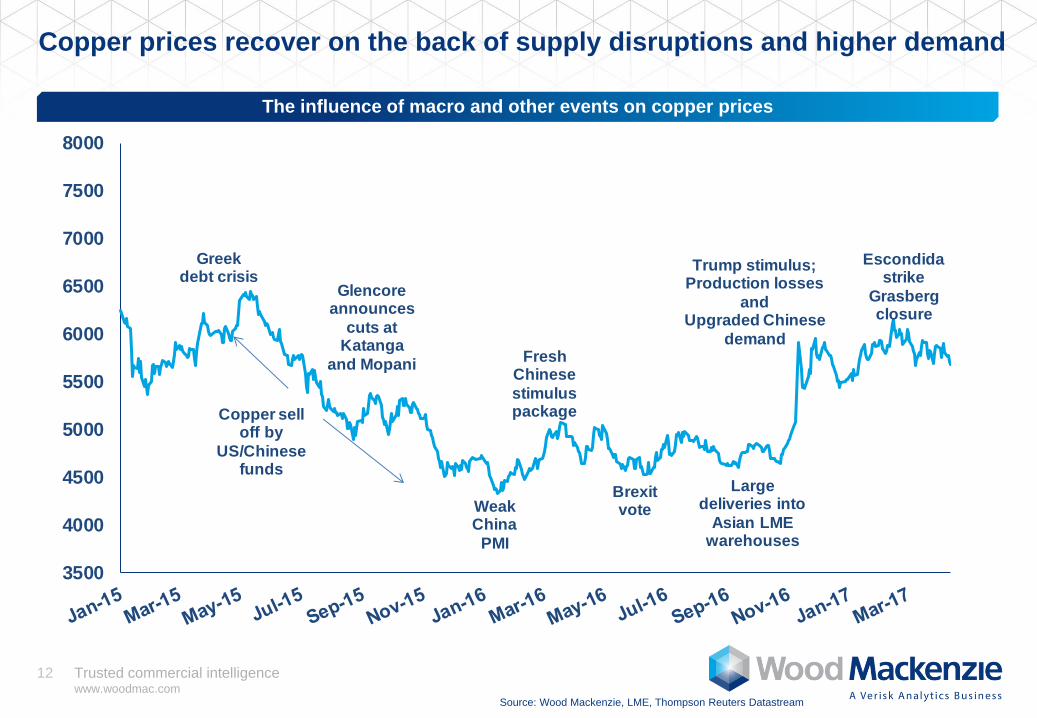
Copper prices recover on the back of supply disruptions and higher demand
Source: Wood Mackenzie, LME, Thompson Reuters Datastream
The influence of macro and other events on copper prices
3500
4000
4500
5000
5500
6000
6500
7000
7500
8000
Trump stimulus;Production losses
andUpgraded Chinese
demand
Greek debt crisis
Glencore announces
cuts at Katanga
and MopaniFresh
Chinese
stimulus package
Weak China
PMI
Large deliveries into
Asian LME warehouses
Brexitvote
Copper sell off by
US/Chinese funds
Escondida strike
Grasberg closure

Trusted commercial intelligence www.woodmac.com
13
Annual average copper price set to recover
Source: Wood Mackenzie
Global stocks of refined copper and annual average copper price
0
50
100
150
200
250
300
350
400
450
0
10
20
30
40
50
60
70
80
90
100
Co
pp
er
pri
ce (c
/lb
)
Glo
ba
l me
tal s
toc
ks
(d
ay
s)
Other stocks SRB stocks Price - Q1 2017 estimate
Source: Wood Mackenzie, LME, Comex, SHFE
Average stocks

Trusted commercial intelligence www.woodmac.com
14
Where now for copper costs and margins?
Global residual cash flow for primary copper mines
1.98 1.300.76
1.63
1.57 0.600.33
0.29
0.19
0.260.56 0.70 0.88 1.12 1.55 1.86
0.0
1.0
2.0
3.0
4.0
5.0
2007 2009 2011 2013 2015 2017 2019 2021 LT
Co
st / M
arg
in ($
/lb
pa
id c
op
per)
Expansion Capex Sustaining Capex Indirect Costs
Mine Site Costs Net Revenue
Base case and probable projects only
Source: Wood Mackenzie Q1 2017

Trusted commercial intelligence www.woodmac.com
15
Key conclusions
Global growth has improved from a year ago. The short-term outlook is
relatively positive, owing to a stronger US economy and a recovery in
commodities, but Europe remains a cause for concern.
Prices have been lower, but so has opex and capex. As prices improve
from 2017, we would expect healthier margins. This should support a
new cycle of investment.
Demand growth in the world ex-China should improve on 2016. Overall
refined demand will remain subdued, in part reflecting a stronger
contribution from scrap, yet China is still the main driver for growth.
Source: Wood Mackenzie
Mine supply forecast to pause during 2017 before recovering to peak in
2020. Additional mine production capability is required from ~2020. There
is a lack of advanced development stage projects to meet this need.
The combination of slower supply growth and moderate demand growth
will push the refined market into deficit this year. With global stocks set
to decline, we would expect annual average prices to trend higher.
Trusted commercial intelligence www.woodmac.com
16
Disclaimer
This report has been prepared for the ICSG – Industry Advisory Panel by Wood
Mackenzie Limited. The report is intended solely for the benefit of this meeting and its
contents and conclusions are confidential and may not be disclosed to any other
persons or companies without Wood Mackenzie’s prior written permission.
The information upon which this report is based on our own experience, knowledge and
databases as well as any information publicly available. The opinions expressed in this
report are those of Wood Mackenzie. They have been arrived at following careful
consideration and enquiry but we do not guarantee their fairness, completeness or
accuracy. The opinions, as of this date, are subject to change. We do not accept any
liability for your reliance upon them.
Strictly Private & Confidential

Trusted commercial intelligence www.woodmac.com
17
Europe +44 131 243 4400
Americas +1 713 470 1600
Asia Pacific +65 6518 0800
Email [email protected]
Website www.woodmac.com
Wood Mackenzie* is a global leader in commercial intelligence for the energy, metals and mining industries.
We provide objective analysis and advice on assets, companies and markets, giving clients the insight they
need to make better strategic decisions. For more information visit: www.woodmac.com
*WOOD MACKENZIE is a Registered Trade Mark of Wood Mackenzie Limited