Andres Meesak, Solar PV in Estonia 18022016
23
SOLAR PV EXPERIENCE, CHALLENGES AND OPPORTUNITIES IN ESTONIA Andres Meesak Estonian PV Energy Association @AndresMeesak
-
Upload
finsolar -
Category
Presentations & Public Speaking
-
view
689 -
download
2
Transcript of Andres Meesak, Solar PV in Estonia 18022016
SOLAR PV EXPERIENCE,
CHALLENGES AND OPPORTUNITIES IN
ESTONIAAndres Meesak
Estonian PV Energy Association@AndresMeesak

Topics:
■ Background / statistics
■ Estonian electricity market
■ Estonian PV sector
■ Challenges and opportunities
■ Conclusions
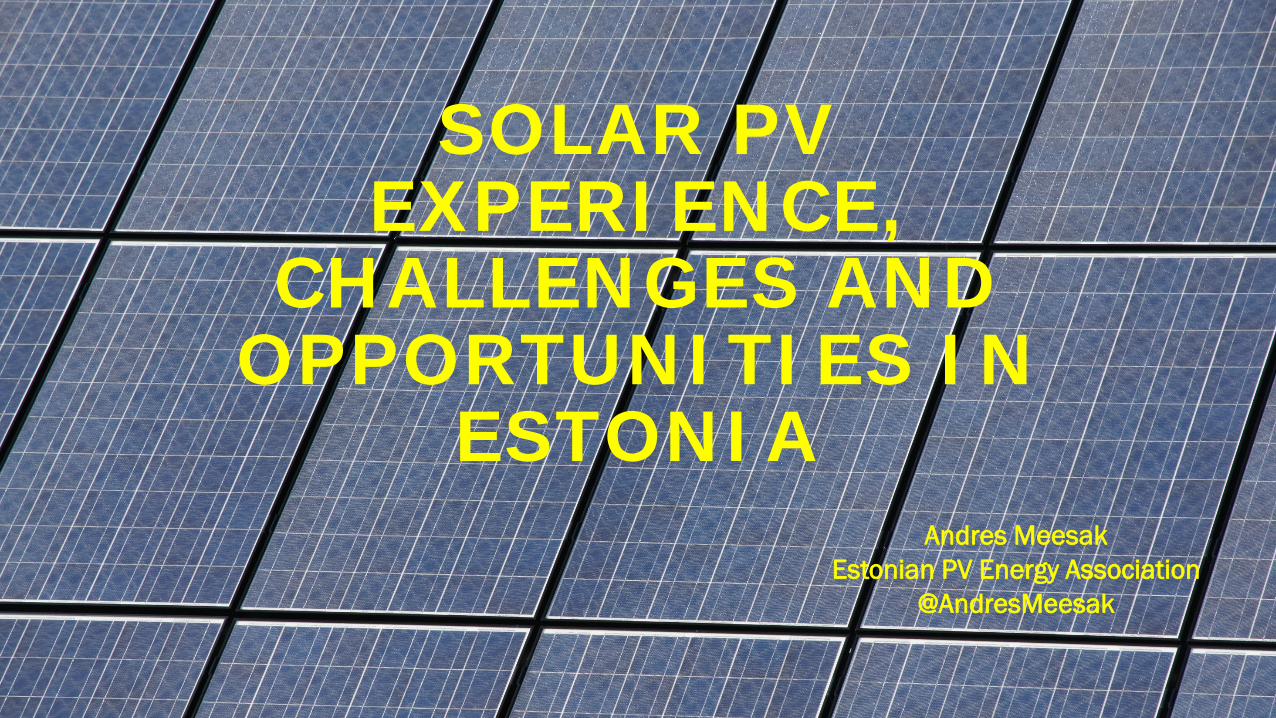
• 9 kW peak power• Comissioned August 2012• Generated > 35 000 kWh electricity
Estonian Development Fund – Coop energy mentor
Research topic:Small scale RE feasibility and economics
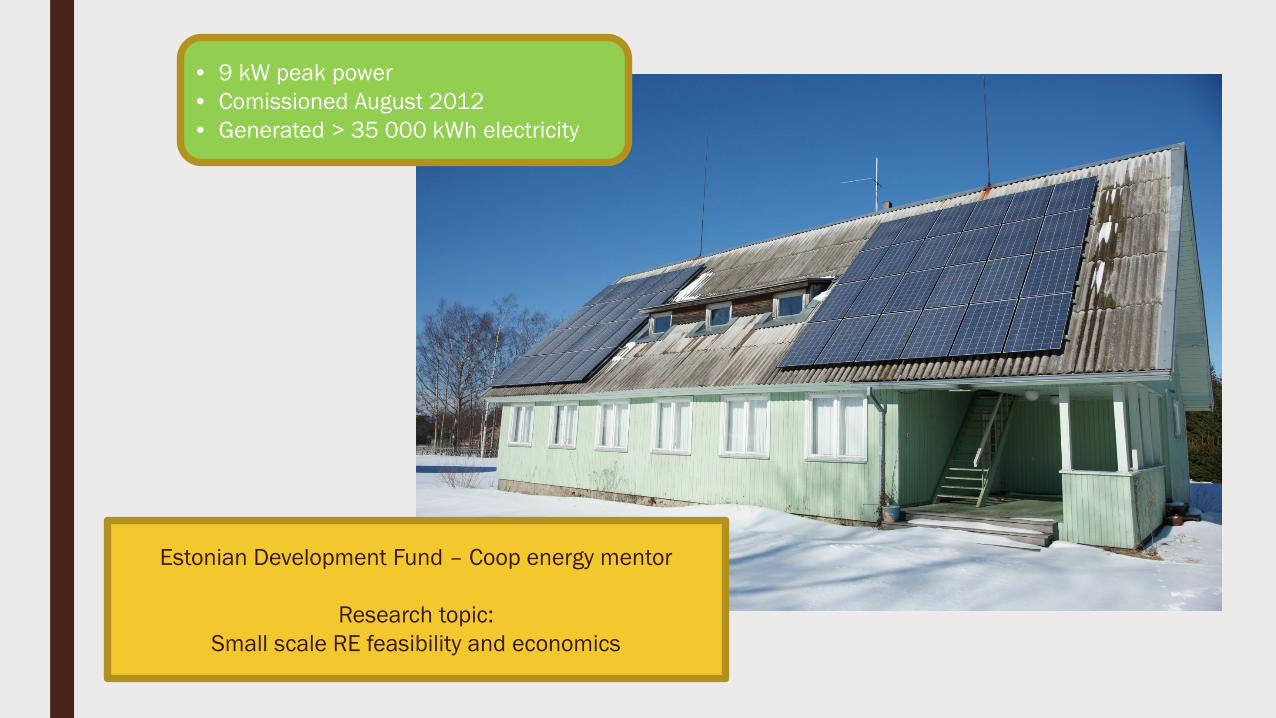
Statistics...
Presenter
Presentation Notes
In Estonia, the total greenhouse gas emissions amounted to 19 million tonnes of CO2 equivalents in 2012, and in 2010–2012 the emission remained around 20 million tonnes. CO2 made up 89% of the greenhouse gases emitted in Estonia, methane and nitrous oxide both accounted for 5% and the share of F-gases was 1%. The biggest share of CO2 emissions came from the oil shale-based energy sector, 85% of nitrous oxide and 51% of methane originated from the agricultural sector, waste management created one-third of methane emissions.

Generation of hazardous waste per capita in EU
>90% of hazardous waste generated in Estonia originates from oil-shale industry (energy
industry)
Statistics...
Statistics...
Presenter
Presentation Notes
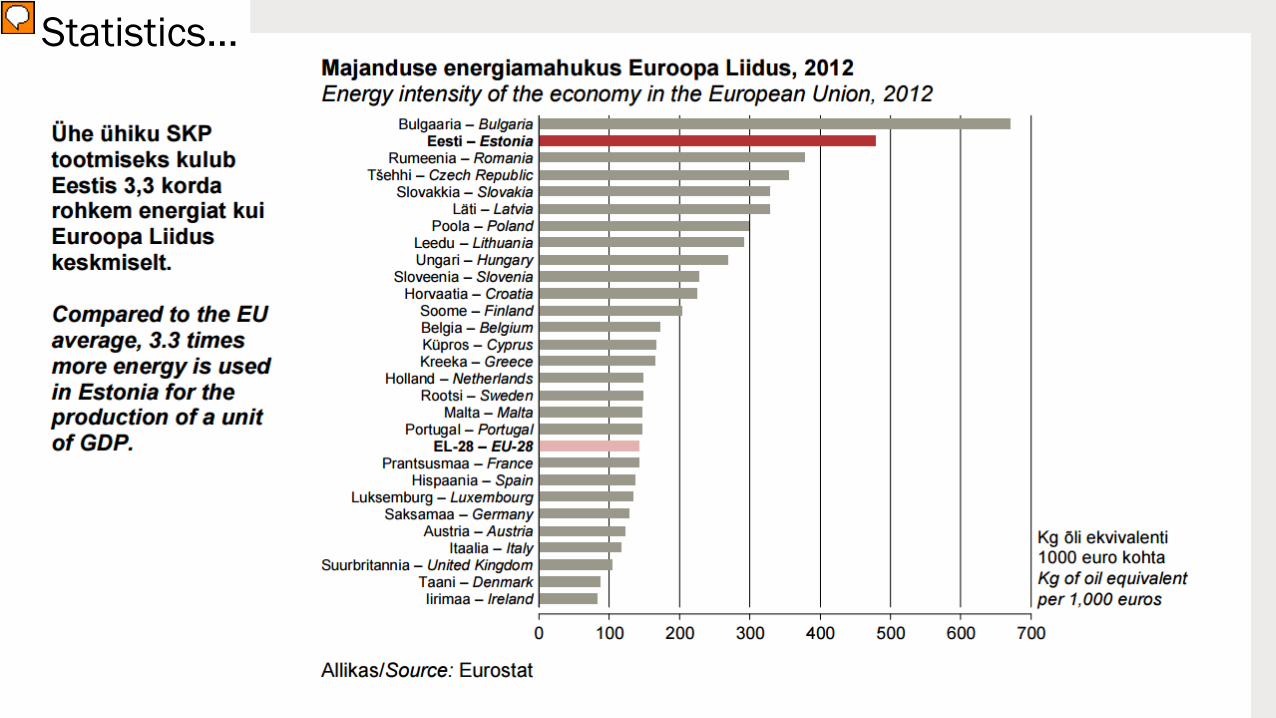
The energy intensity of the economy has decreased by a sixth compared to the time 10 years ago. Estonia is a country with a large energy consumption; the main reason is the low efficiency of energy production from oil shale (in Estonia, the efficiency of the production of electricity from oil shale is about 30%). In 2012, Estonia used 3.3 times more energy (479 kg of oil equivalent) for the production of a unit of GDP, compared to the average of the European Union (143 kg of oil equivalent). In order to reduce the energy intensity of the economy, it is necessary to take measures related to energy production, distribution networks as well as energy consumption.
Statistics...
Presenter
Presentation Notes
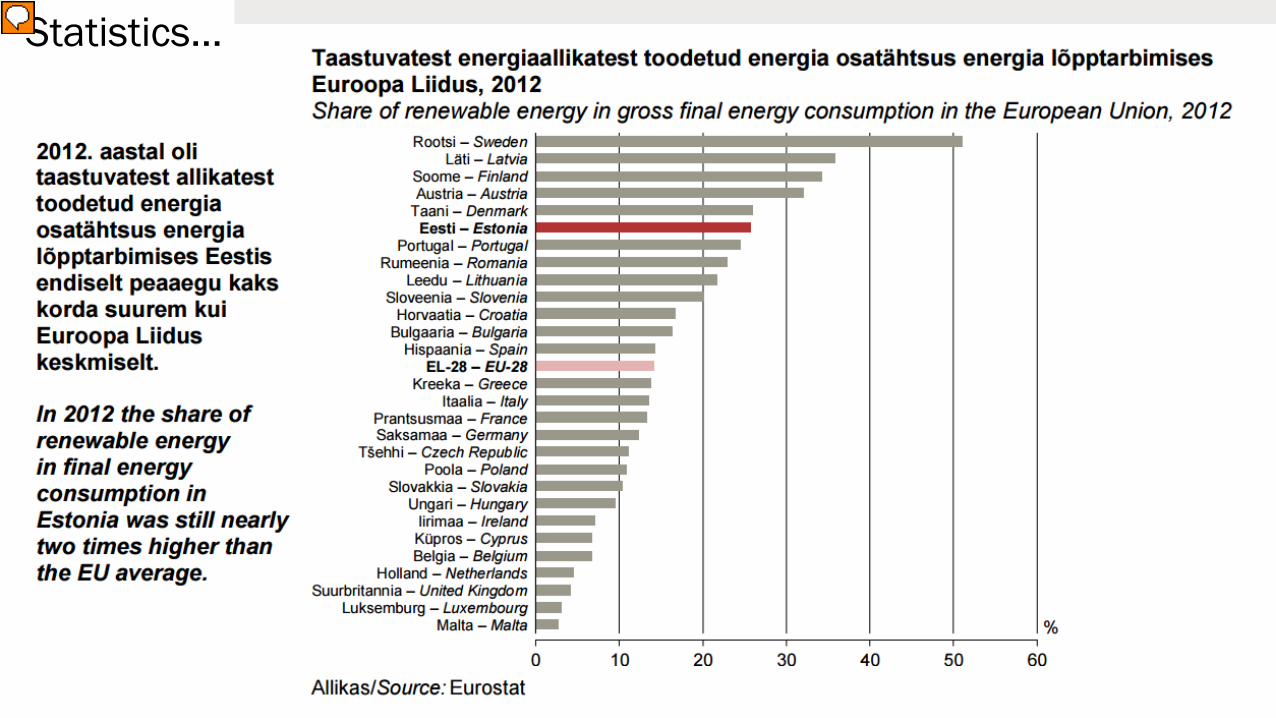
The bigger the share of energy produced from renewable sources in energy consumption, the greater the sustainability of the energy sector. The use of renewable energy reduces the dependence on fossil fuels. What is more, the production of energy from renewable sources generates fewer greenhouse gas emissions than energy production from fossil fuels. It also supports the creation of new jobs in production, has a favourable impact on social cohesion and contributes to the security of energy supply. In the European Union, the use of renewable energy sources is a priority of the energy policy, as it helps to reduce the dependence on fuel supply from non-EU countries, lower CO2 emissions and decouple energy costs from oil prices. The Council of Europe has set the target of increasing the average share of renewable energy in EU countries to 20% by 2020. The draft of the National Development Plan of the Energy Sector Until 2020 includes the following objective: the share of renewable energy in final consumption should be raised to 25% by 2020.
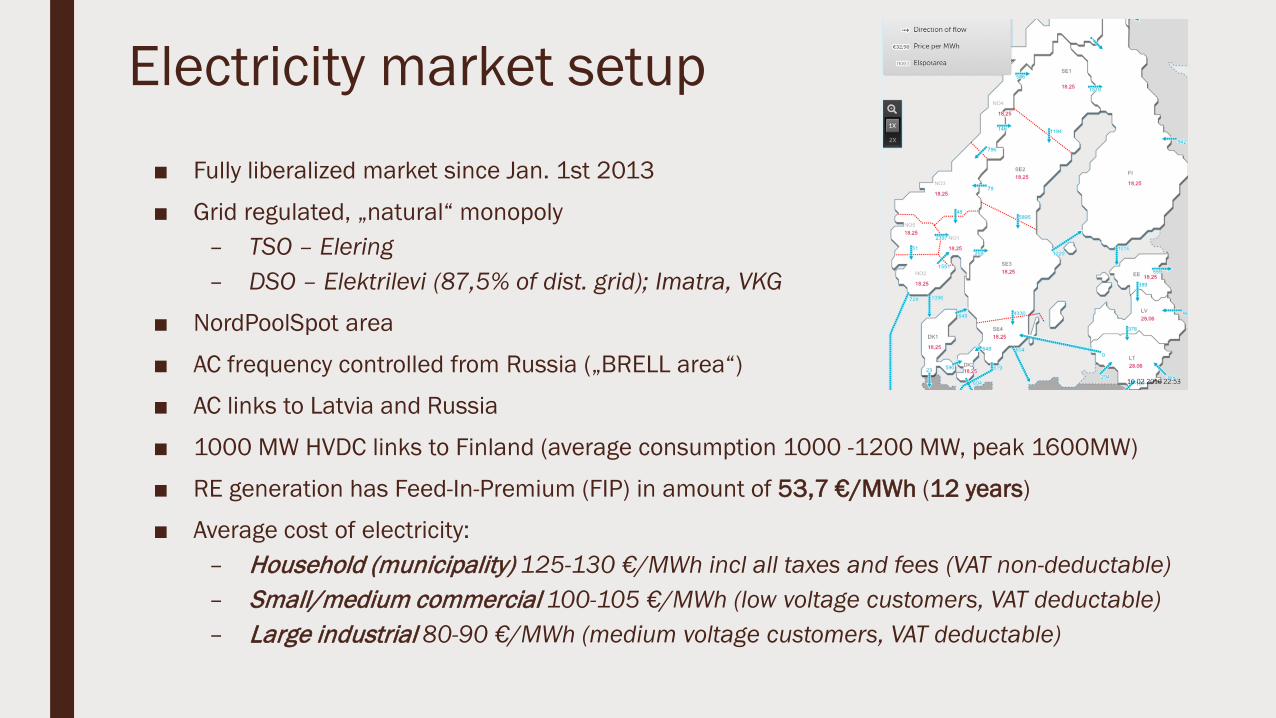
■ Fully liberalized market since Jan. 1st 2013
■ Grid regulated, „natural“ monopoly– TSO – Elering– DSO – Elektrilevi (87,5% of dist. grid); Imatra, VKG
■ NordPoolSpot area
■ AC frequency controlled from Russia („BRELL area“)
■ AC links to Latvia and Russia
■ 1000 MW HVDC links to Finland (average consumption 1000 -1200 MW, peak 1600MW)
■ RE generation has Feed-In-Premium (FIP) in amount of 53,7 €/MWh (12 years)
■ Average cost of electricity:– Household (municipality) 125-130 €/MWh incl all taxes and fees (VAT non-deductable)– Small/medium commercial 100-105 €/MWh (low voltage customers, VAT deductable)– Large industrial 80-90 €/MWh (medium voltage customers, VAT deductable)
Electricity market setup
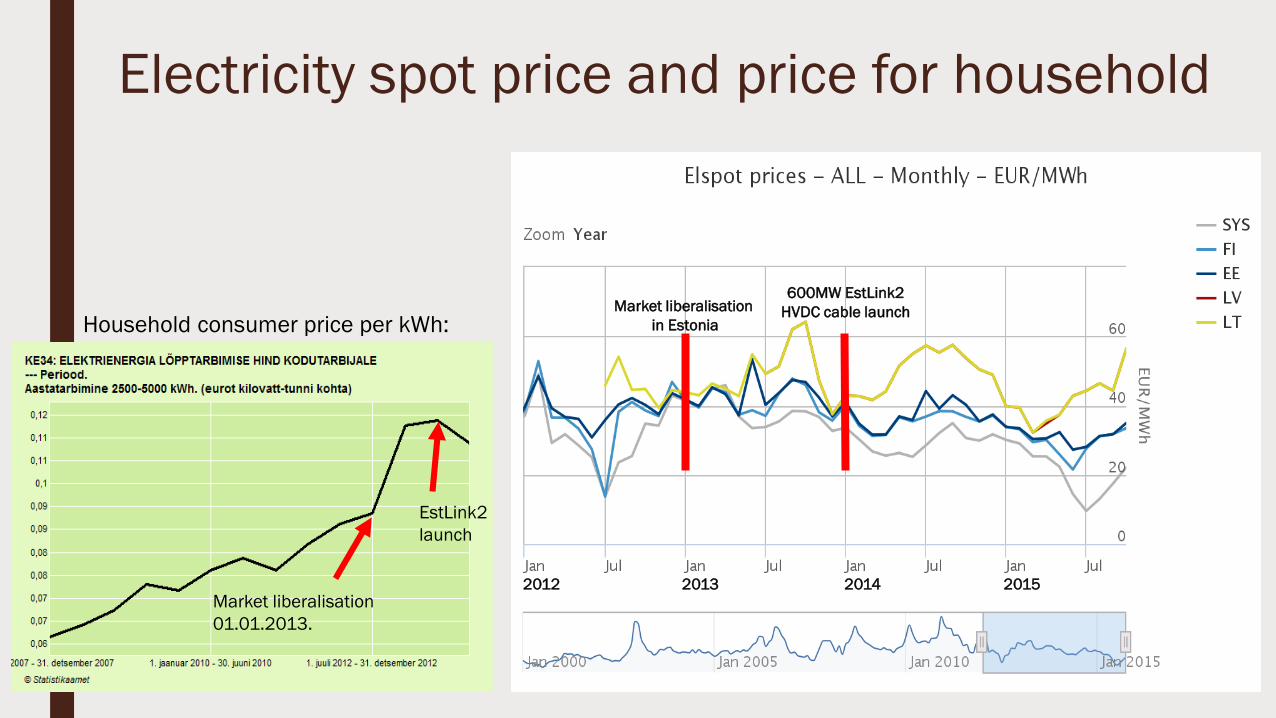
Electricity spot price and price for household
2012 2013 2014 2015
Market liberalisationin Estonia
600MW EstLink2HVDC cable launch
Market liberalisation01.01.2013.
EstLink2 launch
Household consumer price per kWh:

Solar PV sector in Estonia■ Total installed capacity ~ 6MW■ First grid-connected installations 2012 summer
– 1 M€ kick-off investment subsidy for households– No regulation for pro-sumer
■ Grid regulation■ Tax regulation
■ Households with PV installation ~ 500■ Average power of household installation ~ 7,5kW■ Annual revenue of the PV sector ~ 4,5 M€ (2015 estimate)■ Largest installations 300 – 400 kW■ Several MW-scale projects in pipeline■ 2015 – historically significant year – only capacities comissioned in Estonia
was solar PV
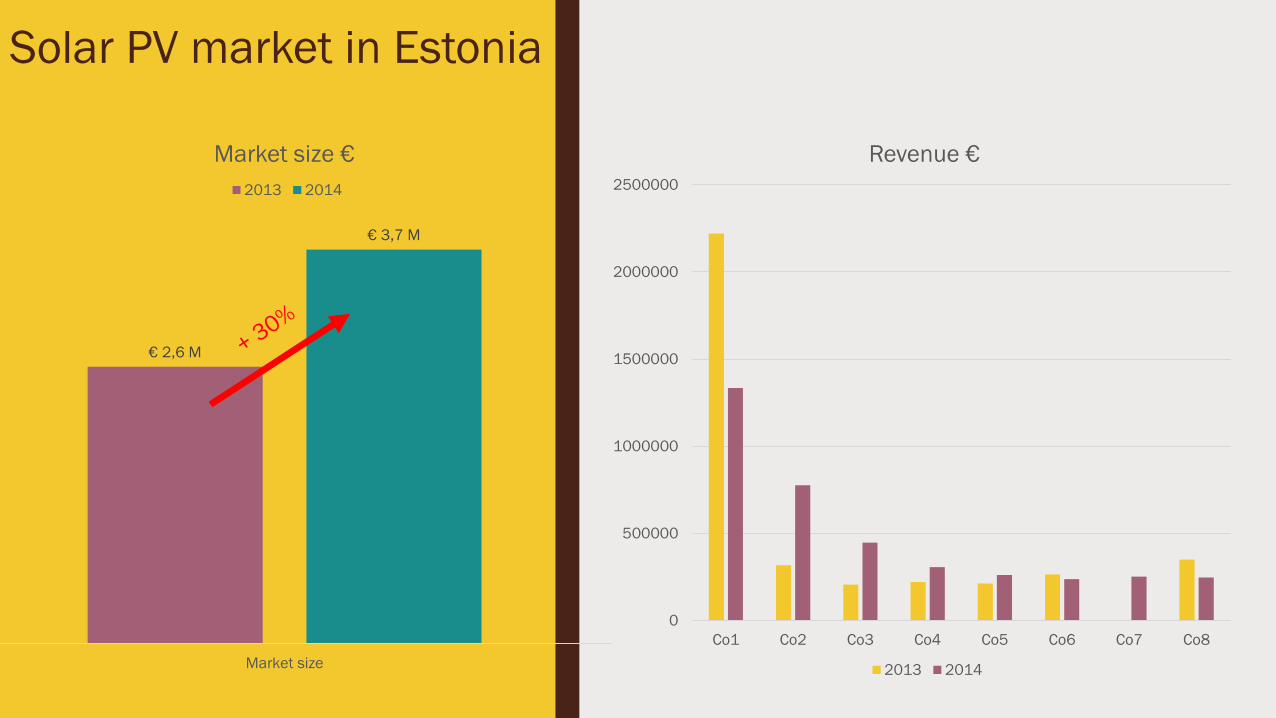
0
500000
1000000
1500000
2000000
2500000
Co1 Co2 Co3 Co4 Co5 Co6 Co7 Co8
Revenue €
2013 2014
€ 2,6 M
€ 3,7 M
Market size
Market size €2013 2014
Solar PV market in Estonia
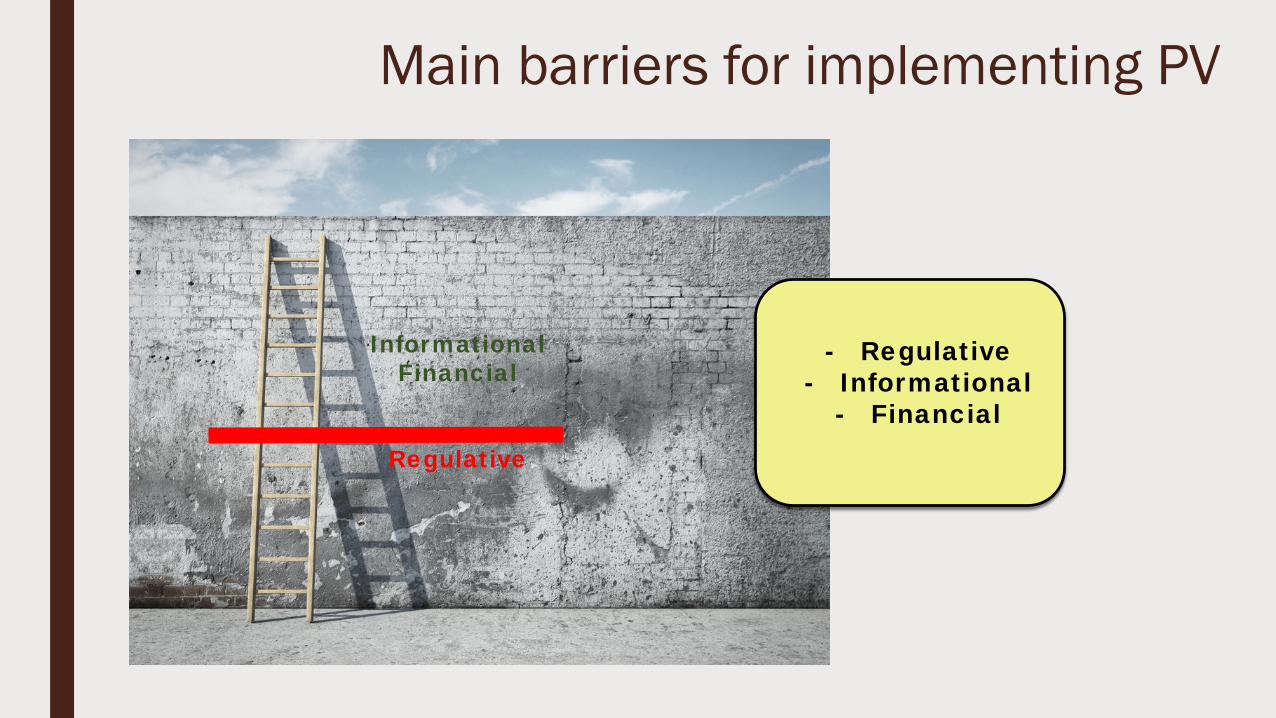
- Regulative- Informational
- Financial
Main barriers for implementing PV
Regulative
InformationalFinancial
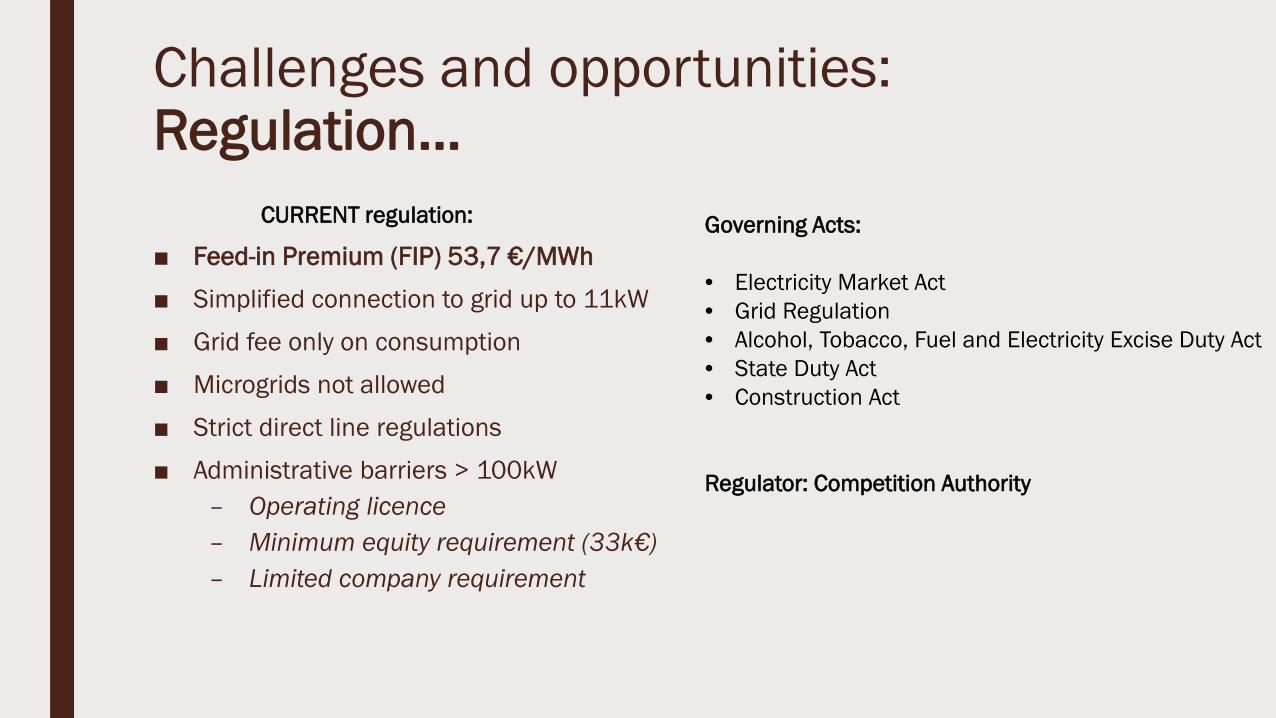
Challenges and opportunities: Regulation...
■ Feed-in Premium (FIP) 53,7 €/MWh■ Simplified connection to grid up to 11kW■ Grid fee only on consumption ■ Microgrids not allowed■ Strict direct line regulations■ Administrative barriers > 100kW
– Operating licence– Minimum equity requirement (33k€)– Limited company requirement
CURRENT regulation: Governing Acts:
• Electricity Market Act• Grid Regulation• Alcohol, Tobacco, Fuel and Electricity Excise Duty Act• State Duty Act• Construction Act
Regulator: Competition Authority
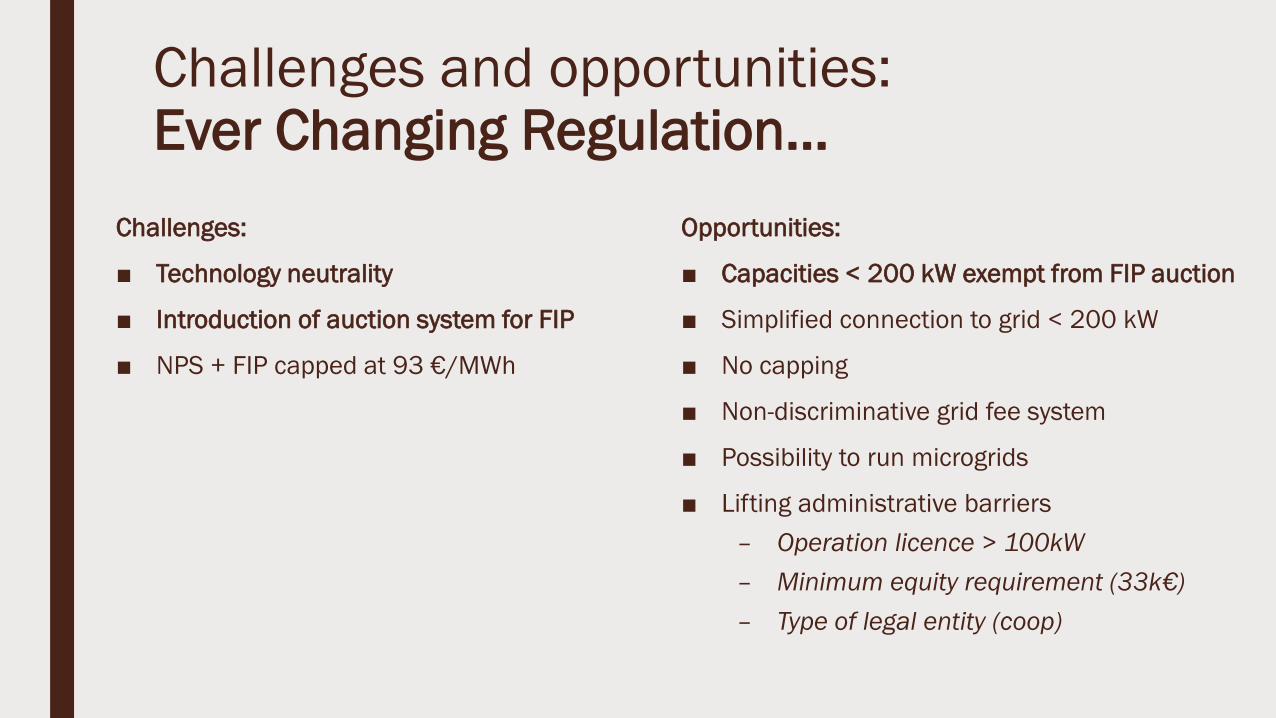
Challenges and opportunities: Ever Changing Regulation...
Challenges:
■ Technology neutrality
■ Introduction of auction system for FIP
■ NPS + FIP capped at 93 €/MWh
Opportunities:
■ Capacities < 200 kW exempt from FIP auction
■ Simplified connection to grid < 200 kW
■ No capping
■ Non-discriminative grid fee system
■ Possibility to run microgrids
■ Lifting administrative barriers– Operation licence > 100kW– Minimum equity requirement (33k€)– Type of legal entity (coop)
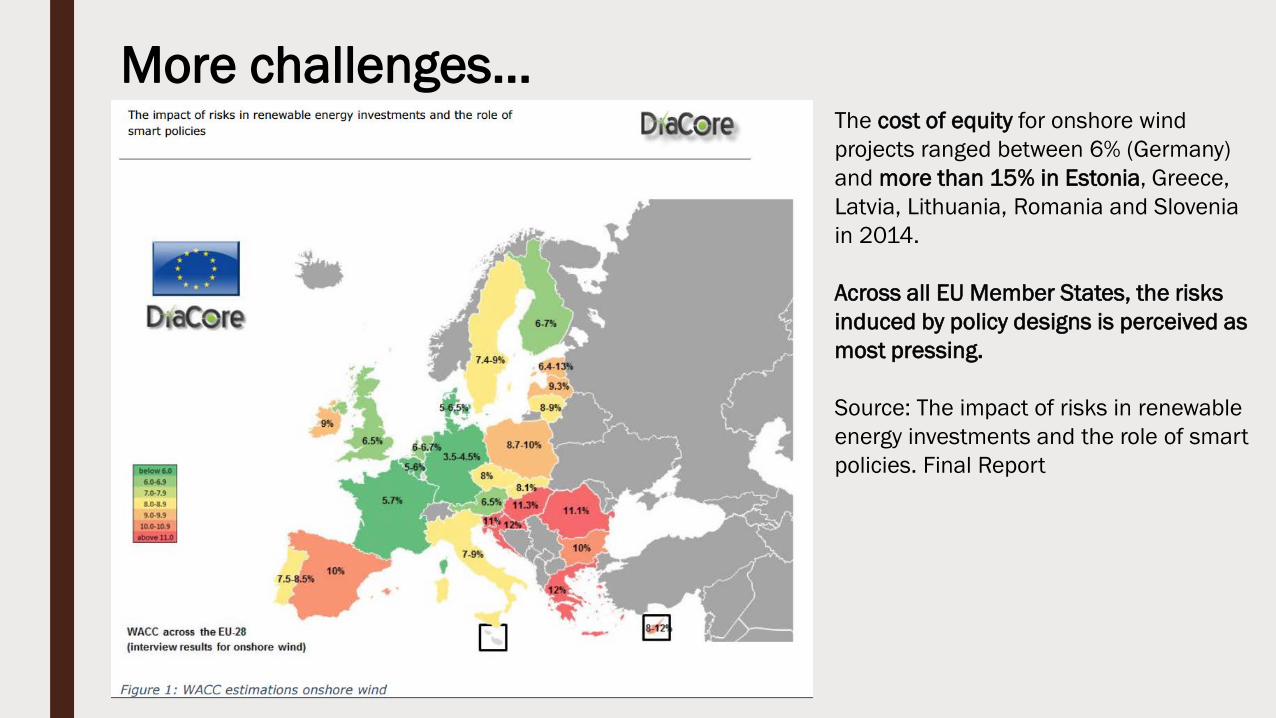
The cost of equity for onshore wind projects ranged between 6% (Germany) and more than 15% in Estonia, Greece, Latvia, Lithuania, Romania and Slovenia in 2014.
Across all EU Member States, the risks induced by policy designs is perceived as most pressing.
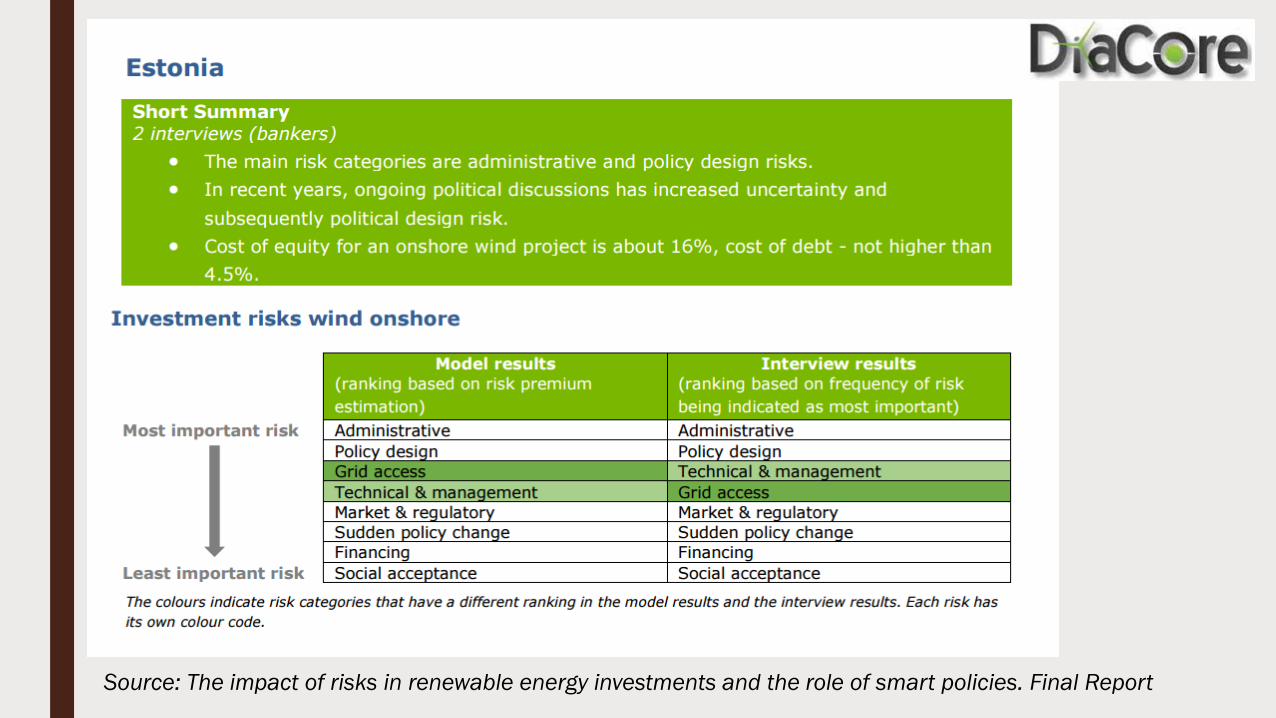
Source: The impact of risks in renewable energy investments and the role of smart policies. Final Report
More challenges...
Source: The impact of risks in renewable energy investments and the role of smart policies. Final Report
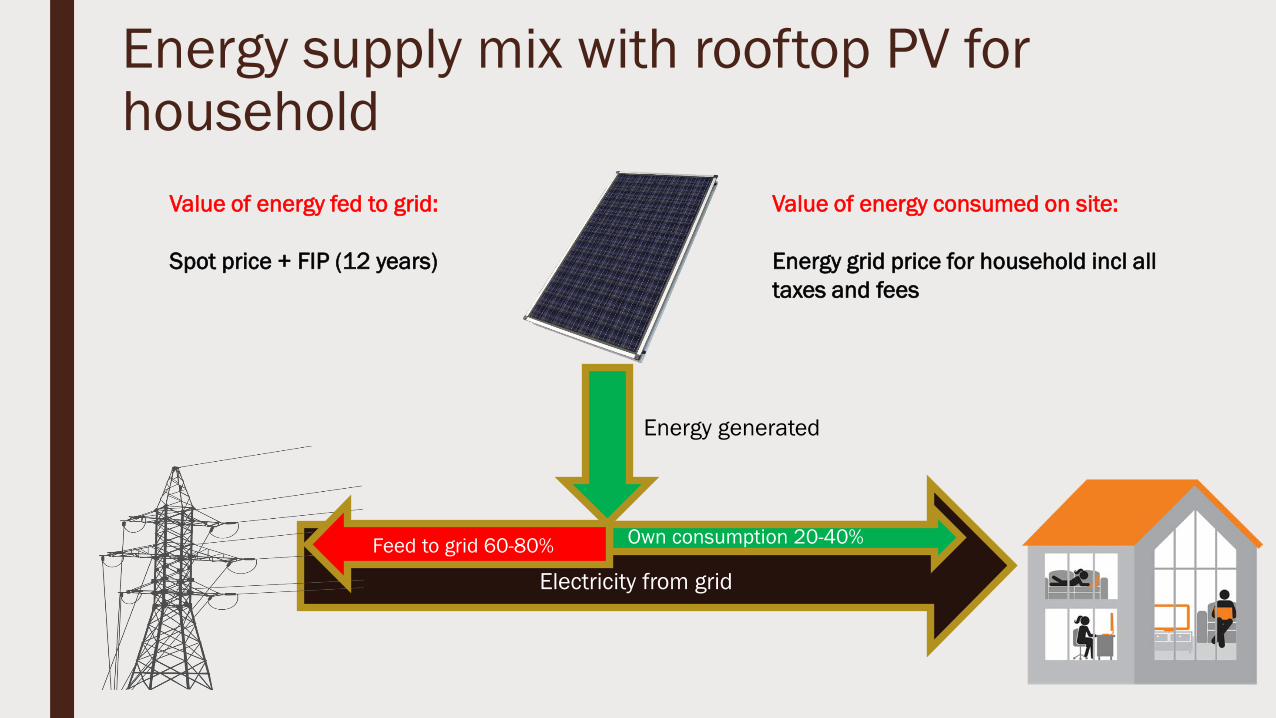
Energy supply mix with rooftop PV forhousehold
Electricity from grid
Energy generated
Feed to grid 60-80% Own consumption 20-40%
Value of energy fed to grid:
Spot price + FIP (12 years)
Value of energy consumed on site:
Energy grid price for household incl all taxes and fees
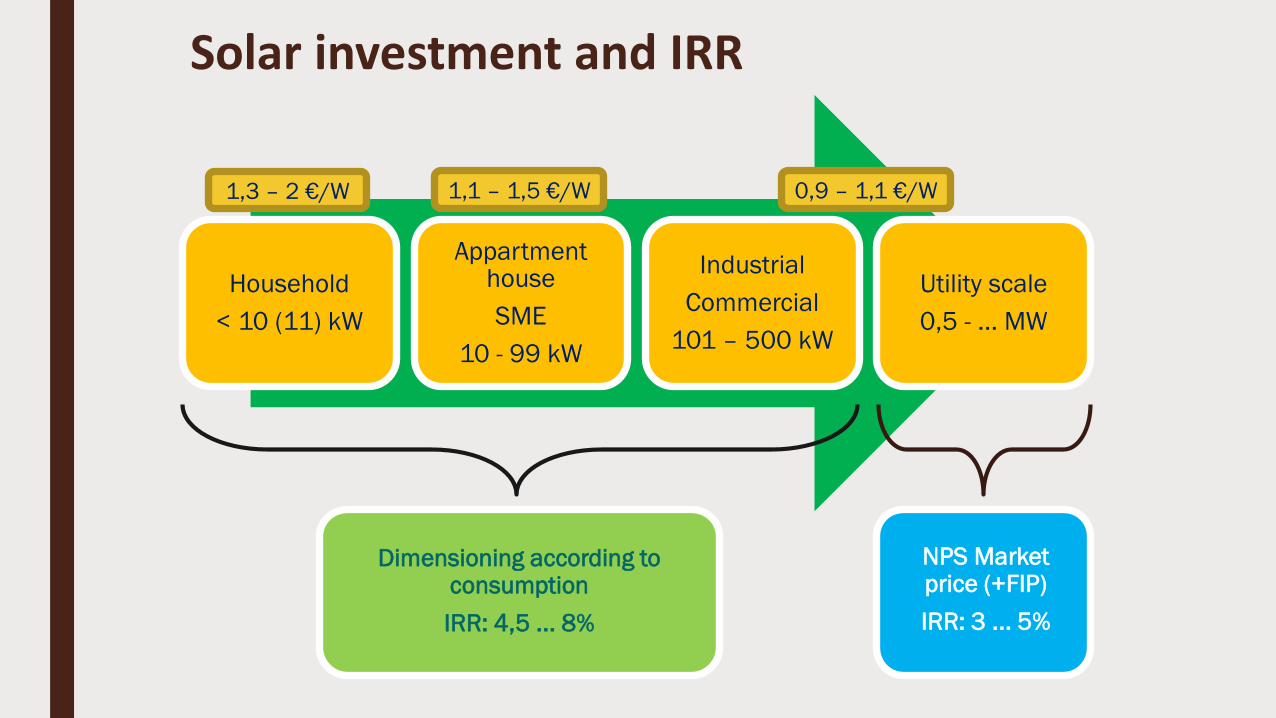
Solar investment and IRR
Household< 10 (11) kW
AppartmenthouseSME
10 - 99 kW
IndustrialCommercial
101 – 500 kW
Utility scale0,5 - ... MW
Dimensioning according toconsumptionIRR: 4,5 ... 8%
NPS Market price (+FIP)IRR: 3 ... 5%
1,3 – 2 €/W 1,1 – 1,5 €/W 0,9 – 1,1 €/W
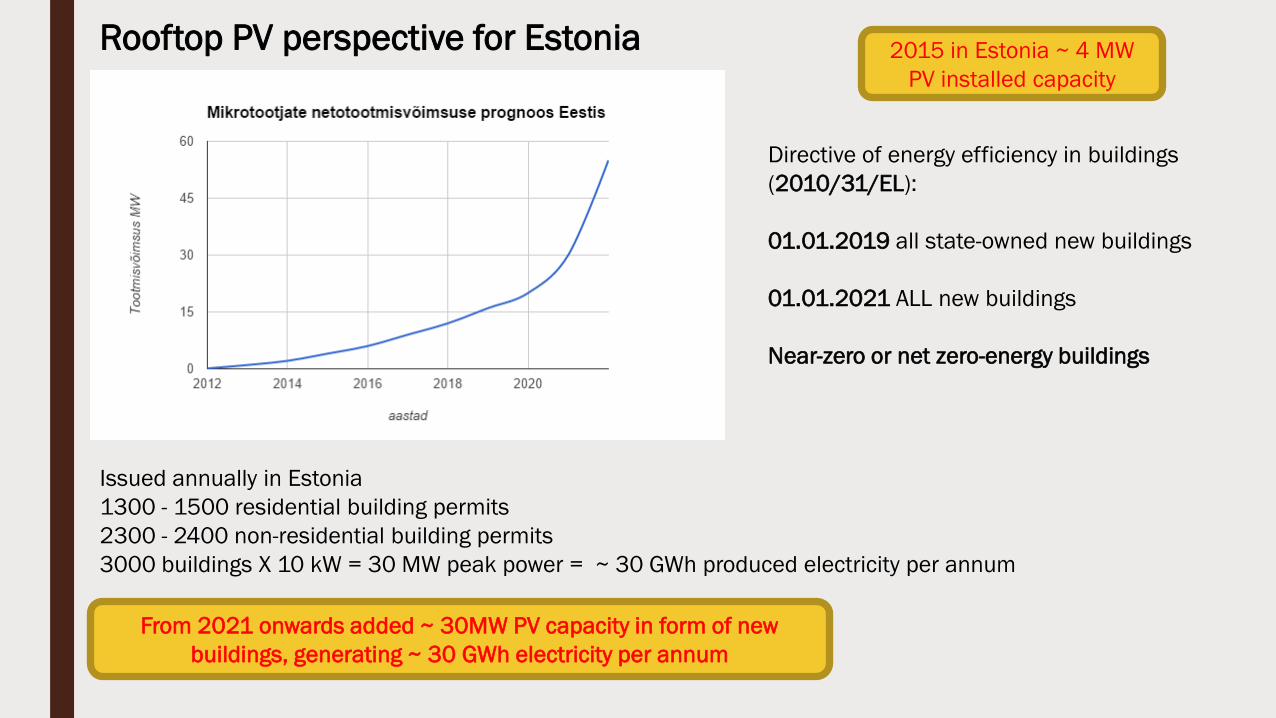
Rooftop PV perspective for Estonia
Directive of energy efficiency in buildings (2010/31/EL):
01.01.2019 all state-owned new buildings
01.01.2021 ALL new buildings
Near-zero or net zero-energy buildings
Issued annually in Estonia1300 - 1500 residential building permits2300 - 2400 non-residential building permits3000 buildings X 10 kW = 30 MW peak power = ~ 30 GWh produced electricity per annum
2015 in Estonia ~ 4 MW PV installed capacity
From 2021 onwards added ~ 30MW PV capacity in form of new buildings, generating ~ 30 GWh electricity per annum
Utility scale PV opportunities
■ Continued focus on own consumption
■ Environmental projects (closed landfill PV parks – 2 X 5MW in development)
■ Combined on-shore wind + PV (pilot Aburi 0,7MW in 2016?, Saaremaa)– Supplemental resources– Maximum utilisation of available grid connection capacities
Conclusion
■ Policy consistency needed– Main barrier for investment uncertainty
■ Fossile divestment plan not existing
■ Rather modest growth till early 2020-s
■ Energy efficiency targets are important trigger
■ DSR and storage technologies will also bring boost– Yet, we need storage 6 months, not 6 hours...
Estonian PV Energy Association
“I’d put my money on the sun and solar energy. What a source of power! I hope we don’t have to wait until oil and coal run out before we tackle that.” Thomas A. Edison, 1931
Ph: +3725014711