
Andrea Biviano INAF/ Oss.Astr.Trieste (Italy)adlibitum.oats.inaf.it/biviano/pasadena07.pdf · Stack...
75
Andrea Biviano INAF/ Oss.Astr.Trieste (Italy) In collaboration with: Peter Katgert (NL) Paolo Salucci (I) Marisa Girardi (I) Alain Mazure (F)
Transcript of Andrea Biviano INAF/ Oss.Astr.Trieste (Italy)adlibitum.oats.inaf.it/biviano/pasadena07.pdf · Stack...

Andrea BivianoINAF/
Oss.Astr.Trieste(Italy)
In collaboration with:
Peter Katgert (NL)Paolo Salucci (I)Marisa Girardi (I)Alain Mazure (F)

Talk outline:
• Historical review
• Motivations
• Methods
• Results:➔ the mass profiles of the different cluster components➔ the orbits of galaxies in clusters
• Perspectives

What are galaxy clustersmade of?
• GalaxiesGalaxies• Intra-cluster (IC) gas• Dark matter


Historical review

Clusters of galaxiesgalaxies known since 1784(Messier’s objects in Virgo)andcatalogued by Herschel since1785: Coma, Leo, UMa, Hydra, etc.
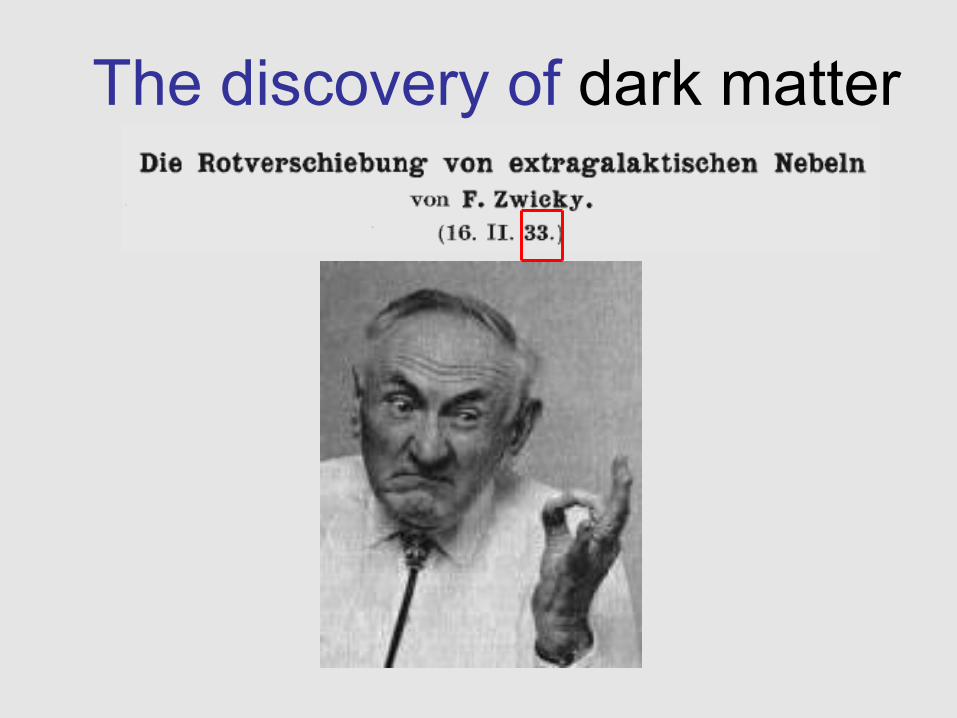
The discovery of dark matter

The discovery of dark matter
The discovery of the intracluster gas
Limber (1959) + Felten et al. (1967) + Cavaliere et al. (1971): predict galaxy clusters contain hot, diffuse gas,detectable in X-ray through its bremsstrahlung thermal emission
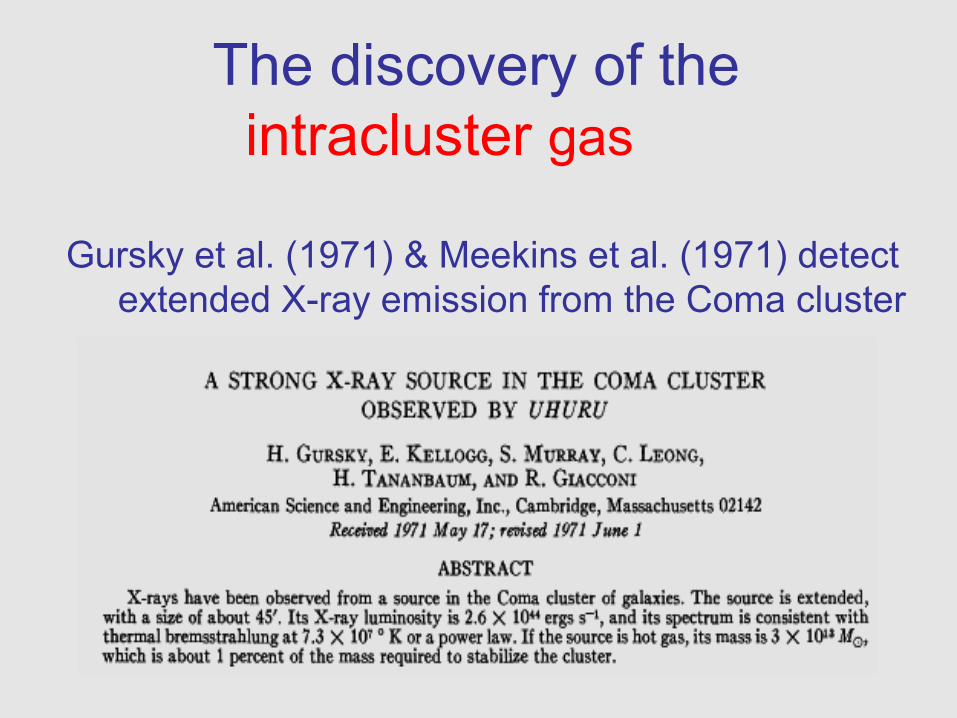
The discovery of the intracluster gas
Gursky et al. (1971) & Meekins et al. (1971) detect extended X-ray emission from the Coma cluster

Zwicky’s discovery of dark matter is not secure because of many assumptions
Using intracluster gas rather than galaxiesgalaxies as tracers of the potential confirms the darkmatter problem
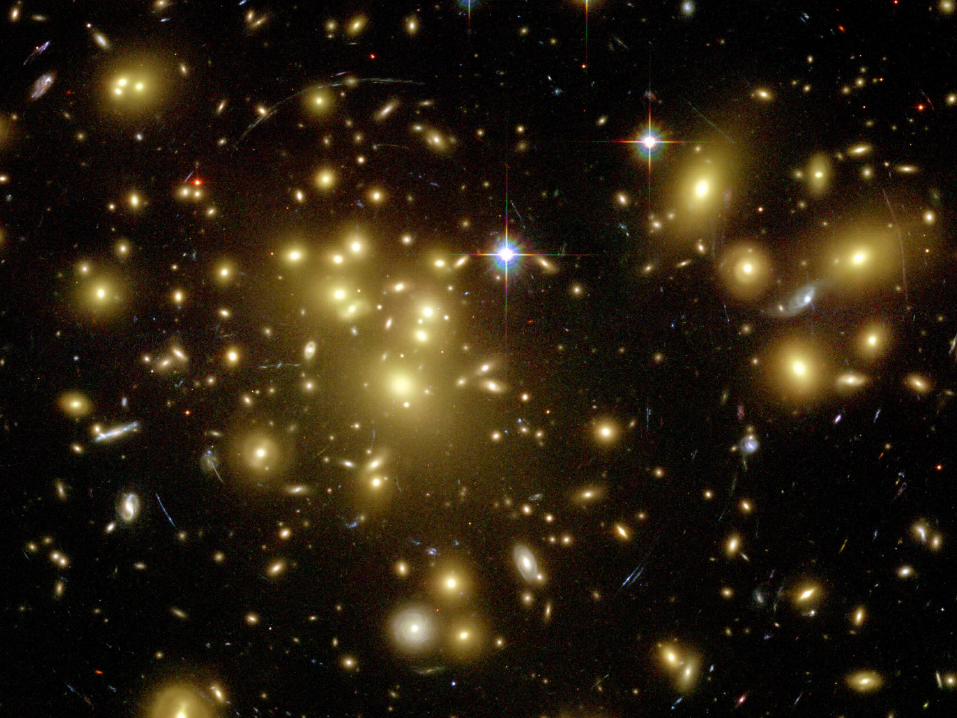
Best confirmation comes from the discoveryof gravitational lensesgravitational lenses in galaxy clusters!

Gravitational lensing:Gravitational lensing: predicted by Zwicky (1937)
…and foundby Soucail etal., 50 yearslater!

Motivations

Deconstructing galaxy clustersDeconstructing galaxy clusters in their 3 main componentsin their 3 main components
Why is it important?
• Test nature of DM• Test cosmological models of structure formation and learn about galaxy evolutiongalaxy evolution

Nature of dark matter:Nature of dark matter:‘‘classical’ CDM or self-interacting?classical’ CDM or self-interacting?
Cosmological numerical simulationsof structure formation with Cold Dark Matter
predict a ‘universal’ density profile of DM halos(Navarro, Frenk & White 1996, 1997):

Nature of dark matter:Nature of dark matter:cold or self-interacting?cold or self-interacting?
CDM ‘universal’ density profile of DM halosis cuspy at the halo center:
Does not fit observed density profiles of galaxies(de Blok & Bosma 2002, Gentile et al. 2004, Borriello et al. 2003)
→ alternative to CDM proposed (Spergel & Steinhardt 2000): Self-Interacting DM could fit galaxy density profilesby reducing the halo central density concentration
(if SIDM cross-section is large enough)

Models of structure formation:Models of structure formation:energy transfer from galaxies to DM? energy transfer from galaxies to DM?
GalaxiesGalaxies are subject to dynamical frictiondynamical friction:
Galaxies tranfer part of their orbital energyto the DM, thus heating up the originally formed cusp.
→ The DM distribution becomes core-like,while the total masstotal mass distribution remains cuspy
(El Zant et al. 2001)

Models of structure formation:Models of structure formation:DM adiabatic contraction? DM adiabatic contraction?
BaryonsBaryons sink dissipatively (cooling flows)→ Such infall perturbs the DM distribution,
pulling it inward, making the DM profile cuspier
(Blumenthal et al. 1986)

Learn about galaxy evolution Learn about galaxy evolution Must determine galaxies galaxies orbits
to solve the Jeans equation
Learning how galaxies move in clusters as a f=f(Mcl,zcl,type) constrains:
• the hierarchical accretion scenariothe hierarchical accretion scenario(do we see evidence for infall?)
and • the evolution mechanism of galaxy typesthe evolution mechanism of galaxy types
(do the orbits of galaxies affect their properties?e.g. via tidal stripping if pericenter is small, etc…)

Methods

The relative distribution of theThe relative distribution of the different cluster componentsdifferent cluster components
BaryonicBaryonic component:component: galaxiesgalaxies + IC gas
Need:
• magnitudes and colours (spectra)magnitudes and colours (spectra) of galaxies in the cluster fieldof galaxies in the cluster field • X-ray surface brightness profile of diffuse intracluster gas

Dark Matter component:
invisible, determine it via the gravitational signal of the total mattertotal matter, then subtract the baryonic matterbaryonic matter. To determine the cluster gravitational signal, use:
• cluster galaxies (need spectra) cluster galaxies (need spectra) or• diffuse IC gas (need its X-ray spectrum) as tracers of the potential, or use:• lensing effect (need high-res imaging)lensing effect (need high-res imaging)

Mass estimate using galaxiesMass estimate using galaxies
Use the Jeans equation for the dynamical equilibrium of a spherically symmetric system:
r, clustercentric radial distance
<vr2>, radial component of velocity dispersion
ν, number density of cluster galaxies β, velocity anisotropy:

Mass estimate using galaxies:Mass estimate using galaxies:
only projected quantities are available:
R, projected clustercentric distanceI(R), projected galaxy number densityσp
2(R), l.o.s. velocity dispersion profile
Using Abel inversion (Mamon & Boué 2006)
I(R) & σp2(R) → ν(r) & <vr
2>(r) → M(r)
…if the velocity anisotropy β is known!

Mass estimate using X-rays:Mass estimate using X-rays:
Use the Jeans equation for thedynamical equilibrium of a sphericallysymmetric system:
r, clustercentric radial distanceT, temperature of diffuse intracluster gasνgas, gas density

Lensing mass estimate:Lensing mass estimate:
Very direct:
determine the distorsion pattern of theimages of background galaxies
and/or model the potential to reproducethe shapes and positions of multiple images of the same sources
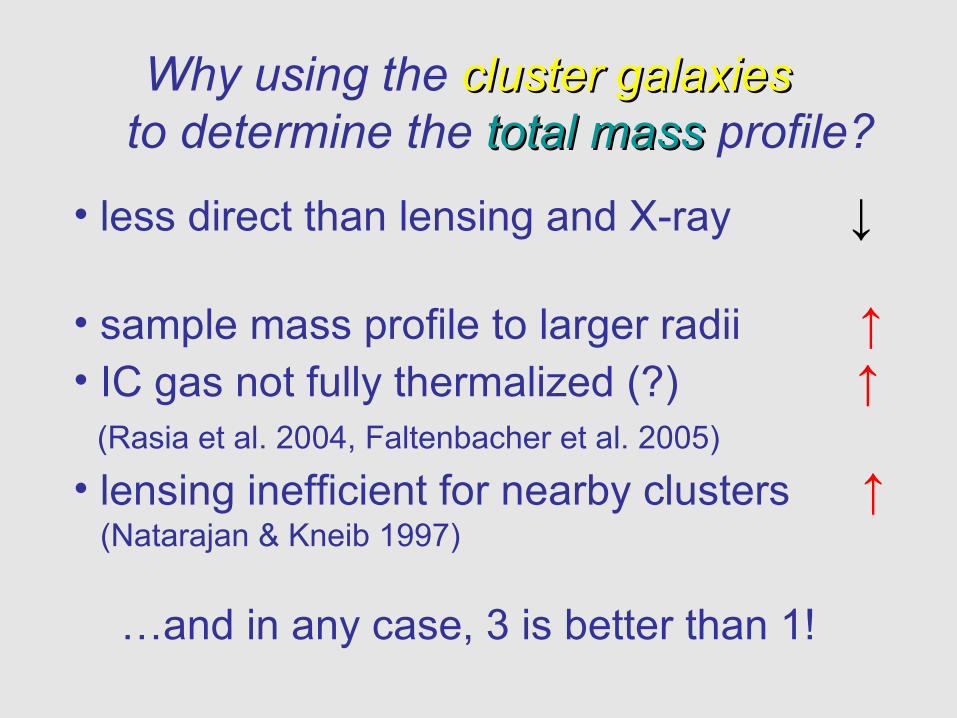
Why using the cluster galaxies cluster galaxies to determine the total masstotal mass profile?
• less direct than lensing and X-ray ↓
• sample mass profile to larger radii ↑• IC gas not fully thermalized (?) ↑ (Rasia et al. 2004, Faltenbacher et al. 2005)
• lensing inefficient for nearby clusters ↑ (Natarajan & Kneib 1997)
…and in any case, 3 is better than 1!

Results:
The mass profiles ofthe different cluster components

Our galaxy data-set: subset of ENACS +Our galaxy data-set: subset of ENACS +
2900 galaxies identified as members of 59 clusters with redshifts, positions, magnitudes, types

Stack the 59 clusters together to buildStack the 59 clusters together to buildan ‘ensemble’ cluster an ‘ensemble’ cluster → better statistics→ better statistics
For stacking, scale clustercentric distances, R,with the cluster virial radii, r200, and galaxyvelocities, v-<vcluster>, with the cluster velocitydispersion, σp.
• Both r200 and σp are reliable quantities (B. et al. 2006, test on num. simulations)• Non-sphericity of clusters is not important• The ensemble cl. is representative of cl.s on average (van der Marel et al. 2000, test on models)

The ensemble cluster in projected phase-space

4 subsamples need to be distinguished:
Bright ellipticals early-type galaxies
early-type spirals late-type spirals and irrs

Select early-type galaxiesearly-type galaxies as our fiducial tracers of the cluster potential:

Determine galaxy number density profile, I(R),galaxy number density profile, I(R),and l.o.s. velocity dispersion profile σp(R) forthe selected population of tracers:

Determine galaxy number density profile, I(R),and l.o.s. velocity dispersion profile l.o.s. velocity dispersion profile σσpp(R)(R) forthe selected population of tracers:

The shape of the tracer velocity distribution→ constrains the tracer velocity anisotropy βvelocity anisotropy β(e.g. Merritt 1987, van der Marel et al. 2000)

Compare moments of the Gauss-Hermite polynomial fit to the obsd velocity distribution with those predicted for distribution function models with constant velocity anisotropy(van der Marel et al. 2000):
→ Early-type galaxies have aquasi-isotropic velocity distribution:

I(R) & σp2(R) & β → ν(r) & <vr
2>(r) → M(r)observables & anisotropy 3d quantities mass profile
Total massTotal mass
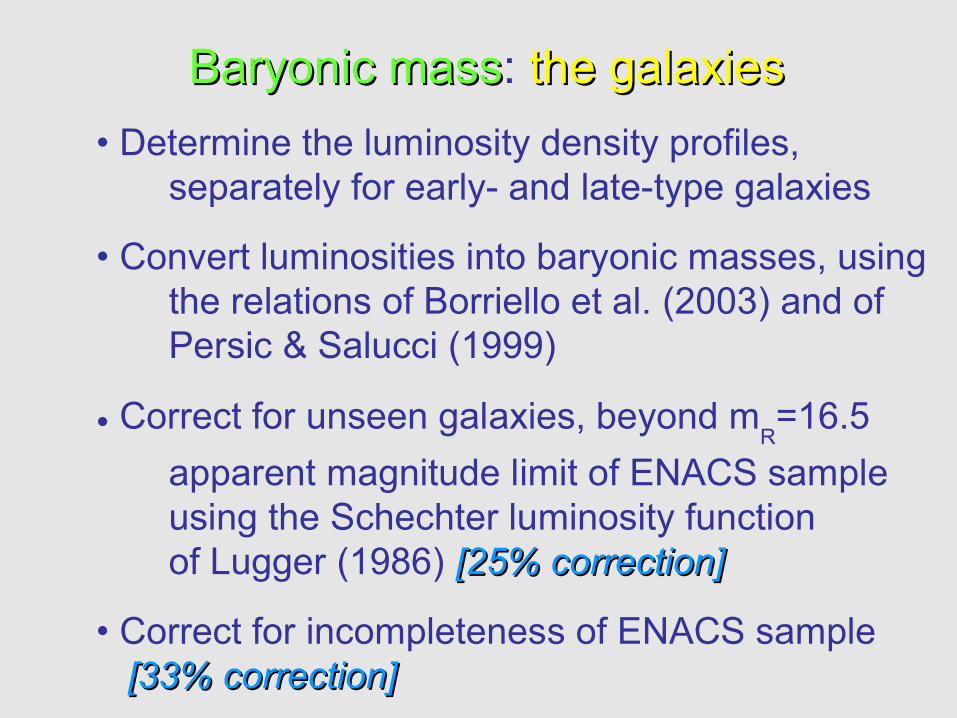
Baryonic massBaryonic mass: the galaxiesthe galaxies
• Determine the luminosity density profiles, separately for early- and late-type galaxies
• Convert luminosities into baryonic masses, using the relations of Borriello et al. (2003) and of Persic & Salucci (1999)
• Correct for unseen galaxies, beyond mR=16.5
apparent magnitude limit of ENACS sample using the Schechter luminosity function of Lugger (1986) [25% correction][25% correction]
• Correct for incompleteness of ENACS sample [33% correction][33% correction]

Relation between luminosity and baryonicmass for early-type galaxies derived frommodelling the fundamental plane of ellipticals:
Analogous relationfor late-type galaxiesderived from: models ofspiral rotation curves,stellar pop.s templates,and HI measurements

Baryonic massBaryonic mass: the galaxiesthe galaxies
early+lateearly+late
earlyearly
latelate

Baryonic massBaryonic mass: the IC gas
• IC gas density profiles unavailable for all clusters of our sample, → use another cluster sample
• Reiprich & Böhringer’s (2002) sample: based on the Rosat All Sky Survey, 106 clusters with measured X-ray surface brightness profiles
• Model fits to the measured s.b. profiles:
That deproject into:
(note: here β is not the velocity anisotropy!)

Baryonic massBaryonic mass: the IC gas
• Bootstrap extraction of a subset of 59 clusters with a mass distribution similar to that of our sample
• Take the average values of the fitting parameters for the gas density profile
• Integrate the average gas density profile to determine the IC gas mass profile, apart from a constant
• Fix the constant from the ratio Mgas/Mtotal (r=r200) determined by Ettori (2003) from BeppoSAX observations, = 0.11 ± 0.03

Baryonic massBaryonic mass: the IC gas
Red line: accounting for the uncertain extrapolation of the gas density profile at large radii (Neumann 2005)

Baryonic massBaryonic mass = galaxiesgalaxies + IC gasDark mass = Total massTotal mass – baryonic massbaryonic mass
...but dark matter can be diffuse or clumped, i.e. linked to individual galaxies (subhaloes)
→ need to estimate DM in subhaloes
Definition: DM (sub)halo of the central galaxy identified with cluster diffuse DM (e.g. Lin & Mohr 2004, Murante et al. 2004, Zaritsky et al. 2006)

DM in subhaloes
Previously determined luminosity density profiles ofearly- and late-type galaxies +
+ scaling relations between a galaxyluminosity and its halo mass (Shankar et al. 2006)
Taking into account that:
Galaxy haloes cannot survive very near the cluster center (tidal stripping and overlap arguments)
[also: grav. lensing, Natarajan et al. 2002, Gavazzi et al. 2004][also: grav. lensing, Natarajan et al. 2002, Gavazzi et al. 2004]

DM in subhaloes
Shankar et al.’s relation determined from theoretical mass function of subhaloes and observed galaxy stellar mass function …
… compares very well withobservationally determinedmass function of subhaloes(Mandelbaum et al. 2006, galaxy-galaxy grav. lensing signal, SDSS data)

DM in subhaloes
Red line: ‘strong stripping’ scenario, 50% total mass in subhaloes lost at any radii (num. sims., Gao et al. 2004)

GalaxiesGalaxies + IC gas = Baryonic massBaryonic mass
Total massTotal mass – baryonic mass baryonic mass – subhalo DM = diffuse DM

Mass fractions of the different clustercomponents as a function of radius
diffuse DM
subhalo DM
baryonsbaryonsIC gas
galaxiesgalaxies

The circular velocity profiles of the different cluster components
total masstotal mass
diffuse DM
subhalo DMbaryonsbaryonsIC gas
galaxiesgalaxies

Fitting models to the Vc(r) profiles
The cuspy model of NFW, motivatedby cosmological num. simulations with CDM:
…vs. the cored model of Burkert (1995),motivated by the problems of NFW on galacticscales (e.g., de Blok et al. 2003, Gentile et al. 2004):

Fitting models to the Vc(r) profiles Dark matter NFWNFW vs. BurkertBurkert
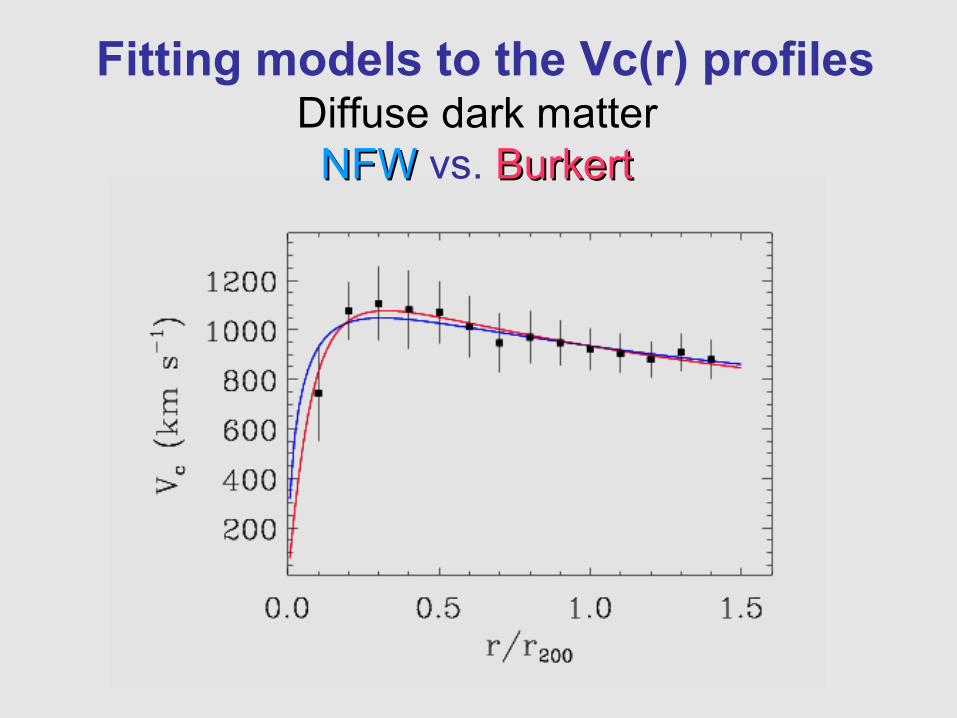
Fitting models to the Vc(r) profiles Diffuse dark matter NFWNFW vs. BurkertBurkert

Fitting models to the Vc(r) profiles Diffuse DM, strong stripping scenario NFWNFW vs. BurkertBurkert

Summary of results (a)
•Diffuse DM dominates total mass at all radii
•Subhaloes account for ≤23% mass within r200
•Baryons account for ≈14% mass within r200
•Baryon fraction changes with r, by ±30%
•IC gas dominate baryons, except at r~0
•Baryons in Es more concentrated than DM
•Baryons in Ss less concentrated than DM
•IC gas mass fraction increases as r0.4

Summary of results (b)
• DM, whether in its diffuse form, or also accounting for subhalo DM, almost equally well fit by cuspy and core density models
• The best fitting NFW parameter c = r200/rs = 5±1 (7±2), is as predicted by cosmo. num. sims.

Observed vs.predicted concentration parameter of NFW profile for systems of different mass

Summary of results (c)
• The best fitting Burkert core-radius is small, 0.1 r200 ~ size of central cD → DM scattering cross section <2 cm2 g-1
(By comparison with simulation res. of Meneghetti et al. 2001)
Much smaller than the 5 cm2g-1 needed to fit dwarf galaxy mass density prof., Davé et al. (2000)
• DM is more concentrated than the total matter
Dynamical friction mechanism ineffective in transferring galaxy energy to DM in clusters or counteracted by adiabatic contraction
(e.g. Zappacosta et al. 2006)

Results:
The orbits of galaxies in clusters
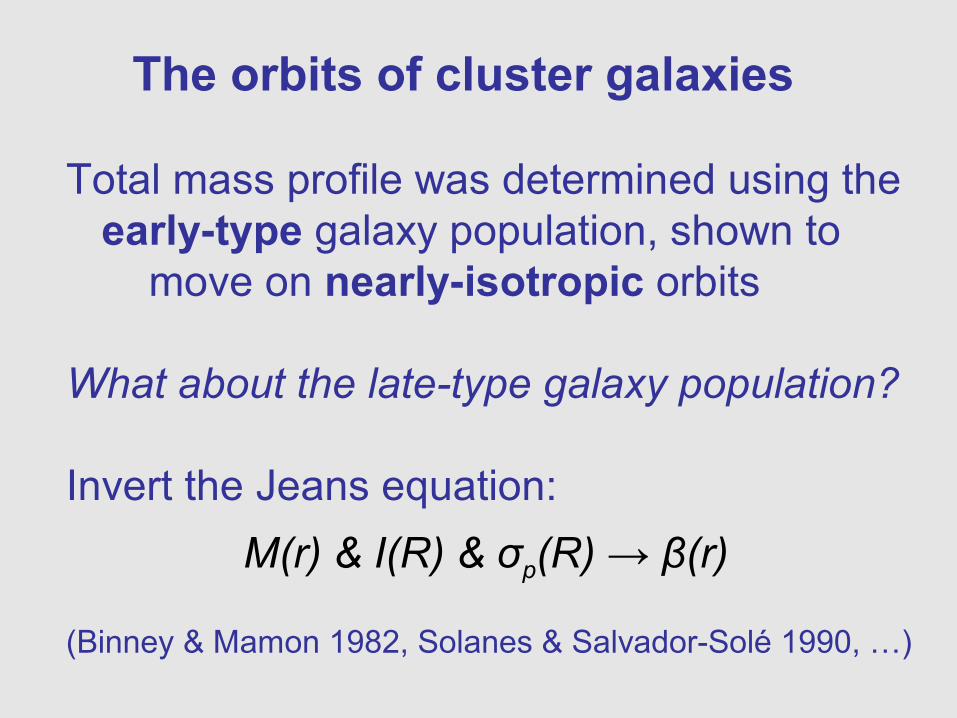
The orbits of cluster galaxies
Total mass profile was determined using the early-type galaxy population, shown to move on nearly-isotropic orbits
What about the late-type galaxy population?
Invert the Jeans equation:
M(r) & I(R) & σp(R) → β(r)
(Binney & Mamon 1982, Solanes & Salvador-Solé 1990, …)

The early Spirals are in dynamical equilibriumwith the cluster potential and move on nearlyisotropic orbits, just as the early-type galaxies
Isotropicsolutionof theinverseJeans eq.
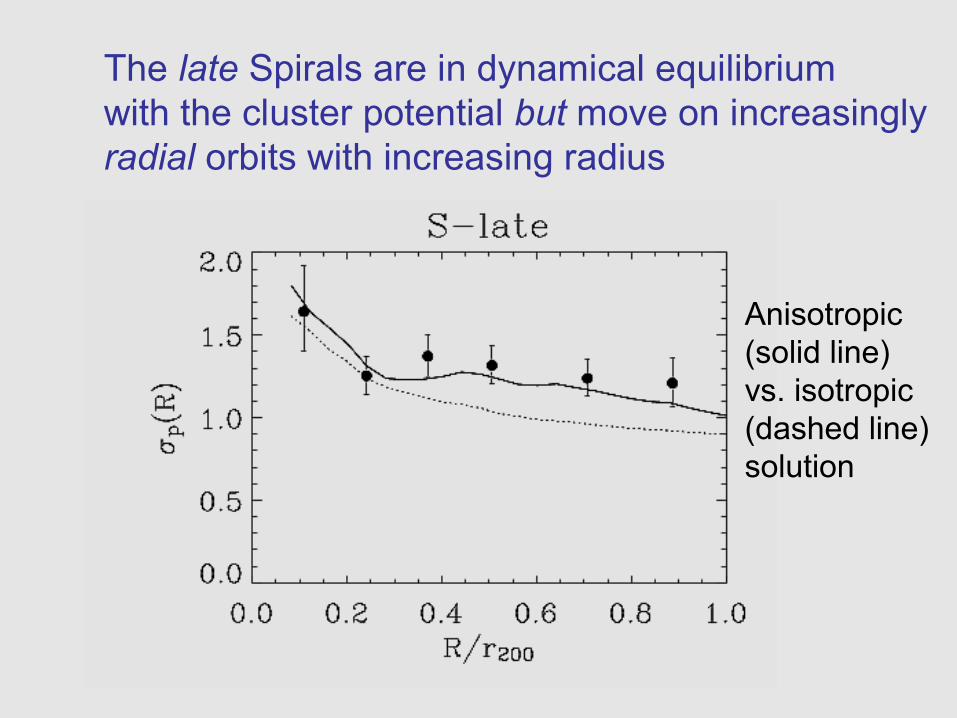
The late Spirals are in dynamical equilibriumwith the cluster potential but move on increasinglyradial orbits with increasing radius
Anisotropic(solid line)vs. isotropic(dashed line)solution

The late Spirals are in dynamical equilibriumwith the cluster potential but move on increasinglyradial orbits with increasing radius

The orbits of cluster galaxies:
• Ellipticals, S0s, early-Spirals (Sa-Sb) move on isotropic orbits
• Late-Spirals (Sbc...) and Irr move on mildly radial orbits
Suggesting the former are a dynamically oldcluster population, the latter retain memory of their recent infall from the field
Studying orbits of cluster galaxies as a f(Mcl,z)provides infos on cluster hierarchical growth& galaxy transformation processes

The orbits of cluster galaxies:
At higher z (≈0.3): CNOC cluster sample
Early-type galaxies have ~isotropic orbits Late-type galaxies orbits not analysed (van der Marel et al. 2000)
However:
• Early-type galaxies have similar I(R) and σp(R) at z≈0 and at z≈0.3 • Also late-type galaxies have similar I(R) and σp(R) at z≈0 and z≈0.3

The projected phase-space distributionsof nearby and distant cluster galaxies of early- and late-type
I(R) profiles for early- (empty symbols) and late- (filled symbols) cluster galaxies
nearbynearby distantdistant

The projected phase-space distributionsof nearby and distant cluster galaxies of early- and late-type
σp(R) profiles for early- (empty symbols) and late- (filled symbols) cluster galaxies
nearbynearby distantdistant

The orbits of cluster galaxies:
At higher z (≈0.3): CNOC cluster sample
• Early-type galaxies have ~isotropic orbits, Late-type gal.s not analysed (van der Marel et al. 2000)
• Early-type galaxies have similar I(R) and σp(R) at z≈0 and at z≈0.3 • Also late-type galaxies have similar I(R) and σp(R) at z≈0 and z≈0.3
→ Late-type galaxies at z≈0.3 on mildly radial orbits like their nearby counterparts
But the fraction of late-type galaxies ↓ as z→0:as the orbit of a galaxy isotropizes, its type changes!

Work in progress and future work
• Investigate physical mechanisms leading to the orbital evolution of galaxies using num. sims. (with Borgani, Murante & co.)
• CDM-predicted profiles work on cluster scales, but not on galactic scales… analyse intermediate scale, galaxy groups (with Mamon & Ponman)
• Improve the current constraints on M(r) – and orbits using larger data-bases: SDSS (with Böhringer & Popesso) WINGS (with Fasano & co.)
• Extend the analysis to higher-z (e.g. EDisCS, White et al. 2005, IMACS, Dressler et al.)
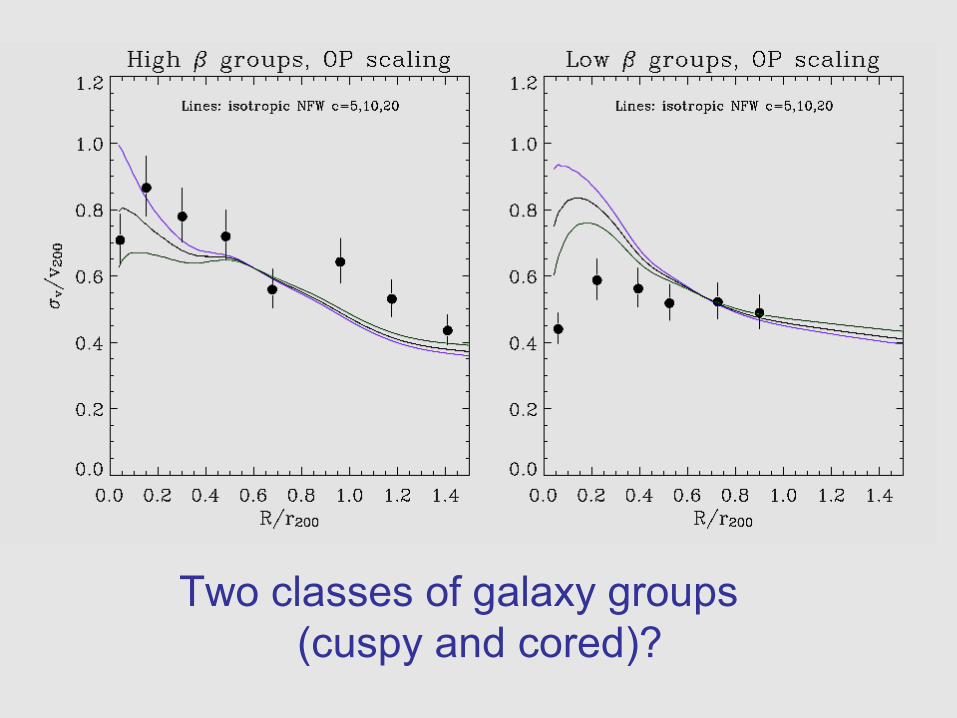
Two classes of galaxy groups (cuspy and cored)?
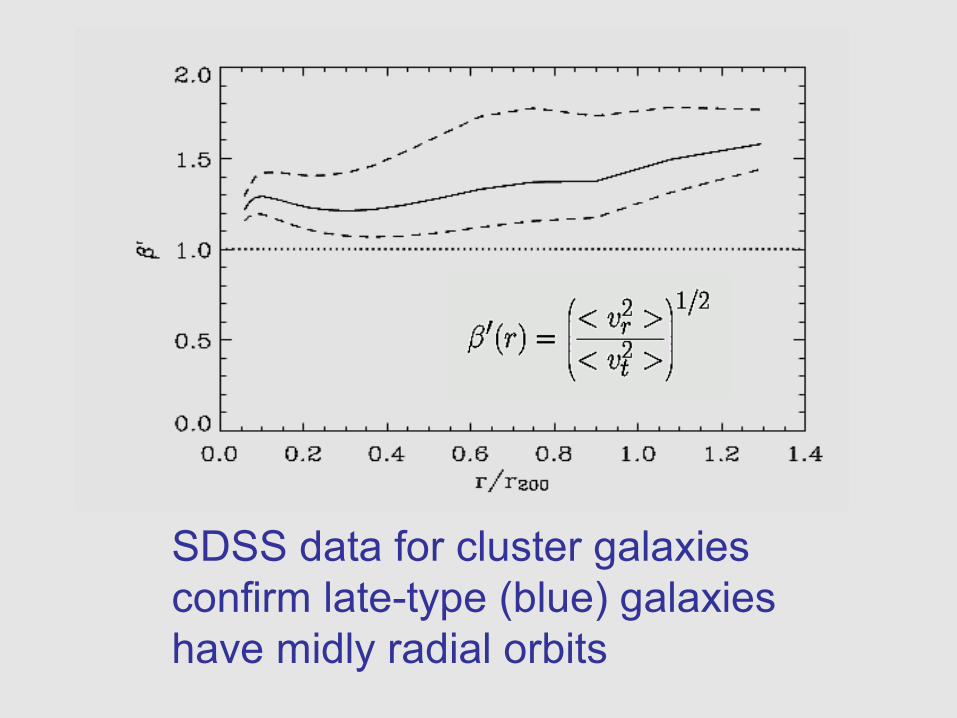
SDSS data for cluster galaxiesconfirm late-type (blue) galaxieshave midly radial orbits