and abundance of native mammals in low-density Western...
21
Do pet cats (Felis catus) have an impact on species richness and abundance of native mammals in low-density Western Australian suburbia? Maggie Lilith BSc. (Hons.) This thesis is presented for the degree of Doctor of Philosophy of Murdoch University, Western Australia. - February 2007 –
Transcript of and abundance of native mammals in low-density Western...
Do pet cats (Felis catus) have an impact on species richness
and abundance of native mammals in
low-density Western Australian suburbia?
Maggie Lilith BSc. (Hons.)
This thesis is presented for the degree of Doctor of Philosophy of Murdoch
University, Western Australia.
- February 2007 –
Reproduced with permission from Auspac Media (2005).

Statement of Responsibility
I declare that this thesis is my own account of my research and contains as its
main content work which has not previously been submitted for a degree at
any tertiary education institution.
………………………………
Maggie Lilith
February 2007

If a dog jumps in your lap, it is because he is fond of you; but if a cat does the same thing, it is because your lap is warmer.
Alfred North Whitehead
English mathematician & philosopher (1861 - 1947)
i
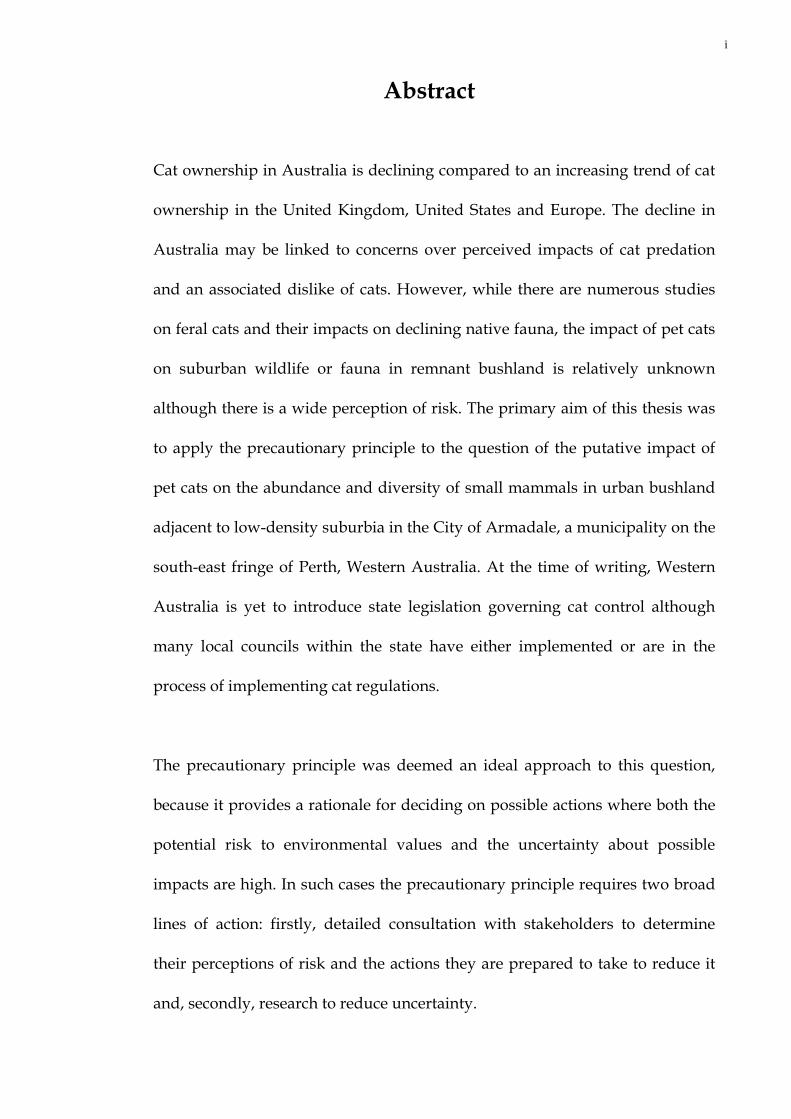
Abstract
Cat ownership in Australia is declining compared to an increasing trend of cat
ownership in the United Kingdom, United States and Europe. The decline in
Australia may be linked to concerns over perceived impacts of cat predation
and an associated dislike of cats. However, while there are numerous studies
on feral cats and their impacts on declining native fauna, the impact of pet cats
on suburban wildlife or fauna in remnant bushland is relatively unknown
although there is a wide perception of risk. The primary aim of this thesis was
to apply the precautionary principle to the question of the putative impact of
pet cats on the abundance and diversity of small mammals in urban bushland
adjacent to low-density suburbia in the City of Armadale, a municipality on the
south-east fringe of Perth, Western Australia. At the time of writing, Western
Australia is yet to introduce state legislation governing cat control although
many local councils within the state have either implemented or are in the
process of implementing cat regulations.
The precautionary principle was deemed an ideal approach to this question,
because it provides a rationale for deciding on possible actions where both the
potential risk to environmental values and the uncertainty about possible
impacts are high. In such cases the precautionary principle requires two broad
lines of action: firstly, detailed consultation with stakeholders to determine
their perceptions of risk and the actions they are prepared to take to reduce it
and, secondly, research to reduce uncertainty.
ii
With regard to stakeholder consultation, local residents were surveyed in
regard to their attitudes and current cat husbandry practices. A substantial
proportion of respondents within this municipality believed cat regulations
were necessary (75% of owners and 95% of non-owners). At least 70% of both
owners and non-owners agreed with the propositions that cats not owned by
licensed breeders should be desexed, local councils should restrict the
maximum number of cats that can be owned on one property and that pet cats
entering nature reserves are harmful to wildlife. Most (c.85%) cat owners
agreed that they would license their cats if that became compulsory. Although
fewer owners (c.60%) were prepared to keep their cats on their property at all
times to protect wildlife, over 80% were willing to confine their cats at night if
it was required. Owners seemed to be substantially motivated by the value of
these measures in reducing injury to cats and facilitating the return of lost
animals rather than concern over wildlife protection.
Attempts to reduce uncertainty involved (i) assessing roaming patterns of pet
cats to determine the sizes of appropriate buffer zones around nature reserves,
and (ii) determining species diversity, species richness and abundance of small
mammals in remnant bushland adjacent to sub-divisions with varying
regulations governing cat husbandry. Radio tracking results to assess cat
roaming patterns showed substantial variation in home range size between cats
in high density suburbia (ranged between 0.01 ha – 0.64 ha) and those in low
density suburbia (ranged from 0.07 ha – 2.86ha). Larger home range sizes of
cats in the rural areas (up to 2.9 ha) suggest buffer zones of up to 500 metres
iii
around nature reserves are needed to exclude almost all roaming cats. The
abundance and species richness of small mammals were investigated in four
areas of remnant bushland. Two were adjacent to subdivisions where cat
ownership was unrestricted, one next to a subdivision where cat ownership
was prohibited and the remaining one next to a subdivision where compulsory
night curfew and bells on pet cats were enforced. No definitive evidence of
predatory impact by pet cats on the small mammals was found. Mammal
species diversity was not significantly different between sites and species
richness and absolute abundance were not higher in sites where cats were
restricted. Vegetation comparisons showed significant differences in the
structure and species composition of the vegetation between most sites and the
mammal species richness and abundance appeared linked to ground cover
density in the various sites. This factor, not cat restrictions, appeared to be the
primary determinant of species richness, species diversity and absolute
numbers of small mammals in these sites.
This study in the City of Armadale has shown that the implementation of
proposed cat legislation must have a “whole of ecosystem” approach, i.e.
protecting identified remnant bushland containing biodiversity from
threatening processes such as plant disease and inappropriate fire, especially
arson, as well as possible predations from pet cats. Habitat restoration and
protection may be more important conservation activities than regulation of
cats. Regulation of cats can be done at differing levels of intensity and cost,
bearing in mind that this community is receptive to regulation of some aspects

iv
of cat ownership. Community education on the values of cat confinement in
regards to cat welfare might increase chances of compliance.
v
Publication
Some of the work presented in this thesis is published. While I took the major
role in the work, M.C. Calver and I. Styles assisted in survey design and
analysis, while M.J Garkaklis assisted in liaison with the Armadale City
Council.
Lilith, M., Calver, M. C., Styles, I. and Garkaklis, M. (2006) Protecting wildlife
from predation by owned domestic cats: Application of a precautionary
approach to the acceptability of proposed cat regulations. Austral Ecology 31,
176 – 189.
vi
Acknowledgements
All work involving consent of human subjects was covered by Murdoch
Human Research Ethics (ethic permit number 2003/176) while animal research
was covered by Murdoch Animal Ethics Committee (AEC) permits N983/03
and N910R/02.
There are many people who have made this study possible and I am grateful to
everyone involved. Firstly, I would like to acknowledge the grant received
from the City of Armadale via the Perth Biodiversity Project and Murdoch
University. Assistance from the City of Armadale staff: Ron van Delft, Corinne
Gaskin and Glen Williams have been greatly appreciated.
The people from the Department of Conservation and Land Management
(CALM) namely John Angus and Mark Garkaklis have been wonderful in
supporting fieldwork and giving advice. As an external supervisor, Mark also
put in many hours of proof-reading. Thank you to Jeff Doust from the Water
Corporation for allowing me access to Water Corporation (Churchman Brook
Catchment) land.
I would also like to acknowledge all the staff (and veterinarians) from Murdoch
Veterinary Clinic who assisted by giving veterinary checkups to cats
volunteered for radio-tracking. There are also people at Murdoch University
whose help has been much appreciated: Dr Barbara Bowen and Dr Phillip
Ladd assisted with the identification of plants, Emeritus Professor Ron Wooller
vii
loaned much-needed equipment for my fieldwork and shared many excellent
ideas, while Assoc/Professor Irene Styles explained patiently the intricacies of
Rasch analysis.
A really big thank you to Helen Owen who has been a constant and tireless
volunteer and friend for the past three years. She shared all those great
moments including wayward mammals and bushfires and listened to
“wonderful” (and not-so wonderful) stories of peoples’ cats – not to mention
suffering the indignity of getting lost in “urban backyards” on many occasions.
There are a number of people who gave up their time voluntarily to help with
my field work and if it wasn’t for all of you, this could not have been possible:
- Jodie Wood and Ben Deeley for their help in sampling vegetation on a
Saturday– thank you for your friendship and hours of proof reading!
- Past volunteers (you know who you are) and to Damien Cancilla for the
loan of field work gear.
I am very grateful for the assistance, expertise and knowledge shared by my
supervisor, Assoc/Professor Mike Calver, who has endured my numerous
questions and demands, but somehow still managed to provide
encouragement to the end. Thanks to Lyn Killingbeck for your support over
the years. Lastly, to all my friends particularly my closest pal Jutta Besold,
thanks for your encouragement (especially over the last few years) - this would
not have been possible without all your love, support and encouragement!
viii
Contents
CHAPTER 1: General Introduction …………………………………………... 1
1.1 Biology and dentition ………………………………………….. 3
1.2 History and arrival of the domestic cat to Australia………... 4
1.3 Impacts of feral cats……………………………………………... 6
1.4 Impacts by pet cats……………………………………………… 7
1.5 Precautionary principle ………………………………………... 14
1.6 Scope and Aims of Thesis……………………………………… 15
CHAPTER 2: Study Area
2.1 City of Armadale – history……………………………………... 18
2.2 Population Demographics……………………………………… 21
2.3 Climate……………………………………………………………. 21
2.4 Vegetation – general description of area……………………... 23
2.5 Fauna…………………………………………………………….... 24
CHAPTER 3: Protecting wildlife from predation by pet cats ..…………… 34
3.1 Introduction……………………………………………………… 35
3.2 Methods…………………………………………………………... 38
3.2.1 Study area………………………………………………… 38
3.2.2 Design of survey…………………………………………. 39
3.2.3 Administration of survey……………………………….. 41
3.2.4 Data Analysis……………………………………………... 42
3.2.5 Software used……………………………………………. 44
3.3 Results…………………………………………………………...... 45
3.3.1 Response rates and profile of respondents……………. 45
3.3.2 Analysis of control, wildlife and sterilisation scales…. 45
3.3.3 Questions in the survey…………………………………. 48
3.4 Discussion.……………………………………………………….. 60
3.4.1 Validity of the survey……………………………………. 60
3.4.2 Cat-owners’ practices……………………………………. 61

ix
3.4.3 Applying a precautionary approach…………………… 61
3.4.4 Experience with regulation elsewhere in Australia…... 66
3.4.5 Implication for communities outside Australia………. 67
3.5 Concluding remarks…………………………………………….. 70
CHAPTER 4: Home range and movement patterns of pet cats within
the City of Armadale
4.1 Introduction – home range……………………………………... 72
4.1.1 Radio-tracking……………………………………………. 77
4.1.2 Methods of home range analysis……………………….. 78
4.1.3 Uses of home range and radio-tracking studies……… 81
4.2 Home range and activity patterns of feral cat populations... 82
4.3 Home range and activity patterns of pet cats….……..……… 86
4.4 Objectives………………………………………………………… 88
4.5 Methods…………………………………………………………... 89
4.5.1 Study design……………………………………………… 89
4.5.2 Choice of cats……………………………………………... 90
4.5.3 Radio-tracking……………………………………………. 93
4.5.4 Home range analysis…………………………………….. 95
4.5.5 Data analysis……………………………………………… 97
4.6 Results…………………………………………………………….. 98
4.7 Discussion………………………………………………………... 115
CHAPTER 5: Assessing prey abundance & predator presence
5.1 Introduction……………………………………………………… 125
5.1.1 Testing predatory impact……………………………….. 127
5.1.2 Population, species richness and density estimates….. 130
5.1.3 Mammal survey techniques for prey…………………... 131
5.1.4 Assessing the presence or absence of cats in the
study areas………………………………………………... 135
5.1.5 Objectives…………………………………………………. 137
x
5.2 Methods…………………………………………………………... 138
5.2.1 General description of study area…………………….... 138
5.2.1.1 Site A – Free-roaming cat zone……………………. 140
5.2.1.2 Site B – Belled and curfewed cat zone……………... 142
5.2.1.3 Site C – Free-roaming cat zone……………............. 143
5.2.1.4 Site D – No-cat cat zone…………………................ 144
5.2.2 Trapping methods……………………………………….. 146
5.2.3 Scent stations……………………………………………... 149
5.2.4 Trapping data analyses………………………………….. 151
5.2.5 Print identification……………………………………….. 153
5.3 Results…………………………………………………………….. 153
5.3.1 Trapping results………………………………………….. 153
5.3.2 Scent station results……………………………………… 166
5.4 Discussion……………………………………………………….. 167
CHAPTER 6: Vegetation
6.1 Introduction………………………………………………………. 173
6.1.1 Types of disturbances:
Vegetation clearance, fire and timber harvesting…….. 174
6.1.2 Impacts of altered habitat structure……………………. 178
6.1.3 Vegetation sampling methods………………………….. 180
6.1.4 Objectives…………………………………………………. 183
6.2 Methods…………………………………………………………... 184
6.2.1 Overstorey – canopy cover ……………………………... 185
6.2.2 Leaf litter………………………………………………….. 186
6.2.3 Vertical vegetation density ……………………………... 187
6.2.4 Floristic structure……………………………………….... 188
6.2.5 Tree density………………………………………………. 188
6.3 Results…………………………………………………………….. 193
6.4 Discussion………………………………………………………... 211
xi
CHAPTER 7: General Discussion…..…………………………………………. 222
7.1 How do residents feel about cat legislation and
other precautionary measures?.................................................... 224
7.2 Home range and activity patterns of pet cats………………... 226
7.3 Interaction between native mammals and pet cats…………. 228
7.4 Interaction between presence of mammals and
vegetation type or disturbance………………………………… 230
7.5 Management recommendations for Armadale City
Council……………………………………………………………. 231
7.6 Conclusions………………………………………………………. 232
REFERENCES……………………………………………………………………. 237
xii
List of Tables
1.1 Australian Companion Legislation for each state.
1.2 A comparison of Australia’s current cat legislation as at June 1998.
2.1 Terrestrial native mammals in the jarrah forest.
2.2 List of mammals that have been seen or trapped in Bungendore Park (by
Friends of Bungendore Park).
2.3 Susceptibility of some native and introduced mammals to predation
from cats, F. catus within the City of Armadale.
3.1 Mean Rasch scores (in logits) of respondents on the Control, Wildlife
and Sterilisation scales, ± standard errors.
3.2 Initial MANOVA analysis of the data in Table 3.1.
3.3 Univariate tests where the multivariate effect of interaction from Table
3.2 is significant.
3.4 Number of cats kept by owners in Armadale.
3.5 Frequency of sterilisation of owned cats in Armadale.
3.6 Current confinement practices of cat owners from urban and rural zones
in Armadale.
3.7 Frequency of responses to three key statements/questions by Armadale
cat owners classified according to the categories Residence and Gender.
3.8 Frequency of responses to a key statement/question by Armadale cat
owners classified according to the categories Residence and Gender.
3.9 The log-linear models fitted to the responses to each statement/question
(position in the survey shown in parentheses) in Tables 3.7 and 3.8.
3.10 Frequency of responses to three key statements/questions by Armadale
residents classified according to the categories Residence, Cat
Ownership and Agreement with the statement.
3.11 Frequency of responses to three key statements/questions by Armadale
residents classified according to the categories Residence, Cat
Ownership and Gender.
xiii
3.12 Frequency of responses to statement 23 and 31 by Armadale residents
classified according to the categories Residence, Cat Ownership and
Gender.
3.13 The log linear models fitted to the responses to each statement/question
(position in the survey shown in parentheses).
4.1 Summary of direct and indirect methods used to evaluate habitat use by
terrestrial vertebrates.
4.2 Comparison of the mean long-term total home ranges of adult feral cats
across studies.
4.3 Comparison of total home ranges of house or pet cats across studies in
Australia and overseas.
4.4 Home range (MCP in hectares) data for 16 cats from all radio tracking
sessions i.e. August 2003, January/February 2005 and August 2005 from
both residential zones in the City of Armadale.
4.5 ANOVAs of log-transformed home range data.
4.6 ANOVAs of log-transformed home range data on August 2003 (urban)
and August 2005 (rural).
4.7 ANOVAs of log-transformed home range data on August 2003 (urban)
and January/February 2005 (rural).
4.8 Mean home range and log of mean estimations of all male and female
cats from all radio tracking sessions.
4.9 Data on home range (MCP) for the 4 rural cats tracked in both
January/February 2005 and August 2005.
4.10 Repeated measures ANOVA of log-transformed home range data from
Table 4.9.
4.11 Observation list for all cats radio-tracked.
5.1 Site location and treatment type.
5.2 Species and total number of individuals trapped and recorded at each
site.
5.3 Sorensen’s similarity indices for comparison of mammal communities at
each site.
xiv
5.4 Shannon-Weiner diversity indices (H’) and evenness indices (J) for each
site.
5.5 Tests for significant differences in Shannon-Weiner values between each
pair of sites.
5.6 KTBA of southern brown bandicoots in each site.
5.7 Trap success of cage traps for captures of southern brown bandicoots in
all sites.
5.8 Known-to-be-alive (KTBA) of brushtail possums in each site.
5.9 Trap success of cage traps for captures of brushtail possums in all sites.
5.10 Results of the scent stations in each site.
6.1 Braun- Blanquet scale showing dominance of vegetation species based
on percentage cover.
6.2 Sorensen’s similarity indices for comparison of plant species at each site.
6.3 Shannon-Weiner diversity indices (H’) and evenness indices (J) for each
site.
6.4 Tests for significant differences in Shannon-Weiner values between each
pair of sites.
6.5 R-statistic and p values for comparison of Braun-Blanquet indices at
paired sites.
6.6 R-statistic and p values for comparison of vegetation importance indices
at paired sites.
6.7 Means and standard error of canopy cover (%) and leaf litter (cm) in
each site (A – D) and quadrat (Q1 – Q5).
6.8 Means and standard deviation of vertical vegetation density as a % (0 –
40cm).
6.9 Results of a MANOVA with factors of Site and Quadrat and dependent
variables of Canopy cover and Leaf litter.
6.10 Tests for the significance of Canopy cover and Leaf litter across sites.
6.11 Tests for the significance of Canopy cover and Leaf litter across
quadrats.
6.12 Tests for the significance of vertical vegetation density across sites.
xv
List of Figures
2.1 Map of the City of Armadale (Scale 4mm = 1km).
2.2 Location of the City of Armadale in relation to Perth, the capital of
Western Australia.
2.3 Monthly temperatures showing highest and average maximum, and
lowest and average minimum recorded at Bickley.
2.4 Average monthly rainfall and number of rain days.
2.5 The yellow-footed antechinus or mardo.
2.6 Brushtail possum.
2.7 Quenda (Southern brown bandicoot).
3.1 Location of the City of Armadale, Western Australia.
4.1 An example of an urban residence from the City of Armadale.
4.2 An example of a rural residence from the City of Armadale.
4.3 Radio-collar.
4.4 M1 (Billy) urban: home range size of 0.01ha (Scale 1:2500).
4.5 M3 (Dustpan) urban: home range size of 0.64ha (Scale 1:2500).
4.6 F6 (Pepper) rural: home range size of 0.07ha (Scale 1:2500).
4.7 F4 (Stripes) rural: home range size of 1.12ha (Scale 1:2500).
4.8 Power vs N (sample size) with α = 0.05.
4.9 Power vs N (sample size) with α = 0.1.
4.10 Power vs N (sample size) with α = 0.2.
4.11 M6 (Max) home range in Feb (in red) and in August 2005 (in blue).
4.12 M8 (DJ) home range in Feb (in red) and in August 2005 (in blue).
4.13 M4 (Tigger) home range in Feb (in red) and in August 2005 (in blue).
5.1a Diagrammatic representation of all sites within the City of Armadale in
relation to location of Perth, Western Australia (Scale 4mm = 1km).
5.1b Trapping sites within the City of Armadale. The urban areas (more
densely populated) are shown in red on left of picture with major roads
in red lines (Scale 4mm = 1km).
5.2 Stinton Cascades (Site A Free-roaming site).
5.3 Araluen (Site B “Belled” and curfewed site).
xvi
5.4 Warwick Savage park (Site C Free-roaming site).
5.5 Churchman Brook (Site D No cat site).
5.6 Elliott trap.
5.7 Cage trap.
5.8 Drawing of sand plot position in relation to trapping grid.
5.9 Scent station (sand tray and bait).
5.10 Population estimates of southern brown bandicoots in site A (Stinton
Cascades) using Jolly-Seber.
5.11 Population estimates of southern brown bandicoots in site C (Warwick
Savage Park) using Jolly-Seber.
5.12 Population estimates of brushtail possums at site A (Stinton Cascades)
using Jolly-Seber.
5.13 Population estimates of brushtail possums in site B (Araluen) using
Jolly-Seber.
5.14 Population estimates of brushtail possums in site C (Warwick Savage
Park) using Jolly-Seber.
5.15 Photo of a paw print from a scent station in site C, Warwick Savage
Park.
6.1 Diagrammatic position of quadrats in each trapping grid (not to scale).
6.2 Vegetation board used for assessing vertical vegetation density.
6.3 Grouping of vegetation communities in all sites based on Braun-Blanquet indices.
6.4 Mammal species richness (green circles) in relation to group of sites
based on vegetation similarities using the Braun-Blanquet indices. 6.5 Mammal abundance (green circles) in relation to group of sites based on
vegetation similarities using the Braun-Blanquet indices. 6.6 Grouping of vegetation communities in all sites based on importance
values. 6.7 Mammal species richness (green circles) in relation to group of sites
based on vegetation similarities using the Krebs importance index. 6.8 Mammal abundance (green circles) in relation to group of sites based on
vegetation similarities using the Krebs importance index.

xvii
6.9 Box and whisker plot for canopy cover at each site. 6.10 Box and whisker plot of mean vertical vegetation density (%), with
standard error.


![PAPER 3 3D gravity modeling of Buyuk Menderes basin in Western Anatolia using parabolic density function [LEDI PRISCILLA].pdf](https://static.fdocuments.net/doc/165x107/577cc3541a28aba71195b087/paper-3-3d-gravity-modeling-of-buyuk-menderes-basin-in-western-anatolia-using.jpg)