Ancient Geographical Barriers Drive Differentiation among ...
14
ORIGINAL RESEARCH published: 26 October 2016 doi: 10.3389/fpls.2016.01618 Edited by: Badri Padhukasahasram, Illumina, USA Reviewed by: Yingjuan Su, Sun Yat-Sen University, China Xue-Jun Ge, South China Institute of Botany (CAS), China *Correspondence: Renchao Zhou [email protected] Suhua Shi [email protected] Specialty section: This article was submitted to Evolutionary and Population Genetics, a section of the journal Frontiers in Plant Science Received: 20 August 2016 Accepted: 13 October 2016 Published: 26 October 2016 Citation: Yang Y, Duke NC, Peng F, Li J, Yang S, Zhong C, Zhou R and Shi S (2016) Ancient Geographical Barriers Drive Differentiation among Sonneratia caseolaris Populations and Recent Divergence from S. lanceolata. Front. Plant Sci. 7:1618. doi: 10.3389/fpls.2016.01618 Ancient Geographical Barriers Drive Differentiation among Sonneratia caseolaris Populations and Recent Divergence from S. lanceolata Yuchen Yang 1 , Norman C. Duke 2 , Fangfang Peng 1 , Jianfang Li 1 , Shuhuan Yang 1 , Cairong Zhong 3 , Renchao Zhou 1 * and Suhua Shi 1 * 1 State Key Laboratory of Biocontrol and Guangdong Provincial Key Laboratory of Plant Resources, Sun Yat-Sen University, Guangzhou, China, 2 Trop WATER, James Cook University, Townsville, QLD, Australia, 3 Hainan Dongzhai Harbor National Nature Reserve, Haikou, China Glacial vicariance is thought to influence population dynamics and speciation of many marine organisms. Mangroves, a plant group inhabiting intertidal zones, were also profoundly influenced by Pleistocene glaciations. In this study, we investigated phylogeographic patterns of a widespread mangrove species Sonneratia caseolaris and a narrowly distributed, closely related species S. lanceolata to infer their divergence histories and related it to historical geological events. We sequenced two chloroplast fragments and five nuclear genes for one population of S. lanceolata and 12 populations of S. caseolaris across the Indo-West Pacific (IWP) region to evaluate genetic differentiation and divergence time among them. Phylogenetic analysis based on sequences of nuclear ribosomal internal transcribed spacer and a nuclear gene rpl9 for all Sonneratia species indicate that S. lanceolata individuals are nested within S. caseolaris. We found strong genetic structure among geographic regions (South China Sea, the Indian Ocean, and eastern Australia) inhabited by S. caseolaris. We estimated that divergence between the Indo-Malesia and Australasia populations occurred 4.035 million years ago (MYA), prior to the onset of Pleistocene. BARRIERS analysis suggested that complex geographic features in the IWP region had largely shaped the phylogeographic patterns of S. caseolaris. Furthermore, haplotype analyses provided convincing evidence for secondary contact of the South China Sea and the Indian Ocean lineages at the Indo-Pacific boundary. Demographic history inference under isolation and migration (IM) model detected substantial gene flow from the Sri Lanka populations to the populations in the Java Island. Moreover, multi-locus sequence analysis indicated that S. lanceolata was most closely related to the Indian Ocean populations of S. caseolaris and the divergence time between them was 2.057 MYA, coinciding with the onset of the Pleistocene glaciation. Our results suggest that geographic isolation driven by the Pleistocene ice age resulted in the recent origin of S. lanceolata. Keywords: genetic differentiation, secondary contact, Pleistocene glaciations, Sonneratia, mangroves Frontiers in Plant Science | www.frontiersin.org 1 October 2016 | Volume 7 | Article 1618
Transcript of Ancient Geographical Barriers Drive Differentiation among ...

fpls-07-01618 October 24, 2016 Time: 16:10 # 1
ORIGINAL RESEARCHpublished: 26 October 2016
doi: 10.3389/fpls.2016.01618
Edited by:Badri Padhukasahasram,
Illumina, USA
Reviewed by:Yingjuan Su,
Sun Yat-Sen University, ChinaXue-Jun Ge,
South China Institute of Botany (CAS),China
*Correspondence:Renchao Zhou
Specialty section:This article was submitted to
Evolutionary and Population Genetics,a section of the journal
Frontiers in Plant Science
Received: 20 August 2016Accepted: 13 October 2016Published: 26 October 2016
Citation:Yang Y, Duke NC, Peng F, Li J,
Yang S, Zhong C, Zhou R and Shi S(2016) Ancient Geographical Barriers
Drive Differentiation amongSonneratia caseolaris Populations
and Recent Divergence fromS. lanceolata.
Front. Plant Sci. 7:1618.doi: 10.3389/fpls.2016.01618
Ancient Geographical Barriers DriveDifferentiation among Sonneratiacaseolaris Populations and RecentDivergence from S. lanceolataYuchen Yang1, Norman C. Duke2, Fangfang Peng1, Jianfang Li1, Shuhuan Yang1,Cairong Zhong3, Renchao Zhou1* and Suhua Shi1*
1 State Key Laboratory of Biocontrol and Guangdong Provincial Key Laboratory of Plant Resources, Sun Yat-Sen University,Guangzhou, China, 2 Trop WATER, James Cook University, Townsville, QLD, Australia, 3 Hainan Dongzhai Harbor NationalNature Reserve, Haikou, China
Glacial vicariance is thought to influence population dynamics and speciation ofmany marine organisms. Mangroves, a plant group inhabiting intertidal zones, werealso profoundly influenced by Pleistocene glaciations. In this study, we investigatedphylogeographic patterns of a widespread mangrove species Sonneratia caseolaris anda narrowly distributed, closely related species S. lanceolata to infer their divergencehistories and related it to historical geological events. We sequenced two chloroplastfragments and five nuclear genes for one population of S. lanceolata and 12populations of S. caseolaris across the Indo-West Pacific (IWP) region to evaluategenetic differentiation and divergence time among them. Phylogenetic analysis basedon sequences of nuclear ribosomal internal transcribed spacer and a nuclear generpl9 for all Sonneratia species indicate that S. lanceolata individuals are nested withinS. caseolaris. We found strong genetic structure among geographic regions (SouthChina Sea, the Indian Ocean, and eastern Australia) inhabited by S. caseolaris.We estimated that divergence between the Indo-Malesia and Australasia populationsoccurred 4.035 million years ago (MYA), prior to the onset of Pleistocene. BARRIERSanalysis suggested that complex geographic features in the IWP region had largelyshaped the phylogeographic patterns of S. caseolaris. Furthermore, haplotype analysesprovided convincing evidence for secondary contact of the South China Sea and theIndian Ocean lineages at the Indo-Pacific boundary. Demographic history inferenceunder isolation and migration (IM) model detected substantial gene flow from theSri Lanka populations to the populations in the Java Island. Moreover, multi-locussequence analysis indicated that S. lanceolata was most closely related to the IndianOcean populations of S. caseolaris and the divergence time between them was 2.057MYA, coinciding with the onset of the Pleistocene glaciation. Our results suggest thatgeographic isolation driven by the Pleistocene ice age resulted in the recent origin ofS. lanceolata.
Keywords: genetic differentiation, secondary contact, Pleistocene glaciations, Sonneratia, mangroves
Frontiers in Plant Science | www.frontiersin.org 1 October 2016 | Volume 7 | Article 1618

fpls-07-01618 October 24, 2016 Time: 16:10 # 2
Yang et al. Ancient Geography-drived Divergence in Sonneratia
INTRODUCTION
Pleistocene glaciations have profoundly shaped the biogeographyof extant global flora and fauna (Hewitt, 2000, 2001). Whiletropical animals and plants were less influenced than theirtemperate counterparts by temperature fluctuations duringthis period, dramatic sea level changes that accompaniedglaciation affected organisms inhabiting tropical marine orintertidal zone (Barber et al., 2000; Kittiwattanawong et al.,2001; Timm and Kochzius, 2008; Macieira et al., 2015). Indo-Australian Archipelago (IAA), which extends from the MalayPeninsula through Sumatra, Borneo and Java to Sulawesi andthe island of New Guinea, has the richest biodiversity onthe planet (Mora et al., 2003). Molecular phylogenetic andpopulation genetic studies in many marine organisms haverevealed strong genetic discontinuities between the bodies ofwater separated by IAA (McMillan and Palumbi, 1995; Williamsand Benzie, 1998; Duda and Palumbi, 1999; Nelson et al.,2000; Kochzius et al., 2003; Froukh and Kochzius, 2008).Barber et al. (2000) proposed a marine Wallace’s line accordingto the genetic breaks between populations from north andsouth of Flores and Java Seas, and suggested that Pleistoceneglacial isolation acted as a driver of intra-species geneticdifferentiation.
Mangroves are the dominant woody plants in the intertidalzones of the tropics (Tomlinson, 1986). Like other organismsinhabiting tropical marine or intertidal zones, they exhibita strong association of genetic divergence with geographicalbreaks (Duke, 1995; Dodd and Rafii, 2002; Triest, 2008).Mangrove species are split into two main biogeographic regionsof species diversity, the Atlantic-East Pacific (AEP) and theIndo-West Pacific (IWP; Tomlinson, 1986; Duke et al., 1998).Within the IWP region, there are two biodiversity centers,Indo-Malesia (Indian subcontinent and Southeast Asia) andAustralasia (from Australia and New Guinea to west Polynesia)(Ricklefs and Latham, 1993), which may be evolutionarilydistinct (Daru et al., 2013). Although the majority of speciesare shared between the two regions (Hogarth, 1999, 2001),there are 7–9 species exclusively distributed in Australasia,while 11 are exclusive to Indo-Malesia (Duke et al., 1998).Genetic breaks between populations from the two regionshave been observed in many mangrove species, such asLumnitzera littorea (Su et al., 2007), Bruguiera gymnorrhiza(Urashi et al., 2013), and Rhizophora mucronata (Wee et al.,2015). Understanding the linkage between intra- and inter-species genetic diversity on one hand, and historical geologicalevents on the other hand should provide important insightsinto the evolutionary mechanisms of biodiversity generation inmangrove plants.
Sonneratia, a typical mangrove genus widely distributed acrossthe IWP, comprises six species and three hybrid taxa (Duke,1984, 1994; Wang and Chen, 2002; Zhou et al., 2005; Qiuet al., 2008). Sonneratia caseolaris is a wide-spread species,ranging from Sri Lanka through the Malay Peninsula toChina and Australia (Tomlinson, 1986; Duke, 2006). It growsin upstream reaches of river-dominated estuaries with lowlevels of salinity and a high supply of fresh water (Duke
and Jackes, 1987; Duke et al., 1998). Its sibling species,S. lanceolata, has a high similarity in morphology and ecologicalrequirement with S. caseolaris (Duke, 2006). Both species havered petals, flat and expanded calyx lobes, distinct mucronateleaf apex and usually occur in the upstream of rivers (Duke,1994, 2006). However, their geographical distributions do notoverlap (Duke and Jackes, 1987). S. lanceolata is restrictedto northwestern Australia, southern New Guinea and fewlocations in Indonesia. In contrast, S. caseolaris is found in theIndo-Malesia region, northeastern Australia and northern NewGuinea (Duke, 2006). These two species thus provide an idealsystem to study the impact of Pleistocene sea-level changes onspeciation of mangrove plants. However, previous intragenericclassifications of Sonneratia based on either morphologicalcharacteristics (Ko, 1985, 1993; Wang and Chen, 2002) ormolecular data didn’t take S. lanceolata into account (Shi et al.,2000; Zhou et al., 2005; Yang et al., 2015), thus, phylogeneticrelationship between S. lanceolata and S. caseolaris remainsunclear.
In this study, we first determined the phylogenetic positionof S. lanceolata in Sonneratia using sequences of the nuclearribosomal internal transcribed spacer (nrITS) and a nuclear generpl9. We then sequenced two chloroplast fragments and fivenuclear genes in samples from one population of S. lanceolataand 12 populations of S. caseolaris to assess the geneticdiversity within S. caseolaris and divergence between it andS. lanceolata. Our results provide new insights into populationdynamics and inter-species divergence of mangrove plants underthe influence of sea-level fluctuations during the Pleistoceneepoch.
MATERIALS AND METHODS
Plant MaterialsWe sampled 16 individuals from a single population ofS. lanceolata in Northern Territory, Australia, and five to 20individuals from 12 populations of S. caseolaris across theIWP region. These 12 populations include four populationsaround the South China Sea (SCS), two at the Indo-Pacificboundary, two from Java Island, Indonesia, three from the coastsof the Indian Ocean, and one from Queensland, Australia.We collected leaf tissue from each individual and stored itin a plastic bag with silica gel for DNA extraction. Thedetails of sampling locations and sample sizes are presented inTable 1.
DNA Extraction, Polymerase ChainReaction (PCR) Amplification, andSequencingTotal genomic DNA of each individual was extracted usingthe CTAB method (Doyle and Doyle, 1987). To resolvethe phylogenetic position of S. lanceolata within the genusSonneratia, nrITS and one nuclear gene rpl9 were amplifiedfrom two randomly chosen individuals from each populationof S. caseolaris and S. lanceolata by polymerase chain reaction
Frontiers in Plant Science | www.frontiersin.org 2 October 2016 | Volume 7 | Article 1618

fpls-07-01618 October 24, 2016 Time: 16:10 # 3
Yang et al. Ancient Geography-drived Divergence in Sonneratia
TABLE 1 | Locations and sample sizes of the 12 Sonneratia caseolaris populations and the single S. lanceolata population used in this study.
Species Code Locations Longitude Latitude Sample size
S. caseolaris CWC Wenchang, Hainan, China 110◦46′ E 19◦31′ N 19
CBA Boao, Hainan, China 110◦34′ E 19◦9′ N 17
TST Surat thani, Thailand 99◦19′ E 09◦08′ N 21
MSB Sibu, Salawa, Malaysia 111◦22′ E 2◦15′ N 18
MKK Kukup, Johor, Malaysia 103◦27′ E 1◦21′ N 20
MSN Merbok, Kedah, Malaysia 100◦21′ E 6◦07′ N 16
BPF Pazra Futo, Sundarban, Bangladesh 89◦40′ E 22◦12′ N 7
BSK Supati Khal, Sundarban, Bangladesh 89◦46′ E 21◦55′ N 12
SRK Rekawa, Sri Lanka 80◦51′ E 21◦55′ N 20
ISG Sungaibuntu, Java, Indonesia 107◦25′ E 6◦4′ S 19
ICJ Cilacap, Java, Indonesia 108◦59′ E 7◦43′ S 20
AQS Daintree River, Australia 101◦54′ E 16◦16′ S 21
S. lanceolata SLA South Alligator River, Northern Territory, Australia 132◦22′ E 12◦23′ S 16
(PCR) with LA Taq DNA polymerase (Takara Bio, Inc., Shiga,Japan). Additionally, two chloroplast fragments (trn L – trn F andtrn V – trn M) and five nuclear genes (rpl9, cpi, ppi, phi, andnhx2) were amplified from each individual of S. lanceolata andS. caseolaris to assess the patterns of genetic diversity betweenand within the two species. The primers for the nuclear geneswere from Zhou et al. (2007). PCR products were purifiedusing 2% agarose gel electrophoresis and extracted using theStarPrep Gel Extraction Kit (GeneStar Biosolutions, Co., Ltd,Beijing, China). The purified products were sequenced usingthe Sanger method in an ABI 3730 DNA automated sequencerwith BigDye Terminator Cycle Sequencing Ready Reaction Kit(Applied Biosystems, Foster city, CA, USA) using the same setsof primers as were used for PCR amplification. All the primersused in this study were presented in Supplementary Table S1.
Phylogenetic AnalysisTo identify the phylogenetic position of S. lanceolata within thegenus, phylogenetic analyses of all six Sonneratia species andthe outgroup Duabanga grandiflora were carried out using thecombined sequence data of nrITS and the nuclear gene rpl9,as only these two fragments could be successfully amplifiedin D. grandiflora. The partition-homogeneity test suggests thatthese two fragments can be combined for phylogenetic analysisin the Sonneratia genus (p = 0.624; Farris et al., 1995). Thesequences from four other Sonneratia species, S. alba, S. ovata,S. griffithii, and S. apetala, and the outgroup D. grandiflora weredownloaded from the NCBI database. GenBank accessions ofall the sequences used for phylogenetic tree construction werelisted in Supplementary Table S2. The sequences of these twofragments were aligned in CLUSTALX (Thompson et al., 1997),followed by manual adjustments in SeqMan v. 7.10 (DNAStar,London, UK). The phylogeny was reconstructed using twomethods: maximum parsimony (MP) and maximum likelihood(ML). The analyses were performed in Mega v. 6.06 (Tamuraet al., 2013). The MP analysis was carried out using the Tree-Bisection-Recombination (TBR) algorithm (Nei and Kumar,2000) on random trees with 100 random addition replicates.The Maxtree parameter was set to 500. Statistical support for
nodes was evaluated by bootstrap support (BS) values from 1000replications. D. grandiflora was used to root the phylogenetictrees. Consistency index (CI) and retention index (RI) werealso employed to estimate homoplasy. Indels were ignored.For ML analysis, TrN + I was selected as the appropriatenucleotide substitution model from a set of 56 models usingthe Akaike information criterion, as implemented in Modeltest3.7 (Posada and Buckley, 2004). ML trees were constructedwith Nearest-Neighbor-Interchange (NNI) and the confidencemeasures of nodes were estimated by BS values from 1000replications.
Sequence Data AnalysesThe sequences of chloroplast fragments and nuclear genes werealigned and edited in SeqMan v. 7.10. The two chloroplastfragments were concatenated for further analyses. Haplotypesof the combined chloroplast fragments and each nuclear genewere phased and validated in DnaSP v. 5.10 (Librado and Rozas,2009). For each population, the number of segregating sites(S) and haplotypes (H), haplotype diversity (Hd), nucleotidediversity (θπ) and DNA polymorphism (θw, Watterson, 1977)were calculated for the combined chloroplast fragments and eachof the five nuclear genes using DnaSP v. 5.10. Haplotype networkswere constructed in NETWORK v. 4.6.1.1 (Fluxus Technology,Ltd, Suffolk, UK) using the median-joining algorithm (Bandeltet al., 1999).
To assess genetic divergence between S. caseolaris andS. lanceolata, as well as among populations of S. caseolaris,we performed a Bayesian clustering analysis, implementedin STRUCTURE v. 2.3.3 (Pritchard et al., 2000), using thepolymorphic sites of the five nuclear genes from all thepopulations of these species we sampled. The likelihood for K(ranging from 1 to 8) clusters was computed with 20 replicatesper K. Each run had a burn-in of 200,000 iterations, followed by1,000,000 Markov chain Monte Carlo (MCMC) iterations basedon the admixture model and correlated allele frequencies model(Falush et al., 2003). The most likely number of clusters wasestimated using the 1K statistic (Evanno et al., 2005). Graphicswere produced using DISTRUCT v.1.1 (Rosenberg, 2004).
Frontiers in Plant Science | www.frontiersin.org 3 October 2016 | Volume 7 | Article 1618

fpls-07-01618 October 24, 2016 Time: 16:10 # 4
Yang et al. Ancient Geography-drived Divergence in Sonneratia
To assess among-population sequence divergence, pairwiseKimura two parameter distances and KXY (the average numberof nucleotide differences between populations) were calculated ateach locus using Mega v. 6.06 and DnaSP v. 5.10, respectively.Multidimensional scaling (MDS) analysis was performed basedon the pairwise Kimura two-parameter distances in R v. 3.1.31.For both species, only the individuals without any missing datawere included in PCA. Starting from KXY estimates, putativegeographic barriers in the IWP region were inferred for all 13populations using Monmonier’s algorithm in the software Barrierv. 2.2 (Manni et al., 2004).
We also estimated divergence time between S. lanceolata andS. caseolaris using the BEAST software v. 1.8.2 (Drummond et al.,2012). According to the results of Bayesian clustering and MDSanalyses, the CWC population was selected to represent the SCSclade of S. caseolaris, while the two populations SRK and BSKwere selected for the Indian Ocean clade. For each population, themajor allele of each nuclear gene was selected and concatenatedwith alleles from other genes to represent the genetic compositionof each clade. The topology of the prior tree was chosen basedon the phylogenetic relationships described in Figure 1. Theestimated divergence times of S. ovata, S. alba, and S. caseolariswere set as three calibration points under Gaussian priors withmeans of 7.0, 9.0, and 11.0 million years and a standard deviationof 2.0 million years, respectively, based on a separate genomicanalysis of mangrove species.
Demographic History Estimation Usingthe Isolation with Migration ModelTo assess the level of interregional gene flow, we estimatedpairwise migration rates (2NM), as well as effective populationsize (Ne) and divergence time (t), among populations from theSCS, Indian Ocean and the Indo-Pacific boundary under theisolation with migration (IM) model. We used data from thefive nuclear genes and the IMa2 program (Hey and Nielsen,2007; Hey, 2010). Two populations from Hainan, China (CWCand CBA) were selected to represent the SCS lineage and threepopulations from Sri Lanka (SRK) and Bangladesh (BSK andBPF) were chosen for the Indian Ocean lineage, according tothe results of Bayesian clustering and MDS analysis (Figure 3A;Supplementary Figure S2). Individuals from the BSK and BPFpopulations were merged to increase sample size. The populationfrom Sungaibuntu, Java, Indonesia (ISG) with putative signalof genetic admixture was included to examine whether therewas substantial secondary contact at the Indo-Pacific boundary.According to our Bayesian clustering analysis, the ISG populationshowed a closer relationship to the Indian Ocean lineage thanthe SCS lineage. Thus, in our prior tree, the SCS and the IndianOcean lineages split, and then the ISG population diverged fromthe Indian Ocean lineage at t2 (Figure 5A). The divergence timeof the two SCS populations CWC and CBA was denoted ast0, while that between the populations from Sri Lanka (SRK)and Bangladesh (BSK and BPF) was represented by t1. For eachgene, the longest non-recombining block was extracted from thealigned data set using the Perl script IMgc (Woerner et al., 2007)
1https://www.r-project.org/
to avoid biased parameter estimation caused by recombination.The HKY substitution model was employed in this analysis.The priori upper bounds of demographic parameters were setto include most of their posterior distributions as determinedby preliminary simulations. However, when there were no goodattainable peaks, the maximum cut-off of the ancestral populationsize was set to 8, pairwise migration rates to 8 and divergencetime to 5. Based on the results of preliminary trial runs, we ran100 chains each with a burn-in of 1∗105 iterations and 5∗106
sampling steps with a geometric heating scheme (-hfg -ha0.96 -hb0.9). Three independent runs were carried out with different,random number seeds to test for convergence. The 5∗106 well-mixed samples were thinned to obtain 100,000 draws frommarginal posterior distributions of each parameter. Posteriormost likely values were estimated by finding posterior modes(Nielsen and Wakeley, 2001). Due to the lack of accuratelyestablished mutation rates for either the genus Sonneratia or thefamily Lythraceae, we used the substitution rates estimated by theBEAST software for the IM analysis.
RESULTS
Phylogenetic Position of S. lanceolataThe combined sequences of nrITS and the nuclear gene rpl9 were1,734 bp long after alignment, with 135 parsimoniouslyinformative sites. The MP analysis produced one mostparsimonious tree with tree length of 370, CI of 0.911 andRI of 0.933 (Figure 1). The ML analysis yielded the sametopology as the MP method. The six Sonneratia species weredivided into two clades with strong support, one of whichgrouped S. lanceolata and S. caseolaris (BS = 98% and 78%for MP and ML analysis, respectively) and the other containedthe remaining four species (BS = 99% for both MP and MLanalyses). Surprisingly, S. lanceolata was nested within the cladeformed by S. caseolaris samples and was most closely related tothe S. caseolaris individuals from Indo-Malesia region with highbootstrap support (BS = 97% and 96% for MP and ML analysis,respectively).
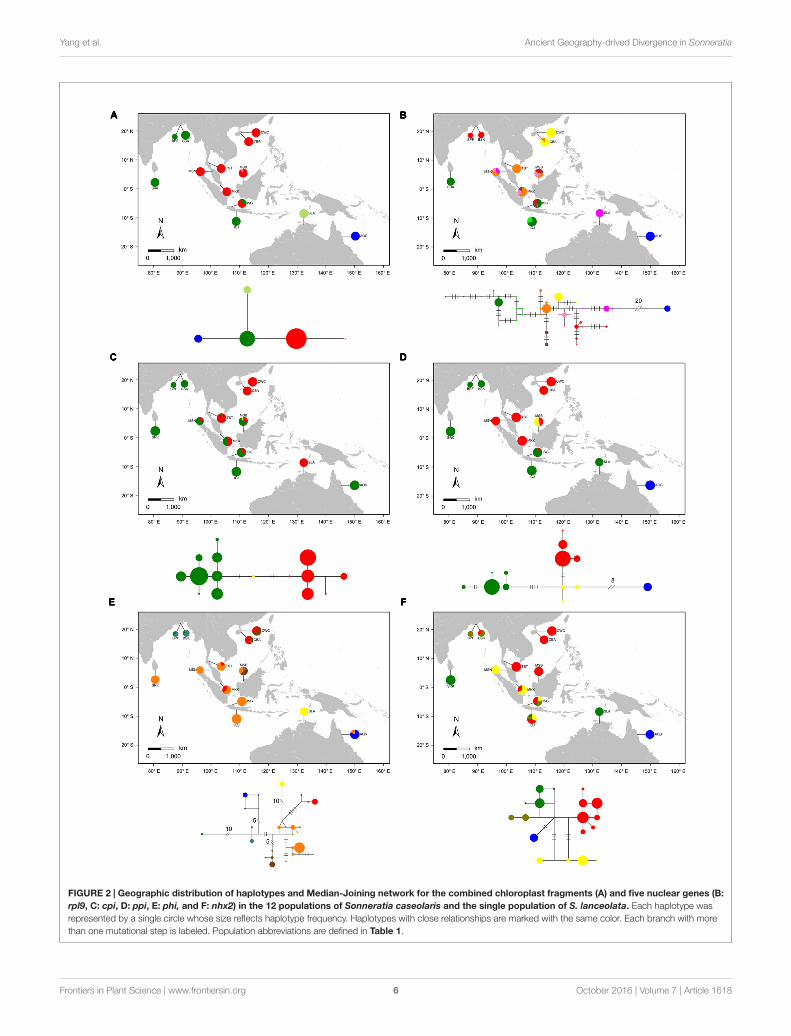
Polymorphisms within S. caseolarisWe sequenced 210 individuals from 12 populations ofS. caseolaris. We observed two single-nucleotide polymorphisms(SNPs) and one one-bp indel in the combined chloroplastfragments. These sites generated four haplotypes across the 12populations of S. caseolaris (Figure 2A). Only two populations(MSB and ISG) of S. caseolaris were polymorphic with extremelylow levels of nucleotide diversity (θπ) and polymorphisms (θw,Supplementary Table S3).
The aligned sequence length of the five nuclear genes rangedfrom 620 to 1,170 bp, containing 12 to 49 SNPs in the 12populations. At the species level, S. caseolaris harbored relativelyhigh levels of genetic diversity, with θπ ranging from 3.660 to8.850 per kb, and θw from 2.820 to 5.560 per kb (SupplementaryFigure S1; Supplementary Table S3). At the population level,populations of S. caseolaris from its range margins (CWC, SRK,BPF, BSK, and AQS) exhibited lower levels of polymorphism than
Frontiers in Plant Science | www.frontiersin.org 4 October 2016 | Volume 7 | Article 1618

fpls-07-01618 October 24, 2016 Time: 16:10 # 5
Yang et al. Ancient Geography-drived Divergence in Sonneratia
FIGURE 1 | Maximum parsimony (MP) and maximum likelihood (ML) phylogenetic trees of Sonneratia based on the combined sequences of nrITSand one nuclear gene rpl9. S. lanceolata samples are shown in bold. Numbers up and down the branches are bootstrap values (>50%) of the MP and MLanalysis, respectively. The abbreviations of the sampling location after species names are listed in Additional file 6: Supplementary Table S4.
those from its distribution center (MSB, MKK, MSN, ISG, andICJ, Supplementary Figure S1). MSB and ISG populations hadthe highest levels of nucleotide diversity (θπ = 3.556 and 3.558per kb, respectively), while the population from Sri Lanka (SRK)had the lowest diversity (θπ= 0.054 per kb).
Population Structure within S. caseolarisAcross the IWP RegionHaplotype network analyses at both the chloroplast fragmentsand the five nuclear genes showed strong population structurethat tracked with geographical distribution of S. caseolaris
Frontiers in Plant Science | www.frontiersin.org 5 October 2016 | Volume 7 | Article 1618
fpls-07-01618 October 24, 2016 Time: 16:10 # 6
Yang et al. Ancient Geography-drived Divergence in Sonneratia
FIGURE 2 | Geographic distribution of haplotypes and Median-Joining network for the combined chloroplast fragments (A) and five nuclear genes (B:rpl9, C: cpi, D: ppi, E: phi, and F: nhx2) in the 12 populations of Sonneratia caseolaris and the single population of S. lanceolata. Each haplotype wasrepresented by a single circle whose size reflects haplotype frequency. Haplotypes with close relationships are marked with the same color. Each branch with morethan one mutational step is labeled. Population abbreviations are defined in Table 1.
Frontiers in Plant Science | www.frontiersin.org 6 October 2016 | Volume 7 | Article 1618

fpls-07-01618 October 24, 2016 Time: 16:10 # 7
Yang et al. Ancient Geography-drived Divergence in Sonneratia
FIGURE 3 | Likely genetic clusters and geographical barriers existing among the 12 populations of S. caseolaris and the single population ofS. lanceolata. (A) Bayesian clustering analysis of the five nuclear genes implemented in STRUCTURE. To illustrate the hierarchical population structure across theIWP region, we show clustering with the best-fitting model of K = 2, as well as K = 3 and K = 4. (B) Putative geographical barriers identifed within the IWP regions.The bars show the output of Bayesian clustering analysis with K = 4. Population abbreviations are defined in Table 1.
(Figure 2). Four chlorotypes in the 12 populations fell intothree major clusters corresponding to three geographic regions.The first cluster comprises populations around the SCS (CWC,CBA, TST, MSB, MKK, and MSN), the second is restricted tothe Indian Ocean (SRK, BPF, BSK, and ICJ), and the third isfound exclusively in Queensland, Australia (AQS, Figure 2A).Similar to the chloroplast fragments, haplotype networks of fourof the five nuclear genes (rpl9, ppi, phi, and nhx2) showed threedistinct groups restricted to the SCS, the Indian Ocean andeastern Australia (Figures 2B,D,E,F). Polymorphisms in the cpigene revealed only two groups, with one predominant in theSCS and the other combining the Indian Ocean and Australianpopulations (Figure 2C). The haplotype networks, in additionto a MDS analysis of the genetic distance matrix, showed thatthe population from eastern Australia was most highly divergedfrom the SCS and the Indian Ocean (Figure 2; Supplementary
Figure S2). This pattern is consistent with early separation of theIndo-Malesia from Australasia.
Bayesian clustering analysis using STRUCTURE suggeststhat the statistically optimal number of populations is K = 2(Supplementary Figure S3). However, the results for K = 3and 4 were also biologically meaningful and were included inthis study. At K = 3 Bayesian clustering analysis generatedpopulation assignments consistent with haplotype network andMDS analysis, splitting samples from the SCS, the IndianOcean and eastern Australia into their own groups (Figure 3A;Supplementary Figure S2). Using the Barrier software, strongestbarriers, supported by four of the five genes, were identifiedbetween the populations from the SCS and the Indian Ocean,corresponding to the high genetic divergence of the SCS andthe Indian Ocean lineages (Figure 3B). Within the IndianOcean group, a relatively weak barrier marked a subdivision
Frontiers in Plant Science | www.frontiersin.org 7 October 2016 | Volume 7 | Article 1618

fpls-07-01618 October 24, 2016 Time: 16:10 # 8
Yang et al. Ancient Geography-drived Divergence in Sonneratia
FIGURE 4 | Divergence time of the six Sonneratia species, as well as the different lineages of S. caseolaris. The scale bar is 1.0 million years (MYA). Thevalue and purple bar at each node indicate the estimated divergence time (MYA) with its 95% highest probability density interval (HPDI).
between Sri Lanka and Bangladesh, which was in agreementwith the Bayesian clustering result with K set to 4. Theseresults indicated that geographic features in the IWP regionmight have profoundly shaped population structure withinS. caseolaris.
Within S. caseolaris, the divergence time between the Indo-Malesia and Australasia populations was estimated to be 4.035million years ago (MYA; 95% of the highest probability densityinterval (HPDI): 2.298–6.318 MYA, Figure 4). Within the Indo-Malesia region, the split between the SCS and the Indian Oceanlineages occurred at 2.561 MYA (95% HPDI: 1.375–3.981 MYA),while the Sri Lanka population diverged from Bangladesh (BSKand BPF) 1.286 MYA (95% HPDI: 0.522–2.174 MYA).
Genetic Admixture at the Indo-PacificBoundaryWe observed extensive admixture between the SCS and theIndian Ocean groups, as evidenced by the analyses of chloroplastfragments as well as nuclear genes, in the Sangaibuntu population(ISG), located near the Indo-Pacific boundary. Similar patternswere also observed in three other populations that are closeto the Malacca Strait (MSB, MKK, and MSN). Bayesianclustering likewise showed signals of genetic admixture betweenthe SCS and the Indian Ocean groups in the ISG, MSB,and MSN populations (Figure 3A). When K was set to 2,approximately 74.6% of the nucleotide variations present inthe ISG population came from the Indian Ocean lineage,while 25.4% were from the SCS lineage. In the two Malaysianpopulations, the proportion of SNPs that belong to the SCSlineages was slightly higher (78.1 and 87.3% in MSB and MSN,respectively).
We then used the isolation with migration (IM) model toestimate demographic parameters of S. caseolaris populationsfrom the SCS (CWC and CBA), the Indian Ocean (BSK, BPFand SRK) and the Indo-Pacific boundary (ISG) (Figure 5;Table 2). The effective sample size (ESS) was larger than70,000, indicating a well-mixed chain. As a result of runningthe BEAST program on our data, we obtained an estimateof the mutation rate at 1.673 ∗ 10−9 substitutions per siteper year (s/s/y; 95% HPDI: 1.219 ∗ 10−9–2.195 ∗ 10−9 s/s/y).Under this assumed mutation rate, effective size (Ne) of thetwo SCS populations (CWC and CBA) was estimated to be107 (95% HPDI: 0–1,253) and 322 (95% HPDI: 0–64,092),respectively; Ne of the populations from the Indian Ocean(BSK/BPF and SRK) was 537 (95% HPDI: 179–2,111) and 36(95% HPDI: 0–680), respectively (Figure 5C). Ne of the ISGpopulation was estimated at 1,396 (95% HPDI: 394–4,187),much greater than that in other populations. The migrationrate from the Indian Ocean population SRK to the populationISG was estimated to 0.119 (95% HPDI: 0.000–0.452), whichwas significantly greater than zero (LLR = 3.224, p < 0.05,Figure 5D).
Genetic Divergence betweenS. caseolaris and S. lanceolataIn contrast to S. caseolaris, genetic diversity of the S. lanceolatapopulation (SLA) was extremely low in both chloroplastfragments and the five nuclear genes, with θπ ranging from 0.000to 0.110 and θw from 0.000 to 0.350 per kb (SupplementaryTable S3).
The position of S. lanceolata within the clade that comprisesthe S. caseolaris samples suggested by our phylogenetic analysis
Frontiers in Plant Science | www.frontiersin.org 8 October 2016 | Volume 7 | Article 1618

fpls-07-01618 October 24, 2016 Time: 16:10 # 9
Yang et al. Ancient Geography-drived Divergence in Sonneratia
FIGURE 5 | Probability density plots of the demographic parameters estimated from the isolation with migration model for populations from the SCS(CWC and CBA), the Indian Ocean (SRK, BSK and BPF) and the Indo-Pacific boundary region (ISG). (A) A schematic of the isolation with migration model.Population abbreviations are defined in Table 1. (B) Probability density of the divergence time between CWC and CBA (T0), between the Sri Lanka population (SRK)and two Bangladesh populations (BSK and BPF, T1) and the formation time of the ISG population (T2). (C) Probability density of the effectively population sizes (Ne)of the five populations. (D) Probability density estimation of the migration rate from the CWC, CBA, BSK and BPF and SRK to ISG populations.
was verified by the haplotype network reconstruction andBayesian clustering. No polymorphism was detected in thechloroplast fragments sequenced in S. lanceolata, and this speciesdiffers from the Indian Ocean populations of S. caseolaris by onlyone mutation (Figure 2A). At the two of the five nuclear genes(ppi and nhx2), S. lanceolata is most closely related to the IndianOcean populations of S. caseolaris (Figures 2D,F). At the genephi, the haplotype of S. lanceolata forms its own clade that differsfrom the Indian Ocean S. caseolaris samples by 11 mutations(Figure 2E). In contrast, the remaining two genes, rpl9 and cpi,contained haplotypes that grouped with the Malaysia population(MSN) of S. caseolaris (Figures 2B,C).
For the optimal clustering (K = 2, Supplementary FigureS3) of the Bayesian clustering, S. lanceolata was assigned to thesame cluster as the Indian Ocean and Australian populationsof S. caseolaris, distinct from the SCS group of that species(Figure 3A). When K = 3, there was a division between theS. caseolaris populations from the Indian Ocean and Australiaof S. caseolaris with the S. lanceolata population falling intothe Indian Ocean population cluster. Increasing K to 4 resultsin S. lanceolata samples forming a new cluster with the twoBangladesh populations of S. caseolaris. These results suggestthat S. lanceolata is closely related to the Indian Oceanlineage of S. caseolaris. Moreover, based on the pairwise KXY
Frontiers in Plant Science | www.frontiersin.org 9 October 2016 | Volume 7 | Article 1618

fpls-07-01618 October 24, 2016 Time: 16:10 # 10
Yang et al. Ancient Geography-drived Divergence in Sonneratia
TAB
LE2
|MLE
san
dth
e95
%hi
ghe
stp
rob
abili
tyd
ensi
tyin
terv
al(H
PD
I)o
fal
ldem
og
rap
hic
par
amet
ers
esti
mat
edus
ing
the
iso
lati
on
wit
hm
igra
tio
nm
od
el(IM
a2).
Mut
atio
nra
te(∗
10−
9s/
s/y)
T0
(MYA
)T
1(M
YA)
T2
(MYA
)N
e CW
CN
e CB
AN
e IS
GN
eB
SK
/B
PF
Ne S
RK
2NM
CW
C→
ISG
2NM
CB
A→
ISG
2NM
BP
F/B
SK→
ISG
2NM
SR
K→
ISG
1.21
90.
004
0.03
40.
046
147
442
1,91
573
749
(0.0
00–0
.090
)(0
.004
–0.2
99)
(0.0
07–2
.108
)(0
–1,7
19)
(0–8
7,96
2)(5
40–5
,747
)(2
46–2
,897
)(0
–933
)
1.67
30.
003
0.02
50.
033
107
322
1,39
653
736
0.00
10.
001
0.00
10.
119
(0.0
00–0
.065
)(0
.003
–0.2
18)
(0.0
05–1
.536
)(0
–1,2
53)
(0–6
4,09
2)(3
94–4
,187
)(1
79–2
,111
)(0
–680
)(0
.000
–0.3
47)
(0.0
00–0
.354
)(0
.000
–0.2
33)
(0–0
.452
)
2.19
50.
002
0.01
90.
025
8224
51,
064
409
27
(0.0
00–0
.050
)(0
.002
–0.1
66)
(0.0
04–1
.171
)(0
–955
)(0
–48,
850)
(300
–3,1
91)
(136
–1,6
09)
(0–5
18)
LLR
−0.
000
−0.
000
−0.
000
3.22
4∗
Fore
ach
para
met
er,9
5%H
PD
Iis
show
nin
pare
nthe
ses.
T0is
the
dive
rgen
cetim
ebe
twee
nth
eC
WC
and
CB
Apo
pula
tions
,whi
leT1
isth
edi
verg
ence
time
betw
een
the
popu
latio
nsfro
mS
riLa
nka
(SR
K)a
ndB
angl
ades
h(B
SK
and
BP
F).T
2re
pres
ents
the
form
atio
ntim
eof
the
ISG
popu
latio
n.M
utat
ion
rate
is1.
673∗
10−
9su
bstit
utio
nspe
rsi
tepe
rye
ar(s
/s/y
;95%
HP
DI:
1.21
9∗
10−
9–2
.195∗
10−
9s/
s/y)
.“∗”
deno
tes
p<
0.05
for
the
mig
ratio
nra
telik
elih
ood
ratio
test
.
values (Supplementary Figure S4; Supplementary Table S4),two putative barriers to gene flow between S. caseolarisand S. lanceolata were identified. One is located betweennorthern Australia and Java Island, and the other is betweenthe Arafura Sea and the Coral Sea. These two geographicbarriers surround the current distribution region of S. lanceolata(Figure 3B). This suggests that the isolation of the ArafuraSea from the surrounding oceanic regions might have triggeredthe S. lanceolata speciation event. Divergence time estimatesindicates that S. lanceolata diverged from the Indian Oceanlineage of S. caseolaris at approximately 2.057 MYA with 95%HPDI extending from 1.053 to 3.275 MYA (Figure 4).
DISCUSSION
Geographic Isolation Drives StrongGenetic Differentiation amongS. caseolaris PopulationsStrong genetic differentiation among the S. caseolaris populationswas associated with geographic barriers. We identified threedistinct genetic lineages located in the SCS, Indian Ocean andAustralia (Figures 2 and 3A; Supplementary Figure S2). We datedthe split between the Indo-Malesia and the Australasia regionsto 4.035 MYA (95% HPDI: 2.298–6.318 MYA, Figure 4), priorto the Pleistocene. This result suggests a critical role for pre-Pleistocene events in genetic divergence of the two main lineagesof S. caseolaris.
We further estimated that the SCS lineage diverged from theIndian Ocean lineage 2.561 MYA (95% HPDI: 1.375–3.981 MYA),in the early Pleistocene. Perhaps sea level changes during thisepoch drove the genetic differentiation between populations fromthese geographic areas. Dispersal of seeds via sea currents plays animportant role in determining the extant distribution and geneticcomposition of mangrove species within and among differentoceanic regions (Duke, 1995; Dodd and Rafii, 2002; Triest, 2008).During glacial periods, global sea levels dropped and exposedthe bulk of the shallow seabed in the SCS, forming temporaryland bridges connecting mainland Asia with the three SundaIslands (Sumatra, Borneo and Java; Voris, 2000; Sathiamurthyand Voris, 2006). This landmass likely acted as a strong physicalbarrier halting sea-drifted gene flow between the SCS and theIndian Ocean populations of S. caseolaris during Pleistocene,consistent with the differentiation mechanism suggested for othermangrove species (Ge and Sun, 2001; Liao et al., 2007; Huanget al., 2008; Urashi et al., 2013; Wee et al., 2015) and numerousmarine organisms (Barber et al., 2000; Nelson et al., 2000;Crandall et al., 2008; DeBoer et al., 2008; Froukh and Kochzius,2008).
It is usually difficult to distinguish genetic admixture fromincomplete lineage sorting, thus reducing the resolution of signalsof gene flow (Ng et al., 2015). In this study, we provide novelevidence for genetic admixture of the SCS and Indian Oceanlineages at the Indo-Pacific boundary in S. caseolaris. Analysesof haplotype frequencies at the chloroplast fragments and four ofthe five nuclear genes showed that the ISG population harbors
Frontiers in Plant Science | www.frontiersin.org 10 October 2016 | Volume 7 | Article 1618

fpls-07-01618 October 24, 2016 Time: 16:10 # 11
Yang et al. Ancient Geography-drived Divergence in Sonneratia
haplotypes from both the SCS and the Indian Ocean groups(Figures 2B–D,F). Haplotypes of nuclear genes fell into twohighly divergent clusters separated from each other by 5–14mutational steps and there were no intermediate haplotypes.This pattern is highly unlikely to have arisen within ISG inthe face of ancestral polymorphism, strongly suggesting thatpreviously isolated lineages came into contact and mixed inthis population. This idea is consistent with our simulationunder the isolation with migration (IM) model that identifiedsubstantial gene flow from the Sri Lanka population (SRK) intoISG (Figure 5D).
Although the basin of the Java Sea was exposed duringglaciations, especially the Last Glacial Maximum (LGM),subsequent interglacial sea-level rises restored the sea corridorsconnecting the SCS and the Indian Ocean (Wyrtki, 1961). Itis thus easily to imagine that seeds from both the SCS andthe Indian Ocean could rapidly re-colonize the seashore ofthe Java Sea via drift on sea currents, resulting in secondarycontact of the two previously isolated lineages in this area.Similar genetic admixture of SCS and Indian Ocean groupswas observed in two mangrove species Rhizophora apiculata(Yahya et al., 2014) and Lumnitzera racemosa (Li et al., 2016),as well as the false clown anemonefish (Amphiprion ocellaris,Timm and Kochzius, 2008) and reef communities (Hoeksema,2007).
Recent Origin of S. lanceolata Triggeredby Glacial IsolationS. lanceolata was first described as a new species by Blume (1851)and is highly similar to S. caseolaris in both morphology andecology, suggesting a close relationship between these two species(Duke and Jackes, 1987; Duke et al., 1998). Coincidently, ourphylogenetic analysis using the combined sequences of nrITSand the nuclear gene rpl9 indicates that S. lanceolata is nestedwithin the S. caseolaris clade (Figure 1). The main differentiatingcharacter between these species is stamen color, which is whitein S. lanceolata (Duke and Jackes, 1987; Duke, 1994, 2006).However, the stamen colors of S. caseolaris vary in differentlocations. For example, the stamens of S. caseolaris are purplishred in Australia and Bangladesh, while they are white in theupper part and red in the basal part in China and Thailand(S. Shi, personal observation). Bayesian clustering analysis andKXY statistics showed that S. lanceolata individuals (collected inAustralia) were genetically closer to the Indian Ocean group thaneither the SCS or Australia groups of S. caseolaris (Figure 3A;Supplementary Figure S4). The split between these two specieswas estimated to occur 2.057 MYA (95% HPDI: 1.053–3.275MYA, Figure 4), during early Pleistocene.
Our results of genetic similarity and divergence time areconsistent with an important role of geographic isolationdriven by Pleistocene glaciations as a trigger of lineage breakbetween S. lanceolata and S. caseolaris. At the boundarybetween Indo-Malesia and Australasia, over 25,000 volcanicocean islands and the shallow seas surrounding them areparticularly sensitive to sea level fluctuations (Briggs, 1987, 2005;Bellwood et al., 2004; Hoeksema, 2007). During Pleistocene
glaciations, sea levels dropped as much as 116 m (Miller et al.,2005; Sathiamurthy and Voris, 2006), connecting the islandsand forming a strong physical barrier that likely preventedgenetic exchange between the two regions (Triest, 2008; Esselstynet al., 2009; Lohman et al., 2011). Likewise, the Torres Straitis a shallow watercourse connecting the Arafura Sea andthe Coral Sea (only 7–15 m deep; Harris, 1988) that spentapproximately 70% of the time since the Pleistocene closedto sea traffic (Miller et al., 2005). These two barriers togene flow likely enabled the split between S. lanceolata andS. caseolaris.
Similar genetic differentiation and speciation might havealso occurred in other mangrove genera. Avicennia integrais a narrowly distributed species confined to the NorthernTerritory, Australia (Duke, 2006). In contrast, its sister speciesA. officinalis has a much wider range extending from South Indiathrough Malaysia and Indonesia to New Guinea and easternAustralia (Tomlinson, 1986). The divergence time betweenthese two species was estimated at 2.5 MYA, correspondingto the onset of Pleistocene (Li, 2015). Another case wasobserved between two sibling species of Ceriops, C. tagaland C. australis. Morphologically, C. australis differs fromC. tagal by the shorter terete and smooth hypocotyls andlonger flowers, calyx lobes and petals (White, 1926; Ballmentet al., 1988; Sheue et al., 2009). Geographically, C. australisis restricted to Australia, along the costal lines of NorthTerritory and Queensland, and a part of New Guinea andIndonesia, while C. tagal widely occurs from southern Indiathrough Southeast Asia to Australia (Duke, 2006). However,C. australis is found more often than C. tagal in Australia(Sheue et al., 2009). These findings suggested that Pleistoceneglacial vicariance may have been a general force contributingto recent inter-species divergence among numerous mangrovegenera.
AUTHOR CONTRIBUTIONS
SS and RZ designed the study. YY, FP, and CZ collected materialsand performed experiments. YY, FP, JL, and SY analyzed andinterpreted the data. YY, ND, FP, RZ, and SS wrote themanuscript. All authors read and approved the final manuscript.
FUNDING
This study was supported by grants from the National NaturalScience Foundation of China (Grant Nos. 41130208, 91331202,and 31130069); Grant 33000-18811202 from the 985 Project;the Science Foundation of State Key Laboratory of Biocontrol(grant numbers SKLBC13A03) and the Chang Hungta ScienceFoundation of Sun Yat-Sen University.
ACKNOWLEDGMENTS
We wish to thank Dr. John Yong (Singapore University ofTechnology and Design) for his help in sample collection and
Frontiers in Plant Science | www.frontiersin.org 11 October 2016 | Volume 7 | Article 1618

fpls-07-01618 October 24, 2016 Time: 16:10 # 12
Yang et al. Ancient Geography-drived Divergence in Sonneratia
Dr. Anthony Greenberg (Bayesic Research LLC) for his help inlanguage editing.
SUPPLEMENTARY MATERIAL
The Supplementary Material for this article can be found onlineat: http://journal.frontiersin.org/article/10.3389/fpls.2016.01618/full#supplementary-material
TABLE S1 | Gene IDs, gene descriptions, primer sequences and GenBankaccession numbers of haplotypes for the two chloroplast fragments andfive nuclear genes used in this study.
TABLE S2 | GenBank accession numbers of the sequences of the nuclearribosomal internal transcribed spacer (nrITS) and the nuclear gene rpl9 forthe six Sonneratia species and the outgroup D. grandiflora used in thisstudy.
TABLE S3 | Statistics of the combined chloroplast fragments and the fivenuclear genes for the populations of S. caseolaris and S. lanceolata.Population IDs are defined in Table 1. S, the number of segregating sites; h, thenumber of haplotypes; Hd, haplotype diversity; θπ, nucleotide diversity; θw, DNApolymorphism.
TABLE S4 | Means and standard variations (SD) of pairwise KXY values ofthe five nuclear genes among the 13 populations of S. caseolaris andS. lanceolata. Means were listed in lower left matrix, while SD were listed in theupper right matrix. Population abbreviations are defined in Table 1.
REFERENCESBallment, E. R., Tj Iii, S., and Stoddart, J. A. (1988). Sibling species in the mangrove
genus Ceriops (Rhizophoraceae), detected using biochemical genetics*. Aust.Syst. Bot. 1, 391–397. doi: 10.1071/SB9880391
Bandelt, H.-J., Forster, P., and Röhl, A. (1999). Median-joining networksfor inferring intraspecific phylogenies. Mol. Biol. Evol. 16, 37–48. doi:10.1093/oxfordjournals.molbev.a026036
Barber, P. H., Palumbi, S. R., Erdmann, M. V., and Moosa, M. K. (2000).Biogeography: a marine Wallace’s line? Nature 406, 692–693. doi:10.1038/35021135
Bellwood, D. R., van Herwerden, L., and Konow, N. (2004). Evolution andbiogeography of marine angelfishes (Pisces: Pomacanthidae). Mol. Phylogenet.Evol. 33, 140–155. doi: 10.1016/j.ympev.2004.04.015
Blume, C. L. (1851). Museum Botanicum Lugduno-Batavium: Sive, StirpiumExoticarum Novarum vel Minus Cognitarum ex Vivis aut Siccis Brevis Expsitioet Descriptio. Leiden: EJ Brill.
Briggs, J. C. (1987). Biogeography and Plate Tectonics. Amsterdam: Elsevier.Briggs, J. C. (2005). The marine East Indies: diversity and speciation. J. Biogeogr.
32, 1517–1522. doi: 10.1111/j.1365-2699.2005.01266.xCrandall, E. D., Jones, M. E., Munoz, M. M., Akinronbi, B., Erdmann, M. V.,
and Barber, P. H. (2008). Comparative phylogeography of two seastars andtheir ectosymbionts within the Coral Triangle. Mol. Ecol. 17, 5276–5290. doi:10.1111/j.1365-294X.2008.03995.x
Daru, B. H., Yessoufou, K., Mankga, L. T., and Davies, T. J. (2013). A global trendtowards the loss of evolutionarily unique species in mangrove ecosystems. PLoSONE 8:e66686. doi: 10.1371/journal.pone.0066686
DeBoer, T. S., Subia, M. D., Erdmann, M. V., Kovitvongsa, K., and Barber, P. H.(2008). Phylogeography and limited genetic connectivity in the endangeredboring giant clam across the Coral Triangle. Conserv. Biol. 22, 1255–1266. doi:10.1111/j.1523-1739.2008.00983.x
Dodd, R. S., and Rafii, Z. A. (2002). Evolutionary genetics of mangroves:continental drift to recent climate change. Trees 16, 80–86. doi: 10.1007/s00468-001-0142-6
Doyle, J. J., and Doyle, J. L. (1987). A rapid DNA isolation procedure for smallquantities of fresh leaf tissue. Phytochem. Bull. 19, 11–15.
Drummond, A. J., Suchard, M. A., Xie, D., and Rambaut, A. (2012). Bayesianphylogenetics with BEAUti and the BEAST 1.7. Mol. Biol. Evol. 29, 1969–1973.doi: 10.1093/molbev/mss075
Duda, T. F. Jr., and Palumbi, S. R. (1999). Population structure of theblack tiger prawn, Penaeus monodon, among western Indian Ocean andwestern Pacific populations. Mar. Biol. 134, 705–710. doi: 10.1007/s002270050586
Duke, N. C. (1984). A mangrove hybrid, Sonneratia × gulngai (Sonneratiaceae)from north-eastern Australia. Austrobaileya 25, 103–105.
Duke, N. C. (1994). A mangrove hybrid Sonneratia xurama (Sonneratiaceae) fromnorthern Australia and southern New Guinea. Aust. Syst. Bot. 7, 521–526. doi:10.1071/SB9940521
Duke, N. C. (1995). Genetic diversity, distributional barriers and raftingcontinents—more thoughts on the evolution of mangroves. Hydrobiologia 295,167–181. doi: 10.1007/BF00029124
Duke, N. C. (2006). Australia’s Mangroves: The Authoritative Guide to Australia’sMangrove Plants. Brisbane, QLD: University of Queensland.
Duke, N. C., Ball, M. C., and Ellison, J. C. (1998). Factors influencing biodiversityand distributional gradients in mangroves. Glob. Ecol. Biogeogr. Lett. 7, 27–47.doi: 10.2307/2997695
Duke, N. C., and Jackes, B. R. (1987). A systematic revision of the mangrove genusSonneratia (Sonneratiaceae) in Australasia. Blumea 32, 277–302.
Esselstyn, J. A., Timm, R. M., and Brown, R. M. (2009). Do geological or climaticprocesses drive speciation in dynamic archipelagos? The tempo and modeof diversification in Southeast Asian shrews. Evolution 63, 2595–2610. doi:10.1111/j.1558-5646.2009.00743.x
Evanno, G., Regnaut, S., and Goudet, J. (2005). Detecting the number of clusters ofindividuals using the software STRUCTURE: a simulation study. Mol. Ecol. 14,2611–2620. doi: 10.1111/j.1365-294X.2005.02553.x
Falush, D., Stephens, M., and Pritchard, J. K. (2003). Inference of populationstructure using multilocus genotype data: linked loci and correlated allelefrequencies. Genetics 164, 1567–1587.
Farris, J. S., Kallersjo, M., Kluge, A. G., and Bult, C. (1995). Constructinga significant test for incongruence. Syst. Biol. 44, 570–572. doi:10.1093/sysbio/44.4.570
Froukh, T., and Kochzius, M. (2008). Species boundaries and evolutionarylineages in the blue green damselfishes Chromis viridis and Chromisatripectoralis (Pomacentridae). J. Fish Biol. 72, 451–457. doi: 10.1111/j.1095-8649.2007.01746.x
Ge, X.-J., and Sun, M. (2001). Population genetic structure of Ceriops tagal(Rhizophoraceae) in Thailand and China. Wetl. Ecol. Manag. 9, 213–219. doi:10.1023/A:1011156707160
Harris, P. T. (1988). Sediments, bedforms and bedload transport pathways on thecontinental shelf adjacent to Torres Strait, Australia—Papua New Guinea. Cont.Shelf Res. 8, 979–1003. doi: 10.1016/0278-4343(88)90058-1
Hewitt, G. (2000). The genetic legacy of the Quaternary ice ages. Nature 405,907–913. doi: 10.1038/35016000
Hewitt, G. M. (2001). Speciation, hybrid zones and phylogeography—or seeinggenes in space and time. Mol. Ecol. 10, 537–549. doi: 10.1046/j.1365-294x.2001.01202.x
Hey, J. (2010). Isolation with migration models for more than two populations.Mol. Biol. Evol. 27, 905–920. doi: 10.1093/molbev/msp296
Hey, J., and Nielsen, R. (2007). Integration within the Felsenstein equation forimproved Markov chain Monte Carlo methods in population genetics. Proc.Natl. Acad. Sci. U.S.A. 104, 2785–2790. doi: 10.1073/pnas.0611164104
Hoeksema, B. W. (2007). “Delineation of the Indo-Malayan centre of maximummarine biodiversity: the Coral Triangle,” in Biogeography, Time, and Place:Distributions, Barriers, and Islands, ed. W. Renema (Berlin: Springer), 117–178.
Hogarth, P. J. (1999). The Biology of Mangroves. New York, NY: Oxford UniversityPress.
Hogarth, P. J. (2001). Mangrove ecosystems. Encycl. Biodivers. 3, 853–870. doi:10.1006/rwbd.1999.0372
Huang, Y., Tan, F., Su, G., Deng, S., He, H., and Shi, S. (2008). Population geneticstructure of three tree species in the mangrove genus Ceriops (Rhizophoraceae)from the Indo West Pacific. Genetica 133, 47–56. doi: 10.1007/s10709-007-9182-1
Frontiers in Plant Science | www.frontiersin.org 12 October 2016 | Volume 7 | Article 1618

fpls-07-01618 October 24, 2016 Time: 16:10 # 13
Yang et al. Ancient Geography-drived Divergence in Sonneratia
Kittiwattanawong, K., Nugranad, J., and Srisawat, T. (2001). High geneticdivergence of Tridacna squamosa living at the west and east coasts of Thailand.Phuket Mar. Biol. Cent. Spec. Publication 25, 343–347.
Ko, W.-C. (1985). Notes on the genus Sonneratia (Sonneratiaceae) in SoutheastAsia. Acta Phytotaxonomica Sin. 23, 311–314.
Ko, W.-C. (1993). Notes on some Sonneratia (Sonneratiaceae) of China. J. Trop.Subtrop. Bot. 1, 11–13.
Kochzius, M., Söller, R., Khalaf, M. A., and Blohm, D. (2003). Molecular phylogenyof the lionfish genera Dendrochirus and Pterois (Scorpaenidae, Pteroinae) basedon mitochondrial DNA sequences. Mol. Phylogenet. Evol. 28, 396–403. doi:10.1016/S1055-7903(02)00444-X
Li, J., Yang, Y., Chen, Q., Fang, L., He, Z., Guo, W., et al. (2016). Pronounced geneticdifferentiation and recent secondary contact in the mangrove tree Lumnitzeraracemosa revealed by population genomic analyses. Sci. Rep. 6, 29486. doi:10.1038/srep29486
Li, X. (2015). The Mechanism of Speciation for Mangroves and the Evolutionof Avicennia in Indo-West Pacific. Doctor’s thesis, Sun Yat-sen University,Guangzhou.
Liao, P.-C., Havanond, S., and Huang, S. (2007). Phylogeography of Ceriops tagal(Rhizophoraceae) in Southeast Asia: the land barrier of the Malay Peninsula hascaused population differentiation between the Indian Ocean and South ChinaSea. Conserv. Genet. 8, 89–98. doi: 10.1007/s10592-006-9151-8
Librado, P., and Rozas, J. (2009). DnaSP v5: a software for comprehensiveanalysis of DNA polymorphism data. Bioinformatics 25, 1451–1452. doi:10.1093/bioinformatics/btp187
Lohman, D. J., de Bruyn, M., Page, T., von Rintelen, K., Hall, R., Ng, P. K. L., et al.(2011). Biogeography of the Indo-Australian archipelago. Annu. Rev. Ecol. Evol.Syst. 42, 205–226. doi: 10.1146/annurev-ecolsys-102710-145001
Macieira, R. M., Simon, T., Pimentel, C. R., and Joyeux, J.-C. (2015). Isolationand speciation of tidepool fishes as a consequence of Quaternary sea-levelfluctuations. Environ. Biol. Fishes 98, 385–393. doi: 10.1007/s10641-014-0269-0
Manni, F., Guerard, E., and Heyer, E. (2004). Geographic patterns of (genetic,morphologic, linguistic) variation: how barriers can be detected by usingMonmonier’s algorithm. Hum. Biol. 76, 173–190. doi: 10.1353/hub.2004.0034
McMillan, W. O., and Palumbi, S. R. (1995). Concordant evolutionary patternsamong Indo-West Pacific butterflyfishes. Proc. R. Soc. Lond. B Biol. Sci. 260,229–236. doi: 10.1098/rspb.1995.0085
Miller, K. G., Kominz, M. A., Browning, J. V., Wright, J. D., Mountain, G. S., Katz,M. E., et al. (2005). The Phanerozoic record of global sea-level change. Science310, 1293–1298. doi: 10.1126/science.1116412
Mora, C., Chittaro, P. M., Sale, P. F., Kritzer, J. P., and Ludsin, S. A. (2003).Patterns and processes in reef fish diversity. Nature 421, 933–936. doi:10.1038/nature01393
Nei, M., and Kumar, S. (2000). Molecular Evolution and Phylogenetics. New York,NY: Oxford University Press.
Nelson, J. S., Hoddell, R. J., Chou, L. M., Chan, W. K., and Phang, V. P. E.(2000). Phylogeographic structure of false clownfish, Amphiprion ocellaris,explained by sea level changes on the Sunda shelf. Mar. Biol. 137, 727–736. doi:10.1007/s002270000379
Ng, W. L., Onishi, Y., Inomata, N., Teshima, K. M., Chan, H. T., Baba, S.,et al. (2015). Closely related and sympatric but not all the same:genetic variation of Indo-West Pacific Rhizophora mangroves across theMalay Peninsula. Conserv. Genet. 16, 137–150. doi: 10.1007/s10592-014-0647-3
Nielsen, R., and Wakeley, J. (2001). Distinguishing migration from isolation: aMarkov chain Monte Carlo approach. Genetics 158, 885–896.
Posada, D., and Buckley, T. R. (2004). Model selection and model averaging inphylogenetics: advantages of Akaike information criterion and Bayesianapproaches over likelihood ratio tests. Syst. Biol. 53, 793–808. doi:10.1080/10635150490522304
Pritchard, J. K., Stephens, M., and Donnelly, P. (2000). Inference of populationstructure using multilocus genotype data. Genetics 155, 945–959.
Qiu, L., Zhou, R.-C., Li, Y.-Q., Havanond, S., Jaengjai, C., and Shi, S.-H. (2008).Molecular evidence for natural hybridization between Sonneratia alba andS-griffithii. J. Syst. Evol. 46, 391–395.
Ricklefs, R. E., and Latham, R. E. (1993). “Global patterns of diversity inmangrove floras,” in Species Diversity in Ecological Communities: Historical andGeographical Perspectives. Chicago, IL: University of Chicago Press, 215–229.
Rosenberg, N. A. (2004). DISTRUCT: a program for the graphical displayof population structure. Mol. Ecol. Notes 4, 137–138. doi: 10.1046/j.1471-8286.2003.00566.x
Sathiamurthy, E., and Voris, H. K. (2006). Maps of Holocene sea level transgressionand submerged lakes on the Sunda Shelf. Nat. Hist. J. Chulalongkorn Univ.Suppl. 2, 1–43.
Sheue, C. R., Liu, H. Y., Tsai, C. C., Rashid, S. M. A., Yong, J. W. H., and Yang,Y. P. (2009). On the morphology and molecular basis of segregation of Ceriopszippeliana and C. decandra (Rhizophoraceae) from Asia. Blumea 54, 220–227.doi: 10.3767/000651909X476193
Shi, S., Huang, Y., Tan, F., He, X., and Boufford, D. E. (2000). Phylogenetic analysisof the Sonneratiaceae and its relationship to Lythraceae based on ITS sequencesof nrDNA. J. Plant Res. 113, 253–258. doi: 10.1007/PL00013926
Su, G., Huang, Y., Tan, F., Ni, X., Tang, T., and Shi, S. (2007). Conservationgenetics of Lumnitzera littorea (Combretaceae), an endangered mangrove,from the Indo-West Pacific. Mar. Biol. 150, 321–328. doi: 10.1007/s00227-006-0357-6
Tamura, K., Stecher, G., Peterson, D., Filipski, A., and Kumar, S. (2013). MEGA6:molecular evolutionary genetics analysis version 6.0. Mol. Biol. Evol. 30, 2725–2729. doi: 10.1093/molbev/mst197
Thompson, J. D., Gibson, T. J., Plewniak, F., Jeanmougin, F., and Higgins, D. G.(1997). The CLUSTAL_X windows interface: flexible strategies for multiplesequence alignment aided by quality analysis tools. Nucleic Acids Res. 25,4876–4882. doi: 10.1093/nar/25.24.4876
Timm, J., and Kochzius, M. (2008). Geological history and oceanography of theIndo-Malay Archipelago shape the genetic population structure in the falseclown anemonefish (Amphiprion ocellaris). Mol. Ecol. 17, 3999–4014. doi:10.1111/j.1365-294X.2008.03881.x
Tomlinson, P. B. (1986). The Botany of Mangroves. Cambridge tropical biologyseries. Cambridge: Cambridge University Press.
Triest, L. (2008). Molecular ecology and biogeography of mangrove trees towardsconceptual insights on gene flow and barriers: a review. Aquat. Bot. 89, 138–154.doi: 10.1016/j.aquabot.2007.12.013
Urashi, C., Teshima, K. M., Minobe, S., Koizumi, O., and Inomata, N. (2013).Inferences of evolutionary history of a widely distributed mangrove species,Bruguiera gymnorrhiza, in the Indo-West Pacific region. Ecol. Evol. 3, 2251–2261. doi: 10.1002/ece3.624
Voris, H. K. (2000). Maps of Pleistocene sea levels in Southeast Asia:shorelines, river systems and time durations. J. Biogeogr. 27, 1153–1167. doi:10.1046/j.1365-2699.2000.00489.x
Wang, R., and Chen, Z. (2002). Systematics and biogeography study on the familySonneratiaceae. Guihaia 22, 214–219.
Watterson, G. A. (1977). Heterosis or neutrality? Genetics 85, 789–814.Wee, A. K. S., Takayama, K., Chua, J. L., Asakawa, T., Meenakshisundaram,
S. H., Adjie, B., et al. (2015). Genetic differentiation and phylogeography ofpartially sympatric species complex Rhizophora mucronata Lam. and R. stylosaGriff. using SSR markers. BMC Evol. Biol. 15:57. doi: 10.1186/s12862-015-0331-3
White, C. T. (1926). A variety of Ceriops tagal C. B Rob. (= C. candolleana W. &A.). J. Bot. 64, 220–221.
Williams, S. T., and Benzie, J. A. H. (1998). Evidence of a biogeographic breakbetween populations of a high dispersal starfish: congruent regions withinthe Indo-West Pacific defined by color morphs, mtDNA, and allozyme data.Evolution 52, 87–99. doi: 10.2307/2410923
Woerner, A. E., Cox, M. P., and Hammer, M. F. (2007). Recombination-filteredgenomic datasets by information maximization. Bioinformatics 23, 1851–1853.doi: 10.1093/bioinformatics/btm253
Wyrtki, K. (1961). Scientific Results of Marine Investigations of the South ChinaSea and the Gulf of Thailand 1959-1961. NAGA Report 2. San Diego, CA: TheUniversity of California, 164–169.
Yahya, A. F., Hyun, J. O., Lee, J. H., Kim, Y. Y., Lee, K. M., Hong, K. N., et al. (2014).Genetic variation and population genetic structure of Rhizophora apiculata(Rhizophoraceae) in the greater Sunda Islands, Indonesia using microsatellitemarkers. J. Plant Res. 127, 287–297. doi: 10.1007/s10265-013-0613-z
Yang, Y., Yang, S., Fang, L., Li, J., Zhong, C., Zhou, R., et al. (2015). Phylogeneticposition of Sonneratia griffithii based on sequences of the nuclear ribosomalinternal transcribed spacer and 13 nuclear genes. J. Syst. Evol. 53, 47–52. doi:10.1111/jse.12102
Frontiers in Plant Science | www.frontiersin.org 13 October 2016 | Volume 7 | Article 1618

fpls-07-01618 October 24, 2016 Time: 16:10 # 14
Yang et al. Ancient Geography-drived Divergence in Sonneratia
Zhou, R., Shi, S., and Wu, C.-I. (2005). Molecular criteria for determining newhybrid species—an application to the Sonneratia hybrids. Mol. Phylogenet. Evol.35, 595–601. doi: 10.1016/j.ympev.2005.03.012
Zhou, R., Zeng, K., Wu, W., Chen, X., Yang, Z., Shi, S., et al. (2007). Populationgenetics of speciation in nonmodel organisms: I. Ancestral polymorphismin mangroves. Mol. Biol. Evol. 24, 2746–2754. doi: 10.1093/molbev/msm209
Conflict of Interest Statement: The authors declare that the research wasconducted in the absence of any commercial or financial relationships that couldbe construed as a potential conflict of interest.
The reviewer YS declared a shared affiliation, though no other collaboration, withseveral of the authors YY, FP, JL, SY, RZ, SS to the handling Editor, who ensuredthat the process nevertheless met the standards of a fair and objective review.
Copyright © 2016 Yang, Duke, Peng, Li, Yang, Zhong, Zhou and Shi. This is anopen-access article distributed under the terms of the Creative Commons AttributionLicense (CC BY). The use, distribution or reproduction in other forums is permitted,provided the original author(s) or licensor are credited and that the originalpublication in this journal is cited, in accordance with accepted academic practice.No use, distribution or reproduction is permitted which does not comply with theseterms.
Frontiers in Plant Science | www.frontiersin.org 14 October 2016 | Volume 7 | Article 1618


![[Blank Page] · 30/07/2019 · In this regard, Council understands that barriers to sustainable employment can be systemic, geographical and socially determined. For this reason,](https://static.fdocuments.net/doc/165x107/5f0837c37e708231d420eb5c/blank-page-30072019-in-this-regard-council-understands-that-barriers-to.jpg)