ANCHORAGE OF LARGE-DIAMETER REINFORCING BARS GROUTED … Rapid Bridge Constructio… · anchorage...
148
DRAFT RESEARCH REPORT Agreement T4118, Task 05 Rapid Construction ANCHORAGE OF LARGE-DIAMETER REINFORCING BARS GROUTED INTO DUCTS by Kyle P. Steuck Jason B.K. Pang Graduate Research Assistant Graduate Research Assistant Marc O. Eberhard John F. Stanton Professor Professor Department of Civil and Environmental Engineering University of Washington, Box 352700 Seattle, Washington 98195 Washington State Transportation Center (TRAC) University of Washington, Box 354802 1107NE 45 th Street, Suite 535 Seattle, Washington 98105-4631 Prepared for Washington State Transportation Commission Department of Transportation and in cooperation with U.S. Department of Transportation Federal Highway Administration November 2007
Transcript of ANCHORAGE OF LARGE-DIAMETER REINFORCING BARS GROUTED … Rapid Bridge Constructio… · anchorage...

DRAFT RESEARCH REPORT Agreement T4118, Task 05
Rapid Construction
ANCHORAGE OF LARGE-DIAMETER REINFORCING BARS GROUTED INTO DUCTS
by
Kyle P. Steuck Jason B.K. Pang Graduate Research Assistant Graduate Research Assistant Marc O. Eberhard John F. Stanton Professor Professor
Department of Civil and Environmental Engineering
University of Washington, Box 352700 Seattle, Washington 98195
Washington State Transportation Center (TRAC) University of Washington, Box 354802
1107NE 45th Street, Suite 535 Seattle, Washington 98105-4631
Prepared for Washington State Transportation Commission
Department of Transportation and in cooperation with
U.S. Department of Transportation Federal Highway Administration
November 2007

TECHNICAL REPORT STANDARD TITLE PAGE
1. REPORT NO.
WA-RD 684.1 2. GOVERNMENT ACCESSION NO. 3. RECIPIENT’S CATALOG NO.
5. REPORT DATE
November 2007 4. TITLE AND SUBTITLE
ANCHORAGE OF LARGE-DIAMETER REINFORCING BARS GROUNTED INTO DUCTS
6. PERFORMING ORGANIZATION CODE
7. AUTHORS
Kyle P. Steuck, Jason B.K. Pang, Marc O. Eberhard John F. Stanton
8. PERFORMING ORGANIZATION CODE
10. WORK UNIT NO. 9. PERFORMING ORGANIZATION NAME AND ADDRESS
Washington State Transportation Center University of Washington, Box 354802 University District Building, 1107 NE 45th Street, Suite 535 Seattle, Washington (98105-7370)
11. CONTRACT OR GRANT NUMBER
T4118, Task 05
13. TYPE OF REPORT AND PERIOD COVERED
Draft Research Report 12. SPONSORING AGENCY NAME AND ADDRESS
Research Office Washington State Department of Transportation Transportation Building, MS 47372 Olympia, Washington 98504-7372 Project Manager: Kim Willoughby, 360-705-7978
14. SPONSORING AGENCY CODE
15. SUPPLIMENTARY NOTES
16. ABSTRACT
The use of a few large-diameter reinforcing bars for the construction of precast concrete bridge bents allows simplified construction by reducing the number of alignments to be made in the field. These bars are grouted into ducts in a precast concrete cap beam. In the proposed precast concrete substructure system, the grouted bars carry tensile forces across the joint between the column and cap beam. This joint is the yielding element in the structural system, and it is crucial to the performance of the structure that the bars yield before other failure mechanisms, including bond failure, occur. However, the cap beam is typically insufficient to anchor the bar, as the depth of the beam is substantially less than the American Association of State Highway and Transportation Officials (AASHTO) bridge code allows.
For this project, 17 pullout tests were conducted to determine the bond characteristics and development length of large-diameter bars grouted into ducts. The bars tested ranged in size from #8 to #18. Pullout tests conducted with embedment lengths of at least six bar diameters yielded the reinforcing bar, while the test conducted with an embedment length of 14 bar diameters resulted in bar fracture.
The tests and subsequent analysis showed that the bond of these grouted connections is significantly better than the bond of bars cast directly into concrete. The development lengths needed to fully anchor the bar are therefore within the depth available in the cap beam.
17. KEY WORDS
Bond strength, deformed bars, cement grouts, precast concrete, bridge substructures, joint construction, bents, anchorage, ducts
18. DISTRIBUTION STATEMENT
19. SECURITY CLASSIF. (of this report) 20. SECURITY CLASSIF. (of this page) 21. NO. OF PAGES 22. PRICE

iii
DISCLAIMER
The contents of this report reflect the views of the authors, who are responsible
for the facts and the accuracy of the data presented herein. The contents do not
necessarily reflect the official views or policies of the Washington State Transportation
Commission, Washington State Department of Transportation, or Federal Highway
Administration. This report does not constitute a standard, specification, or regulation.

iv

v
CONTENTS
EXECUTIVE SUMMARY ..................................................................................... xiii Objectives ............................................................................................................ xiii Background ............................................................................................................ xiii Results ............................................................................................................ xiii Conclusions ............................................................................................................ xiv CHAPTER 1: INTRODUCTION........................................................................... 1 1.1 Precast Concrete Construction for Rapid Construction of Bridges .................. 1 1.2 Proposed Precast Substructure System ............................................................. 3 1.3 The Importance of Bond to the Proposed System ............................................ 4 1.4 The Mechanism of Bond................................................................................... 5 1.5 Code Development Length Expressions........................................................... 7 1.6 Previous Research............................................................................................. 8 1.7 Research Program ............................................................................................. 9 1.8 Organization of Report ..................................................................................... 10 CHAPTER 2: EXPERIMENTAL PROGRAM 11 2.1 Overview of Testing ......................................................................................... 11 2.2 Specimen Design .............................................................................................. 13 2.3 Materials ........................................................................................................... 14 2.3.1 Concrete ................................................................................................ 14 2.3.2 Ducts ..................................................................................................... 14 2.3.3 Reinforcing Bars ................................................................................... 15 2.3.4 Grout ..................................................................................................... 16 2.3.5 Fibers..................................................................................................... 17 2.4 Test Bar Grouting Procedure ............................................................................ 18 2.5 Loading Apparatus............................................................................................ 18 2.5.1 Reaction Block...................................................................................... 19 2.5.2 Rams ..................................................................................................... 21 2.5.3 Load Cell............................................................................................... 21 2.5.4 Grips...................................................................................................... 21 2.6 Instrumentation ................................................................................................. 22 2.6.1 Load Cell............................................................................................... 22 2.6.2 Linear Potentiometers ........................................................................... 23 2.6.3 Strain Gages .......................................................................................... 24 2.7 Test Procedure .................................................................................................. 25 2.7.1 Setup ..................................................................................................... 25 2.7.2 Pullout Test ........................................................................................... 25 2.7.3 Post-Test Reset...................................................................................... 26 CHAPTER 3: RESULTS OF MATERIAL TESTS ............................................. 27 3.1 Reinforcing Bar Geometry................................................................................ 27 3.2 Reinforcing Bar Stress-Strain Data................................................................... 30 3.3 Grout Strengths ................................................................................................. 31

vi
3.4 Concrete Strengths ............................................................................................ 33 CHAPTER 4: PULLOUT RESULTS .................................................................... 34 4.1 Peak Results ...................................................................................................... 34 4.2 Force-Displacement Behavior .......................................................................... 35 4.2.1 Calculation of Front-End Slip............................................................... 36 4.2.2 Short-Embedment Length Tests ........................................................... 37 4.2.3 Long-Embedment Length Tests............................................................ 39 4.3 Damage Observations ....................................................................................... 40 4.3.1 Short-Embedment Length Tests ........................................................... 41 4.3.2 18S04 .................................................................................................... 44 4.3.3 Long-Embedment Length Tests............................................................ 46 4.3.4 Scaled Tests .......................................................................................... 48 CHAPTER 5: DISCUSSION OF FINDINGS ....................................................... 50 5.1 Grout Failure Mechanisms................................................................................ 50 5.2 Effect of Grout Strength.................................................................................... 52 5.3 Effect of Fibers ................................................................................................. 55 5.4 Effect of Bar Size and Geometry ...................................................................... 57 5.4.1 Full-Scale Tests..................................................................................... 58 5.4.2 Scaling for Joint Tests........................................................................... 60 5.5 Effect of Yielding ............................................................................................. 61 5.6 Comparison to Codes and Previous Research .................................................. 62 CHAPTER 6: LINEAR AND NONLINEAR MODELING ................................ 64 6.1 Linear Model..................................................................................................... 64 6.1.1 Model Form .......................................................................................... 64 6.1.2 Model Calibration ................................................................................. 66 6.2 Nonlinear Bond Model ..................................................................................... 70 6.2.1 Key Variables........................................................................................ 71 6.2.2 Unconfined Model ................................................................................ 71 6.2.3 Confined Model .................................................................................... 72 6.2.4 Comparison to Other Bond Models ...................................................... 75 6.3 Nonlinear Analysis Method .............................................................................. 76 6.4 Results of Nonlinear Model .............................................................................. 78 6.4.1 Peak Loads by Test ............................................................................... 78 6.4.2 Force-Displacement Behavior .............................................................. 80 6.4.3 Bond Stress Distribution....................................................................... 81 6.4.4 Development Length............................................................................. 83 CHAPTER 7: CONCLUSIONS ............................................................................. 86 7.1 Summary ........................................................................................................... 86 7.1 Conclusions....................................................................................................... 87 7.2 Implementation Recommendations .................................................................. 88 7.3 Suggestions for Further Research ..................................................................... 88

vii
REFERENCES......................................................................................................... 89 APPENDIX A: SYSTEM TABLE AND SCHEMATIC DRAWINGS.............. A-1 APPENDIX B: NET STRESS-STRAIN PLOTS ................................................. B-1 APPENDIX C: FORCE-DISPLACEMENT PLOTS.......................................... C-1 APPENDIX D: FEM CODE .................................................................................. D-1 APPENDIX E: MODEL RESULTS ..................................................................... E-1

viii
FIGURES Figure Page
1.1 Schematic of two-column bent with moment diagram from seismic loading 1 1.2 Comparison of reinforced concrete (left) and precast (right) column-to-cap
beam joints .................................................................................................. 2 1.3 Displaced columns and rotations ................................................................ 3 1.4 Big bar system............................................................................................. 4 1.5 Equilibrium of pullout test .......................................................................... 6 2.1 Tests performed in each specimen.............................................................. 13 2.2 Bamboo ribs on a #18 bar ........................................................................... 16 2.3 Preliminary grout strengths......................................................................... 17 2.4 Test setup .................................................................................................... 19 2.5 Annuli of contact for ram and reaction block ............................................. 20 2.6 Reaction block design ................................................................................. 20 2.7 Triple ram used to yield and fracture #18 bars ........................................... 21 2.8 Wedge grip design ...................................................................................... 22 2.9 Schematic of instrumentation bridge with pots .......................................... 23 2.10 Photo of pots for test 18N02 ....................................................................... 24 3.1 Bar dimensions for net area calculations .................................................... 28 3.2 Bar dimenstions for relative rib area........................................................... 29 3.3 Net stress-strain curve................................................................................. 31 3.4 Test mix grout strengths.............................................................................. 32 4.1 Peak nominal bar stress vs Le/db................................................................ 35 4.2 Bar stretch above the grout surface............................................................. 36 4.3 Short-embedment length force-displacement curves.................................. 37 4.4 Ascending branch of short, no fiber, #18 tests............................................ 38 4.5 Force-displacement: 18N08........................................................................ 39 4.6 Force-displacement to yield: 18N08........................................................... 40 4.7 Grout cone: 18F02 ...................................................................................... 42 4.8 Grout cone: 18N02...................................................................................... 42 4.9 Layered grout cone: 14N08 ........................................................................ 43 4.10 Grout cone and sheared grout: 18F04......................................................... 44 4.11 Force-displacement: 18S04......................................................................... 45 4.12 Reinforcement: 18S04 ................................................................................ 45 4.13 Concrete splitting: 18S04............................................................................ 46 4.14 Fractured bar: 18N14 .................................................................................. 47 4.15 Concrete damage: 08C08............................................................................ 48 4.16 Grout damage: 08N08................................................................................. 48 5.1 Struts in grout.............................................................................................. 51 5.2 τavg vs grout strength ................................................................................... 52 5.3 τavg vs Le...................................................................................................... 53

ix
5.4 τavg/f’g vs le .................................................................................................. 54 5.5 τavg/ '
gf vs le ............................................................................................... 55 5.6 Fiber and no fiber bond stress-displacement comparison........................... 56 5.7 Ascending branch of bond-slip histories..................................................... 57 5.8 Eight-db embedment length tests................................................................ 58 5.9 Four-db embedment length tests................................................................. 59 5.10 Initial response of four-db embedment length tests..................................... 60 5.11 Scaling comparison..................................................................................... 61 5.12 Stress vs le/db with predictions.................................................................... 63 6.1 Slip distributions for varying λLe values .................................................... 66 6.2 Bond stiffness calculation ........................................................................... 67 6.3 Local bond stiffnesses................................................................................. 68 6.4 Back-end slip for test 18N08 ...................................................................... 70 6.5 Unconfined bond model.............................................................................. 72 6.6 Assumed strain and slip distributions ......................................................... 74 6.7 Confined bond model.................................................................................. 75 6.8 Bond model comparison ............................................................................. 76 6.9 Schematic of the nonlinear model............................................................... 77 6.10 Steel constitutive model.............................................................................. 77 6.11 Peak loads from FEM and experiments ...................................................... 79 6.12 Test and FEM force-displacement comparison .......................................... 80 6.13 Bond stress distributions ............................................................................. 81 6.14 Slip distributions ......................................................................................... 83 6.15 FEM development length predictions......................................................... 84
x
TABLES Table Page 2.1 Test matrix .................................................................................................. 12 2.2 Duct dimensions.......................................................................................... 15 3.1 Bar dimensions............................................................................................ 27 3.2 Yield stresses and elastic moduli ................................................................ 30 3.3 Test day grout strengths .............................................................................. 32 4.1 Peak resistances .......................................................................................... 34 6.1 Average and local bond stiffness ................................................................ 68 6.2 Bond stiffnesses and slip fractions.............................................................. 69

xi
LIST OF SYMBOLS A Bar cross sectional area Aavg Average bar area Ab Bar area (AASHTO) Anet Net bar area Anom Nominal bar area cb Bar spacing (ACI) db Bar diameter dduct Duct diameter E Elastic modulus f’c Concrete compressive strength f’g Grout compressive strength fy Steel yield stress hr Height of reinforcing bar deformation k Local bond stiffness K Average bond stiffness Ktr Transverse reinforcement index (ACI) Lair Length between grout surface and pot measurement Lbar Length of measured bar Le Embedment length Lunconfined Length of unconfined region (cone) ld Development length P Axial load on reinforcing bar Punconfined Load accounted for in unconfined region Sr Spacing of deformations on reinforcing bar u Displacement in direction of pulled bar uair In-air stretch of the reinforcing bar uconfined Displacement of the midpoint of the confined region usurface Displacement at the grout surface upot Displacement measured by the linear potentiometers umid Displacement calculated at midpoint of the embedded length Wactual Weight of a section of reinforcing bar wnom Weight per unit length of reinforcing bar as given by ASTM wr Width of deformation on reinforcing bar x Distance along reinforcing bar β Slip fraction (see Chapter 6) γ Shear strain ε Axial strain εair Bar strain measured by strain gages εcone Calculated bar strain at the base of the unconfined region λ Stiffness parameter (see Chapter 6) Π Bar perimeter σ Bar stress σavg Bar stress calculated using average area σnet Bar stress calculated using net area

xii
σnom Bar stress calculated using nominal area σu Ultimate bar stress τ Bond stress on bar surface τ avg Average bond stress on bar surface τ duct Average bond stress on duct surface Ψe Epoxy coating factor (ACI) Ψs Size factor (ACI) Ψt Top bar factor (ACI)

xiii
EXECUTIVE SUMMARY
OBJECTIVES This research program consisted of experimental tests and numerical simulations
of the anchorage of large-diameter reinforcing bars grouted into steel ducts. The research
was conducted to support the development of a new precast column and beam system,
which is intended to help accelerate the construction of bridge bents in seismically active
regions. In this system, a small number of large-diameter reinforcing bars project from
the top of the column into large ducts cast into the cap beam. The bars are then grouted
in the ducts to provide continuity. These large-diameter ducts, formed with 8-inch
corrugated steel pipe, allow the proposed system to be constructed easily in the field.
BACKGROUND In the proposed system, the grouted bars carry tensile forces across the joint
between the column and cap beam. This joint is the yielding element in the structural
system, and it is crucial to the performance of the structure that the bars yield before
other failure mechanisms, including bond failure, occur. The bars must therefore be fully
developed.
The experimental program consisted of 17 monotonic pullout tests on bars
ranging in size from No. 8 to No. 18 and with embedment lengths of 2 to 14 bar
diameters. Both fiber-reinforced and unreinforced grouts were tested. The tests on No. 8
bars were conducted in scaled ducts to replicate the sizes used in the scaled beam-column
joint tests.
RESULTS In fourteen of the seventeen tests, failure occurred by bar pullout through the
grout. Near the surface of the grout, a cone also pulled out. Over the remaining
embedded length, a cylinder, consisting of the bar surrounded by an annulus of grout
captured between the lugs, pulled through the surrounding grout. This shearing cylinder
provided greater bond resistance per unit area than did the unconfined cone region. Two

xiv
tests (18S04 and 08C08) resulted in concrete splitting failures, and one test (18N14)
resulted in bar fracture.
Reinforcing the grout with fibers did not provide any advantage in the monotonic
pullout tests. As mixed, the presence of fibers reduced the compressive strength of the
grout. The unreinforced grout used in the majority of these tests had an average strength
of 8.5 ksi on test day, five days after placing the grout. The fiber-reinforced grout
averaged 7.3 ksi on test day. In the tests with fiber-reinforced grout, the pullout
resistance was typically lower than in the equivalent tests with unreinforced grout.
Constitutive bond-slip relationships were developed from the results of tests with
short embedment lengths. In these tests, the slip was almost the same all along the
embedded length, so it was assumed that the local shear stress was also uniformly
distributed and equal to the average. The constitutive bond-slip relationships were
incorporated into analytical models of the pullout tests. The accuracy of these models
was confirmed by the results from the long-embedment length tests. The models were
used to determine the necessary embedment lengths to achieve various bar stresses,
including yield and fracture.
CONCLUSIONS Testing and analysis of the anchorage of large-diameter bars grouted into ducts
showed that these bars can be developed in much shorter lengths than current code
expressions suggest. In the test program, a No. 18 bar was developed to fracture with an
anchorage length of 14 bar diameters (31.5 inches). The analytical model suggests that
fracture could be achieved with a development length of 10 bar diameters. Further tests
on bars with embedment lengths between these two values, to confirm the precise
embedment length needed to achieve fracture, were not conducted. These development
lengths are much shorter than the development lengths given by the American
Association of State Highway and Transportation Officials (AASHTO) for bars
embedded in concrete.
Because the grouted bars develop in shorter lengths than bars embedded in
concrete, bar anchorage is not a barrier to implementation of the proposed precast column
and cap beam system. The depth available in typical cap beams (about 42 inches) is
much greater than the monotonic development length for No. 18 bars (about 16 inches).

xv
The cap beam is sufficiently deep to accommodate a development length with both a 50
percent increase to allow for cyclic loading and an eight-bar-diameter debonded length.
Debonding the reinforcing bars in the grouted duct may be desirable to reduce the strain
concentration in the bar at the joint.

xvi

1
CHAPTER 1: INTRODUCTION
1.1 PRECAST CONCRETE CONSTRUCTION FOR RAPID CONSTRUCTION OF BRIDGES
Typical cast-in-place (CIP) bridge construction practice requires that concrete
substructures be built on site. This practice involves a number of time-consuming on-site
activities, such as tying the reinforcement, building formwork, pouring concrete, waiting
for concrete to cure, and removing formwork. It is important to accelerate this
construction sequence because the indirect costs of time on site are high. Reducing the
time required on site improves worker safety, and decreases disruption to traffic flow,
and any reduction in the use of site-cast-concrete mitigates environmental impact
(Wacker 2005).
Previous research at the University of Washington, in coordination with the
Washington State Department of Transportation (WSDOT), contractors, and precast
concrete fabricators, developed several bridge structural systems that shorten construction
time. A summary of these systems, their strengths and weaknesses, and schematic
drawings can be found in Appendix A. These systems use precast concrete to fabricate
the columns and cap beams of the bridge substructure, just as many current designs
utilize precast girders for the superstructure. The current research effort aimed to develop
a precast concrete column-to-cap beam connection that can be used for multi-column
bent caps, as shown in Figure 1.1 with the column-to-cap beam connection region shown
enclosed in a box.
Figure 1.1: Schematic of two-column bent with moment diagram from seismic loading

2
Precast concrete connections can be particularly vulnerable to earthquakes.
Unlike building design, which follows a strong-column-weak-beam philosophy, in
typical bridge design the columns are designed to yield during an earthquake. This
inelastic action is typically concentrated at the top and bottom of the columns. In CIP
construction, this inelastic action tends to be spread over the column ends in a region
known as the plastic hinge, shown in Figure 1.2. In precast construction, the precast
elements are typically stronger and stiffer than the joints between them. Consequently,
inelastic action tends to be concentrated at the joint, and the precast elements rotate as
nearly rigid bodies.
Figure 1.2: Comparison of reinforced concrete (left) and precast (right) column-to-cap
beam joints
Two strategies have been proposed for designing precast joints at locations where
high seismic moments can be expected. First, the designer may choose to reinforce the
joint so that it is stronger than the surrounding precast elements and thus force the
inelastic action to occur in the interior of the precast elements. This approach essentially
emulates cast-in-place construction. This type of column is shown on the right in Figure
1.3. The figure also illustrates how the rotation at the joint increases with decreasing
effective length. The reduced effective length of the column in turn increases the shear
demand on the column and decreases ductility of the system.

3
Alternatively, the designer can ensure that the link between relatively rigid
elements remains ductile during the earthquake. This strategy has been used in building
design and tested in the PRESSS program (Nakaki 1999, Priestley 1999, Palmieri 1996).
Figure 1.3: Displaced columns and rotations
The precast bridge substructure systems in Appendix A are intended to provide
ductile connections between precast columns and cap beams. To meet the needs of
WSDOT, the system must provide desirable seismic behavior, be quick to construct, and
provide adequate construction tolerances.
1.2 PROPOSED PRECAST SUBSTRUCTURE SYSTEM From many possible precast substructure systems, the “big bar” system shown in
Figure 1.4 was selected for further research. The big bar system incorporates several
large-diameter bars projecting from the top of a precast column into openings formed by
metal ducts in the cap beam. In this system, the bars are then grouted into these
openings. The advantages of this system include a cap beam design that is similar to
cast-in-place (CIP) designs, larger construction tolerances than other duct-based systems,
and a simplified construction procedure during which the cap beam can be placed on the
column without a mating collar.

4
Figure 1.4: Big bar system
1.3 THE IMPORTANCE OF BOND TO THE PROPOSED SYSTEM In the proposed system, the grouted large-diameter reinforcing bars carry tensile
forces between the column and cap beam. To provide the full design strength of the
reinforcing bars, the bars must be fully developed.
Two important loading combinations impose moments on the column-to-cap
beam joint during the life of the bridge substructure that give rise to tensile stresses in the
reinforcing bars. Seismic loading is probably the most critical of these loads. This joint
is the yielding element in the structural system, and it is crucial to the performance of the
structure that the bars yield before other failure mechanisms develop.

5
A second loading combination occurs during construction. During construction,
loads are placed on the cap beam that impose moments in the columns. For example,
girders may be placed on one span before they are placed on the next span. These
moments are smaller in comparison to those imposed by seismic loads, but in this case,
the diaphragm has not yet been constructed, so only the grouted duct is available to
develop the bar.
The development of the bar is also linked to the strain concentration in precast
joints. A bar developed into a CIP cap beam will pull out slightly from the cap beam,
reducing the bar strain at the joint. In contrast, bars grouted into ducts provide excellent
bond, in which case the bar strains in precast systems are concentrated over a very short
length. There is then a risk of early bar fracture and, consequently, brittle behavior.
Also, a bar that is developed in a very short length into the cap beam complicates the
state of stress in the joint region (Sritharan 2005). One design intended to avoid a brittle
joint includes intentionally debonding the large diameter bars to reduce the strain
concentration at the joint.
In the absence of testing, the large-diameter bars must be continued to at least the
code-required development length above the column, extending well beyond the cap
beam and into the cast-in-place diaphragm. These requirements need to be reconsidered
for this new application.
1.4 THE MECHANISM OF BOND Some of the key relationships that govern the development of reinforcing bars are
discussed here.
Bond stress (τ ) is the first of these quantities. The bond stress is defined as the
force along the bar axis per unit surface area transferred between the bar and the
surrounding medium. Figure 1.5 and equations 0.1 to 0.6 show the equilibrium
relationships between embedded length (Le), bar perimeter (Π), bar stress (σ), and bond
stress (τ).

6
Figure 1.5: Equilibrium of pullout test
Equation 0.1 describes the equilibrium of forces on the differential element shown
in Figure 1.5.
( )σ σ σ τ+ ⋅ − ⋅ = ⋅Π ⋅d A A dx 0.1
Solving for the bond stress,
στ =ΠA d
dx 0.2
where A is the bar cross-sectional area.
By replacing the local bond stress, �, with the average bond stress, �avg, this
differential equation can be solved for the embedded length, le, to give following the
linear equation:
avge
ALστ =
Π 0.3
Equation 0.3 assumes that one end of the bar has no stress. A reinforcing bar is
not a cylinder, but if we assume that 2
4 bA dπ= and πΠ = ⋅ bd , then the average bond
stress can be given by Equation 0.4,
4
bavg
e
dL
στ ⋅=
⋅ 0.4

7
which can be rearranged to give Equation 0.5,
4 eavg
b
Ld
σ τ= ⋅ 0.5
and Equation 0.6.
4e b
avg
L dστ
=⋅
0.6
Equation 0.6 forms the basis for code development length equations, which
incorporate a variety of factors that influence τavg. To fully develop a bar, the stress in the
bar must reach fy. In this case, the embedment length becomes the development length,
ld.
The local bond stress, τ, in Equation 0.2 at a point along a reinforcing bar under
load is a function of the relative displacement between the bar and the surrounding
medium. This constitutive relationship has been based on the shear strain, γ, in the
medium surrounding the bar (Viwathanatepa 1979). More recent research has related the
local bond stress to the slip of the bar through the medium (Eligehausen 1983, Raynor
2000). Slip occurs along the bar-grout interface. The slip of the bar at the surface of the
grout at the loaded end is termed the front-end slip. The slip at the bar at the opposite end
of the embedded length is termed the back-end slip.
1.5 CODE DEVELOPMENT LENGTH EXPRESSIONS Both the Association of State Highway and Transportation Officials (AASHTO)
and American Concrete Institute (ACI) codes specify development lengths for bars
embedded in concrete. These equations are based on the equilibrium principles in
Equation 0.6. Neither code has addressed the development of bars grouted into ducts.
By using the properties of the high-strength grout as the concrete strength, the code
expressions result in development lengths that exceed the depth of the cap beam.
The ACI equation, with stresses in psi, is as follows:
'
340
y t e sd b
b trc
b
fl d
c Kfd
ψ ψ ψ λ⎛ ⎞⎜ ⎟⎜ ⎟= ⎜ ⎟⎛ ⎞+⎜ ⎟⎜ ⎟⎜ ⎟⎝ ⎠⎝ ⎠
0.7

8
This equation results in ld = 45 in. for a Grade 60 #18 bar embedded in 8000-psi
grout with the maximum confinement term allowed, 2.5b tr
b
c Kd
⎛ ⎞+=⎜ ⎟
⎝ ⎠. This value, given
in Chapter 12 of ACI 318, is for non-seismic loading. For seismic loading, Chapter 21 of
ACI 318 provides values only for bar sizes No. 3 through No. 11. For these bars
embedded in 8000 psi concrete, the straight bar seismic development length is 34 bar
diameters. This criterion would lead to ld = 75 in. for a No 18 bar.
AASHTO gives separate equations for the development length, depending on the
bar size. Stresses are in ksi for all AASHTO expressions. Bars smaller than #14 are
governed by Equation0.8.
'
1.25 b yd
c
A fl
f= 0.8
Equation 0.9 governs #14 bars.
'
2.7 yd
c
fl
f= 0.9
Equation 0.10 governs #18 bars.
'
3.5 yd
c
fl
f= 0.10
For a Grade 60 #18 in 8-ksi concrete, the non-seismic AASHTO development
length is 74 inches. The seismic development length is 125 percent of the nonsesmic
length, or 93 inches. These equations are intended for use with bars embedded in
concrete alone. However, previous research, discussed below, suggests that bars grouted
into ducts are developed much more quickly than bars cast into concrete.
1.6 PREVIOUS RESEARCH Although there has been a substantial amount of research into the development of
reinforcing bars in normal-weight concrete, much less research has been performed on
bars grouted into ducts. Research at the University of Washington (Raynor 2000)
showed that small-diameter bars grouted into ducts develop very high bond stresses and
can be developed to fracture in six to eight bar diameters. This research was primarily

9
conducted on #8 bars, with three tests on #10 bars. Raynor’s development length
equation for monotonic loading is shown in Equation 0.11.
'
0.5d u
b g
ld f
σ= 0.11
where σu is the ultimate steel stress and f’g is the grout compressive strength.
Other research has indicated that duct pullout through the concrete matrix can be
an important failure mechanism (Palmeri 1996, Brenes 2006). This research was
conducted with relatively large bars in smaller ducts. Because of the large diameter of
the duct required to maintain the desired construction tolerances, duct pullout is less
likely to be a factor.
The duct will pull through the concrete when the applied load exceeds the bond
capacity between the concrete and duct. This mechanism will not control when the bar
capacity is less than the duct capacity (Equation 0.12).
duct barP P≥ 0.12
These capacities are functions of the diameter of the bar and duct, shown in Equation
0.13.
duct e duct bar e barl d l dτ π τ π⋅ ⋅ ⋅ ≥ ⋅ ⋅ ⋅ 0.13
As the bar-to-duct diameter ratio decreases with increasing duct size, less demand is
placed on the duct-concrete bond. As long as the inequality in Equation 0.14 is satisfied,
the bar will pull out through the grout before the duct pulls out through the concrete.
duct bar
bar duct
dd
ττ
≥ 0.14
1.7 RESEARCH PROGRAM This research developed a novel combination of materials and applications to
develop large-diameter bars in the “big bar” precast bridge rapid construction system.
Bond relationships and development lengths for these bars grouted into ducts were
developed. The range of bar sizes tested by Raynor was extended to the largest bars
available. The bars were tested in a configuration similar to that in the intended
application.

10
This research also supports ongoing testing of the “big bar” column and cap beam
system. Because the joint cannot be tested at full scale with current lab conditions, scaled
tests of the column-to-cap beam joint are being conducted. Pullout tests of the full-scale
and scaled bars were conducted to validate the use of scaled materials in the pseudostatic
column-to-cap beam joint tests.
1.8 ORGANIZATION OF REPORT Chapter 2 describes the pullout tests performed for the experimental program.
Chapter 3 presents the results of material testing associated with the experimental
program. Chapter 4 presents the results of the pullout tests. Chapter 5 discusses findings
from these results. Chapter 6 describes analytical modeling performed in support of the
pullout tests, and Chapter 7 presents a summary and conclusions.

11
CHAPTER 2: EXPERIMENTAL PROGRAM
This chapter describes the experimental program, which consisted of a series of
17 monotonic pullout tests of reinforcing bars anchored in grout and concrete. All but
one of these tests were performed on bars grouted in steel ducts, which were cast into
blocks of concrete. The remaining test was performed on a bar cast directly into the
concrete.
2.1 OVERVIEW OF TESTING The tests conducted in this study were designed to determine the influence of the
following parameters:
• embedment length
• bar diameter
• fiber-reinforcement of the grout
• scaling.
Table 2.1 below shows the test matrix. Each test was denoted by a five-digit code
to indicate the bar size, type of test, and embedment length. Its form was xxAyy, where
xx represents the bar size, A represents an alphabetic code shown below, and yy
represents the nominal embedment length in bar diameters. Tests are broken down into
two groups: full-scale tests and scaled tests. Full-scale tests were conducted in the large-
diameter steel ducts called for in the proposed substructure system, while the scaled tests
were conducted in smaller ducts that were used in the scaled column tests.

12
Table 2.1: Test matrix
Bar size Full-scale tests Scaled tests
#18 #14 #10 #8 2 db 18N02, 18F02 3 db 18N03, 18F03 4 db 18N04, 18F04, 18S04 10N04, 10F04 6 db 18N06 10N06 8 db 18N08 14N08 10N08 08N08, 08C08 Em
bedm
ent
leng
th
14 db 18N14 N = non-fiber reinforced grout F = fiber reinforced grout
S = surface test (no fibers) C = concrete embedment
Monotonic testing was selected over cyclic testing. In research conducted on bars
embedded in concrete, monotonic tests have been found to provide a useful
approximation of the envelope curve of cyclic tests (Eligehausen 1983). In addition,
cyclic tests of these large bars would also have been difficult because of the large forces
applied, which require both high-capacity and complex connections between the
actuators and test specimen. The loading connections for a cyclic test must accommodate
some tolerances in the location and angle of the grouted bar and carry large loads
between the actuator and test specimen.
The test sequence began with the shortest embedment length tests and progressed
to greater lengths in order to find the embedment length necessary to yield or fracture a
bar. Initially, tests were performed both with fibers and without fibers at the same
development lengths, but the fiber tests were dropped from later testing when the fibers
were shown to have little beneficial effect.
For the majority of the tests, the duct was continuously cast into the concrete
beyond the grouted region, virtually eliminating the possibility of the duct slipping
through the concrete. A continuous duct also allowed for much greater flexibility in
conducting the tests because several tests were conducted in each duct. Each test used a
fresh region of the duct. In the remaining tests (18S04, 18N14, and 08N08), the bar was
embedded in a separate section of duct. A spacer separated the back end of the duct from
the rest of the specimen, and the grout filled the full duct length.

13
It would have been impractical to test the column-cap beam connections at full
scale. The joint tests were conducted at a scale factor of 2.4. Scaled ducts and bars were
used in the seismic joint tests. In support of the joint tests, two pullout tests, 08N08 and
08C08, were performed to ensure that scaling the bars and ducts was appropriate. These
tests also provide a more direct comparison with Raynor’s work because of the matching
bar size, although the duct-to-bar diameter ratio was larger for these tests.
2.2 SPECIMEN DESIGN The seventeen pullout tests were conducted in five concrete specimens. The tests
performed in each specimen are shown schematically in Figure 2.1.The test specimens
were designed to allow a relatively large number and variety of tests. This resulted in
successive tests located in the same specimen being conducted directly above each other,
approaching the top of the specimen in later tests.
Figure 2.1: Tests performed in each specimen

14
For the full-scale bar tests, four large concrete cylinders (36 in. diameter by 42 in.
tall) were cast, each with a single 8-in.-diameter duct along the axis. Three of the
specimens had continuous ducts while the fourth had a plywood spacer to separate the
duct for two tests (18S04 and 18N14). Unlike the other specimens, this specimen was
designed to be inverted to allow tests to be conducted from each end. The specimens
were reinforced lightly with #4 spiral spaced at 4 in. on center and six #3 vertical bars to
support the spiral.
The scaled (#8) bar tests were performed in a fifth, shorter cylinder (36 in.
diameter by 18 in. tall). The matching cylinder diameter allowed the same loading
equipment to be used in all the tests. This cylinder was also designed to be inverted
between the two tests. The specimen was cast with a #8 bar embedded 8 in. in concrete
for test 08C08 and with an 8-in. length of 4-in.-diameter duct for test 08N08.
Each test specimen included two recessed Dayton Superior B-16 lifting anchors
on the top surface. The two specimens that were designed to be inverted had lifting
anchors on both ends of the cylinder. In addition to providing a means to move the
specimens about the lab, these anchors were used to attach instrumentation to measure
displacement of the concrete and bar.
2.3 MATERIALS
2.3.1 Concrete The concrete used in the construction of the test specimens and test apparatus had
a target strength of 6000 psi. Because of the expected overstrength of delivered concrete,
a 5000-psi mix was ordered. Because the concrete was not typically damaged during
testing, concrete cylinders were tested intermittently.
2.3.2 Ducts Previous research on grouted bars has been conducted in unlined holes (Darwin
1993) or on bars grouted into post-tensioning (PT) ducts (Raynor 2000). PT duct is
available up to an outer diameter of 6 in. This diameter is insufficient to accommodate
the 2.25-in. nominal diameter #18 bar and the desired construction tolerances (+/- 3 in.).
For the tests on #10, #14, and #18 bars, the duct cast into the concrete test specimen was

15
an 8-in. nominal diameter corrugated steel pipe. These galvanized pipes are available in
diameters from 6 in. to 12 ft.
The corrugated metal pipes (CMP) are fabricated from a long piece of galvanized
steel, which is then helically wound to the required diameter. These ducts have the
advantage of having large surface deformations, which increase the resistance to shear
between the duct and its surrounding medium. Furthermore, the increased thickness of
the pipe in comparison to the PT duct increases the confinement of the grout, potentially
strengthening the grout and preventing radial bond cracks from propagating to the
surrounding concrete.
For the scaled-down pullout test (08N08), 4-in.-diameter PT duct created the void
into which the bar was grouted because 4-in. CMP was not available. The same PT duct
was used in the scaled column-cap beam joint connections tested for the project. Scaled
comparisons are shown in Table 2.2.
Table 2.2: Duct dimensions (all dimensions inches)
Duct Outer diameter
Inner diameter Thickness Wavelength Deformation
height 8 in. CMP 8.81 8.19 0.068 1.59 0.25
Scaled CMP 3.67 3.41 0.028 0.66 0.10
4 inch PT 3.94 3.19 0.023 0.53 0.16
2.3.3 Reinforcing Bars The bars used in these pullout tests were all A706 Grade 60 with bamboo-style
deformations, seen in Figure 2.2. Each bar was used for more than one test as long as the
bar remained elastic during the initial tests. For subsequent tests, the embedded section
of the bar was cut off to eliminate contamination from previous grout and to facilitate the
construction of the test stack. Two #8, two #10, one #14, and four #18 bars were used
during the tests.

16
Figure 2.2: Bamboo ribs on a #18 bar
Because of the high tensile capacity of the #18 bars, no separate stress-strain tests
to failure were performed, although the pullout tests themselves provided stress-strain
data. Stress-strain curves are reported in Chapter 3. Key bar geometric properties,
including relative reinforcement ratios, for each bar are also reported in Chapter 3.
2.3.4 Grout The grout used in the pullout tests was Dayton Superior Sure-Grip High
Performance Grout. The grout was mixed according to the manufacturer’s instructions to
provide a “fluid” mix. The grout was proportioned by converting the manufacturer’s
volumetric instructions to a weight ratio of 0.15 lb of water per pound of grout. Total
weights were determined by calculating the desired grout volume, including allowances
for test cubes and waste, and finding the weight of grout required. One bag of grout
weighed about 50 lb and produced about 0.5 ft3 of grout.
Mixing was performed with a handheld electric drill in a bucket. Approximately
2/3 of the water was placed in the bucket. Grout was slowly added and mixed, with
water being added intermittently to maintain a fluid mix. When all the water and grout
were in the bucket, mixing continued until the grout was smooth and even.
Grout strengths were determined by cube testing per ASTM C109. The 2-in. cube
samples were cast from each batch after the grout was mixed. The cubes were demolded
after 24 hours of curing under plastic and were placed in a fog room until tested. Each
cube was measured with calipers before testing, and the area calculated from these
measurements was used to determine the strength at the peak load.
Before the pullout specimens were grouted, four series of grout tests were
performed. Grout strengths for the preliminary mixes are reported in Figure 2.3. These

17
tests determined the desirable mix and test age for the grout. The first two batches were
prepared according to the manufacturer’s instructions for “fluid” and “flowable” mixes.
Despite containing less water, the flowable mix achieved lower early strengths, so the
fluid mix was selected for all further testing. Next, two more fluid mixes were tested at
three, four, five, seven, and nine days to determine an appropriate age for testing. With
many tests run in each specimen, the grout curing time was a significant factor in the
overall test-to-test cycle time. These tests indicated that the strength of a mix remained
stable after five days. A further increase in strength was within the scatter of the data.
From these preliminary tests, the researchers decided to test each specimen at five days,
when grout strengths were approximately 8000 psi.
0
1000
2000
3000
4000
5000
6000
7000
8000
9000
10000
0 1 2 3 4 5 6 7 8 9 10
Grout age (days)
f'g (p
si)
Flowable Mix 1Fluid Mix 1Fluid Mix 2Fluid Mix 3
Figure 2.3: Preliminary grout strengths
2.3.5 Fibers The fiber reinforcement used in the “F” series of tests was Fibermesh 150
polypropylene fiber. The fibers were dosed at 3 lb/yd3 to replicate the materials used in
previous research at the University of Washington (UW), although this is twice the

18
manufacturer’s recommended dose (Raynor 2000). The fibers were added to the mixing
bucket after the grout had been mixed to an even consistency. Mixing continued until the
fibers were evenly distributed.
2.4 TEST BAR GROUTING PROCEDURE The first step in preparing the test specimen was to grout the bar into the duct for
the appropriate length. Appropriate quantities of grout and water were proportioned by
weight and mixed. If required, fibers were also proportioned by weight and added to the
mix. The grout was placed in the specimen by means of a PVC tremie pipe. The depth
of the grout was monitored by means of a dipstick. Depending on the location and length
of the grouted region, various methods were used to ensure that the embedded bar was
centered and plumb. Typically, this was accomplished by centering the bottom of the bar
in a divot in the center of the duct before the grouting operation began and by centering
the bar at the surface of the specimen with a wooden crosshead attached to the lifting
anchors. A level was always used to establish that the bar was vertical.
2.5 LOADING APPARATUS The pullout tests were conducted by using the self-reacting test setup shown in
Figure 2.4. The test stack consisted of a specimen with its grouted bar, a concrete
reaction block, a ram, a load cell, and a bar grip.

19
Figure 2.4: Test setup
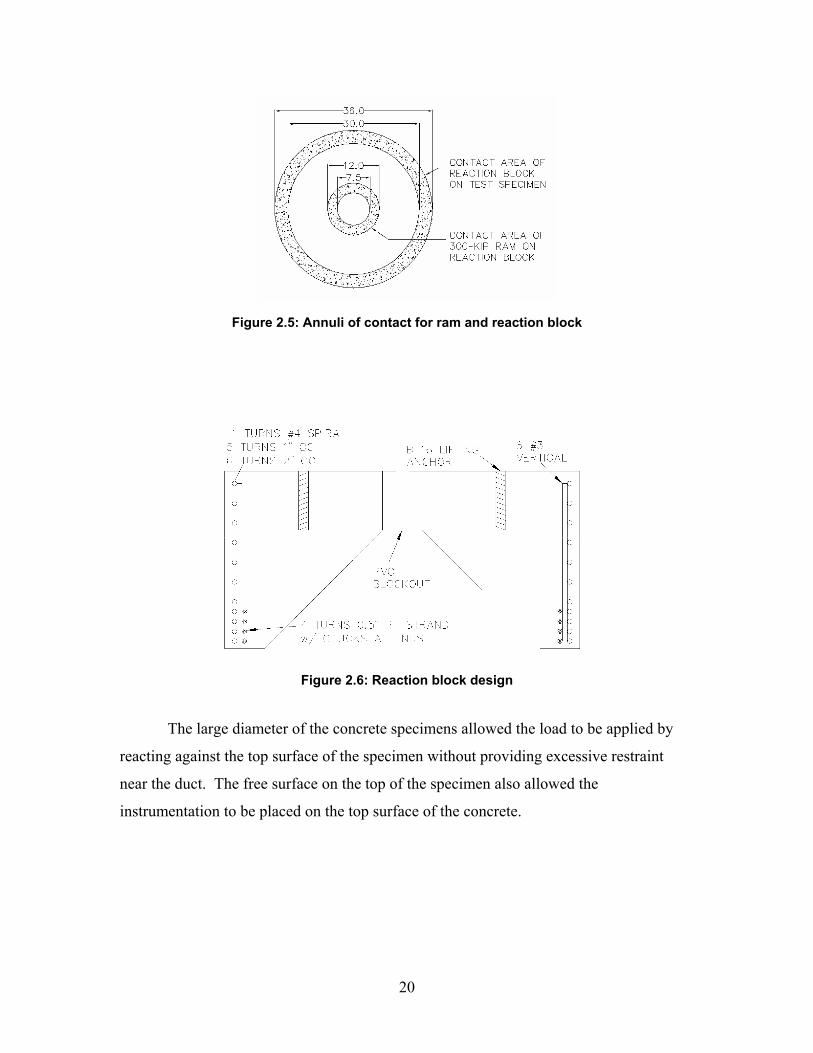
2.5.1 Reaction Block Immediately above the test specimen, a concrete reaction block filled two roles.
First, it spread the load applied by the ram from a small area to a larger annulus on the
test specimen, as shown in Figure 2.5. Second, it created a space for instrumentation to
be placed on the concrete surface and bar to measure displacements and strains during the
course of the test. This void was roughly conical, with a center hole to allow the bar to
pass through the top of the block. An opening was provided at the base for
instrumentation wires to pass from this central void to the data acquisition system.
The reaction block, shown in Figure 2.6, was designed by using strut-and-tie
concepts for a capacity of 300 kips. It performed well in tests of up to 420 kips without
substantial cracking. Reinforcement consisted of both #4 spiral and ½-inch prestressing
strand. An annular steel plate was permanently attached with hydrostone to the top
surface of the reaction block to provide a smooth surface for the ram to sit on.
20
Figure 2.5: Annuli of contact for ram and reaction block
Figure 2.6: Reaction block design
The large diameter of the concrete specimens allowed the load to be applied by
reacting against the top surface of the specimen without providing excessive restraint
near the duct. The free surface on the top of the specimen also allowed the
instrumentation to be placed on the top surface of the concrete.

21
2.5.2 Rams Loading for the tests was provided by one of two ram setups. For the majority of
the tests, a 300-kip, low-profile, double-acting center-hole ram applied the load. The ram
was capable of yielding, but not fracturing, a #18 bar. A 600-kip capacity ram was used
for the longer embedment length tests of the #18 bars (18N06, 18N08, 18N14) in order to
apply the loads needed to fracture a #18 bar. The 600-kip ram assembly, shown in Figure
2.7, was composed of three 200-kip rams acting together. A hydraulic manifold allowed
simultaneous, equal loading of the three rams. Steel plates on each face and a sliding
center-hole assembly kept the load centered and plane. Hydraulic pressure for both ram
setups was provided by an electric pump.
Figure 2.7: Triple ram used to yield and fracture #18 bars
2.5.3 Load Cell Between the rams and the grips, a center hole load cell was placed in series to
measure the applied load. The load cell is further discussed in the instrumentation
section below.
2.5.4 Grips To transfer the load from the stack to the bar, a custom-made grip topped the test
stack. The grip was patterned after wedges that had been used in smaller (#6 and #8)
reinforcing bar tests, which had been scaled up from a prestressing strand chuck. The
grip consisted of a large steel collar mated with three hardened wedges. The same collar

22
was used for the #10, #14, and #18 bar tests, with different wedges for each diameter bar.
For the #8 tests, the wedges and collar from previous UW testing were used. Although
most dimensions for the larger collar and wedges were scaled directly from the #8 grip,
the overall height of the collar and wedges was increased by 50 percent to reduce the
stresses on the sliding surface. The dimensions of the large collar and wedges are shown
in Figure 2.8. During one test on a #18 bar, one wedge cracked lengthwise. The crack
initiated on the face with the threads and propagated radially to the angled surface. This
crack was analogous to the splits between the wedges and did not affect the performance
of the grip.
Figure 2.8: Wedge grip design (dimensions in inches)
2.6 INSTRUMENTATION Load, strain, and displacement data were collected to characterize the response of
the specimen.
2.6.1 Load Cell For the #10, #14, and #18 bar tests, a 300-kip load cell was part of the test stack.
Like the collar block, the load cell was originally designed for 300 kips but performed
well up to the 420-kip maximum load applied during the test series. For the #8 bar tests,
a 200-kip load cell was used. Both load cells were calibrated against the laboratory’s
300-kip Baldwin testing machine before testing with the data acquisition system used for
the test.

23
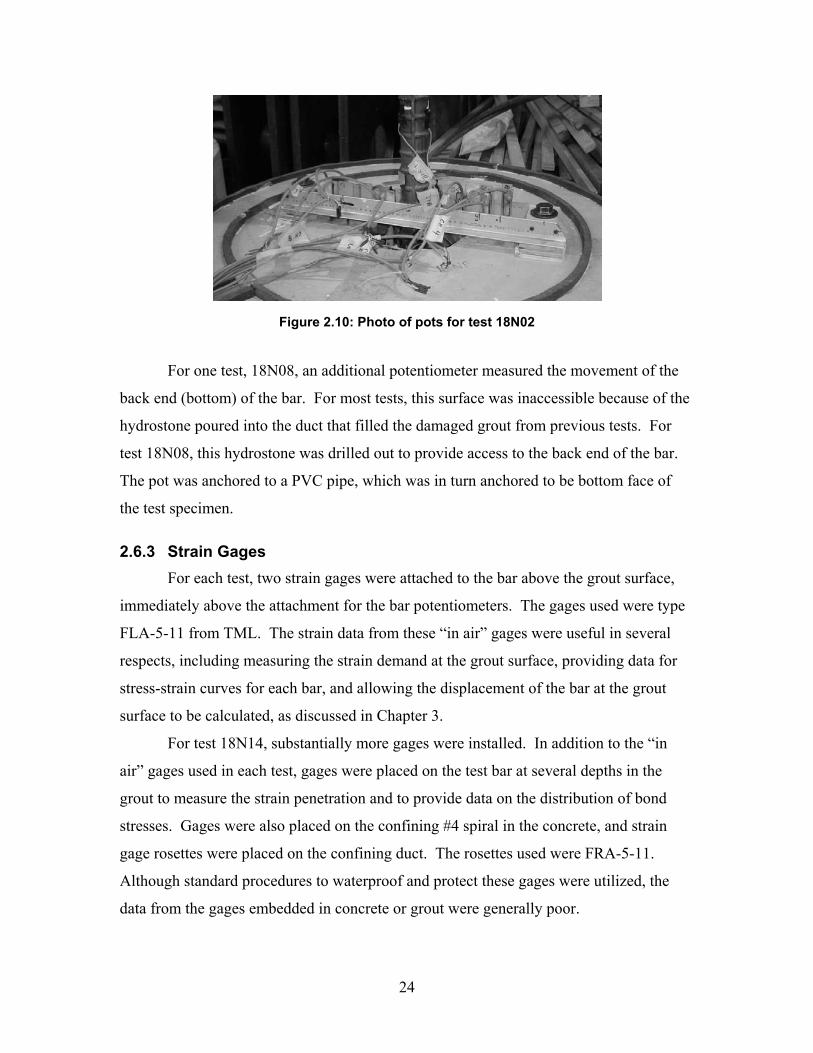
2.6.2 Linear Potentiometers During each test, an array of linear potentiometers (pots) measured the
displacements of the concrete surface, bar, and either the grout surface or duct. The
layout of pots on the bridge is shown schematically in Figure 2.9, and with a photo in
Figure 2.10. The pots had a nominal stroke of 1.5 in. and generally provided good data
for about 1.3 in. For all tests, an aluminum bridge provided the mounting surface for the
pots. This bridge was anchored to the test specimen with the lifting anchors. Four pots
measured concrete displacements 5.5 in. and 7 in. from the axis of the bar. Two pots
measured grout or duct displacements, and two measured bar displacements. The pots
labeled “Duct” in Figure 2.9 measured duct displacements for most tests. These pots
measured grout displacements on the tests that were conducted at the top surface of the
specimen.
The pots measuring the concrete and grout displacements were glued to the
aluminum bridge and touched glass slides attached to the rougher concrete or grout
surface. For duct and bar measurements, the nose of the pot touched aluminum angles
attached to the duct or bar. One limitation of this method of attachment was that in later
tests, the mill scale flaked off the bar as the bar yielded. The aluminum angles then
detached from the bar, and measurements became undependable.
Figure 2.9: Schematic of instrumentation bridge with pots
24
Figure 2.10: Photo of pots for test 18N02
For one test, 18N08, an additional potentiometer measured the movement of the
back end (bottom) of the bar. For most tests, this surface was inaccessible because of the
hydrostone poured into the duct that filled the damaged grout from previous tests. For
test 18N08, this hydrostone was drilled out to provide access to the back end of the bar.
The pot was anchored to a PVC pipe, which was in turn anchored to be bottom face of
the test specimen.
2.6.3 Strain Gages For each test, two strain gages were attached to the bar above the grout surface,
immediately above the attachment for the bar potentiometers. The gages used were type
FLA-5-11 from TML. The strain data from these “in air” gages were useful in several
respects, including measuring the strain demand at the grout surface, providing data for
stress-strain curves for each bar, and allowing the displacement of the bar at the grout
surface to be calculated, as discussed in Chapter 3.
For test 18N14, substantially more gages were installed. In addition to the “in
air” gages used in each test, gages were placed on the test bar at several depths in the
grout to measure the strain penetration and to provide data on the distribution of bond
stresses. Gages were also placed on the confining #4 spiral in the concrete, and strain
gage rosettes were placed on the confining duct. The rosettes used were FRA-5-11.
Although standard procedures to waterproof and protect these gages were utilized, the
data from the gages embedded in concrete or grout were generally poor.

25
2.7 TEST PROCEDURE Because the bars and specimens were used for several tests in a series, the test
procedure included a period of setup, the actual test, and resetting for the next test.
2.7.1 Setup After the grout had set, the centering crosshead could be removed and the
specimen prepared for testing. First, the instrumentation bridge shown in Figure 2.10
was bolted into the recessed lifting anchors. After the instrumentation was in place, the
concrete reaction block was placed on top of the specimen. Contact between the two
concrete blocks was ensured by placing a layer of hydrostone on the annulus of contact.
The lab’s overhead crane facilitated the accurate placement of the reaction block and the
test stack above it.
The remainder of the test stack (rams, load cell, and stressing collar) was then
placed and centered on the bar. The final step was to place the wedges into the stressing
collar. After this was completed, the test itself was ready to be run.
2.7.2 Pullout Test After it had been confirmed that the electronic data acquisition system was
running and recording data, pressure was applied to the ram or rams by means of an
electric pump. The loading rate, determined by modulating the running of the pump, was
approximately 0.1 in./min in the elastic range. After the bar yielded, the pump was run
constantly, and the flow capacity determined the loading rate.
Each test consisted of two phases. In the first phase, the bar was loaded to 5 ksi
and then unloaded. This procedure allowed the grips to set and confirmed that the pump
and data acquisition electronics were functioning properly. After unloading, the second
phase of the test involved running the pump as above until either the bar unloaded or the
stroke of the ram was reached. In the latter case, the ram was unloaded, steel shims were
placed between the load cell and the grips, and the ram was reloaded. Tests on bars
embedded in concrete have shown that this unload/reload cycle does not significantly
affect the envelope behavior (Eligehausen 1983). During some tests, this unload/reload
cycle had to be carried out two or three times to provide enough stroke to pull out the bar.

26
2.7.3 Post-Test Reset After each test, the grips were removed from the bar. This procedure was
sometimes difficult because the high loads gripping the bar squeezed the wedges and
collar block together. To loosen the collar from the wedges, an annular steel cylinder
was placed over the collar and hit with a sledgehammer. On one occasion, the collar was
also heated to separate the collar and wedges. After the wedges had been removed, the
test stack could be removed in reverse order (load cell, rams, reaction block). At this
point, the damage to the bar, grout, and concrete could be observed.
The test procedure consistently loosened the bar to the point where it could be
removed from the damaged grout by hand or with the overhead crane. For tests in which
the bar remained elastic, the bar was then prepared for further testing by cutting off the
section of the bar that had been embedded in the grout. This eliminated the need to clean
the grout off the embedded section bar and also kept the overall height of the fully
prepared test specimen roughly constant. This meant that the “in air” strain gages could
be reused if they were undamaged.
The concrete cylinders were used for several tests. Loose grout was removed
from the duct, and a smooth, level surface was created by pouring hydrostone into the
duct. As a result of this procedure, early tests in each specimen were deeper than the
later ones, which occurred closer to the surface. Although this changed the stress
conditions in the concrete outside the ducts, the performance of the concrete was rarely
critical to the result of the test.

27
CHAPTER 3: RESULTS OF MATERIAL TESTS Equation Chapter (Next) Section 1
This chapter presents the results of the pullout tests and supplementary material
testing. Section 3.1 describes the geometry of the reinforcing bars used in the pullout
tests, Section 3.2 describes the stress-strain relationships of the reinforcing bars, Section
3.3 reports grout strengths, and Section 3.4 reports concrete strengths.
3.1 REINFORCING BAR GEOMETRY This section describes the geometric properties of the reinforcing bars. The area,
diameter, and relative rib area of each bar are listed in Table 3.1.
Table 3.1: Bar dimensions Nominal diameter
Lug diameter
Nominal area
Average area
Net area
Relative rib area
db dl Anom Aavg Anet Rr Tests
(in.) (in.) (in.2) (in.2) (in.2) (--) 08C08 08N08 1 1.08 0.79 0.75 0.72 0.081
10N04 10F04 10N06
1.27 1.38 1.27 1.21 1.15 0.077
10N08 1.27 1.35 1.27 1.23 1.17 0.067 14N08 1.69 1.80 2.25 2.19 2.11 0.056 18N02 18N03 18N04 18N08
2.26 2.37 4.00 3.74 3.67 0.063
18F02 18F03 18F04 18N06
2.26 2.41 4.00 3.75 3.66 0.078
18N14 2.26 2.38 4.00 3.91 3.77 0.063 18S04 2.26 2.39 4.00 3.75 3.62 0.074
The nominal values of the bar area and diameter, defined by the American
Concrete Institute and the ASTM International, are the basis for design calculations.
Unless otherwise noted, these nominal quantities were used for all calculations. The
nominal area is based on the nominal weight per unit length of the bar. The cross-

28
sectional area of an equivalent smooth cylinder is calculated by dividing this nominal
weight by an assumed density of steel.
2
3
/ 121490
⎛ ⎞= ⎜ ⎟
⎝ ⎠nom
nomw ft inA lb ft
ft
3.1
The nominal diameter of the bar is the diameter of the equivalent cylinder.
4b nomd A
π= 3.2
The actual average bar area was calculated by using the actual weight of a length of the
bar and Equation 3.3.
2
3
121490
actualavg
bar
W inA lb ftLft
⎛ ⎞= ⎜ ⎟
⎝ ⎠⋅ 3.3
On average, the average area was 95.4 percent of the nominal area, ranging from
93.8 percent to 97.7 percent of the nominal value. ASTM Specification A706 specifies
that this area be at least 94 percent of the nominal area. Two bars just failed this
criterion.
The net area is the minimum area available for carrying longitudinal stresses: the
body of the bar and the longitudinal ribs. Figure 3.1 shows the locations of the
measurements of each bar. Two measurements, a and b, were taken of the diameter of
the body of the bar. The height and width of the longitudinal ribs, hr and wr, respectively,
were also measured.
Figure 3.1: Bar dimensions for net area calculations

29
The net area was calculated as follows:
2net r rA a b w hπ= ⋅ ⋅ + ⋅ ⋅ 3.4
The net area of each bar ranged from 90.5 percent to 94.2 percent of the nominal area,
with the average being 92.0 percent of the nominal area.
The perimeter of the circle described by the transverse lugs was used for some
bond calculations. This perimeter is defined by a diameter, dl, which includes the body
of the bar and the lugs. The average bond stresses calculated with this perimeter are
denoted by the subscript cyl.
Relative rib area is a quantity that relates the bearing area of the transverse ribs to
the shearing area along the surface of the bar (see Figure 3.2). The area of a rib is given
as follows (ACI 408.3 2001).
( )2r b r rA d w hπ= − 3.5
The relative rib area is then:
rr
b r
ARd sπ
= 3.6
Bars with relative rib areas of greater than 0.1 are allowed by ACI to have shorter
development lengths than other bars (ACI 408.3 2001). The relative rib areas of the bars
used in this study did not exceed this value and ranged from 0.056 to 0.081.
Figure 3.2: Bar dimenstions for relative rib area

30
3.2 REINFORCING BAR STRESS-STRAIN DATA Each pullout test provided stress-strain data from the load cell and the strain
gages. Most bars were loaded in the elastic range for more than one test. Comparing the
stress-strain curves for each test confirmed the accuracy of the data.
Each of the three bar areas was used to calculate the stress on the bar and stress-
derived quantities such as the yield strength, fy, and the elastic modulus, E. The yield
strength was calculated by using the 0.2 percent offset method. E was calculated in the
linear range of the steel. Table 3.2 shows the values of fy and E determined for each bar
from each area.
Table 3.2: Yield stresses and elastic moduli Nominal area Average area Net area
fy E fy E fy E Tests (ksi) (ksi) (ksi) (ksi) (ksi) (ksi)
08C08 08N08 62.5 23120 66.0 24370 68.7 25360
10F04
10N04
10N06
61.1 22790 64.0 24710 67.4 25960
10N08 62.0 23950 64.1 24300 67.6 25200 14N08 65.8 24990 67.7 25760 70.2 26890 18N02 18N03 18N04 18N08
65.6 24600 70.4 26620 71.6 27110
18F02 18F03 18F04 18N06
69.3 27430 74.0 29022 71.7 29750
18N14 69.3 26550 70.8 27050 73.4 27950 18S04 1 25730 1 27230 1 27940
1 Note: Bar used for test 18S04 did not yield
A net area stress-strain curve is shown in Figure 3.3, and plots for each bar are
shown in Appendix B. The net stresses provided the best agreement with the expected
value of Young’s modulus because the strain measurements were taken at a point
between lugs, where only the net area was available to resist longitudinal stress.

31
However, even more steel was removed to place the gages, further decreasing the
stiffness of the bar at the location where the strains are measured. This effect was more
pronounced for the smaller bars, where the steel removed for the gage was a larger
percentage of the overall bar area.
Figure 3.3: Net stress-strain curve
3.3 GROUT STRENGTHS Grout strength gain with time is shown in Figure 3.4. Grout cubes were tested on
the day of each pullout test and at seven days after mixing. In addition, several mixes
were tested at ages of eight to 61 days to measure long-term strength gain. The grout
strength on each test day is shown in Table 3.3 and was typically 7500 psi to 8500 psi.
Cubes tested after 28 days had an average compressive strength of 10,000 psi.

32
0
2000
4000
6000
8000
10000
12000
14000
0 10 20 30 40 50 60 70
Grout age (days)
f'g (p
si)
No fibersFibers
Figure 3.4: Test mix grout strengths
Table 3.3: Test day grout strengths
Grout age f’g Test (day) (ksi) 08C08 461 8.071 08N08 5 7.79 10F04 5 7.63 10N04 5 7.98 10N06 6 8.27 10N08 5 8.00 14N08 5 8.22 18F02 5 7.27 18F03 5 7.52 18F04 5 6.80 18N02 15 8.37 18N03 5 7.77 18N04 5 8.51 18N06 5 9.89 18N08 5 8.90 18N14 5 10.31 18S04 5 7.98
1 No grouted duct, concrete age and f’c shown

33
The presence of fibers reduced the grout cube compressive strength. The average
test day unreinforced grout strength was 8.5 ksi, whereas the average test day fiber-
reinforced grout strength was 7.3 ksi. The fiber-reinforced grout was mixed with the
same water/grout ratio but resulted in reduced early strengths. The grout cubes failed
through spalling of the side surfaces, with the remaining core area crushing. By
displacing grout, the fibers create an overall weaker cube. Because the fibers were
randomly oriented, for every fiber that reinforced a crack, another fiber was lying along
the direction of cracking, creating a weak line. The increased tensile strength merely held
the cube together after the sides of the cube had spalled off.
3.4 CONCRETE STRENGTHS The concrete strengths of the four large test specimens were tested at seven, 30,
and 91 days after the pour. Cylinders were not tested on other days because no
significant damage to the concrete was observed. At seven days, the average
compressive strength was 4040 psi. At 30 days, the compressive strength was 6220 psi.
On the test day of 18S04, the compressive strength was 7430 psi and the split-cylinder
strength was 716 psi.
The concrete strength of the smaller cylinder was tested at seven, 28, and 46 days
after the pour. At seven days, the compressive strength was 5320 psi. At 28 days, the
compressive strength was 7070 psi. At 46 days, on the test day of 08C08, the
compressive strength was 8070 psi.

34
CHAPTER 4: PULLOUT TEST RESULTS Equation Chapter (Next) Section 1
A total of 17 pullout tests were performed as part of this research. These tests can
be divided into two categories based on whether or not the bar yielded. The bar remained
elastic and failed by pull-out in all tests in which the embedded lengths were four bar
diameters or less. These tests are denoted as short-embedment tests. All tests with
embedded lengths of six bar diameters or more yielded the bar and are denoted as long-
embedment tests.
Section 4.1 discusses the peak resistances reached during each test. Section 4.2
discusses the force-displacement behavior of the tests. Section 4.3 discusses the damage
observed as a result of the tests.
4.1 PEAK RESULTS The measured embedment length and peak tensile resistance reached during each
test is listed in Table 4.1. The peak resistance is given as a load, as bar stresses
calculated with each of the three bar areas, as average bond stresses, and as normalized
average bond stresses achieved by dividing by f’g or 'gf .
Table 4.1: Peak resistances
le le/db P σnom σavg σnet τavg τavg/f’g τavg/'gf
Slip at PmaxTest
(in.) (--) (kip) (ksi) (ksi) (ksi) (ksi) (--) (ksi) (in.) 08C08 8.00 8.00 58.0 73.4 77.3 80.6 2.31 0.29 0.96 1 08N08 8.00 8.00 60.3 76.3 80.4 83.8 2.40 0.31 1.02 0.13410F04 6.31 4.97 33.1 26.1 27.4 28.8 1.31 0.17 0.92 0.09810N04 4.25 3.35 40.2 31.7 33.2 35.0 2.37 0.30 2.93 0.07410N06 7.63 6.00 88.0 69.3 72.7 76.5 2.89 0.35 1.67 0.05210N08 9.75 7.68 112.3 88.4 91.3 96.0 2.89 0.36 1.48 0.15014N08 13.13 7.75 178.7 79.4 81.6 84.7 2.56 0.31 1.14 1 18F02 4.63 2.05 37.5 9.4 10.0 10.2 1.14 0.16 0.98 0.04818F03 7.19 3.18 119.7 29.9 31.9 32.7 2.35 0.31 1.35 0.04518F04 9.38 4.15 167.0 41.8 44.5 45.6 2.51 0.37 1.34 0.14918N02 4.38 1.94 29.4 7.3 7.8 8.0 0.95 0.11 0.81 0.05218N03 6.19 2.74 142.5 35.6 38.1 38.8 3.25 0.42 2.02 0.12018N04 9.50 4.21 186.2 46.6 49.8 50.7 2.76 0.32 1.31 0.11218N06 13.81 6.12 301.0 75.3 80.3 82.2 3.07 0.31 1.21 1 18N08 18.00 7.98 358.9 89.7 96.0 98.8 2.81 0.32 1.10 0.80318N14 31.5 13.96 420.0 105.0 107.4 111.4 1.88 0.18 0.64 1 18S04 9.00 3.99 93.2 23.3 24.9 25.7 1.46 0.18 0.73 0.041
1Peak load reached after displacement readings became unreliable.

35
If τavg remained constant, the maximum bar stress achieved during a test would be
linearly related to the normalized embedment length, le/db, according to the relationship
in Equation 0.5. This assumption is implicit in the permission to reduce the development
length by a factor of (As required)/(As provided) per ACI 318 §12.2.5 or AASHTO
§5.11.2.1.3 (ACI 318-02, AASHTO LRFD 2005).
Figure 4.1 shows the peak nominal bar stress plotted against the normalized
embedment length for each test. The relationship is roughly linear for a range of
embedded lengths from three to eight bar diameters. However, the data do not tend
toward the origin at very short embedment lengths. The test at 14 bar diameters departs
from the linear relationship because of the capacity of the bar being reached.
Figure 4.1: Peak nominal bar stress vs Le/db
4.2 FORCE-DISPLACEMENT BEHAVIOR The front-end force-displacement behavior of the specimens is discussed here.
The individual force-displacement plots for all 17 tests are provided in Appendix C.
Examples of the short-embedment length tests are discussed in Section 4.2.2. Test

36
18N08, which included measurement of the back-end slip, is discussed in Section 4.2.3 as
an example of a long-embedment length test.
4.2.1 Calculation of Front-End Slip As shown in Figure 4.2, the actual front-end displacement can be calculated from
the measured displacements and strains by subtracting the extension of the bar between
the location of the displacement measurement and the surface of the grout. Equation 4.1
assumes that the strain measured by the gage is constant over the length between the pots
and the surface of the grout.
ε= ⋅air air airu L 4.1
Equation 4.2 was then used to calculate the front-end slip.
= −surface pot airu u u 4.2
Figure 4.2: Bar stretch above the grout surface
The strain gages provided a local measurement of the bar strain at a location
where the bar area was smaller than average. The gages were located between ribs of the
reinforcing bars, and some steel was removed to place the gages. The measured strain
was thus higher at this location than for the remainder of the “in air” bar, especially once
yielding began. The calculated front-end displacement was therefore only an
approximation of the actual front-end displacement.

37
4.2.2 Short-Embedment Length Tests Four force-displacement plots are shown inFigure 4.3, representative of the short-
embedment length test behavior. Test 18N02 is an example of a very short-embedment
length test. Test 18N04 represents a more typical force-displacement behavior for short-
embedment length tests. Test 18S04 displayed behavior very different than that seen in
any other test.
Figure 4.3: Short-embedment length force-displacement curves
The ascending branch of the force-displacement curves, shown in Figure 4.4,
began almost linearly. The low-load (5 ksi) cycle at the beginning of each test imposed
small permanent deformations. The largest of these deformations was 0.02 in. in test
18F02. The reloading path was identical to the unloading path. The stiffness decreased
as the peak load was approached.

38
Figure 4.4: Ascending branch of short, no fiber, #18 tests
For most of the short-embedment length tests, a relatively flat section of the force-
displacement curve was reached around the peak load. For example, test 18N04
exhibited two peaks of approximately similar magnitudes, and test 18N02 exhibited a
relatively flat plateau after the peak. This plateau typically extended from a front-end
slip of about 0.06 in. to about 0.12 in. Three short-embedment length tests reached the
peak load without a plateau, including tests 10N04, 18F02, and 18N03.
In all tests except 18S04, further displacement resulted in significantly reduced
resistance. This decreased resistance typically happened in two stages. In the first 0.1 in.
after the peak load was reached, a sharp drop in load occurred. After reaching 0.2 to 0.25
inches of displacement, the resistance to further displacement continued to drop, but less
rapidly, until the bar was completely removed from the grout.
Test 18S04 had a force-displacement relationship that differed significantly from
that observed in any other test. The peak load was much lower than in test 18N04 with
the same embedded length. After the peak load had been reached, displacements of the
bar, grout, and concrete began to increase without significant change in the load. The

39
cause of the increased displacements and lowered peak load became apparent when the
reaction block was lifted and the damage to the test specimen became visible, as
discussed in Section 4.3.
4.2.3 Long-Embedment Length Tests The force-displacement behavior of test 18N08 is shown in Figure 4.5 to illustrate
the typical force-displacement behavior of the long-embedment length tests. The test
setup for 18N08 included measurement of the back-end slip, which is shown in Figure
4.6.
Figure 4.4: Force-displacement: 18N08

40
Figure 4.6: Force-displacement to yield: 18N08
The long-embedment length tests showed larger displacements than the short-
embedment length tests, in part because of the bar yielding. The yield point was visible
as a change in displacement without significant change of load. This effect was noticed
even though an approximation of the deformation of the bar between the pots and the
grout surface had been subtracted. As the bar strain hardened, displacements and load
continued to increase until the grout or bar failed. Grout failure led to a sudden load drop
of about 200 kips and a rigid-body motion of the embedded bar of 0.25 in. This failure
was accompanied by a loud bang.
The back end of the bar began moving almost immediately in the test. At yield,
the back end had moved 0.05 in., and it had moved 0.16 in. at the peak load. The
difference between the front-end and back-end movement of the bar was the stretch of the
bar inside the grout.
4.3 DAMAGE OBSERVATIONS Damage to the grout and concrete was monitored in two ways. First,
potentiometers measured displacements of the surface movements. In tests where the

41
grout surface was even with the surface to the top specimen (18S04, 18N14, 14N08, and
08N08), displacements of the grout surface were measured. In all other tests, the
displacement of the duct at the surface of the specimen was measured. Second, damage
was visually observed after the reaction block had been removed from the test specimen.
4.3.1 Short-Embedment Length Tests No short-embedment test other than 18S04 exhibited surface movements of more
than 0.003 in. These displacements were small because the forces applied were less than
the yield forces of the embedded bars, and many of these tests were conducted deep in
the test specimen. Testing low in the specimen resulted in smaller forces being applied to
the concrete, resulting in small displacements of the duct and concrete and no cracking on
the concrete surface.
Each bar was removed with some grout still attached. Other grout remained in
the duct, either as a relatively undamaged mass or as fragments that could be removed.
The damaged fiber-reinforced grout tended to be removed as a large block attached to the
bar. Smaller cracks in the grout were held together by the fibers. In the specimens
without fiber reinforcement, these cracks left the grout in fragments.
In test 18F02, the grout removed with the bar formed the cone shown in Figure
4.7. After test 18N02, a similar cone was reconstructed from the large fragments of grout
found in the duct. The cone of grout removed with 18F02 extended from the lowest
embedded lug to the top surface of the grout at approximately a 45-degree angle. The
reconstructed cone from 18N02, shown in Figure 4.8, was somewhat shallower. The
cone may have been steeper in the specimen, since not all fragments of grout were
recovered. Both cones showed signs of radial cracking in addition to the angled failure
surface.

42
Figure 4.7: Grout cone: 18F02
Figure 4.8: Grout cone: 18N02

43
Grout cones were found after each grouted test except 18S04. The depth and
angle of the cone varied slightly among the tests but generally were between 30 and 45
degrees from horizontal. Some cones, like that in 18N04, appeared to be formed by a
single, angled crack extending from the bar to the duct. Others formed a series of cones,
with some conical cracks at very shallow angles. Grout damage of this kind is shown in
Figure 4.9.
Figure 4.9: Layered grout cone: 14N08
Below the cone, the bar pulled through the grout. In several tests, grout remained
in the interstices between transverse lugs, forming a relatively smooth cylinder, shown in
Figure 4.10. This cylinder was defined by the diameter of the lugs.

44
Figure 4.10: Grout cone and sheared grout: 18F04
This cone-and-cylinder failure surface through the grout was found in all short-
embedment length tests except 18S04. This includes the tests on #10 and #14 bars. The
size of the cone was similar for these tests, indicating that the diameter of the duct, rather
than the size of the bar, controlled the depth of the cone. The confinement that the duct
provided to the grout below the cone prevented deeper cones from forming.
4.3.2 18S04 Test 18S04 was run in a separate section of duct, which was thus freer to move
through the concrete than the ducts used for other tests. The concrete and grout surfaces
moved much more in test 18S04 than in any other test. These movements are shown in
Figure 4.11. The unique behavior is attributed to the fact that the bar was bonded in a 9-
in.-length of duct embedded in the top of the cylinder, as shown in Figure 2.1. Failure
was associated by a concrete splitting failure of the top surface of the cylinder.

45
Figure 4.11: Force-displacement: 18S04
The spiral reinforcement in the test specimen also debonded and was pulling
around the concrete cylinder, shown in Figure 4.12. This reinforcement was ineffective
at confining the concrete, and the concrete split. When the reaction block was removed,
the splitting of the top surface was observed. The grout was intact, but the duct pulled
through the split concrete.
Figure 4.12: Reinforcement: 18S04

46
This mode of failure was suppressed in many of the other specimens. Other tests
were run in ducts that were embedded in the concrete beyond the grouted embedment
length. The duct in 18S04 was embedded in the concrete for 9 in., the same as the
embedment length of the bar. This specimen was not restrained by any effective
reinforcement, leading to the splitting failure (Figure 4.13). Splitting of the concrete did
not occur in the other specimens in which the duct was embedded the same distance as
the bar, 18N14 and 08N08.
Figure 4.13: Concrete splitting: 18S04
4.3.3 Long-Embedment Length Tests In the long-embedment length tests, the forces were relatively large, but damage
to the concrete test specimen was light. Duct movement at peak load was less than 0.05
in. Concrete surface movements did not exceed 0.01 in. at the peak load. The top
surface of the concrete had some radial cracks. These tests involved higher loads and
were performed closer to the surface of the test specimens than the short-embedment
length tests. Of the long-embedment tests, the radial cracking was most extensive in test
18N14, shown in Figure 4.14

47
The damaged grout in the long-embedment tests formed grout cones in the top of
the embedment length similar to, but shallower than, those in the short-embedment length
tests. The grout cone formed during test 18N14 was the shallowest found, less than 20
degrees from horizontal. Wedges of grout about 1-in. deep were removed from the top
surface of the grout.
Tests 18N06, 18N08, 10N06, 10N08, and 14N08 ended in grout failure. Below
the grout cone, the bars sheared through the grout along a cylinder defined by the
transverse lugs, just as it did in the short-embedment length tests. Test 18N14 ended in
rupture of the bar. After the peak load of 420 kips was reached, the bar lost significant
load to necking before fracturing. The fractured bar is shown in Figure 4.14.
Figure 4.14: Fractured bar: 18N14

48
4.3.4 Scaled Tests The bar in test 08C08 was embedded directly in concrete. The failure was by
formation of a large concrete cone that extended from the bottom of the embedded bar to
the outer surface of the concrete, shown in Figure 4.15. Like some of the grout cones in
other specimens, the concrete cone was composed of more than one layer of conical
cracking.
Figure 4.15: Concrete damage: 08C08
Test 08N08 exhibited grout failure along several surfaces. In the top 2 in. nearest
to the surface, a plug of grout pulled out along the duct surface, shown in Figure 4.16.
Below this, a 30-degree cone brought the failure surface to the bar. Below the cone, the
bar pulled out along a shearing cylinder similar to that of other tests.
Figure 4.16: Grout damage: 08N08

49
The concrete surface of the test specimen was also damaged. Several radial
cracks formed in the concrete, and the concrete surface was displaced upwards in some
locations. The extent of damage was similar to that seen in 18N14.

50
CHAPTER 5: DISCUSSION OF FINDINGS
This chapter discusses the experimental results. Failure mechanisms are
discussed in Section 5.1. The effects of variable grout strength, presence of fibers, and
bar size are discussed in sections 5.2 through 5.4. The effect of yielding the reinforcing
bar is discussed in Section 5.5. The results of this research are compared to previous
research and the building codes in Section 5.6.
5.1 GROUT FAILURE MECHANISMS Two distinct failure mechanisms of the grout were shown in Figure 4.10. Near
the surface, a cone of grout formed. Below this cone, a cylinder consisting of the
reinforcing bar and grout between the lugs slid through the remaining grout in the
specimen. The difference between the two mechanisms was the result of the difference
in confinement provided by the duct and surrounding concrete. This effect has been seen
in pullout tests performed in confined concrete specimens (Viwathantepa 1979).
The confinement provided by the duct and concrete was ineffective near the grout
surface because of the mechanism that transfers load from the bar through the grout to the
duct. Before cracking, bond stresses were carried as shear stresses in the grout. When
the tensile capacity of the grout was exceeded, the grout cracked along a plane normal to
the principal tensile stress. The shear stress is inversely related to the distance from the
axis of the bar, and was thus highest next to the bar and lowest next to the duct. This
resulted in steep cracking near the bar and shallower cracking close to the duct, with a
curved surface in between.
After cracking, the axisymmetric strut-and-tie model shown in Figure 5.1
developed in the grouted region. Angled struts formed to carry the applied load, and
horizontal equilibrium was provided by the hoop stresses in the steel duct and
surrounding concrete. Close to the front end of the bar, struts would have to have been
very shallow in order to connect to the duct. These shallow struts could not carry as
much vertical load as deeper struts.

51
Figure 5.1: Struts in grout
Struts near the grout surface could not maintain horizontal equilibrium, and the
cracked grout was free to separate. This grout formed the cone that was observed at
angles from about 20 to 45 degrees in various tests. This angle was related to the overall
dimensions of the cone, since the cracked surface was usually irregular and curved as
mentioned above. The cone in test 18N14 was the shallowest observed because the full
bond capacity was not mobilized before the bar fractured.
In the confined regions of grout, the individual struts were strong. Before the
struts crushed or the ducts exceeded their capacity to confine the grout, another failure
mechanism controlled the local bond strength. This failure mechanism was the shearing
cylinder observed in tests with more than 4.5 in. of embedment length. The bar and grout
formed a relatively smooth cylinder that passed through the confined grout, which
remained in the specimen. Shear friction and aggregate interlock provided the remaining
resistance to sliding after failure.
The shear cylinder mechanism provided higher bond stresses than the cone
mechanism. In the shortest tests (18N02 and 18F02), the cone region took up nearly the
full embedded length, and no shear cylinder formed. These tests also developed much
lower than average bond stresses, as shown in Figure 5.2.

52
5.2 EFFECT OF GROUT STRENGTH The grout strength was not systematically varied among the tests in this
experimental program, but some variation was observed. The grout strength on test day
ranged from 6.8 ksi to 10.3 ksi. A relationship is presumed to exist between the grout
strength and the maximum bond stress that can be achieved. The peak average bond
stress is plotted against the grout strength in Figure 5.2.
Figure 5.2: τavg vs grout strength
Two tests, 18N14 and 18S04, did not fail by bond failure. The peak τavg values
were thus not related to the available bond capacity. In the shortest embedment length
tests (18N02 and 18F02), failure was controlled by cone mechanism, which also resulted
in low peak τavg values.
Researchers have taken the peak bond stress to be a function of concrete or grout
strength in a number of ways. Raynor and pre-1963 ACI codes assumed that the peak
bond stress varies linearly with the grout compressive strength, f’g. Other research and
current code expressions relate τavg to 'gf (Eligehausen 1983, Viwathantepa 1979,

53
Martin 2006). From Figure 5.2 it is not clear which form is more appropriate for
normalization, both because of the limited range of grout strength used and because other
factors, including the embedded length, influenced the bond stress. The following
discussion compares the scatter of the data when they were normalized by each method.
Figure 5.3 shows the peak average bond stress plotted against the embedment
length. Peak values for the majority of tests are between 2.25 and 3 ksi. The coefficient
of variation for all tests except the five with bond stresses of less than 2 ksi is 11.1
percent.
Figure 5.3: τavg vs Le
Figure 5.4 shows the peak average bond stress normalized by the grout strength
plotted against the embedment length. Here, the data cluster more closely around 0.3f’g.
Except for the same five tests listed above, the coefficient of variation is 10.9 percent.
This form of normalization makes the most sense if the failure mode is related to
crushing of the grout.

54
Figure 5.4: τavg/f’g vs le
Figure 5.5 shows the peak average bond stress normalized by the square root of
the grout strength plotted against the embedment length. Except for the same five tests
listed above, the coefficient of variation is 10.0 percent. This form of normalization
makes the most sense if the failure mechanism is related to splitting of the grout.

55
Figure 5.5: τavg/ 'gf vs le
Normalizing the peak average bond stress slightly reduced the variation among
the tests. Because the range of tested grout strengths was relatively small, it is difficult to
determine the best form of normalization for a bond model. For further calculations,
bond stresses were normalized by 'gf .
5.3 EFFECT OF FIBERS Previous research (Raynor 2000, Nakaki 1999) used fiber-reinforced grout to
grout bars and gaps between precast elements. The same type of polypropylene fibers
used by Raynor was used for the four “F” tests in this research (18F02, 18F03, 18F04,
and 10F04). Each of the fiber-reinforced tests had a corresponding non-fiber-reinforced
test (18N02, 18N03, 18N04, and 10N04).
The presence of fiber reinforcement in the grout for the pullout tests did not
provide any beneficial effect. With one exception (18N02 and 18F02), the peak loads
reached in the fiber-reinforced specimens were lower than those achieved in the non-

56
fiber-reinforced specimens. Because of the lower grout strength, normalized bond
stresses were higher than those of the corresponding unreinforced specimen in tests
18F02 and 18F04, but lower than those in tests 18F03 and 10F04.
Figure 5.6 compares the τavg-displacement behavior of tests 18N03, 18F03,
18N04, and 18F04. The normalized bond resistance is used to provide a comparison
between the different embedded lengths. The ascending branches of the bond-slip
relationships are shown in Figure 5.7.
Figure 5.6: Fiber and no fiber bond stress-displacement comparison

57
Figure 5.7: Ascending branch of bond-slip histories
The fibers had been expected to improve post-peak behavior by bridging cracks in
the grout. However, no improvement to post-peak behavior was observed. The ability
for cracked grout to hold together may be important for pads between precast elements
but does not appear to improve bond characteristics.
Note that fiber reinforcement may provide benefits during cyclic loading that did
not become apparent during the monotonic pullout tests described here.
5.4 EFFECT OF BAR SIZE AND GEOMETRY Bars from #10 to #18 were tested in the full-scale, 8-in. ducts. This research was
conducted largely to find whether large-diameter bars can develop bond stresses similar
to those of small-diameter bars. Previous research (Eligehausen 1977, Raynor 2000) has
found little evidence for a bar size effect but has been conducted over much smaller
ranges of bar size. Tests were also conducted to confirm that the ducts and bars were
scaled appropriately for the column-to-beam connection testing.

58
5.4.1 Full-Scale Tests Bond models have been presented that relate the local bond stress to a normalized
slip, s/db (Martin 2006). Normalizing the front-end displacements by the bar diameter
allows for stress-displacement behavior to be compared among bar sizes.
Figure 5.8 shows stress-normalized displacement relationships for the three tests
with embedment lengths of eight bar diameters conducted in the full-scale ducts.
Figure 5.8: Eight-db embedment length tests (Note: displacements for 14N08 became
unreliable before the peak stress was reached.)
The peak bar stress in test 14N08 was slightly lower than those in tests 18N08 or
10N08, but there is no evidence of a significant bar size effect. Tests on the #10 and #18
bars recorded sudden drops in the load not long after the peak load was reached, although
these drops occurred at different displacements. Although the displacements were
normalized by the bar diameter, the smaller bars showed stiffer ascending branch
behavior. This suggests that this normalized displacement may not capture the variation
in behavior among the range of bar sizes, although it is more accurate than the absolute
displacement.

59
Figure 5.9 shows four tests conducted with nominal embedment lengths of four
bar diameters. These tests were all conducted in the 8-in. CMP duct. The tests on the
#10 bars reached lower peak loads than the tests on the #18 bars. The absolute, as
opposed to normalized, embedment lengths were shorter for the #10 bars. Because the
unconfined region of the grout was related to the duct size, more of the embedment
length of the #10 bar lay in the unconfined region than that of the #18 bars.
Unlike the longer eight-db tests, the response of the smaller bars was less stiff than
that of the large bars (see figures 5.9 and 5.10). Like the decreased peak load, this effect
is likely related to the relatively longer section of bar that is in the unconfined, cone
region of embedment.
Variations in other geometric properties of the bar (e.g. Rr) were not
systematically varied among the tests and were not used as predictors of performance.
Figure 5.9: Four-db embedment length tests

60
Figure 5.10: Initial response of four-db embedment length tests
5.4.2 Scaling for Joint Tests Test 08N08 was a scaled version of test 18N08. The bar and duct used for 08N08
were used in the pseudostatic column-to-cap beam joint testing. The force-displacement
behavior in these two tests, expressed here as the nominal bar stress and normalized slip,
is shown in Figure 5.11.

61
Figure 5.11: Scaling comparison
The two tests had similar stiffnesses up to yield. When the bar in test 08N08
yielded, the displacement measurements showed backwards movement of the bar. This
effect was an artifact of the procedure used to convert the measured quantities to slip at
the surface of the grout, and was more pronounced in smaller bars.
Test 18N08 reached a higher bar stress than 08N08. Both bars began to strain
harden before pulling through the grout. The similarity of the response showed that this
scaling was appropriate for use in the joint tests.
5.5 EFFECT OF YIELDING When the reinforcing bar yields, two effects reduce local bond stresses. First, the
large strains associated with yielding cause deformations that increase slip of the bar.
This increased slip can locally exceed the displacement for peak bond stress, reducing the
bond. Second, plastic deformation reduces the area of the bar. At strains of
approximately 20 percent, the bar area is reduced to the extent that the lugs disengage
from the grout, destroying the bond (Raynor 2000). These two effects are independent in
principle but were strongly linked in these tests.

62
Section 5.1 introduced the idea of a shearing cylinder. If this cylinder has already
formed, the reduction in area required to reduce the aggregate interlock across the sliding
interface should be small, especially for a grout with only fine aggregate. It is difficult to
distinguish between these effects in the data. Although it is reasonable to assume that
yielding the reinforcing bar reduces bond independent of the increased slips, and tests by
Raynor showed this effect, the effect cannot be quantified from these data.
However, the peak bond stress did not appear to be negatively affected by
yielding for the specimens that failed by pullout. In fact, the peak average bond stress
reached in tests 10N08, 18N08, and 18N06, which yielded the bars, was higher than the
peak average bond stress reached in tests 18N04 and 10N04, which did not.
5.6 COMPARISON TO CODES AND PREVIOUS RESEARCH Figure 5.12 shows the peak stress from each test plotted against the normalized
embedment length. If τavg were constant among the tests, then the points would fall along
a line. The figure also shows the bar stresses implied by the ACI and AASHTO code
development length equations and by Raynor’s development length equation.
The bar stresses implied by the code equations are very low in comparison to the
values reached during the tests. This confirms the expectation that the code equations are
excessively conservative for the development of bars in grouted ducts. Many of the tests
on which the code development lengths were based were conducted on splices of bars
embedded in concrete (Orangun 1977). Such splices tend to fail through splitting of the
concrete, but in the tests described here, that mode of failure was suppressed by the duct
and large concrete specimen.
Raynor’s development-length equation is unconservative when applied to these
tests.
Within each test series, neither Raynor’s tests nor this research showed a
significant effect due to bar size. This suggests that the difference in results was due to
the test setup itself. Raynor’s tests were conducted on a section of reinforcing bar
grouted into a duct that was embedded in a concrete block. Most of the reinforcing bar
was debonded from the grout by a PVC pipe, thereby eliminating the possibility of a cone
forming. The entire bonded region could form struts through the grout to the

63
confinement provided by the concrete and duct. Some of these struts passed through
sections of the grout that were not part of the bonded length of the bar.
Figure 5.12: Stress vs le/db with predictions

64
CHAPTER 6: LINEAR AND NONLINEAR MODELING Equation Chapter (Next) Section 1Equation Chapter (Next) Section 1
In general, the bond-slip and the steel constitutive relationships are nonlinear, and
the bar bond problem cannot be solved in closed form. Simplifying these relationships to
linear conditions allowed a closed-form model to be developed. This model, presented in
Section 6.1, is applicable to the initial, linear response of the specimens, and it provides
insight into the general behavior of the specimens. The remainder of this chapter
discusses a nonlinear finite element model that can be used to analyze the behavior of the
specimens beyond the initial, linear region.
6.1 LINEAR MODEL The closed-form model presented here was developed by Raynor (Raynor 2000).
6.1.1 Model Form The closed-form model assumes linear bond-slip and steel stress-strain responses.
That is,
( ) ( )x k u xτ = ⋅ 6.1
and
( ) ( )x E u xσ ′= ⋅ 6.2
Equilibrium requires
( )dA xdxσ τ= Π ⋅ 6.3
where A is the cross-sectional area of the bar and Π is its perimeter.
By combining equations 6.1 through 6.3, one obtains the following differential
equation,
[ ]( ) ( )dA E u x k u xdx
′⋅ ⋅ = Π ⋅ ⋅ 6.4
For these equations, x is measured from 0 at the front end of the bar to Le at the
back end of the bar. The boundary conditions are
( ) ( ) 0e eL E u Lσ ′= ⋅ = 6.5
and

65
(0) (0) oE uσ σ′= ⋅ = 6.6
Solving the differential equation, the slip at any location in the embedded length
is given by Equation 6.7,
cosh ( )( )sinh
σ λλ λ
−= o e
e
L xu xE L
6.7
where λ is given by Equation 6.8, Le is the embedded length of the bar, x is the distance
from the front end of the bar, and λ is given by
λ Π=
kEA
6.8
The tension stiffness of the bar relative to the shear stiffness of the interface grout,
expressed by the dimensionless term λLe, is important to the overall behavior of the
model. The slip distribution will vary from nearly linear to highly nonlinear as the value
of λLe increases. A comparison of the slip distributions for three values of λLe is shown
in Figure 6.1.
For large values of λLe, (i.e., the grout is stiff in comparison to the bar), the bond
and slip distributions in the embedded length are highly nonlinear. For small values of
λLe (i.e., the bar is stiff in comparison to the grout), the bond stress and slip distributions
are nearly constant, and the bar stress and strain distributions are nearly linear throughout
the embedded length.
The linear slip equations can be used to calculate to a parameter, β, which
represents the fraction of the front-end slip that results from rigid-body motion of the bar.
The remainder of the front-end slip results from deformation of the embedded bar. This
slip fraction calculated by Equation 6.9 is only accurate when the bar and grout respond
linearly. Nonetheless, the following equation provides a simple parameter for evaluating
the response of a specimen.
( ) 1(0) cosh
βλ
= =e
u Lu L
6.9

66
Figure 6.1: Slip distributions for varying λLe values
6.1.2 Model Calibration Most of the terms in Raynor’s linear equations are easily determined from the bar
properties, but the bond stiffness, k, must be determined from experimental evidence.
The average bond-slip response was nearly linear for most specimens until near
the peak load. Two points on the bond-slip plot were selected, and the stiffness between
these points was calculated, as shown in Figure 6.2.
(0)avgK
uτΔ
=Δ
6.10

67
Figure 6.2: Bond stiffness calculation
The average bond stiffness, K, was calculated for the response between 0.5 ksi
and 1.5 ksi, except for 18N02 and 18F02, which were calculated in the range of 0.5 ksi
to 1.0 ksi. Bond stiffnesses ranged from about 20 ksi/in. for the shortest embedment
length tests to about 75 ksi/in. for specimen 18F04. The average bond stiffness for each
of the #18 tests is shown in Table 6.1.
The local bond stiffness can be calculated from the average bond stiffness. The
average bond stress is given by
oavg
e
AL
στ =Π
6.11
and the front-end slip is given by
( )( )
cosh(0)
sinheo
e
Lu
E Lλσ
λ λ= ⋅ 6.12
These equations can be combined to give
( )tanh e
e
LK k
Lλ
λ= 6.13

68
This equation can be solved to find the local bond stress, k. The calculated values are
shown in Table 6.1 and Figure 6.3
Table 6.1: Average and local bond stiffness
Test K (ksi/in.)
k (ksi/in.)
18F02 24.0 24.318F03 62.0 66.818F04 66.2 76.018N02 21.0 21.218N03 56.5 59.418N04 57.8 65.418N06 53.4 68.318N08 27.1 33.518N14 17.5 27.118S04 45.3 49.3
0.00
10.00
20.00
30.00
40.00
50.00
60.00
70.00
80.00
0 5 10 15 20 25 30 35
Le (in.)
k (k
si/in
.)
Figure 6.3: Local bond stiffnesses
The bond stiffness of very short-embedment length tests was low because the
unconfined region appears to have been less stiff than the confined region, probably
because of micro-cracks in the grout. The longest two tests also had much lower bond
stiffnesses. While the length of the test should have been accounted for in the conversion
from the average stiffness (K) to the calculated local stiffness (k), the low stiffnesses for
these two tests may have been due to nonlinearities not expressed in the linear model.

69
From the remaining tests, the bond stiffness of a #18 bar was taken as 65 ksi/in.
The bond models discussed below assumed that the bond stiffness is linearly related to
the bar diameter. Because the perimeter is also linearly related to the bar diameter, the λ
value for any size bar is the same.
Table 6.2 gives the λ, λLe, and β values for each of the tested specimens, given the
assumed bond stiffness of 65 ksi/in.
Table 6.2: Bond stiffnesses and slip fractions Test λ (1/in.) λLe β
08C08 0.063 0.50 0.89 08N08 0.063 0.50 0.89 10F04 0.063 0.40 0.93 10N04 0.063 0.27 0.97 10N06 0.063 0.48 0.89 10N08 0.063 0.61 0.84 14N08 0.063 0.83 0.73 18F02 0.063 0.29 0.96 18F03 0.063 0.45 0.91 18F04 0.063 0.59 0.85 18N02 0.063 0.28 0.96 18N03 0.063 0.39 0.93 18N04 0.063 0.60 0.84 18N06 0.063 0.87 0.71 18N08 0.063 1.13 0.58 18N14 0.063 1.99 0.27 18S04 0.063 0.57 0.86
The linear model predicted that even the longer embedment length tests would
have relatively large β values, implying that the slip and the bond stress were relatively
constant along the embedded length. For example, specimen 18N08 had a β of 58
percent. The back-end slip can be estimated by multiplying the calculated slip fraction
by the front-end slip. For test 18N08, this calculated back-end slip, based on a bond
stiffness of 65 ksi/in., was compared with the measured back-end slip in Figure 6.4.

70
Figure 6.4: Back-end slip for test 18N08
The predicted slip at any given stress was somewhat higher than measured,
suggesting that the grout was stiffer than 65 ksi/in. The close agreement of the back-end
slip in the elastic range suggests that the bond stiffness value is appropriate for use in
specimens with long embedment lengths. However, after yield, the predicted back slips
become much too high, since the stiffness of the bar decreases relative to the grout
stiffness, increasing the fraction of the slip due to bar deformation and reducing the
fraction due to rigid body motion. Note that while this procedure accurately predicts the
ratio between the measured front-end and back-end slips, it is less accurate at predicting
the absolute values of these quantities.
6.2 NONLINEAR BOND MODEL Nonlinear bond-slip constitutive models for both the unconfined and confined
regions of the embedment length were developed for use in the numerical modeling of
the system.

71
6.2.1 Key Variables Several variables and system properties interact to determine the local bond stress
at a point on the bar. System properties that may affect the bond stress include grout
strength and bar geometry. Possible variables that can change along the length of the bar
include slip and bar strain.
As noted in Section 5.4, variations in geometric properties, such as bar size and
relative rib area, did not affect the test results sufficiently to determine a specific
relationship between these quantities and the local bond stress. Although the grout
strength did not vary significantly among the tests, the unconfined and confined bond
models were normalized by the square root of the grout strength in ksi.
As discussed in Section 5.5, the effect of yielding independent of the increased
slip could not be determined. The local bar strain was therefore not included in the bond
model. The remaining local variable was slip. The average bond stress and the slip at the
center of the bonded region were used to develop the bond model, as further discussed
below. Slips were normalized by the bar diameter, as done explicitly by some
researchers (Martin 2006) and implicitly by others (Eligehausen 1983).
The form of the bond models is then:
'( ) gb
slipx f fd
τ⎛ ⎞
= ⋅⎜ ⎟⎝ ⎠
6.14
6.2.2 Unconfined Model The bond-slip model for the unconfined region was taken from the response of
test 18N02, shown in Figure 6.5. Nearly the full embedded length in test 18N02 was
within the 45-degree unconfined region. The remaining length was smooth steel without
lugs and so did not form the grout-and-bar shearing cylinder that was characteristic of the
confined region.
The slip for the model was taken as the slip at the center of the embedded length.
This slip was calculated by assuming a linear strain distribution in the embedded length.
The strain was known at the front end from the strain gages and was zero at the back end.
The strain at the center of the bar could be estimated with Equation 6.15:
2
cone surfacemid surface unconfinedu u L
ε ε+= − 6.15

72
where
unconfinedcone surface
PEA
ε ε= − 6.16
Figure 6.5: Unconfined bond model
The piecewise linear function that defines this bond model is given in Appendix
D. The model is shown in comparison to test 18N02 in Figure 6.7.
The constitutive model differs from the measured values in that the model has
been smoothed near the peak load, and the bond stress at large slips has been set to zero.
6.2.3 Confined Model Determining the bond-slip relationship for the confined region was complicated
by the fact that no test included only a confined region. Instead, the embedded length and
measured force had to be reduced by the length and force accounted for by the
unconfined region.
( )τ−
=Π −
unconfinedconfined
e unconfined
P PL L
6.17

73
The length of the unconfined region was assumed to be defined by a cone
extending from the duct to the bar, as shown in Figure 5.1. The unconfined length was
given by Equation 6.18.
( ) tan( )2
duct bunconfined
d dL θ
−= 6.18
The location of the lugs strongly influenced the cone angle in any particular test,
and 45 degrees was chosen as a rough average of the observed cone angle. More
accurate analysis of the cone length was not warranted because of the inherent variability
of cracking among and within the test specimens.
The force accounted for by the unconfined region was taken as the force on
specimen 18N02 at the same slip. By subtracting this force, only the force resisted by the
confined region was counted for calculating the confined bond stress.
18N02( ) ( )unconfinedP u P u= 6..19
Just as the slip at the center of the embedded length was used for the unconfined
model, the slip at the center of the confined region was calculated for use in the confined
bond model. The assumed strain and slip distributions are shown in Figure 6.6.
Although the strain distribution through the cone was unknown, a bar force at the base of
the cone was calculated as above. This bar force was converted to a bar strain, and a
linear strain profile was assumed through the unconfined region. From this strain at the
base of the cone, a second linear strain profile was assumed to exist through the confined
region. The modified slip is given by Equation 6.20.
( ) ( )32 8
air coneconfined surface unconfined cone e unconfinedu u L L L
ε εε
+= − − − 6.20

74
Figure 6.6: Assumed strain and slip distributions
The confined bond model, shown in Figure 6.7, was based on the response of
specimen 18N04. This specimen had several desirable characteristics: elastic steel
response, relatively long confined region, and unreinforced grout. The model is
represented as a piecewise function given in Appendix D.

75
Figure 6.7: Confined bond model
6.2.4 Comparison to Other Bond Models Figure 6.8 compares the bond model developed here with bond models developed
by other researchers. Each model is shown for a #18 bar in 8-ksi grout to allow
comparison of models with different forms. The overall shape is similar to the bond
model presented by Eligehausen for bars embedded in concrete, although the stresses
obtained are higher (Eligehausen 1983). The proposed bond models do not reach the
very high stresses achieved by Raynor’s model, which was developed for #8 bars in high-
strength grout (Raynor 2000).

76
Figure 6.8: Bond model comparison
In Figure 6.8, Eligehausen’s model has been extrapolated from his original model,
on the basis of #8 bars in 4350-psi concrete, to the larger bar size and stronger
compressive strengths utilized in this series of tests. The increase in bar size increases
the slip values by 30 percent, the maximum suggested by Eligehausen, and the increase in
grout strength increases the bond stress values as 'gf (Eligehausen 1983).
6.3 NONLINEAR ANALYSIS METHOD A finite element analysis was needed to simulate the response of a test specimen.
The model consists of a series of nonlinear 1-D bar elements attached to nonlinear bond
springs, as shown in Figure 6.9. The bond springs in the confined region were defined by
the nonlinear confined bond-slip model in Figure 6.7, and the bond springs in the
unconfined region were defined by the nonlinear unconfined bond-slip model in Figure
6.5.
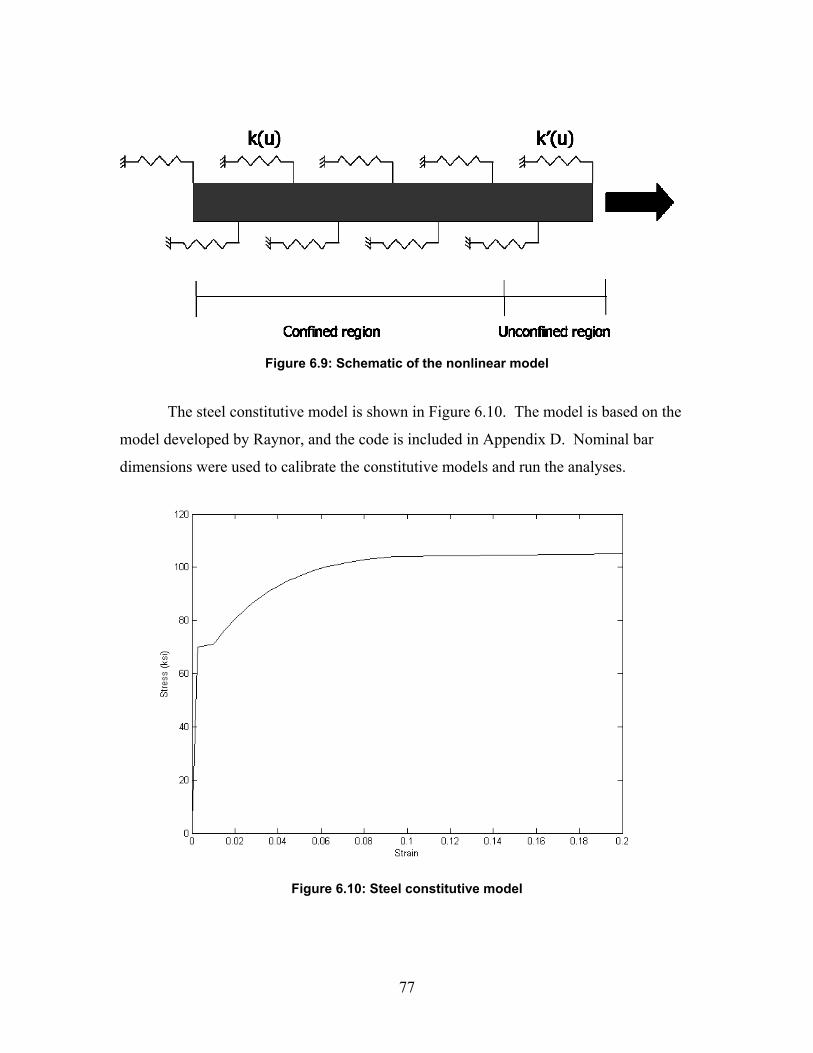
77
Figure 6.9: Schematic of the nonlinear model
The steel constitutive model is shown in Figure 6.10. The model is based on the
model developed by Raynor, and the code is included in Appendix D. Nominal bar
dimensions were used to calibrate the constitutive models and run the analyses.
Figure 6.10: Steel constitutive model

78
The chain configuration allows for a special method of solution to be used for the
analysis. For any given back-end slip, the bond stresses, bar stresses, and bar strains can
be calculated by working forward. This will result in a force at the front end of the bar,
as well as distributions of stresses and strains along the bar. By incrementing the back-
end slip, the full force-displacement curve can be computed. Specific loads can be taken
from this curve by interpolation or can be computed by iteration.
Taking the back-end slip as the incremented variable greatly simplifies the
solution procedure. With the back-end slip assumed, the stress, strain, and slip of the bar
are known at this location. Given these quantities, the bond stress over the next element
can be calculated from the bond model. Next, the bar stress in the element is calculated
from equilibrium. From the bar stress, the bar strain is calculated by using a one-sided
cyclic steel model. The bar strain is then used to calculate the slip at the next node. This
procedure progresses until the surface of the grout is reached, and the front-end slip and
stress are calculated. The code for this procedure is given in Appendix D.
6.4 RESULTS OF THE NONLINEAR MODEL The nonlinear model was be used to estimate the peak load for each specimen and
to simulate the force-displacement behavior of each specimen. Results for both estimates
are provided below.
6.4.1 Peak Loads by Test Figure 6.11 compares the peak load, expressed as a nominal bar stress, predicted
by the model with the peak bar stress achieved in the test. The 1:1 line is shown for
reference. Values to the right of this line were overpredicted by the model, values to the
left were underpredicted.

79
Figure 6.11: Peak loads from FEM and experiments
Overall, the model accurately predicted the bar stresses reached during the test.
The root mean squared error of the peak load for all tests was 8.8 ksi, or 13 percent of the
yield strength. This value does not include tests 18S04 and 08C08. These tests failed by
concrete splitting, which was not included in the model. The root mean squared error of
the peak load for the #18 tests was 5.2 ksi, or 7.4 percent of the yield strength.
The predicted peak values for the shortest tests, 18N02 and 18F02, were
overpredicted even though the unconfined model was determined directly from test
18N02. This anomaly resulted from the configuration of the lugs in the actual tests. In
each test, a section of the embedded bar below the cone did not have any lugs. This
section without lugs was unlikely to develop significant stress in the actual test.
However, because the location of the lugs was not included in the model, the model
assigned bond stresses from the confined model to the section.
The model underestimated the maximum stress for most of the tests on #10 bars.
In contrast, test 10F04 was overpredicted; the peak average bond stress reached during
the test was lower than typical, which suggests that the test result was unusual. The

80
prediction for the single test on a #14 bar was slightly larger than the test value. The
evidence for a bar size effect on the bond model is thus mixed. Further testing may be
needed to determine the effect, if any, of bar size on local bond stress.
6.4.2 Force-Displacement Behavior Simulating the force-displacement behavior of the test specimens was more
challenging than simulating the peak load alone. The short-embedment length tests
resulted in a predicted force-displacement curve that mimicked the bond model itself.
Very long embedment lengths, including test 18N14, primarily depended on the steel
model. More interesting results came from simulating the moderately long-embedment
length tests. The estimated stress-displacement curve for specimen 18N06 is shown
along with the test result in Figure 6.12. Comparisons for each test are shown in
Appendix E.
Figure 6.12: Test and FEM force-displacement comparison

81
In Figure 6.12, the initial stiffness of the model and test agree well, but the test
produced an increase in displacement before yield that is not shown in the model. The
peak force is well predicted, although the displacement measurements for test 18N06
became unreliable before the peak load was reached.
6.4.3 Bond Stress Distribution For each test, the bond stress distribution at the peak load was computed by using
the nonlinear model. For the short-embedment length tests, the bond stress is uniform
through the confined region at the peak load. The entire length of the confined region
was on the plateau of maximum bond stress. For the longer embedment length tests,
other distributions formed. The bond stress distributions at the peak load for tests 18N04,
18N08 and 18N14 are shown in Figure 6.13. The location axis runs from the front end of
the bar at zero to the back end of the bar at 9, 18 and 31.5 in., respectively.
Figure 6.13: Bond stress distributions

82
In Figure 6.13, the difference between the confined and unconfined bond models
is apparent in the sharp drop in bond stress around 3 inches of depth. In reality, this
difference in bond stress does not occur discretely but is related to the location relative to
the grout surface, the imposed slip, and bond demand. This complex relationship was not
included in the nonlinear model.
The model showed that in test 18N08 much of the bond stress at the peak load,
which reached a bar stress of about 90 ksi in the test and the model, came from the back
end of the bar. To develop these high bond stresses, the back end of the bar must
experience slips large enough to bring the back end of the bar nearly to the plateau of
maximum bond stress.
At the peak load in test 18N14, the back end of the bar moved less, resulting in
lower bond stresses at the back end of the bar. From there, the bond stress increased to a
peak at a point near the midpoint of the embedded length. After this peak, the increase in
bar slip caused the bond stress to decrease. This process continued until the front end of
the bar had moved so far through the grout that it provided little bond resistance.
The slip distributions at the peak load for tests 18N04, 18N08, and 18N14 are
shown in Figure 6.14. Again, this plot shows that the slips for the short-embedment
length tests did not vary greatly along the length of the bar, so that the bond stress was
relatively uniform along the length. The longer embedment lengths have back-end slips
on the ascending branch of the bond model, with front-end slips that have passed the peak
of the bond model.

83
Figure 6.14: Slip distributions
6.4.4 Development Length The FEM code was also run with the nominal bar geometry of a #18 and grout
strengths of 8 ksi in order to predict the necessary embedment length for bar yield and bar
fracture. The yield stress of the reinforcing bar for these analyses was assumed to be 70
ksi, representing the typical overstrength of the tested reinforcing bars. The results from
this analysis are plotted in Figure 6.15. The model was implemented for embedment
lengths that include an unconfined region, shown by the solid line, and for embedded bars
that are entirely in the confined region, shown by the dashed line. The test results are
also shown for comparison.

84
Figure 6.15: FEM development length predictions
The solid line represents the relationship between embedded length and peak bar
stress when the embedded region contains an unconfined region similar in length to the
cones observed in the tests. This assumes that the bar and duct size are similar to those
tested here; that is #18 bars in 8-in.-diameter ducts.
For embedded lengths that include the weaker unconfined region, the model
suggests that for a #18 bar in 8-ksi grout, the nominal yield stress (60 ksi) can be
achieved in 5.5 bar diameters and fracture (105 ksi) in 10 bar diameters. While only
valid for monotonic loading, these lengths are significantly shorter than the current
development lengths given by the ACI and AASHTO codes.
The ACI code expressions are based on developing a bar stress of 125 percent of
nominal yield, 75 ksi. The code appears to ensure this by finding the development length
for 60 ksi and multiplying this length by 125 percent (Orangun 1977, Jirsa 1979). This
method works well if the relationship between embedment length and peak stress is
linear. The test results and FEM modeling appear to confirm that this relationship is
nearly linear in this range, although this finding may be a result of the yield stress of the

85
tested bars being between 65 and 70 ksi. The model and tests show that a stress of 75 ksi
can be developed in 7 bar diameters. This length includes the 45-degree unconfined
region.
The dashed line would be applicable to situations without an unconfined region.
An implementation that avoids the development of a cone would have a shorter
development length, as the remaining bonded length would be surrounded by confined
grout. This can be achieved by intentionally debonding the bar near the joint interface of
a column-to-cap-beam connection, in the region that would otherwise be unconfined.
Because structural performance benefits could potentially result from debonding the bar
in this region, this may be advantageous. For these types of embedment, a bar stress of
75 ksi can be achieved in 6 bar diameters.
The development lengths discussed here are for static loading. Cyclic tests were
not carried out because of the difficulty of cyclically loading the large bars. For smaller
bars, Raynor suggested that the cyclic development length is 40 percent longer than the
monotonic development length. Increasing the development lengths for the large bars by
50 percent for cyclic loading should be conservative. The ACI and AASHTO codes
currently increase monotonic development lengths by 25 percent to account for cyclic
loading.

86
CHAPTER 7: CONCLUSIONS
7.1 SUMMARY This research program consisted of experimental tests and analyses of the
anchorage of large-diameter reinforcing bars grouted into steel ducts. These tests were
conducted to support the development of a new precast column and beam system. This
system was developed to accelerate the construction of bridge bents for seismically active
regions. In this system, a small number of large bars project from the top of the column
into large ducts cast into the cap beam. The bars are then grouted in the ducts to provide
continuity. These large-diameter ducts, formed with 8-in. corrugated steel pipe, allow the
proposed system to be constructed easily in the field.
The experimental program consisted of 17 monotonic pullout tests on bars
ranging in size from #8 to #18 and with embedment lengths ranging from 2 bar diameters
to 14 bar diameters. Both fiber-reinforced and unreinforced grouts were tested. The tests
on #8 bars were conducted in scaled ducts in support of the scaled testing of the proposed
column and beam joint.
Fourteen of the seventeen tests resulted in bar pullout through the grout. Near the
surface of the grout, a cone pulled out. Over the remaining embedded length, a cylinder
of bar and grout between the lugs of the bar pulled through the remaining grout. This
shearing cylinder provided greater bond resistance per unit area than the unconfined cone
region. Two tests (18S04 and 08C08) resulted in concrete splitting failures, and one test
(18N14) resulted in bar fracture.
Constitutive bond-slip relationships were developed from the results of tests with
short embedment lengths. The long embedment length tests proved the bars could be
developed to yield and fracture with embedded lengths much shorter than current codes
suggest.
The constitutive bond-slip relationships were incorporated into analytical models
of the pullout tests. The accuracy of these models was confirmed by the results from the
long-embedment length tests. The models were used to determine the necessary
embedment lengths according to the criteria that were used to develop the current ACI
code equations.

87
7.2 CONCLUSIONS This study supports the following conclusions regarding the necessary anchorage
length for bars in grouted ducts:
• Reinforcing bars up to #18 grouted into ducts can be developed to yield in 6 bar
diameters and to fracture in 14 bar diameters. These lengths are shorter than the
depth available in typical cap beams. Therefore, the use of large bars for grouted
connections is possible.
• There was no clear relationship between bar size and peak bond stress.
• The scaled pullout tests, conducted by using the materials selected for the bars
and ducts in the scaled column-to-beam tests, produced strengths and stiffnesses
similar to those of the equivalent full-scale tests.
• The nonlinear model accurately predicted the peak resistance of the monotonic
pullout tests. The root mean square error in the predicted bar tensile stress for all
tests that resulted in bar pullout was 8.8 ksi. For the tests on #18 bars, the root
mean square error was 5.2 ksi.
• Modeling showed that the #18 bars could have been developed to yield in 5.5 bar
diameters and to fracture in 10 bar diameters. These models included the weaker
unconfined region as part of the development length.
• Current code expressions require that a bar be loaded to 125 percent of its
nominal yield stress to be considered anchored. Modeling showed that the #18
bars could be developed to 125 percent of the nominal yield stress (75 ksi) in 7
bar diameters for embedment lengths that include an unconfined region.
• The linear and nonlinear models showed that reinforcing bars developed to yield
may move significantly over the entire embedded length. For example, modeling
showed that about three-quarters of the slip at the live end of a bar embedded 6db
in grout comes from rigid-body motion of the bar.
• High compressive strengths can be obtained from commercially available grouts
at early ages. Compressive strengths of about 8 ksi were consistently reached at 5
days. The peak bond stress was not clearly related to the grout compressive
stress.

88
• Peak bond stresses of 1.3 'gf ksi (41 '
gf psi) were achieved in the short-
embedment length tests.
• The presence of fibers did not improve monotonic pullout resistance and
decreased the compressive strength of the grout.
7.3 IMPLEMENTATION RECOMMENDATIONS The results of this study can be applied to the implementation of the proposed
precast column and cap beam system.
• The depth available in typical cap beams is much greater than the monotonic
development length for #18 bars (42 in. in comparison to about 16 in.). The cap
beam is sufficiently deep to accommodate a development length with a 50 percent
increase for cyclic loading and an 8-bar-diameter debonded length. Debonding the
reinforcing bars in the grouted duct may be beneficial because of the reduction of
the strain concentration at the joint.
• The results of this study are applicable to grout strengths of at least 8 ksi. The
peak bond stress was not very sensitive to the grout strength, and grout strengths
from 6.5 to 8 ksi are probably acceptable.
• All tests were conducted in 8-in. corrugated steel pipes that provided confinement
for the grout. The large deformations and large diameter increased resistance to
duct pullout. Other ducts may need to be investigated for duct pullout. Duct
pullout was studied in only three tests, and did not include group effects.
7.4 SUGGESTIONS FOR FURTHER RESEARCH This research could be extended by studying the following areas:
• Cyclic loading. While the loading connections necessary for cyclic tests are
complex, the suggested increase from the monotonic to the cyclic development
length may be overly conservative.
• Early grout strengths. Very young (1 and 2 day) grout was not tested for
compressive strength or bond strength. These strengths are certainly lower than
the tested values but are critical for determining the minimum time between the
grouting operation and subsequent construction operation.

89
REFERENCES
AASHTO (2005). “LRFD Bridge Design Specifications,” 4th ed., American Association of State Highway and Transportation Officials, Washington, DC.
ACI Committee 318 (2005). “Building Code Requirements for Structural Concrete (ACI
318-05) and Commentary (ACI 318R-05),” American Concrete Institute, Farmington Hills, MI
ACI Committee 408 (2001). “Splice and Development Length of High Relative Rib Area
Reinforcing Bars in Tension (408.3-01) and Commentary (408.3R-01),” American Concrete Institute, Farmington Hills, MI
Brenes, F., Wood, S., and Kreger, M. (2006). “Anchorage Requirements for Grouted
Vertical-Duct Connectors in Precast Bent Cap Systems: A Summary,” Center For Transportation Research, Project Summary Report 0-4176, Austin, TX
Darwin, D., and Salamizavaregh, S. (1993). “Bond Strength of Grouted Reinforcing
Bars,” Structural Engineering and Engineering Materails Report no. SM 32, University of Kansas Center for Research, Inc., Lawrence, KS
Eligehausen, R., Popov, E., and Bertero, V. (1983). “Local Bond Stress-Slip
Relationships of Deformed Bars Under Generalized Excitations,” Earthquake Engineering Research Center, Report UCB/EERC-83/23, University of California, Berkeley, CA
Jirsa, J., Lutz, L., and Gergely, P. (1979). “Rationale for Suggested Development, Splice,
and Standard Hook Provisions for Deformed Bars in Tension,” Concrete International, July 1979, p 47-61
Martin, J. (2006). “An Experimental Investigation of Bond in Reinforced Concrete,”
Master’s thesis, University of Washington, Seattle, WA Nakaki, S., Stanton, J., Sritharan, S. (1999). “Overview of the PRESSS five-story precast
test building,” PCI Journal, v 44 n2, Mar-Apr 1999, p 26-39 Orangun, C., Jirsa, J., and Breen, J. (1977). “A Reevaluation of Test Data on
Development Length and Splices,” ACI Journal, V. 74 n. 3, p 114-122 Palmieri, L., Saqan, E., French, C., and Kreger, M. (1996). “Ductile Connections for
Precast Concrete Frame Systems,” Mete A. Sozen Symposium, ACI SP162-13, p 313-355
Priestley, M.J.N., Sritharan, S., Conley, J., Pampanin, S. (1999). “Preliminary results and
conclusions from the PRESSS five-story precast concrete test building,” PCI Journal, V. 44, n. 6, Nov 1999, p 42-67

90
Raynor, D. (2000). “Bond Assessment of Hybrid Frame Continuity Reinforcement,”
Master’s thesis, University of Washington, Seattle, WA Sritharan, S. (2005). “Strut-and-Tie Analysis of Bridge Tee Joints Subjected to Seismic
Actions,” Journal of Structural Engineering, 131(9) p 1321-1333 Viwathanatepa, S., Popov, E., and Bertero, V. (1979). “Effects of Generalized Loadings
on Bond of Reinforcing Bars Embedded in Confined Concrete Blocks,” Earthquake Engineering Research Center, Report UCB/EERC-79/22, University of California, Berkeley, CA
Wacker, J., Hieber, D., Stanton, J., and Eberhard, M. (2005). “Design of Precast
Concrete Piers for Rapid Bridge Construction in Seismic Regions,” Washington State Transportation Center Report, Seattle, WA

A-1
APPENDIX A: SYSTEM TABLE AND SCHEMATIC DRAWINGS
The tables printed here were developed by Kari Gunnarsson. Each system was
evaluated on the basis of factors encompassing fabrication, construction, and structural
behavior. Points were assigned, with 1 being the best and 5 being the worst. Low point
totals represent preferred systems.
Table A.1: Fabrication Factors
Forming Steel and Duct Placement
Extra Materials Points
Ducts 1 3 Maintain tolerances, ½ in. bars and ducts
2 Ducts 6
Large Opening
2 Circular opening. Corrugated Surfaces.
1 1 None 4
6 #18 1 2 2 #18 bars and ducts 5
Solid Column (RC)
2 Circular opening. Corrugated Surfaces.
1 1 None 4
Solid Column (PSC)
2 Circular opening. Corrugated Surfaces.
1 1 None 4
Concrete-Filled Tube
2 Tube projecting from column
1 3 Tube 6
Slotted column
4 Odd shapes / Blockouts
2 Congestion in column top
3 Bars in top of column 9

A-2
Table A.2: Construction Factors Speed of
Construction
Temporary Erection Devices
Site Tolerance Size of Crossbeam Points
Ducts 3 Alignment of ducts and bars
3 Template and collar or shims
3 Col: +/- 1.5 in. Orientation of column (20 alignments).
2 6 ft x3.5 ft
11
Large Opening
3 Need fresh concrete on site
2 Collar 1 Col: +/- 1.5 in. 2 6 ft x3.5 ft 8
6 #18 1 1 Collar or shims
2 Col: +/- 1.5 in. Orientation of column (6 alignments).
1 5 ft x3.5 ft
5
Solid Column (RC)
1 2 Collar 1 Col: +/- 1.5 in. 3 6.5 ft x3.5 ft 7
Solid Column (PSC)
1 2 Collar 1 Col: +/- 1.5 in. 3 6.5 ft x3.5 ft 7
Concrete-Filled Tube
1 1 Collar or shims
1 Col: +/- 1.5 in. 1 5 ft x3.5 ft 4
Slotted column
2 Alignment of slots and bars
1 Collar or shims
2 Col: +/- 1.5 in. Orientation of column (2 alignments).
1 5 ft x3.5 ft
6

A-3
Table A.3: Structural Performance Factors Transfer of
Vertical Load
Bar Location in Cross
Beam Ductility
Outstanding Structural
Issues Points
Ducts 1 Bearing 2 Sides (some in between ducts)
1 Similar to current bridges
1 None 5
Large Opening
2 Friction, use corrugated surfaces
2 Sides 1 Similar to current bridges
1 None 6
6 #18 1 Bearing 1 Evenly distributed
2 Splicing in inelastic region
2 Bond of #18 bars and ducts
6
Solid Column (RC)
2 Friction, use corrugated surfaces
2 Sides 1 Similar to current bridges
2 Transfer of crossbeam torsion
7
Solid Column (PSC)
2 Friction, use corrugated surfaces
2 Sides 1 Similar to or better than current bridges
3 Transfer of crossbeam torsion 8
Concrete-Filled Tube
1 Bearing 1 Sides (but more closer to middle)
3 Difficult splicing in inelastic region
3 Moment transfer. Size of tube 8
Slotted column
1 Bearing 1 Evenly distributed
2 Splicing in inelastic region
3 Group pullout bond failure 7

A-4
Table A.4: Total Points Fabrication Construction Structural Total Points
Ducts 6 11 5 22 Large Opening 4 8 6 18
6 #18 5 5 6 16 Solid Column (RC)
4 7 7 18
Solid Column (PSC)
4 7 8 19
Concrete-Filled Tube
6 4 8 18
Slotted column 9 6 7 22

A-5
Figure A.1: Ducts system (20 #11)
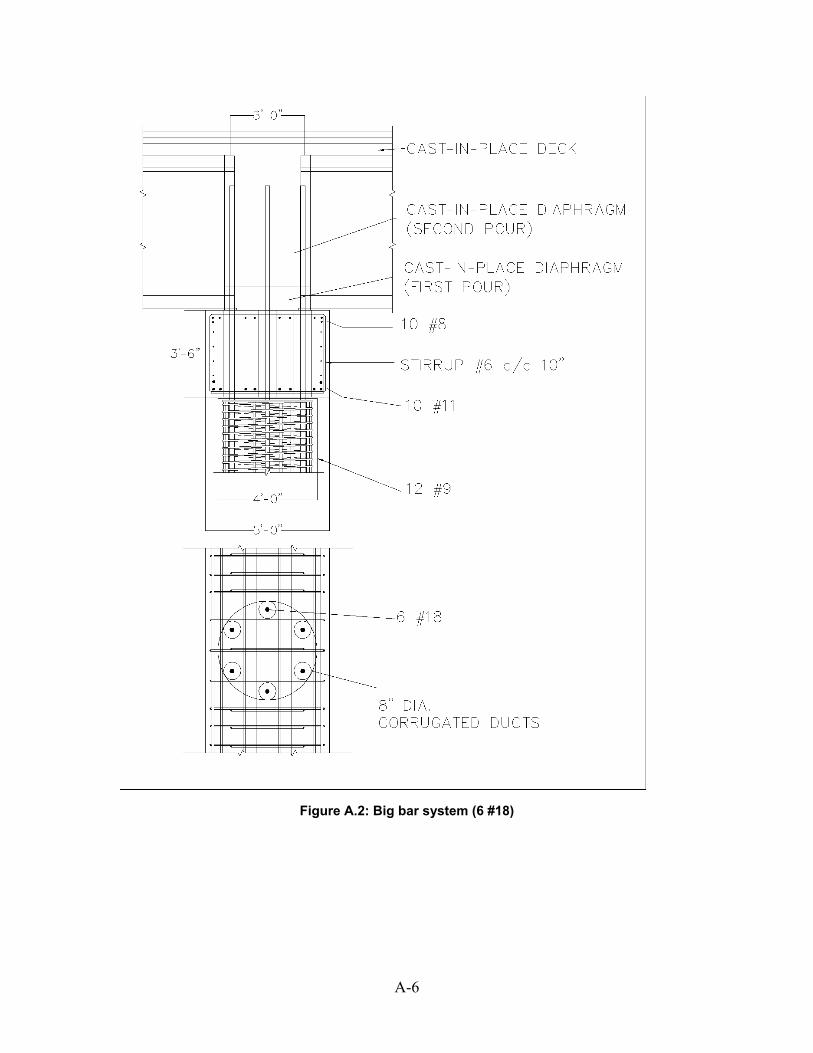
A-6
Figure A.2: Big bar system (6 #18)

A-7
Figure A.3: Large opening system

A-8
Figure A.4: Concrete filled tube system

A-9
Figure A.5: Column into capbeam system (PSC or RC)

A-10
Figure A.6: Slotted column system

B-1
APPENDIX B: NET STRESS-STRAIN PLOTS
For each bar, the net stress versus strain plots are shown. A line with a slope of
29000 ksi is also shown, representing the expected value of E.
Figure B.1: #8 Bar (08N08, 08C08)

B-2
Figure B.2: #10 bar (10F04, 10N04, 10N06)
Figure B.3: #10 Bar (10N08)

B-3
Figure B.4: #14 Bar (14N08)
Figure B.5: #18 Bar (18F02, 18F03, 18F04, 18N06)

B-4
Figure B.6: #18 Bar (18N02, 18N03, 18N04, 18N08)
Figure B.7: #18 Bar (19N14)

B-5
Figure B.8: #18 Bar (18S04)

B-6

C-1
APPENDIX C: FORCE-DISPLACEMENT PLOTS
Figure C.1: 08C08
Figure C.2: 08N08
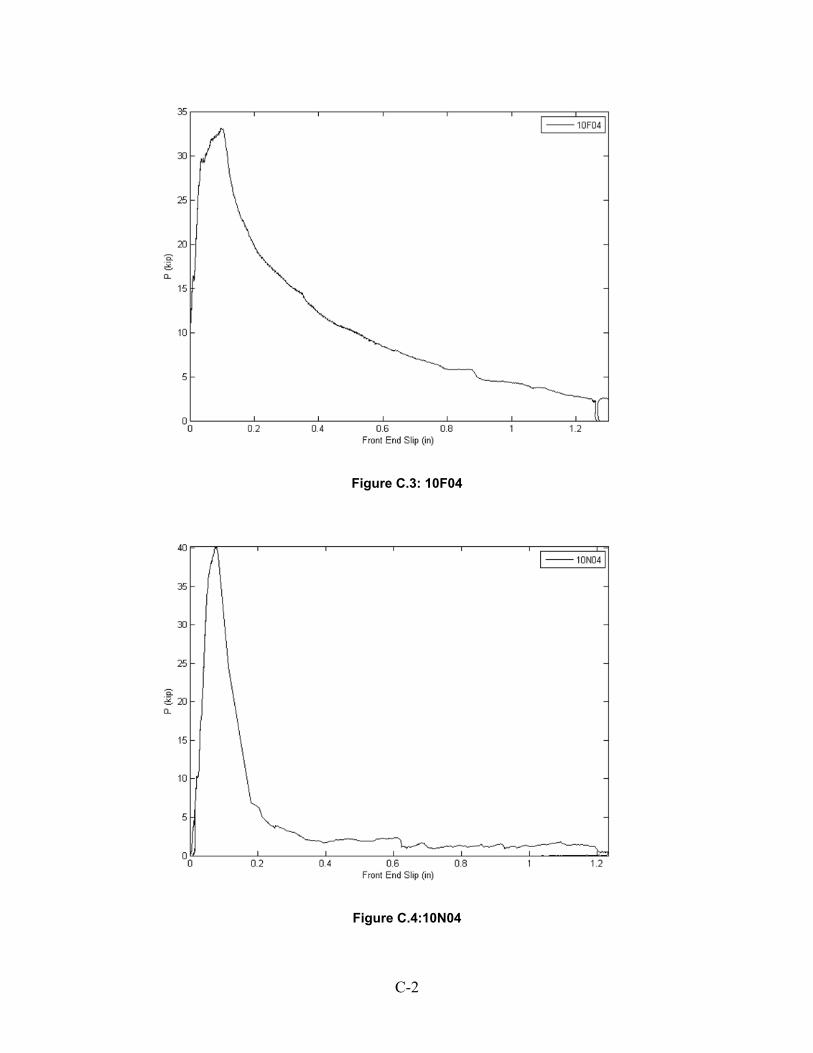
C-2
Figure C.3: 10F04
Figure C.4:10N04

C-3
Figure C.5: 10N06
Figure C.6: 10N08

C-4
Figure C.7: 14N08 (Note: Displacement measurements became unreliable before peak load
reached)
Figure C.8: 18F02

C-5
Figure C.9: 18F03
Figure C.10: 18F04

C-6
Figure C.11: 18N02
Figure C.12: 18N03

C-7
Figure C.13:18N04
Figure C.14:18N06 (Note: Displacement measurements became unreliable before peak
load reached)

C-8
Figure C.15: 18N08
Figure C.16: 18N14 (Note: Displacement measurements became unreliable before peak
load reached)

C-9
Figure C.17:18S04

C-10

D-1
APPENDIX D: FEM CODE
The nonlinear FEM was implemented in Matlab. The following code consists of
five functions. Testsim, given the embedded length, bar properties, grout properties,
assumed cone length, and choice of bond model, simulates a test. The function
increments the back-end slip and finds the front-end slip and front-end stress for each
increment. The function also locates the maximum bar stress and stores the distribution
of bar stress, bond stress, slip, and strain along the length of the bar for this state.
Barpull finds the distribution of bar stress, bond stress, slip, and strain along the
embedded length for a given back-end slip. Barpull calls stressstrain for the steel
constitutive model and monomodels for the bond constitutive model.
Stressstrain is a simple function that finds the strain given a particular stress and
allows for unloading after yielding. It calls monostressstrain for the backbone steel
stress-strain curve.
testsim function [SlipVec StressVec BackSlipVec] = testsim(L, db, ab, fg,
cone, plotflag) % simulates a run through a test by incrementing the backend slip nL = 1; % number of length increments to run (runs
nL+1) le = L/2; % initial length Linc = (L - le) / nL; backendslip = 0.0001; % initial back end slip nSlip = 250; % # of slip increments maxslip = 0.25; % largest back end slip Slipinc = (maxslip - backendslip)/nSlip; % initialize variables StressVec = 0; SlipVec = 0; BackSlipVec = 0; MaxStress = 0; % run once w/ L=Le/2 ValueMap = barpull(le, backendslip, db, ab, fg, cone, 0); StressVec = [StressVec ValueMap(size(ValueMap,1),3)]; SlipVec = [SlipVec ValueMap(size(ValueMap,1),2)]; BackSlipVec = [BackSlipVec ValueMap(1,2)]; le = le + Linc;
D-2
if ValueMap(size(ValueMap,1),3) > MaxStress; MaxValues = ValueMap; MaxStress = ValueMap(size(ValueMap,1),3); end LocalStressMax = zeros(size(ValueMap,1),1); while backendslip < maxslip ValueMap = barpull(L, backendslip, db, ab, fg, cone,
LocalStressMax); StressVec = [StressVec ValueMap(size(ValueMap,1),3)]; SlipVec = [SlipVec ValueMap(size(ValueMap,1),2)]; BackSlipVec = [BackSlipVec ValueMap(1,2)]; backendslip = backendslip + Slipinc; LocalStressMax=max(LocalStressMax,ValueMap(:,3)); if ValueMap(size(ValueMap,1),3) > MaxStress; MaxValues = ValueMap; MaxStress = ValueMap(size(ValueMap,1),3); end end %endwhile if plotflag==true figure(1) plot(SlipVec, StressVec,BackSlipVec, StressVec); xlabel('Front End Slip'); ylabel('Stress'); figure(2) plot(MaxValues(:,1),MaxValues(:,2)); xlabel('Location'); ylabel('Slip'); figure(3) plot(MaxValues(:,1),MaxValues(:,5)); xlabel('Location'); ylabel('Tau'); figure(4) plot(MaxValues(:,1),MaxValues(:,3)); xlabel('Location'); ylabel('Stress'); figure(5) plot(MaxValues(:,1),MaxValues(:,4)); xlabel('Location'); ylabel('Strain'); end
barpull function [output] = barpull(L, s0, db, Ab, fg, cone, stressmax) % Finds state given one back end slip and bar props nNode = 100;

D-3
x = zeros(nNode,1); slip = zeros(nNode,1); stress = zeros(nNode,1); strain = zeros(nNode,1); tau = zeros(nNode,1); if stressmax==0 stressmax=zeros(nNode,1); end for i = 1:nNode x(i) = (i-1)*L/(nNode-1); end %i=1 slip(1) = s0; tau(1) = monomodels(slip(1),fg, db, L-x(1),cone); if tau(1)>10 pause end P = tau(1) * x(2)/2 * pi * db; stress(1) = P/Ab; strain(1) = strainstress(stress(1),stressmax(1)); slip(2) = slip(1) + strain(1)*x(2); for i = 2:nNode %nodal loop tau(i) = monomodels(slip(i),fg,db, L-x(i),cone); if i~=nNode P = tau(i) * (x(i+1)-x(i-1))/2 * pi * db; else P = tau(i) * (x(i)-x(i-1))/2 *pi *db; end stress(i) = stress(i-1) + P/Ab; if stress(i)>=105 break; % correction for bar fracture end strain(i) = strainstress(stress(i),stressmax(i)); if i~=nNode slip(i+1) = slip(i) + strain(i)*(x(i+1) - x(i)); end end %nodal loop output = [x slip stress strain tau];
monomodels function bond=monomodels(s,fg,db,x,cone) %Monotonic bond model % x - distance from live end slip = s/db; %correction to #18 slip if x < cone

D-4
if slip <= .02 bond = 15 * slip; elseif slip <= 0.075 bond = -10/11 * slip + 7/22; elseif slip <= 0.1 bond = -10 * slip + 1; else bond = 0; end else if slip <=.025 bond = -1280*slip^2 + 80*slip; elseif slip <=0.05 bond = 1.2; elseif slip <= .1 bond = -11*slip + 1.75; elseif slip <= 0.5 bond = -1.5*slip +.8; else bond = 0.05; end end bond = bond * sqrt(fg);
stressstrain function strain=strainstress(stress, maxstress); %Allows unloading on Multilinear steel stress-strain strain = monostrainstress(stress); maxstrain = monostrainstress(maxstress); if strain < maxstrain strain = maxstrain - (maxstress-stress)/26000; end
monostressstrain function strain=monostrainstress(stress); %Monotonic, multilinear steel stress-strain % Developed by Raynor, constants taken from test results with
nominal area % Includes shallow yield plateau, polynomial strain hardening ord=6; stress1 = 70; % yield stress2 = 70.1; % end of yield plateau stress3 = 105; % ultimate E1 = 26000; % Young's modulus eps1 = stress1/E1; % yield eps2 = 0.009; % end of yield plateau eps3 = 0.2; % ultimate

D-5
if stress <= stress1 strain = stress / E1 ; elseif stress <= stress2 E2 = (stress2 - stress1)/(eps2 - eps1); strain = eps1 + (stress-stress1)/E2; elseif stress <= stress3 k = (stress2 - stress3)/(eps2 - eps3).^ord; strain = eps3 - ((stress - stress3)/k).^(1/ord); else strain = eps3; end

D-6

E-1
APPENDIX E: MODEL RESULTS
Table E.1: Peak bar stress comparison Peak nominal bar
stress (ksi) Test Model Test
08C08 90.7 73.4 08N08 89.6 76.3 10F04 37.4 26.1 10N04 16.1 31.7 10N06 53.2 69.3 10N08 74.7 88.4 14N08 85.0 79.4 18F02 13.1 9.4 18F03 28.3 29.9 18F04 39.1 41.8 18N02 12.5 7.3 18N03 22.8 35.6 18N04 44.3 46.6 18N06 76.3 75.2 18N08 94.6 89.7 18N14 105.0 105.0 18S04 39.8 23.3

E-2
Figure E.1: 08C08 (Note: concrete splitting mode not included in model)
Figure E.2: 08N08

E-3
Figure E.3: 10F04
Figure E.4: 10N04

E-4
Figure E.5: 10N06
Figure E.6: 10N08

E-5
Figure E.7: 14N08 (Note: Displacement measurements became unreliable before peak load
reached.)
Figure E.8: 18F02

E-6
Figure E.9: 18F03
Figure E.10: 18F04

E-7
Figure E.11: 18N02
Figure E.12: 18N03

E-8
Figure E.13: 18N04
Figure E.14: 18N06 (Note: Displacement measurements became unreliable before peak
load reached.)

E-9
Figure E.15: 18N08
Figure E.16: 18N14 (Note: Displacement measurements became unreliable before peak
load reached)
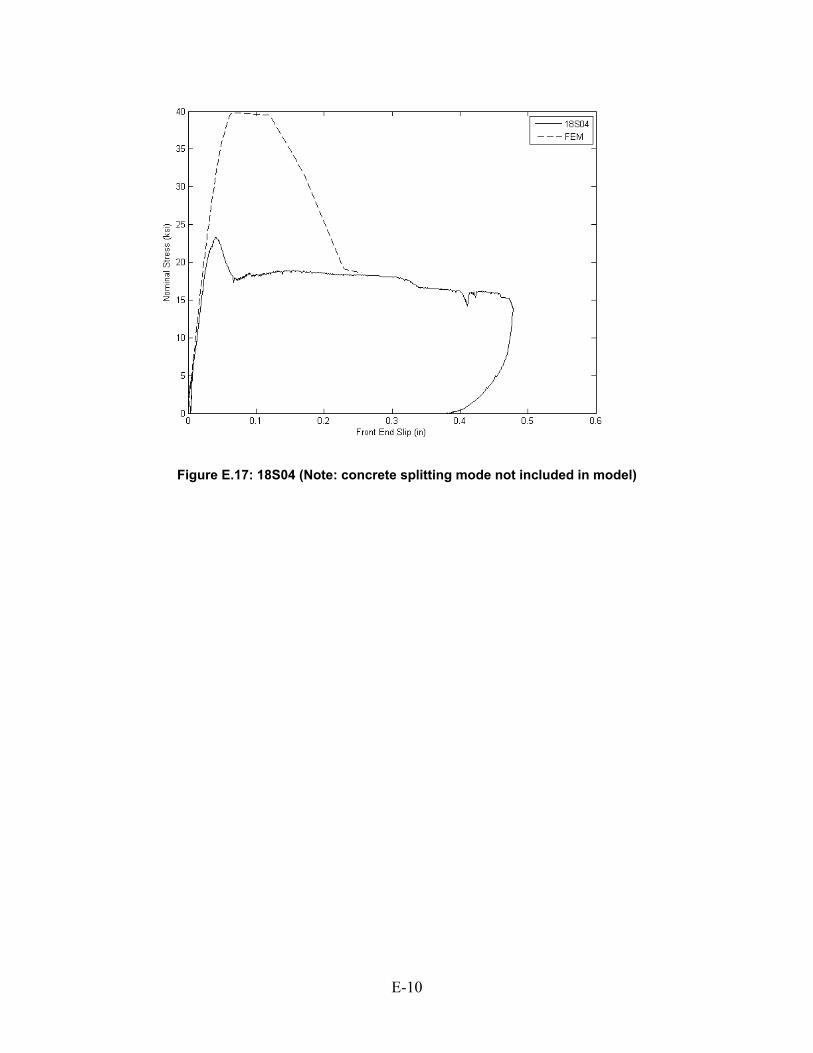
E-10
Figure E.17: 18S04 (Note: concrete splitting mode not included in model)