ANCHORAGE Community Assessment Project Cheshire cat in Alice in Wonderland tells Alice that if she...
28
Imagine creating the city of your dreams. Imagine you made the first move. Community Assessment Project ANCHORAGE 2006 Comprehensive Report
Transcript of ANCHORAGE Community Assessment Project Cheshire cat in Alice in Wonderland tells Alice that if she...

Imagine creating the city of your dreams.Imagine you made the first move.
Community Assessment ProjectANCHORAGE
2006 Comprehensive Report


For more information about this report, or to get involved with the Community Assessment Project,
please contact:
Michele Brown, President and CEO United Way of Anchorage
www.unitedwayofanchorage.org 701 W. 8th Avenue, Suite 230 Anchorage AK 99501 (907) 263-3800
Report prepared by:
Applied Survey Research www.appliedsurveyresearch.org
P.O. Box 1927 Watsonville, CA 95076 (831) 728-1356 991 West Hedding, Suite 102 San Jose, CA 95126 (408) 247-8319
For more information about the data in this report, please contact:
Kelly Pleskunas, Project Director Applied Survey Research
P.O. Box 1927 Watsonville, CA 95076 (831) 728-1356


Table of Contents
Anchorage Community Assessment Project 2006 i
Table of Contents Introduction and Methodology _________________________________________________ 1
Introduction _____________________________________________________________________________3 Acknowledgements _______________________________________________________________________4 Executive Summary _______________________________________________________________________9 Community Goals________________________________________________________________________14 Methodology ___________________________________________________________________________18
Demographic Profile ________________________________________________________ 23 Population _____________________________________________________________________________25 Migration ______________________________________________________________________________30 Languages Spoken at Home _______________________________________________________________31
Economic Issues ___________________________________________________________ 33 Employment Projections __________________________________________________________________35 Wages for Selected Occupations____________________________________________________________38 Job Opportunities________________________________________________________________________40 Unemployment Rate _____________________________________________________________________41 Income________________________________________________________________________________42 Inflation _______________________________________________________________________________43 Poverty and Public Assistance ______________________________________________________________44 Cost of Housing _________________________________________________________________________46 Housing Occupancy ______________________________________________________________________48
Education Issues ___________________________________________________________ 49 School Demographics ____________________________________________________________________51 Test Scores – Standards Based Assessment___________________________________________________53 Test Scores – TerraNova CAT/6 ____________________________________________________________58 Test Scores – High School Graduation Qualifying Examination ____________________________________61 Test Scores – Scholastic Achievement Test ___________________________________________________63 Test Scores – American College Testing______________________________________________________64 Annual Dropout Rates ____________________________________________________________________65 High School Graduation Rates______________________________________________________________66 Parents’ Participation in Schools ____________________________________________________________67 Youth Mentoring and Activities _____________________________________________________________68 Safety in Schools ________________________________________________________________________71 Child Care _____________________________________________________________________________76 College Attendance ______________________________________________________________________80 Life-long Learning _______________________________________________________________________82 Educational Attainment ___________________________________________________________________87
Health Issues ______________________________________________________________ 89 Health Insurance Coverage________________________________________________________________91 Denali Kidcare __________________________________________________________________________96 Health Care Access and Utilization __________________________________________________________97 Emergency Room Use ___________________________________________________________________101 Preventive Care ________________________________________________________________________102 Delays In Care – Prescription Medication ____________________________________________________103 Births ________________________________________________________________________________104 Adequate Prenatal Care__________________________________________________________________108 Low Birth Weight Babies _________________________________________________________________109 Oral Health____________________________________________________________________________111

Table of Contents
ii Anchorage Community Assessment Project 2006
Physical Health_________________________________________________________________________113 Physical Activity – Adults _________________________________________________________________114 Physical Activity – Youth _________________________________________________________________115 Tobacco Use __________________________________________________________________________116 Alcohol Consumption____________________________________________________________________118 Substance Abuse _______________________________________________________________________120 Mental Health Services __________________________________________________________________123 Youth Weight and Nutrition_______________________________________________________________126 Obesity_______________________________________________________________________________129 Asthma_______________________________________________________________________________131 Diabetes______________________________________________________________________________133 Unintentional Injury_____________________________________________________________________135 Suicide _______________________________________________________________________________137 Leading Causes of Death_________________________________________________________________139 Deaths Due to Cancer ___________________________________________________________________143 People With Disabilities __________________________________________________________________145
Natural Environment Issues _________________________________________________ 147 Concern About The Natural Environment ____________________________________________________149 Wildlife Populations and Habitats __________________________________________________________150 Parks and Green Spaces _________________________________________________________________154 Wetlands _____________________________________________________________________________156 Outdoor Recreation _____________________________________________________________________157 Air Quality ____________________________________________________________________________160 Water Quality__________________________________________________________________________163 Waste Management_____________________________________________________________________165
Public Safety Issues________________________________________________________ 167 Crime – All Ages _______________________________________________________________________169 Crime – Juvenile _______________________________________________________________________172 Safety in Neighborhood__________________________________________________________________178 Satisfaction with Police, Fire, and Medical Response ___________________________________________180 Emergency Preparedness ________________________________________________________________182 Gang Activity __________________________________________________________________________183 Interpersonal Violence___________________________________________________________________184 Child and Elder Abuse ___________________________________________________________________188 Foster Care Placements__________________________________________________________________190
Social Environment Issues___________________________________________________ 191 Volunteering, Charitable Giving, and Community Participation ___________________________________193 Voter Participation ______________________________________________________________________197 Community Arts and Culture ______________________________________________________________199 Discrimination _________________________________________________________________________202 Basic Needs ___________________________________________________________________________204 Homelessness _________________________________________________________________________208 Transportation _________________________________________________________________________214 Quality of Life _________________________________________________________________________217
Appendices_______________________________________________________________ 219 Appendix I: Telephone Survey Results ______________________________________________________221 Appendix II: Face-to-Face Survey Results ___________________________________________________245

Introduction and Methodology
Anchorage Community Assessment Project 2006 1
Introduction and Methodology

Introduction and Methodology
2 Anchorage Community Assessment Project 2006

Introduction and Methodology
Anchorage Community Assessment Project 2006 3
Introduction The Cheshire cat in Alice in Wonderland tells Alice that if she doesn’t know where she’s going, then it doesn’t matter which way she goes.
Anchorage residents know the direction our city should go. The community of our dreams is safe, healthy, compassionate, and no one is in need. We strive for a city where families are self-sufficient and self-reliant, neighborhoods are vibrant, helping families thrive rather than pulling them down; and no one goes hungry, suffers violence and abuse, or faces a night without shelter or medicine.
The Anchorage Community Assessment Project is a tool we can all use to chart our progress in reaching that city of our dreams. Regular community assessment keeps our finger on the pulse of Anchorage. It allows us to actively listen and engage the community on the issues that matter most, watch the trends on significant community indicators, and track our community’s well-being.
Knowing the direction we want to head, we can turn our attention to selecting the path to get there. The information in this report motivates us to set goals and focus our efforts. It fosters a shared vision for change that galvanizes the partnerships, strategies, and action plans that will achieve long lasting change.
2006 is United Way of Anchorage’s 50th year of improving people’s lives and building a stronger community. This Anchorage Community Assessment Project Report launches United Way of Anchorage’s next 50 years of caring for people and our community. Through this report, we can see how Anchorage is faring. Then, working with many community partners, we can measurably achieve the community of our dreams.
We believe that results you can see matter.
Victor Mollozzi Co-Chair, Anchorage Community Assessment Project
Mayor Mark Begich Co-Chair, Anchorage Community Assessment Project
Michele Brown President, United Way of Anchorage

Introduction and Methodology
4 Anchorage Community Assessment Project 2006
Acknowledgements Financial Sponsors
Rasmuson Foundation
BP Alaska, Inc.
Print Sponsors
Anchorage Economic Development Corporation
Providence Health System in Alaska
University of Alaska Anchorage
Municipality of Anchorage
Steering Committee Members
Steering Committee Member
Title Agency
Mike Abbott Deputy Municipal Manager Municipality of Anchorage Eleanor Andrews President and CEO Andrews Group, Inc. Mary Barber CEO The Barber Group Mark Begich Mayor Municipality of Anchorage Belinda Breaux Consultant Breaux Leadership Solutions Renee Carter-Chapman Vice Chancellor UAA Office of Community Partnerships Michelle Cassano Executive Director American Diabetes Association Susan Churchill Program Director Bridge Builders Jeff Clarke Chief Administrative Officer Rasmuson Foundation Carol Comeau Superintendent Anchorage School District Lamar Cotten Community Volunteer Delisa Culpepper Chief Operating Officer Alaska Mental Health Trust Authority Ron Dailey Community Volunteer Diane DiSanto Community Development Specialist Municipality of Anchorage Norwood Eggeling Community Volunteer Anna Fairclough Assembly Chair Anchorage Assembly Kitty Farnham Director of Strategic Planning Providence Health System in Alaska Joel Gilbertson Regional Director of Strategic
Planning and Administration Providence Health System in Alaska

Introduction and Methodology
Anchorage Community Assessment Project 2006 5
Steering Committee Member
Title Agency
Carol Gore President and CEO Cook Inlet Housing Authority Greta Goto Senior Vice President First Alaskans Institute Marcia Hastings Deputy Director The Alaska Community Foundation Jewel Jones Consultant Anchorage Urban League Denis LeBlanc City Manager Municipality of Anchorage Steve Lindbeck Vice Chancellor of University
Advancement University of Alaska Anchorage
Dennis McMillian President The Foraker Group Mary Jane Michael Director, Office of Economic and
Community Development Municipality of Anchorage
Victor Mollozzi SVP, Senior Credit Officer Northrim Bank Gloria O'Neill President/CEO Cook Inlet Tribal Council Ken Osterkamp Executive Director Alaska 20/20 Bob Poe President/CEO Anchorage Economic Development
Corporation Sammye Pokryfki Program Officer Rasmuson Foundation Brian Saylor Director UAA Institute for Circumpolar Health Studies Clover Simon Executive Director Planned Parenthood of Alaska Carol Simonetti Executive Director The Alaska Community Foundation Fran Ulmer Director, Institute of Social and
Economic Research University of Alaska Anchorage
Stephanie Wheeler Executive Director Office of Faith-Based and Community Initiatives
Candace Winkler Executive Director Child Care Connection Beverly Wooley Director, Department of Health and
Human Services Municipality of Anchorage
Technical Advisory Committee Chairs
Technical Advisory Committee Chair
Domain Agency
Bob Poe Economics Anchorage Economic Development Corporation
Carol Comeau Education Anchorage School District Mary Barber Education The Barber Group Joel Gilbertson Health Providence Health System in Alaska Mike Abbott Public Safety Municipality of Anchorage Carol Gore Social Environment Cook Inlet Housing Authority Candace Winkler Social Environment Child Care Connection Lamar Cotten Natural Environment Community Volunteer

Introduction and Methodology
6 Anchorage Community Assessment Project 2006
Technical Advisory Committee Members
Technical Advisory Committee Member
Agency
Dianne Alger MOA - DHHS Stephanie Allen Alaska Health Fair Nancy Andes UAA Center for
Community Engagement Becky Beck Anchorage Downtown
Partnership Jim Beck Access Alaska Stephanie Berglund Child Care Connection Bill Bouwens Community Volunteer Barbara Brown Leadership Anchorage Liz Burris Anchorage Project Access Niki Burrows Federation of Community
Councils Barbara Campbell Volunteers of America of
Alaska Sharon Chamard UAA Justice Center Lupe Chavez YWCA Anchorage Stephanie Cole Alaska Court System Judy Cordell Abused Women’s Aid in
Crisis Nancy Cornwell Alaska Tobacco Prevention
and Control Program Deborah Craig DPA - DHSS Elaine Dahlgren Volunteers of America of
Alaska Anne Dennis-Choi Salvation Army Clitheroe
Center Cheryl Easley UAA Shellee Evans UAA Justice Center Susan Faith Salvation Army Older
Alaskans Program Joan Fisher Anchorage Neighborhood
Health Center Charlotte Fox Alaska State Council on
the Arts Tim Fox Office of Faith-Based and
Community Initiatives Neil Fried Department of Labor Marti Anne Gilman Anchorage Project Access Scott Goldsmith ISER Daphne Hambrook American Red Cross of
Alaska Duane Heyman Alaska Health Care
Roundtable
Technical Advisory Committee Member
Agency
George Hieronymus The Foraker Group Susan Hopkin The Alaska Community
Foundation Terry Horton The Foraker Group Tara Horton Office of Faith-Based and
Community Initiatives Nathan Johnson MOA - DHHS Marilyn Kasmar Alaska Primary Care
Association Gwen Kennedy Kennedy and Associates Fred Kopacz Southcentral Foundation Bob Langworthy UAA Justice Center Marge Larson American Lung
Association Mary Anne LeMaitre Community Volunteer Sharon Leon Anchorage Youth Court Pat Libby The Libby Group Patrick Luby AARP Alaska Carlette Mack Covenant House Alaska Ellen Maling Campfire USA Alaska
Council Annette Marley, MPH Alaska Native Health
Board Joe Mathis American Red Cross Steve McComb Division of Juvenile Justice Sherry McWhorter The Salvation Army Molly Merritt-Duren CITC Employment and
Training Division Stephanie Monahan Big Brothers Big Sisters Lura Morgan DHHS, Environmental
Services Susannah Morgan Food Bank of Alaska Tom Morgan Communities in Schools of
Alaska Jola Morris Assets, Inc. Lorie Morris Alaska Baptist Family
Services Pete Mulcahy Armed Services YMCA of
Alaska Melinda Myers Success by Six Peggy Owens Big Brothers Big Sisters Rebecca Parker DHSS Carma Reed MOA – Department of
Neighborhoods

Introduction and Methodology
Anchorage Community Assessment Project 2006 7
Technical Advisory Committee Member
Agency
Kelda Reeves Big Brothers Big Sisters Tyler Robinson MOA - Department of
Neighborhoods Ann Rothe Alaska Botanical Garden Kristin Ryan Department of
Environmental Conservation
Stacy Schubert The Anchorage Chamber of Commerce
Krista Scully Alaska Bar Association Janice Shamberg Anchorage Assembly Dirk Shumaker Kids' Corps, Inc. Rick Sinnott ADF&G/Wildlife
Conservation
Technical Advisory Committee Member
Agency
Beth Sirles UAA School of Social Work
Pauline Smith Anchorage Literacy Project Stan Smith Ad Tech Consulting GroupThelma Snow-Jackson Municipality of Anchorage Trevor Storrs Alaskan AIDS Assistance
Association Jane Straight Girl Scouts Susitna
Council Tim Sullivan Weed and Seed Shirley Tuzroyluke Southcentral Native
Educators Association Erika Wolter Alaska Mental Health
Trust Authority
Super Survey Saturday Volunteers and Staff Mike Abbott Randy Akers Bruce Bartley Melissa Bartley Keith Baxter Sue Brogan Barbara Brown Michele Brown
Susan Churchill Ron Dailey Jill Fankhauser Ken Fankhauser Greta Goto Fred Jenkins Barbara Johnson Lynne Koral
Anna Luby Pat Luby Elizabeth Miller Victoria Shaver John Stinson Tim Sullivan John Vicente Nina Vicente
Super Survey Saturday Sponsors United Way of Anchorage Municipality of Anchorage Providence Health System in Alaska Red Apple Market
A special thank you to all of the agencies who contributed data for this report. Photography on opening sections provided by Alejandro IV Barragan.

Introduction and Methodology
8 Anchorage Community Assessment Project 2006
About the Researcher Applied Survey Research (ASR) is a nonprofit, social research firm dedicated to helping people build better communities by collecting meaningful data, facilitating information-based planning and developing custom strategies. The firm was founded on the principle that community improvement,
sustainability and program success are closely tied to assessment of needs, evaluation of community goals and the development of appropriate responses.
Applied Survey Research Staff Project Directors Susan Brutschy and Kelly Pleskunas Analysts and Researchers Laura Connery Shannon Fulton Ken Ithiphol Tracy Keenan Kristi Kelly
Jill Leufgen Holly Maclure Hope Malcolm Maltz Mónica Morales Javier Salcedo
Abbie Stevens Peter A. Theodore Ash Vandersteen Deanna Zachary

Introduction and Methodology
Anchorage Community Assessment Project 2006 9
Executive Summary The Anchorage Community Assessment Project provides a snapshot of our community’s quality of life. How healthy are we? How are our children doing in school? Can people find work and afford the basics? Are people safe at school, at work, and in their neighborhoods? Are people civically engaged? And how are our parks, roads, and air quality?
With that comprehensive, broad view of Anchorage, we can gauge if we’re satisfied with our quality of life and with the direction we are heading.
An assessment is the necessary starting point in an ongoing cycle that allows us to continually improve the place we call home. The Anchorage Community Assessment Project provides the data; from there, we must reach further and get the stories behind the data. By doing this, community goals take shape; community partnerships form around those goals, considering strategies and developing detailed action plans that result in lasting, measurable improvements for Anchorage residents.
Future community assessments will tell us whether we are making progress, whether our community goals continue to be the right ones, and what new directions we must take to ensure Anchorage remains a vibrant place to live, work, and play.
The steering committee has used the Community Assessment Project findings to identify community goals. These are not mandates but rather opportunities around which one or more organizations have an expressed interest in pooling efforts and resources. Following are highlights from the six areas covered, including findings as well as the community vision and goals for each.
Economy
Vision: Anchorage residents have employment opportunities and the support services necessary to achieve their highest individual level of self-sufficiency.
Findings
Job Opportunities. From 2000 through 2005, the unemployment rate for Anchorage rose from 4.9% to 5.4%, lower than the statewide rate but slightly higher than the nationwide rate. The majority of survey respondents indicated they felt there were opportunities to work in Anchorage.
Cost of Housing. A comparison of Anchorage and the rest of the state shows that housing prices are considerably higher in Anchorage than in Alaska overall. The average housing price in Anchorage rose 44% between 2001 and 2006, while statewide prices rose 41%. Nearly one-third of face-to-face survey respondents stated that they were spending more than half of their take-home income on housing costs.
Community Goals Anchorage residents have job opportunities that pay livable wages. There is adequate community infrastructure in place for families to achieve self-sufficiency. There is sufficient affordable housing for Anchorage residents.

Introduction and Methodology
10 Anchorage Community Assessment Project 2006
Education
Vision: Children enter school ready to learn, and graduate from high school prepared for the workforce, higher education, and life.
Findings
Child Care. In 2004, more than 52,000 children in Anchorage needed child care. However, the 102 licensed child care centers in Anchorage had a total capacity of fewer than 5,000 available spaces. When asked about their child care arrangements, survey respondents were least satisfied with affordability and early learning opportunities.
Graduation Rate. The four-year high school graduation rate in Anchorage decreased from 65.2% in 2003-04 to 61.4% in 2004-05, while remaining slightly higher than statewide rates.
Community Goals Children enter school ready to learn. Children graduate from high school prepared for the workforce, higher education, and life.
Health
Vision: Anchorage residents practice healthy behaviors, and have access to quality health care services that maximize their physical and mental well-being.
Findings
Health Care Access and Utilization. Although the majority of survey respondents indicated that they were able to get needed medical attention in the last year, 19% of face-to-face survey respondents and 7% of telephone survey respondents reported that they use Anchorage’s hospital emergency rooms as their main source of health care. For those needing mental health care in the past year, more than forty percent (43.3%) of face-to-face respondents, and 18.5% of telephone respondents, could not access services, due primarily to a lack of insurance coverage.
Almost one-third of face-to-face survey respondents and 41.9% of telephone survey respondents also said they have no dental care insurance, with many reporting that it has been more than a year since they received dental health care services.
Introduction and Methodology
Anchorage Community Assessment Project 2006 11
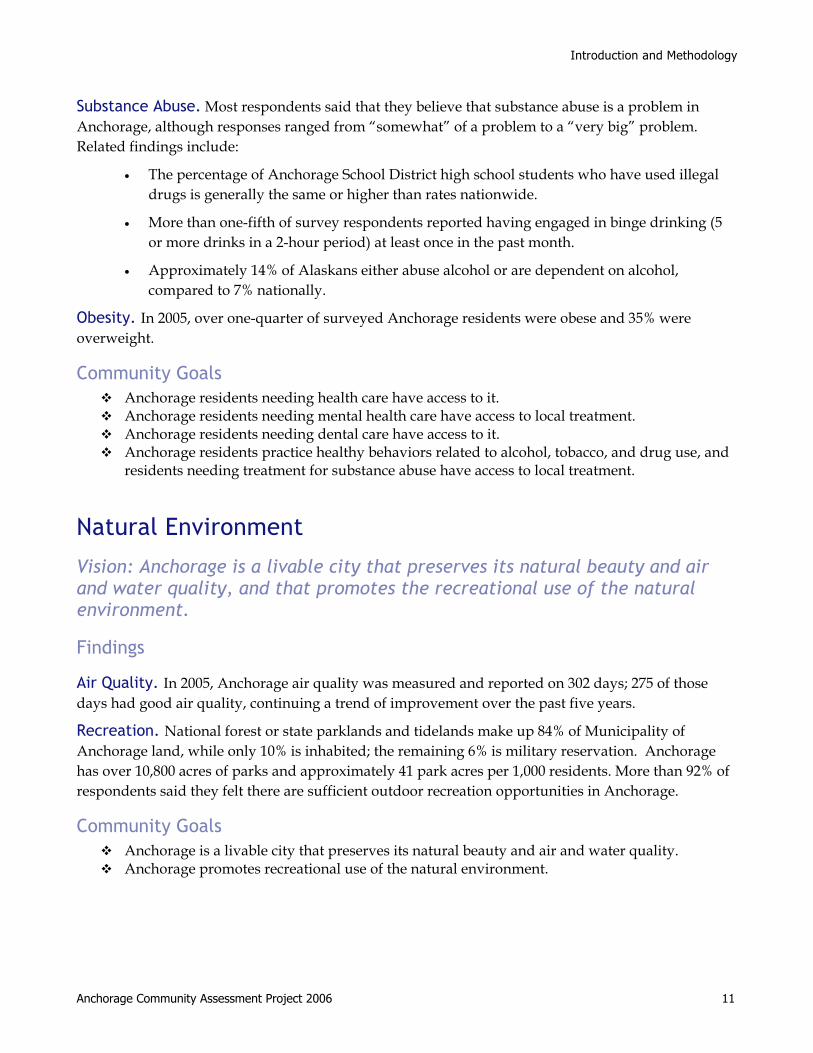
Substance Abuse. Most respondents said that they believe that substance abuse is a problem in Anchorage, although responses ranged from “somewhat” of a problem to a “very big” problem. Related findings include:
• The percentage of Anchorage School District high school students who have used illegal drugs is generally the same or higher than rates nationwide.
• More than one-fifth of survey respondents reported having engaged in binge drinking (5 or more drinks in a 2-hour period) at least once in the past month.
• Approximately 14% of Alaskans either abuse alcohol or are dependent on alcohol, compared to 7% nationally.
Obesity. In 2005, over one-quarter of surveyed Anchorage residents were obese and 35% were overweight.
Community Goals Anchorage residents needing health care have access to it. Anchorage residents needing mental health care have access to local treatment. Anchorage residents needing dental care have access to it. Anchorage residents practice healthy behaviors related to alcohol, tobacco, and drug use, and
residents needing treatment for substance abuse have access to local treatment.
Natural Environment
Vision: Anchorage is a livable city that preserves its natural beauty and air and water quality, and that promotes the recreational use of the natural environment.
Findings
Air Quality. In 2005, Anchorage air quality was measured and reported on 302 days; 275 of those days had good air quality, continuing a trend of improvement over the past five years.
Recreation. National forest or state parklands and tidelands make up 84% of Municipality of Anchorage land, while only 10% is inhabited; the remaining 6% is military reservation. Anchorage has over 10,800 acres of parks and approximately 41 park acres per 1,000 residents. More than 92% of respondents said they felt there are sufficient outdoor recreation opportunities in Anchorage.
Community Goals Anchorage is a livable city that preserves its natural beauty and air and water quality. Anchorage promotes recreational use of the natural environment.
Introduction and Methodology
12 Anchorage Community Assessment Project 2006
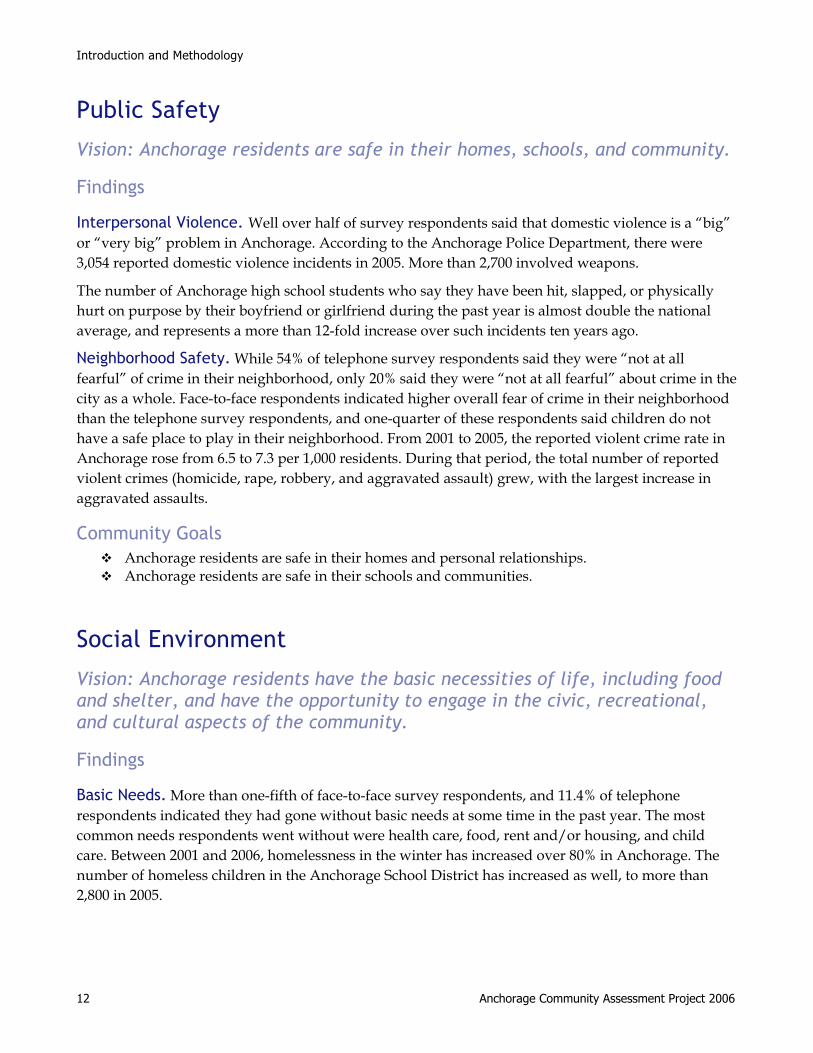
Public Safety
Vision: Anchorage residents are safe in their homes, schools, and community.
Findings
Interpersonal Violence. Well over half of survey respondents said that domestic violence is a “big” or “very big” problem in Anchorage. According to the Anchorage Police Department, there were 3,054 reported domestic violence incidents in 2005. More than 2,700 involved weapons.
The number of Anchorage high school students who say they have been hit, slapped, or physically hurt on purpose by their boyfriend or girlfriend during the past year is almost double the national average, and represents a more than 12-fold increase over such incidents ten years ago.
Neighborhood Safety. While 54% of telephone survey respondents said they were “not at all fearful” of crime in their neighborhood, only 20% said they were “not at all fearful” about crime in the city as a whole. Face-to-face respondents indicated higher overall fear of crime in their neighborhood than the telephone survey respondents, and one-quarter of these respondents said children do not have a safe place to play in their neighborhood. From 2001 to 2005, the reported violent crime rate in Anchorage rose from 6.5 to 7.3 per 1,000 residents. During that period, the total number of reported violent crimes (homicide, rape, robbery, and aggravated assault) grew, with the largest increase in aggravated assaults.
Community Goals Anchorage residents are safe in their homes and personal relationships. Anchorage residents are safe in their schools and communities.
Social Environment
Vision: Anchorage residents have the basic necessities of life, including food and shelter, and have the opportunity to engage in the civic, recreational, and cultural aspects of the community.
Findings
Basic Needs. More than one-fifth of face-to-face survey respondents, and 11.4% of telephone respondents indicated they had gone without basic needs at some time in the past year. The most common needs respondents went without were health care, food, rent and/or housing, and child care. Between 2001 and 2006, homelessness in the winter has increased over 80% in Anchorage. The number of homeless children in the Anchorage School District has increased as well, to more than 2,800 in 2005.

Introduction and Methodology
Anchorage Community Assessment Project 2006 13
Civic Engagement. Nearly two-thirds of telephone survey respondents said that in the past year, they had participated in community events or activities. In addition, almost three-fourths of respondents said they contribute money to charitable organizations, while more than a third do volunteer work. More than 30% do both.
Community Goals Anchorage residents have their basic needs met. Anchorage residents are engaged in community and civic life.
Next Steps Now that we have baseline information and community goals, partnerships and coalitions are forming around those goals. These teams will need to bring in a wide range of perspectives and expertise in order to identify strategies and develop action plans that will lead Anchorage into a safer, healthier, and more prosperous future. If you are interested in getting involved in leading Anchorage toward lasting, measurable community-level change, contact United Way of Anchorage at (907) 263-3800.

Introduction and Methodology
14 Anchorage Community Assessment Project 2006
Community Goals The steering committee has used the Community Assessment Project findings to identify community goals. These are not mandates or directions but rather opportunities around which one or more organizations have an expressed interest in pooling efforts and resources.
Turning Information into Action Regular community assessment is how we keep our finger on the pulse of Anchorage. It is not an end in itself. The data it contains should provide the impetus for action that gets lasting, measurable improvements in the community. It allows us to actively engage the community on issues that matter, watch the trends on those issues, and track our community’s well-being.
The information learned in the Anchorage Community Assessment Project fosters a shared vision for change. This shared vision promotes broader and deeper partnerships and collaborations. With shared goals, we can develop better integrated strategies and action plans that allow more informed decision making and investments that provide a greater social return.
As we conduct ongoing periodic assessments of our community, we will continue to monitor our progress toward our shared goals, re-assessing our measurements and strategies as needed. The process is continuous, as seen below:
Measuring Progress For each community goal, indicators have been selected from the Community Assessment Project report that together will provide us with a picture of how well we’re doing toward that goal. For instance, if we want to know whether children are emerging from high school ready for higher education and the workforce, we look at graduation rates and dropout rates, but we might also want
Information
Strategies
Action plans Community goals
Partnerships
Lasting,Measurable
change

Introduction and Methodology
Anchorage Community Assessment Project 2006 15
to consider children’s reading skills by grade level, participation in extracurricular activities, and the percentage of students taking the SAT. Each indicator alone gives us one piece of the puzzle. Together, these (and possibly other) indicators provide us with a fuller picture of the readiness of Anchorage’s children to go on to productive, successful lives.
For each indicator listed in the following section, a reference is given for its location in the full report.
Goals and Measurements
Economy
Vision
Anchorage residents have employment opportunities and the support services necessary to achieve their highest individual level of self-sufficiency.
Goal As Measured By Anchorage residents have job opportunities that pay livable wages.
Job opportunities (Fig. 14)
There is adequate community infrastructure in place for families to attain/maintain self-sufficiency.
Availability of child care (Fig. 69) Child care costs (Fig. 75)
There is sufficient affordable housing for Anchorage residents.
Housing costs (Fig. 24)
Education
Vision
Children enter school ready to learn, and graduate from high school prepared for the workforce, higher education, and life.
Goal As Measured By Children enter school ready to learn. Quality of child care (Figs. 73, 74) Children graduate from high school prepared for the workforce, higher education, and life,
Graduation rate (Fig. 55) Dropout rate (Fig. 54) Reading by grade level (Fig. 31) Students taking the SAT (Fig. 50) After-school activities (Fig. 59) Connectedness among students (Fig. 60)

Introduction and Methodology
16 Anchorage Community Assessment Project 2006
Health
Vision
Anchorage residents practice healthy behaviors, and have access to quality health care services that maximize their physical and mental well-being.
Goal As Measured By Anchorage residents needing health care have access to it. Access to health care (Figs. 93, 99, 105)
Emergency room use (Fig. 108) Anchorage residents needing mental health care have access to local treatment.
Access to mental health care (Fig. 96) Mental health treatment (Fig. 133) Suicide rate (Figs. 147, 148, 149)
Anchorage residents needing dental care have access to it. Access to dental health care (Fig. 98) Anchorage residents practice healthy behaviors related to alcohol, tobacco, and drug use, and residents needing treatment for substance abuse have access to local treatment.
Tobacco use by youth (Fig. 125) Smoking rates (Fig. 126) Alcohol and drug use by youth (Figs. 127, 129) Alcohol use by adults (Fig. 128) Obesity (Fig. 138)
Natural Environment
Vision
Anchorage is a livable city that preserves its natural beauty and air and water quality, and that promotes the recreational use of the natural environment.
Goal As Measured By Anchorage is a livable city that preserves its natural beauty and air and water quality.
Preservation of open space (Fig. 165) Preservation of wetlands (Fig. 171)
Anchorage promotes recreational use of the natural environment.
Outdoor recreation opportunities (Fig. 175)

Introduction and Methodology
Anchorage Community Assessment Project 2006 17
Public Safety
Vision
Anchorage residents are safe in their homes, schools, and community.
Goal As Measured By Anchorage residents are safe in their homes and personal relationships.
Domestic violence (Fig. 204) Child abuse (Fig. 209) Elder abuse (Fig. 210) Youth experiencing interpersonal violence (Figs. 202, 203)
Anchorage residents are safe in their schools and communities.
Safety perceptions (Figs. 192, 193) Safety in schools (Fig. 64) Property crime (Fig. 185) Violent crime (Fig. 184) Juvenile crime (Fig. 188)
Social Environment
Vision
Anchorage residents have the basic necessities of life, including food and shelter, and have the opportunity to engage in the civic, recreational, and cultural aspects of the community.
Goal As Measured By Anchorage residents have their basic needs met. Hunger (Figs. 228, 233, 234)
Homelessness (Figs. 235, 236) Anchorage residents are engaged in community and civic life.
Voter participation (Fig. 220) Volunteering and charitable giving (Figs. 212, 214, 216)

Introduction and Methodology
18 Anchorage Community Assessment Project 2006
Methodology
Community Assessment Model Summary The CAP community assessment model provides a comprehensive view of the quality of life in the Municipality of Anchorage. It is based on credible primary and secondary data that are gathered for a series of indicators in six areas: Economy, Education, Health, Public Safety, the Natural Environment, and the Social Environment. This comprehensive report is a tool for concerned citizens from the private and public sectors to come together to review the numbers and turn them into a picture of where the municipality is headed.
The goal of the Community Assessment Project is to continually improve the quality of life for Municipality of Anchorage residents by:
• Raising public awareness of human needs, changing trends, emerging issues, and community problems;
• Providing accurate, credible and valid information on an ongoing basis to human service planners, and those providing funds;
• Providing information for individual institutions to guide decision-making about creation, management and redesign of programs; setting community goals using measurable quality of life indicators that will lead to positive healthy development for individuals, families, and communities; and
• Supporting and assisting with the establishment of collaborative action plans to achieve the community goals.
Technical Advisory Committees For the purposes of this project, special groups known as Technical Advisory Committees (TACs) met in March and September of 2006 to develop the sets of indicators that would guide this project. These committees were represented by a rich mixture of professionals, advocates, and community volunteers, all of whom were experts in the following areas: the economy, education, health, public safety, and the social and natural environments.
Quality of Life Indicators The community assessment model relied on quality of life indicators as the primary measures to illustrate the status of a system or issue that might otherwise be too large and complex to understand. As an example, we might ask ourselves, “Do people have adequate access to health care?” Increased use of the emergency room for non-emergency purposes could be an indicator that they do not.
The TACs used special criteria to develop the quality of life indicators used for this project. These criteria stipulated that indicators needed to be understandable to the general user and the public, responsive quickly and noticeably to change, relevant for policy decisions, and available annually. During the brainstorming sessions, the TACs developed nearly one hundred quality-of-life indicators.

Introduction and Methodology
Anchorage Community Assessment Project 2006 19
Primary Data
Data Legend
Denotes a telephone survey question, 2006.
Denotes a face-to-face survey question, 2006.
Denotes an “Anchorage Community Survey” question, 2005.
Denotes a Behavioral Risk Factor Surveillance question, 2004 and 2005.
Denotes a Youth Behavioral Risk Survey question, 2005.
* An asterisk denotes that there were fewer than 200 cases, and therefore it was not statistically appropriate to calculate a percent change.
Telephone Survey Measures of community progress depend upon consistent, reliable and scientifically accurate sources of data. One of the types of data gathered for this project is primary (original) data. The primary data were obtained from a telephone survey and a face-to-face survey of a sample of Municipality of Anchorage residents. There is much to be learned from people’s perceptions of their community, especially when those perceptions contradict the empirical evidence about its conditions. For instance, in the area of public safety, crime rates may be going down while perceptions of danger are going up.
Applied Survey Research (ASR) conducted a telephone survey, in both English and Spanish, with over 400 randomly selected city residents. The intent of the survey was to measure the opinions, attitudes, desires and needs of a demographically representative sample of Anchorage’s residents.
Telephone Sample Selection and Data Weighting Telephone contacts were attempted with a random sample of residents 18 years or older in the Municipality of Anchorage. Surveys were completed with 404 respondents in the Municipality, and each completed survey took an average of 15 minutes.
Data from the survey were “weighted” to better reflect the number of male and female respondents. Data weighting is a procedure that adjusts for discrepancies between demographic proportions within a sample and the population from which the sample was drawn. For example, within the survey, the sample was 60% female and 40% male, whereas the population in the Municipality of Anchorage is evenly split between the two genders.1 When the data were weighted to adjust for the over-sampling of females, answers given by each female respondent were weighted slightly
1 U.S. Census Bureau, 2004 American Community Survey, Demographic Profiles, 2006.
Introduction and Methodology
20 Anchorage Community Assessment Project 2006
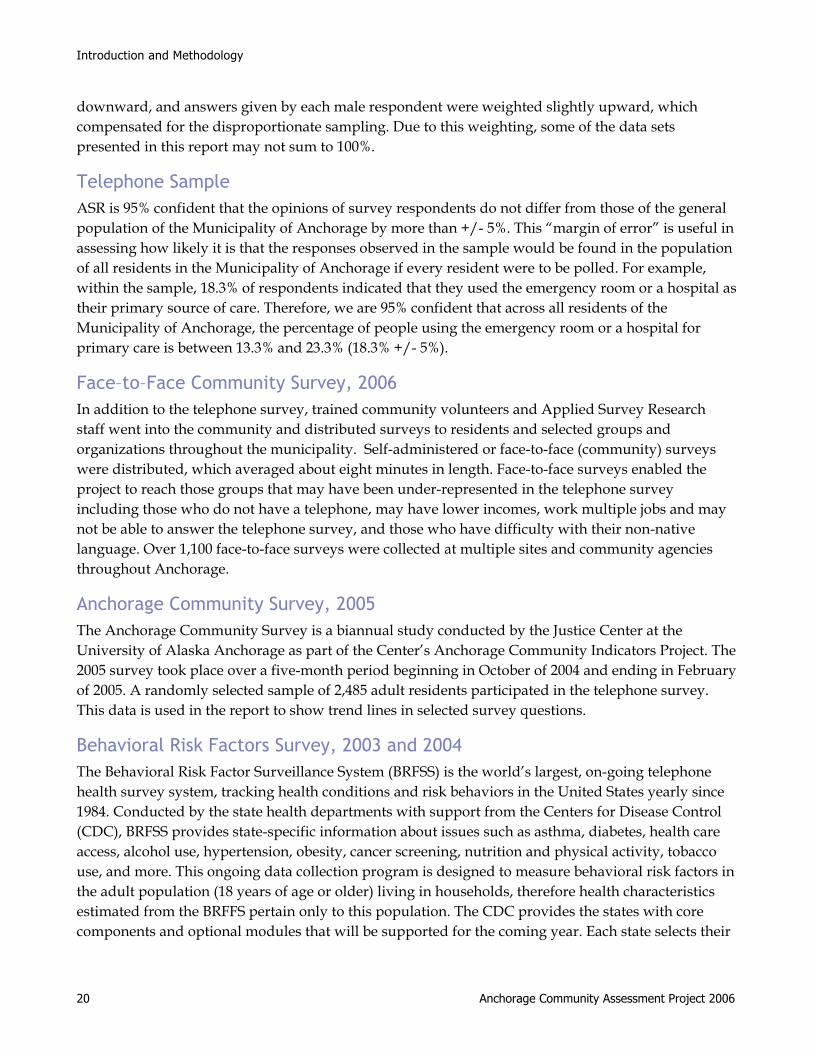
downward, and answers given by each male respondent were weighted slightly upward, which compensated for the disproportionate sampling. Due to this weighting, some of the data sets presented in this report may not sum to 100%.
Telephone Sample ASR is 95% confident that the opinions of survey respondents do not differ from those of the general population of the Municipality of Anchorage by more than +/- 5%. This “margin of error” is useful in assessing how likely it is that the responses observed in the sample would be found in the population of all residents in the Municipality of Anchorage if every resident were to be polled. For example, within the sample, 18.3% of respondents indicated that they used the emergency room or a hospital as their primary source of care. Therefore, we are 95% confident that across all residents of the Municipality of Anchorage, the percentage of people using the emergency room or a hospital for primary care is between 13.3% and 23.3% (18.3% +/- 5%).
Face–to–Face Community Survey, 2006 In addition to the telephone survey, trained community volunteers and Applied Survey Research staff went into the community and distributed surveys to residents and selected groups and organizations throughout the municipality. Self-administered or face-to-face (community) surveys were distributed, which averaged about eight minutes in length. Face-to-face surveys enabled the project to reach those groups that may have been under-represented in the telephone survey including those who do not have a telephone, may have lower incomes, work multiple jobs and may not be able to answer the telephone survey, and those who have difficulty with their non-native language. Over 1,100 face-to-face surveys were collected at multiple sites and community agencies throughout Anchorage.
Anchorage Community Survey, 2005 The Anchorage Community Survey is a biannual study conducted by the Justice Center at the University of Alaska Anchorage as part of the Center’s Anchorage Community Indicators Project. The 2005 survey took place over a five-month period beginning in October of 2004 and ending in February of 2005. A randomly selected sample of 2,485 adult residents participated in the telephone survey. This data is used in the report to show trend lines in selected survey questions.
Behavioral Risk Factors Survey, 2003 and 2004 The Behavioral Risk Factor Surveillance System (BRFSS) is the world’s largest, on-going telephone health survey system, tracking health conditions and risk behaviors in the United States yearly since 1984. Conducted by the state health departments with support from the Centers for Disease Control (CDC), BRFSS provides state-specific information about issues such as asthma, diabetes, health care access, alcohol use, hypertension, obesity, cancer screening, nutrition and physical activity, tobacco use, and more. This ongoing data collection program is designed to measure behavioral risk factors in the adult population (18 years of age or older) living in households, therefore health characteristics estimated from the BRFFS pertain only to this population. The CDC provides the states with core components and optional modules that will be supported for the coming year. Each state selects their

Introduction and Methodology
Anchorage Community Assessment Project 2006 21
optional modules, chooses any state-added questions, and constructs its questionnaire. For the 2004 BRFSS, over 2,600 Alaskan households were interviewed.
Anchorage School District Youth Risk Behavior Survey, 2005 The 2005 YRBS was a replica of the 1995 YRBS with the exception that active parental consent was used in 2005 and additional questions were added. As a result, the 2005 survey results are comparable to 1995.
In 2004-2005 there were 13,596 students in grades 9-12 attending eligible Anchorage high schools. Some groups, such as alternative schools and home schooled students were excluded from the survey sample. Among the eligible Anchorage high schools, there were approximately 583 eligible classrooms. Of these, 36 classes (781 students) were randomly selected to be included in the state survey, 21 classes (565 students) were randomly selected to be included in the local survey, and 2 classes (39 students) were selected for both state and local surveys. This resulted in 59 classes or 1,385 eligible students chosen to participate in the state or local survey to achieve a +/-5% precision of results. State and local survey results were combined to attain the greatest number of surveys possible.
Parent permission forms were required before students could participate. Survey administrators at each high school worked diligently to collect permission slips and were specially trained to conduct the survey in a consistent and confidential manner. Each administrator was given a script to read to students that established guidelines for student privacy and anonymity and the importance of the survey. Each student was given an unmarked envelope in which to seal his or her survey before turning it in. These survey envelopes remained sealed until received at a central state collection site. No individual identifiers were recorded on the surveys or sealed envelopes.
A total of 884 students completed the survey resulting in a survey response rate of 64%. Data were analyzed by the state Department of Health and Social Services section of Chronic Disease Prevention and Health Promotion. Analysis included performance of extensive edit checks to identify survey inconsistencies. When inconsistencies were found, responses were excluded from the analysis. For example, if a student reported in one question having never been in a physical fight, but then reported in another question being hurt in a physical fight, the data on that student were excluded for the two questions related to physical fighting. These inconsistencies were rare.
The 2005 YRBS results provide descriptive data on the who, what, where, and when of the self-reported behaviors in a number of major risk categories. The YRBS survey does not attempt to answer the questions of why and how. The descriptive data apply only to students attending public high schools (grades 9-12) in the Municipality of Anchorage, Alaska.
Data was gathered by gender and grade, but because there are fewer than 100 respondents in some categories, the data cannot be reported by gender and grade. It is also not reported by race for the same reason.

Introduction and Methodology
22 Anchorage Community Assessment Project 2006
Secondary Data Secondary (pre-existing) data were collected from a variety of sources, including but not limited to: the U.S. Census; federal, state and local government agencies; academic institutions; economic development groups; health care institutions; and computerized sources through online databases and the internet. Whenever possible, comparison data for the state of Alaska and 5-year trend data were collected.
Healthy Alaskans 2010 Healthy Alaskans 2010 includes a set of health objectives for the state to achieve over the first decade of the new century. This document uses the framework of the national Healthy People 2010 report, and reflects Alaska’s health-related goals and objectives that include health promotion, health protection, preventive services and access to care, and public health infrastructure. People, communities, professional organizations and others can use these objectives to track changes in health status, identify changes that need to be made, and to help plan and develop programs to improve the health of Alaskans.