Anatomy of Medial Gastrocne Nuclei in Cat Spinal Cord oleus otor
14
JOURNALOF NEUROPHYSIOLOGY Vol. 40. No. 3, May 1977. Printed in U.S.A. Anatomy of Medial Gastrocne Nuclei in Cat Spinal Cord oleus otor R. E. BURKE, P. L. STRICM, K. KANDA, C. C. KIM, AND B. WALMSLEY Laboratory of Neural Control, National Institute of Neurological and Communicative Disorders and Stroke, and Laboratory of Neurophysiology, National Institute of MentaZ Health, National Institutes of Health, Bethesda, Maryland 20014 SUMMARY AND CONCLUSIONS 1. We have examined the number, size, and position of neurons labeled after intramuscular injection of horeradish peroxidase (HRP) into either the medial gastrocnemius (MG) or soleus (SOL) muscles in adult cats. A variety of criteria permitted identification of labeled neurons as motoneurons belonging to the MG or SOL motor pools. 2. Labeled motoneurons of both MG and SOL were found in the ventral horn of segments L, and S1, arranged in discrete longitudinal col- umns. The regions occupied by the MG and SOL cell columns overlapped, but the main concen- trations of SOL cells were found somewhat ros- tral to the major collection of MG motoneurons. Within the caudal half of the region of overlap between the MG and SOL motor cell columns, > 96% of all neurons present were labeled with HRP and were, thus, either MC or SOL motoneurons. This suggests that HRP, under these conditions, labeled a very large fraction of the motoneurons in the target motor nuclei. 3. The average soma diameters of both MG and SOL motoneurons were distributed in a bimodal manner, suggesting that both alpha and gamma motoneurons were labeled with HRP. Neurons in the smaller size peak (average soma diameter, 18-38.5 pm: with median, 25-30 pm) constituted about 25-30% of each labeled cell population and are presumed to be gamma motoneurons. The larger labeled cells (average soma diameter 38.5-78 pm) are presumed to be alpha motoneurons. Cells in the gamma moto- neuron size range were systematically labeled more heavily than cells in the alpha range. 4. The size distributions of gamma motoneu- rons were similar in MG and SOL nuclei. The size distribution of alpha motoneurons in the SOL population was more restricted (range, 38.5 - 67 pm) and had a smaller median value (50 pm; two cats) than the range (38.5-78 pm) and median values (53 and 57 pm; two cats) found Received for publication September 13, 1976. for MG alpha motoneurons. The MG and SOL motor nuclei studied in detail, contained about the same absolute number of alpha motoneurons with average diameters less than 50 pm, but the MG nuclei included many more cells with soma diameter >50 pm. 5. Labeled gamma and alpha motoneurons were spatially distributed in an apparent random mixture throughout the SOL motor-cell column. The intermingling of various size motoneurons in the MG cell column was also very complete, but the most rostra1 third of the MG nucleus contained a higher ratio of large to small alpha cells than expected on the basis of random dis- tribution. This apparent nonhomogeneity along the MG motor-cell column can be correlated with a matching nonuniformity in the distribu- tion of muscle fiber types within the MG muscle itself. INTRODUCTION The motoneurons innervating limb muscles in the cat are located in the lateral portion of the ventral horn gray matter, in Rexed’s lamina IX (18). Using chromatolysis as a cell marker, Romanes (19) demonstrated that the motoneu- rons innervating individual hindlimb muscles in the cat were grouped together in relatively dis- crete longitudinal columns within lamina IX. The concept of motor nuclei as discrete colum- nar arrangements of cells fits well with the re- sults of physiological investigations of motoneu- rons (see, e.g., ref 23). The existing evidence about individual motor nuclei is, however, in- complete in several respects. For example, there is little information about the distribution of sizes of normal motoneurons innervating an in- dividual muscle or about the spatial organization of these neurons within a given motor-cell col- umn. In order to provide further information on the organization of individual motor nuclei, we have used the method of retrograde intraaxonal transport of exogenous horeradish peroxidase (HRP) ( see ref 14) to mark motoneurons of the medial gastrocnemius (MC) or soleus (SOL) 667
Transcript of Anatomy of Medial Gastrocne Nuclei in Cat Spinal Cord oleus otor

JOURNALOF NEUROPHYSIOLOGY Vol. 40. No. 3, May 1977. Printed in U.S.A.
Anatomy of Medial Gastrocne
Nuclei in Cat Spinal Cord oleus otor
R. E. BURKE, P. L. STRICM, K. KANDA, C. C. KIM, AND B. WALMSLEY
Laboratory of Neural Control, National Institute of Neurological and Communicative Disorders and Stroke, and Laboratory of Neurophysiology, National Institute of MentaZ Health, National Institutes of Health, Bethesda, Maryland 20014
SUMMARY AND CONCLUSIONS
1. We have examined the number, size, and position of neurons labeled after intramuscular injection of horeradish peroxidase (HRP) into either the medial gastrocnemius (MG) or soleus (SOL) muscles in adult cats. A variety of criteria permitted identification of labeled neurons as motoneurons belonging to the MG or SOL motor pools.
2. Labeled motoneurons of both MG and SOL were found in the ventral horn of segments L, and S1, arranged in discrete longitudinal col- umns. The regions occupied by the MG and SOL cell columns overlapped, but the main concen- trations of SOL cells were found somewhat ros- tral to the major collection of MG motoneurons. Within the caudal half of the region of overlap between the MG and SOL motor cell columns, > 96% of all neurons present were labeled with HRP and were, thus, either MC or SOL motoneurons. This suggests that HRP, under these conditions, labeled a very large fraction of the motoneurons in the target motor nuclei.
3. The average soma diameters of both MG and SOL motoneurons were distributed in a bimodal manner, suggesting that both alpha and gamma motoneurons were labeled with HRP. Neurons in the smaller size peak (average soma diameter, 18-38.5 pm: with median, 25-30 pm) constituted about 25-30% of each labeled cell population and are presumed to be gamma motoneurons. The larger labeled cells (average soma diameter 38.5-78 pm) are presumed to be alpha motoneurons. Cells in the gamma moto- neuron size range were systematically labeled more heavily than cells in the alpha range.
4. The size distributions of gamma motoneu- rons were similar in MG and SOL nuclei. The size distribution of alpha motoneurons in the SOL population was more restricted (range, 38.5 - 67 pm) and had a smaller median value (50 pm; two cats) than the range (38.5-78 pm) and median values (53 and 57 pm; two cats) found
Received for publication September 13, 1976.
for MG alpha motoneurons. The MG and SOL motor nuclei studied in detail, contained about the same absolute number of alpha motoneurons with average diameters less than 50 pm, but the MG nuclei included many more cells with soma diameter >50 pm.
5. Labeled gamma and alpha motoneurons were spatially distributed in an apparent random mixture throughout the SOL motor-cell column. The intermingling of various size motoneurons in the MG cell column was also very complete, but the most rostra1 third of the MG nucleus contained a higher ratio of large to small alpha cells than expected on the basis of random dis- tribution. This apparent nonhomogeneity along the MG motor-cell column can be correlated with a matching nonuniformity in the distribu- tion of muscle fiber types within the MG muscle itself.
INTRODUCTION
The motoneurons innervating limb muscles in the cat are located in the lateral portion of the ventral horn gray matter, in Rexed’s lamina IX (18). Using chromatolysis as a cell marker, Romanes (19) demonstrated that the motoneu- rons innervating individual hindlimb muscles in the cat were grouped together in relatively dis- crete longitudinal columns within lamina IX. The concept of motor nuclei as discrete colum- nar arrangements of cells fits well with the re- sults of physiological investigations of motoneu- rons (see, e.g., ref 23). The existing evidence about individual motor nuclei is, however, in- complete in several respects. For example, there is little information about the distribution of sizes of normal motoneurons innervating an in- dividual muscle or about the spatial organization of these neurons within a given motor-cell col- umn. In order to provide further information on the organization of individual motor nuclei, we have used the method of retrograde intraaxonal transport of exogenous horeradish peroxidase (HRP) ( see ref 14) to mark motoneurons of the medial gastrocnemius (MC) or soleus (SOL)
667
muscles after MRP injecti ns ~~n~~ed to either muscle.
The results indicate that, u.nder appropriate conditions? a very large fraction of the motoneu- rons innervating a pa.rticular muscle can be iden- tified by retrograde MRP transport neurons that innervate extrafusal and gamma motoneurons that i.nn trafusa.ll muscle fibers within muscle spindles can be distinguished on the basis of cell size and HRP-staining characteristics (20). It Las been possible to construct detailed maps of the sp distribution of both types of cells within the and SOL motor nuclei. Tn the case of MG, the motor nucleus maps are consistent with the presence of a rostra1 to caudal topographic rela- tion between the nuclear position of an alpha motoneuron and the lo on of its innervated muscle unit within the muscle.
METHODS
Experiments were performed on four young adult (weight, 1.5-2.7 kg) female cats,
Peroxidnse injection The animals ‘were anesthetized with pentobar-
bitall (30-35 mg/kg). Un.der sterile conditions the left MG muscle was exposed and gently freed of enough underlying tissue so that a thin spatula could be inserted between it and sur- rounding muscles. The regions of nerve and. blood supply were net encroached on. Horse- radish peroxidase (Sigma, type VI), 50 mg dis- solved in 1.0 ml. sterile saline, was injected throughout the muscle belly using multiple penetrations, ensuring that the needle always remained within MG. An attempt was made to infiltrate the entire muscle, judged by discolora- tion of the inner and outer surfaces. After injec- tion the wound was washed with sterile saline and was then closed in layers.
Table 1 lists the experimental procedures per- formed in each animal. In two cats (MAWS and 6), nerves to a number of other muscles in the left hindlimb were sectioned before MG injec-
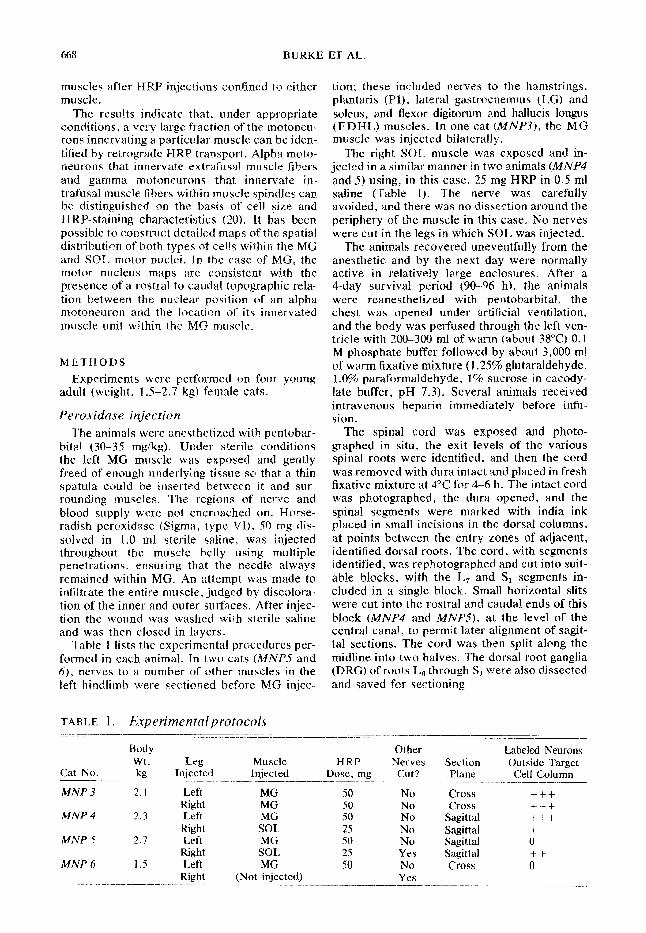
TABLE 1. Experimentalprotocols
tion; these included nerves to plantaris I), lateral gastrocn soleus, a flexor digitsrum and hallucis longus (FDHL) muscles. In one cat (MNfV), the MG muscle was injected bilaterally,
avoided, and there wa,s no dissection around the periphery of th.e muscle in this case, No nerves were cut in the legs in which SQL was injected.
The animals recovered uneventfully from the by the next day were normally
active in relatively rge enclosures. After a d-day survival perio (90-96 h), the animals were reanesthetized with pentobarbital, the chest was opened under artificial ventilation, and the bo as perfused through the left ven- tricle with 300 ml of warm (about 38°C) 0.1 M phosphate buffer followed bq’ about 3,000 ml of warm fixative mixture (11.25% glutaraldehyde, 1 .O% paraformaldehyde, 1% sucrose in cacody- late buffer, pH 7.3). Several animals received intravenous heparin immediately before infu- sion.
The spinal cord was exposed and photo- graphed in situ, the exit levels of the various spinal roots were identified, and then the cord was removed with dura intact and placed in fresh fixative mixture at 4YZ for 4-6 h. The intact cord was photographed, the dura opened, and the spinal segments were marked with india ink placed in small in.cisions in the dorsal columns, at points between the entry zones of a.djacent, identified dorsal roots. The cord, with segments identified, was rephotographed and cut into suit- able blocks, with the L, and S, segments in- cluded in a single block. Small horizontal slits were cut into the rostra1 and ca.udall ends of this block (MNP4 and MN???), at the level of the central canal, to permit later alignment of sagit- tal sections. The cord was then split along the midline into two halves. The dorsal root ganglia (DlbBG) of roots Ls through S, were also dissected and saved for sectioning.
-____-l_l--ll_-___l̂ ~~----_--- - - - - 1- . - - -1 -l~l__--- - . . - - . - - - - ~ ~ - - - - - - - -_1- - - - - -__- . . . -_ I_ - - - -_ r_- - l__l___llll_l__l-. --------- l l-“~_--_ -
Body Other Labeled Neurons WC L&g Muscle HRP Nerves Section Outside Target
Cat No. kg Injected Injected Dose, mg Cut? Plane Cell Column --_l-..-l_-xI_ --.- ---_------_-_____ _I--- --.-.- ---1_11--~--- ____ -.- MNP 3 2.1 Left NG 50 No Cross +++
Right MG 50 No Cross t + + MNP 4 2.3 Left MG 50 No Sag&al t c-t-
Right SOL 25 No Sag&d MNP 5 2.7 Left MG 50 No Sag&al 0’
Right SOL4 25 Yes Sag&al. ++ MNP 6 1.5 Left MG 50 No Cross 0
Right (Not injected) Yes

MOTOR NUCb,EUS ANATOMY
Tissue processing Spinal cord blocks and DRGs were treated for
3-4 days with ascending concentrations of su- crose in 0.t M phosphate buffer at 4°C. Serial frozen sections (50~pm thickness) were made from tissue in 15 or 30% sucrose on a sliding microtome with tissue blocks held on a con- trolled temperature freezing stage (Cryohistomat Mark I). Sections were processed for demon- stration of HRP by methods adapted from Graham and Karnovsky (11). Spinal cord sec- tions were mounted in serial order and identical orientation without counterstain. Later, cover slips were removed from selected sections, which were then lightly counterstained with gal- locyanine (16) for 1 h at room temperature. Sec- tions of DRG were processed similarly, but these were mounted in random order.
Tissue analysis Detailed analysis of tissue sections was done
in two cats (MNP4 and MNPS, see Table 1). The results in the other two cats were entirely con- firmatory, but detailed cell plotting was not at- tempted for technical reasons. All labeled neu- rons were contained in the L,-S1 tissue blocks. All sections from these blocks were drawn using a camera lucida, including outlines of gray and white matter boundaries and positions of major blood vessels. Then the positions of all struc- tures labeled with HRP reaction product were plotted on the same outlines. Doubtful struc- tures were checked under high (400x) magnifi- cation and each neuron profile was examined using oblique bright-field illumination and re- duced condenser aperture. “Cell bodies” were identified as those neuron profiles containing either a. complete nucleus, surrounded on all sides by intracytoplasmic HRP-labeled granules, and/or a clearly defined nucleolus, visible be- cause of its high refractive index. Identification of cell bodies made in some unstained sections was later checked after counterstaining. Small, heavily stained cells were, in fact, more easily analyzed in sections without counterstain.
Cell bodies, as defined above, were individ- ually numbered on the serial section maps. The maximum and minimum diameters of the so- matic profile of each cell body was measured with an eyepiece micrometer. Cell limits were, in most cases, clearly visible using oblique il- lumination at low num.erical aperture. An imagi- nary oval, excluding major dendritic branches but including the entire soma, served as the basis for diameter measurements” No correction was made for possible shrinkage. The overall dimen- sions of the section outlines, after mounting and drying, were 4--G% less than those of the fixed blocks photographed before sectioning. As seen in Fig. I, there was no apparent shrinkage of
neuronal profiles within the surrounding tissue. Finally, the sagittal section maps of individual
sections were aligned, according to the gray and white matter boundaries and outlines of pene- trating blood vessels, to give three-dimensional reconstructions of the entire block. Dorsal and cross-section views of such reconstructions are shown in Figs. 3 and 4.
RESULTS
The results to be reported are based on de- tailed study of material from cats MNP4 and MNP5 (Table l), supplemented by less rigorous examination of tissue from the other two cats, MNP3 and MNP6.
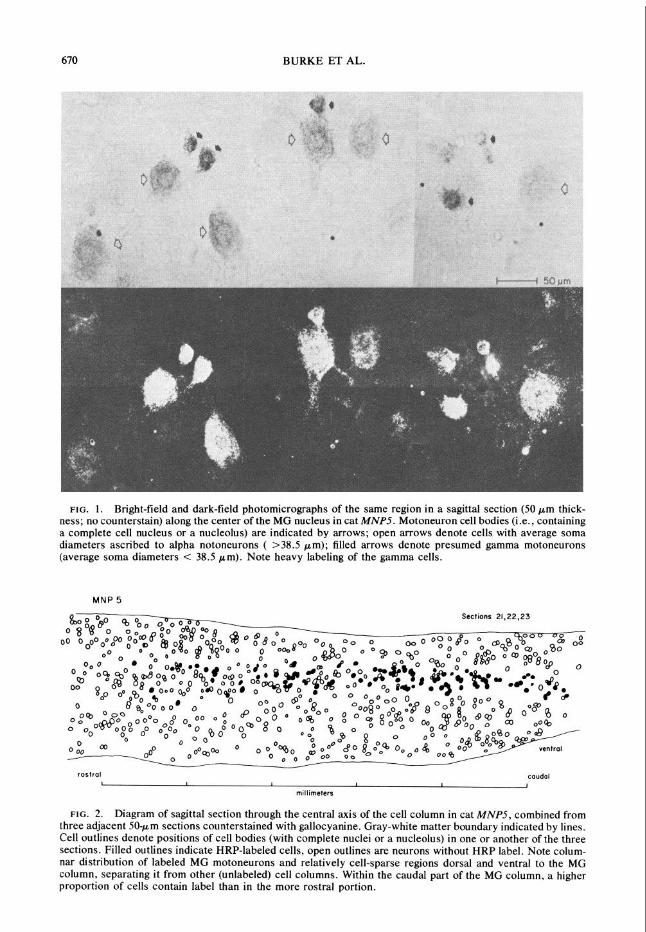
All of the HRP reaction product was con- tained within structures having the characteris- tics of motoneurons (i.e., cell bodies with large nuclei, prominent nucleoli, visible dendrites, Nissl substance when counterstained) or in smaller profiles interpreted as dendrites cut in cross or tangential section. There was no label in vascular end&helium or in other nonneuronal elements. The intensity of staining varied from one neuron to the next (Fig. 1). In all animals, the smallest neurons were usually the most heav- ily labeled cells due to a combination of high density and large size of the HRP-labeled granules within their cytoplasm (20). As will be discussed below, the small, heavily labeled cells are, very likely, gamma motsneurons.
The photomicrographs in Fig. 1 show a por- tion of the ventral horn in L, containing moto- neurons labeled with HRP after MG injection. Cell bodies, identified as described in METHODS,
are denoted by arrowsThis field is typical of the intermingling found between large (presumably alpha) mstoneurons (open arrows) and the smaller gamma motoneurons (solid arrows).
The diagram in Fig. 2 shows a sagi.ttal section map of all neuronal cell bodies contained in three adjacent sections along the central axis of the MG nuclear cell column in cat MNP5 (see Fig. 3). Note that HRP-labeled neurons (solid sym- bols), plus some unlabeled cells, are distributed along a relatively well-defined cell column, bor- dered dorsally and ventrally by thin rather cell- sparse regions. There are relatively few un- labeled neurons (open symbols) in the caudal half of this cell column at this sagittal level, while the proportion of unlabeled cells within the column increases more rsstrally. Sections from the right side of the same spinal cord contained neurons labeled following SOL muscle injection, and these cells were located in the homologous column (see Fig. 3).
Spatial distribution of MG and SOL motoneurons
In the two cats in which other muscle nerves were cut prior to MG injection (MNPS and
670 BURKE ET AL.
FIG. 1. Bright-field and dark-field photomicrographs of the same region in a sagittal section (50 pm thick- ness; no counterstain) along the center of the MG nucleus in cat MNP5. Motoneuron cell bodies (i.e., containing a complete cell nucleus or a nucleolus) are indicated by arrows; open arrows denote cells with average soma diameters ascribed to alpha notoneurons ( >38.5 pm); filled arrows denote presumed gamma motoneurons (average soma diameters < 38.5 pm). Note heavy labeling of the gamma cells.
MNP 5
Sections 21.22.23
rostml I I
caudal I
FIG. 2. Diagram of sagittal section through the central axis of the cell column in cat MNP5, combined from three adjacent 50-pm sections counterstained with gallocyanine. Gray-white matter boundary indicated by lines. Cell outlines denote positions of cell bodies (with complete nuclei or a nucleolus) in one or another of the three sections. Filled outlines indicate HRP-labeled cells, open outlines are neurons without HRP label. Note colum- nar distribution of labeled MG motoneurons and relatively cell-sparse regions dorsal and ventral to the MC column, separating it from other (unlabeled) cell columns. Within the caudal part of the MG column, a higher proportion of cells contain label than in the more rostra1 portion.
MOTOR NUCLEUS ANATOMY 671
MG injection SOL injection
I LS
I mm
I
Cat MNP 5
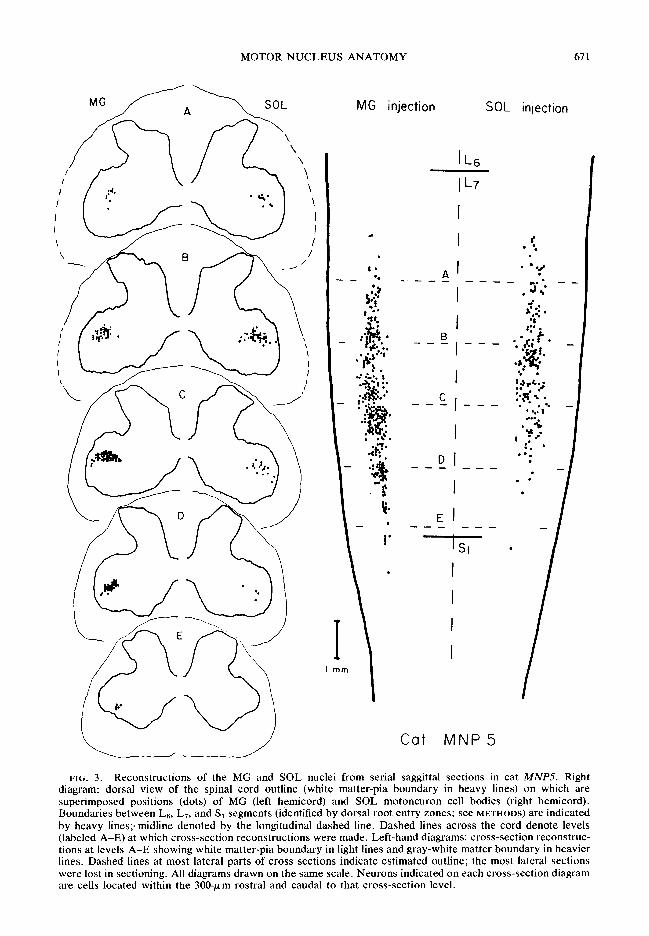
FIG. 3. Reconstructions of the MG and SOL nuclei from serial saggittal sections in cat MNP.5. Right diagram: dorsal view of the spinal cord outline (white matter-pia boundary in heavy lines) on which are superimposed positions (dots) of MG (left hemicord) and SOL motoneuron cell bodies (right hemicord). Boundaries between L6, L7, and S1 segments (identified by dorsal root entry zones; see METHODS) are indicated by heavy lines;. midline denoted by the longitudinal dashed line. Dashed lines across the cord denote levels (labeled A-E) at which cross-section reconstructions were made. Left-hand diagrams: cross-section reconstruc- tions at levels A-E showing white matter-pia boundary in light lines and gray-white matter boundary in heavier lines. Dashed lines at most lateral parts of cross sections indicate estimated outline; the most lateral sections were lost in sectioning. All diagrams drawn on the same scale. Neurons indicated on each cross-section diagram are cells located within the 300-pm rostra1 and caudal to that cross-section level.

672 BURKE ET AL.
MAU%; see Table l), all HRP-labeled motoneu- rons were found within a single, clearly defined cell column (Figs. 2 and 3). In the other two animals (without nerve section; MNP.3 and MNP4; Table I), many labeled cells were found in this same cell column. However, other labeled motoneurons were also found in a more ventral column of cells, in a position occupied by ham- string motoneurons according to Romanes (19). Because cells in the latter region were not labeled in the nerve-sectioned cats, HRP label- ing outside the target gastrocnemius cell column was regarded as spurious and these cells were excluded from further analysis.
With respect to SOL nuclei, virtually every Hap-labeled neuron after SOL injection in MNP4 is included in the diagrams in Fig. 4 (with five exceptions, all lying outside the evident SOL column, mainly rostrally and dorsally in the region of the Pl-FDIIL nucleus (19)). In the case of SOL injection in cat MNPS many labeled cells were found outside the well-defined limits of the nuclear column shown in Fig. 3. These were mainly more rostra1 and dorsolateral, again in positions consistent with the motor nuclei of pre- tibia1 flexors and of the PI and FDHL (19). Since this cell collection was clearly separate from the SOL column, these neurons were also excluded from further consideration.
It should be noted that LG motoneurons evi- dently occupy the same column as do the cells of SOLJ (19, 23). In our experience, it was not pos- sible to cut the nerve branches to LG without endangering the closely apposed SOL nerve. We thus could not rule out the possibility that some of the labeled neurons identified as SOL cells were, in fact, LG motoneurons. For reasons dis- cussed later, we feel that such LG “contamina- tion” of the SOL results is minimal.
It is not at all clear how motoneurons innervating muscles not directly injected with HRP become labeled. I%owever, the cross transfer of HRP appears to be a peripheral phenomenon since it does not occur after cutting the nerves to muscles contiguous to the injected muscle. Spurious labeling of PI and FDHL after SQL injection could be due to direct diffusion of HRP out of the SOL, but the label in hamstring moto- neurons after MG injection in MNP4 (also found in cat MNP3); see Table 1, is more difficult to explain in that way. It may well be that the cross transfer of HRP occurs by a vascular route, perhaps being cleared from the injected muscle by venous blood that is subse- quently distributed to other leg muscles by backflow. The process could also involve the lymphatic system. In any case, there appears to be no evidence for gener- alized uptake of HRP into motoneurons by a direct vascular route. The label, whether spurious or not, was always confined to particular nuclear groupings.
(see METHODS). In the dorsal view (Fig. 3, right-hand diagram), both nuclei have a rather lens-shaped outline. Note the local variations in the numbers of labeled cells along the length of both cell columns, corresponding to a “beaded” appearance as described by Romanes (19) and Testa (22) Cross-section diagrams, through relatively rostra1 nuclear levels (A and B in Fig. 3, left, for example) z show that the MG and SOL nuclei occupy a position in the ventral horn similar to the diagrams in Romanes’ work (see especially his Fig. 8). However, in the center (C), both nuclei extend laterally almost to the gray matter-white matter interface. More caudally (D and E), MG cells particularly are found in a relatively ventral position within the ventral horn. When examined within the sagittal plane (Fig. 2) 4 the M G nucleus is aligned with the longitudinal axis of the spinal cord, and the ap- parent changes in cross-section position are, in fact, due to changes in the shape of the gray matter around a column of cells that is almost straight.
As shown by Romanes (19) the SOL nucleus occupies the same ventral horn region as does the MC (Figs li 3 and 4). I f we assume that the cat spinal cord is co etely symmetrical with re-
, it is evident that the SOL nucleus in cat MNP.5 (Fig. 3) overlaps the MG nucleus to a very great extent, but the central dense collection of SOL motoneurons occupies a somewhat more rostra1 location as compared to the central part of the MG cell column. It is rather interesting that the “beads,” or collec- tions of SOL motoneurons along the length of the nucleus, are in approximate register with the “holes,” or regions of decreased cell density, along the length of the MG nucleus.
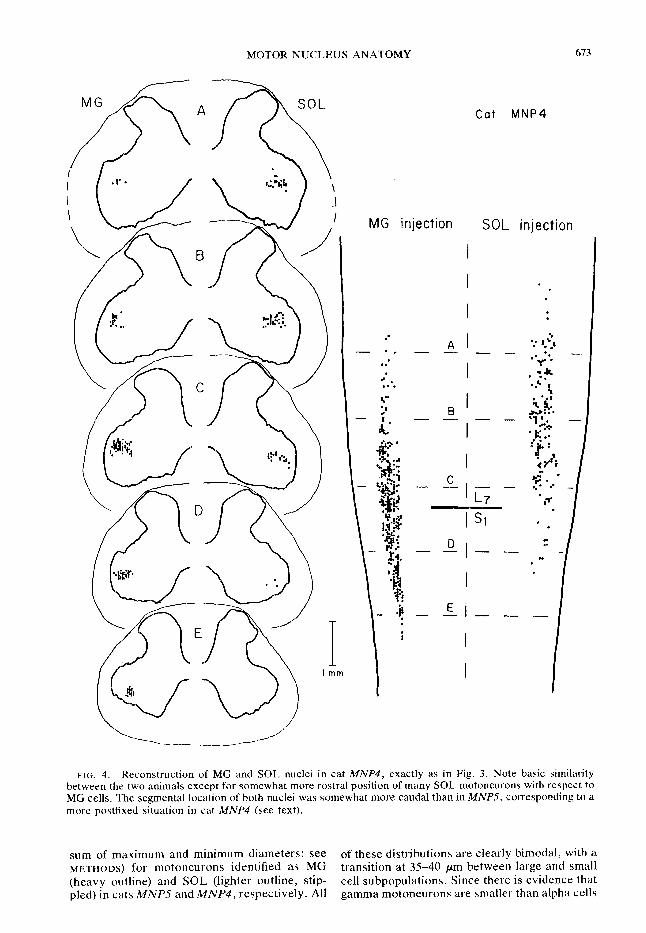
Figure 4 illustrates reconstructions obtained as in Fig. 3, but from cat MNP4. The MG and SOL nuclei are individually almost exactly as described for MNP.5, but there is tral shift of SOL cells relative to clei also occupy more caudal positions with re- spect to segmental location; almost half of the MG nucleus is located in the S1 segment in MNP4 while the MG nucleus in MNP.5 is almost entirely within LT. The relative sizes (cross- section area at dural exit) of spinal roots in MNP4 were L,>L,>L,>S, (Romanes’ group 6; see Table 2 in ref 19) while the size sequence in MNP.5 was L,>L,=L&S, (Romanes’ group 7, more prefixed than group 6). Thus, the segmen- tal positions of the MG and SOL nuclei in these cats fits well with the degree of “prefixation” judged by spinal root sizes (19).
Spatial distribution of MG and Numbers and sizes of motoneurons in SOL motoneurons MG and SOL nuclei
The diagrams in Fig. 3 show a reconstruction of the MG and Sol motor nuclei in cat MNPS
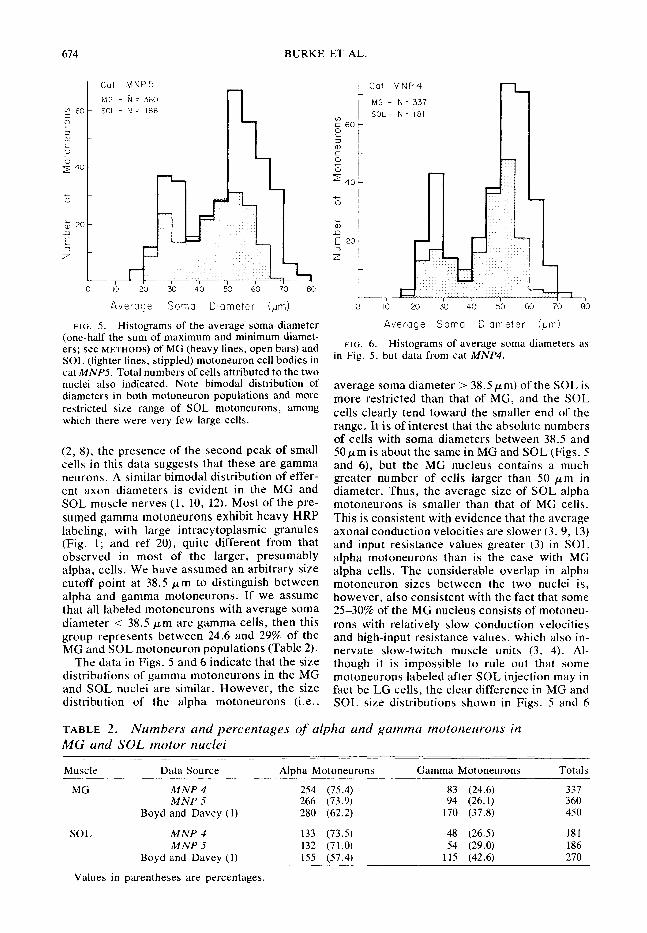
The histograms in Figs. 5 and 6 show the dis- tributions of average soma diameters (half the
MOTOR NUCLEUS ANATOMY 673
Cat MNP4
MG injection SOL injection
FIG. 4. Reconstruction of MG and SOL nuclei in cat MNP4, exactly as in Fig. 3. Note basic similarity between the two animals except for somewhat more rostra1 position of many SOL motoneurons with respect to MG cells. The segmental location of both nuclei was somewhat more caudal than in MNPS, corresponding to a more postfixed situation in cat MNP4 (see text).
sum of maximum and minimum diameters; see of these distributions are clearly bimodal, with a METHODS) for motoneurons identified as MG transition at 35-40 rJLm between large and small (heavy outline) and SOL (lighter outline, stip- cell subpopulations. Since there is evidence that pled) in cats 2MAP5 and MAW, respectively. All , gamma motoneurons are smaller than alpha cells
674 BURKE ET AL.
Cat MNPS
MG - r;l = 360 N= 186
- -
- -
1, ?
0 IO 20 30 40 50 60 70 80
Average Soma Diameter (pm)
FIG. 5. Histograms of the average soma diameter (one-half the sum of maximum and minimum diamet- ers; see METHODS) of MG (heavy lines, open bars) and SOL (lighter lines, stippled) motoneuron cell bodies in cat MNPS. Total numbers of cells attributed to the two nuclei also indicated. Note bimodal distribution of diameters in both motoneuron populations and more restricted size range of SOL motoneurons, among which there were very few large cells.
(2, 8), the presence of the second peak of small cells in this data suggests that these are gamma neurons. A similar bimodal distribution of effer- ent axon diameters is evident in the MG and SOL muscle nerves (1, 10, 12). Most of the pre- sumed gamma motoneurons exhibit heavy HRP labeling, with large intracytoplasmic granules (Fig. 1; and ref 20)) quite different from that observed in most of the larger, presumably alpha, cells. We have assumed an arbitrary size cutoff point at 38.5 pm to distinguish between alpha and gamma motoneurons. If we assume that all labeled motoneurons with average soma diameter < 38.5 pm are gamma cells, then this group represents between 24.6 and 29% of the MG and SOL motoneuron populations (Table 2).
The data in Figs. 5 and 6 indicate that the size distributions of gamma motoneurons in the MG and SOL nuclei are similar. However, the size distribution of the alpha motoneurons (i.e.,
t
Cat MNP4
MG - N = 337
t
SOL- N= 181 r” 60 0 L
0 IO 20 30 40 50 60 70 80
Average Soma Diameter (ym)
FIG. 6. Histograms of average soma diameters as in Fig. 5, but data from cat MNP4.
average soma diameter > 38.5 pm) of the SOL is more restricted than that of MG, and the SOL cells clearly tend toward the smaller end of the range. It is of interest that the absolute numbers of cells with soma diameters between 38.5 and 50 pm is about the same in MG and SOL (Figs. 5 and 6), but the MG nucleus contains a much greater number of cells larger than 50 pm in diameter. Thus, the average size of SOL alpha motoneurons is smaller than that of MG cells. This is consistent with evidence that the average axonal conduction velocities are slower (3,9, 13) and input resistance values greater (3) in SOL alpha motoneurons than is the case with MG alpha cells. The considerable overlap in alpha motoneuron sizes between the two nuclei is, however, also consistent with the fact that some 25-30% of the MG nucleus consists of motoneu- rons with relatively slow conduction velocities and high-input resistance values, which also in- nervate slow-twitch muscle units (3, 4). Al- though it is impossible to rule out that some motoneurons labeled after SOL injection may in fact be LG cells, the clear difference in MG and SOL size distributions shown in Figs. 5 and 6
TABLE 2. Numbers and percentages of alpha and gamma motoneurons in MG and SOL motor nuclei
Muscle
MG
SOL
Data Source Alpha Motoneurons Gamma Motoneurons Totals
MNP 4 254 (75.4) 83 (24.6) 337 MNP 5 266 (73.9) 94 (26.1) 360
Boyd and Davey (1) 280 (62.2) 170 (37.8) 450
MNP 4 133 (73.5) 48 (26.5) 181 MNP 5 132 (71.0) 54 (29.0) 186
Boyd and Davey (1) 155 (57.4) 115 (42.6) 270
Values in parentheses are percentages.

MOTOR NUCLEUS ANATOMY 675
suggests that such contamination is probably small, since LG neurons would be expected to have a size distribution similar to that found for MG cells (see, e.g., ref 13).
In order to evaluate the completeness of nu- clear labeling after MG and SOL injection, we counted all neurons present in sections along the central axis of both nuclei using counterstained sections from cat MNP5. Figure 7 shows, at the top, a dorsal view of the MG and SOL nuclei in this preparation (as in Fig. 3). The portion of each nucleus included in the rectangular outline represents the region of overlap between MG and SOL motoneurons in these sections which was analyzed in detail. Dividing the volume of the overlap region into lengthwise quarters, we counted all neurons, labeled and unlabeled.
The table in Fig. 7 shows that labeled MG motoneurons represent over 70% of all cells found in the caudal half of the MG nucleus. The percentage of labeled SOL motoneurons is more constant along the length of the studied region. If
Cat MNP 5
we assume that the spinal cord in this cat was bilaterally symmetrical, greater than 96% of all neurons in the caudal half of the overlap region can be accounted for as either MG or SOL mo- toneurons. The increasing number of motoneu- rons not labeled from either muscle in the rostra1 half of the overlap region presumably represents the presence of LG motoneurons, which are know to occur within the same ventral horn cell column as MG and SOL, but mainly are found at somewhat more rostra1 levels (19). These data suggest that most, if not all, MG and SOL moto- neurons were labeled with HRP under the condi- tions used in these experiments, at least as re- gards the motoneurons lying in the caudal half of both nuclei.
Detailed anatomy of MG motor nucleus As shown in Fig. 1, alpha and gamma moto-
neurons occur intermingled within the MG nu- cleus, and the same is true for the SOL nucleus. When we examined the whole of each nucleus
SOLEUS
hELED CELLS 18 18,9 33 33,3 ’ 24 25,O 18 2483
UNLABELED CELLS 77 81,l 66 66,6 72 75,o 56 75,7
TOTALS 95 99 96 74
PEDIAL WTROMMIUS
iABED CELLS 21 2386 32 36,4
UNLABELED CELLS 68 7604 56 63;6
TOTALS 89 88
ffi + SOL (%I 42,5 6987 97,5 9486
1 66 72,5
25 27,5
91
-1 45 70,3
19 29.7
64
FIG. 7. Top: diagram of dorsal view of MG and SOL nuclei in cat MNP5, as in Fig. 3, right. The rectangular outlines include the region of overlap between labeled MG and SOL motoneurons (dots). All neurons, labeled and unlabeled, were counted within this region, limiting consideration in the dorsoventral dimension to the cell column containing HRP-labeled cells (see Fig. 2). Analyzed region was divided into longitudinal quarters (heavy vertical lines). Table shows the numbers of HRP-labeled and unlabeled cells in each quarter, as well as the percentage represented by each group in the total number (N) of cells in that quarter. See text for further discussion.

676 BURKE ET AL.
from end to end, we found that gamma motoneu- rons were scattered throughout the entire vol- ume of each nucleus. The alpha-gamma inter- mixture in SOL nuclei is apparently random and quite uniform from rostra1 to caudal ends.
Figure 8 shows the results of an analysis of the longitudinal distribution of MC motoneurons ac- cording to cell size in cat MNP5. The alpha motoneuron subpopulation was in this case di- vided into two groups, one with average soma diameter >55 pm (called “large alpha” cells) and the other group with diameters between 38.5 and 54 pm (“small alpha” cells; see Fig. 5). The top diagrams in Fig. 8 show three sagittal sec- tions through the MG nucleus on which are plotted the locations of cell bodies of different sizes, with the size range denoted by the sym- bols. The extensive admixture of gamma and of large and small alpha motoneurons is evident throughout the MG cell column.
When the MG nucleus was divided into lengthwise thirds (Fig. 8, arrows), the percent-
age of cells in each size category making up the population in the respective thirds varied some- what along the length of the nucleus (Fig. 8, histograms, and Table 3). There was an excess percentage of large alpha motoneurons (and a corresponding relative dearth of small alpha cells) in the rostra1 third in both MNPS and MNP4. There was also a relative excess of gamma cells in the caudal third in MNP5 only. The departure from the relative frequencies ex- pected for a random spatial distribution of cell types was statistically significant (P < 0.01; 3 x 3 chi-square test, with df = 4). A similar trend in MNP4 (Table 3) was not statistically significant because of the smaller number of cells in the rostra1 third of that MG nucleus. The possible significance of this observation is taken up in the DISCUSSION.
Dorsal root ganglion cell labelirtg In all cats examined, technically adequate sec-
tions of the dorsal root ganglia (DRGs) of L6, L7,
Sect. 17/ 18
I
0 > 55 pm
@ 39-54ym
v < 38 ym
Sect. 21122
Sect. 27128
Total Rostra1 l/3 Middle l/3 Caudal l/3
FIG. 8. Top: sagittal-section diagrams showing three planes through the MG cell column in cat IWNPS. Gray-white matter boundary indicated by solid line. Positions of HRP-labeled cell bodies in the indicated sections (i.e., within a thickness of 1OO~m included in two adjacent serial sections) are plotted using symbols to denote the size range of each motoneuron. Symbol key in upper right corner. Segment boundaries indicated by heavy vertical lines. Vertical arrows with dashed tails (below) indicate positions of the most rostra1 and most caudal labeled cells in the MG nucleus. Shorter arrows indicate division of the MG nucleus into longitudiinal thirds. Histograms in the lower row show the relative frequencies (ordinate scale in percent) of large alpha cells (0; average soma diameter > 55 pm), small alpha cells (0; diameter > 38.5 m and ~55 pm), and gamma motoneurons (‘I; diameter <38.5 pm) in the total nucleus (leftmost histogram) and in the subtotal of cells within each respective third of the nucleus from rostra1 to caudal. See text for further discussion.
MOTOR NUCLEUS ANATOMY 677
and S, exhibited HRP-labeled cell profiles scat- tered throughout the ganglia. As with motoneu- rons, the reaction product was entirely con- tained within intracytoplasmic granules. Quan- titative cell counts were not practical because of section quality and the potential for spurious labeling in some of the cats without nerve sec- tions. However, counts of labeled DRG cell pro- files (irrespective of the presence of nuclei or nucleoli) on the left side of cat iMIvp5 (MG injec- tion) showed 119 labeled profiles in the S, DRG, 265 in L7, and only 23 very lightly labeled pro- files in L+ Many cell profiles in the S, and L7 DRGs were quite heavily labeled. Some nuclear outlines were observed, and it was clear that label was present in DRG cells ranging from very small to the largest cell bodies in the ganglia. Reaction product granules could not be detected in afferent axons.
DISCUSSION
Retrograde transport of HRP permits a more detailed mapping of individual motor nuclei, in this case MG and SOL in the cat spinal cord, than has been available using chromatolysis as a cell marker (19, 23). Our observations are, how- ever, in accord with earlier studies with respect to the existence of discrete columns of motoneu- rons innervating particular limb muscles. We have, in fact, used Romanes’ results (19) to as- sess the presence or absence of spurious labeling in nontarget motoneurons. The present results are also in accord with the conclusion that gamma motoneurons are intermingled with alpha cells in cat motor nuclei (2, 17, 24) and provide evidence for the completeness of this admixture.
Number of labeled motoneurons The most extensive existing evidence as to the
numbers of motoneurons innervating limb mus- cles in the cat derives from studies of the num- bers and sizes of efferent axons in muscle nerves after degeneration of the afferent fibers (dorsal root ganglion removal; 1, 7, 10; see also ref 12). Boyd and Davey (I), in particular, have pro- vided detailed data on cat hindlimb nerves. Our summary axon counts for MG and SOL nerves are given in Table 2. The cell counts obtained after HRP labeling are in each case lower than those of Boyd and Davey, but the discrepancy is less than 10% in the case of alpha motoneurons in MG and less than 15% for alpha cells in SOL. A much larger discrepancy is evident between the counts of axons attributed to gamma moto- neurons and the present counts of HRP-labeled neurons in the gamma size range, in which the cell counts are more than 50% less than expected on the basis of axon counts in the muscle nerves of both MC and SOL (1).
It would seem a Priori that cell-marking meth-
ods, such as chromatolysis (19) and HRP label- ing, are inherently more subject to errors of omission than are axon counts and, thus, the present discrepancies are perhaps to be ex- pected. The results shown in Fig. 7 suggest that, at least in cat MNPS, a very large proportion of motoneurons of both MG and SOL were in fact labeled, but it cannot be ruled out that neurons in the more rostra1 part of both nuclei remained unlabeled and, thus, undetected- This number is presumably small, however, since there is rea- sonable correspondence between all of the vari- ous estimates for the number of alpha motoneu- Tons.
The much larger deficit in the counts of gamma cells remains unexplained. Axon counts can be erroneously high due to axonal branching in the studied parts of peripheral nerves (1, 10) and it may be that gamma axons branch more extensively within the nerve than do alpha axons, although the early results of Eccles and Sherrington (10) appear to contradict this con- clusion. Because of the very heavy labeling of presumed gamma motoneurons (Fig. 1; see ref 20), it seems unlikely that significant numbers were missed simply because of very light label content, although it cannot completely be ruled out that a particular subclass of gamma cells may not take up and/or transport HRP as do the ma- jority. We conclude that the actual number of gamma motoneurons in the MG and SOL motor nuclei is somewhere between the limits estab- lished by the present cell counts on the one hand, and the axon counts of Boyd and Davey (1) on the other.
Neurons with electrophysiological charac- teristics of spinal cord interneurons are occa- sionally encountered by micropipettes tracking through the motor columns of the ventral horn. The large percentage of cells labeled with HRP in the MG plus SOL nuclei (Fig. 7) suggests that the number of such lamina IX interneurons within the motor cell columns themselves must be rather small (see ref 23).
Topographic relations between MG motor nucleus and MG muscle
The finding of a higher than expected ratio of large to small alpha motoneurons in the most rostra1 portion of the MG nucleus (Fig. 8 and Table 3) provides an interesting correlation with other evidence. Swett and co-workers (21) have demonstrated a topographic relation between the longitudinal position of ventral root filaments containing MG efferent axons and the location of the innervated muscle units within the MG mus- cle. The most rostra1 filaments contain axons that innervate units located along the dorsal margin of the muscle (see Fig. lo), and the most caudal filaments correspondingly innervate units

678 BURKE ET AL.
TABLE 3. Longitudinal distribution of large and small alpha and gamma motoneurons in two MG nuclei
Cell Type and Cat Size Range Rostra1 Third Middle Third Caudal Third Totals
MNP 4 Large alpha 18 (50.0) 74 (35.4) 36 (39.1) 128 (38.0) c-55 lun)
Small alpha 11 (30.6) 83 (39.7) 32 (34.8) 126 (37.4) (38.5 - 55 pm)
Gamma (c38.5 m) 7 (19.4) 52 (24.9) 24 (26.1) 83 (24.6) Totals 36 (100) 209 (100) 92 (100) 337 (100)
MNP 5 Large alpha 44 (50.0) 85 (40.1) 13 (21.7) 142 (39.4) (>55 clan)
Small alpha 23 (26.1) 78 (36.8) 23 (38.3) 124 (34.5) (38.5 - 55 jun)
Gamma (c38.5 q) 21 (23.9) 49 (23.1) 24 (40.0) 94 (26.1) Totals 88 (100) 212 (100) 60 (100) 360 (100)
Values are numbers and percentages (in parentheses) of neurons in each size category along the rostrocaudal axis of the column.
dorsal margin
ventral margin
FIG. 9. Left: Diagram of cross section through the midbelly of cat MC muscle, with three representative regions denoted by rectangles. Right: photomicrographs of the indicated regions taken from a section stained for

MOTOR NUCLEUS ANATOMY 679
MG Must
FIG. 10. Diagram of the topographic relation between motoneurons in the MG motor nuleus in the spinal cord (upper diagram: stippled) and the innervated muscle units in the MG muscle (lower diagram). The crosshatched rostral region of the nucleus contains motoneurons with axons exiting in relatively rostral ventral root filaments (also crosshatched) to innervate muscle units in the dorsal margin region of the muscle (crosshatch and lines). See text for further explanation.
in the ventral margin region. We have confirmed this topography in less systematic studies of MG motoneurons recorded and stimulated intracellu- larly, noting the position of their muscle units (unpublished observations; ref 3, 4, 6).
Histochemical studies of the whole MG mus- cle in the cat show that the region along the dorsal margin (see Fig. 10, approximately one- fifth of the whole muscle volume) contains a rather different mosaic of muscle fiber types than does the remaining four-fifths. In the dorsal margin region, only -about 10% of the muscle fibers present have the histochemical profile characteristic of slow-twitch, type S motor units (Fig. 9; see ref 4), while the propor- tion of such fibers throughout the other three- quarters of the muscle is about 30%. The moto- neurons innervating type S muscle units have relatively slow axonal conduction velocity and high-input resistance values in comparison to the cells innervating fast-twitch units (3-5) and, thus, the MG type S motoneurons are almost certainly among the smallest alpha cells in the
nucleus (Figs. 5 and 6). The relative dearth of the smaller alpha cells in the most rostra1 part of the MG nucleus (Fig. 8 and Table 3) thus fits with the intramuscular distribution of type S motor units. Figure 10 illustrates this topography in diagrammatic form, showing (crosshatching) the interrelated rostra1 portion of the nucleus, the ventral root efferents, and the innervated dorsal margin region of the muscle.
The present results, particularly in MG, are consistent with the existence of a relatively pre- cise topographic relation between the nuclear position of an alpha motoneuron and the in- tramuscular location of its innervated muscle fibers (see also ref 15). In muscles with nonhomogeneous distribution of different motor-unit types, such as cat MG (Fig. 9), this fact is apparently reflected in the distribution of alpha motoneurons along the motor cell column (Figs. 8 and lo), although it should be em- phasized that there is no strict segregation of motoneurons according to size or motor-unit type (see also ref 6). This topography and inter-
ATPase activity after incubation in acidic buffer (pH 4.65) to demonstrate presence of three muscle-fiber types (see 4). The darkest fibers are typical of muscle fibers belonging to type S (slow twitch) motor units, which are innervated by relatively small alpha motoneurons. Fibers with intermediate and light-staining intensity are typical of those found in fast-twitch type FF and type FR motor units, respectively (see 4), both of which are innervated by relatively large alpha motoneurons (3, 5). Uppermost micrograph, from the dorsal margin region, shows the low percentage of presumed type-S muscle fibers (about 10% of the fiber mosaic in this region) as compared to the remainder of the MG muscle (type S percentage about 30%).

680 BURKE ET AL.
mingling must be taken into acount in hypothe- Laboratories y Veterans Administration Hospital, ses as to how Motor nuclei are formed during Syracuse, Pd. Y. 13210.
V
development. Present address of C. C. Kim: Dept. of Physiology, Catholic Medical College, Seoul 110, Korea.
Present address of K. Kanda: Dept, of Physiology, Present address of P. L. Strick: Research Chiba University School of Medicine, Chiba, Japan.
REFERENCES
1.
2.
3.
4.
5.
6.
7.
8.
9.
10.
11.
12.
BOYD, I. A. AND DAVEY, M. R. Composition of Peripheral Nerves. Edinburgh: Livingstone, 1968. BRYAN, R. N., TREVINO, D. L., AND WILLIS, W. D. Evidence for a common location of alpha and gamma motoneurons. Brain Res. 38: 193-196, 1972. BURKE, R. E. Motor unit types of cat triceps surae muscle. J. Physiol., London 193: 141-160, 1967. BURKE, R. E., LEVINE, D. N., TSAIIUS, P., AND ZAJAC, F. E. Physiological types and histochemi- cal profiles in motor units of the cat gastrocne- mius. J. Physiol., London 234: 723-748, 1973. BURKE, R. E., RYMER, W. Z., AND WALSH, J. V. Relative strength of synaptic input from short- latency pathways to motor units of defined type in cat medial gastrocnemius. J. Neurophysiol. 39: 447-458, 1976. BURKE, R. E. AND TSAIRIS, P. Anatomy and in- nervation ratios in motor units of cat gastrocne- mius. J. Physiol., London 234: 749-765, 1973. CLARK, D. A. Muscle counts of motor units: a study in innervation ratios. Am. J. Physiol. 96: 296-304, 1931. ECCLES, J. C., ECCLES, R. M., IGGO, A., AND LUNDBERG, A. Electrophysiological studies on gamma motoneurons. Acta Physiol. &and. 50: 32-40, 1960. ECCLES, J. C., ECCLES, R. M., AND LUNDBERG, A. The action potentials of the alpha motoneu- rones supplying fast and slow muscles. J. Phys- iol., London 142: 275-291, 1958. ECCLES, J. C. AND SHERFUNGTON, C. S. Numbers and contraction values of individual motor units examined in some muscles of the limb. Proc. Roy. Sot., London, Ser. B 106: 326-357, 1930. GRAHAM, R. C. AND KARNOVSKY, M. J. The early stages of absorption of injected horseradish peroxidase in the proximal tubules of mouse kid- ney: ultrastructural cytochemistry by a new tech- nique. J. Histochem. Cytochem. 14: 291-302, 1966. HAGBARTH, K.-E. AND WOHLFART, G. The number of muscle-spindles in certain muscles in cat in relation to the composition of the muscle
13.
14.
15.
16.
18.
19.
20.
21‘
22.
23.
24.
nerves. Acta Anat. 15: 85-104, 1952. KUNO, M. Excitability following antidromic acti- vation in spinal motoneurones supplying red muscles. J. Physiol., London 149: 374-393, 1959, LAVALL, J. H. AND LAVAIL, M. M. The retro- grade intraaxonal transport of horseradish per- oxidase in the chick visual system: a light and electron microscopic study. J. Comp. Neurol. 157: 303-358, 1974. LETBETTER, W. D, Influence of intramuscular nerve branching on motor unit orgamization in medial gastrocnemius muscle. Anat. Record 178: 402, 1974. LUNA, L. G. (editor). Manual ofHisrologic Stain- ing Methods of the Armed Forces Institute of Pathology. (3rd ed.). New York: McGraw, 1968, p. 258, NYBERG-HAMEN 9 R. Anatomical demonstration of y-motoneurons in the cat’s spinal cord. Exptl. Nemrol. 13: 71-81, 1965. REXED, B I The cytoarchitectonic organization of the spinal cord in the cat. J. Comp. Neurol. 96: 415-496, 1952. ROMANES, G. J. The motor cell columns of the lumbo-sacral spinal cord of the cat, J. Comp. Neurol. 94: 313-363, 1951. STRICK, P. L., BURKE, R. E., KANE)A, K., KIM, C. C., AND WALMSLEY y B, Differences between alpha and gamma motoneurons labeled with horseradish peroxidase by retrograde transport. Brain Res. 113: 582-588, 1976. SWETT, J., ELDRED, E., AND BUCHWALD, .I. S. Somatotopic cord-to-muscle relations in efferent innervation of cat gastrocnemius. Am. J. Physiol. 219: 762-766, 1970. TESTA, C. Functional implications of the mor- phology of spinal ventral horn neurons of the cat. J. Camp, Neural. 123: 425-443, 1964. VAN BMEN, J. M. AND FRANK, K. Correlation between the morphology and potential field of a spinal motor nucleus in the cat. Electroen- cephalog. Clin. Neurophysiol. 19: 112--126, 1965. WILLIS, W. D., SKINNER, R. D., ANIP WEIR, M. A. Field potentials of alpha and gamma motoneu- rons and Renshaw cells in response to activation of motor axons. Exptl. Neural. 25: 57-69, 1969.