
Anatomy of density: measurable factors that SPECIAL ...
19
SPECIAL COLLECTION: URBAN DENSIFICATION RESEARCH CORRESPONDING AUTHOR: Shlomo Angel Marron Institute of Urban Management, New York University, New York, NY, US [email protected] KEYWORDS: affordability; cities; densification; housing; urban density; urban planning; urban policy TO CITE THIS ARTICLE: Angel, S., Lamson-Hall, P., & Blanco, Z. G. (2021). Anatomy of density: measurable factors that constitute urban density. Buildings and Cities, 2(1), pp. 264–282. DOI: https://doi. org/10.5334/bc.91 ABSTRACT Serious concerns about global warming have been translated into urgent calls for increasing urban densities, as higher densities are associated with lower carbon emissions from both vehicles and buildings. However, attempts at effective densification have generally failed and urban densities continue to decline in cities across the world. Calls for densification without making room for it have resulted in serious housing supply bottlenecks in many cities and have rendered their housing unaffordable. If affordable densification is to be successful, it is necessary to understand the factors that constitute urban density. A novel way is presented for factoring the average density of cities into constituent factors— three or seven factors—that when multiplied together reconstitute urban density. This factoring methodology is presented together with the preliminary measurement of these factors in 10 cities in 10 world regions. This approach allows, for the first time, a clear understanding of how different cities acquire their density: Hong Kong gets its density from building height; Kinshasa from crowding; and Dhaka and Bogotá from residential coverage. This anatomy of density offers a new outline for a comprehensive strategy for city densification: one that addresses each and every one of the factors that constitute urban density. PRACTICE RELEVANCE Urban density is usually defined as the ratio of the total population of a city and its total area. This is the most appropriate single metric for measuring progress in densification in cities and is now a central objective of the global climate change agenda. However, this metric is rather crude and often hides more than it reveals. The anatomy of density offers a new, simple method for factoring urban density into its constituent factors that when multiplied together reconstitute urban density. This approach offers city leaders and urban planners a new way to consider and develop comprehensive policy options and strategies for city densification that addresses each and every one of the factors that constitute urban density and the tradeoffs between them. SHLOMO ANGEL PATRICK LAMSON-HALL ZELTIA GONZALEZ BLANCO *Author affiliations can be found in the back matter of this article Anatomy of density: measurable factors that constitute urban density
Transcript of Anatomy of density: measurable factors that SPECIAL ...

SPECIAL COLLECTION:
URBAN DENSIFICATION
RESEARCH
CORRESPONDING AUTHOR:Shlomo Angel
Marron Institute of Urban Management, New York University, New York, NY, US
KEYWORDS:affordability; cities; densification; housing; urban density; urban planning; urban policy
TO CITE THIS ARTICLE:Angel, S., Lamson-Hall, P., & Blanco, Z. G. (2021). Anatomy of density: measurable factors that constitute urban density. Buildings and Cities, 2(1), pp. 264–282. DOI: https://doi.org/10.5334/bc.91
ABSTRACTSerious concerns about global warming have been translated into urgent calls for increasing urban densities, as higher densities are associated with lower carbon emissions from both vehicles and buildings. However, attempts at effective densification have generally failed and urban densities continue to decline in cities across the world. Calls for densification without making room for it have resulted in serious housing supply bottlenecks in many cities and have rendered their housing unaffordable. If affordable densification is to be successful, it is necessary to understand the factors that constitute urban density. A novel way is presented for factoring the average density of cities into constituent factors—three or seven factors—that when multiplied together reconstitute urban density. This factoring methodology is presented together with the preliminary measurement of these factors in 10 cities in 10 world regions. This approach allows, for the first time, a clear understanding of how different cities acquire their density: Hong Kong gets its density from building height; Kinshasa from crowding; and Dhaka and Bogotá from residential coverage. This anatomy of density offers a new outline for a comprehensive strategy for city densification: one that addresses each and every one of the factors that constitute urban density.
PRACTICE RELEVANCE
Urban density is usually defined as the ratio of the total population of a city and its total area. This is the most appropriate single metric for measuring progress in densification in cities and is now a central objective of the global climate change agenda. However, this metric is rather crude and often hides more than it reveals. The anatomy of density offers a new, simple method for factoring urban density into its constituent factors that when multiplied together reconstitute urban density. This approach offers city leaders and urban planners a new way to consider and develop comprehensive policy options and strategies for city densification that addresses each and every one of the factors that constitute urban density and the tradeoffs between them.
SHLOMO ANGEL
PATRICK LAMSON-HALL
ZELTIA GONZALEZ BLANCO
*Author affiliations can be found in the back matter of this article
Anatomy of density: measurable factors that constitute urban density

265Angel et al. Buildings and Cities DOI: 10.5334/bc.91
1. INTRODUCTION: URBAN DENSITY AS A METRIC OF INTEREST1.1 A KEY SUSTAINABILITY METRIC
Urban density or, more precisely, urban population density is simply understood as the ratio of the total number of inhabitants living within a well-defined footprint of a city and the total area of this footprint. Increasing urban density, or densification, has been correctly identified as a worthwhile sustainability objective. First, because urban density translates population into land consumption: a city with a given population will occupy a smaller geographical footprint—and will therefore need to convert less of the surrounding countryside to urban use when its urban density is higher. Second, because the inhabitants of a more compact city with a higher urban density will be closer to each other. Other things being equal (i.e. disregarding variations in the overall shape of its footprint, in internal spatial variations in density or in internal arrangements of land use), everything in a more compact city will be closer, making movement from place to place more efficient. In terms of both land consumption and transportation, a more compact city will be a more sustainable city.
Because of these substantial benefits, densification is now ‘enshrined in land use planning policy in many countries’ (Burton 2001: 219) as well as in Goal 11 (Indicator 11.3.1) of the United Nations’ Sustainable Development Goals (Opoku 2016). Most developed and many less-developed countries now pursue policies that promote compact urban form (OECD 2012), and studies have indeed revealed a range of secondary benefits from compactness: more productivity; lower cost public services; enhanced social and economic mobility as well as diversity; increased public transit use; lower energy use and emissions; and improved health and wellbeing (for a comprehensive review, see Boyko & Cooper 2011). This is also seen in pandemics such as Covid-19, which thrive in larger cities, not denser ones:
Larger cities have more than their share of cases and deaths in part because the larger the city, the larger the number of possible interactions among its inhabitants. And it is this larger number, rather than the overall average proximity of people to each other—expressed by the average density in the city—that accounts for that larger share. In fact, when it pertains to Covid-19 cases and deaths, denser metropolitan areas appear to be better able to contain their numbers than more spread out ones.
(Angel & Blei 2020: 28)
1.2 MEASURING DENSITY IN CITIES
There are many ways to measure density (for a comprehensive review, see Churchman 1999) and a large number of academic articles have been devoted (1) to measuring it in cities and metropolitan areas, in neighborhoods, and in individual building projects in different ways; (2) to arguing the merits and demerits of particular measures; and (3) to discussing the difficulties of measurement given the limitations of available data. The main density metrics found in the literature are shown in Table 1.1
Several authors (e.g. Banai & DePriest 2014) focus on data issues in measuring urban population densities. Population data are typically obtained from censuses. Since census data are collected and assigned to homes, the population in a given census tract is its ‘residential’, or its night-time, population. The entire population of a city is thus assigned to its residential areas, since by definition no population inhabits non-residential areas. Still, Banai & DePriest (2014: 3) (quoting Bourne 2001) point out that:
lower-density commercial and industrial uses contribute to sprawl more than higher-density residential uses
suggesting that urban density refers to the entire urban footprint rather than be restricted to residential areas within that footprint. As for the urban footprint of cities, Banai & DePriest (2014) point out that recent advances in remote sensing and Geographical Information Systems (GIS) have made it possible to identify the contiguous built-up areas of cities, as well as the urbanized open spaces encompassed by these built-up areas and metropolitan areas. This is done with the

aim of producing comparable global results. As cities and metropolitan areas typically form single, integrated labor markets, we contend that these urban footprints are also the proper areas of analysis for exploring the issues of sustainability described in the previous section.
Dovey & Pafka (2016) call for ‘greater density literacy,’ pointing out the distinctions between indoor densities (people per m2 of occupied floor area) and outdoor densities, between net residential densities (confined to residential blocks) and gross (urban) densities, between daytime and night-time densities, between person-based densities and dwelling-unit densities, between low- and high-rise densities, and between area density and street density or ‘intensity.’ While it is true that most of these densities (Table 1) are ‘factors’ of the overall urban density of cities, data limitations restrict our analysis (and those of most practitioners) to night-time densities and make it impossible to explore the ‘intensity’ of cities in general or the density of individual urban neighborhoods in particular.
DENSITY CATEGORY RATIO REFERENCE
Indoor density
Persons per dwelling unit Total populationTotal number of dwelling units
US Census Bureau (1950); Grebler (1951)
Persons per habitable room Total populationTotal number of rooms
Blake et al. (2007)
Floor area per person Total area of dwelling unitsTotal population
UN-Habitat (1996); Blake et al. (2007)
Occupied floor area per person Total occupied floor areaTotal population
WHO (2009)
Parcel density
Floor area ratio Gross residential floor areaResidential plot area
ASPO (1958); Kogo et al. (2010)
Dwelling unit per hectare (ha) Total number of dwelling unitsResidential plot area
ASPO (1958); Forsyth (2003)
Residential neighborhood density
People per residential neighborhood area
Total populationResidential neighborhood area
Eldridge (1984)
Dwelling units per residential neighborhood area
Total number of dwelling unitsResidential neighborhood area
ASPO (1958); Alexander (1993); Forsyth (2003)
Dwelling units per ‘developable land’ area
Total number of dwelling unitsTotal ‘ ’ areadevelopableland
Galster et al. (2001)
Citywide density
Citywide floor area ratio Total floor areaArea of urban footprint
McDonald and McMillen (2010); Krehl et al. (2016)
Citywide floor area per person residential floor areapopulation
Total Total
Krehl et al. (2016)
Citywide people per total residential area
Total populationTotal residential area
Frenkel and Ashkenazi (2008)
Urban density
tT nU
tr
lb
pa
pn
l
tF
oo
ao
otap
u irin
o James (1967: 55); Angel et al. (2016); OECD (2018)
Built-up area density Total populationBuilt up area in urban footprint
Angel et al. (2016)
Table 1 Main measures of urban density in the literature and selected sources that mention them.

267Angel et al. Buildings and Cities DOI: 10.5334/bc.91
To the best of the authors’ knowledge, few publications discuss the arithmetic relationships between different density metrics. Different densities are usually treated as discrete quantities, with authors pointing out, for example, that ‘net residential density’ is higher than ‘gross residential density’ because the area in the denominator of the latter is larger than that of the former, but without specifying exactly what their ratio is or what it denotes.
1.3 URBAN DENSITY AS A SINGLE METRIC
Despite the proliferation of density measures, the authors believe it is vital to preserve urban density as the single key metric for measuring densification. Many measures of density describe important urban phenomena, but a mission-oriented public policy that measures its success by pursuing a single goal with a single measure for the city at large is likely to be easier to formulate, garner support, and implement than a policy that seeks to attain disparate goals requiring disparate measures.
The use of urban density in this way is problematic, however, because it may hide more than it reveals, something easily illustrated with five brief examples:
• Overcrowding: High density is achieved by packing large households into small dwelling units.• High plot coverage: High density is achieved by residential blocks with ‘handshake’ buildings
that almost touch each other.• Ghost cities: Conversely, low-density status may be achieved despite high ‘floor area ratios’ or
high levels of ‘dwelling units density’ because most buildings are vacant. (The densification of such a city does not require additional construction; it simply requires people to inhabit it.)
• Towers with low plot coverage and large apartments: Luxury residential towers may exhibit a low urban density because these towers house very few people in large apartments and/or occupy only a small fraction of their plot areas. In such a city, displacing dense, low-rise neighborhoods with high-rise ‘towers in the park’ may lower, rather than increase, ‘urban density.’
• Small residential share: High-density residential neighborhoods may contribute little to lowering overall urban density because a large share a city’s urban footprint is devoted to industrial use.
These examples point to the core insight of this paper: the same urban density can be the result of very different phenomena, and any serious densification policy must attend to all these different phenomena if it is to be effective. This is unlikely to occur as long as these different phenomena are hidden under the mantle of a single density measure.
The key research questions posed here are:
• What are the measurable factors that interact to create the overall urban density of cities?• How can understanding the ‘anatomy of density’ be used to overcome the limitations of
urban density as a single metric?
The answers offer policy-actionable insights into cities and preserve urban density as a single metric for measuring densification at the scale of the urban footprint.
2. THE THEORY: FACTORING URBAN DENSITYUrban density can be factored into its constituent parts in different ways that expose its anatomy. Factoring is simply defined as breaking down a quantity into its constituents in such a way that multiplying them by each other yields that quantity (e.g. 12 = 3 × 4 or 12 = 2 × 2 × 3). Exposing the components of urban density in a city makes it possible to treat them individually while considering their effect on urban density as a whole, much in the way that understanding the human body’s anatomy makes it possible to treat its organs singly, while still considering their effect on the body as a whole. What is more, factoring urban density exposes the relationships among individual density metrics, thus giving both order and structure to the discussion of urban density and highlighting the tradeoffs inherent in different urban policies that impact density.

268Angel et al. Buildings and Cities DOI: 10.5334/bc.91
To realize these benefits, the factors of urban density must be measured at a scale that will create results that are comparable among cities and have meaning for the sustainability goals stated in the introduction. This means measuring the anatomy of density using averages for each density factor for the urban footprint, meaning the city or metropolitan area as a whole.2
There is more than one way to factor urban density. In total, 10 discrete factors have been identified. These factors can be meaningfully grouped into sets of two, three, four and seven. Each set of factors retains the key characteristic that lends utility to the approach, namely, the product of each set of factors is equal to urban density. This means that any desired change in urban density must come from a change in one of those factors, and that any change in one factor will, all else being held equal, result in a change in urban density. In a decision-making context, this new understanding will assist in framing tradeoffs among different policy options. The more detailed the factoring, the more comprehensive the resulting snapshot of urban density.
To illustrate this, the subsequent two sections will provide definitions of numerous factors of urban density. Section 2.1 will initially focus on three factors and section 2.2 on the most comprehensive set of seven factors. Both sections will incorporate some discussion of how increases in each of these factors will, all else being equal, lead to an increase in urban density. For reference, these factors—with additional factoring of urban density into two and four factors as well—are shown in Figure 1.
Figure 1: The two, three, four and seven factors that, when multiplied together, constitute urban density.

269Angel et al. Buildings and Cities DOI: 10.5334/bc.91
2.1 URBAN DENSITY AS A PRODUCT OF THREE FACTORS
‘Urban density’ is defined as the ratio of the ‘total population’ residing in a given ‘urban footprint’ and the total area of the urban footprint (top row of Figure 1):3
Total populationArea of urban footprint
Urban density (1)
We can decompose urban density into three factors that when multiplied together yield urban density: ‘floorspace occupancy,’ ‘floor area ratio’ and ‘residential share’ (third row of Figure 1).
The first factor, floorspace occupancy, is the ratio of the total population of a city and its total residential floor area, the gross residential floor area, including wall thicknesses and common areas:4
Total populationTotal residential floor area
Floorspace occupancy (2)
Floorspace occupancy is simply the reciprocal of a more familiar metric: the average residential ‘floor area per person’ in the city (UN-Habitat 1996; Blake et al. 2007):
Total residential floor areaTotal population
Floor area per person (3)
Floorspace occupancy is used as a factor of urban density instead of using floor area per person because urban density increases proportionally when it increases. In contrast, urban density decreases proportionally when floor area per person increases.
The second factor is the average residential ‘floor area ratio’, a metric used to regulate the allowable building volume on a given plot (e.g. ASPO 1958; Kogo et al. 2010), restricted to the ‘total area of residential plots’:
Total residential floor areaTotal area of residential plots
Floor area ratio (4)
The total area of residential plots is defined net of streets, public spaces or civic facilities.5
The third factor is ‘residential share,’ the share of the total area of the city’s urban footprint taken up by residential plots, a common metric used in quantifying urban land-use plans (e.g. Perez et al. 2004; Keys et al. 2007):
Total area of residential plotsTotal area of the urban footprint
Residential share (5)
All else being equal, a city with a higher share of its land in residential use will be able to host a greater number of people and will have a higher urban density.
It can now be ascertained that when floorspace occupancy, floor area ratio and residential share are multiplied together, everything cancels out and their product equals urban density:
Floorspace occupancy × floor area ratio × residential share = urban density (6)
2.2 URBAN DENSITY AS A PRODUCT OF SEVEN FACTORS
We can also decompose urban density into seven factors (bottom row of Figure 1). This is accomplished by factoring floorspace occupancy into four factors, factoring floor area ratio into two factors and leaving residential share as before.
270Angel et al. Buildings and Cities DOI: 10.5334/bc.91
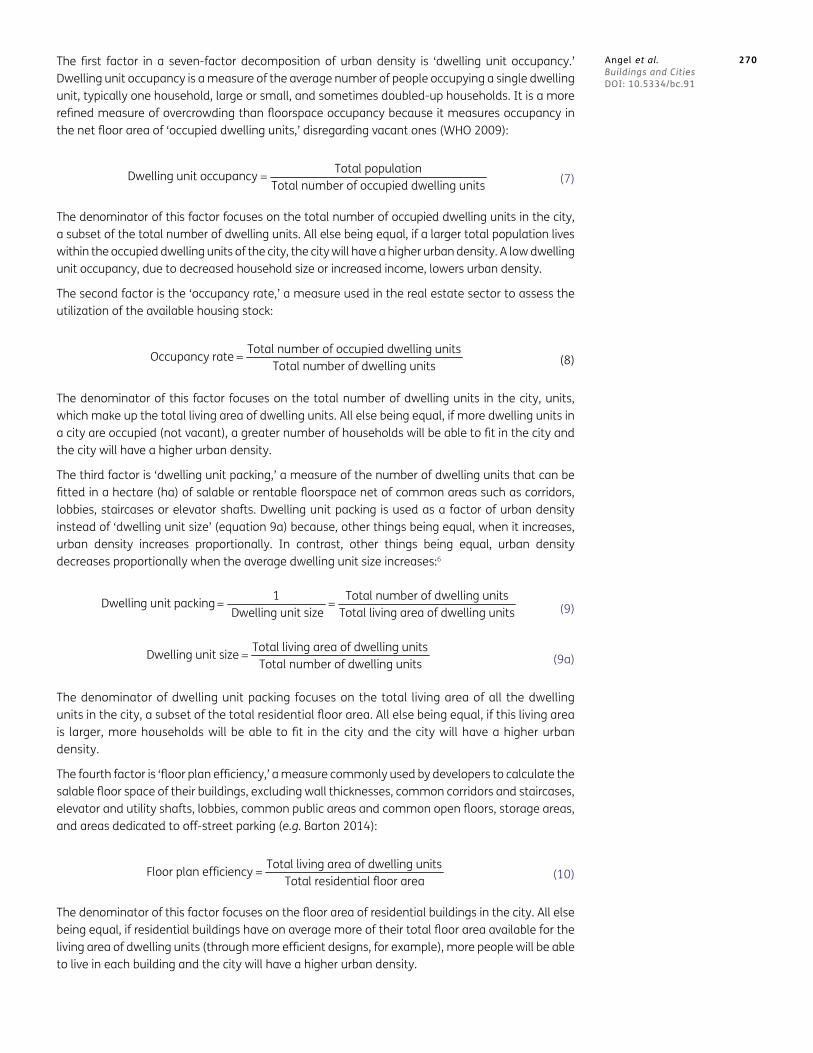
The first factor in a seven-factor decomposition of urban density is ‘dwelling unit occupancy.’ Dwelling unit occupancy is a measure of the average number of people occupying a single dwelling unit, typically one household, large or small, and sometimes doubled-up households. It is a more refined measure of overcrowding than floorspace occupancy because it measures occupancy in the net floor area of ‘occupied dwelling units,’ disregarding vacant ones (WHO 2009):
Total population Total number of occupied dwelling units
Dwelling unit occupancy (7)
The denominator of this factor focuses on the total number of occupied dwelling units in the city, a subset of the total number of dwelling units. All else being equal, if a larger total population lives within the occupied dwelling units of the city, the city will have a higher urban density. A low dwelling unit occupancy, due to decreased household size or increased income, lowers urban density.
The second factor is the ‘occupancy rate,’ a measure used in the real estate sector to assess the utilization of the available housing stock:
Total number of occupied dwelling units Total number of dwelling units
Occupancy rate (8)
The denominator of this factor focuses on the total number of dwelling units in the city, units, which make up the total living area of dwelling units. All else being equal, if more dwelling units in a city are occupied (not vacant), a greater number of households will be able to fit in the city and the city will have a higher urban density.
The third factor is ‘dwelling unit packing,’ a measure of the number of dwelling units that can be fitted in a hectare (ha) of salable or rentable floorspace net of common areas such as corridors, lobbies, staircases or elevator shafts. Dwelling unit packing is used as a factor of urban density instead of ‘dwelling unit size’ (equation 9a) because, other things being equal, when it increases, urban density increases proportionally. In contrast, other things being equal, urban density decreases proportionally when the average dwelling unit size increases:6
1 Total number of dwelling units Dwelling unit size Total living area of dwelling units
Dwelling unit packing (9)
Total living area of dwelling units Total number of dwelling units
Dwelling unit size (9a)
The denominator of dwelling unit packing focuses on the total living area of all the dwelling units in the city, a subset of the total residential floor area. All else being equal, if this living area is larger, more households will be able to fit in the city and the city will have a higher urban density.
The fourth factor is ‘floor plan efficiency,’ a measure commonly used by developers to calculate the salable floor space of their buildings, excluding wall thicknesses, common corridors and staircases, elevator and utility shafts, lobbies, common public areas and common open floors, storage areas, and areas dedicated to off-street parking (e.g. Barton 2014):
Total living area of dwelling units Total residential floor area
Floor plan efficiency (10)
The denominator of this factor focuses on the floor area of residential buildings in the city. All else being equal, if residential buildings have on average more of their total floor area available for the living area of dwelling units (through more efficient designs, for example), more people will be able to live in each building and the city will have a higher urban density.

271Angel et al. Buildings and Cities DOI: 10.5334/bc.91
The fifth factor is ‘building height,’ measured as the average number of residential floors—exclusive of commercial floors in mixed-use buildings—in the city as a whole (e.g. ASPO 1958; Bertaud & Brueckner 2005):
Total residential floor areaTotal area of residential building footprints
Building height (11)
The denominator of this factor focuses on the area of residential building footprints, a part of the total residential area of the city. All else being equal, if the residential building footprints within the city contain more residential floor area (an outcome that can only be achieved by building up or digging down), more people will be able to live within each building footprint and the city will have a higher urban density.
The sixth factor is ‘plot coverage,’ measured as the average share of residential plots occupied by residential building footprints:
Total area of residential building footprints Total area of residential plots
Plot coverage (12)
The denominator of this factor focuses on just the residential area of the city, a part of the urban footprint. All else being equal, a city with a greater share of its residential area occupied by residential buildings can host a greater number of people within its residential area and will have a higher urban density.
The seventh factor is ‘residential share,’ the share of the total area of the city’s urban footprint taken up by residential plots:
Total area of residential plotsTotal area of the urban footprint
Residential share (13)
Each of these seven factors is a ratio of two averages for the city as a whole. When multiplying these ratios together, most of these averages cancel. This is illustrated in the bottom row of Figure 1. Starting from the far left, the denominator of each factor cancels out the numerator of the factor to the right of it: first occupied dwelling units cancels, followed by dwelling units, followed by living area, followed by floor area, then building footprints and finally residential area. Population is the only remaining numerator and urban area is the only remaining denominator. The ratio of these two variables was previously defined in equation (1) as urban density:
Dwelling unit occupancy × occupancy rate × dwelling unit packing × floor plan efficiency × building height × plot coverage × residential share = urban density.
For the factors that constitute urban density to be useful, they must also be measurable. This paper demonstrates this by calculating average citywide values for each factor. The results of these measurements are preliminary and quite possibly subject to substantial errors, but they are useful in illustrating for the first time that there are important variations in the anatomy of density among cities: different cities get their urban density from different combinations of factors.
3. METHODOLOGY FOR OBTAINING EMPIRICAL RESULTS3.1 TEN REPRESENTATIVE CITIES
To measure the factors that constitute urban density, 10 representative cities were selected from the global sample of 200 cities in the Atlas of Urban Expansion—2016 Edition (Angel et al. 2016). The selected cities are listed in Table 2, which also shows that urban density in this group of cities was not highly correlated with city gross domestic product (GDP) or with city population. The cities were selected to maximize diversity in size, location, and economic development in order to test the methodology for obtaining the empirical results in a range of contexts.

3.2 MEASURABLE METRICS
The measurable metrics that give an insight into the factors of urban density in each city are defined in Table 3.
In this section we provide short summaries that explain how the values for each of these eight metrics were obtained. Detailed explanations are provided in the Appendix in the supplemental data online.
The urban footprint and total population were drawn from previous work of the authors. Several authors (e.g. Banai & DePriest 2014) have noted that the administrative boundary of the city is not an appropriate denominator for measuring its density because it may be too large or too small in comparison with its contiguous built-up area and may change arbitrarily from one year to another. This study uses urban footprints for the 10 cities that were previously created (Angel et al. 2016) by classifying recent Landsat imagery in study areas containing these cities.7 As part of the same exercise, the total population living within the urban footprints of these 10 cities was estimated using a methodology described by Angel et al. (2016) to address the modifiable areal unit problem.8
CITY COUNTRY REGION CITY GDP PER CAPITA, 2012
SATELLITE IMAGE DATE
URBAN FOOTPRINT AT THE DATE (HA)
POPULATION IN THE URBAN FOOTPRINT (’000s)
URBAN DENSITY (PERSONS/HA)
Dhaka Bangladesh South and Central Asia
US$4,979 1 March 2014 36,541 13,609 372
Hong Kong Hong Kong (SAR), China
East Asia and the Pacific
US$50,746 1 October 2013 12,278 4,322 352
Kinshasa Congo Democratic Republic
Sub-Saharan Africa
US$1,849 1 July 2013 45,681 10,226 224
Bogotá Colombia Latin America and the Caribbean
US$15,933 1 January 2010 39,723 7,802 196
Cairo Egypt North Africa US$12,067 1 May 2013 136,396 15,735 115
Baku Azerbaijan Western Asia US$13,536 1 August 2014 25,662 1,672 65
Madrid Spain Europe US$38,069 1 May 2010 84,407 5,256 62
Bangkok Thailand Southeast Asia US$23,309 1 January 2015 294,462 14,011 48
Wuhan China East Asia and the Pacific
US$17,783 1 September 2013
183,723 8,174 44
Minneapolis United States North America US$59,082 1 October 2014 251,256 2,627 10
Table 2 Basic data on the 10 representative cities, arranged by their urban density, from the highest (Dhaka) to the lowest (Minneapolis).
METRIC DEFINITION
Urban footprint Total contiguous built-up area of the city and its urbanized open space
Total population Total population residing within the urban footprint
Residential share Share of the urban footprint occupied by residential buildings/plots
Plot coverage Share of the total area of residential plots occupied by residential buildings
Building height Average number of residential floors on a unit area of a residential building footprint
Floor plan efficiency Average share of the gross residential floor area allocated to living areas in dwelling units
Occupancy rate Share of the total number of dwelling units that are occupied
Persons per dwelling unit Average number of persons per dwelling unit in the city
Table 3 Eight metrics that need to be obtained in a city to calculate urban density and all its factors and their definitions.

273Angel et al. Buildings and Cities DOI: 10.5334/bc.91
Residential share, plot coverage and building height estimates were obtained from Google Earth and Bing satellite imagery using an intra-urban spatial sampling methodology that identified a set of quasi-random points within the urban extent at a desired point density based on a Halton sequence (Halton 1964). This technique, developed for the Atlas of Urban Expansion (Angel et al. 2016) facilitates the collection of samples within a geographic area, permitting statistical analysis of the results. Trained image analysts assessed each point sample and conducted digitization work using the satellite imagery, based on techniques akin to aerial image analysis. The specific digitization rules used in this research are novel and offer a new and low-cost way to gather data in cities. For each of the sampled measurements, a running average was calculated after the fact to check that sufficient samples had been collected to stabilize the average.
Residential share was measured by determining for each point in the Halton sequence whether the land use at that point was ‘residential’ or ‘non-residential’ and calculating the residential share.9 More than 2000 points were sampled in each city.
Building height was estimated by counting residential floors in the nearest residential building to a Halton point identified as ‘residential’ earlier. Each building was placed in a typology: (1) single family; (2) non-core multi-family; and (3) core multi-family, where core buildings were defined as having centralized elevator shafts and stairwells. Analysts then counted the stories of that building, excluding floors that were identifiable non-residential uses (such as stores or parking).10 Building heights were gathered for an average of 1500 buildings in each of the 10 pilot cities.
Plot coverage was estimated by digitizing the boundaries of the blocks surrounding the first few hundred sampled points identified as ‘residential.’ These boundaries could be streets surrounding residential city blocks or intra-block boundaries between ‘residential’ and ‘non-residential’ land uses. The footprints of all residential buildings within a bounded area defined as ‘residential’ were digitized and their total area was calculated. An average of 460 residential blocks was digitized in each of the 10 pilot cities.
Occupancy rate, floorplan efficiency and persons per dwelling unit were collected from secondary sources.
The occupancy rate of residential units was estimated using three methods, reflecting different levels of data availability. (1) For Cairo, Madrid and Minneapolis national census data provided the occupancy rate directly. (2) For Bangkok, Bogotá, Dhaka, and Hong Kong the census provided ‘households sharing the same housing unit’ and ‘total number of domestic households’ for the city. The former was subtracted from the latter, yielding the number of occupied units (with the assumption that every household occupied a single unit). (3) For Baku, Kinshasa, and Wuhan the same arithmetic was used as in (2), but the total number of dwelling units was calculated by dividing the total square meters of residential floor space in the city by the average dwelling unit size, estimated by multiplying floor area per person and average household size.
Estimating floor plan efficiency required examining architectural drawings of buildings of varying sizes and heights, grouped by the building typology identified earlier.11 Data gathering for this metric was preliminary and consisted of collecting and digitizing approximately 50 floor plans to estimate the share of the gross floor area of residential buildings devoted to dwelling units, net of wall thicknesses, lobbies, elevator shafts, stairwells, and mechanical spaces.
Persons per dwelling unit was typically calculated from national census data using the total population and total number of dwelling units. In some countries it was only available inferentially. In Azerbaijan, for example, the census provided the total residential floorspace in Baku, average square meters per person, and average household size, from which the total number of dwelling units was estimated. The urban extent of the cities used by the respective censuses to collect this information did not usually correspond exactly to the urban footprint of the city. We adopted the empirical value for persons per dwelling unit calculated from census data for the urban footprint as a whole, assuming that it did not vary appreciably from this empirical value.
274Angel et al. Buildings and Cities DOI: 10.5334/bc.91
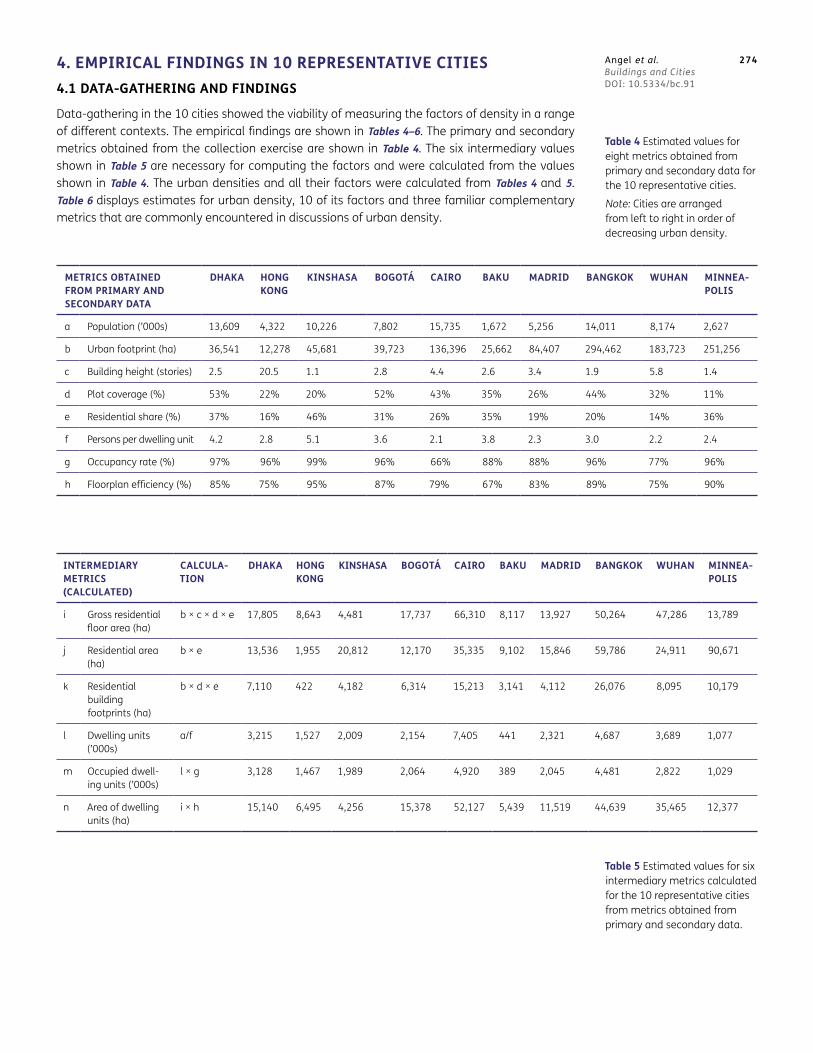
4. EMPIRICAL FINDINGS IN 10 REPRESENTATIVE CITIES4.1 DATA-GATHERING AND FINDINGS
Data-gathering in the 10 cities showed the viability of measuring the factors of density in a range of different contexts. The empirical findings are shown in Tables 4–6. The primary and secondary metrics obtained from the collection exercise are shown in Table 4. The six intermediary values shown in Table 5 are necessary for computing the factors and were calculated from the values shown in Table 4. The urban densities and all their factors were calculated from Tables 4 and 5. Table 6 displays estimates for urban density, 10 of its factors and three familiar complementary metrics that are commonly encountered in discussions of urban density.
METRICS OBTAINED FROM PRIMARY AND SECONDARY DATA
DHAKA HONG KONG
KINSHASA BOGOTÁ CAIRO BAKU MADRID BANGKOK WUHAN MINNEA-POLIS
a Population (’000s) 13,609 4,322 10,226 7,802 15,735 1,672 5,256 14,011 8,174 2,627
b Urban footprint (ha) 36,541 12,278 45,681 39,723 136,396 25,662 84,407 294,462 183,723 251,256
c Building height (stories) 2.5 20.5 1.1 2.8 4.4 2.6 3.4 1.9 5.8 1.4
d Plot coverage (%) 53% 22% 20% 52% 43% 35% 26% 44% 32% 11%
e Residential share (%) 37% 16% 46% 31% 26% 35% 19% 20% 14% 36%
f Persons per dwelling unit 4.2 2.8 5.1 3.6 2.1 3.8 2.3 3.0 2.2 2.4
g Occupancy rate (%) 97% 96% 99% 96% 66% 88% 88% 96% 77% 96%
h Floorplan efficiency (%) 85% 75% 95% 87% 79% 67% 83% 89% 75% 90%
Table 4 Estimated values for eight metrics obtained from primary and secondary data for the 10 representative cities.
Note: Cities are arranged from left to right in order of decreasing urban density.
INTERMEDIARY METRICS (CALCULATED)
CALCULA-TION
DHAKA HONG KONG
KINSHASA BOGOTÁ CAIRO BAKU MADRID BANGKOK WUHAN MINNEA- POLIS
i Gross residential floor area (ha)
b × c × d × e 17,805 8,643 4,481 17,737 66,310 8,117 13,927 50,264 47,286 13,789
j Residential area (ha)
b × e 13,536 1,955 20,812 12,170 35,335 9,102 15,846 59,786 24,911 90,671
k Residential building footprints (ha)
b × d × e 7,110 422 4,182 6,314 15,213 3,141 4,112 26,076 8,095 10,179
l Dwelling units (’000s)
a/f 3,215 1,527 2,009 2,154 7,405 441 2,321 4,687 3,689 1,077
m Occupied dwell-ing units (’000s)
l × g 3,128 1,467 1,989 2,064 4,920 389 2,045 4,481 2,822 1,029
n Area of dwelling units (ha)
i × h 15,140 6,495 4,256 15,378 52,127 5,439 11,519 44,639 35,465 12,377
Table 5 Estimated values for six intermediary metrics calculated for the 10 representative cities from metrics obtained from primary and secondary data.

4.2 IMPLICATIONS OF FINDINGS
The empirical results for the set of representative cities presented here are purely descriptive and cannot be extrapolated to the universe of cities. However, the results are internally valid and reveal large variations in the metrics that are not necessarily correlated with overall urban density. At a minimum, these findings show the value of decomposing density into its constituent factors by confirming the assertion that comparisons of urban density as a composite indicator may hide more than they reveal. They also show that different cities obtain their density from quite different combinations of factors.
The former point is illustrated by graphs showing the variations in urban density, floorspace occupancy, floor area density and floor area per person (the reciprocal of floorspace occupancy) in the 10 representative cities (Figure 2). The cities in Table 6 and in Figures 2 and 3 are arranged in order of declining urban density: from Dhaka, with an urban density of 372 persons/ha, to Minneapolis, with 10 persons/ha.
URBAN DENSITY AND ITS FACTORS
CALCULA-TION
DHAKA HONG KONG
KINSHASA BOGOTÁ CAIRO BAKU MADRID BANGKOK WUHAN MINNEA-POLIS
o Urban density (persons/ha)
a/b 372 352 224 196 115 65 62 48 44 10
p Floorspace occupancy (persons/ha)
a/i 764 500 2,282 440 237 206 377 279 173 191
q Floor area density
i/b 0.5 0.7 0.1 0.4 0.5 0.3 0.2 0.2 0.3 0.1
r Floor area ratio i/j 1.3 4.4 0.2 1.5 1.9 0.9 0.9 0.8 1.9 0.2
e Residential share (%)
e 37% 16% 46% 31% 26% 35% 19% 20% 14% 36%
c Building height (stories)
c 2.5 20.5 1.1 2.8 4.4 2.6 3.4 1.9 5.8 1.4
d Plot coverage (%) d 53% 22% 20% 52% 43% 35% 26% 44% 32% 11%
s Dwelling unit occupancy (persons/occupied dwelling unit)
a/m 4.4 2.9 5.1 3.8 3.2 4.3 2.6 3.1 2.9 2.6
g Occupancy rate (%)
g 97% 96% 99% 96% 66% 88% 88% 96% 77% 96%
t Dwelling unit packing (dwelling unit/ha)
l/n 212 235 472 140 142 81 201 105 104 87
h Floorplan efficiency (%)
h 85% 75% 95% 87% 79% 67% 83% 89% 75% 90%
COMPLEMENTARY METRICS
u * Floor area per person (m2) [reciprocal of p]
1/p 13 20 4 23 42 49 26 36 58 52
v * Dwelling unit size (m2) [reciprocal of t]
1/t 47 43 21 71 70 123 50 95 96 115
w * Occupied floor area per person (m2)
v/s 11 14 4 19 22 29 19 30 33 45
Table 6 Estimated urban densities and their factors calculated for the 10 representative cities from metrics obtained from data presented in Tables 4 and 5.
Note: The column labeled ‘Calculation’ indicates how the values were computed from the values given in Tables 4 and 5.

276Angel et al. Buildings and Cities DOI: 10.5334/bc.91
Figure 2 shows very weak correlations between urban density and its factors: as expected, urban density tended to be higher in cities with higher floor area density and floorspace occupancy and lower in cities with higher floor area per person. But exceptions abound: floor area density was higher in Hong Kong than in Dhaka, even though its overall urban density is lower; Cairo’s floor area density was equal to that of Dhaka, even though its urban density was only the fifth highest in the group; and Kinshasa’s floor area density was the second lowest in the group, even though its urban density was the third highest, and floorspace occupancy was highest in Kinshasa even though its urban density was only the third highest in the group.
The latter point—that different cities obtain their density from combinations of different factors—is illustrated in the subsequent section.
4.4 REPRESENTING URBAN DENSITY IN THREE DIMENSIONS
Section 2.2 focused on urban density as a product of seven factors, an approach that—while yielding a great deal of useful data—is not intuitive or easy to visualize. A simpler way to understand urban density as a product of factors is to focus on the three factors introduced in section 2.1:
Floorspace occupancy × floor area ratio × residential share = urban density (6)
Perceiving urban density as a product of three factors as shown above makes it possible to represent it as a box in three-dimensional space. As before, a given urban density offers no hints as to which factor is responsible for it being high or low; but representing urban density as a box for each of the 10 cities begins to reveal its basic anatomy (Figure 3). Floorspace occupancy is measured on the x-axis; residential share is measured on the y-axis; and floor area ratio is measured on the
Figure 2: Observed variations in urban density, floorspace occupancy, floor area density and floor area per person in the 10 representative cities.
277Angel et al. Buildings and Cities DOI: 10.5334/bc.91
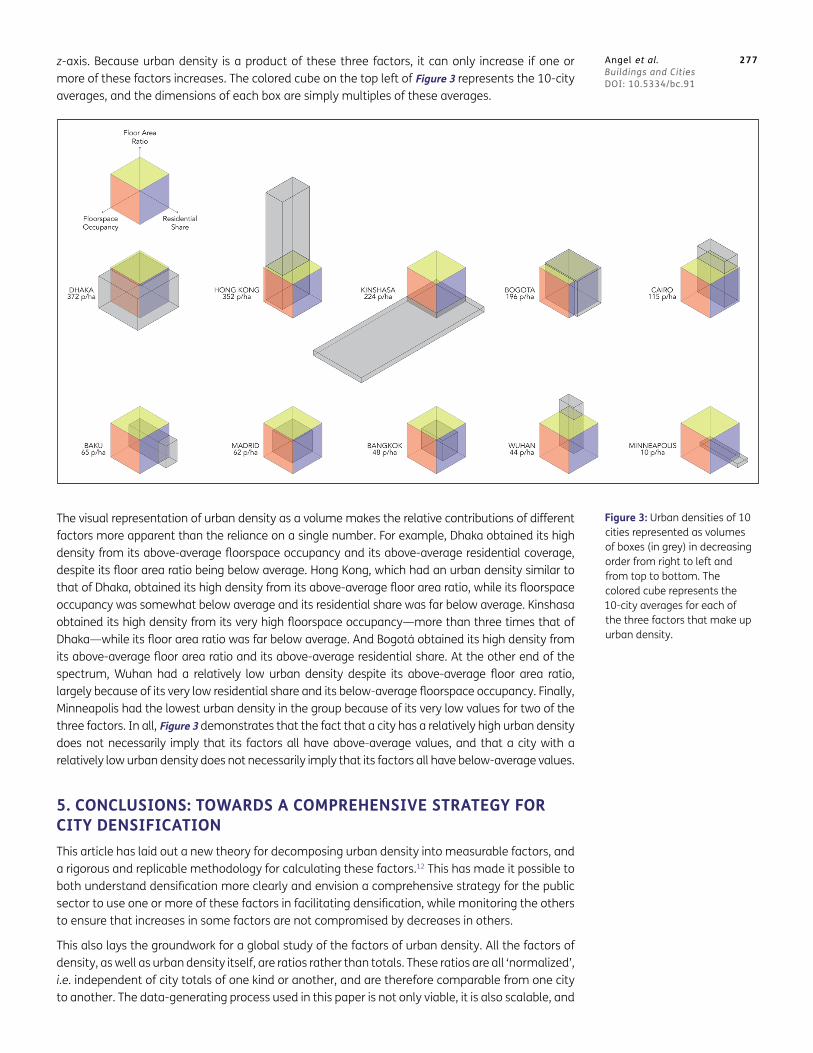
z-axis. Because urban density is a product of these three factors, it can only increase if one or more of these factors increases. The colored cube on the top left of Figure 3 represents the 10-city averages, and the dimensions of each box are simply multiples of these averages.
The visual representation of urban density as a volume makes the relative contributions of different factors more apparent than the reliance on a single number. For example, Dhaka obtained its high density from its above-average floorspace occupancy and its above-average residential coverage, despite its floor area ratio being below average. Hong Kong, which had an urban density similar to that of Dhaka, obtained its high density from its above-average floor area ratio, while its floorspace occupancy was somewhat below average and its residential share was far below average. Kinshasa obtained its high density from its very high floorspace occupancy—more than three times that of Dhaka—while its floor area ratio was far below average. And Bogotá obtained its high density from its above-average floor area ratio and its above-average residential share. At the other end of the spectrum, Wuhan had a relatively low urban density despite its above-average floor area ratio, largely because of its very low residential share and its below-average floorspace occupancy. Finally, Minneapolis had the lowest urban density in the group because of its very low values for two of the three factors. In all, Figure 3 demonstrates that the fact that a city has a relatively high urban density does not necessarily imply that its factors all have above-average values, and that a city with a relatively low urban density does not necessarily imply that its factors all have below-average values.
5. CONCLUSIONS: TOWARDS A COMPREHENSIVE STRATEGY FOR CITY DENSIFICATIONThis article has laid out a new theory for decomposing urban density into measurable factors, and a rigorous and replicable methodology for calculating these factors.12 This has made it possible to both understand densification more clearly and envision a comprehensive strategy for the public sector to use one or more of these factors in facilitating densification, while monitoring the others to ensure that increases in some factors are not compromised by decreases in others.
This also lays the groundwork for a global study of the factors of urban density. All the factors of density, as well as urban density itself, are ratios rather than totals. These ratios are all ‘normalized’, i.e. independent of city totals of one kind or another, and are therefore comparable from one city to another. The data-generating process used in this paper is not only viable, it is also scalable, and
Figure 3: Urban densities of 10 cities represented as volumes of boxes (in grey) in decreasing order from right to left and from top to bottom. The colored cube represents the 10-city averages for each of the three factors that make up urban density.

278Angel et al. Buildings and Cities DOI: 10.5334/bc.91
we believe it would be possible to obtain rigorous and externally valid results for the universe of all 4,231 cities and metropolitan areas with populations over 100,000 in 2010.
Such results would advance the study of urban density by providing statistically valid data and internationally comparable data that could be used for hypothesis testing. This work will require an investment of resources, but recent developments in machine learning and the increased availability of large geospatial data sets both promise to reduce projected costs appreciably.
The results of such an exercise would also support planning practice by establishing the distribution of values for different factors, helping to calibrate the expectations of cities seeking to densify through one technique or another.
The true value of the methodology will come with further study of the relationships between the factors. Section 2 established the mathematical relationship between the different factors of urban density, with implications for practice that become evident with the data in hand: policies that seek to increase urban density by focusing on one of the factors, such as floor area density, must also be assessed in terms of their relationship with all of the other factors in order to be effective. For instance, a policy to increase dwelling unit packing without maintaining the occupancy rate and dwelling unit occupancy (which would only be possible with an increase in the population and number of households) would produce a neutral result at great cost.
Such an approach could plausibly be applied in a decision-making context to reduce or eliminate these sorts of errors. This fresh look at the anatomy of density affords an opportunity to reconsider plans for cities—and, where appropriate, higher levels of government as well—to establish attainable and measurable densification goals for each factor. This is indeed a challenge, and an effective densification strategy could gain support by joining with existing agendas that seek to minimize greenhouse gas emissions, preserve the countryside, address inequality and promote affordable housing.
Urban planners are experts in understanding the practical difficulties of densification: the cultural and political barriers, the difficulties in revising the regulatory framework, and the budget available for implementation. These are unique to every city and cannot be determined in advance. This paper and the theory of the anatomy of density that it introduces helps urban planners and city leaders retain urban density as the key metric for measuring densification by providing the necessary framework to expose the vital information that urban density contains. The simplicity and transparency of this approach helps distinguish between effective and ineffective policies for densification, providing a way for cities to take rapid and meaningful action on this critical issue in the years to come.
NOTES1 Bourne (2001) notes that a single focus on residential densities, as do all but the last
four metrics in Table 1, may fail to account for the effect of low-density commercial and industrial uses on the overall compactness of cities, particularly where sustainability issues are concerned. Indeed, since population data are collected at people’s homes, urban density as defined here is a night-time density, i.e. a residential density rather than an employment density. But as we shall show, overall urban density can increase if the residential share of land use in the city increases at the expense of commercial and industrial uses, i.e. when overall employment density increases. Urban density thus includes employment density.
2 We note at the outset that an ‘average’ ratio of two quantities can have two distinct meanings (The Math Forum 2003). For example, the ‘average building height’ in a city, measured in floors, could be the ratio of the total floor area in the city and the total area of building footprints in the city. Alternatively, it could be the ‘average (or mean) height of individual buildings in the city, which would be the sum of the heights of individual buildings (which are the ratios of their floor areas and building footprints) divided by the total number of buildings. In this paper, all the averages of the factors that constitute urban density are defined as the ratio of sums and not as means of individual observations.

279Angel et al. Buildings and Cities DOI: 10.5334/bc.91
3 For a detailed definition of the urban footprint and the method of mapping and calculating urban footprints using Landsat satellite imagery, see Angel et al. (2016: 21–30).
4 For example, stairwells, corridors and elevator shafts.
5 The product of floorspace occupancy and floor area ratio yields the familiar ‘net residential density,’ a common measure of the average number of people in a hectare of net residential area in the city.
6 An important measure of residential overcrowding (e.g. Gove et al. 1983; Blake et al. 2007; Dol & Haffner 2010: 51, tab. 2.1), ‘occupied floor area per person’ is simply the ratio of dwelling unit size and dwelling unit occupancy, but only if we assume that the size of occupied and unoccupied dwelling units is the same:
Occupied floor area per person = dwelling unit size/dwelling unit occupancy = (total living area in occupied dwelling units/total number of occupied dwelling units)/(total population/total number of occupied dwelling units) = total living area in occupied dwelling units/total population. (13)
If, as we suspect, the average size of unoccupied dwelling units is larger than the average size of occupied dwelling units, then a correct estimate of occupied floor area per person may be smaller than that estimated here.
7 We classified the Landsat imagery into built-up and non-built-up pixels. We then classified the built-up pixels into urban, suburban or rural ones, based on the shares of built-up pixels within a 1 km2 walking distance circle around them: Those with <25% were classified as rural; those with 25–50% were classified as suburban; and those with ≥50% were classified as urban. We created urban clusters by grouping contiguous urban and suburban pixels. We included fringe open spaces that were within 100 m of them, and captured open spaces that were fully enclosed by urban and suburban pixels and fringe open spaces, and were <200 ha in area in urban clusters. Urban clusters that shared buffers surrounding them equal to one-quarter of their area were then combined to form the city’s urban footprint (Figure 3).
8 Each census enumeration district contains built-up pixels and the population within each enumeration district is assumed to be living within those built-up pixels. It is further assumed that the population is equally divided among those built-up pixels. Only the portion of the population living in pixels that fall within the urban footprint, as defined above, is counted in the population of the city.
9 This classification was based on a taxonomy developed for Angel et al. (2016). A point that fell on a plot or a building with mixed land use, including residential use, was considered to be ‘residential.’ Residential share was estimated as the share of ‘residential’ points in the total number of points sampled.
10 In the majority of cases, it was possible to count the number of floors in high-resolution satellite imagery or Google Street View based on window openings and balconies. Occasionally, the number of floors in a building in our sample was estimated by comparing it with an adjacent building of similar height with visible windows, or by comparing the length its shadow with that of buildings with visible windows.
11 For each architectural floor plan, analysts distinguish living and non-living areas, with areas that are exclusively within a private dwelling unit categorized as ‘living areas.’ The average ratio of living area to total floor area was calculated for each building type, and then a weighted average ratio was calculated for each city based on the mix of building types identified in the building height measurement.
12 The simplicity and rigor of the proposed methodology has made it easy to replicate. For a recent report on the replication of this methodology for factoring urban density in 10 Japanese cities, see Narro et al. (2020).

280Angel et al. Buildings and Cities DOI: 10.5334/bc.91
ACKNOWLEDGEMENTSThe authors wish to acknowledge Priam Pillai, Suman Kumar and Sharad Shingade of Mahatma Education Society and Valectus Ltd, and Manuel Madrid of gvSIG Association for their contributions to the measurement of the factors of density.
AUTHOR AFFILIATIONSShlomo Angel orcid.org/0000-0002-8478-015XMarron Institute of Urban Management, New York University, New York, NY, US
Patrick Lamson-Hall orcid.org/0000-0002-4573-9568Marron Institute of Urban Management, New York University, New York, NY, US
Zeltia Gonzalez Blanco orcid.org/0000-0003-1830-0514Marron Institute of Urban Management, New York University, New York, NY, US
COMPETING INTERESTSThe authors have no competing interests to declare.
DATA AVAILABILITYThe data sets generated during and/or analysed in the current study are available from the corresponding author on reasonable request.
FUNDINGThis research received no specific grant from any funding agency in the public, commercial or not-for-profit sectors.
SUPPLEMENTAL DATASupplemental data for this article can be accessed at: https://doi.org/10.5334/bc.91.s1
REFERENCESAlexander, E. R. (1993). Density measures: A review and analysis. Journal of Architectural and Planning
Research, 10(3), 181–202. https://www.jstor.org/stable/43028746?seq=1#metadata_info_tab_contentsAngel, S., & Blei, A. M. (2020). Why pandemics, such as COVID-19, require a metropolitan response (SSRN
Working Paper, October). DOI: https://doi.org/10.2139/ssrn.3714883Angel, S., Blei, A. M., Lamson-Hall, P., Galarza Sanchez, N., Parent, J., & Civco, D. L. (2016). Atlas of urban
expansion—2016 Edition. Lincoln Institute of Land Policy.
ASPO. (1958). Floor area ratio (Planning Advisory Service Information Report No. 111, June). American Society
of Planning Officials (ASPO). https://www.planning.org/pas/reports/report111.htmBanai, R., & DePriest, T. (2014). Urban sprawl: Definitions, data, methods of measurement, and
environmental consequences. Journal of Sustainability Education, 7(December). http://www.jsedimensions.org/wordpress/wp-content/uploads/2014/12/Banai-DePriest-JSE-Vol-7-Dec-2014.pdf
Barton, J. (2014). The economics of building tall: New London architecture. http://legacy.newlondonarchitecture.org/docs/james_barton_-_aecom.pdf
Bertaud, A., & Brueckner, J. K. (2005). Analyzing building-height restrictions: Predicted impacts and
welfare costs. Regional Science and Urban Economics, 35, 109–125. DOI: https://doi.org/10.1016/j.regsciurbeco.2004.02.004
Blake, K. S., Kellerson, R. L., & Simic, A. (2007). Measuring overcrowding in housing (Prepared for the
US Department of Housing and Urban Development Office of Policy Development and Research,
September). https://www.huduser.gov/publications/pdf/measuring_overcrowding_in_hsg.pdfBourne, L. S. (2001). The urban sprawl debate: Myths, realities, and hidden agendas. Plan Canada, 41(4),
26–30. https://utahforresponsiblegrowth.org/pdf/urban_sprawl_debate.pdf

281Angel et al. Buildings and Cities DOI: 10.5334/bc.91
Boyko, C. T., & Cooper, R. (2011). Clarifying and re-conceptualising density. Progress in Planning, 76(1), 1–61.
DOI: https://doi.org/10.1016/j.progress.2011.07.001Burton, E. (2001, April). The compact city and social justice. Paper presented at the Housing Studies
Association Spring Conference, Housing, Environment and Sustainability, University of York, UK. http://www.china-up.com:8080/international/special/pdf/8.pdf
Churchman, A. (1999). Disentangling the concept of density. Journal of Planning Literature, 13(4), 389–411.
DOI: https://doi.org/10.1177/08854129922092478Dol, K., & Haffner, M. (Eds.). (2010). Housing statistics in the European Union (September). OTB Research
Institute for the Built Environment, Delft University of Technology, and Ministry of the Interior and
Kingdom Relations. http://www.hofinet.org/upload_docs/UPLOADED_housing_statistics_in_the_european_union_2010.pdf
Dovey, K., & Pafka, E. (2016). Urban density matters—But what does it actually mean? City Metric, July.
https://www.citymetric.com/fabric/urban-density-matters-what-does-it-actually-mean-2118Eldridge, N. (1984). Population density: The choice of gross or net residential area. Urban Policy and Research,
2(1), 23–26. https://www.tandfonline.com/doi/abs/10.1080/08111148408522642. DOI: https://doi.org/10.1080/08111148408522642
Forsyth, A. (2003). Measuring density: Working definitions for residential density and building intensity (Design
Brief No. 8, July). Design Center for American Urban Landscape. http://annforsyth.net/wp-content/uploads/2018/05/db9.pdf
Frenkel, A., & Ashkenazi, M. (2008). Measuring urban sprawl: How can we deal with it? Environment and
Planning B: Planning and Design, 35: 56–79. https://www.researchgate.net/publication/23541654_Measuring_urban_sprawl_How_can_we_deal_with_it. DOI: https://doi.org/10.1068/b32155
Galster, G., Hanson, R., Ratcliffe, M. R., Wolman, H., Coleman, S., & Freihage, J. (2001). Wrestling sprawl to
the ground: Defining and measuring an elusive concept. Housing Policy Debate, 12(4): 681–717. http://www.gulfofmaine.org/2/wp-content/uploads/2014/03/Wrestling-Sprawl-to-the-Ground-Defining-and-Measuring-an-Elusive-Concept.pdf. DOI: https://doi.org/10.1080/10511482.2001.9521426
Gove, W. R., Hughes, M., & Galle, O. R. (1983). Overcrowding in the household: An analysis of determinants
and effects. Academic Press.
Grebler, L. (1951). The housing inventory: Analytic concept and quantitative change. American Economic
Review, 41(2), 555–568.
Halton, J. (1964). Algorithm 247: Radical-inverse quasi-random point sequence. Communications of the
Association for Computing Machinery, 7, 701–702. DOI: https://doi.org/10.1145/355588.365104James, J. R. (1967). Residential densities and housing layouts. Town and Country Planning, 35(11), 552–561.
Keys, E., Wentz, E. A., & Redman, C. L. (2007). The spatial structure of land use from 1970–2000 in the
Phoenix, Arizona, metropolitan area. Professional Geographer, 59(1), 131–147. https://www.researchgate.net/publication/227641626_The_Spatial_Structure_of_Land_Use_from_1970-2000_in_the_Phoenix_Arizona_Metropolitan_Area. DOI: https://doi.org/10.1111/j.1467-9272.2007.00596.x
Kogo, T., Kaneko, T., & Morisugi, H. (2010). Necessity of minimum floor area ratio regulation: A second-best
policy. Annals of Regional Science, 44, 523–539. https://www.researchgate.net/publication/225799109_Necessity_of_minimum_floor_area_ratio_regulation_A_second-best_policy. DOI: https://doi.org/10.1007/s00168-008-0269-0
Krehl, A., Siedentop, S., Taubenböck, H., & Wurm, M. (2016). A comprehensive view on urban spatial
structure: Urban density patterns of German city regions. ISPRS International Journal of Geo-Information,
5(6), 76. DOI: https://doi.org/10.3390/ijgi5060076McDonald, J. F., & McMillen, D. P. (2010). Urban economics and real estate: Theory and policy, 2nd edn. Wiley.
Narro, D., Ricardo, A., & Katafuchi, Y. (2020). Decomposition of density into their components: Analysis for the
case of Japan (Paper No. 100322, May). MPRA.
OECD. (2012). Compact city policies: A comparative assessment (OECD Green Growth Studies). Organisation
for Economic Co-operation and Development (OECD) Publ.
OECD. (2018). Rethinking urban sprawl: Moving toward sustainable cities. Organisation for Economic
Co-operation and Development (OECD) Publ. DOI: https://doi.org/10.1787/9789264189881-enOpoku, A. (2016, September). SDG2030: A sustainable built environment’s role in achieving the post-2015
United Nations Sustainable Development Goals. In Proceedings of the 32nd Annual ARCOM Conference, 2,
1149–1158. Association of Researchers in Construction Management.
Perez, Y., Avault, J., & Vrabel, J. (2004). Residential land use in Boston (Research Department Report No. 592,
March). Boston Redevelopment Authority. http://www.bostonplans.org/getattachment/62f2b1bf-c8b3-434b-89e4-ea8f5c8508b4
The Math Forum. (2003, October 24). Average of ratios vs. ratio of averages. The Math Forum. http://mathforum.org/library/drmath/view/64391.html

282Angel et al. Buildings and Cities DOI: 10.5334/bc.91
TO CITE THIS ARTICLE:Angel, S., Lamson-Hall, P., & Blanco, Z. G. (2021). Anatomy of density: measurable factors that constitute urban density. Buildings and Cities, 2(1), pp. 264–282. DOI: https://doi.org/10.5334/bc.91
Submitted: 18 December 2020 Accepted: 16 February 2021 Published: 23 March 2021
COPYRIGHT:© 2021 The Author(s). This is an open-access article distributed under the terms of the Creative Commons Attribution 4.0 International License (CC-BY 4.0), which permits unrestricted use, distribution, and reproduction in any medium, provided the original author and source are credited. See http://creativecommons.org/licenses/by/4.0/.
Buildings and Cities is a peer-reviewed open access journal published by Ubiquity Press.
US Census Bureau. (1950). U.S. Census of population: 1950, Volume III: Census Tract Statistics. US Census
Bureau. https://www.census.gov/library/publications/1953/dec/population-vol-03.htmlUN-Habitat. (1996). An urbanizing world: Global report on human settlements. Oxford University Press. United
Nations Centre for Human Settlements (UN-Habitat).
WHO. (2009). Overcrowding. In Children’s environmental health indicators. World Health Organization (WHO).
https://www.who.int/ceh/indicators/overcrowding.pdf


![DENJOY, DEMUTH, AND DENSITY - UW-Madison ...jmiller/Papers/DDD.pdfout by T. Tao in his blog [43], the Lebesgue density theorem implies that general measurable sets behave similarly](https://static.fdocuments.net/doc/165x107/5ccea4cf88c99385278d26c6/denjoy-demuth-and-density-uw-madison-jmillerpapersdddpdfout-by-t-tao.jpg)