Anatomy of a Paroxysmal Lava Fountain at Etna Volcano: The ...
23
remote sensing Article Anatomy of a Paroxysmal Lava Fountain at Etna Volcano: The Case of the 12 March 2021, Episode Sonia Calvari * , Alessandro Bonaccorso and Gaetana Ganci Citation: Calvari, S.; Bonaccorso, A.; Ganci, G. Anatomy of a Paroxysmal Lava Fountain at Etna Volcano: The Case of the 12 March 2021, Episode. Remote Sens. 2021, 13, 3052. https:// doi.org/10.3390/rs13153052 Academic Editor: Andrew McGonigle Received: 14 June 2021 Accepted: 30 July 2021 Published: 3 August 2021 Publisher’s Note: MDPI stays neutral with regard to jurisdictional claims in published maps and institutional affil- iations. Copyright: © 2021 by the authors. Licensee MDPI, Basel, Switzerland. This article is an open access article distributed under the terms and conditions of the Creative Commons Attribution (CC BY) license (https:// creativecommons.org/licenses/by/ 4.0/). Istituto Nazionale di Geofisica e Vulcanologia, Osservatorio Etneo-Sezione di Catania, 95125 Catania, Italy; [email protected] (A.B.); [email protected] (G.G.) * Correspondence: [email protected] Abstract: On 13 December 2020, Etna volcano entered a new eruptive phase, giving rise to a number of paroxysmal episodes involving increased Strombolian activity from the summit craters, lava fountains feeding several-km high eruptive columns and ash plumes, as well as lava flows. As of 2 August 2021, 57 such episodes have occurred in 2021, all of them from the New Southeast Crater (NSEC). Each paroxysmal episode lasted a few hours and was sometimes preceded (but more often followed) by lava flow output from the crater rim lasting a few hours. In this paper, we use remote sensing data from the ground and satellite, integrated with ground deformation data recorded by a high precision borehole strainmeter to characterize the 12 March 2021 eruptive episode, which was one of the most powerful (and best recorded) among that occurred since 13 December 2020. We describe the formation and growth of the lava fountains, and the way they feed the eruptive column and the ash plume, using data gathered from the INGV visible and thermal camera monitor- ing network, compared with satellite images. We show the growth of the lava flow field associated with the explosive phase obtained from a fixed thermal monitoring camera. We estimate the erupted volume of pyroclasts from the heights of the lava fountains measured by the cameras, and the erupted lava flow volume from the satellite-derived radiant heat flux. We compare all erupted volumes (pyro- clasts plus lava flows) with the total erupted volume inferred from the volcano deflation recorded by the borehole strainmeter, obtaining a total erupted volume of ~3 × 10 6 m 3 of magma constrained by the strainmeter. This volume comprises ~1.6 × 10 6 m 3 of pyroclasts erupted during the lava fountain and 2.4 × 10 6 m 3 of lava flow, with ~30% of the erupted pyroclasts being remobilized as rootless lava to feed the lava flows. The episode lasted 130 min and resulted in an eruption rate of ~385 m 3 s -1 and caused the formation of an ash plume rising from the margins of the lava fountain that rose up to 12.6 km a.s.l. in ~1 h. The maximum elevation of the ash plume was well constrained by an empirical formula that can be used for prompt hazard assessment. Keywords: Etna volcano; paroxysmal explosive and effusive episodes; ash plume; remote sensing; volcano monitoring; volcanic hazard 1. Introduction Explosive eruptions of mafic magmas produce lava fountains whose heights de- pend on the exsolved volatile content of the magma, its erupted mass flux, and the ge- ometry of the vent, either an elongated eruptive fissure or a near circular conduit [1]. Lava fountains were typical at Kilauea volcano during the 1959–1960, 1969–1970, and 1983–2008 eruptions [2–5], being characterized by vertical jets of gas and incandescent pyroclasts rising several hundred meters above the vent. This activity is also common at Etna volcano, with several such explosive phases occurring in 2000 [6–8], 2001, 2002– 2003 [9–11], and in 2011–2015 [12–16]. The last paroxysmal lava fountain sequence started on 13 December 2020, and is still going on as of 2 August 2021. A recent study, based on a catalogue of the explosive paroxysmal episodes that occurred at Etna since 1986 (and updated to 1 April 2021), showed a general marked increase in the release of seismic energy Remote Sens. 2021, 13, 3052. https://doi.org/10.3390/rs13153052 https://www.mdpi.com/journal/remotesensing
Transcript of Anatomy of a Paroxysmal Lava Fountain at Etna Volcano: The ...
remote sensing
Article
Anatomy of a Paroxysmal Lava Fountain at EtnaVolcano: The Case of the 12 March 2021, Episode
Sonia Calvari * , Alessandro Bonaccorso and Gaetana Ganci
�����������������
Citation: Calvari, S.; Bonaccorso, A.;
Ganci, G. Anatomy of a Paroxysmal
Lava Fountain at Etna Volcano: The
Case of the 12 March 2021, Episode.
Remote Sens. 2021, 13, 3052. https://
doi.org/10.3390/rs13153052
Academic Editor: Andrew McGonigle
Received: 14 June 2021
Accepted: 30 July 2021
Published: 3 August 2021
Publisher’s Note: MDPI stays neutral
with regard to jurisdictional claims in
published maps and institutional affil-
iations.
Copyright: © 2021 by the authors.
Licensee MDPI, Basel, Switzerland.
This article is an open access article
distributed under the terms and
conditions of the Creative Commons
Attribution (CC BY) license (https://
creativecommons.org/licenses/by/
4.0/).
Istituto Nazionale di Geofisica e Vulcanologia, Osservatorio Etneo-Sezione di Catania, 95125 Catania, Italy;[email protected] (A.B.); [email protected] (G.G.)* Correspondence: [email protected]
Abstract: On 13 December 2020, Etna volcano entered a new eruptive phase, giving rise to a numberof paroxysmal episodes involving increased Strombolian activity from the summit craters, lavafountains feeding several-km high eruptive columns and ash plumes, as well as lava flows. As of 2August 2021, 57 such episodes have occurred in 2021, all of them from the New Southeast Crater(NSEC). Each paroxysmal episode lasted a few hours and was sometimes preceded (but more oftenfollowed) by lava flow output from the crater rim lasting a few hours. In this paper, we use remotesensing data from the ground and satellite, integrated with ground deformation data recorded bya high precision borehole strainmeter to characterize the 12 March 2021 eruptive episode, whichwas one of the most powerful (and best recorded) among that occurred since 13 December 2020.We describe the formation and growth of the lava fountains, and the way they feed the eruptivecolumn and the ash plume, using data gathered from the INGV visible and thermal camera monitor-ing network, compared with satellite images. We show the growth of the lava flow field associatedwith the explosive phase obtained from a fixed thermal monitoring camera. We estimate the eruptedvolume of pyroclasts from the heights of the lava fountains measured by the cameras, and the eruptedlava flow volume from the satellite-derived radiant heat flux. We compare all erupted volumes (pyro-clasts plus lava flows) with the total erupted volume inferred from the volcano deflation recorded bythe borehole strainmeter, obtaining a total erupted volume of ~3 × 10⁶ m3 of magma constrained bythe strainmeter. This volume comprises ~1.6 × 10⁶ m3 of pyroclasts erupted during the lava fountainand 2.4 × 10⁶ m3 of lava flow, with ~30% of the erupted pyroclasts being remobilized as rootlesslava to feed the lava flows. The episode lasted 130 min and resulted in an eruption rate of ~385 m3
s−1 and caused the formation of an ash plume rising from the margins of the lava fountain that roseup to 12.6 km a.s.l. in ~1 h. The maximum elevation of the ash plume was well constrained by anempirical formula that can be used for prompt hazard assessment.
Keywords: Etna volcano; paroxysmal explosive and effusive episodes; ash plume; remote sensing;volcano monitoring; volcanic hazard
1. Introduction
Explosive eruptions of mafic magmas produce lava fountains whose heights de-pend on the exsolved volatile content of the magma, its erupted mass flux, and the ge-ometry of the vent, either an elongated eruptive fissure or a near circular conduit [1].Lava fountains were typical at Kilauea volcano during the 1959–1960, 1969–1970, and1983–2008 eruptions [2–5], being characterized by vertical jets of gas and incandescentpyroclasts rising several hundred meters above the vent. This activity is also commonat Etna volcano, with several such explosive phases occurring in 2000 [6–8], 2001, 2002–2003 [9–11], and in 2011–2015 [12–16]. The last paroxysmal lava fountain sequence startedon 13 December 2020, and is still going on as of 2 August 2021. A recent study, based ona catalogue of the explosive paroxysmal episodes that occurred at Etna since 1986 (andupdated to 1 April 2021), showed a general marked increase in the release of seismic energy
Remote Sens. 2021, 13, 3052. https://doi.org/10.3390/rs13153052 https://www.mdpi.com/journal/remotesensing

Remote Sens. 2021, 13, 3052 2 of 23
over time [17]. This is in agreement with a general trend of increasing heights and volumeof the lava fountains and ash plumes from 2000 until now [6,8,10–12,14,15].
The summit of Etna volcano comprises four main craters: Voragine, Bocca Nuova, NECrater, and SE Crater, with the addition of the newly formed New SE Crater (NSEC) builtup on top of the SE Crater since 2011 [14,18]. Lava fountains from the summit craters orfrom eruptive fissures have often preceded major flank effusive activity, such as at Etna in2001 and 2002–2003; thus, they were considered as possible precursors [10,11]. However,the several lava fountain events between 2011 and 2015 [12,14–17,19] were not followed byflank eruptions. This observation, combined with the estimation of erupted volumes fromthe monitoring camera analyses [14,15], allowed recognizing that Etna displayed a steady-state behavior for at least four decades [20–23]. Therefore, in cases such as the 2011–2015lava fountains, this explosive activity can represent a modality of magma discharge able tomaintain the steady-state. At Etna volcano, the average output rate was estimated at 0.8m3 s−1, or 25 × 106 m3 per year [21,22]. On this basis, Bonaccorso and Calvari [22] foundthat the magma stored within the plumbing system can be released either through a highnumber of lava fountains, erupting volumes of ~2–3 × 10⁶ m3 each [12,14,15,22], or witha small number of flank effusive eruptions, each normally releasing ~30–60 × 106 m3 oflava [21,22]. Considering this conceptual model, it is not surprising that on 13 December2020, after about 18 months of eruptive pause [24–27], the volcano entered a new eruptivephase characterized by 57 lava fountain episodes (as of 2 August 2021) accompanied,preceded, or followed by short-lasting effusive phases. Lava fountains, being characterizedat Etna by heights of a few km, and always accompanied by several km high ash plumesgenerated from the same vent, raise serious concern among the local population. In fact,an ash fallout up to ~38 kg/m2 [10] has a strong impact on the viability, on the stability ofroofs, on the air traffic (the Catania airport is a major international hub), on agriculture, onwater contamination, and on the health of the local population [28–32].
The release of ash plumes during mild basaltic explosive activity was described andanalyzed only recently, when two distinct eruption styles were identified for Strombolianexplosions [33]. Type 1 Strombolian eruptions consist of coarse ballistic scoria (cm/dm-scale) and a relatively ash-free gas plume. Type 2 Strombolian eruptions consist of anash-rich plume, with or without additional ballistic scoria. What determines type 2 ash-rich Strombolian behavior is the sliding of loose clastic material into the vent [33–35], orrheological changes in the uppermost magma column [36,37]. The formation of ash plumeduring lava fountaining is even more questioned and often not considered in lava fountainmodels [38,39]. This is because lava fountaining is considered as mostly characterized bycoarse ballistics falling around the vent and building spatter cones or spatter ramparts,with small amounts of ash being released in the atmosphere [40–42].
The formation of ash plumes is a common feature at Etna volcano, always accompany-ing lava fountain eruptions [6–15,17]. Conversely, ash plume is lacking during Strombolianand intermediate explosive activity [43], but is released by the summit craters duringrare phreatomagmatic activity [44–46]. In addition, weak and dilute ash plume may formduring summit collapses, occurring within the craters or pit crater formations [44,47,48].
Several authors described a transitional explosive stage in between the Strombo-lian and lava fountain [6,14,39,43], occurring when the discrete countable Strombolianbursts increase in number and frequency, shifting to the continuous lava fountainingregime [14,43]. This transition can be either abrupt or gradual [6]. At Etna, lava fountainsare always associated to the formation of ash plumes [6,7,10,11,14,15], and as soon as thelava fountain regime starts, we observe the release of ash from the upper part of the lavafountain that rises for kilometers above the crater, feeding a sustained ash plume [42].However, the way a lava fountain expands vertically into a sustained ash plume, as well asthe timing of this process, is still little constrained. Nonetheless, sustained eruptive columnsand ash plumes are of great concern to local authorities in Sicily and elsewhere [17,49–51]because the ash plumes may expand well beyond the national country. As an example,Etna’s ash plumes also affected Malta and Greece [25,45,52,53] for several days after the
Remote Sens. 2021, 13, 3052 3 of 23
end of the eruption [54], and its gas and ash plumes even travelled the entire globe [55].Even worse, the eruption of Mt St Helens in 1982 [49], Pinatubo in 1991 [56], and theIcelandic volcano Eyjafjallajökull in 2010 caused air traffic disruption for about a monthacross Europe [50,51].
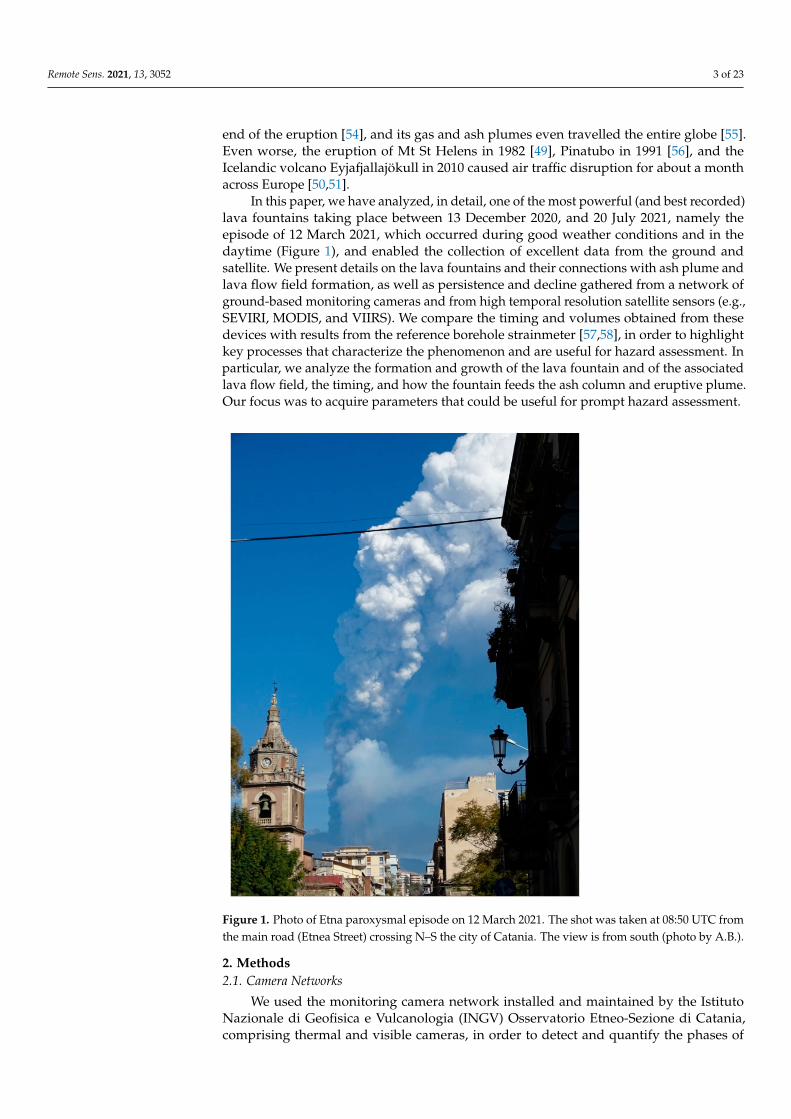
In this paper, we have analyzed, in detail, one of the most powerful (and best recorded)lava fountains taking place between 13 December 2020, and 20 July 2021, namely theepisode of 12 March 2021, which occurred during good weather conditions and in thedaytime (Figure 1), and enabled the collection of excellent data from the ground andsatellite. We present details on the lava fountains and their connections with ash plume andlava flow field formation, as well as persistence and decline gathered from a network ofground-based monitoring cameras and from high temporal resolution satellite sensors (e.g.,SEVIRI, MODIS, and VIIRS). We compare the timing and volumes obtained from thesedevices with results from the reference borehole strainmeter [57,58], in order to highlightkey processes that characterize the phenomenon and are useful for hazard assessment. Inparticular, we analyze the formation and growth of the lava fountain and of the associatedlava flow field, the timing, and how the fountain feeds the ash column and eruptive plume.Our focus was to acquire parameters that could be useful for prompt hazard assessment.
Figure 1. Photo of Etna paroxysmal episode on 12 March 2021. The shot was taken at 08:50 UTC fromthe main road (Etnea Street) crossing N–S the city of Catania. The view is from south (photo by A.B.).
2. Methods2.1. Camera Networks
We used the monitoring camera network installed and maintained by the IstitutoNazionale di Geofisica e Vulcanologia (INGV) Osservatorio Etneo-Sezione di Catania,comprising thermal and visible cameras, in order to detect and quantify the phases of

Remote Sens. 2021, 13, 3052 4 of 23
eruptive activity. Our aim was to define the timing of its changes, as well as the height ofthe lava fountains and ash plume, the erupted volume of pyroclastics and the expansion ofthe lava flow field, and of their timing—parameters that are essential for hazard assessmentat a frequently erupting volcano. The labels of the cameras used in this paper, as well astheir main features, viewing direction, and average distance from the craters, are listed inTable 1, and their positions are shown in Figure 2. The height of the lava fountains wasobtained from the thermal cameras ENT and EBT located on the S and NW flanks of thevolcano, respectively. The error in the height measurement is ±50 m [14,15]. These heightswere used to calculate the erupted volume of pyroclasts, following the method developedby Calvari et al. [14,15]. This method consists in measuring the lava fountain height onthermal images with a 1-minute time lapse, and applying the Equation (1):
v = (2gh)0.5 (1)
for the calculation of the flux of gas and pyroclasts through the vent section. In Equation (1),v is the velocity of the mixture comprising gas plus pyroclasts, g is the acceleration of gravity,and h is the lava fountain height, expressed in meters above the crater rim. The NSECvent section, following Calvari et al. [14,15], was considered circular, with a vent diameterof 30 m. By integrating the velocity of the gas plus pyroclasts mixture over the entireduration of the lava fountain, multiplied by the vent section area, and extracting fromthe final value the 0.18%, which represents the average amount of pyroclasts within thefluid mixture [14,15], we obtain the volume of pyroclasts erupted during the lava fountainepisode. It is worth noting that the growth of the NSEC cinder cone during one singlelava fountain episode is not enough to affect our measurements of lava fountain or ashplumes [18].
Table 1. List of the INGV monitoring cameras used in this paper and their main features. The field of view is considered atthe crater rim.
Label Type Location Distance from theCraters (km) Frame Rate Field of View
ENT ThermalFLIR A40M
Nicolosi, Southflank
730 m a.s.l.15.0 2 frames/s 24◦ (horizontal)
18◦ (vertical)
EBT ThermalFLIR A320
Bronte, NW flank85 m a.s.l. 13.5 2 frames/s 25◦ (horizontal)
18.8◦ (vertical)
EMCT ThermalFLIR A320
Mt. Cagliato, Eastflank
1160 m a.s.l.8.3 2 frames/s 25◦ (horizontal)
18.8◦ (vertical)
EMOT ThermalFLIR A320
Montagnola, Southflank
2600 m a.s.l.3.0 1 frame/s 25◦ (horizontal)
18.8◦ (vertical)
EMCH VisibleVivotec IP8172
Mt. Cagliato, Eastflank
390 m a.s.l.8.3 2 frames/min
33◦~93◦
(horizontal),24◦~68◦ (vertical)
ECV VisibleCanon VC-C4R
Catania Nesima,South flank35 m a.s.l.
26.7 1 frame/2 s 3–47.5◦ (horizontaland vertical)
ECVH VisibleVivotec IP8172
Catania Nesima,South flank35 m a.s.l.
27.0 1 frame/min33◦~93◦
(horizontal),24◦~68◦ (vertical)
EBVH VisibleVivotec IP8172
Bronte, NW flank163 m a.s.l. 13.5 1 frame/min
33◦~93◦
(horizontal),24◦~68◦ (vertical)
Remote Sens. 2021, 13, 3052 5 of 23
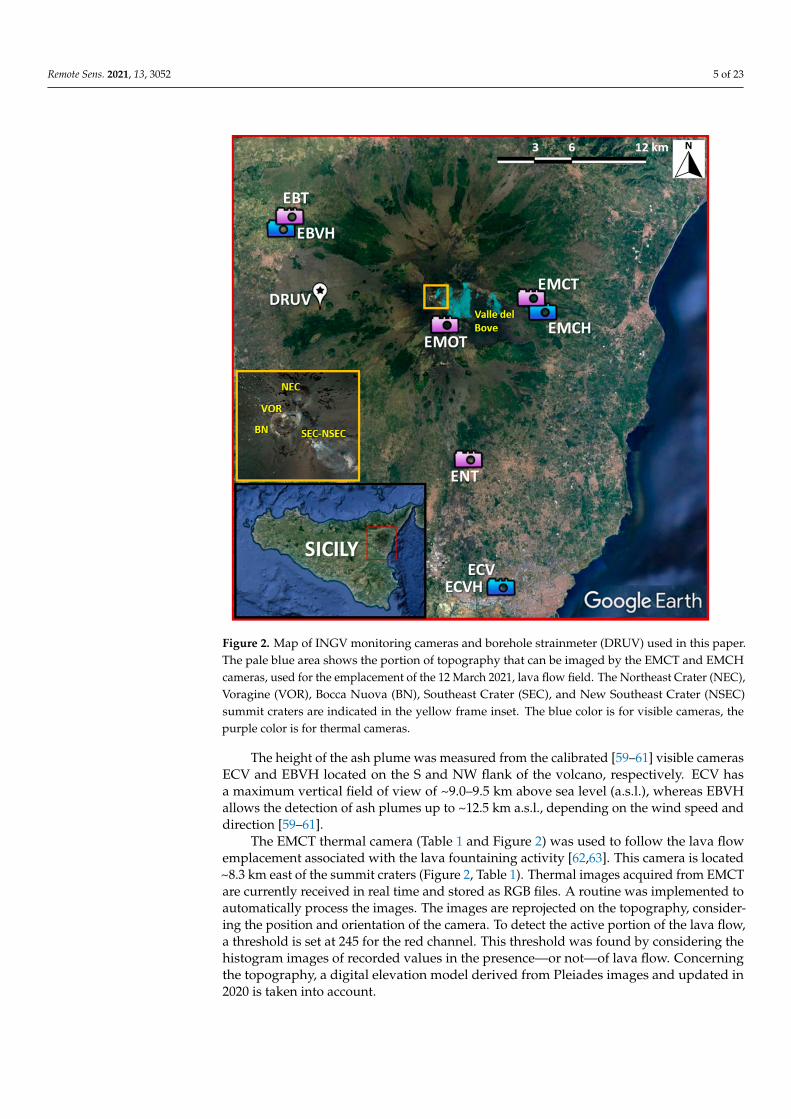
Figure 2. Map of INGV monitoring cameras and borehole strainmeter (DRUV) used in this paper.The pale blue area shows the portion of topography that can be imaged by the EMCT and EMCHcameras, used for the emplacement of the 12 March 2021, lava flow field. The Northeast Crater (NEC),Voragine (VOR), Bocca Nuova (BN), Southeast Crater (SEC), and New Southeast Crater (NSEC)summit craters are indicated in the yellow frame inset. The blue color is for visible cameras, thepurple color is for thermal cameras.
The height of the ash plume was measured from the calibrated [59–61] visible camerasECV and EBVH located on the S and NW flank of the volcano, respectively. ECV hasa maximum vertical field of view of ~9.0–9.5 km above sea level (a.s.l.), whereas EBVHallows the detection of ash plumes up to ~12.5 km a.s.l., depending on the wind speed anddirection [59–61].
The EMCT thermal camera (Table 1 and Figure 2) was used to follow the lava flowemplacement associated with the lava fountaining activity [62,63]. This camera is located~8.3 km east of the summit craters (Figure 2, Table 1). Thermal images acquired from EMCTare currently received in real time and stored as RGB files. A routine was implemented toautomatically process the images. The images are reprojected on the topography, consider-ing the position and orientation of the camera. To detect the active portion of the lava flow,a threshold is set at 245 for the red channel. This threshold was found by considering thehistogram images of recorded values in the presence—or not—of lava flow. Concerningthe topography, a digital elevation model derived from Pleiades images and updated in2020 is taken into account.

Remote Sens. 2021, 13, 3052 6 of 23
2.2. Satellite Thermal Monitoring
Low spatial-high temporal resolution satellite images (1–3 km pixel at nadir, 6 h—upto 5 min frequency), such as those acquired by SEVIRI, MODIS, and VIIRS, are currentlyused to follow the eruptive activity at Mount Etna. Due to the short-lived nature of thelava fountains that occurred to date in 2021, SEVIRI aboard the geostationary MeteosatSecond Generation, providing information at 15 to 5 min sample times, is the best sensorto describe the evolution of the eruptive phenomena [62,64,65]. The thermal anomaliesrelated to the volcanic activity can be located in the satellite images by processing themiddle infrared (MIR) channel that is particularly sensitive to high temperature events.The automatic system HOTSAT [66] was used to process these data. Besides locatingthe thermal anomalies, HOTSAT also computes the radiant heat flux by quantifying thethermal anomaly in each image. From a temporal sequence of images, a radiant heat fluxcurve can be retrieved, and the timing of an eruptive event can be determined. In thecase of effusive events, this curve can provide an estimation of the eruption rate, i.e., itcan be converted into a time averaged discharge rate (TADR; [64,67–69]), TADR beingan essential parameter for defining the size and magnitude of a volcanic eruption [40,68].This conversion entails some assumptions [70], among which the thermal steady stateneeds to be reached [71]. Lava fountains are very fast and transient events, so converting theradiant heat flux into TADR is not possible. Indeed, during the climax phase, saturation andplume obscuration occur, increasing the uncertainties on the peak values of radiant heat flux.To overcome these limitations, the method developed by Ganci et al. [65] was applied here.This method considers the surface temperature for a stagnant, stable, cooling lava sur-face as a function of time following the solution of the Stefan cooling problem [68,72].The satellite-derived radiant heat flux depends on the radiative heat flux density due tothe surface temperature and the area of cooling lava. The erupted volume of lava is hencecomputed by modeling the cooling curve apparent in the satellite-derived radiant heatflux curve. A minimum and a maximum range of thickness are assumed for the lavaflow field, and the actual curve is constrained between two modeled curves by using theNelder–Mead algorithm.
SEVIRI, MODIS, and VIIRS data were also used to compute the volcanic Ash CloudTop Height (ACTH). In this work, this value was derived by comparing the brightness tem-perature for the pixels contaminated by the volcanic plume with atmospheric temperatureprofiles. Data for the atmospheric profiles were downloaded with hourly frequency, regrid-ded to a regular lat–long grid of 0.25 degrees, from ERA5, the fifth generation ECMWF re-analysis for the global climate and weather (available at https://cds.climate.copernicus.eu/,accessed on 2 August 2021). The radiances acquired in the thermal infrared were cor-rected for atmospheric effect by using the MODTRAN (MODerate resolution atmosphericTRANsmission) model and converted to brightness temperatures by using the Planck law.We computed the Brightness Temperature Difference (BTD) between channels IR12.0 andIR10.8 to highlight the presence of ash/SO2 plume, so we also computed the area of thevolcanic cloud as seen from space for each image. In order to compare the temperature atthe top of the volcanic cloud with the temperature of the atmospheric profile, we developeda MATLAB routine that interpolated the atmospheric profile at the measured value oftemperature and provided the correspondent height. The interpolation is made throughthe MATLAB function spline. The method assumes that the top layer volcanic ash cloudbehaves as a blackbody, and it is opaque; the assumption can cause significant overesti-mation of the cloud top temperature and, therefore, underestimation of the volcanic ashheight if there are multilayer clouds under the top volcanic ash layer. Moreover, for highclouds near the tropopause and at high latitudes, the method can lead to errors becausethe rate of temperature change with height is small [73]. However, reanalysis of regionalatmospheric products was used for ACTH estimations at the Etna volcano during recenteruptions [25,52]; the results of these models for lava fountains at Mount Etna were alsovalidated with other ground-based approaches [59]. Finally, higher spatial resolution
Remote Sens. 2021, 13, 3052 7 of 23
images, such as those acquired by Sentinel-2 MSI, Landsat 8, and Aster, were used to locateand map the active or recently emplaced lava flow field [74,75].
2.3. High Precision Strain from the Borehole Dilatometer
A network composed of deep borehole dilatometers was installed on Etna in 2011(two stations) and 2014 (further two stations). The dilatometers measure the volumetricstrain of the rocks where they are installed, reaching nominal resolution of 10−10 to 10−11,and guaranteeing a frequency range from 10−7 to >20 Hz. The instruments are usuallyinstalled into deep drilled holes (depth > 100 m) to reduce environmental noise, mainlythe thermoelastic strain effects, to better exploit their high sensitivity. The instrumentsare coupled to the rock by using expansive cement and they require final calibration afterinstallation. The calibrations are usually performed by comparing the recorded strain withthe estimated reference signals, such as those produced by lunar tides, mainly the diurnalO1 (25.82 h) and the semidiurnal M2 (12.42 h) [58]. Other approaches are also implementedby comparing the recorded dynamic strain amplitude of long-period surface waves fromstrong distant earthquakes [76] or by direct comparison of the strain recorded by theborehole dilatometer with the seismic strain of teleseismic waves, recorded by a nearbybroadband seismic array [77]. A detailed description of the installations, instrumental insitu calibrations, and main results are fully described by Bonaccorso et al. [76,78]. In thisstudy, we used the signal from the most precise station, namely DRUV. This dilatometerwas installed at a depth of 172.5 m within a very massive basalt layer in the mid-westernflank of the volcano at about 10 km away from the summit craters (Figure 2). All previouslycited calibration approaches were successfully applied to the strain recorded at this stationobtaining the same calibration coefficient [58,76–78]. This is considered the reference stationsince, as testified by the in situ calibrations, it has a >20 times more precise sensitivity thanthe other stations.
3. Eruptive Activity before the 12 March 2021, Paroxysm
In the recent years, Etna volcano often displayed sequences of lava fountain events,mostly occurring from the SE Crater (SEC), and more recently from the NSEC [6,8,9,11,17].These are characterized by the development of associated ash plumes and short-livedlava overflows from the crater rim [6–11,17]. Several periods of lava fountain activitycharacterized the growth of the SEC: in 1989 (16 lava fountains), in 1998–1999 (22), in2000 (64), in 2001 (15), and in 2013–2015 (49) [8,14,15,17]. The first, most relevant of thesesequences occurred in 2000, when during the six months (spanning between January andJune) the SEC produced 64 such episodes [8]. This episodic activity was triggered by moreprimitive and gas-rich magma entering the SEC reservoir, where it mixed with the residentand more evolved magma, giving rise to a gas bubble foam layer accumulated at about1.5 km depth below the erupting crater [7,8,57]. In general, paroxysmal episodes takingplace close in time are generally impulsive and characterized by rapid waxing and waningphases compared to the episodes more distant in time that show a slower pattern [17].
Following the short flank eruption on Etna in December 2018 [25,27], the volcano hadanother effusive phase from the summit craters between 30 May and 6 June 2019, whensome short fissures opened at the base of the NSEC, feeding a lava flow field that spreadeastwards [26,79]. Once this eruptive activity ended, the summit craters of the volcanodisplayed a mild Strombolian explosive activity with occasional ash emission. On 18 July2019, an effusive vent opened at the base of the NSEC, producing a small lava flow thatspread NE for a few kilometers. This lava flow stopped on the evening of 20 July 2019.Another effusive vent opened on 27 July 2019, at the S base of the NSEC, producing alava flow that spread towards SW and S for several hundred meters and stopped the nextday. The Strombolian explosive activity at the summit craters continued during the year,accompanied by occasional and pulsating ash emissions, and producing an intra-cratercinder cone and a several hundred-meter-long lava flow within the Voragine crater inSeptember 2019. From October 2019, the summit craters of the volcano displayed a mild
Remote Sens. 2021, 13, 3052 8 of 23
Strombolian explosive activity with occasional dilute ash emission [80]. In December 2019,the explosive activity increased in intensity, with bomb spatter and ballistics falling onthe outer flanks of the NSEC, and a lava flow erupted from the Voragine crater, spreadingwithin the nearby Bocca Nuova crater. This eruptive activity continued in 2020, intensifyingduring February–early March 2020 [80], when up to three scoria cones built up withinthe Voragine crater by March 2020. A complex lava flow field fed by the Voragine ventswas spreading within the nearby Bocca Nuova crater, lasting until the end of April 2020.The Strombolian explosive activity continued at all summit craters with occasional diluteash emissions, increasing in May 2020, and forming ash clouds rising several hundredmeters above the craters. Several such ash clouds were also observed from June and August2020 until 13 December 2020, when the first episode of lava fountaining occurred at theNSEC, accompanied by lava flow output from the crater rim spreading S. The collapse ofa portion of the crater rim caused three pyroclastic density currents (PDC) spreading S,SW and SE from the base of the cone for several hundred meters. The explosive activityclimaxed into an additional lava fountaining episode on 14 December 2020, and a lava flowfrom the NSEC spreading S on 15 December 2020. Additional lava fountaining episodesand lava flow outputs occurred on: 21 and 22 December 2020, 18 January 2021; on 16,17, 19, 20, 22, 23, 24, and 28 February 2021; on 2, 4 (two episodes), 7, 9, 12, 14, 17, 19, 23,and 31 March 2021, on 19, 21, 22, 24, 25, 26 (three episodes), 27, 28 (four episodes), and30 May 2021, on 2, 4, 12, 16, 17, 19, 20, 22, 23 (two episodes), 24, 25 (two episodes), 26,27, and 28 June 2021; and on 1, 4, 6, 8, 14, 20 and 31 July 2021 (see activity reports ofINGV-OE at https://www.ct.ingv.it/index.php/monitoraggio-e-sorveglianza/prodotti-del-monitoraggio/bollettini-settimanali-multidisciplinari, accessed on 2 August 2021).
4. Results
The chronology of the eruptive events was gathered from the analysis of the imagesacquired by the INGV monitoring network, comprising visible and thermal cameras(Table 1 and Figure 2) and allowing a view of the volcano from various distances anddirections, and by satellite. All times indicated in this paper are UTC.
4.1. Eruptive Events and Characterization of the Lava Fountain and Ash Plume
The Strombolian activity at the NSEC, observed from the INGV network of monitoringcameras (Figure 2 and Table 1), started on 12 March 2021, at 02:35, gradually increasing infrequency, height, and intensity of the jets. Table 2 summarizes the timing of the events asobserved by the monitoring cameras and satellite, also complemented by strain informa-tion. At 06:40 the activity became transitional between Strombolian and lava fountaining(Figure 3a), and at 07:00 a lava flow breached the lower eastern rim of the crater spreadingE within the Valle del Bove depression (VdB; Figures 2 and 3b). At 07:22 a second overflowoccurred from the NE margin of the crater rim, expanding on the N flank of the crater(Figure 3b). At 07:35, the explosive activity became a clear lava fountaining, accompa-nied by significant ash emission and fast formation and growth of an eruptive column(Figure 3b). The third lava flow started spreading SE from 09:20 (Figure 3c).

Remote Sens. 2021, 13, 3052 9 of 23
Table 2. Timing of the 12 March 2021, eruptive episode retrieved from the INGV monitoring cameras, from the satellite andstrain signal. IER = instantaneous effusion rate [68].
Time UTC Eruptive Activity Notes
02:35 Strombolian activity started at the NSEC Figure 7
02:56 First satellite thermal anomaly detectedand Strombolian activity intensified Figure 7
05:00 Plume already reached 4000 m a.s.l. Figures 5 and 6a
06:40 Transitional activity between Strombolianand lava fountaining started at NSEC Figures 3a and 6b
07:00 Lava flow output started from the E rimof NSEC, expanding E Figure 3a
07:22A second lava flow started from the NE
rim of NSEC, expanding N, strainsuddenly declining
Figure 3b
07:35
Lava fountaining phase with significantash emission and formation of an
eruptive column, 20–30 m s−1 of muzzlevelocity
Figures 3b and 6d
07:35–08:56Radiant heat flux increased from satellite,muzzle velocity of ~70 m s−1, strain rate
increasedFigure 9
08:14 Maximum muzzle velocity of 133 m s−1reached by the lava fountain
08:30 Maximum plume height of 11.3 km a.s.l.detected from EBVH Figures 4 and 5
08:47–08:49
Maximum elevation reached by the lavafountain of 3000 m above the crater rim
(from EBT), and of 2400 m above thecrater rim (from ENT) and peak IER of
276 m3 s−1
Figures 4b and 5
08:57 Peak value of 35 GW measured fromsatellite and peak value from strain Figures 5 and 9
09:05–09:30 The ash plume started declining in height Figure 5
09:20 A third lava flow started from the SE rimof NSEC, expanding SE Figure 3c
09:45 Lava fountain ended, strain decliningstopped Figure 3c
10:10–10:15 The ash plume dropped below 6.0 kma.s.l. Figure 5
10:54 Explosive paroxysm ended Figure 3c
12:00 Lava flow output ended and lava flowfield cooling
Remote Sens. 2021, 13, 3052 10 of 23
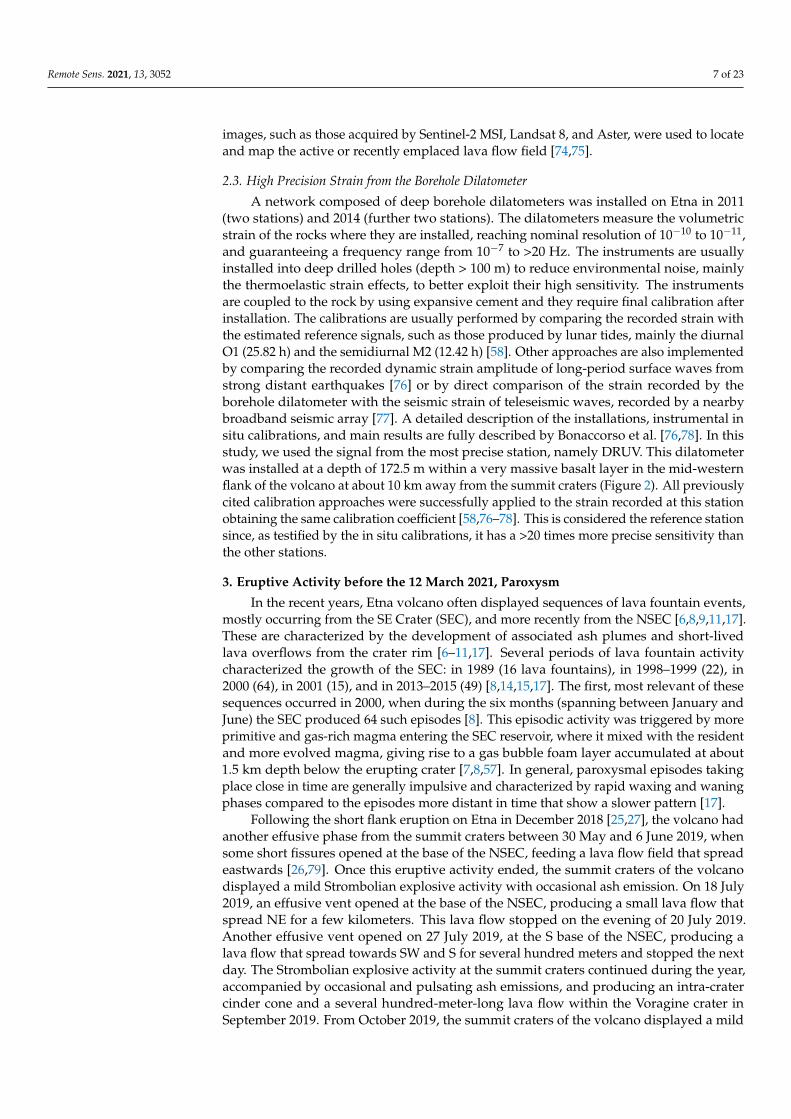
Figure 3. The output of three lava flows from the crater rim of the New Southeast Crater (NSEC), observed by the EMCTthermal camera located on the E flank of the volcano, on 12 March 2021. North is on the right, south is on the left. SeeFigure 2 for camera location and Table 1 for its characteristics. (a) Thermal image recorded at 07:23:16 showing the firstlava flow (white) spreading E along the western wall of the Valle del Bove (VdB). (b) Thermal image recorded at 07:59:26showing the lava fountain with the ash plume (blue), and the second lava flow spreading N (white, right of the image).(c) Thermal image recorded at 10:54:40 showing the crater inactive, and in white the three lava branches slowly expanding.
The height of the lava fountain, detected from the ENT (S flank) and EBT (NWflank, Figure 2 and Table 1) thermal cameras, gradually increased up to 08:49, when itreached the maximum elevation of 2400 m above the crater rim and the peak instantaneouseffusion rate (IER, averaged over a shorter lapse of time than the effusion rate [68]) of276 m3 s−1 (Table 2). The muzzle velocity, obtained from the EMOT camera which iscloser to the summit vents, was only 20–30 m s−1 during the initial phase of fountaining,increased to ~70 m s−1 after 08:05, and reached the peak of 133 m s−1 at 08:14 (Table 2).Then the fountain height decreased, stopping at 09:45 (Table 2), after a duration of 130 min(Figure 3). The average fountain height, calculated from the values measured every minutewith the ENT camera, was 1149 m.
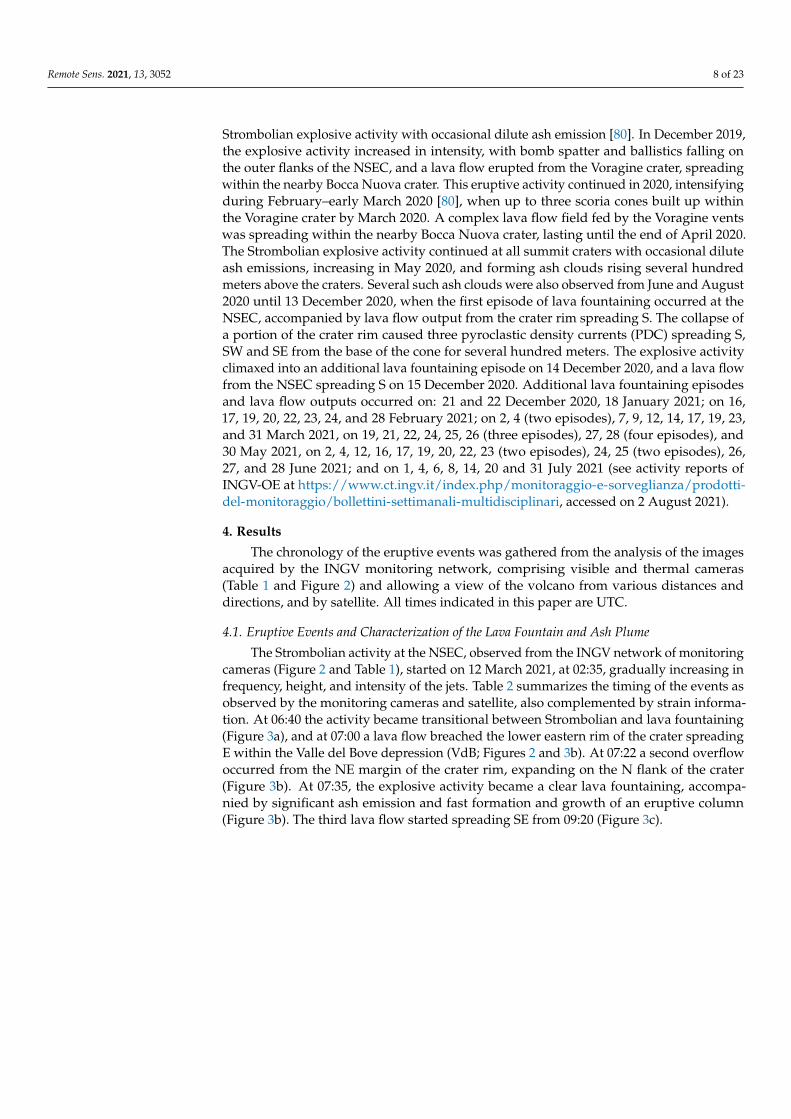
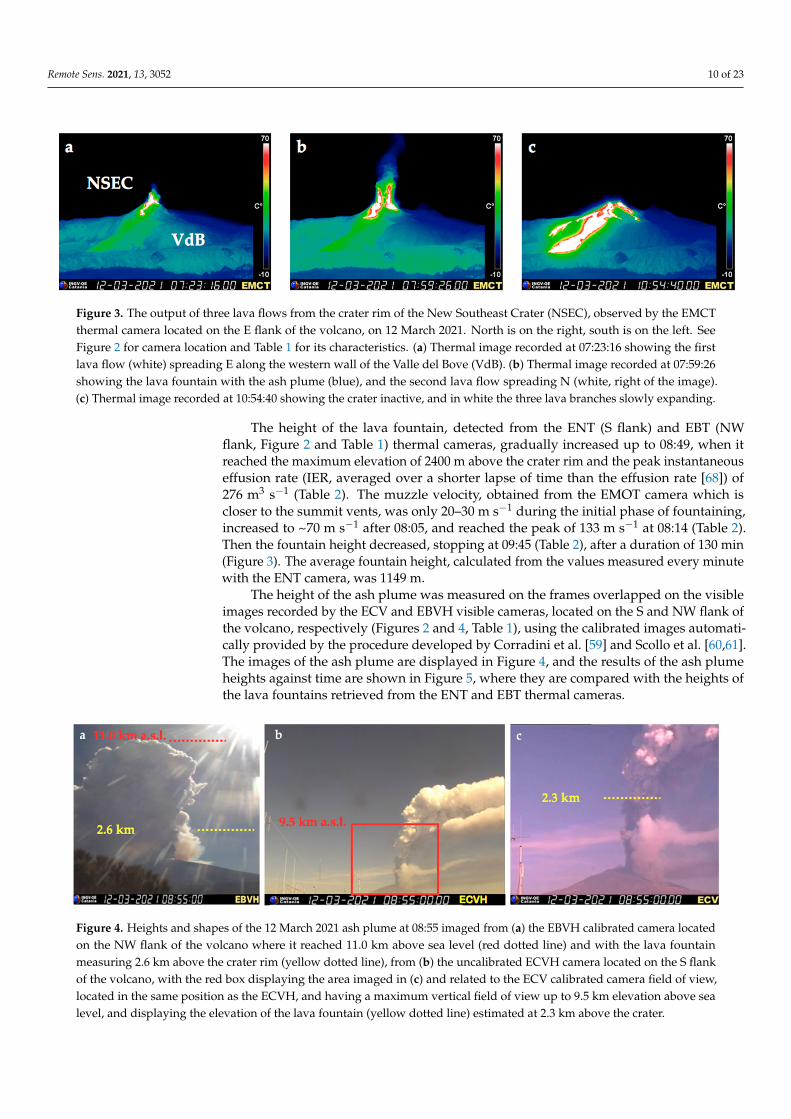
The height of the ash plume was measured on the frames overlapped on the visibleimages recorded by the ECV and EBVH visible cameras, located on the S and NW flank ofthe volcano, respectively (Figures 2 and 4, Table 1), using the calibrated images automati-cally provided by the procedure developed by Corradini et al. [59] and Scollo et al. [60,61].The images of the ash plume are displayed in Figure 4, and the results of the ash plumeheights against time are shown in Figure 5, where they are compared with the heights ofthe lava fountains retrieved from the ENT and EBT thermal cameras.
Figure 4. Heights and shapes of the 12 March 2021 ash plume at 08:55 imaged from (a) the EBVH calibrated camera locatedon the NW flank of the volcano where it reached 11.0 km above sea level (red dotted line) and with the lava fountainmeasuring 2.6 km above the crater rim (yellow dotted line), from (b) the uncalibrated ECVH camera located on the S flankof the volcano, with the red box displaying the area imaged in (c) and related to the ECV calibrated camera field of view,located in the same position as the ECVH, and having a maximum vertical field of view up to 9.5 km elevation above sealevel, and displaying the elevation of the lava fountain (yellow dotted line) estimated at 2.3 km above the crater.
Remote Sens. 2021, 13, 3052 11 of 23
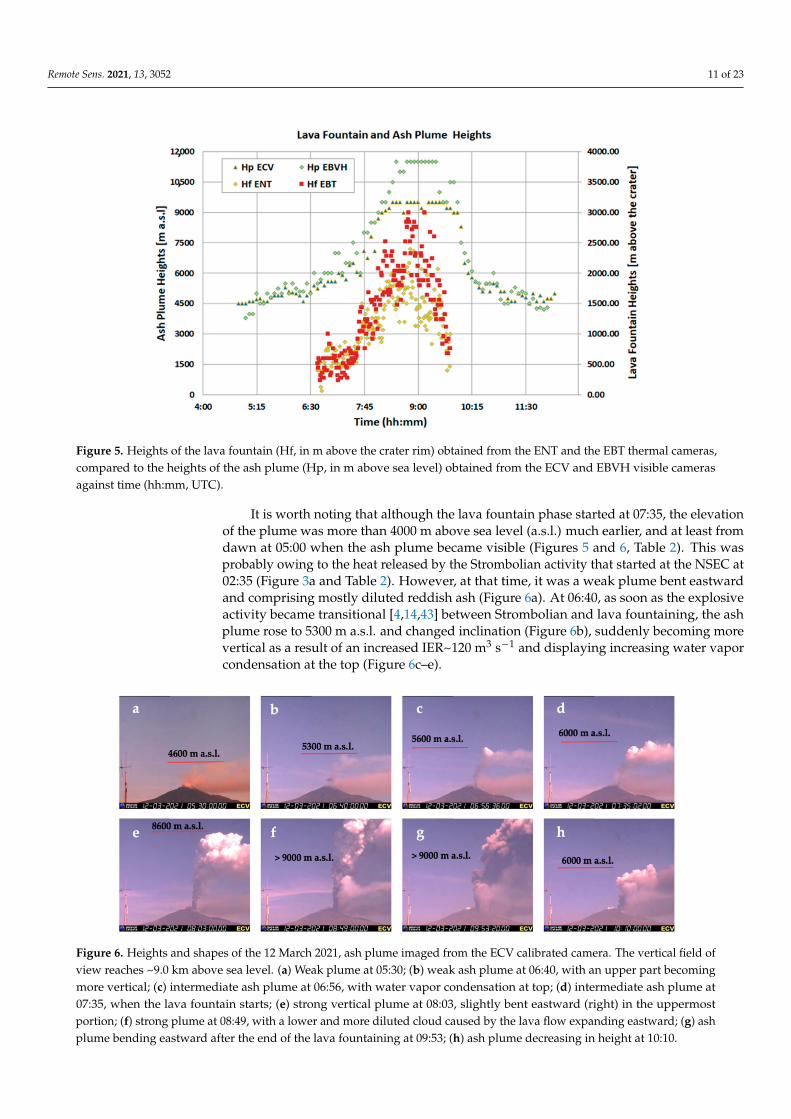
Figure 5. Heights of the lava fountain (Hf, in m above the crater rim) obtained from the ENT and the EBT thermal cameras,compared to the heights of the ash plume (Hp, in m above sea level) obtained from the ECV and EBVH visible camerasagainst time (hh:mm, UTC).
It is worth noting that although the lava fountain phase started at 07:35, the elevationof the plume was more than 4000 m above sea level (a.s.l.) much earlier, and at least fromdawn at 05:00 when the ash plume became visible (Figures 5 and 6, Table 2). This wasprobably owing to the heat released by the Strombolian activity that started at the NSEC at02:35 (Figure 3a and Table 2). However, at that time, it was a weak plume bent eastwardand comprising mostly diluted reddish ash (Figure 6a). At 06:40, as soon as the explosiveactivity became transitional [4,14,43] between Strombolian and lava fountaining, the ashplume rose to 5300 m a.s.l. and changed inclination (Figure 6b), suddenly becoming morevertical as a result of an increased IER~120 m3 s−1 and displaying increasing water vaporcondensation at the top (Figure 6c–e).
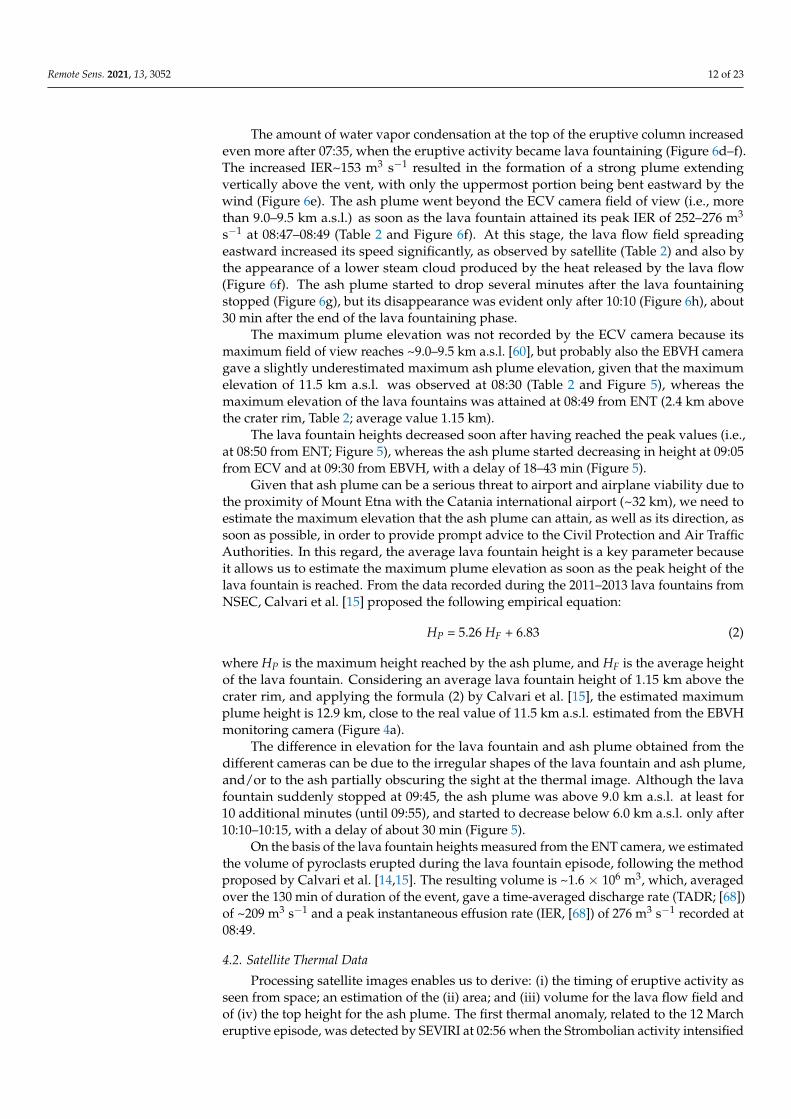
Figure 6. Heights and shapes of the 12 March 2021, ash plume imaged from the ECV calibrated camera. The vertical field ofview reaches ~9.0 km above sea level. (a) Weak plume at 05:30; (b) weak ash plume at 06:40, with an upper part becomingmore vertical; (c) intermediate ash plume at 06:56, with water vapor condensation at top; (d) intermediate ash plume at07:35, when the lava fountain starts; (e) strong vertical plume at 08:03, slightly bent eastward (right) in the uppermostportion; (f) strong plume at 08:49, with a lower and more diluted cloud caused by the lava flow expanding eastward; (g) ashplume bending eastward after the end of the lava fountaining at 09:53; (h) ash plume decreasing in height at 10:10.
Remote Sens. 2021, 13, 3052 12 of 23
The amount of water vapor condensation at the top of the eruptive column increasedeven more after 07:35, when the eruptive activity became lava fountaining (Figure 6d–f).The increased IER~153 m3 s−1 resulted in the formation of a strong plume extendingvertically above the vent, with only the uppermost portion being bent eastward by thewind (Figure 6e). The ash plume went beyond the ECV camera field of view (i.e., morethan 9.0–9.5 km a.s.l.) as soon as the lava fountain attained its peak IER of 252–276 m3
s−1 at 08:47–08:49 (Table 2 and Figure 6f). At this stage, the lava flow field spreadingeastward increased its speed significantly, as observed by satellite (Table 2) and also bythe appearance of a lower steam cloud produced by the heat released by the lava flow(Figure 6f). The ash plume started to drop several minutes after the lava fountainingstopped (Figure 6g), but its disappearance was evident only after 10:10 (Figure 6h), about30 min after the end of the lava fountaining phase.
The maximum plume elevation was not recorded by the ECV camera because itsmaximum field of view reaches ~9.0–9.5 km a.s.l. [60], but probably also the EBVH cameragave a slightly underestimated maximum ash plume elevation, given that the maximumelevation of 11.5 km a.s.l. was observed at 08:30 (Table 2 and Figure 5), whereas themaximum elevation of the lava fountains was attained at 08:49 from ENT (2.4 km abovethe crater rim, Table 2; average value 1.15 km).
The lava fountain heights decreased soon after having reached the peak values (i.e.,at 08:50 from ENT; Figure 5), whereas the ash plume started decreasing in height at 09:05from ECV and at 09:30 from EBVH, with a delay of 18–43 min (Figure 5).
Given that ash plume can be a serious threat to airport and airplane viability due tothe proximity of Mount Etna with the Catania international airport (~32 km), we need toestimate the maximum elevation that the ash plume can attain, as well as its direction, assoon as possible, in order to provide prompt advice to the Civil Protection and Air TrafficAuthorities. In this regard, the average lava fountain height is a key parameter becauseit allows us to estimate the maximum plume elevation as soon as the peak height of thelava fountain is reached. From the data recorded during the 2011–2013 lava fountains fromNSEC, Calvari et al. [15] proposed the following empirical equation:
HP = 5.26 HF + 6.83 (2)
where HP is the maximum height reached by the ash plume, and HF is the average heightof the lava fountain. Considering an average lava fountain height of 1.15 km above thecrater rim, and applying the formula (2) by Calvari et al. [15], the estimated maximumplume height is 12.9 km, close to the real value of 11.5 km a.s.l. estimated from the EBVHmonitoring camera (Figure 4a).
The difference in elevation for the lava fountain and ash plume obtained from thedifferent cameras can be due to the irregular shapes of the lava fountain and ash plume,and/or to the ash partially obscuring the sight at the thermal image. Although the lavafountain suddenly stopped at 09:45, the ash plume was above 9.0 km a.s.l. at least for10 additional minutes (until 09:55), and started to decrease below 6.0 km a.s.l. only after10:10–10:15, with a delay of about 30 min (Figure 5).
On the basis of the lava fountain heights measured from the ENT camera, we estimatedthe volume of pyroclasts erupted during the lava fountain episode, following the methodproposed by Calvari et al. [14,15]. The resulting volume is ~1.6 × 10⁶ m3, which, averagedover the 130 min of duration of the event, gave a time-averaged discharge rate (TADR; [68])of ~209 m3 s−1 and a peak instantaneous effusion rate (IER, [68]) of 276 m3 s−1 recorded at08:49.
4.2. Satellite Thermal Data
Processing satellite images enables us to derive: (i) the timing of eruptive activity asseen from space; an estimation of the (ii) area; and (iii) volume for the lava flow field andof (iv) the top height for the ash plume. The first thermal anomaly, related to the 12 Marcheruptive episode, was detected by SEVIRI at 02:56 when the Strombolian activity intensified
Remote Sens. 2021, 13, 3052 13 of 23
(Table 2). This anomaly was followed by a constant increase in the satellite-derived radiantheat flux mainly related to the lava flow spreading, as also visible from the lava flow areaincrease imaged by the EMCT thermal camera (Figure 7b). A first increase in the radiantheat flux signal was recorded at 6:42 and a second sharp increase occurred at 08:12, witha peak value of ~25 GW at 08:57 (Table 2). After this a constant decrease, related to thecooling of the lava flow, was observed. Due to the low spatial resolution of SEVIRI imagesat Etna volcano, we are not able to distinguish between the radiant heat flux curve comingfrom the lava fountain and the contribution related to the lava flow field. Most of thethermal signal is due to the lava flow emplacement as shown by the comparison with thelava flow field growth recorded by the EMCT thermal camera (Figure 7a,b). This happensfor two reasons: the first is that the SEVIRI pixel over the summit crater saturates, and thesecond one is that the eruptive column above the lava fountain covers the view from thesatellite. Applying the method by Ganci et al., [64], the satellite-derived cooling curve wasmodeled and a lava flow volume of ~2.4 × 10⁶ m3 was estimated.
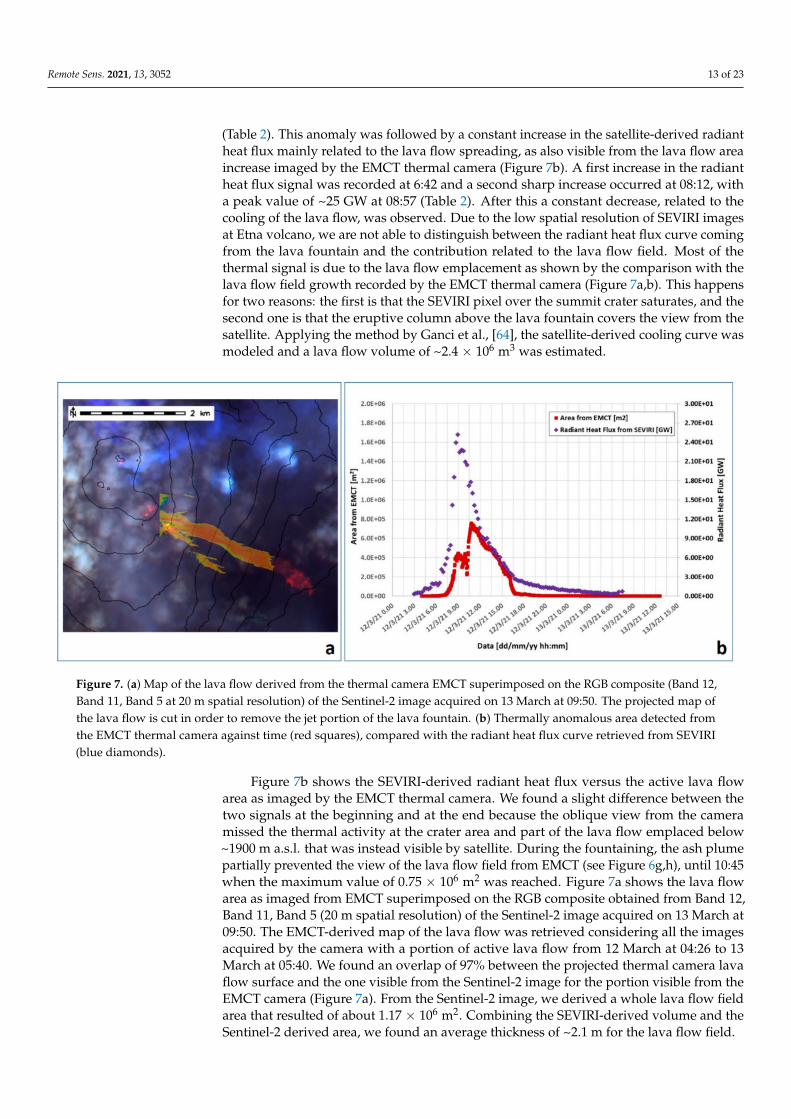
Figure 7. (a) Map of the lava flow derived from the thermal camera EMCT superimposed on the RGB composite (Band 12,Band 11, Band 5 at 20 m spatial resolution) of the Sentinel-2 image acquired on 13 March at 09:50. The projected map ofthe lava flow is cut in order to remove the jet portion of the lava fountain. (b) Thermally anomalous area detected fromthe EMCT thermal camera against time (red squares), compared with the radiant heat flux curve retrieved from SEVIRI(blue diamonds).
Figure 7b shows the SEVIRI-derived radiant heat flux versus the active lava flowarea as imaged by the EMCT thermal camera. We found a slight difference between thetwo signals at the beginning and at the end because the oblique view from the cameramissed the thermal activity at the crater area and part of the lava flow emplaced below~1900 m a.s.l. that was instead visible by satellite. During the fountaining, the ash plumepartially prevented the view of the lava flow field from EMCT (see Figure 6g,h), until 10:45when the maximum value of 0.75 × 10⁶ m2 was reached. Figure 7a shows the lava flowarea as imaged from EMCT superimposed on the RGB composite obtained from Band 12,Band 11, Band 5 (20 m spatial resolution) of the Sentinel-2 image acquired on 13 March at09:50. The EMCT-derived map of the lava flow was retrieved considering all the imagesacquired by the camera with a portion of active lava flow from 12 March at 04:26 to 13March at 05:40. We found an overlap of 97% between the projected thermal camera lavaflow surface and the one visible from the Sentinel-2 image for the portion visible from theEMCT camera (Figure 7a). From the Sentinel-2 image, we derived a whole lava flow fieldarea that resulted of about 1.17 × 10⁶ m2. Combining the SEVIRI-derived volume and theSentinel-2 derived area, we found an average thickness of ~2.1 m for the lava flow field.

Remote Sens. 2021, 13, 3052 14 of 23
Figure 8 shows the ash cloud top height obtained from a VIIRS image acquired on 12March 2021, at 10:46. The result is a maximum height of 12.6 km a.s.l. (Figure 8).
Figure 8. Ash Cloud Top Height (ACTH) computed from a VIIRS image of 12 March 2021, at 10:46.
By processing SEVIRI data, we were also able to follow the ash cloud dispersionduring the eruptive episode. The plume top area was visible by SEVIRI at 8:15 and thearea increased until 10:45 with an almost constant velocity between 0.1 and 0.2 km2 s−1
(Figure 9). At 11:00, more than one hour after the end of the lava fountaining (Table 2), theplume top area started decreasing and separating from the volcano.
Figure 9. On the left: three SEVIRI scenes (channel IR 10.8) acquired on 12 March 2021 at 8:30, 10:00, and 10:45. On the right:histogram of the plume top area during 12 March 2021 from 8:15 to 11:00.
Remote Sens. 2021, 13, 3052 15 of 23
4.3. Strain
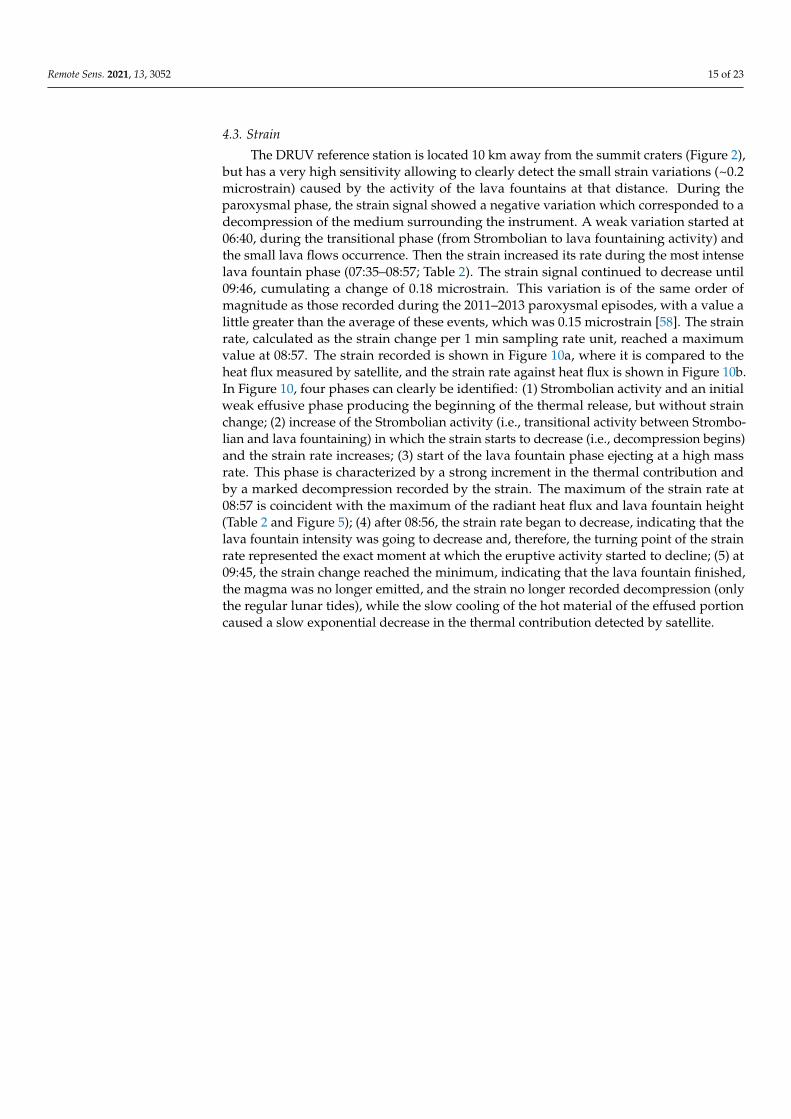
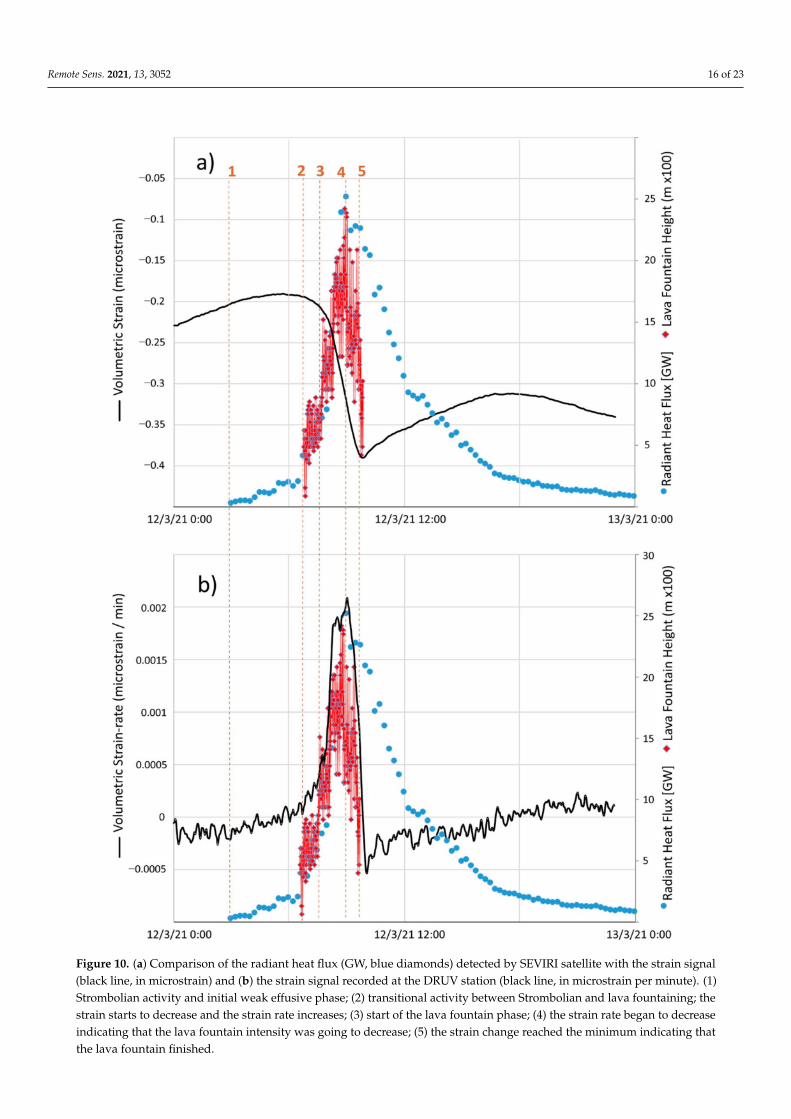
The DRUV reference station is located 10 km away from the summit craters (Figure 2),but has a very high sensitivity allowing to clearly detect the small strain variations (~0.2microstrain) caused by the activity of the lava fountains at that distance. During theparoxysmal phase, the strain signal showed a negative variation which corresponded to adecompression of the medium surrounding the instrument. A weak variation started at06:40, during the transitional phase (from Strombolian to lava fountaining activity) andthe small lava flows occurrence. Then the strain increased its rate during the most intenselava fountain phase (07:35–08:57; Table 2). The strain signal continued to decrease until09:46, cumulating a change of 0.18 microstrain. This variation is of the same order ofmagnitude as those recorded during the 2011–2013 paroxysmal episodes, with a value alittle greater than the average of these events, which was 0.15 microstrain [58]. The strainrate, calculated as the strain change per 1 min sampling rate unit, reached a maximumvalue at 08:57. The strain recorded is shown in Figure 10a, where it is compared to theheat flux measured by satellite, and the strain rate against heat flux is shown in Figure 10b.In Figure 10, four phases can clearly be identified: (1) Strombolian activity and an initialweak effusive phase producing the beginning of the thermal release, but without strainchange; (2) increase of the Strombolian activity (i.e., transitional activity between Strombo-lian and lava fountaining) in which the strain starts to decrease (i.e., decompression begins)and the strain rate increases; (3) start of the lava fountain phase ejecting at a high massrate. This phase is characterized by a strong increment in the thermal contribution andby a marked decompression recorded by the strain. The maximum of the strain rate at08:57 is coincident with the maximum of the radiant heat flux and lava fountain height(Table 2 and Figure 5); (4) after 08:56, the strain rate began to decrease, indicating that thelava fountain intensity was going to decrease and, therefore, the turning point of the strainrate represented the exact moment at which the eruptive activity started to decline; (5) at09:45, the strain change reached the minimum, indicating that the lava fountain finished,the magma was no longer emitted, and the strain no longer recorded decompression (onlythe regular lunar tides), while the slow cooling of the hot material of the effused portioncaused a slow exponential decrease in the thermal contribution detected by satellite.
Remote Sens. 2021, 13, 3052 16 of 23
Figure 10. (a) Comparison of the radiant heat flux (GW, blue diamonds) detected by SEVIRI satellite with the strain signal(black line, in microstrain) and (b) the strain signal recorded at the DRUV station (black line, in microstrain per minute). (1)Strombolian activity and initial weak effusive phase; (2) transitional activity between Strombolian and lava fountaining; thestrain starts to decrease and the strain rate increases; (3) start of the lava fountain phase; (4) the strain rate began to decreaseindicating that the lava fountain intensity was going to decrease; (5) the strain change reached the minimum indicating thatthe lava fountain finished.
Remote Sens. 2021, 13, 3052 17 of 23
It is interesting to observe that the strain signal provided correct timings of the start andend of the lava fountain phase (Figure 10a), with times in agreement with those obtainedfrom the camera frames. The strain rate marked the intensity regime of the explosive phase,and when the sign inversion occurred (at the beginning of phase 4, Figure 10a) there was aprecise indication that the lava fountain began to decline (5, Figure 10b).
5. Discussion
The explosive mechanism of the lava fountains at Etna is generally understood asthe “foam model” [81,82], which takes account of a rapid and violent ascent of a bubblefoam layer previously accumulated at a shallow depth [7,8,14,83]. In this paper we haveanalyzed ground, satellite data and high precision strain signals collected during the 12March lava fountain episode at Etna volcano in order to characterize the formation andgrowth of the lava fountain and of the associated lava flow field, and the way the fountainfeeds the ash column and eruptive plume. The aim was to acquire parameters that couldbe useful for hazard assessment.
The cameras allowed us to observe the phenomenon from the ground and providedprecise information on the characteristics of the lava fountain, on the subsequent erup-tive column, ash plume development, and height. In particular, they constrained thetotal amount of the erupted fluid (gas plus pyroclasts) during the lava fountaining phase,and from this value we extracted the volume of pyroclasts as 0.18% of the total [14,15].Thermal satellite analyses enable estimating the thermal energy and lava flows erupted dur-ing and after the lava fountains. In addition, satellite images reveal the size and elevation ofthe ash plume and their changes in time. The strain measures the response of the volcanicedifice to the decompression caused by the eruptive activity and provides constraints onthe timing and total erupted volume. In general, the approach of integrating these variousobservations allowed us to obtain robust constraints to characterize the phenomenon.
In particular, in this study we have described the Strombolian activity at the vent,which began on 12 March 2021 at 02:35 (Table 2), gradually increasing with time in intensityand frequency of the bursts. Only after 06:40, i.e., after about 4 h of growing explosiveactivity, did the Strombolian activity pass to transitional explosions [14,39,43], and at 07:35,about one hour later, became lava fountaining. This transition corresponds to an increasein coalescence between gas bubbles [39] that drives the change from countable discreteexplosions (Strombolian activity), revealing a bubbly flow regime within the conduit, tothe transitional activity [14,39,43], indicative of a slug flow regime within the conduit,to the uncountable oscillations of a lava fountaining typical of a sustained annular flowregime [84]. It is at this stage—namely when lava fountaining is fully developed—thatabundant ash is released from the fountain margins to feed the ash plume, suggestingfurther passage from an annular flow regime to a dispersed flow regime [84]. The lavafountaining phase showed a growing muzzle velocity that started from 20–30 m s−1,rapidly grew to 70 m s−1, and peaked at 133 m s−1 (Table 2). These values are in the rangeof Etna’s previous paroxysmal events [15,31,85].
Considering that the wind speed during the lava fountaining episode ranged between~5 and 10 m s−1, at an altitude between 3 and 10 km (ERA5 Reanalysis available athttps://cds.climate.copernicus.eu/, accessed on 2 August 2021), the results by Calvariet al. [15] is confirmed, namely that wind speed up to 10 m s−1 leads to a strong tointermediate plume rising vertically above the crater or slightly bending in the winddirection. This shape has a lower impact on the local population because ash fallout ismainly concentrated around the vent, but has a greater impact on aviation because theplume reaches greater elevation [15]. In the case of the 12 March 2021, paroxysmal episode,the ash plume rose to the maximum elevation of 11.3 km a.s.l. at 08:30, as detected from themonitoring cameras (Table 2), but grew even further away from the volcano and reached12.6 km at 10:46 (Figure 8), as detected by the satellite. Thus, even more than one hourafter the end of the lava fountaining, the ash plume was still threatening the airplanespath (Figures 8 and 9). Given that the maximum elevation of the lava fountaining was
Remote Sens. 2021, 13, 3052 18 of 23
detected 10–15 min after the top plume height detected from the EBVH camera (Table 2),it is possible that the maximum elevation of the ash plume was slightly higher than thatdetected by the EBVH ground camera even close to the volcano. This is confirmed by the12.6 km detected by satellite at 10:46 (Figure 8) and is in agreement with what was predictedby the Equation (2) [15] that estimated a maximum ash plume elevation of 12.9 km.
The lava fountaining paroxysm ejected 1.6 × 10⁶ m3 pyroclasts at maximum IERof 276 m3 s−1. Most of the pyroclastic material erupted by the fountaining fell aroundthe vent, further increasing the size of the NSEC cinder cone, as happened in the recentpast [14,15,18,86]. Together with the lava fountaining, a lava flow also erupted from thecrater rim, spreading a volume of 2.4 × 10⁶ m3 over a surface of 1.2 × 10⁶ m2 and travellingfor 3.7 km eastward for a few hours.
The strain, based on the change cumulated during the lava fountain, was particularlyuseful for giving an estimate of the total erupted volumes, comprising both the pyroclastserupted during the lava fountaining phase and the lava flows. In fact, considering the strainchanges recorded during the lava fountains occurring at Etna on 2011–2013, Bonaccorsoet al. [57] inferred a near spherical source of radius 0.5 km located below the crater area ata depth close to the sea level. This source represents the shallow storage where gas-richmagma is trapped and then violently ejected through the lava fountains. During thelava fountain, this source deflated and its volume changed by 2 × 10⁶ m3; due to thecompressibility of the magma that accommodates a further amount of magma, the totalvolume of magma expelled was ~2.5 × 10⁶ m3 [57]. This was considered the representativevolume for a lava fountain producing the mean strain change recorded for the 2011–2013lava fountains, which was a 0.15 microstrain. Since the expected strain caused by adepressurizing spherical source is linearly related to the volume change of this source [87],we can use the results obtained by Bonaccorso et al. [57] to estimate the volume emittedby the NSEC lava fountains by the amplitude of the strain change at DRUV. For the 12March 2021, episode, the 0.18 microstrain corresponds to a total emitted volume of ~3× 10⁶ m3, comprising both lava flows and pyroclasts. This value results in an averageeruption rate of 385 m3 s−1. However, by summing up the satellite-derived lava flowvolume and the thermal camera derived pyroclastic volumes, a value of 4 × 10⁶ m3 isobtained. We argue that the lava fountain heights analysis measured a quantity of magmathat partly flowed as lava flow and partly fell into the cone as pyroclasts. Indeed, bycomparing the satellite-derived and the thermal camera derived volumes, the quantity ofmagma ejected into the fountain and falling into the lava flow field is about 1 × 10⁶ m3,while about 0.6 × 10⁶ m3 is related to pyroclasts. This value is comparable with the growthof the NSEC cone already measured during 2011–2013 [14], but also with a recent DEMdifference computation by using Pleiades data (6.4 × 10⁶ m3 during 12 eruptive episodes;Ganci et al. unpublished data).
It is noteworthy that sustained ash plumes at the Etna volcano always accompanylava fountains [10,11,14,15,17,25,52–54,59]. Ash plumes cause the greatest concern on thecivil protection authorities because they can attain up to 12–14 km in elevation [52,88]causing severe threat to the air traffic, while still expanding in the atmosphere, but alsogreat damage to infrastructures, viability, and public health upon falling on the ground [30].The ash plume forms as soon as the explosive activity shifts from transitional to lava foun-tain (stage 3 in Figure 10), most often within 30 min from the paroxysmalstart [14,15,25]. It corresponds to an acceleration of the jet that is responsible for the peakIER (Table 2) and the greater cooling and fragmentation of pyroclasts [25,33,44]. The heatreleased during the lava fountain phase is sufficient to rise a large volume of fine-grainedpyroclasts (ash) up into the atmosphere, causing it to spread for several hours around thevolcano, and to travel distances of several tens of kilometers [89].
A numerical study involving explosive eruptions, carried out at the Etna volcano [90],estimated that the mass deposited over a distance of 1 and 100 km from the vent represents30% of the emitted pyroclastic mass. Thus, it is noteworthy that this amount was sufficientto feed an ash plume 11–13 km high (Table 2, Figures 4 and 5) expanding for hundreds of
Remote Sens. 2021, 13, 3052 19 of 23
kilometers from the vent (Figures 8 and 9), and covering a sky surface of up to 1900 km2
and a distance of ~140 km from the vent in two and half hours. This matches a plume-cloud expanding for 60 km from the vent in just 50 min during a previous paroxysmalepisode [89], and fully displays the hazard posed by the ash cloud to aviation safetyand circulation also because of growing airline traffic [91–93]. It is, thus, of paramountimportance to use monitoring data to develop simple equations, such as those used duringrecent effusive eruptions at Etna [94,95], which might allow for fast and reliable estimatesuseful for hazard assessment during the earlier phases of an explosive paroxysm. In thisrespect, application of the formula proposed by Calvari et al. [15], to estimate the maximumvertical extent of the ash plume once the lava fountaining phase stabilized, proved to beeffective when applied to the 12 March 2021, paroxysm. In fact, this formula estimated anash plume maximum elevation of 12.9 km a.s.l., which is a value very close to the 12.6 kma.s.l. estimated from the satellite images.
6. Conclusions
Our results have essential implications in regard to hazard assessments at Etna duringparoxysmal explosive phases. They confirm the role of wind speed [15] in determining if astrong, intermediate, or weak ash plume forms, with wind speeds below 10 m s−1 favoringthe formation of strong to intermediate, taller vertical plumes, which cause most of thepyroclastic fallout around the vent. Our results on the 12 March 2021, episode confirm thepossibility of estimating the maximum ash plume elevation using the formula proposed byCalvari et al. [15], given that the maximum plume elevation obtained by satellite (12.6 km)was very close to the 12.9 km estimated by the empirical formula. Integrating results fromthe ground monitoring cameras, satellite, and strainmeters, we obtained an estimation ofthe total erupted volume of 3 × 10⁶ m3, of which 1.6 × 10⁶ m3 erupted as pyroclasts, with~1 × 10⁶ m3 of the volume of pyroclasts flowing together with the lava flows to comprise alava flow field extending over a surface of ~1.17 × 10⁶ m2, with a volume of 2.4 × 10⁶ m3.Considering the duration of 130 min for the episode, there was an average eruption rate of385 m3 s−1 for this event, comprising both pyroclasts and lava flows. Our results show thatextreme caution must be applied when calculating the volume erupted during paroxysmalepisodes, combining data obtained from monitoring cameras and satellites. In fact, bycomparing these results with the strain changes at the shallow magma source, we haveshown how a significant portion of pyroclasts (~1 × 10⁶ m3) flowed along the flanks of theNSEC cone to feed the lava flows. This corresponds to ~33% of the total volume eruptedby the paroxysmal episode.
Although the duration of the eruptive event was rather short (130 min), the expansionof the ash cloud continued for the following hours, reaching the maximum elevationdetected by satellite about 1 h after the end of the paroxysm (Figures 8 and 9). The ashcloud expanded in the atmosphere and eventually detached from the volcano 1.5 h afterthe end of the paroxysm (Figure 9). This result must be taken into account when organizingair traffic immediately after the end of an explosive paroxysm.
Author Contributions: Conceptualization, S.C.; methodology, S.C., G.G., A.B.; validation, S.C.,G.G., A.B.; formal analysis, S.C., G.G., A.B.; investigation, S.C., G.G., A.B.; resources, S.C.; datacuration, S.C., G.G., A.B.; visible and thermal ground imagery data treatment, S.C., G.G.; satellite datatreatment, G.G.; ground deformation data treatment, A.B.; writing—original draft preparation, S.C.,G.G., A.B.; writing—review and editing, S.C., G.G., A.B.; visualization, S.C., G.G., A.B.; supervision,S.C., G.G., A.B.; project administration, S.C.; funding acquisition, S.C. All authors have read andagreed to the published version of the manuscript.

Remote Sens. 2021, 13, 3052 20 of 23
Funding: This research was funded by the Project FIRST-ForecastIng eRuptive activity at Strombolivolcano: timing, eruptive style, size, intensity, and duration, INGV-Progetto Strategico DipartimentoVulcani 2019, (Delibera n. 144/2020; Scientific Responsibility: S.C.). The research has moreoverbenefited from funding provided by the Italian Presidenza del Consiglio dei Ministri—Dipartimentodella Protezione Civile (DPC), All. B2-Task 11 “Real-time quantification of Etna’s eruptive activityfrom fixed thermal cameras and satellite data”. (Scientific Responsibility: G.G.) and Task 9 “Ottimiz-zazione dell’acquisizione dei segnali ad alta precisione degli strainmeter installati in pozzo sull’Etna”(Scientific Responsibility: A.B.). A.B. also benefited from the EC 298H2020-FET OPEN project grantagreement n. 863220 “SiC optical nano-strain-meters for pico-detection in Geosciences” (SiC nano forpicoGeo). This paper does not necessarily represent DPC’s official opinions and policies.
Data Availability Statement: The cameras and strainmeter data used in this study are propertyof INGV-OE (Istituto Nazionale di Geofisica e Vulcanologia—Osservatorio Etneo, Sezione di Cata-nia). They can be made available, upon reasonable request, asking to the corresponding author.The satellite data processed and presented in this study are openly available.
Acknowledgments: We would like to thank the scientists and technicians from INGV-OE for moni-toring the network maintenance, especially E. Pecora and M. Prestifilippo for providing informationessential for this work. We are grateful to EUMETSAT for SEVIRI data (https://data.eumetsat.int), tothe National Aeronautics and Space Administration (NASA) for MODIS data (modis.gsfc.nasa.gov),to the National Oceanic and Atmospheric Administration (NOAA) for VIIRS data (https://www.bou.class.noaa.gov/), and to the Sentinel Hub services (https://scihub.copernicus.eu/) (accessed on2 August 2021) for Copernicus Sentinel data. The English style was corrected by Stephan Conway.
Conflicts of Interest: The authors declare no conflict of interest.
References1. Wilson, L.; Parfitt, E.A.; Head, J.W., III. Explosive volcanic eruptions-VIII. The role of magma recycling in controlling the
behaviour of Hawaiian-style lava fountains. Geophys. J. Int. 1995, 121, 215–225. [CrossRef]2. Swanson, D.A.; Duffield, W.A.; Jackson, D.B.; Peterson, D.W. Chronological Narrative of the 1969–71 Mauna Ulu Eruption of Kilauea
Volcano, Hawai’i; U.S. Geological Survey Professional Paper 1056; U.S. Government Printing Office: Washington, DC, USA, 1979.3. Wolfe, E.W.; Neal, C.A.; Banks, N.G.; Duggan, T.J. Geological observations and chronology of eruptive events. In The Puu
Oo eruption of Kilauea Volcano, Hawaii; Episodes 1 through 20, January 3, 1983, through June 8, 1984; U.S. Geological SurveyProfessional Paper 1463; U.S. Government Printing Office: Washington, DC, USA, 1988.
4. Parfitt, E.A.; Wilson, L. The 1983–86 Pu’u’O’o eruption at Kilauea Volcano, Hawaii: A study of dike geometry and eruptionmechanisms for a long-lived eruption. J. Volcanol. Geotherm. Res. 1994, 59, 179–205. [CrossRef]
5. Parcheta, C.E.; Houghton, B.F.; Swanson, D.A. Contrasting patterns of vesiculation in low, intermediate, and high Hawaiianfountains: A case study of the 1969 Mauna Ulu eruption. J. Volcanol. Geotherm. Res. 2013, 255, 79–89. [CrossRef]
6. Alparone, S.; Andronico, D.; Lodato, L.; Sgroi, T. Relationship between tremor and volcanic activity during the Southeast Cratereruption on Mount Etna in early 2000. J. Geophys. Res. 2003, 108, B52241. [CrossRef]
7. Allard, P.; Burton, M.; Murè, F. Spectroscopic evidence for a lava fountain driven by previously accumulated magmatic gas.Nature 2005, 433, 407–410. [CrossRef] [PubMed]
8. Andronico, D.; Corsaro, R.A. Lava fountains during the episodic eruption of South–East Crater (Mt. Etna), 2000: Insights intomagma-gas dynamics within the shallow volcano plumbing system. Bull. Volc. 2011, 73, 1165–1178. [CrossRef]
9. Behncke, B.; Neri, M. The July-August 2001 eruption of Mt. Etna (Sicily). Bull. Volcanol. 2003, 65, 461–476. [CrossRef]10. Andronico, D.; Branca, S.; Calvari, S.; Burton, M.R.; Caltabiano, T.; Corsaro, R.A.; Del Carlo, P.; Garfì, G.; Lodato, L.;
Miraglia, L.; et al. A multi-disciplinary study of the 2002–03 Etna eruption: Insights for into a complex plumbing system.Bull. Volcanol. 2005, 67, 314–330. [CrossRef]
11. Andronico, D.; Scollo, S.; Caruso, S.; Cristaldi, A. The 2002–03 Etna explosive activity: Tephra dispersal and features of thedeposits. J. Geophys. Res. 2008, 113, B04209. [CrossRef]
12. Bonaccorso, A.; Calvari, S. A new approach to investigate an eruptive paroxysmal sequence using camera and strainmeternetworks: Lessons from the 3–5 December 2015 activity at Etna volcano. Earth Plan. Sci. Lett. 2017, 475, 231–241. [CrossRef]
13. Bonaccorso, A.; Calvari, S.; Linde, A.; Sacks, S. Eruptive processes leading to the most explosive lava fountain at Etna volcano:The 23 November 2013 episode. Geophys. Res. Lett. 2014, 41, 4912–4919. [CrossRef]
14. Calvari, S.; Salerno, G.G.; Spampinato, L.; Gouhier, M.; La Spina, A.; Pecora, E.; Harris, A.J.L.; Labazuy, P.; Biale, E.; Boschi, E.An unloading foam model to constrain Etna’s 11–13 January 2011 lava fountaining episode. J. Geophys. Res. 2011, 116, B11207.[CrossRef]
15. Calvari, S.; Cannavò, F.; Bonaccorso, A.; Spampinato, L.; Pellegrino, A.G. Paroxysmal Explosions, Lava Fountains and AshPlumes at Etna Volcano: Eruptive Processes and Hazard Implications. Front. Earth Sci. 2018, 6, 107. [CrossRef]
Remote Sens. 2021, 13, 3052 21 of 23
16. Ganci, G.; Cappello, A.; Bilotta, G.; Herault, A.; Zago, V.; Del Negro, C. Mapping volcanic deposits of the 2011–2015 Etna Eruptiveevents using satellite remote sensing. Front. Earth Sci. 2018, 6, 83. [CrossRef]
17. Andronico, D.; Cannata, A.; Di Grazia, G.; Ferrari, F. The 1986–2021 paroxysmal episodes at the summit craters of Mt. Etna:Insights into volcano dynamics and hazard. Earth Sci. Rev. 2021, 220, 103686. [CrossRef]
18. Behncke, B.; Stefano Branca, S.; Corsaro, R.A.; De Beni, E.; Miraglia, L.; Proietti, C. The 2011–2012 summit activity of Mount Etna:Birth, growth and products of the new SE crater. J. Volcanol. Geoth. Res. 2014, 270, 10–21. [CrossRef]
19. Andronico, D.; Scollo, S.; Cristaldi, A.; Lo Castro, M.D. Representativity of incompletely sampled fall deposits in estimatingeruption source parameters: A test using the 12–13 January 2011 lava fountain deposit from Mt. Etna volcano, Italy. Bull. Volcanol.2014, 76, 861. [CrossRef]
20. Wadge, G.; Guest, J.E. Steady-state magma discharge at Etna 1971–81. Nature 1981, 294, 548–550. [CrossRef]21. Harris, A.J.L.; Steffke, A.; Calvari, S.; Spampinato, L. Thirty years of satellite-derived lava discharge rates at Etna: Implications
for steady volumetric output. J. Geophys. Res. 2011, 116, B08204. [CrossRef]22. Bonaccorso, A.; Calvari, S. Major effusive eruptions and recent lava fountains: Balance between erupted and expected magma
volumes at Etna volcano. Geophys. Res. Lett. 2013, 40, 6069–6073. [CrossRef]23. Bonaccorso, A.; Aloisi, M. Tracking magma storage: New perspectives from 40 years (1980–2020) of ground deformation source
modeling on etna volcano. Front. Earth Sci. 2021, 9, 638742. [CrossRef]24. Aloisi, M.; Bonaccorso, A.; Cannavò, F.; Currenti, G.; Gambino, S. The 24 December 2018 eruptive intrusion at Etna volcano as
revealed by multidisciplinary continuous deformation networks (CGPS, borehole strainmeters and tiltmeters). J. Geophys. Res.2020, 125, e2019JB019117. [CrossRef]
25. Calvari, S.; Bilotta, G.; Bonaccorso, A.; Caltabiano, T.; Cappello, A.; Corradino, C.; Del Negro, C.; Ganci, G.; Neri, M.;Pecora, E.; et al. The VEI 2 Christmas 2018 Etna eruption: A small but intense eruptive event or the starting phase of alarger one? Remote Sens. 2020, 12, 905. [CrossRef]
26. De Beni, E.; Cantarero, M.; Neri, M.; Messina, A. Lava flows of Mt Etna, Italy: The 2019 eruption within the context of the last twodecades (1999–2019). J. Maps. 2020, 17, 65–76. [CrossRef]
27. Mattia, M.; Bruno, V.; Montgomery-Brown, E.; Patanè, D.; Barberi, G.; Coltelli, M. Combined seismic and geodetic analysis before,during, and after the 2018 Mount Etna eruption. Geochem. Geophys. Geosyst. 2020, 21, e2020GC009218. [CrossRef]
28. Kampouri, A.; Amiridis, V.; Solomos, S.; Gialitaki, A.; Marinou, E.; Spyrou, C.; Georgoulias, A.K.; Akritidis, D.; Papagiannopoulos,N.; Mona, L. Investigation of Volcanic Emissions in the Mediterranean: “The Etna–Antikythera Connection”. Atmosphere 2021,2, 40. [CrossRef]
29. Wilson, T.M.; Cole, J.W.; Stewart, C.; Cronin, S.J.; Johnston, D.M. Ash storms: Impacts of wind-remobilised volcanic ash onrural communities and agriculture following the 1991 Hudson eruption, southern Patagonia, Chile. Bull. Volc. 2011, 73, 223–239.[CrossRef]
30. Andronico, D.; Del Carlo, P. PM10 measurements in urban settlements after lava fountain episodes at Mt. Etna, Italy: Pilot test toassess volcanic ash hazard to human health. Nat. Hazards Earth Syst. Sci. Discuss. 2016, 16, 29–40. [CrossRef]
31. Donnadieu, F.; Freville, P.; Hervier, C.; Coltelli, M.; Scollo, S.; Prestifilippo, M.; Valade, S.; Rivet, S.; Cacault, P. Near-sourceDoppler radar monitoring of tephra plumes at Etna. J. Volcanol. Geotherm. Res. 2016, 312, 26–39. [CrossRef]
32. Marzano, F.S.; Mereu, L.; Scollo, S.; Donnadieu, F.; Bonadonna, C. Tephra Mass Eruption Rate From Ground-Based X-Band andL-Band Microwave Radars During the November 23, 2013, Etna Paroxysm. IEEE Trans. Geosci. Rem. Sens. 2020, 58, 3314–3327.[CrossRef]
33. Patrick, M.R.; Harris, A.J.L.; Ripepe, M.; Dehn, J.; Rothery, D.; Calvari, S. Strombolian explosive styles and source conditions:Insights from thermal (FLIR) video. Bull. Volcanol. 2007, 69, 769–784. [CrossRef]
34. Murata, K.J.; Dondoli, C.; Saenz, R. The 1963–65 eruption of Irazú Volcano, Costa Rica (the period of March 1963 to October 1964).Bull. Volcanol. 1966, 29, 765–796. [CrossRef]
35. Booth, B.; Walker, G.P.L. Ash deposits from the new explosion crater, Etna 1971. Trans. R. Soc. Lond. 1973, A274, 147–161.36. Taddeucci, J.; Pompilio, M.; Scarlato, P. Conduit processes during the July–August 2001 explosive activity of Mt Etna (Italy):
Inferences from glass chemistry and crystal size distribution of ash particles. J. Volcanol. Geotherm. Res. 2004, 137, 33–54.[CrossRef]
37. Lautze, N.; Houghton, B.F. Physical mingling of magma and complex eruption dynamics in the shallow conduit at StromboliVolcano, Italy. Geology 2005, 33, 425–428. [CrossRef]
38. Head, J.W.; Wilson, L. Lava fountain heights at Pu’u O’o, Kilauea, Hawaii: Indicators of amount and variations of ex- solvedmagma volatiles. J. Geophys. Res. 1987, 92, 13715–13719. [CrossRef]
39. Parfitt, E.A.; Wilson, L.; Neal, C.A. Factors influencing the height of Hawaiian lava fountains: Implications for the use of fountainheight as an indicator of magma gas content. Bull. Volcanol. 1995, 57, 440–450. [CrossRef]
40. Walker, G.P.L. Explosive volcanic eruptions—a new classification scheme. Geol. Rundsch. 1973, 62, 431–446. [CrossRef]41. Parfitt, E.A. A study of clast size distribution, ash deposition and fragmentation in a Hawaiian-style volcanic eruption. J. Volcanol.
Geotherm. Res. 1998, 84, 197–208. [CrossRef]42. Sparks, R.S.J.; Bursik, M.I.; Carey, S.N.; Gilbert, J.S.; Glaze, L.S.; Sigurdsson, H.; Woods, A.W. Volcanic Plumes; John Wiley Sons:
Hoboken, NJ, USA, 1997; p. 574. ISBN 0-471-93901-3.

Remote Sens. 2021, 13, 3052 22 of 23
43. Spampinato, L.; Calvari, S.; Oppenheimer, C.; Lodato, L. Shallow magma transport for the 2002–03 Mt. Etna eruption inferredfrom thermal infrared surveys. J. Volcanol. Geotherm. Res. 2008, 177, 301–312. [CrossRef]
44. Taddeucci, J.; Pompilio, M.; Scarlato, P. Monitoring the explosive activity of the July–August 2001 eruption of Mt. Etna (Italy) byash characterization. Geophys. Res. Lett. 2002, 29, 71-1–71-4. [CrossRef]
45. Dellino, P.; Kyriakopoulos, K. Phreatomagmatic ash from the ongoing eruption of Etna reaching the Greek island of Cefalonia.J. Volcanol. Geotherm. Res. 2003, 126, 341–345. [CrossRef]
46. Calvari, S.; Pinkerton, H. Birth, growth and morphologic evolution of the “Laghetto” cinder cone during the 2001 Etna eruption.J. Volcanol. Geotherm. Res. 2004, 132, 225–239. [CrossRef]
47. Calvari, S.; Pinkerton, H. Instabilities in the summit region of Mount Etna during the 1999 eruption. Bull. Volcanol. 2002,63, 526–535. [CrossRef]
48. Andronico, D.; Spinetti, C.; Cristaldi, A.; Buongiorno, M.F. Observations of Mt. Etna volcanic ash plumes in 2006: An integratedapproach from ground-based and polar satellite NOAA–AVHRR monitoring system. J. Volcanol. Geotherm. Res. 2009, 180, 135–147.[CrossRef]
49. Harris, D.M.; Rose, W.I. Estimating particle size, concentrations, and total mass of ash in volcanic clouds using weather radar.J. Geoph. Res. 1983, 88, 10969–10983. [CrossRef]
50. Spinetti, C.; Barsotti, S.; Neri, A.; Buongiorno, M.F.; Doumaz, F.; Nannipieri, L. Investigation of the complex dynamics andstructure of the 2010 Eyjafjallajokull volcanic ash cloud using multispectral images and numerical simulations. J. Geophys. Res.Atmos. 2013, 118, 4729–4747. [CrossRef]
51. Durig, T.; Gudmundsson, M.T.; Karmann, S.; Zimanowski, B.; Dellino, P.; Rietze, M.; Buttner, R. Mass eruption rates inpulsating eruptions estimated from video analysis of the gas thrust-buoyancy transition—A case study of the 2010 eruption ofEyjafjallajökull, Iceland. Earth Planets Space 2015, 67, 180. [CrossRef]
52. Corradini, S.; Montopoli, M.; Guerrieri, L.; Ricci, M.; Scollo, S.; Merucci, L.; Marzano, F.S.; Pugnaghi, S.; Prestifilippo, M.; Ventress,L.J.; et al. Multi-Sensor Approach for volcanic ash cloud retrieval and eruption characterization: The 23 November 2013 EtnaLava Fountain. Remote Sens. 2016, 8, 58. [CrossRef]
53. Corradini, S.; Guerrieri, L.; Stelitano, D.; Salerno, G.; Scollo, S.; Merucci, L.; Prestifilippo, M.; Musacchio, M.; Silvestri, M.;Lombardo, V.; et al. Near real-time monitoring of the Christmas 2018 Etna eruption using SEVIRI and products validation. RemoteSens. 2020, 12, 1336. [CrossRef]
54. Corradini, S.; Guerrieri, L.; Brenot, H.; Clarisse, L.; Merucci, L.; Pardini, F.; Prata, A.J.; Realmuto, V.J.; Stelitano, D.; Theys, N.Tropospheric volcanic SO2 mass and flux retrievals from satellite. The Etna December 2018 eruption. Remote Sens. 2021, 13, 2225.[CrossRef]
55. Athanassiadou, M. The Mt Etna SO2 eruption in December 2015—The view from space. Weather 2016, 71, 273–278. [CrossRef]56. Bluth, G.J.S.; Doiron, S.D.; Schnetzler, C.C.; Krueger, A.J.; Walter, L.S. Global tracking of the SO2 cloud from the June, 1991 Mount
Pinatubo eruptions. Geophys. Res. Lett. 1992, 19, 151–154. [CrossRef]57. Bonaccorso, A.; Calvari, S.; Currenti, G.; Del Negro, C.; Ganci, G.; Linde, A.; Napoli, R.; Sacks, S.; Sicali, A. From source to surface:
Dynamics of Etna’s lava fountains investigated by continuous strain, magnetic, ground and satellite thermal data. Bull. Volcanol.2013, 75, 690. [CrossRef]
58. Bonaccorso, A.; Currenti, G.; Linde, A.; Sacks, S. New data from borehole strainmeters to infer lava fountain sources (Etna2011–2012). Geophys. Res. Lett. 2013, 40, 3579–3584. [CrossRef]
59. Corradini, S.; Guerrieri, L.; Lombardo, V.; Merucci, L.; Musacchio, M.; Prestifilippo, M.; Scollo, S.; Silvestri, M.; Spata, G.; Stelitano,D. Proximal monitoring of the 2011–2015 Etna lava fountains using MSG-SEVIRI data. Geosciences 2018, 8, 140. [CrossRef]
60. Scollo, S.; Prestifilippo, M.; Pecora, E.; Corradini, S.; Merucci, L.; Spata, G.; Coltelli, M. Eruption column height estimation of the2011–2013 Etna lava fountains. Ann. Geophys. 2014, 57, S0214.
61. Scollo, S.; Prestifilippo, M.; Bonadonna, C.; Cioni, R.; Corradini, S.; Degruyter, W.; Rossi, E.; Silvestri, M.; Biale, E.; Carparelli, G.;et al. Near-real-time tephra fallout assessment at Mt. Etna, Italy. Remote Sens. 2019, 11, 2987. [CrossRef]
62. Ganci, G.; James, M.R.; Calvari, S.; Del Negro, C. Separating the thermal fingerprints of lava flows and simultaneous lavafountaining using ground-based thermal camera and SEVIRI measurements. Geophys. Res. Lett. 2013, 40, 5058–5063. [CrossRef]
63. Corradino, C.; Ganci, G.; Cappello, A.; Bilotta, G.; Calvari, S.; Del Negro, C. Recognizing eruptions of mount etna throughmachine learning using multiperspective infrared images. Remote Sens. 2020, 12, 970. [CrossRef]
64. Ganci, G.; Vicari, A.; Cappello, A.; Del Negro, C. An emergent strategy for volcano hazard assessment: From thermal satellitemonitoring to lava flow modelling. Remote Sens. Environ. 2012, 119, 197–207. [CrossRef]
65. Ganci, G.; Harris, A.J.L.; Del Negro, C.; Guéhenneux, Y.; Cappello, A.; Labazuy, P.; Calvari, S.; Gouhier, M. A year of lavafountaining at Etna: Volumes from SEVIRI. Geophys. Res. Lett. 2012, 39, L06305. [CrossRef]
66. Ganci, G.; Vicari, A.; Fortuna, L.; Del Negro, C. The HOTSAT volcano monitoring system based on combined use of SEVIRI andMODIS multispectral data. Ann. Geophys. 2011, 54, 5. [CrossRef]
67. Ganci, G.; Cappello, A.; Bilotta, G.; Corradino, C.; Mangiameli, M.; Mussumeci, G.; Del Negro, C. 3D Lava flow mapping involcanic areas using multispectral and stereo optical satellite data. AIP Conf. Proc. 2020, 2293, 300003. [CrossRef]
68. Harris, A.J.L.; Dehn, J.; Calvari, S. Lava effusion rate definition and measurement: A review. Bull. Volcanol. 2007, 70, 1–22.[CrossRef]
Remote Sens. 2021, 13, 3052 23 of 23
69. Harris, A.J.L.; Flynn, L.P.; Keszthelyi, L.; Mouginis-Mark, P.J.; Rowland, S.K.; Resing, J.A. Calculation of lava effusion rates fromLandsat TM data. Bull. Volcanol. 1998, 60, 52–71. [CrossRef]
70. Wright, R.; Blake, S.; Harris, A.; Rothery, D. A simple explanation for the space-based calculation of lava eruption rates. EarthPlan. Sci. Lett. 2001, 192, 223–233. [CrossRef]
71. Garel, F.; Kaminski, E.; Tait, S.; Limare, A. An experimental study of the surface thermal signature of hot subaerial isoviscousgravity currents: Implications for thermal monitoring of lava flows and domes. J. Geophys. Res. 2012, 117, B02205. [CrossRef]
72. Hon, K.; Kauahikaua, J.; Denlinger, R.; Mackay, K. Emplacement and inflation of pahoehoe sheet flows: Observations andmeasurements of active lava flows on Kilauea Volcano, Hawaii. Geol. Soc. Am. Bull. 1994, 106, 351–370. [CrossRef]
73. Prata, A.J.; Bluth, G.J.S.; Rose, W.I.; Schneider, D.J.; Tupper, A.C. Comments on failures in detecting volcanic ash from asatellite-based technique. Remote Sens. Environ. 2001, 78, 341–346. [CrossRef]
74. Del Negro, C.; Cappello, A.; Ganci, G. Quantifying lava flow hazards in response to effusive eruption. Geol. Soc. Am. 2015,128, 752–763. [CrossRef]
75. Corradino, C.; Ganci, G.; Cappello, A.; Bilotta, G.; Herault, A.; Del Negro, C. Mapping recent lava flows at Mount Etna usingmultispectral sentinel-2 images and machine learning techniques. Remote Sens. 2019, 11, 1916. [CrossRef]
76. Bonaccorso, A.; Linde, A.; Currenti, G.; Sacks, S.; Sicali, A. Theborehole dilatometer network of Mount Etna: A powerful tool todetect and infer volcano dynamics. J. Geophys. Res. Solid Earth 2016, 121, 4655–4669. [CrossRef]
77. Currenti, G.; Zuccarello, L.; Bonaccorso, A.; Sicali, A. Borehole volumetric strainmeter calibration from a nearby seismic broadbandarray at Etna volcano. J. Geophys. Res. 2017, 122, 7729–7738. [CrossRef]
78. Bonaccorso, A.; Currenti, G.; Linde, A.; Sacks, S.; Sicali, A. Advances in understanding intrusive, explosive and effusive processesas revealed by the borehole dilatometer network on Mt. Etna volcano. Front. Earth Sci. 2020, 7, 357. [CrossRef]
79. Marchese, F.; Neri, M.; Behncke, B. Main morpho-structural changes and eruptions of Etna in 2016–2019 captured by satelliteobservations. In Proceedings of the 22nd EGU General Assembly, Online Event, 4–8 May 2020; p. EGU2020-13909. [CrossRef]
80. Genzano, N.; Marchese, F.; Neri, M.; Pergola, N.; Tramutoli, V. Implementation of robust satellite techniques for volcanoes onASTER data under the google earth engine platform. Appl. Sci. 2021, 11, 4201. [CrossRef]
81. Jaupart, C.; Vergniolle, S. Laboratory models of Hawaiian and Strombolian eruptions. Nature 1988, 331, 58–60. [CrossRef]82. Jaupart, C.; Veirgniolle, S. The generation and collapse of foam layer at the roof of a basaltic magma chamber. J. Fluid Mech. 1989,
203, 347–380. [CrossRef]83. Bonaccorso, A.; Cannata, A.; Corsaro, R.A.; Di Grazia, G.; Gambino, S.; Greco, F.; Miraglia, L.; Pistorio, A. Multi-disciplinary
investigation on a lava fountain preceding a flank eruption: The 10 May 2008 Etna case. Geochem. Geophys. Geosyst. 2011, 12, 7.[CrossRef]
84. Jaupart, C. Magma ascent at shallow levels. Encycl. Volcanoes 1999, 1, 237–245.85. Dubosclard, G.; Cordesses, R.; Allard, P.; Hervier, C.; Coltelli, M.; Kornprobst, J. First testing of a volcano Doppler radar (Voldorad)
at Mt. Etna. Geophys. Res. Lett. 1999, 26, 3389–3392. [CrossRef]86. De Beni, E.; Behncke, S.; Branca, I.; Nicolosi, R.; Carluccio, F.; D’Ajello, C.; Chiappini, M. The continuing story of Etna’s new
southeast crater (2012–2014): Evolution and volume calculations based on field surveys and aerophotogrammetry. J. Volcanol.Geotherm. Res. 2015, 303, 175–186. [CrossRef]
87. Roeloffs, E.A.; Linde, A.T. Borehole observations and continuous strain and fluid pressure. In Volcano Deformation GeodeticMeasurments Techniques; Dzurisin, D., Ed.; Springer: Berlin/Heidelberg, Germany, 2007; pp. 305–322. [CrossRef]
88. Vulpiani, G.; Ripepe, M.; Valade, S. Mass discharge rate retrieval combining weather radar and thermal camera observations.J. Geophys. Res. Solid Earth 2016, 121, 5679–5695. [CrossRef]
89. Pailot-Bonnétat, S.; Harris, A.J.L.; Calvari, S.; De Michele, M.; Gurioli, L. Plume height time-series retrieval using shadow insingle spatial resolution satellite images. Remote Sens. 2020, 12, 3951. [CrossRef]
90. Spanu, A.; de’Michieli Vitturi, M.; Barsotti, S. Reconstructing eruptive source parameters from tephra deposit: A numerical studyof medium-sized explosive eruptions at Etna volcano. Bull. Volcanol. 2016, 78, 59. [CrossRef]
91. Casadevall, T.J. Volcanic ash and aviation safety: Proceedings of the First International Symposium on Volcanic Ash and AviationSafety. USGS Bull. 1994, 2047, 450–469.
92. Rose, W.I.; Delene, D.J.; Schneider, D.J.; Bluth, G.J.S.; Krueger, A.J.; Sprod, I.; McKee, C.; Davies, H.L.; Erns, G.G.J. Ice in the 1994Rabaul eruption cloud: Implications for volcano hazard and atmospheric effects. Nature 1995, 375, 477–479. [CrossRef]
93. Marzano, F.S.; Picciotti, E.; Montopoli, M.; Vulpiani, G. Inside Volcanic Clouds. Remote Sensing of Ash Plumes Using MicrowaveWeather Radars. Am. Meteorol. Soc. 2013, 94, 1567–1586. [CrossRef]
94. Bonaccorso, A.; Calvari, S.; Boschi, E. Hazard mitigation and crisis management during major flank eruptions at Etna volcano:Reporting on real experience. In Detecting, Modelling and Responding to Effusive Eruptions; Harris, A.J.L., De Groeve, T., Garel, F.,Carn, S.A., Eds.; Special Publications (IAVCEI) Series; Geological Society of London: London, UK, 2015; Volume 426, pp. 447–461.ISBN 978-1-86239-736-1. [CrossRef]
95. Solana, M.C.; Calvari, S.; Kilburn, C.R.J.; Gutierrez, H.; Chester, D.; Duncan, A. Supporting the development of procedures forcommunications during volcanic emergencies: Lessons learnt from the Canary Islands (Spain) and Etna and Stromboli (Italy).In Advances in Volcanology, Observing the Volcano World, Volcano Crisis Communication; Fearnley, C.J., Bird, D.K., Haynes, K.,McGuire, W.J., Jolly, G., Eds.; Springer: Cham, Switzerland, 2017; pp. 289–305. ISBN 978-3-319-44095-8. [CrossRef]