
Analyzing tropical cyclone tracks of North Indian Ocean By Dr. Mukta Paliwal CSE, IIT Bombay.
27
Analyzing tropical cyclone tracks of North Indian Ocean By Dr. Mukta Paliwal CSE, IIT Bombay
-
Upload
jasper-fox -
Category
Documents
-
view
218 -
download
4
Transcript of Analyzing tropical cyclone tracks of North Indian Ocean By Dr. Mukta Paliwal CSE, IIT Bombay.

Analyzing tropical cyclone tracks of North Indian Ocean
By Dr. Mukta PaliwalCSE, IIT Bombay

Introduction
• Tropical cyclones are low pressure systems that have thunderstorm activity and rotate counterclockwise.
• Tropical cyclones form over all tropical oceanic areas except the South Atlantic and the Southeast Pacific.
• Western North Pacific accounts for the largest number of Tropical Cyclones (Typhoons), averaging 26 per year, followed by Eastern North Pacific (17), South Indian Ocean (10) and North Atlantic (10).
• In comparison, North Indian Ocean basin has an average of only 5.5 cyclones per year.
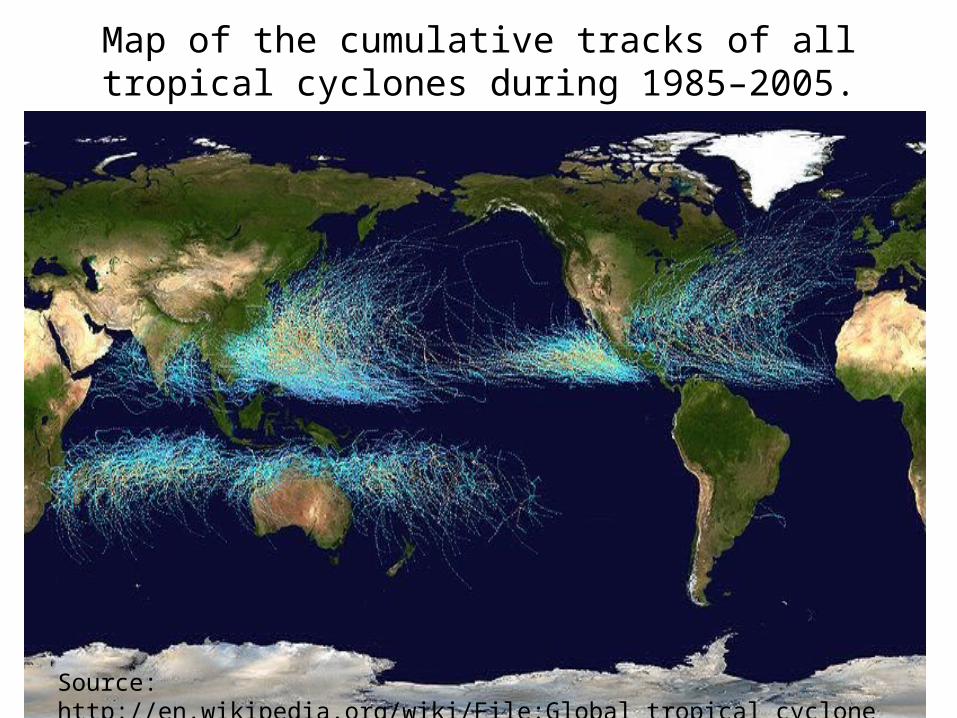
Map of the cumulative tracks of all tropical cyclones during 1985–2005.
Source: http://en.wikipedia.org/wiki/File:Global_tropical_cyclone_tracks-edit2.jpg
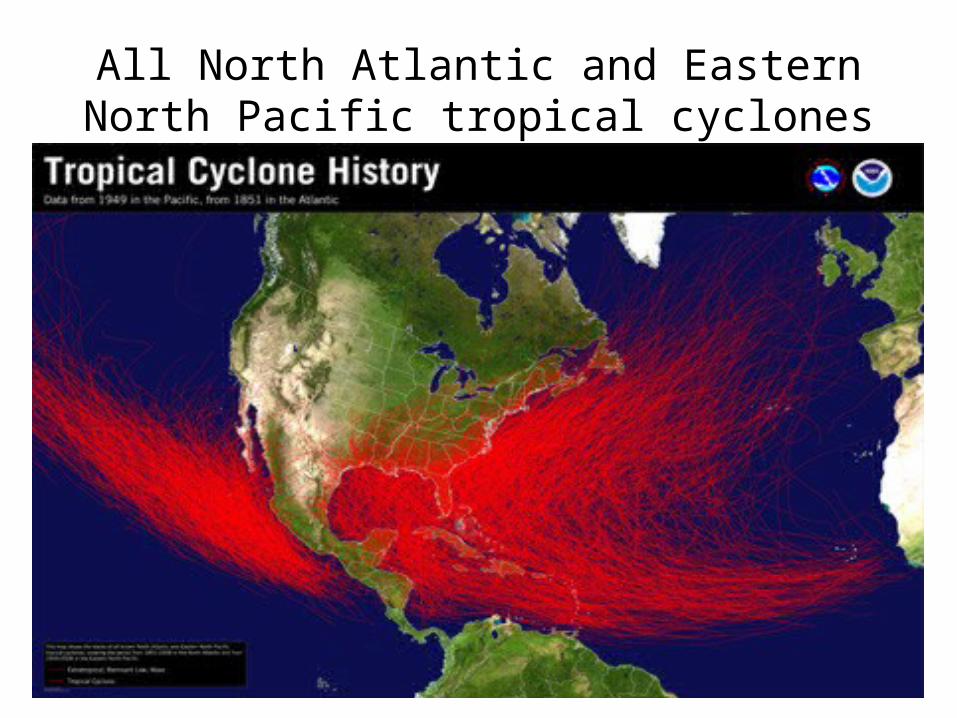
All North Atlantic and Eastern North Pacific tropical cyclones
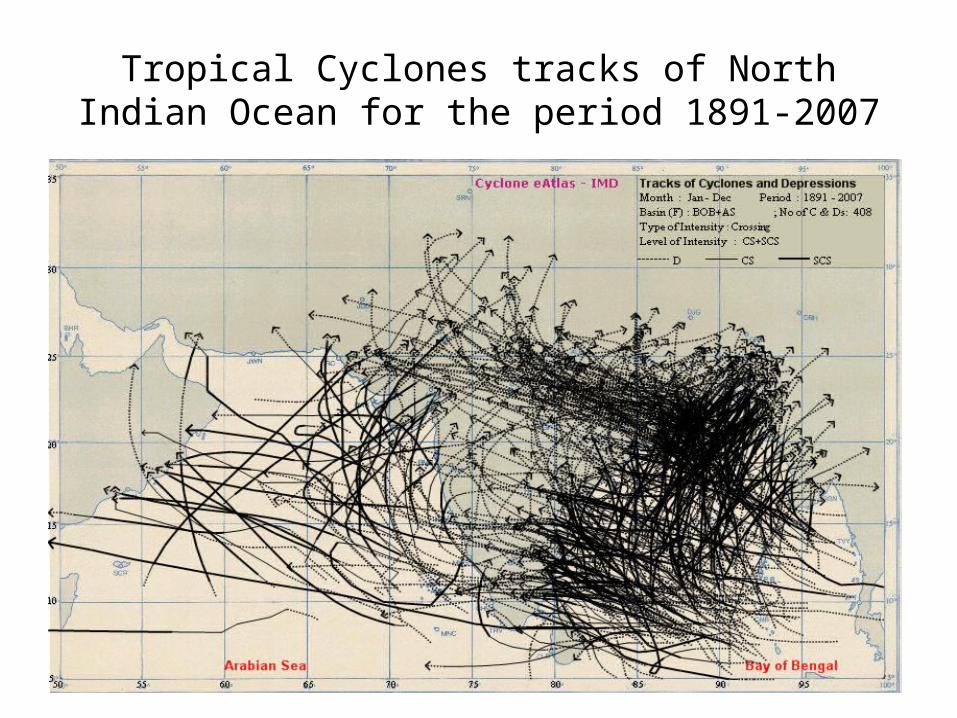
Tropical Cyclones tracks of North Indian Ocean for the period 1891-2007

Introduction…• Cyclones are regarded as one of the most
dangerous meteorological phenomena of the tropical region.
• The main hazards associated with tropical cyclones are storm surge, high winds, heavy rain, and flooding.
• Cyclone impacts include loss of life of humans and animals, in addition to damage to property and agriculture.
• e.g., in 1995 total main- land U.S. tropical cyclone damage averaged on the order of $5 billion (Pielke and Landsea, 1998).
• Tropical storms, being natural phenomena, cannot be prevented but our vulnerability can be reduced through preparedness.
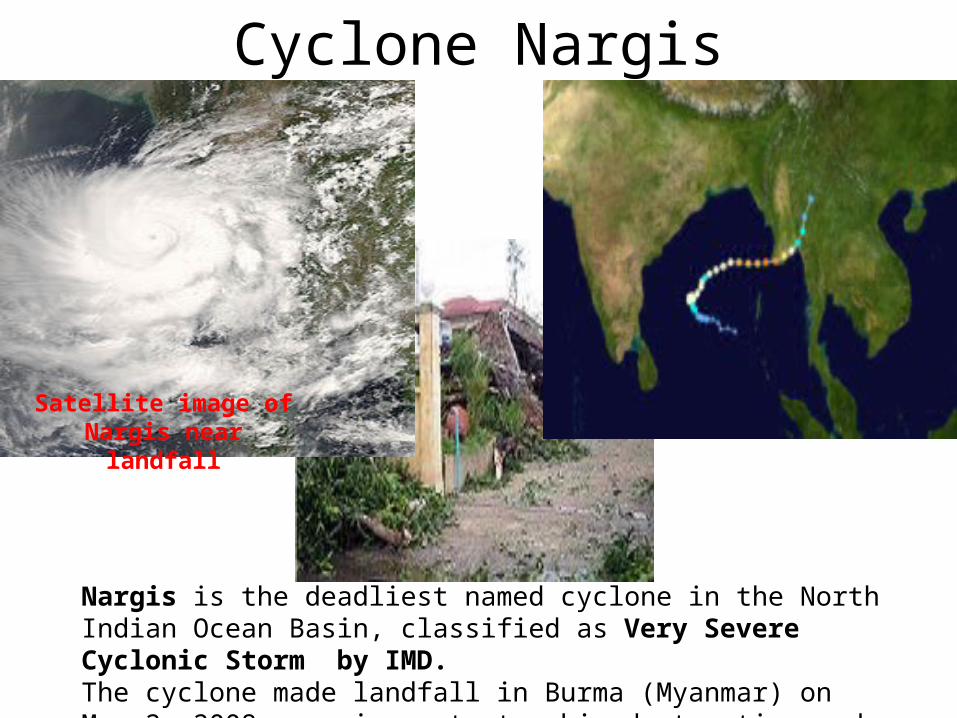
Cyclone Nargis
Satellite image of Nargis near landfall
Nargis is the deadliest named cyclone in the North Indian Ocean Basin, classified as Very Severe Cyclonic Storm by IMD.The cyclone made landfall in Burma (Myanmar) on May 2, 2008, causing catastrophic destruction and at least 138,000 fatalities.

Introduction…• The risk of landfall of a tropical cyclone depends on its movement
(trajectory).
• Behavior of tropical cyclone trajectories needs to be better understood in order to isolate potentially predictable aspects of landfall.
• The large number of cyclone trajectories in a given ocean basin can be better analyzed using the cluster analysis – By grouping them into small subgroups with homogeneous spatiotemporal
characteristics.
• Different clustering methodology have been used to study the Tropical Cyclones in western North Pacific ocean (Elsner and Liu, 2003; Camargo et al., 2007) , North Atlantic Ocean (Elsner, 2003; Gaffeney et al. 2007; Nakamura et al., 2009 ).

Objective• The primary focus of the current study is to analyze tropical cyclone tracks
over the North Indian Ocean into different subcategories depending on geographical information by applying different clustering techniques.
• We would like to extend the methodology existing in the literature of clustering these cyclone trajectories – Concept of Vector Geometry– Complex tracks (Higher order moments etc.)
• The large-scale patterns of atmospheric circulation and sea surface temperature associated with each of these clusters can be also be studied.
• Future work may include, to bring hazard index for Indian coastline (calculating landfall probability) that can be used as input to the insurance industry (flood insurance etc.) [Davidson RA, Lambert KB (2001) & Zandbergen et al. (2009)]

Data• The best tracks have been published in the form of atlas by IMD
from time to time since 1964 containing the data from 1877 onwards.
• However, six hourly best track data containing various characteristics of the cyclonic disturbances is available in the Annual Cyclone Review reports published by IMD since 1990.
• It includes the every six hourly position (lat/long), stage of intensity, estimated central pressure, pressure drop at the centre and sustained maximum surface wind.
• Data for a total of 166 cyclonic events was listed for the period 1990-2009, after cleaning and preprocessing for some of the events, total number of events used in this study are 139.

Sample Data: Tracks of tropical cyclones considered

Track analysis literature
• K-means clustering method has been used by Elsner and Liu (2003) for western North Pacific and Elsner (2003) for North Atlantic TCs.– They have used only two points (positions of maximum and final hurricane intensities)
along the track.
• This methodology was also used by Blender et al. (1997) to analyze extratropical cyclones(ETC), they have used track information of only first three days.
• Gaffeney et al. 2007 has developed a probabilistic clustering methodology to classify ETCs using regression mixture models.
• Camargo et al. (2007) in their two part study has used this methodology to describe TC trajectories of North Pacific ocean.
• Recently, Nakamura et al. (2009) has introduced a different approach for classifying TC trajectories using the Mass Moments.– CT is considered as open spatial curve with wind speed as mass attribute.

Methodology• In the current work, K-means clustering algorithm similar to
Nakamura et al. (2009) have been used.
• A tropical cyclone track is considered as an open curve defined in xy-plan, latitude and longitude being the x and y axis and being approximated by a regular geometric object (i.e. variance ellipse).
• The entire track shape and length are taken into account by using the first two moments of the open curve– First moment is the location of the x and y coordinates of the centroid of the
track.– Second moment is the variance (x, y, and xy directions) ellipse.
• A vector of five attributes (two centroid and three variance) per track is considered for the clustering.

Example of the centroid (asterisk) and variance ellipse for a cyclone track
The classical covariance measure is usually explained as a measure of the orientation and length of the principal axes of an ellipse that describes the scatter of data in a plane.

Methodology…• The first moment establishes the location of the effective center of gravity of the
cyclone track and second moment provides a measure of the shape of the cyclone.
• If the track is straight line, the length of the second principal axis will be zero, indicating that there is no variation in that direction,.
• It would be nonzero for the curve, the magnitude increasing as the relative curvature increases.
• Further, if two tracks are curves, but one is convex and the other concave with respect to a particular reference frame, then the signs of the cross-covariance terms in the second moment matrix are opposite.
• Thus, using the first two moments of a cyclone track one can get a measure of its central location, length, orientation, and also curvature to an extent.

Results
• As for the K-means algorithm, the number of cluster needs to be known apriori– the hierarchical clustering is performed in order to find the
number of clusters.
• On the basis of dendogram, the five cluster solution is found to be suitable for this initial analysis.
• The attributes of the clusters in terms of spatial characteristics such as track shape, genesis location, intensity, life span and seasonality are discussed for each of the five clusters.
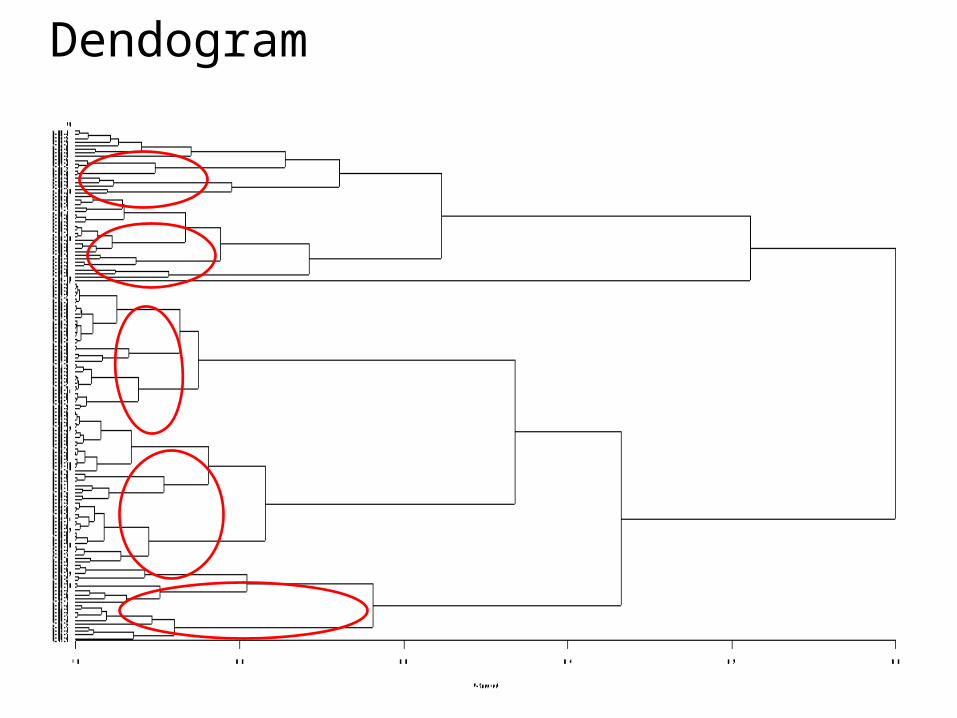
Dendogram

Results• Mean centroid and variance values for each cluster
• Cluster 1 is centered close to the Tamilnadu coastline. • Cluster 2 is centerd near the Orissa coastline• Cluster 3 is centered in the Arabian Sea near the Guj & Mah coastline• Cluster 4 is centerd in the bay of bengal• The variance ellipse of cluster 1, 2, 3 and 5 are more elongated in
longitude position with a negative tilt and for cluster 4 it is stretched latitude and have a positive tilt.
Centroid Lat (x)
Centroid Long (y)
Variance Lat (x)
Variance Long(y)
Covariance (xy)
12.16 84.51 1.47 3.07 -0.33
20.01 85.79 0.97 3.67 -0.74
16.02 65.65 1.91 5.95 -1.21
16.25 87.64 11.58 3.61 1.94
16.67 78.86 6.41 11.69 -5.7

Centroid locations (dots) for the five clusters and the mean centroid value is marked with a big star sign

Genesis location and track shape
• Mean and range of cyclone genesis location of each cluster
• Though, the genesis and actual track are not directly used in the analysis, clear groupings can be seen.
Mean Gensis Range of GensisLat (x) Long(y) Lat (x) Long (Y)
10.57 86.38 4.5-16 76-97.218.95 87.61 14-23 81.5-91.514.28 68.11 2.0-23.5 59.5-73.511.97 87.95 6.5-19.5 71.5-95.513.37 83.9 7.0-20.5 68.0-98.5

Life Span
• The life span of the cyclone affects the size of the variance ellipse.
• Life span was converted from 6-h periods to days.
• Cluster 3, 4 and 5 have longer duration then the mean life span of the total.
• Cluster 2 has shorter duration cyclones.

Maximum Wind Speed
• The longer the life span the longer the cyclone takes to intensify.
• Thus the same pattern follows for Wind speed also.
• Cluster 5 have higher intensity cyclones, most systems being classified as sever to very sever cyclonic storms.
• For cluster 4 &3, median systems are the sever cyclonic storms.
• Cluster 1 are groups of cyclonic storms.
• Cluster 2 are mostly deep depressions and has slightly weaker wind speed as compare to the total mean.

Seasonality
• Boxplots of Months in which the cyclone has occurred for 5 clusters and all the events.
• Cluster 2 has active season as May to Oct
• For cluster 1, 3, 4 and 5 it is bimodal distribution.– May & Oct-Dec– May- Jun & Sep-Nov– Apr,-May & Oct-Nov– Aug & Nov-Dec
Cluster Jan Feb Mar Apr May Jun Jul Aug Sep Oct Nov Dec
1 2 1 1 1 4 1 1 9 13 8
2 3 6 5 6 9 5 1
3 4 5 3 6 5
4 4 5 1 3 6 1
5 2 2 1 4 2 4 3

Summary
• This would be an unique study to analyze and summarize the tropical cyclone characteristics using the whole track information for North Indian Ocean.
• A tropical cyclone track can be thought of as an open curve and described by first two moments.
• The resulting clusters have different centroid locations and also differently shaped variance ellipses.
• Other characteristics like genesis location, life span and maximum sustained wind speed are also forming clear groupings, though this information has not been used explicitly in clustering.

Future Work• This analysis will be completed and repeated by considering
the maximum wind speed as the weights.
• The clustering will also be performed using other clustering algorithm available in the literature– This would help us validating the results of the analysis.
• We plan to extend the methodology of analysis of tracks – using higher order mass moments to capture recurving
tracks etc.– Considering the direction of the vector data

Thank You

• This best track data sets are based on the classification
Sr.No. Types of Disturbances Associated wind speed1 Low Pressure Area < 17 knots 2 Depression 17-27 knots 3 Deep Depression 28-33 knots 4 Cyclonic Storm 34-47 knots 5 Severe Cyclonic Storm 48-63 knots 6 Very Severe Cyclonic Storm 64-119 knots
7 Super Cyclonic Storm > 119 knots


![[Paliwal, Manisha] Business Ethics(BookFi.org)[1]](https://static.fdocuments.net/doc/165x107/5695d1ba1a28ab9b0297b41d/paliwal-manisha-business-ethicsbookfiorg1.jpg)