Analyzing the Effect that Living Arrangements have … · Analyzing the Effect that Living...
15
Analyzing the Effect that Living Arrangements have on Control of Diabetes Mellitus La’ Nyia J. Odoms, M.Ed MD/MSPH Candidate 2016, Meharry Medical College, School of Medicine, Nashville, TN GE-National Medical Fellowships, Primary Care Leadership Program Health Care Center for the Homeless Orlando, FL July 26th, 2013
Transcript of Analyzing the Effect that Living Arrangements have … · Analyzing the Effect that Living...

Analyzing the Effect that Living
Arrangements have on Control
of Diabetes Mellitus
La’ Nyia J. Odoms, M.EdMD/MSPH Candidate 2016, Meharry Medical College, School of Medicine,
Nashville, TN
GE-National Medical Fellowships, Primary Care Leadership Program
Health Care Center for the Homeless Orlando, FL
July 26th, 2013

Introduction
Health Care Center for the Homeless
NCQA Patient-Centered Medical Home- Level 2
Celebrating 20yrs of service!

Background
Why Diabetes…Living Arrangements…Research?
Diabetes is a major cause of heart disease and stroke, and continues to be the leading cause of kidney failure, nontraumaticlower-extremity amputations, and blindness among adults, aged 20-74 (National Diabetes Fact Sheet, 2007).
Homeless people suffer from significant levels of morbidity and mortality, but there is little evidence that homeless-ness has a direct adverse effect on health outcomes.

Research Objective
• Analyze variance in hemoglobin A1C
levels to improve glycemic control
*Housing Status
Gender
Ethnicity
Race
Methodology
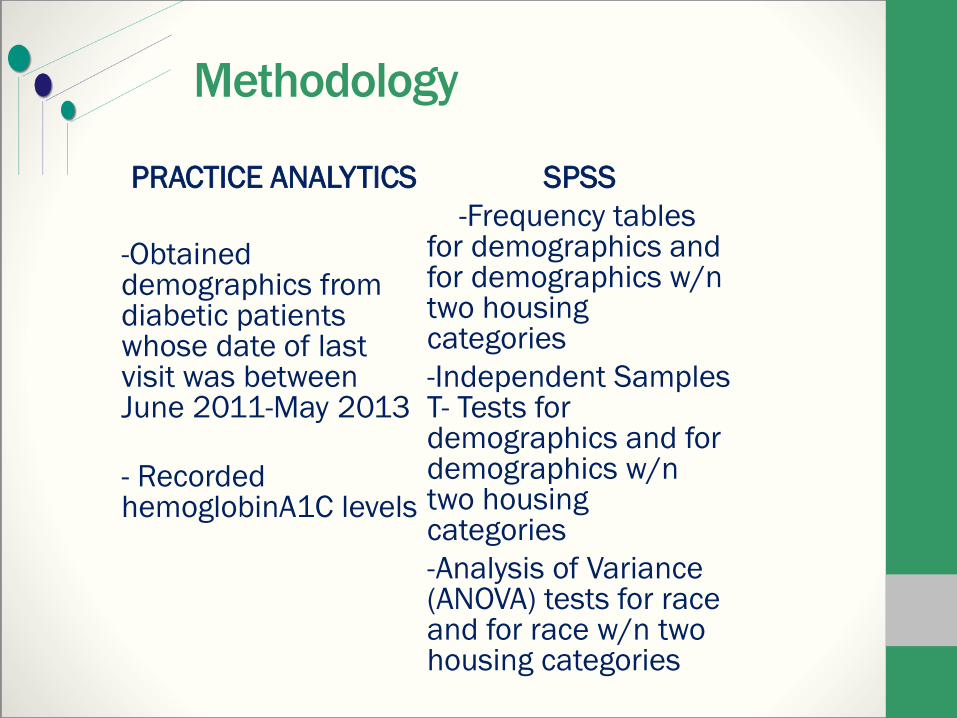
PRACTICE ANALYTICS
-Obtained demographics from diabetic patients whose date of last visit was between June 2011-May 2013
- Recorded hemoglobinA1C levels
SPSS
-Frequency tables for demographics and for demographics w/n two housing categories
-Independent Samples T- Tests for demographics and for demographics w/n two housing categories
-Analysis of Variance (ANOVA) tests for race and for race w/n two housing categories

Results
HOUSING STATUSFrequency Percent Valid Percent
Cumulative
PercentValid Housed
Homeless
Total
434
121
555
78.2
21.8
100.0
78.2
21.8
100.0
78.2
100.0
GENDERFrequency Percent Valid Percent
Cumulative
Percent
Valid Male
Female
Total
249
306
555
44.9
55.1
100.0
44.9
55.1
100.0
44.9
100.0
ETHNICITYFrequency Percent Valid Percent
Cumulative
Percent
Valid Non-Hispanic
Hispanic
Total
431
124
555
77.7
22.3
100.0
77.7
22.3
100.0
77.7
100.0
Results Cont’d
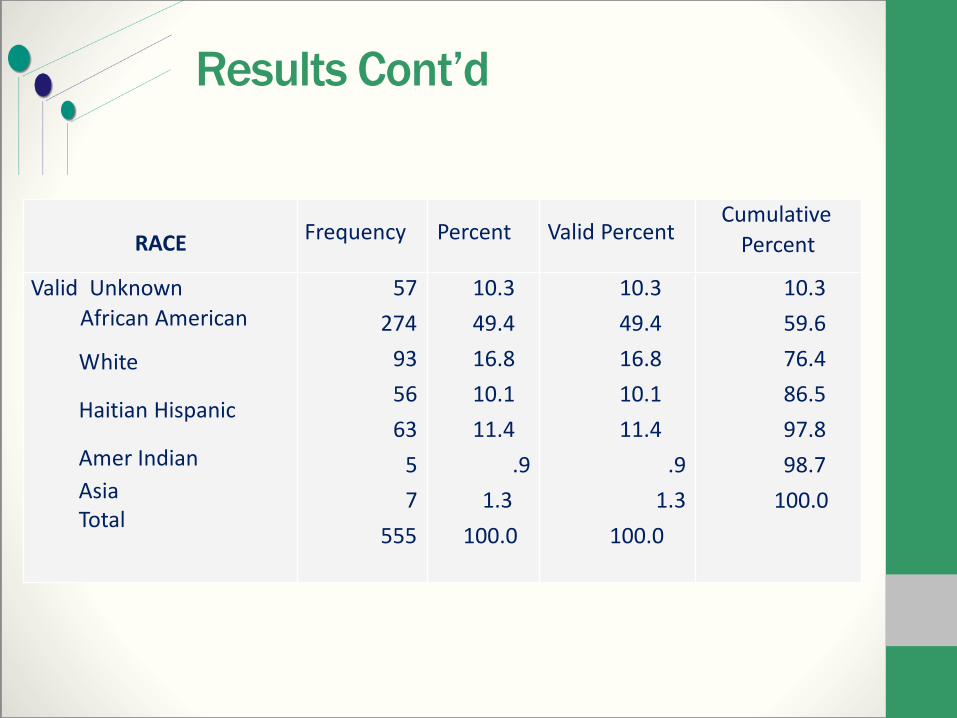
RACE Frequency Percent Valid PercentCumulative
Percent
Valid Unknown
African American
White
Haitian Hispanic
Amer Indian
AsiaTotal
57
274
93
56
63
5
7
555
10.3
49.4
16.8
10.1
11.4
.9
1.3
100.0
10.3
49.4
16.8
10.1
11.4
.9
1.3
100.0
10.3
59.6
76.4
86.5
97.8
98.7
100.0

Results Cont’d
8.40 8.73
0.001.002.003.004.005.006.007.008.009.00
10.0011.0012.00
Housed Homeless
Pe
rce
nt
Mean Hemoglobin A1C Levels- Housing Status
Mean difference NOT statistically significant (p = .136)

Results Cont’d
8.34 8.63
0.00
1.00
2.00
3.00
4.00
5.00
6.00
7.00
8.00
9.00
10.00
11.00
12.00
Female Male
Perc
ent
Mean Hemoglobin A1C Levels- Gender
Mean difference NOT statistically significant (p = .128)
8.278.70 8.58 8.76
0.00
1.00
2.00
3.00
4.00
5.00
6.00
7.00
8.00
9.00
10.00
11.00
12.00
Female Female Male Male
Perc
ent
Mean Hemoglobin A1C Levels- Gender
Housed
Homeless
Mean differences were NOT statistically significant (p = .143 housed/ p= .898 homeless)

Results Cont’d
8.24 8.54
0.001.002.003.004.005.006.007.008.009.00
10.0011.0012.00
Hispanic Non-Hispanic
Perc
ent
Mean Hemoglobin A1C Levels- Ethnicity
Mean difference was NOT statistically significant (p = .175)
8.20 8.43 8.46 8.80
0.00
1.00
2.00
3.00
4.00
5.00
6.00
7.00
8.00
9.00
10.00
11.00
12.00
Hispanic Hispanic Non-Hispanic Non-Hispanic
Perc
ent
Mean Hemoglobin A1C Levels- Ethnicity
Housed
Homeless
Mean differences were NOT statistically significant (p = .275 housed/ p= .498 homeless)

Results Cont’d
8.688.16 8.35 8.29
0.00
1.00
2.00
3.00
4.00
5.00
6.00
7.00
8.00
9.00
10.00
11.00
12.00
African American White Haitian Hispanic
Perc
ent
Mean Hemoglobin A1C Levels- Race
Mean difference was NOT statistically significant (p = .172)
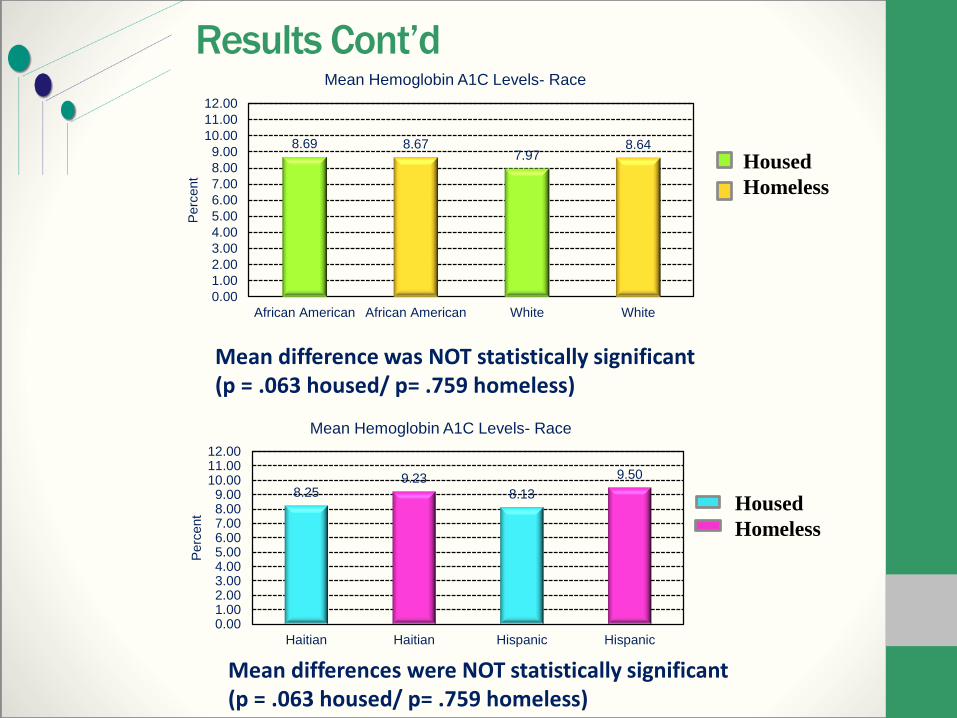
Results Cont’d
8.69 8.677.97
8.64
0.00
1.00
2.00
3.00
4.00
5.00
6.00
7.00
8.00
9.00
10.00
11.00
12.00
African American African American White White
Perc
ent
Mean Hemoglobin A1C Levels- Race
Housed
Homeless
Mean difference was NOT statistically significant (p = .063 housed/ p= .759 homeless)
8.259.23
8.13
9.50
0.001.002.003.004.005.006.007.008.009.00
10.0011.0012.00
Haitian Haitian Hispanic Hispanic
Perc
ent
Mean Hemoglobin A1C Levels- Race
Housed
Homeless
Mean differences were NOT statistically significant (p = .063 housed/ p= .759 homeless)

DiscussionNo statistically significant difference in mean
hemoglobin A1C between homeless and housed patients, nor across gender, race, and ethnicity.
When homeless and housed (housing status) were used as categorical controls, no statistically significant difference was found between the aforementioned demographics.
Data Collection: Quest Diagnostics vs. Florida Hospital
Endocrinology Referrals
Access to services at main clinical site
Promising Diabetic Profile

AcknowledgementsDr. Cadet, Medical Director/Site Advisor
Dr. Oliveira, Assistant Professor/Faculty AdvisorMehrin Islam, Former AmeriCorps Intern
Mrs. Mariella Torrellas, Physician AssistantMr. Bakari Burns, CEO
Dr. Chianta Lindsey, Nurse PractitionerDr. Chen, Assistant Professor, Meharry Medical College
Dr. Brown, Assistant Professor/Advisor, Meharry Medical CollegeGE-NMF Primary Care Leadership Program
Health Care Center for the Homeless Staff & Patients

Questions/Comments