Analyzing Student Responses to a Multiple Representation Problem Tara Bartiromo and Eugenia Etkina...
21
Analyzing Student Responses to a Multiple Representation Problem Tara Bartiromo and Eugenia Etkina February 17, 2010 AAPT Winter Meeting Washington, DC NSF DRL- 0733140
-
date post
21-Dec-2015 -
Category
Documents
-
view
221 -
download
0
Transcript of Analyzing Student Responses to a Multiple Representation Problem Tara Bartiromo and Eugenia Etkina...

Analyzing Student Responses to a Multiple Representation Problem
Tara Bartiromo and Eugenia Etkina
February 17, 2010AAPT Winter MeetingWashington, DC
NSF DRL-0733140
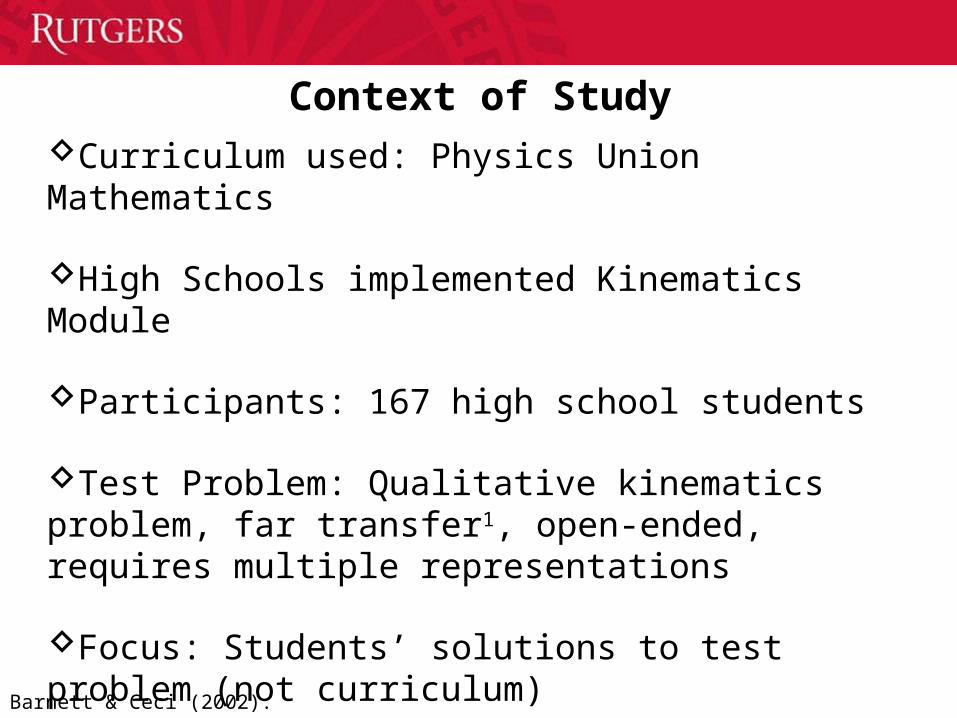
Context of StudyCurriculum used: Physics Union Mathematics
High Schools implemented Kinematics Module
Participants: 167 high school students
Test Problem: Qualitative kinematics problem, far transfer1, open-ended, requires multiple representations
Focus: Students’ solutions to test problem (not curriculum)
Barnett & Ceci (2002).
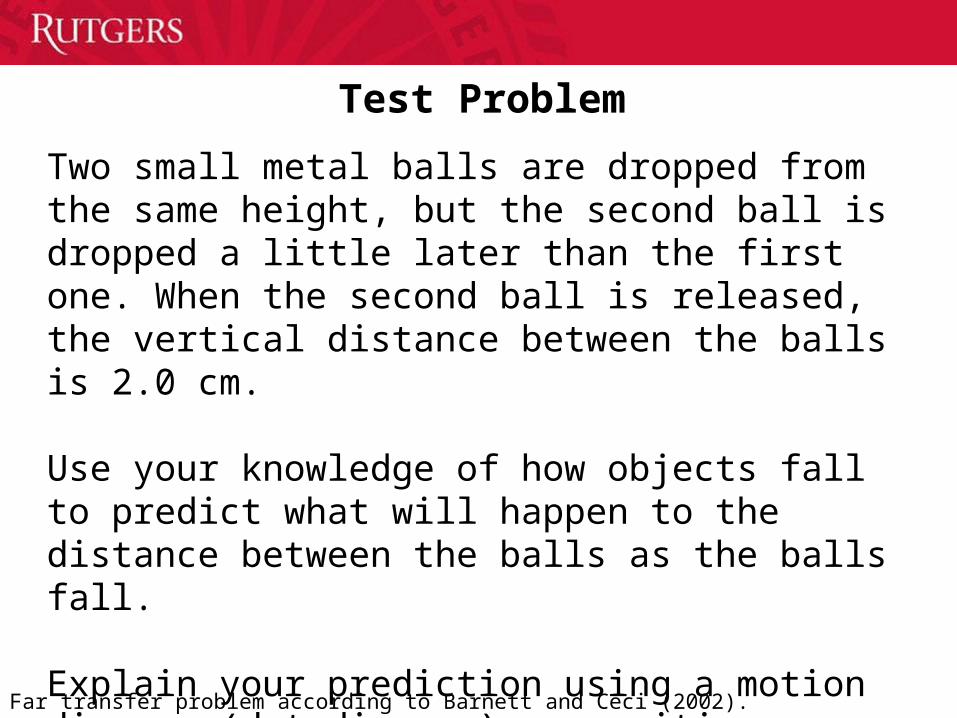
Test Problem
Two small metal balls are dropped from the same height, but the second ball is dropped a little later than the first one. When the second ball is released, the vertical distance between the balls is 2.0 cm.
Use your knowledge of how objects fall to predict what will happen to the distance between the balls as the balls fall.
Explain your prediction using a motion diagram (dot diagram), a position-versus-time graph, and mathematically.
Far transfer problem according to Barnett and Ceci (2002).
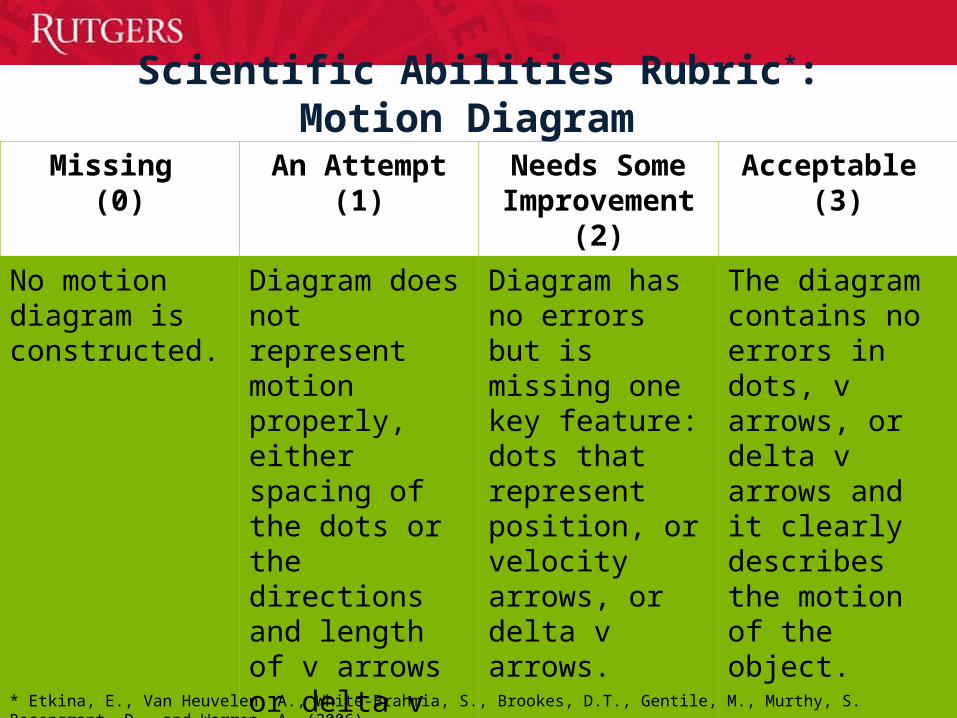
Scientific Abilities Rubric*: Motion Diagram
Missing (0)
An Attempt(1)
Needs Some Improvement
(2)
Acceptable (3)
No motion diagram is constructed.
Diagram does not represent motion properly, either spacing of the dots or the directions and length of v arrows or delta v arrows does not match the motion.
Diagram has no errors but is missing one key feature: dots that represent position, or velocity arrows, or delta v arrows.
The diagram contains no errors in dots, v arrows, or delta v arrows and it clearly describes the motion of the object.
* Etkina, E., Van Heuvelen, A., White-Brahmia, S., Brookes, D.T., Gentile, M., Murthy, S. Rosengrant, D., and Warren, A. (2006).

Research on Representations
1. Van Heuvelen (1991); 2. Kozma & Russell (1997); 3. Kohl & Finkelstein (2008); 4. De Leone, & Gire, (2005); 5. Rosengrant, Van Heuvelen, & Etkina (2009); 6. Kohl & Finkelstein (2007); 7. Meltzer (2005); 8. . Dufresne, Gerace, & Leonard (1997).
Experts:Qualitative/quantitative reasoning1,2,
variety of representations1,
fluent translators2.
Novices:Representation
use?2, representations are instruction-dependent4,5,
quality of representation4,5
,6
Goals of Education
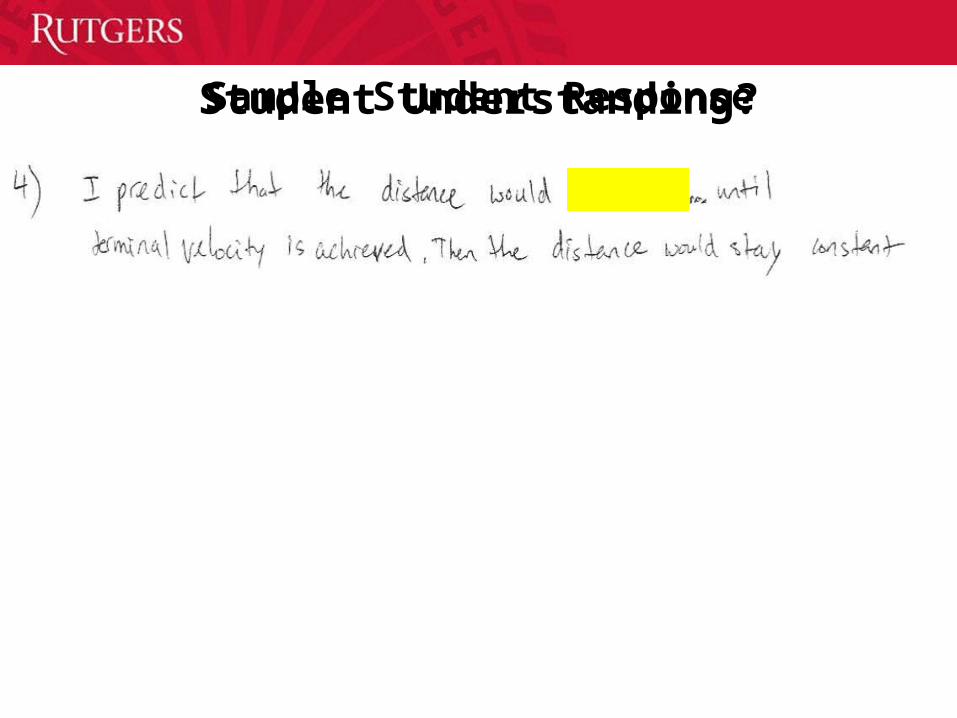
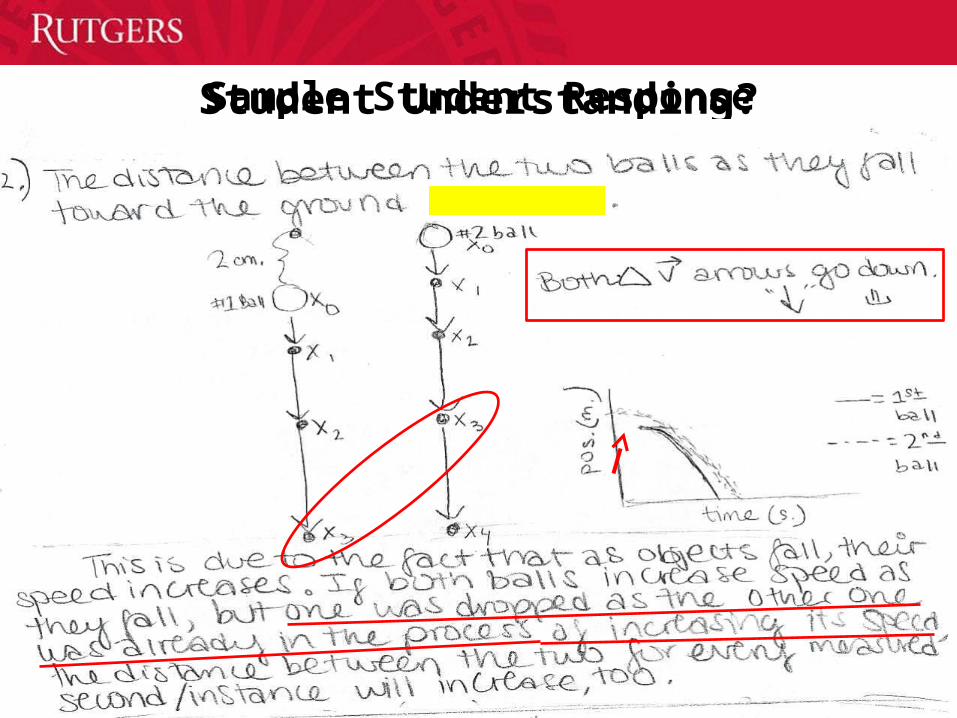
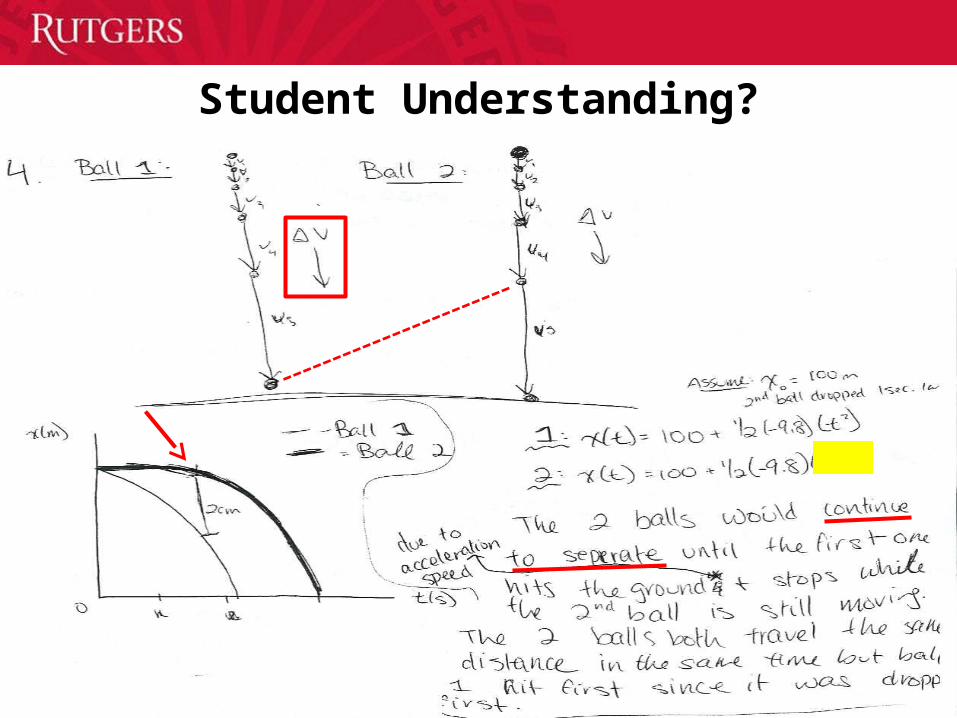
Student Understanding?Sample Student Response
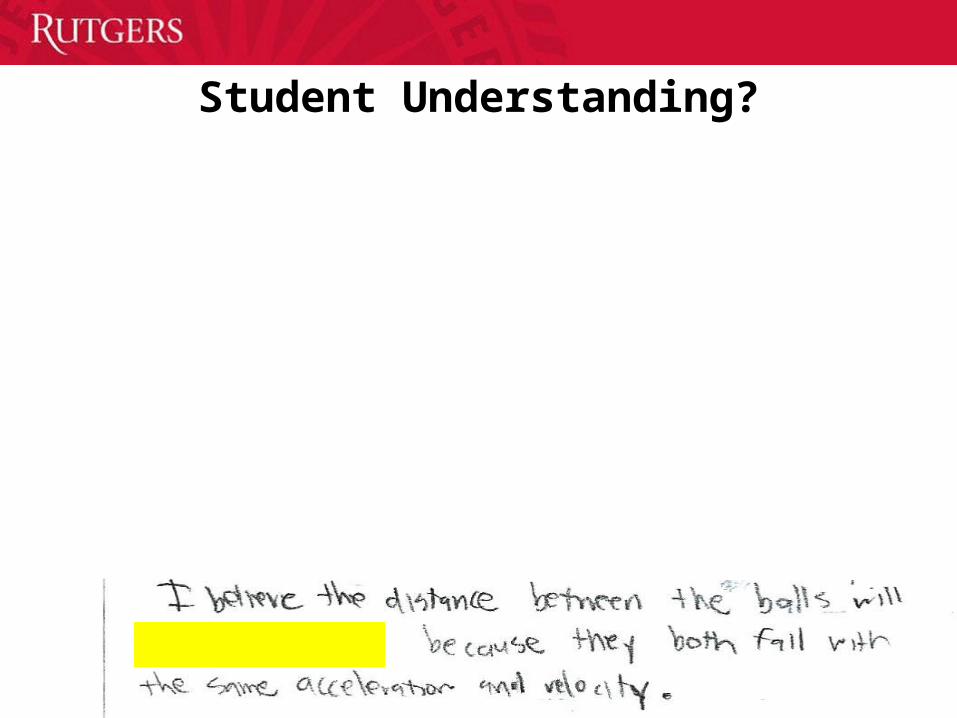
Student Understanding?

What evidence is enough to demonstrate student
understanding (of a concept, a problem, etc.)?

Evidence of Student Understanding: Single Representation
Sample: 167 Students
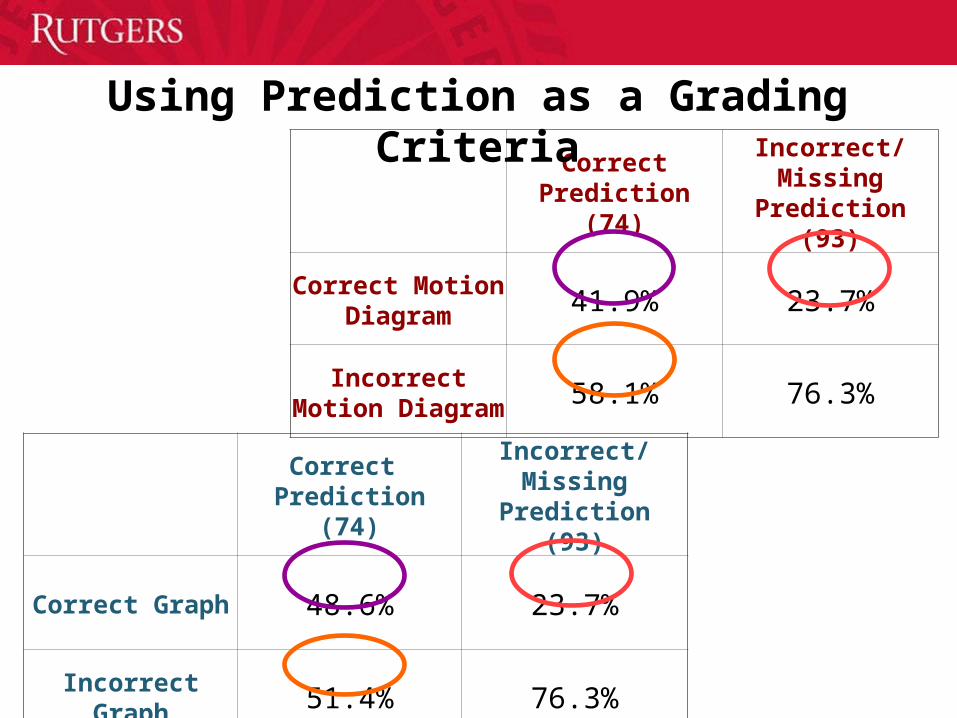
Correct
Prediction (74)Incorrect/Missing
Prediction (93)
Correct Motion Diagram 41.9% 23.7%
Incorrect Motion Diagram 58.1% 76.3%
Correct
Prediction (74)Incorrect/Missing
Prediction (93)
Correct Graph 48.6% 23.7%
Incorrect Graph 51.4% 76.3%
Using Prediction as a Grading Criteria
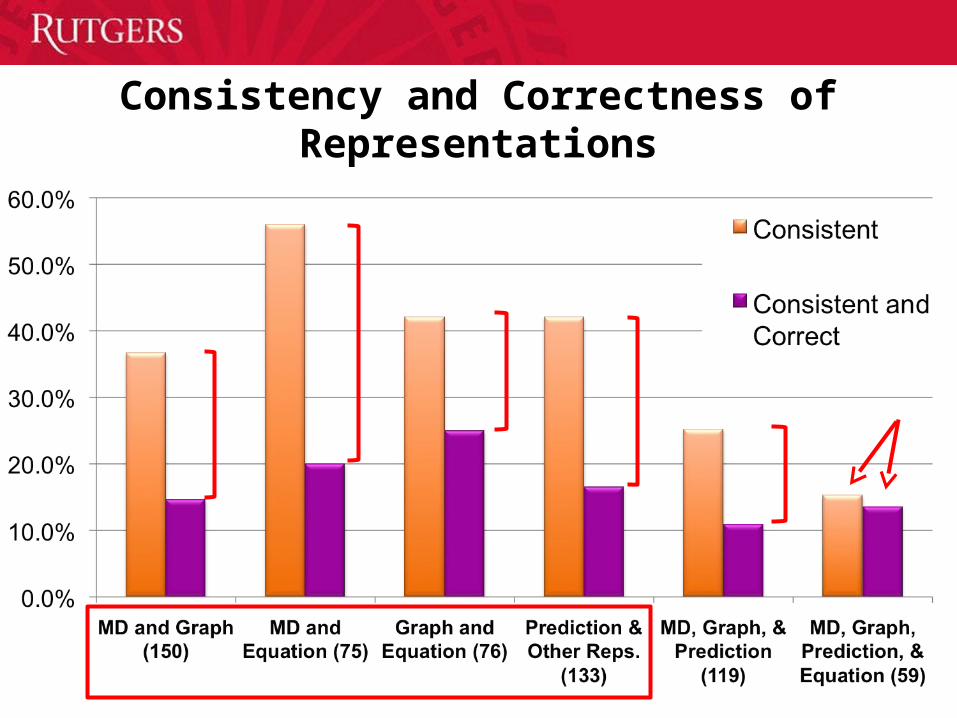
Consistency and Correctness of Representations

Summary
Assessing any single representation for correctness leads to very different results1.
Student understanding is multi-dimensional and can only be discovered when students need to use multiple representations to solve a problem2.
Fluent translation (i.e. consistency) between representations needs to be fostered but is not sufficient.
1. Kohl & Finkelstein (2006); 2. Lesh, Post, & Behr. (1987).

Implications
As researchers, we base our judgment of student understanding on superficial criteria. As scientists we should look for more evidence.
There are simple ways of probing deeper to obtain more evidence of student understanding
Additionally assess students using a more complex problem that requires students to use and reason with multiple representations (not in isolation on multiple problems).
Lesh, Post, & Behr. (1987).
For More Information: http://pum.rutgers.edu http://www.islephysics.net http://paer.rutgers.edu/scientificabilities/
References:1.E. Etkina, and A. Van Heuvelen, in Research-Based Reform of University Physics (2007), Vol. 1, WWW Document, (http://www.compadre.org/Repository/docu ment/ServeFile.cfm?ID=4988&DocID=239).2.Etkina, E., Van Heuvelen, A., (2006, 2001), Investigative Science Learning Environment3.Etkina, E., Van Heuvelen, A., White-Brahmia, S., Brookes, D.T., Gentile, M., Murthy, S. Rosengrant, D., and Warren, A. (2006) Developing and assessing student scientific abilities. Physical Review. Special Topics, Physics Education Research. 2, 020103.4.Lesh, R., Post, T., & Behr, M. (1987). Representations and translations among representations in mathematics learning and problem solving. In C. Janvier (Ed.), Problems of representation in the teaching and learning of mathematics (pp. 33-40). Hillsdale, NJ: Erlbaum.5.Rosengrant, D. Van Heuvelen, A., & Etkina, E. (2009). Do students use and understand free-body diagrams? Phys. Rev. Special Topics – PER, 5, 010108.6.Meltzer, D. E. (2005). Relation between students’ problem-solving performance and representational format. Am. J. Phys., 73, 463-478.7.Kohl, P. B., & Finkelstein, N. D. (2005). Student representational competence and self-assessment when solving physics problems. Phys. Rev. Special Topics – PER, 1, 010104.8.Kohl, P. B., & Finkelstein, N. D. (2006). Effects of representation on students solving physics problems: A fine-grained characterization. Phys. Rev. Special Topics – PER, 2, 010106.9.Kohl, P. B., & Finkelstein, N. D. (2007). Strongly and weakly directed approaches to teaching multiple representation use in physics. Phys. Rev. Special Topics – PER, 3, 010108.10.Kohl, P. B., & Finkelstein, N. D. (2008). Patterns of multiple representation use by experts and novices during physics problem solving. Phys. Rev. Special Topics – PER, 4, 010111.11.De Leone, C. J., & Gire, E. (2005). Is instructional emphasis on the use of non-mathematical representations worth the effort? In Heron, P., McCullough, L., and Marx, J. (Eds.), 2005 Physics Education Research Conference, 818, Salt Lake City, Utah, p. 45-48.12.Kozma, R., & Russell, J. (1997). Multimedia and understanding: Expert and novice responses to different representations of chemical phenomena. Journal of Research in Science Teaching, 34, 949-968.13.Dufresne, R., Gerace, W., Leonard, W. (1997). Solving physics problems with multiple representations. The Physics Teacher, 35, 270-275.14.Barnett, S. M., & Ceci, S. J. (2002). When and where do we apply what we learn? A taxonomy for far transfer. Psychological Bulletin, 128, 612-637.
Email: [email protected]
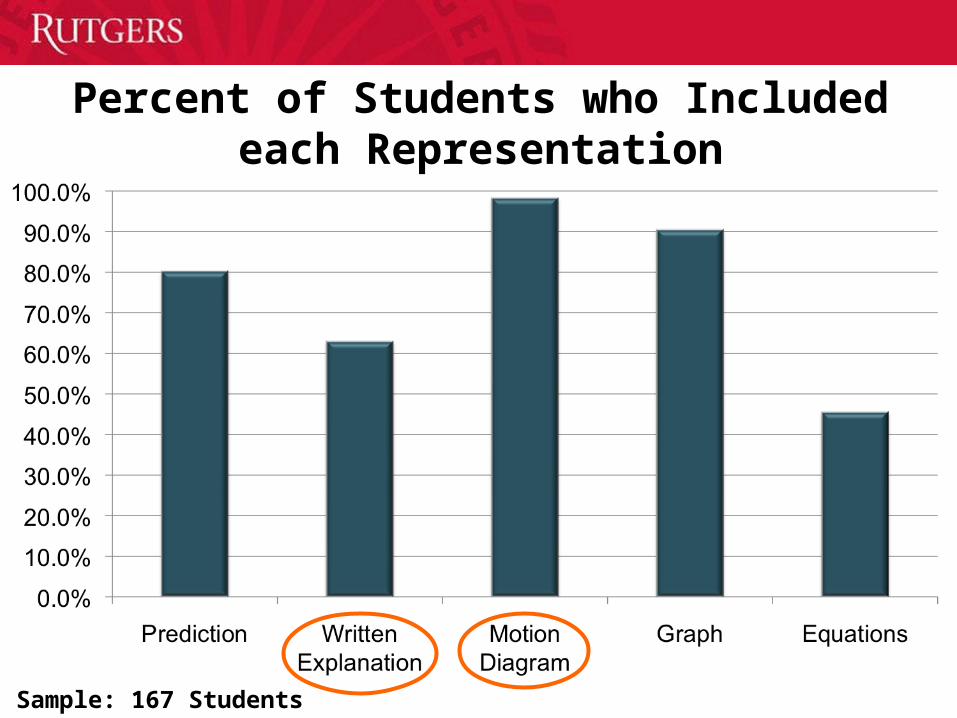
Percent of Students who Included each Representation
Sample: 167 Students

12.8 An object moves horizontally. The equations below represent its motion mathematically. Describe the actual motion that these two equations together might describe. •v(t) = +20 m/s + (-2 m/s2)t
•x(t) = -200 m + (+20 m/s)t + ½(-2 m/s2)t2
a) Describe the motion in words and sketch the process represented in the two mathematical expressions above.b) Draw a motion diagramc) Draw a position-versus-clock reading graph and a velocity-versus-clock reading graph.
Sample PUM Activity

12.2 Use the Moving Man PHET simulation. The man is walking initially at 0.75 m/s towards his home starting from the position of 7m to the left of the origin. At this point, he begins to increase his velocity at a rate of 0.2 m/s every second. a) Write an expression for the man’s position as a function of time.b) Create a position vs. time and velocity vs. time graph for this function.c) Before you continue with the simulation, check for consistency between the representations. How do you know they are consistent?
Sample PUM Activity
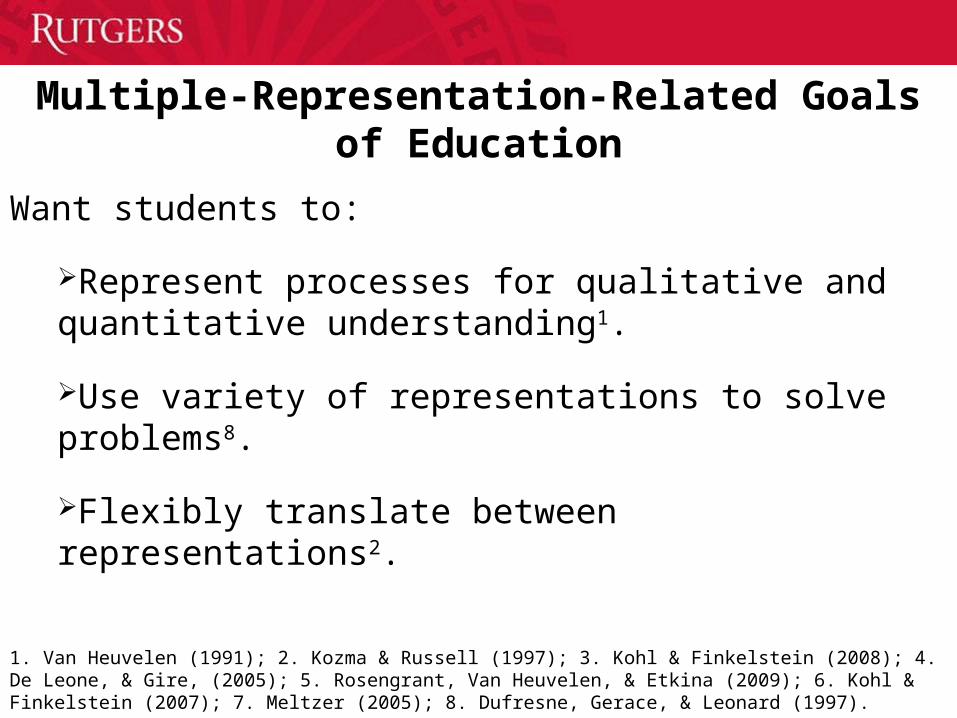
Multiple-Representation-Related Goals of Education
Want students to:
Represent processes for qualitative and quantitative understanding1.
Use variety of representations to solve problems8.
Flexibly translate between representations2.
1. Van Heuvelen (1991); 2. Kozma & Russell (1997); 3. Kohl & Finkelstein (2008); 4. De Leone, & Gire, (2005); 5. Rosengrant, Van Heuvelen, & Etkina (2009); 6. Kohl & Finkelstein (2007); 7. Meltzer (2005); 8. Dufresne, Gerace, & Leonard (1997).

Correct
Explanation (14)Incorrect/Missing Explanation (111)
Correct Motion Diagram 71.4% 24.3%
Incorrect Motion Diagram 28.6% 75.7%
Correct
Explanation (14)Incorrect/Missing Explanation (111)
Correct Graph 64.3% 27.0%
Incorrect Graph 35.7% 73.0%
Using Explanation as a Grading Criteria
Student Understanding?Sample Student Response
Student Understanding?