Analyzing student-level disciplinary data: A guide for ... · March 2017. Applied Research Methods...
43
March 2017 Applied Research Methods Analyzing student- level disciplinary data: A guide for districts Anthony Petrosino Trevor Fronius Cailean C. Goold WestEd Daniel J. Losen Independent Consultant Herbert M. Turner ANALYTICA, Inc. In collaboration with the Urban School Improvement Alliance At Education Development Center, Inc. U.S. Department of Education
-
Upload
truongduong -
Category
Documents
-
view
213 -
download
0
Transcript of Analyzing student-level disciplinary data: A guide for ... · March 2017. Applied Research Methods...
March 2017
Applied Research Methods
Analyzing student-level disciplinary data: A guide for districts
Anthony Petrosino Trevor Fronius
Cailean C. Goold WestEd
Daniel J. Losen Independent Consultant
Herbert M. Turner ANALYTICA, Inc.
In collaboration with the Urban School Improvement Alliance
At Education Development Center, Inc.
U . S . D e p a r t m e n t o f E d u c a t i o n

U.S. Department of Education Betsy DeVos, Secretary
Institute of Education Sciences Thomas W. Brock, Commissioner for Education Research Delegated the Duties of Director
National Center for Education Evaluation and Regional Assistance Audrey Pendleton, Acting Commissioner Elizabeth Eisner, Acting Associate Commissioner Amy Johnson, Action Editor Elizabeth Eisner, Project Officer
REL 2017–263
The National Center for Education Evaluation and Regional Assistance (NCEE) conducts unbiased large-scale evaluations of education programs and practices supported by federal funds; provides research-based technical assistance to educators and policymakers; and supports the synthesis and the widespread dissemination of the results of research and evaluation throughout the United States.
March 2017
This report was prepared for the Institute of Education Sciences (IES) under Contract ED-IES-12-C-0009 by Regional Educational Laboratory Northeast and Islands, administered by Education Development Center, Inc. The content of the publication does not necessarily reflect the views or policies of IES or the U.S. Department of Education, nor does mention of trade names, commercial products, or organizations imply endorsement by the U.S. Government.
This REL report is in the public domain. While permission to reprint this publication is not necessary, it should be cited as:
Petrosino, A., Fronius, T., Goold, C. C., Losen, D. J. and Turner, H. M. (2017). Analyzing student-level disciplinary data: A guide for districts (REL 2017–263). Washington, DC: U.S. Department of Education, Institute of Education Sciences, National Center for Education Evaluation and Regional Assistance, Regional Educational Laboratory Northeast and Islands. Retrieved from http://ies.ed.gov/ncee/edlabs.
This report is available on the Regional Educational Laboratory website at http://ies.ed.gov/ ncee/edlabs.

Summary
Discipline in schools can be categorized as exclusionary actions, which remove students from their normal learning setting (for example, out-of-school suspension), or inclusionary actions, which do not (for example, afterschool detention). The relationship of exclusionary discipline to negative outcomes for students, particularly racial/ethnic minority students and students with disabilities (Losen, 2014), has raised questions among policymakers, parents, and other stakeholders about equity in school punishment and whether alternatives may be employed in response to student offenses.
Every public school and district is required to report disciplinary data at the aggregate level to the U.S. Department of Education’s Office for Civil Rights.1 Federal guidance from the U.S. Department of Justice Civil Rights Division and the U.S. Department of Education Office for Civil Rights (2014) recommends that districts examine those data and review their disciplinary policies to determine the extent to which exclusionary disciplinary actions are being used and whether they are being administered disproportionately to subgroups of students, such as racial/ethnic minority students or students with disabilities.
This report, conducted in collaboration with the Urban School Improvement Alliance, provides information on how to conduct such an examination and explores differences in student academic outcomes across the types of disciplinary actions that students receive. It serves as a blueprint to assist districts with designing and carrying out their own analyses and engaging with external researchers who are doing the same.
The methods described in this report are designed to answer three core questions: • What disciplinary actions do students in the district receive and for what offenses? • Does the district use exclusionary disciplinary actions more frequently for some
subgroups of students than for others? • Do student academic outcomes differ by the type of disciplinary actions that stu
dents receive?
This report identifies several initial tasks that are important to consider prior to analyzing student-level disciplinary data:
• Defining all data elements to understand how the district categorizes student offenses and disciplinary actions.
• Establishing rules to make the analysis transparent (including rules for handling missing data).
• Determining whether data are missing or inaccurate. • Defining the unit of analysis: the who or what (students, schools, or offenses) that
is being studied. • Avoiding disclosure of personally identifiable data.
In addition, this report demonstrates a number of calculations, using fictitious data to calculate the number and percentage of:
• Students receiving any disciplinary action. • Students receiving exclusionary disciplinary action versus inclusionary disciplinary
action. • Students receiving out-of-school versus in-school suspensions. • Disciplinary actions for types of major offense.
i
Contents
Summary i
Why this report? 1
Before starting 4
Understanding and checking data 4 Define all data elements to understand how the district categorizes student offenses and
disciplinary actions 4 Establish rules to make the analysis transparent 5 Determine whether data are missing or inaccurate 6 Define and refine the unit of analysis 6 Avoid disclosure of personally identifiable data 7
How to determine the disciplinary actions that students in a district receive and for what offenses 7 Calculating the number and percentage of students receiving any disciplinary action 8 Calculating the number and percentage of students receiving exclusionary disciplinary
Calculating the number and percentage of students receiving out-of-school versus in-school
Calculating the number and percentage of students receiving disciplinary actions for types
action versus inclusionary disciplinary action 8
suspensions 9
of major offense 9
How to determine whether a district uses exclusionary disciplinary actions more frequently for some subgroups of students than for others 11 Determining student subgroups for analysis 11 Calculating risk indices 11 The challenge of small cell sizes 15 Calculating the risk rate for different disciplinary actions by racial/ethnic subgroup 15 Calculating the frequency of different disciplinary actions and offense types by student
racial/ethnic subgroup 16
How to determine whether student academic outcomes differ by the types of disciplinary actions that students receive 17
Conclusion 19
Appendix A. Core Planning Group member data A-1
Appendix B. Common checks to reduce data errors B-1
Appendix C. SPSS syntax C-1
Notes Notes-1
References Ref-1
ii
Boxes Box 1. Key terms 2 Box 2. Disciplinary data checklist 5
Figures Figure 1. Risk ratio is relative, fictitious data 14
Tables Table 1. Categorizations of some less serious student offenses with subjective descriptors, by
district 5 Table 2. Students with at least one disciplinary action in the last academic year, fictitious data 8 Table 3. Types of disciplinary action received, among students who received any disciplinary
action in the last academic year, fictitious data 9 Table 4. Students with suspensions by type in last academic year, fictitious data 9 Table 5. Disciplinary actions by offense and type of disciplinary action, fictitious data 10 Table 6. Risk index, showing risk rate calculations and risk rates across subgroups, fictitious data 12 Table 7. Risk difference calculation, fictitious data 13 Table 8. Risk ratio calculation, fictitious data 13 Table 9. Discipline rate per 100 students calculation, fictitious data 14 Table 10. In-school and out-of-school suspensions by racial category, fictitious data 16 Table 11. Percentage of students receiving out-of-school suspension and in-school
suspension, by offense type and race/ethnicity, fictitious data 17 Table 12. Students advancing to next grade level by the type of disciplinary action
experienced in the past academic year, fictitious data 18 Table A1. Summary student offense and disciplinary action data collected by Core Planning
Group member districts, 2015 A-1 Table C1. Data codebook for variables used in syntax for SPSS C-1
iii

Why this report?
Discipline in schools can be categorized as exclusionary actions, which remove students from their normal learning setting (for example, out-of-school suspension), or inclusionary actions, which do not (for example, afterschool detention; see box 1 for definitions of key terms used in the report).
Exclusionary discipline practices have been found to be related to negative outcomes for students, and furthermore, to be disproportionately applied to particular groups of students, such as racial/ethnic minorities (see Porowski, O’Conner, & Passa, 2014, for a review of the literature). In addition, a recent meta-analysis examining over 30 studies reported that suspensions were significantly associated with lower achievement and higher likelihoods of dropping out (Noltmeyer, Ward & McLaughlin, 2015). Removing students from school on disciplinary grounds increases their risk of dropping out, becoming involved in the juvenile justice system, and being incarcerated as an adult (Balfanz, Byrnes, &Fox, 2014; Fabelo et al., 2011).
The relationship of exclusionary discipline to negative outcomes for students, particularly racial/ethnic minority students and students with disabilities, has raised questions among policymakers, parents, and other stakeholders about equity in school punishment and whether alternatives may be employed in response to student offenses (Noltmeyer, Ward & McLaughlin, 2015; Losen, 2014; Fabelo et al., 2011). For example, New York State’s attorney general investigated the Syracuse City School District for overusing out-of-school suspension, particularly for racial/ethnic minority students and students with disabilities (Losen, 2014), leading to a formal agreement in which the district agreed to undertake steps to address the issue (Seager, Madura, Cox, & Carey, 2015).
In addition, the federal government has made school discipline and its relationship to equity, student success, and school safety a priority topic.2 In January of 2014, citing research connecting exclusionary discipline (such as suspension) and the negative outcomes mentioned above, the U.S. Department of Justice Civil Rights Division and the U.S. Department of Education Office for Civil Rights jointly issued a “Dear Colleague” letter outlining local education agencies’ obligation to review their discipline policies and practices for unnecessary reliance on exclusionary discipline and asking whether such discipline is administered disproportionately to certain groups, such as racial/ethnic minority students and students with disabilities (U.S. Department of Justice Civil Rights Division and U.S. Department of Education Office for Civil Rights, 2014).3 This report emerged out of districts’ need for support and information related to conducting the types of analyses of disciplinary data specified in that letter.
Along with the federal attention to school discipline, there is concern among districts in states served by Regional Educational Laboratory (REL) Northeast & Islands about the use and disproportionality of disciplinary actions. For example, the use of exclusionary disciplinary actions, particularly in urban schools serving large proportions of racial/ethnic minority students from lower-income communities, has become the subject of both investigation and analysis for Urban School Improvement Alliance member districts. The Urban School Improvement Alliance is one of the eight alliances served by REL Northeast & Islands and comprises research and data leaders from midsized urban districts in Connecticut, Massachusetts, New York, and Rhode Island. Several representatives of alliance
The relationship of exclusionary discipline to negative outcomes for students, particularly racial/ ethnic minority students and students with disabilities, has raised questions among stakeholders about equity in school punishment and whether alternatives may be employed in response to student offenses
1

Box 1. Key terms
Disciplinary terms
Disciplinary action. An action taken by the school administration in response to a specific
student offense. For example, lunch detention for the student offense of using verbal profanity
toward a teacher.
Exclusionary discipline. A disciplinary action that removes a student from his or her normal
learning setting. For example, out-of-school suspension (National Clearinghouse on Supportive
School Discipline, 2014).
Expulsion. A type of exclusionary discipline that removes a student from his or her normal
learning setting for the remainder of the school year or longer, depending on the policy of the
local education agency. The student’s educational services could continue (for example, at an
alternative school) or cease during this time (U.S. Department of Education, 2016b).
Inclusionary discipline. A disciplinary action that does not remove a student from his or her
normal learning setting and results in no loss of instruction time. For example, afterschool
detention. Also referred to as nonexclusionary discipline (National Clearinghouse on Support
ive School Discipline, 2014).
In-school suspension. A disciplinary action that temporarily removes a student from his or her
classroom or classrooms for at least half a day and keeps him or her under the supervision of
school employees. Not all in-school suspension is inclusionary because it may result in loss of
instruction time (U.S. Department of Education, 2016b).
Out-of-school suspension. A type of exclusionary discipline that excludes a student from school
for one school day or longer (U.S. Department of Education, 2016b).
Student offense. A violation of school rules committed by a student.
Data terms
Composition index. A comparison of the percentage of a subgroup of students receiving a
certain disciplinary action to their percentage of the total student enrollment. For example, if
White students constitute 60 percent of suspensions, but make up only 40 percent of the total
enrollment, their composition index would be 60/40 = 1.5 (The Equity Project, 2015).
Discipline rate per 100 students. The number of disciplinary actions per 100 students. It is
calculated by dividing the number of disciplinary actions a student subgroup receives by the
total enrollment of the subgroup and multiplying by 100. For example, if 100 Black students
are suspended and there are 200 Black students total, the discipline rate per 100 students is
(100/200) x 100 = 50 (McIntosh, Barnes, Eliason & Morris, 2014).
Outlier. A value in a data set that is very different from the other values in the data set (usually it is
much larger or much smaller, or falls outside a valid range of answers) (The Equity Project, 2015).
Relative risk ratio (also known as risk ratio). The ratio between the rate at which one student
subgroup receives a disciplinary action to the rate at which another student subgroup does. A
relative risk ratio is calculated by dividing the rate at which one student subgroup receives a
disciplinary action by the rate at which another student subgroup does. For example, if the risk
rate for Black students is 40 percent and the risk rate for White students is 20 percent for a
(continued)
2

Box 1. Key terms (continued)
specific disciplinary action, the risk ratio for this action for Black students to White students
would be 40/20 or 2:1 (The Equity Project, 2015).
Risk difference. The difference between the rate at which one student subgroup receives a
disciplinary action and the rate at which another student subgroup does. A risk difference is
calculated by subtracting the rate at which one student subgroup receives a disciplinary action
by the rate at which another student subgroup does. For example, if the risk rate is 40 percent
for Black students and 20 percent for White students for a specific disciplinary action, the risk
difference is 20 percentage points. (U.S. Department of Education, Data Accountability Center,
2011).
Risk rate. The percentage of students who experience a certain event. A risk rate is calcu
lated by dividing the number of students experiencing a certain event by the total number of
students enrolled. For example, if 50 White students are suspended out of 100 total White
students enrolled, the risk rate is 50/100 = 50 percent (McIntosh et al., 2014).
Risk index. A risk index is a table made up of the risk rates for student subgroups (such as
by disability status, race/ethnicity, gender, or other protected status). The risk index allows for
comparison of the risk rate for each student subgroup in the analysis (Losen, 2014).
Unduplicated counts. Each student or occurrence is counted only once. For example, in an
analysis of students who were suspended, in an unduplicated count a student who was sus
pended multiple times would only be counted once (U.S. Department of Education, 2016b).
Unit of analysis. The level of analysis, also described as the entity (the who or what) being
studied. For example, in analyzing a student-level data file to identify the factors that predict
student suspensions, the unit of analysis would be the individual student. In analyzing
school-level data to identify factors that predict school use of suspension, the unit of analysis
would be the school (What Works Clearinghouse, 2016).
member districts have expressed a desire for information on ways to prepare and analyze their student-level disciplinary data.
Districts can examine their own data to assess how often they are using exclusionary disciplinary actions, particularly for minor student offenses, whether policies or practices for addressing such infractions appear to be targeted toward certain types of students, and how disciplinary actions correlate with academic outcomes. Although analyses of associations between disciplinary actions and outcomes may not support a causal link between actions and outcomes, they may point to potential impacts and could inform the need for future research, including examination of alternative ways to address negative behaviors.
This report offers a blueprint to assist districts in examining their student-level disciplinary data and engaging with external researchers who are doing the same. It is designed to answer three core questions, using data that districts are likely already collecting:
• What disciplinary actions do students in the district receive and for what student offenses?
• Does the district use exclusionary disciplinary actions more frequently for some subgroups of students than for others?
Districts can examine their own data to assess how often they are using exclusionary disciplinary actions, particularly for minor student offenses, whether policies or practices for addressing such infractions appear to be targeted toward certain types of students, and how disciplinary actions correlate with academic outcomes
3

• Do student academic outcomes differ by the type of disciplinary actions that students receive?
Although the focus is district disciplinary data, the analyses in this report can also be used to examine disciplinary data for a single school or an entire state.
Before starting
Analysts may want to consider how they will obtain the components necessary to conduct the analyses outlined in this report:4
• A student-level data file—that is, a file with a record for each student—that includes data on student demographics, student offenses, disciplinary actions, and academic performance.
• A simple “flat” file (a data file that is considered binary, contains no structured relational data, and can be analyzed on its own), such as a spreadsheet where each row represents a single student observation and each column represents a single student variable (for example, student offense or subsequent disciplinary action). Such a flat student-level data file can be aggregated at any number of unit levels (including the school and district level).
• A statistical software package. Common examples include Excel, Stata, SAS, SPSS, and R. This report provides syntax and screenshots for SPSS; however, many of the analyses presented in this report may be computed using the other programs listed above.
In addition, analysts may want to focus initially on data for a single academic year. Districts may have access to longitudinal student data, but it is likely more useful to first examine one year of data before undertaking more complex longitudinal analyses. It is recommended that analysts use a census of all district students or all students in a middle school or a high school. Using a census rather than a sample means that, from a research perspective, there is no need to estimate standard errors or confidence intervals or to conduct statistical significance tests in order to make inferences from the sample to the population.
Understanding and checking data
This section describes five considerations that apply generally to disciplinary data that are important to take into account before starting any analysis (box 2).
Define all data elements to understand how the district categorizes student offenses and disciplinary actions
Unlike serious offenses such as drug possession or violence resulting in injury, which are defined by objective criteria, less serious offenses may not be characterized by specific behaviors and therefore may be indicated by vague descriptors. This means that educators may have discretion in how these behaviors are identified and disciplined. Some researchers have argued that more subjective descriptors can contribute to disproportionate disciplinary treatment of certain student subgroups, such as racial/ethnic minority students and students with disabilities, because determinations made on the basis of subjective descriptors are more vulnerable to the influence of implicit bias (Losen & Orfield, 2002; Morgan et al., 2014; Staats, 2014). King, Harris-Murri, and Artiles (2006) recommend that districts
Analysts may want to focus initially on data for a single academic year. Districts may have access to longitudinal student data, but it is likely more useful to first examine one year of data before undertaking more complex longitudinal analyses
4

Box 2. Disciplinary data checklist
Analysts can use a checklist of guiding questions to monitor their work. Questions may include:
• Are behaviors warranting disciplinary actions clearly defined?
• Are disciplinary actions associated with student offenses clearly defined?
• What is the population of interest?
• Are there clearly defined rules for:
• Ensuring transparency?
• Dealing with missing or inaccurate data?
• Checking accuracy of data entry?
• Are personally identifiable data sufficiently suppressed?
provide clear definitions of behaviors that warrant disciplinary actions, and the appropriate responses to be taken, to reduce disciplinary problems that arise and escalate because of cultural misunderstandings.
To inform this report, the study team asked members of the Urban School Improvement Alliance what disciplinary data each member district collects. To determine the relative consistency of the data, each member was asked to provide information on the types of data on student offense and disciplinary action that his or her district collects. Responses were received from eight members (see appendix A). In categorizing some of the less serious offenses, some districts included such vague descriptors as “disrespect,” “defiance,” and “disorderly conduct” (table 1). For educators, teachers, and parents in the district to know exactly what is being captured by the data, more explicit definitions about both the student offense and disciplinary action are needed.
Establish rules to make the analysis transparent
Another important consideration is establishing rules to make the analysis transparent, such as defining the population and describing how changes in a student’s status during the year will be handled in the data file and data analyses. For example, how will students who drop out during the year who received a disciplinary action be handled? What if students
For educators, teachers, and parents in the district to know exactly what is being captured by the data, explicit definitions about both the student offense and disciplinary action are needed
5
Table 1. Categorizations of some less serious student offenses with subjective descriptors, by district
District DisrespectDisruptive behavior
Inappropriate behavior
Insubordi-nation
Disorderly conduct Defiance
Causing disturbance
1 ● ● ●
2 ● ● ●
3 ● ● ●
4 ● ● ●
5 ● ● ● ●
6 ● ● ● ●
Note: A dot indicates that the district records the offense category. Although data were collected from eight member districts, only six are included, because one district explicitly discourages the use of vague offense categories and one district did not provide its less serious offense categories. District names are not included to preserve confidentiality.
Source: Authors’ analysis based on data from members of the Urban School Improvement Alliance.

switch from general education to special education during the year? (See appendix B for suggested strategies for handling these and other possible data error issues.)
Determine whether data are missing or inaccurate
At the data analysis stage, data will be present or missing, and, if present, accurate or inaccurate. There are two primary reasons that data systems have missing or inaccurate data: data are not entered into the system at all or data are incorrectly recorded—and both can be challenging to address at the analysis stage. The implications of both are described below.
Data are missing because they are not entered into the system at all. Data that are not entered into the system at all may show up as zeroes or missing data, which provides an incomplete picture of offenses and discipline and can lead to misinterpretation of the data and underestimates of frequency of occurrence. Such errors may occur more frequently when data are not collected, reported, or used on a regular basis (Allison, 2001; Losen, 2014).
One strategy to identify this problem is for analysts to review the data file and determine whether frequencies and prevalence of offenses and disciplinary actions match the experiences of school staff. Descriptive statistics (such as variables’ means and their minimum and maximum values) can be used to investigate whether there are potential missing data; however, additional information is necessary to determine whether the data are actually missing. For example, if data are available from surveys of students about their behavior, districts could review whether student offense data from the official records are similar to student self-report data. Several other checks can verify data and the extent of missing data before beginning analysis (see appendix B). If it can be confirmed that a zero refers to a missing data value rather than an actual zero value, it can be recoded as missing.
Data are collected or recorded incorrectly. Schools often collect their own disciplinary data, and methods for collecting data may vary—even among schools in the same district. For example, the role of the person who enters data into the system or who has permission to revise it may differ across schools. Disciplinary data can be incorrectly recorded when the wrong code for an offense is used, when data are copied inaccurately from a paper form, or when open-ended data are coded into discrete categories. Incorrectly recorded data may result in erroneous outliers in the data. For example, if a student receives a one-day suspension, but the length is double keyed, the data file would indicate an 11-day suspension. This is an extreme example that may skew the results. Disciplinary data on students might be intentionally misreported because of certain incentives; this has occurred in other areas of education, as when test scores have been tampered with to meet student achievement goals (Bidwell, 2015; U.S. Department of Education Office of Inspector General, 2007). Several data checks, such as examining the source of the original data, can help identify errors that occurred in data recording.
Define and refine the unit of analysis
When working with disciplinary data, it is important to define and refine the unit of analysis —that is, to be clear about what is being analyzed. For example, is the focus the number of out-of-school suspensions? Or is the focus which students are receiving out-of-school suspensions? Answering the first question means looking at the number of suspensions without
There are two primary reasons that data systems have missing or inaccurate data: data are not entered into the system at all or data are incorrectly recorded—and both can be challenging to address
6

regard for the number of students—meaning that the suspension is the unit of analysis and acknowledging that some students may receive multiple suspensions and will thus appear multiple times in the analysis. Answering the second question means looking at the number of students suspended—meaning that the student is the unit of analysis and that each student is counted once in the analysis, regardless of the number of suspensions (often referred to as unduplicated counts). This analysis provides information on students’ risk of suspension.
Whether students or suspensions are the unit of analysis has ramifications for analysis and interpretation. For example, the analyst has to determine whether to combine out-of-school and in-school suspensions or to track the two types of suspension separately. Although there may be value in understanding data on total suspensions (for example, when considering overall discipline rates or trends), learning about the prevalence of both in-school suspension and out-of-school suspension would require the analyst to examine the two types of suspension separately. Out-of-school suspensions involve loss of instruction time and are considered to be more intrusive and harmful than most in-school suspensions (Losen, 2014; Morgan et al., 2014). Unlike out-of-school suspensions, in-school suspensions are more likely to allow students to receive continuing instruction and support (Blomberg, 2004). It is also important to be aware that a low rate of out-of-school suspensions may occur alongside a high rate of in-school suspensions (Losen, 2014).
Regardless of whether students or disciplinary action are the unit of analysis, the analyst will confront the issue of how to handle multiple offenses within the same incident. For example, fighting over drugs may be entered in some district data systems twice: as a fighting offense and as a drug offense. A common strategy is to count the incident only once, for example, by including in the analysis only the most serious offense within any incident that has multiple offenses.
Avoid disclosure of personally identifiable data
Finally, it is important to avoid disclosure of personally identifiable data. Doing so requires determining the minimum number of students to be reported in a publicly available table (U.S. Department of Education, 2010). Although reporting standards vary, many states follow a rule not to publicly report on any cell in a table that has fewer than 10 students (U.S. Department of Education, 2010). Districts may want to follow this rule if the analysis will be publicly available. The primary concern is that reporting on such a small number of students may indirectly identify a particular student.
How to determine the disciplinary actions that students in a district receive and for what offenses
After understanding and checking data, the next step in analyzing student-level disciplinary data is determining what types of offenses are being committed, what disciplinary actions are being used, and how many students are affected. This section illustrates how to make those determinations using four calculations of the number and percentage of:
• Students receiving any disciplinary action. • Students receiving exclusionary disciplinary action versus inclusionary disciplinary
action. • Students receiving out-of-school versus in-school suspensions. • Students receiving disciplinary actions for types of major offense.
Whether students or suspensions are the unit of analysis has ramifications for analysis and interpretation
7

Calculating the number and percentage of students receiving any disciplinary action
A first step is to gauge the prevalence of students who experience any disciplinary action during the year. The results illustrate how many students (number and percentage) did or did not receive at least one disciplinary action (see appendix C for the syntax for SPSS for running frequency analyses). Using fictitious data for an example district with 1,000 students, the calculation shows that 381 students, or 38.1 percent of students in the district, received a disciplinary action (table 2).
Calculating the number and percentage of students receiving exclusionary disciplinary action versus inclusionary disciplinary action
A second step is to examine the types of disciplinary actions among students receiving any type of disciplinary action. Districts may collect a wide range of data on disciplinary actions, ranging from relatively minor disciplinary actions, such as afterschool detention, to more serious punishment, such as referrals to the police. Districts often classify these disciplinary actions into numerous categories. For example, the number of disciplinary action categories for Urban School Improvement Alliance districts ranged from 19 to 39 (see table A1 in appendix A). Because of this range, it is often difficult to compare types of disciplinary action across schools and districts, and analyses fail to provide policy- and practice-relevant information for district leadership and other stakeholders. Therefore, when there are a large number of disciplinary action categories, it may be appropriate to consolidate them into a more manageable number (for example, exclusionary disciplinary actions, such as out-of-school suspension and expulsion, and inclusionary disciplinary actions, such as afterschool detention and in-school suspension). Because exclusionary disciplinary actions typically result in a loss of instruction time and inclusionary disciplinary actions may hold potential for positive supports (Blomberg, 2004),5 examining the two types of disciplinary actions allows for comparison.
On the basis of fictitious data for both exclusionary and inclusionary disciplinary action categories, the number of students in each category was counted and divided by 381, the number of students who received any disciplinary action. A student is unduplicated within each type of disciplinary action (that is, a student who received multiple exclusionary punishments is counted only once in the exclusionary disciplinary action category) but can be duplicated across types (that is, the 132 students who received both an exclusionary and inclusionary disciplinary action during the academic year are counted in both the exclusionary and inclusionary disciplinary action categories). Thus, 36.2 percent of students who received any disciplinary action received at least one exclusionary disciplinary action (table 3).
Table 2. Students with at least one disciplinary action in the last academic year, fictitious data
A first step in analyzing student-level disciplinary data is to gauge the prevalence of students who experience any disciplinary action during the year; a second step is to examine the types of disciplinary actions among students receiving any type of disciplinary action
8
At least one disciplinary action
Total enrolled students (n = 1,000)
Number Percent
Yes 381 38.1
No 619 61.9
Source: Authors’ analysis based on fictitious data.

Calculating the number and percentage of students receiving out-of-school versus in-school suspensions
A third step to better understand the use of inclusionary and exclusionary suspension is to conduct a frequency analysis of both types of suspension. There can be variance in how many days a student spends in out-of-school suspension, so the analysis could also include the frequencies of students receiving one day of out-of-school suspension and those receiving more than one day. There is also variance in in-school suspension, such as in how much instruction time is lost (for example, in sitting in the principal’s office), but a district’s data system may not capture that.
In this instance, it may be appropriate for districts to count only the most serious disciplinary action a student receives in each type so that the results are unduplicated within category (but duplicated across categories, such as exclusionary and inclusionary). The fictitious data indicate that 20.4 percent of enrolled students received an in-school suspension during the last academic year, nearly twice as many as received an out-of-school suspension of one day (10.9 percent) or longer (2.9 percent; table 4).
Calculating the number and percentage of students receiving disciplinary actions for types of major offense
To consider the types of disciplinary actions administered for different types of student offenses, another type of frequency analysis, commonly referred to as a cross-tabulation (also known as a contingency table) can be used. In a cross-tabulation, two variables (in
A third step is to conduct a frequency analysis of both inclusionary and exclusionary suspension
9
Table 3. Types of disciplinary action received, among students who received any disciplinary action in the last academic year, fictitious data
Type of disciplinary action
Students who received any disciplinary action (n = 381)
Number Percent
Exclusionary 138 36.2
Inclusionary 375 98.4
Note: Students are unduplicated within type of disciplinary action.
Source: Authors’ analysis based on fictitious data.
Table 4. Students with suspensions by type in last academic year, fictitious data
Type of disciplinary action
Total enrolled students (n = 1,000)
Number Percent
Exclusionary
Out-of-school suspension
One day 109 10.9
More than one day 29 2.9
Other exclusionary discipline 0 0.0
Inclusionary
In-school suspension 204 20.4
Other inclusionary discipline 171 17.1
Source: Authors’ analysis based on fictitious data.

this instance, disciplinary actions and types of offenses) are examined together to report the number of cases that simultaneously fall into the various categories.
Because the number of offenses and disciplinary actions collected by a district can be large, a cross-tabulation of offenses and disciplinary actions could be unwieldy and difficult to interpret and might include categories that have few students and cannot be reported because of confidentiality concerns. It is important to consider the steps below before conducting such an analysis.
It is essential first to determine how many categories of offenses and disciplinary actions will be useful in the analysis, based on the questions that need to be answered. Second, these offenses and disciplinary actions can be categorized into major or most common groups. For example, the focus can be one or two offenses, such as bullying or disobedience, and major disciplinary action, such as in-school and out-of-school suspensions. This decision can be made in consultation with key stakeholders in the district familiar with the data, such as administrators and school staff, so that everyone understands what types of offenses and disciplinary actions the larger categories include and why some breakdowns are not made public (because of small cell sizes, for example). Alternatively, the most common offense and disciplinary action categories (such as the top five) that account for the vast majority of cases could be used, with an “other” category to capture the remaining offenses or disciplinary actions that represent fewer students. The resulting report should be explicit about how broader categories were created and what disciplinary actions and offenses are represented by each broader category.
In an example using broad categories for analysis of fictitious data, nearly all student misbehavior during the year is categorized into eight common student offense categories (including fighting, truancy, drugs, and theft; table 5). Disciplinary actions are collapsed into two categories: exclusionary and inclusionary. To make the example easier to follow, the analysis uses a rate based on the number of disciplinary actions per 100 students for each offense type. This rate is calculated by dividing the number of students receiving the disciplinary
To consider the types of disciplinary actions administered for different types of student offenses, another type of frequency analysis, commonly referred to as a cross-tabulation, can be used
10
Table 5. Disciplinary actions by offense and type of disciplinary action, fictitious data
Offense
Total disciplinary actions
(n = 957)
Exclusionary disciplinary actions
(n = 536)
Inclusionary disciplinary actions
(n = 410)
Number
Rate per 100 students Number
Rate per 100 students Number
Rate per 100 students
Disruptive behavior 221 22.1 97 9.7 124 12.4
Drugs 103 10.3 63 6.3 40 4.0
Fighting 156 15.6 110 11.0 46 4.6
Harassment 116 11.6 56 5.6 60 6.0
Theft 78 7.8 70 7.0 a a
Truancy 189 18.9 87 8.7 102 10.2
Weapon 41 4.1 38 3.8 a a
Other 53 5.3 15 1.5 38 3.8
Note: Total student enrollment is 1,000 students.
a. Suppressed because there are fewer than 10 cases.
Source: Authors’ analysis based on fictitious data.

action by the number of total students enrolled, and multiplying by 100. The fictitious data indicate that the two most common offense categories for exclusionary disciplinary actions are fighting and disruptive behavior.
In this example, the total number of disciplinary actions is counted. Because one student may be counted in more than one offense category, the total number of disciplinary actions approaches the total number of students enrolled in the school. This table enables analysts to view what types of offenses occur most frequently, and the resulting disciplinary actions for each offense.
How to determine whether a district uses exclusionary disciplinary actions more frequently for some subgroups of students than for others
Districts may want to examine whether exclusionary disciplinary actions are used more frequently for certain subgroups of students. Presenting the results to stakeholders such as teachers, administrators, parents, and other local stakeholders in an intuitive, understandable way requires considering the metrics that will be used.
This section provides suggestions on the following: • Determining student subgroups for analysis. • Calculating risk indices. • The challenge of small cell sizes. • Calculating the risk rate for different disciplinary actions by racial/ethnic subgroup. • Calculating the frequency of different disciplinary actions and offense types by
student racial/ethnic subgroup.
Determining student subgroups for analysis
The first step is to determine what student subgroups are to be included in the analysis. Although the research literature indicates that exclusionary discipline may be influenced by a number of factors (Skiba et al., 2014), federal guidance recommends that districts focus on protected student subgroups (U.S. Department of Justice Civil Rights Division and U.S. Department of Education Office for Civil Rights, 2014), such as those distinguished by race/ethnicity, gender, and disability status. The examples here focus on race/ethnicity as a protected student subgroup.
The second step is to produce enrollment frequency counts and percentages for protected student subgroups, such as race/ethnicity. The enrollment totals are needed for some of the analyses discussed later.
Calculating risk indices
A third step is to determine what risk index to use to establish whether there are disproportionate disciplinary actions toward student subgroups. There are several options for presenting results: the U.S. Department of Education Office for Civil Rights currently publishes reports that include several different measures for disciplinary data (U.S. Department of Education Office for Civil Rights, 2016a), which are discussed in this section to help districts understand the benefits and limitations of each. It is advisable to use multiple
Districts may want to examine whether exclusionary disciplinary actions are used more frequently for certain subgroups of students
11

indices, as several have limitations under certain data conditions that could lead to misinterpretation of results if used in isolation.
All the options rely on three steps to create risk rates (the steps can be applied both to the total student population and to the specific student subgroups):
• Identify the number of students enrolled, in total and by subgroup. • Identify the total number of students receiving a particular disciplinary action
(such as out-of-school suspension). • Divide the number of students receiving the disciplinary action by the total
number of students enrolled to produce a percentage.
Calculating the simple risk rate. To calculate a risk rate, divide the number of students receiving a disciplinary action by the total number of enrolled students. For example, consider a school with 1,000 students enrolled, 100 of whom received out-of-school suspensions. The risk of any student receiving at least one out-of-school suspension during the school year is 10 percent.
Creating the risk index. The risk index comprises the risk rates for certain student subgroups and allows for comparison of the risk rate for each student subgroup in the analysis. For example, suppose that 1,000 students are enrolled, of whom 400 are White and 200 are Black. Suppose that during the year 50 White students and 50 Black students were suspended. Using the risk index table, the risk rate for White students would be 12.5 percent (50/400) and the risk rate for Black students would be 25 percent (50/200; table 6). The fictitious data indicate that the risk for receiving out-of-school suspension is higher for Black students (25 percent) than for White students (12.5 percent). A more detailed risk index can be created to further disaggregate the results—for example, the risk for suspension by race/ethnicity with disability status. From such a risk index, risk differences and risk ratios can be easily calculated as described below. (Note that tables 6–9 and figure 1 are designed to illustrate how to create these indices, and the data in them are not the same as in the fictitious data in tables presented elsewhere in this report.)
Risk differences or gaps. Gaps or differences in risk rates (using the risk index) can be used to analyze disproportionality. To examine the discipline gap, risk rates are compared across student subgroups, and the gaps between any two subgroups can easily be calculated by subtracting one rate from the other (Losen, 2014). This is similar to the way to calculate a racial/ethnic achievement gap. For example, using fictitious data, the risk rate is 25 percent for Black students and 12.5 percent for White students (table 7). After
Table 6. Risk index, showing risk rate calculations and risk rates across subgroups, fictitious data
Several risk indices can be used to establish whether there are disproportionate disciplinary actions toward student subgroups
12
Category Black White Hispanic All
Total enrollment 200 400 400 1,000
Number of students receiving out-of-school suspensions at least once 50 50 38 138
Risk formula 50/200 50/400 38/400 138/1,000
Risk rate (percent) 25 12.5 9.5 13.8
Source: Authors’ analysis based on fictitious data.

Table 7. Risk difference calculation, fictitious data
Category Black White
Total enrollment 200 400
Number of students receiving out-of-school suspensions at least once
Risk formula
Risk rate (percent)
Risk difference (gap) (percentage points)
50
50/200
25
25 – 12.5 = 12.5
50
50/400
12.5
Source: Authors’ analysis based on fictitious data.
subtracting one risk rate from the other, the risk gap is 12.5 percentage points. One benefit of a risk difference is that it provides a clear comparison in absolute percentage points between two different rates. It is an easily interpreted starting point for considering differences between subgroups. One limitation to a risk difference is that for low probability events, the risk difference is not as sensitive—for example, if 4 percent of one subgroup is suspended and 1 percent of another subgroup is suspended, the risk difference would be 3 percentage points, which looks small, even though members of the first subgroup are four times as likely as members of the other group to be suspended.
A relative risk ratio. A relative risk ratio enables comparing the rate at which one student subgroup receives a disciplinary action to the rate at which another does. To calculate the relative risk ratio, it is necessary to first determine the risk rates and then divide the rate at which one subgroup receives a disciplinary action by the rate at which another subgroup does. Using fictitious data, the risk ratio for Black students relative to White students is 2:1 (table 8). This means that for every White student who receives an out-of-school suspension, two Black students receive an out-of-school suspension.
There are several limitations to risk ratios. First, high ratios are possible even when the underlying risk for each of the comparison subgroups is low. For example, a relative risk ratio of 2:1 could be found in a district with few suspensions or a district with many suspensions. In figure 1 the fictitious data produce the same risk ratio for four districts, even though in city A the rate of out-of-school suspensions is 80 percent for Black students and 40 percent for White students, while in city D the rate is 20 percent for Black students and 10 percent for White students. Both yield a risk ratio of 2:1, even though the absolute racial gap is much larger in city A.
Table 8. Risk ratio calculation, fictitious data
A relative risk ratio enables comparing the rate at which one student subgroup receives a disciplinary action to the rate at which another does
Category Black White
Total enrollment 200 400
Number of students receiving out-of-school suspensions at least once 50 50
Risk formula 50/200 50/400
Risk rate (percent) 25 12.5
Risk ratio equation (percent) Risk for Black students / risk for White students = 25 / 12.5
Risk ratio 2:1
Source: Authors’ analysis based on fictitious data.
13

Figure 1. Risk ratio is relative, fictitious data
Black students White students
City A City B City C City D
Risk rate for out-of-school suspension
100
75
50
25
0
Source: Authors’ analysis based on fictitious data.
Second, relative risk ratios do not indicate whether a disciplinary action is used often or rarely, which may be an issue if the goal is to discover whether large differences are driven by potentially excessive or unnecessary disciplinary actions. Third, because risk ratios depend on division, if the comparison subgroup has no suspended students, a ratio cannot be calculated. This may be the case for some elementary schools. The risk ratio should not be relied on as a primary measure for understanding disproportionality in the district but should be used in conjunction with other metrics, such as the risk difference.
Discipline rate per 100 students. Another useful metric is the discipline rate per 100 students. It is calculated by dividing the total number of disciplinary actions that the student subgroup received by the total enrollment for the student subgroup and multiplying by 100. For example, the fictitious data in table 9 indicate that the rate of out-of-school suspensions is 25 for every 100 Black students and 12.5 for every 100 White students (table 9).
The composition index. A composition index compares the percentage of a subgroup of students receiving a particular disciplinary action to their percentage of total student enrollment. For example, if White students make up 40 percent of the population but receive 60 percent of suspensions, their composition index would be 1.5 (60/40). A composition index of 1.0 indicates that a student subgroup receives the same percentage of disciplinary actions as its percentage of total student enrollment; a composition index of less than 1.0 indicates that the student subgroup receives a smaller percentage of disciplinary
Table 9. Discipline rate per 100 students calculation, fictitious data
A composition index compares the percentage of a subgroup of students receiving a particular disciplinary action to their percentage of total student enrollment
14
Category Black White
Total enrollment 200 400
Number of out-of-school suspensions 50 50
Rate per 100 students formula 50/200 × 100 50/400 × 100
Rate per 100 students 25 12.5
Source: Authors’ analysis based on fictitious data.

actions than its percentage enrollment, and a composition index greater than 1.0 indicates that the student subgroup receives a larger percentage of disciplinary actions than its percentage enrollment.
The composition index has several limitations. First, it does not indicate whether the overall use of suspension is frequent or rare. Second, it has mathematical limitations. For example, if the highest suspended subgroup also represents a significant majority of the total enrollment (85 percent or more), a composition index method may not be a useful comparison among subgroups (Losen, 2014). For example, in a district where White students account for 90 percent of enrollment and have a 45 percent out-of-school suspension rate, these students would have a composition index of 0.5; if in the same district Hispanic students account for 4 percent of enrollment and have a 2 percent out-of-school suspension rate, they would have the same composition index (0.5). Thus, the composition index is the same for each subgroup, even though White students account for nearly half the outof-school suspensions, while Hispanic students account for only 2 percent. Therefore, the composition index is not recommended as the primary measure for identifying disproportionality. If the composition index is presented, it may be a supplemental measure used in conjunction with one or more of the other metrics presented here.
The challenge of small cell sizes
A particular issue that challenges all analyses, especially those involving disproportionality, is the small cell problem. A small cell problem occurs when only a few cases (students or disciplinary actions) appear in one cell of a table. This often occurs in data on subgroups, as there are fewer cases per category—for example, few students in a subgroup of interest or few students receiving a particular disciplinary action. It is important to use caution in interpreting very small cell sizes. For example, if only two Black students are enrolled and both are suspended, the fact that 100 percent of Black students were suspended may lead to an inaccurate conclusion about disproportionality of disciplinary actions. One strategy for dealing with such a situation is to examine data over multiple years. If the pattern for Black students appears every year (that is, the few Black students in the school are suspended every year), there may be a systemic issue rather than a statistical anomaly. Another problem with a small cell size is that it may allow individual students to be personally identified from their personal characteristics (for example, a cell with the only two Black students in the school). This information should not be publicly reported given the risk of disclosing the identity of these students.
Calculating the risk rate for different disciplinary actions by racial/ethnic subgroup
This section provides information on how to examine the relationship between race/ ethnicity and disciplinary actions using the rate of disciplinary actions per 100 students.
The current example, using fictitious data, categorizes disciplinary actions into two subgroups: out-of-school suspensions and in-school suspensions. Table 10 provides a breakdown of disciplinary actions for student racial/ethnic subgroups, including the enrollment percentages for each racial/ethnic subgroup, the unduplicated percentages of all disciplinary actions received within student subgroups, the number of students receiving out-of-school and in-school suspensions, and the rates of in-school and out-of-school suspensions per 100 students. The fictitious data indicate that Black and Hispanic students
An issue that challenges analyses of disproportionality is the small cell problem; this often occurs in data on subgroups, as there are fewer cases per category
15
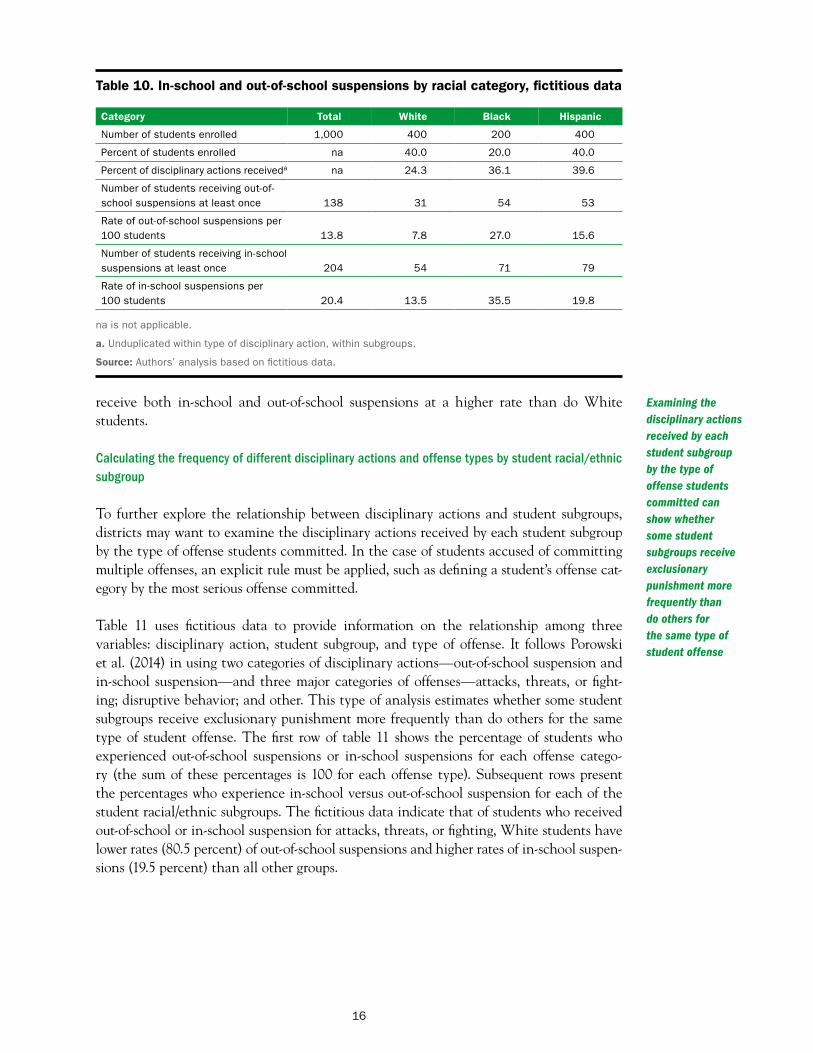
Table 10. In-school and out-of-school suspensions by racial category, fictitious data
Category Total White Black Hispanic
Number of students enrolled 1,000 400 200 400
Percent of students enrolled na 40.0 20.0 40.0
Percent of disciplinary actions receiveda na 24.3 36.1 39.6
Number of students receiving out-ofschool suspensions at least once 138 31 54 53
Rate of out-of-school suspensions per 100 students 13.8 7.8 27.0 15.6
Number of students receiving in-school suspensions at least once 204 54 71 79
Rate of in-school suspensions per 100 students 20.4 13.5 35.5 19.8
na is not applicable.
a. Unduplicated within type of disciplinary action, within subgroups.
Source: Authors’ analysis based on fictitious data.
receive both in-school and out-of-school suspensions at a higher rate than do White students.
Calculating the frequency of different disciplinary actions and offense types by student racial/ethnic subgroup
To further explore the relationship between disciplinary actions and student subgroups, districts may want to examine the disciplinary actions received by each student subgroup by the type of offense students committed. In the case of students accused of committing multiple offenses, an explicit rule must be applied, such as defining a student’s offense category by the most serious offense committed.
Table 11 uses fictitious data to provide information on the relationship among three variables: disciplinary action, student subgroup, and type of offense. It follows Porowski et al. (2014) in using two categories of disciplinary actions—out-of-school suspension and in-school suspension—and three major categories of offenses—attacks, threats, or fighting; disruptive behavior; and other. This type of analysis estimates whether some student subgroups receive exclusionary punishment more frequently than do others for the same type of student offense. The first row of table 11 shows the percentage of students who experienced out-of-school suspensions or in-school suspensions for each offense category (the sum of these percentages is 100 for each offense type). Subsequent rows present the percentages who experience in-school versus out-of-school suspension for each of the student racial/ethnic subgroups. The fictitious data indicate that of students who received out-of-school or in-school suspension for attacks, threats, or fighting, White students have lower rates (80.5 percent) of out-of-school suspensions and higher rates of in-school suspensions (19.5 percent) than all other groups.
Examining the disciplinary actions received by each student subgroup by the type of offense students committed can show whether some student subgroups receive exclusionary punishment more frequently than do others for the same type of student offense
16

How to determine whether student academic outcomes differ by the types of disciplinary actions that students receive
As described earlier, the U.S. Department of Justice Civil Rights Division and U.S. Department of Education Office for Civil Rights (2014) have issued guidance recommending that district personnel determine how often exclusionary punishment is used and whether it is disproportionately administered to certain protected student subgroups. Districts may want to go beyond these questions to ask more about the relationship between disciplinary actions and subsequent academic outcomes. In this section, cross-tabulation is presented as an approach for beginning to understand this relationship. Cross-tabulations are most appropriate with categorical data (data that have discrete characteristics and can be organized into subgroups, such as student race/ethnicity and letter grades), but continuous data (data that have continuity and can be examined along a continuum of values, such as age or test scores) can be collapsed into meaningful categories based on ranges of scores, for example, and be used in the analysis.
Regression analysis may offer a path for going beyond a descriptive account of the data. Regression analysis will not permit causal inferences in this context, but it will provide information about associations or correlations among discipline, offenses, and student characteristics that may lead to additional investigation into ways disciplinary actions affect the academic outcomes of students. The findings could inform future studies of the effects of disciplinary actions and efforts to identify alternative ways to address negative student behaviors. Regression analysis, including hierarchical linear modeling, may also be used to better understand the correlation between disciplinary actions and subsequent academic outcomes. For more information on hierarchical linear modeling, see Raudenbush and Bryk (2002) and O’Dwyer and Parker (2014).
Accounting for missing data is a challenge in quantitative analysis. For example, in an analysis of the association between out-of-school suspension and state-sponsored test scores, there will be students who missed the annual test. The same students may have high absenteeism rates and may experience more disciplinary actions than do students who regularly attend school. Excluding students with missing test data, a common practice,
Regression analysis can provide information about associations or correlations among discipline, offenses, and student characteristics that may lead to additional investigation into ways disciplinary actions affect the academic outcomes of students
17
Table 11. Percentage of students receiving out-of-school suspension and in-school suspension, by offense type and race/ethnicity, fictitious data
Race/ethnicity
Attacks, threats, or fighting Disruptive behavior Other
Out-of-school
suspensionIn-school
suspension
Out-of-school
suspensionIn-school
suspension
Out-of-school
suspensionIn-school
suspension
Total 83.0 17.0 64.5 35.5 59.9 40.1
White 80.5 19.5 62.4 37.6 65.8 34.2
Black 86.2 13.8 63.8 36.2 58.5 41.5
Hispanic 84.7 15.4 68.9 31.1 55.3 44.7
Asian/Pacific Islander 87.9 12.1 68.4 31.6 52.2 47.8
American Indian/Alaskan Native 88.1 11.9 70.6 29.4 52.3 47.7
Multiracial 91.1 8.9 67.6 32.4 54.6 45.4
Source: Authors’ analysis based on fictitious data.

could eliminate from the sample students who have experienced exclusionary disciplinary action and reduce accuracy of the analysis.
Examining patterns of missing data can help in assessing concerns about missing data. For example, an analyst could identify students who did take the test and students who did not, cross-tabulate whether students did or did not take the test by disciplinary actions received, and review the values for whether there are differences in percentages. To test whether a difference is large enough that chance fluctuation is not a likely explanation for the result, a chi-square test can be used. If there is a pattern to the missing data, several approaches (which are beyond the purview of this guide) can be used to address the issue (see Allison, 2001, and Puma, Olsen, Bell, and Price, 2009).
A cross-tabulation can also be done between disciplinary action and academic outcomes. In an example of a cross-tabulation of disciplinary actions and academic outcomes using fictitious data, the disciplinary action categories are in-school suspension, other inclusionary discipline, out-of-school suspension, and other exclusionary discipline (table 12). For academic outcome, the table uses satisfactory progress to the next grade. Satisfactory progress can be defined different ways, such as whether the student passed all requirements to progress to the next grade (see appendix C for the SPSS syntax for the analyses in this section). In the analysis, the total number and percentage of students who advanced to the next grade, or not, are provided for each of the four disciplinary action categories and for students who received no disciplinary action. In this example a higher percentage of students receiving out-of-school suspension (19.6 percent) than of students receiving in-school-suspension (8.3 percent) did not progress in grade level. These students are unduplicated within disciplinary action category.
Table 12. Students advancing to next grade level by the type of disciplinary action experienced in the past academic year, fictitious data
Disciplinary action
Advanced to next grade level
No Yes
At least one in-school suspension (n = 375)
Number 31 344
Percent 8.3 91.7
At least one other inclusionary discipline (n = 315)
Number 34 281
Percent 10.8 89.2
At least one out-of-school suspension (n = 138)
Number 27 111
Percent 19.6 80.4
Examining patterns of missing data can help in assessing concerns about missing data. If there is a pattern to the missing data, several approaches can be used to address the issue
At least one other exclusionary discipline (n = 12)
Number a a
Percent a a
No disciplinary action (n = 619)
Number 38 581
Percent 6.1 93.9
Note: Unduplicated count of students within type of disciplinary action.
a. Suppressed because there are fewer than 10 cases.
Source: Authors’ analysis based on fictitious data.
18

Conclusion
As concerns about school discipline and its impact on equity, student success, and school safety become a greater national priority, district leadership may request analyses of student-level disciplinary data. The results of such analyses can help district leadership and others concerned with this issue, such as parents, understand what types of discipline students receive and for what offenses, whether disciplinary actions are used disproportionately with different subgroups of students, and whether there is a relationship between type of discipline and later student outcomes. This report provides information to assist those conducting these analyses and highlights important considerations as districts begin such empirical investigations.
This report may also serve as a stimulus for examining the way districts define and collect disciplinary data. The work required to prepare and conduct analyses with existing student-level district data could expose instances in which data are defined poorly, entered incorrectly, or left uncollected. Such discoveries could lead to interventions to improve data quality, such as implementation of improved technology6 or training of data input personnel that stress the importance of the correctness of these data, especially because they will be publicly reported.
The results of analyses of student-level disciplinary data can help district leadership and others concerned with this issue understand what types of discipline students receive and for what offenses, whether disciplinary actions are used disproportionately with different subgroups, and whether there is a relationship between type of discipline and student outcomes
19

Appendix A. Core Planning Group member data
This appendix describes the process of gathering information about student offense and disciplinary action data from the Regional Educational Laboratory (REL) Northeast & Islands Urban School Improvement Alliance Core Planning Group members. Members represent nine midsized urban districts—New Haven, Connecticut; Brockton, Massachusetts; Lowell, Massachusetts; Worcester, Massachusetts; New Rochelle, New York; Rochester, New York; Syracuse, New York; Yonkers, New York; and Providence, Rhode Island—and one suburban district—Lexington, Massachusetts—in the REL Northeast & Islands Region.
A query to members sought examples of the types and amounts of student offense and disciplinary action data collected by districts. Representatives from 8 of the 10 member districts provided information about the student offense data and disciplinary action data that they collected, including data codebooks that would describe the data elements. The data sources were primarily lists of data elements that the districts use to capture student offenses and disciplinary actions (table A1). In addition, members from Syracuse, New York, sent the Syracuse Code of Conduct, and members from Rochester, New York, sent the district’s electronic data entry process for recording student offenses.
Table A1. Summary student offense and disciplinary action data collected by Core Planning Group member districts, 2015
District Number of student offense categories Number of disciplinary action categories
1 86 36
2 81 21
3 92 39
4 53 20
5 42 19
6 60 36
7 59 38
8 66 25
Source: Authors’ compilation based on data reported by Urban School Improvement Alliance Core Planning Group members in 2015.
A-1

Appendix B. Common checks to reduce data errors
This appendix presents a list of checks that analysts can conduct to reduce data errors when using disciplinary data. These checks may require information gathering from district personnel. The checks are:
• Review coding and syntax, especially when results produce outliers or are counterintuitive. Even a slight misreading of syntax or misreading in transposing data across files can produce substantial errors. Check the number of students and frequencies before and after merging files to ensure that all records are included in the final dataset.
• Check whether students who were disciplined and also dropped out during the academic school year are still included in the dataset. District rules may vary on how to count disenrolled students and other leavers, but because suspension may incentivize dropping out or leaving, it is important for analyses to include these students. To avoid undercounting suspensions, it is preferable to use the enrollment data file from early in the year. Typically, districts use the October date required by the state or federal government for the child count of students with disabilities.
• Cross-check both the discipline data and the enrollment data for counts of general education and special education students. Typically, both general education and special education departments keep data on total enrollment and suspension counts of students with and those without disabilities, but these department counts can differ from each other based on the rules the departments use to define enrollment and suspension. Individual students can also shift categories during the year. Do the total counts and subgroup counts align? • Confirm whether the enrollment data used are cumulative or as of a specific
date. If the latter, do the departments use the same date? When counts differ, it is important that they be reconciled by using the same enrollment dates. Once the sources are aligned, suspension rates should be recalculated from the reconciled enrollment data.
• Confirm enrollment rules. For example, one department may subtract students not in attendance for a full academic year for achievement accountability purposes. If the special education and regular education data use different enrollment rules, apply one consistent set. If this does not eliminate the disparity, look for possible errors in data entry, for example duplicate student records. If a student appears once as having a disability and eligible for special education and somewhere else as not having a disability, use the more recent student record and corresponding disability designation after confirming that the student record was duplicated.
• Determine whether there is variation in the way that student offenses and disciplinary actions are defined and coded across the district. For example, do district personnel use consistent definitions for disciplinary actions and offenses across all departments and schools? Do general and special education have different rules for determining counts of out-of-school suspensions? If so, convene the data specialists to reconcile these differences, reduce the uniform definitions and terms to a formal written policy, and train all relevant staff on the agreed definitions. Typically there are stricter legal requirements for counting special education removals (Kendziorski & Winkler, 2012), so to avoid differences and to ensure full compliance, districts should apply the special education rules to all students. Doing so also ensures that comparisons
B-1

are valid and large disparities driven by small differences in counting rules are avoided.
• Finally, where irreconcilable errors are large enough to distort the disciplinary action rates, report these errors publicly and institute data accuracy intradepartmental cross-checks at time of entry to prevent the problem from recurring.
• If there are individual student identifiers in the file, reconcile duplicate names and birth-dates with their identifier numbers. Develop a consistent method for reporting when they cannot be reconciled.
• Cross-check numbers with publicly reported discipline data. For example, schools and districts are required to report data on discipline to the U.S. Department of Education Office of Civil Rights every two years. They are also required to report certain data to state education agencies each year. If the numbers differ, find out why. Report unresolved errors in public reports to increase transparency.
• Verify how to interpret missing data in the dataset (when possible, distinguish failure to report data from true zeros—for example, no offense or action occurred). Do not use a zero when required data were simply not reported by the school. If required data are unavailable but the field needs to be filled, clearly code it as missing to ensure that a zero does not mask a problem.
• Check that all rates of student offenses or disciplinary actions are 100 percent or less. Some reasons why they may be over 100 percent include: • For computing risk rates, the number of discipline actions (for example, sus
pensions) was used instead of the unduplicated number of students receiving the action.
• Students were included among the counts of suspended students but not among the enrolled. This can happen if students enter the district or switch schools after enrollment data were submitted.
• The actual value is 100 percent but baseline enrollment data were rounded down or the number of suspended students was rounded up.
• A student was suspended both before and after special education eligibility. • End of year or average yearly enrollment data were used, and many students
suspended during the year subsequently dropped out before the end of the year.
B-2

Appendix C. SPSS syntax
The steps for producing tables 2–5 and 10–12 in the main text are depicted below using screen shots from IBM SPSS Statistics (version 19) and the SPSS syntax. Tables 6–9 were created using Excel, and the calculations are provided within each table. The variable definitions in table C1 may be used as a codebook to interpret the syntax used to produce the data tables in this report.
Table C1. Data codebook for variables used in syntax for SPSS
Element name Variable type Definition of element
Disc_Any_Bin Numeric Binary indicator of any discipline received
Disc_Loss_Bin Numeric Binary indicator of exclusionary disciplinary action
Disc_Type_Cat Numeric Categorical indicator of type of disciplinary action received
Offense_Type_Cat Numeric Categorical indicator of type of offense committed by the student
Race_Eth_Cat Numeric Categorical indicator of student’s race/ethnicity
Grade_Progress_Bin Numeric Binary indicator of whether the student progressed to the next grade
Source: IBM SPSS Statistics (version 19).
C-1

The syntax used to create table 2: Students with at least one disciplinary action in last academic year, fictitious data
Step 1: In the drop-down menu for Analyze, select the Frequencies option under Descriptive Statistics.
Step 2: Select the variable “Disc_ Any_Bin” and move it into the Variable(s) box. Select OK.
The following SPSS command syntax can also be used:
FREQUENCIES VARIABLES=Disc_Any_Bin /ORDER=ANALYSIS.
C-2

The syntax used to create table 3: Types of disciplinary action received, among students who received any disciplinary action in the last academic year, fictitious data
Step 1: The first step to create table 3 in the main report is to select only students with any disciplinary action (these students are coded as “1” here). In the drop-down menu for Data, select the Select Cases option.
Select if condition is satisfied and the condition is Disc_Any_Bin=1 because only students with any disciplinary action are included in the analysis for table 3.
C-3

Step 2: To calculate the frequencies, select the variable “Disc_Loss_Bin” and move it into the Variable(s) box. Select OK.
The following SPSS command syntax can also be used:
USE ALL. COMPUTE filter_$=(Disc_Any_Bin = 1).VARIABLE LABELS filter_$ ‘Disc_Any_Bin = 1 (FILTER)’.VALUE LABELS filter_$ 0 ‘Not Selected’ 1 ‘Selected’.FORMATS filter_$ (f1.0).FILTER BY filter_$.EXECUTE.
FREQUENCIES VARIABLES=Disc_Any_Bin /ORDER=ANALYSIS.
C-4

The syntax used to create table 4: Students with suspensions by type in last academic year, fictitious data
Step 1: In the drop-down menu for Analyze, select the Frequencies option under Descriptive Statistics.
Step 2: To calculate the frequencies, select the variable “Disc_Type_Cat” and move it into the Variable(s) box. Select OK.
The following SPSS command syntax can also be used:
FREQUENCIES VARIABLES=Disc_Type_Cat /ORDER=ANALYSIS.
C-5

The syntax used to create table 5: Disciplinary actions by offense and type of disciplinary action, fictitious data
For table 5 in the main report, cross-tabulations are produced in SPSS and rates based on the number of disciplinary actions per 100 students for each offense type are calculated in Excel. The formula for a discipline rate is:
= (number of offenses / total enrollment for group) × 100
where group is equal to number of students who receive the discipline action type.
Step 1: In the drop-down menu for Analyze, select the Crosstabs option under Descriptive Statistics.
Step 2: To calculate the crosstabs, select the variable “Disc_Type_Cat” and move it into the Row(s) box, and then select the variable “Offense_Type_Cat” and move it into the Column(s) box. Select OK.
C-6

The following SPSS command syntax can also be used.
CROSSTABS /TABLES=Disc_Type_Cat BY Offense_Type_Cat /FORMAT=AVALUE TABLES /CELLS=COUNT /COUNT ROUND CELL.
The syntax used to create table 10: In-school and out-of-school suspensions by racial/ethnic category, fictitious data
For table 10 in the main report, the cross-tabulations are produced in SPSS and rate per 100 students are constructed in Excel. The formula for a risk rate is:
= (number of students receiving a discipline action/total enrollment for group) × 100
Step 1: In the drop-down menu for Analyze, select the Crosstabs option under Descriptive Statistics.
C-7

Step 2: To calculate the crosstabs, select the variable “Disc_Type_Cat” and move it into the Row(s) box, and then select the variable “Race_Eth_Cat” and move it into the Column(s) box. Select OK.
The following SPSS command syntax can also be used:
CROSSTABS /TABLES=Disc_Type_Cat BY Race_Eth_Cat /FORMAT=AVALUE TABLES /CELLS=COUNT /COUNT ROUND CELL.
C-8

The syntax used to create table 11: Percentage of students receiving out-of-school suspension and in-school suspension, by offense type and race/ethnicity, fictitious data
To produce table 11 in the main report, the file is first split, so that the results are produced and layered by the offense types aggregated in this example. Since the table includes information for each of the three offense types, the first step is to split the file by Offense_Type_ Cat. The resulting table will appear inverted; however, to replicate the table in the report, the cross-tabulation should be transposed in Excel or using Pivot Trays in SPSS.
Step 1: The first step for table 11 is to split the file by offense types. In the drop-down menu for “Data”, select the Split File option.
Step 2: Select “Offense_Type_Cat” and move it into the Groups Based on: box. Select Compare Groups.
C-9

Step 3: In the drop-down menu for Analyze, select the Crosstabs option under Descriptive Statistics.
Step 4: To calculate the crosstabs, select the variable “Disc_Type_Cat” and move it into the Row(s) box, and then select the variable “Race_Eth_Cat” and move it into the Column(s) box. Select OK.
The following SPSS command syntax can also be used.
SORT CASES BY Offense_Type_Cat.SPLIT FILE LAYERED BY Offense_Type_Cat.
CROSSTABS /TABLES=Disc_Type_Cat BY Race_Eth_Cat /SHOWDIM=2 /FORMAT=AVALUE TABLES /CELLS=COUNT /COUNT ROUND CELL.
C-10

The syntax used to create table 12: Students advancing to next grade level by the type of disciplinary action experienced in the past academic year, fictitious data
Step 1: In the drop-down menu for Analyze, select the Crosstabs option under Descriptive Statistics.
Step 2: To calculate the crosstabs, select the variable “Disc_Type_Cat” and move it into the Row(s) box, and then select the variable “Grade_Progress_Bin” and move it into the Column(s) box. Select OK.7
The following SPSS command syntax can also be used.
CROSSTABS /TABLES= Disc_Type_Cat BY Grade_Progress_Bin /SHOWDIM=2 /FORMAT=AVALUE TABLES /CELLS=COUNT COLUMN /COUNT ROUND CELL.
C-11

Notes
The authors thank the Core Planning Group for the Urban School Improvement Alliance for providing information on their student offense and disciplinary action data. They are grateful to Marco Andrade, Amy Fowler, and David Weinberger for serving on the advisory committee for this study and providing excellent feedback throughout.
1. For more information about the Civil Rights Data Collection, see http://www2.ed.gov/ about/offices/list/ocr/data.html?src=rt/.
2. The federal government has also instituted several reporting requirements relevant to discipline. For example, legislation requires that each state report “the incidence and duration of disciplinary actions by race, ethnicity, limited English proficiency status, gender, and disability category, of children with disabilities, including suspensions of 1 day or more” (see Assistance for Education of All Children with Disabilities, 2008). Schools and districts must also report a wide range of education data, including on disciplinary actions, to the U.S. Department of Education Office for Civil Rights every two years.
3. Similarly, the Council of State Governments consensus report on school discipline recommends reserving exclusionary discipline as a measure of last resort for addressing disciplinary issues in school (Morgan, Salomon, Plotkin, & Cohen, 2014).
4. “Analyst” is used in this report to refer to any individual who analyzes data or conducts research in a district.
5. However, studies have demonstrated that in-school suspension also predicts a wide range of negative outcomes (Fabelo et al., 2011).
6. For example, districts may examine whether additional safeguards can be used such as data entry templates that would reject counts of unduplicated suspensions if they exceed enrollment, or would reject zero values when other inputs indicate that a zero would not be an acceptable entry.
7. In this example the disciplinary action categories are presented as mutually exclusive, but that may not always be the case. It could be that some students incurred both inclusionary and exclusionary disciplinary actions. In this case, binary variables for each type of disciplinary action would be entered into the Row(s) box.
Notes-1
References
Allison, P. D. (2001). “Missing data (Series: Quantitative Applications in the Social Sciences).” Sage University Papers, 136(1), 1–104. Thousand Oaks, CA, Sage Publications, Inc.
Assistance for Education of All Children with Disabilities (2008). USCODE-2008-title20 -chap33-subchapII-sec1418.
Balfanz, R., Byrnes, V., & Fox, J. (2014). Sent home and put off-track: The antecedents, disproportionalities, and consequences of being suspended in the ninth grade. In D. J. Losen (Ed.), Closing the school discipline gap: Research for policymakers (pp. 17–30). New York, NY: Teachers College Press.
Bidwell, A. (2015, April 2). Atlanta scandal could be the tip of a test cheating iceberg. U.S. News & World Report. Retrieved July 8, 2015, from http://www.usnews.com/news/ articles/2015/04/02/11-former-atlanta-educators-convicted-in-standardized-test-cheating -scandal.
Blomberg, N. (2004). Effective discipline for misbehavior: In school vs. out of school suspension. Concept: An interdisciplinary journal of graduate studies 27: 1–11.
The Equity Project. (2015). Glossary of equity terms. Bloomington, IN: Indiana University, Center for Evaluation and Education Policy. Retrieved November 28, 2016, from http:// www.indiana.edu/~equityiu/glossary/.
Fabelo, T., Thompson, M., Plotkin, M., Carmichael, D., Marchbanks, M., & Booth, E. (2011). Breaking schools’ rules: A statewide study of how school discipline relates to students’ success and juvenile justice involvement. New York, NY: Council of State Governments Justice Center. Retrieved July 15, 2015, from https://csgjusticecenter.org/wp-content/ uploads/2012/08/Breaking_Schools_Rules_Report_Final.pdf.
Kendziorski, T. F., & Winkler, K. E. (2012). I.E.P. 101. Troy, MI: The ARC of Oakland County. Retrieved October 23, 2015, from http://www.novi.k12.mi.us/downloads/ss_ docs/iep_101_20140131_095604_2.pdf.
King, K. A., Harris-Murri, N. J., & Artiles, A. J. (2006). Proactive culturally responsive discipline. Tempe, AZ: Arizona State University, National Center for Culturally Responsive Educational Systems. Retrieved July 15, 2015, from http://www.nccrest.org/Exemplars/ exemplar_culturally_responsive_discipline.pdf.
Losen, D. (2014). Closing the school discipline gap: Equitable remedies for excessive exclusion (disability, equity and culture). New York, NY: Teachers College Press.
Losen, D., & Orfield, G. (2002). Racial inequity in special education. Cambridge, MA: Harvard University Project on Civil Rights. http://eric.ed.gov/?id=ED470549
Marchbanks, M. P., III, Blake, J., Booth, E. A., Carmichael, D., Seibert, A. L., & Fabelo, T. (2014). The economic effects of exclusionary discipline on grade retention and high
Ref-1

school dropout. In D. J. Losen (Ed.), Closing the school discipline gap: Research for policymakers (pp. 59–74). New York, NY: Teachers College Press.
McIntosh, K., Barnes, A., Eliason, B., & Morris, K. (2014). Using discipline data within SWPBIS to identify and address disproportionality: A guide for school teams. Washington, DC: U.S. Department of Education, Office of Special Education Programs Technical Assistance Center on Positive Behavioral Interventions and Supports. Retrieved November 28, 2016, from http://www.pbis.org/Common/Cms/files/pbisresources/PBIS_ Disproportionality_Data_Guidebook.pdf.
Morgan, E., Salomon, N., Plotkin, M., & Cohen, R. (2014). The school discipline consensus report: Strategies from the field to keep students engaged in school and out of the juvenile justice system. New York, NY: Council of State Governments Justice Center. Retrieved July 15, 2015, from http://csgjusticecenter.org/wp-content/uploads/2014/06/ The_School_Discipline_Consensus_Report.pdf.
National Clearinghouse on Supportive School Discipline. (2014). Exclusionary discipline. Retrieved November 28, 2016, from http://supportiveschooldiscipline.org/learn/ reference-guides/exclusionary-discipline.
Noltmeyer, A. L., Ward, R. M., & McLaughlin, C. (2015). Relationship between school suspension and student outcomes: A meta-analysis. School Psychology Review, 44(2), 224–240.
O’Dwyer, L. M., & Parker, C. E. (2014). A primer for analyzing nested data: Multilevel modeling in SPSS using an example from a REL study (REL 2015–046). Washington, DC: U.S. Department of Education, Institute of Education Sciences, National Center for Education Evaluation and Regional Assistance, Regional Educational Laboratory Northeast & Islands. http://eric.ed.gov/?id=ED551064
Porowski, A., O’Conner, R., & Passa, A. (2014). Disproportionality in school discipline: An assessment of trends in Maryland, 2009–12 (REL 2014–017). Washington, DC: U.S. Department of Education, Institute of Education Sciences, National Center for Education Evaluation and Regional Assistance, Regional Educational Laboratory Mid-Atlantic. Retrieved March 23, 2015 from http://ies.ed.gov/ncee/edlabs.
Puma, M. J., Olsen, R. B., Bell, S. H., & Price, C. (2009). What to do when data are missing in group randomized controlled trials (NCEE No. 2009–0049). Washington, DC: U.S. Department of Education, Institute of Education Sciences, National Center for Education Evaluation and Regional Assistance. http://eric.ed.gov/?id=ED511781
Raudenbush, S. W., & Bryk, A. S. (2002). Hierarchical linear models (2nd ed.). Thousand Oaks, CA: Sage Publications.
Seager, A., Madura, J., Cox, J., & Carey, R. (2015) A district’s use of data and research to inform policy formation and implementation. Waltham, MA: Regional Educational Laboratory Northeast & Islands. http://eric.ed.gov/?id=ED562070
Ref-2

Skiba, R., Trachok, M., Chung, C. G., Baker, T., Sheya, A., & Hughes, R. (2014). Where should we intervene? Contributions of behavior, student, and school characteristics to suspension and expulsion. In D. J. Losen (Ed.), Closing the school discipline gap: Research for policymakers (pp. 132–146). New York, NY: Teachers College Press.
Staats, C. (2014). Implicit racial bias and school discipline disparities. Exploring the connection. Columbus, OH: Kirwan Institute, Ohio State University. Retrieved July 15, 2015, from http://kirwaninstitute.osu.edu/wp-content/uploads/2014/05/ki-ib-argument-piece03.pdf.
U.S. Department of Education. (2008). Policy questions on the Department of Education’s 2007 guidance on collecting, maintaining and reporting data by race or ethnicity. Washington, DC: Author. Retrieved July 15, 2015, from http://www2.ed.gov/policy/rschstat/ guid/raceethnicity/questions.html.
U.S. Deapartment of Education, Data Accountability Center. (October 2011). Methods for Assessing Racial/Ethnic Disproportionality in Special Education: A Technical Assistance Guide (Revised). Rockville, MD.: Weststat. Retrieved from http://www.isbe.net/ spec-ed/pdfs/disproportionality_ta-guide.pdf
U.S. Department of Education, National Center for Education Statistics. (2010). Statistical methods for protecting personally identifiable information in aggregate reporting (NCES No. 2011–603). Washington, DC: Institute of Education Sciences, National Center for Education Statistics. http://eric.ed.gov/?id=ED514095
U.S. Department of Education, Office of Inspector General. (2007). An OIG perspective on the Unsafe School Choice Option (ED–OIG/S03G0015). Washington, DC: Author. Retrieved July 15, 2015, from http://www2.ed.gov/about/offices/list/oig/auditreports/s03g0015.pdf.
U.S. Department of Education, Office for Civil Rights. (2014). Data snapshot: School discipline (Civil Rights Data Collection Issue Brief No. 2). Washington, DC: Author. Retrieved July 15, 2015, from http://ocrdata.ed.gov/Downloads/CRDC-School -Discipline-Snapshot.pdf.
U.S. Department of Education, Office for Civil Rights. (2016a). 2013–2014 Civil Rights Data Collection: A first look. Washington, DC: Author. Retrieved November 23, 2016, from http://www2.ed.gov/about/offices/list/ocr/docs/2013–14-first-look.pdf.
U.S. Department of Education, Office for Civil Rights. (2016b). Master list of 2015–2016 CRDC definitions. Washington, DC: Author. Retrieved November 28, 2016, from https://crdc.grads360.org/services/PDCService.svc/GetPDCDocumentFile?fileId=20523.
U.S. Department of Justice, Civil Rights Division, and U.S. Department of Education, Office for Civil Rights. (2014). Dear colleague letter on the nondiscriminatory administration of school discipline. Washington DC: Author. Retrieved July 15, 2015, from http:// www2.ed.gov/about/offices/list/ocr/letters/colleague-201401-title-vi.html.
What Works Clearinghouse. (2016). Glossary. Washington, DC: U.S. Department of Education, Institute of Education Sciences. Retrieved November 28, 2016, from https://ies. ed.gov/ncee/wwc/Glossary#letterI.
Ref-3

The Regional Educational Laboratory Program produces 7 types of reports
Making Connections Studies of correlational relationships
Making an Impact Studies of cause and effect
What’s Happening Descriptions of policies, programs, implementation status, or data trends
What’s Known Summaries of previous research
Stated Briefly Summaries of research findings for specific audiences
Applied Research Methods Research methods for educational settings
Tools Help for planning, gathering, analyzing, or reporting data or research