Analyzing microRNA Data and Integrating microRNA · PDF fileAnalyzing microRNA Data and...
21
Analyzing microRNA Data and Integrating miRNA Data with Gene Expression Data in Partek ® Genomics Suite™ 1 Analyzing microRNA Data and Integrating miRNA with Gene Expression Data in Partek ® Genomics Suite ® 6.6 Overview This tutorial outlines how microRNA data can be analyzed within Partek® Genomics Suite®. Additionally, this tutorial outlines how microRNA data can be integrated with mRNA data from gene expression microarrays. This tutorial will illustrate how to: Analyze differentially expressed microRNAs Integrate microRNA and gene expression data using 3 different methods Combine microRNAs with their mRNA targets Find overrepresented microRNA target sets Correlate microRNA and mRNA data Note: the workflow described below is enabled in Partek Genomics Suite version 6.6. Please check the version of Partek Genomics Suite you are using in the top menu bar (for instance, version 6.6 from year 2011 and Nov. 10 ) and compare it with the latest version shown by selecting Help > Check for Updates as shown in Figure 1. Figure 1: Compare current installed version of Partek Genomics Suite against the latest version for the platform on your system The screenshots in this tutorial may vary slightly across platforms and across different versions of Partek.
Transcript of Analyzing microRNA Data and Integrating microRNA · PDF fileAnalyzing microRNA Data and...

Analyzing microRNA Data and Integrating miRNA Data with Gene Expression Data in Partek® Genomics Suite™ 1
Analyzing microRNA Data and Integrating miRNA with
Gene Expression Data in Partek® Genomics Suite® 6.6
Overview
This tutorial outlines how microRNA data can be analyzed within Partek® Genomics
Suite®. Additionally, this tutorial outlines how microRNA data can be integrated with
mRNA data from gene expression microarrays.
This tutorial will illustrate how to:
Analyze differentially expressed microRNAs
Integrate microRNA and gene expression data using 3 different methods
Combine microRNAs with their mRNA targets
Find overrepresented microRNA target sets
Correlate microRNA and mRNA data
Note: the workflow described below is enabled in Partek Genomics Suite version 6.6.
Please check the version of Partek Genomics Suite you are using in the top menu bar (for
instance, version 6.6 from year 2011 and Nov. 10 ) and
compare it with the latest version shown by selecting Help > Check for Updates as shown
in Figure 1.
Figure 1: Compare current installed version of Partek Genomics Suite against the latest
version for the platform on your system
The screenshots in this tutorial may vary slightly across platforms and across different
versions of Partek.

Analyzing microRNA Data and Integrating miRNA Data with Gene Expression Data in Partek® Genomics Suite™ 2
Description of the Data Set
For this tutorial, microRNA from 3 brain samples and 3 heart samples were quantified
using the Affymetrix GeneChip® miRNA 1.0 array. The same sample set was also
processed on GeneChip® Human Gene 1.0 ST arrays for mRNA expression.
Data and associated files for this tutorial can be downloaded by selecting Help > On-line
Tutorials from the Partek Genomics Suite main menu. The data can also be downloaded
directly from:
http://www.partek.com/Tutorials/microarray/microRNA/miRNA_tutorial_data.zip.
It is important to note that the methods used here are not limited to Affymetrix® technology
since Partek Genomics Suite supports a variety of technology platforms for both gene
expression and microRNA analyses.
Importing files
For this tutorial, the gene expression and miRNA expression studies have already been
created and have been stored in Partek Genomics Suite project (ppj) format as
miRNAmRNA integration. This project contains two Partek format file files:
Affy_miR_BrainHeart_intensities.fmt with the microRNA data and
Affy_HuGeneST_BrainHeart_GeneIntensities.fmt with the analyzed mRNA data.
Typically, you would begin a microRNA expression study with the following steps:
Open the microRNA expression workflow within Partek Genomics Suite by selecting it from the Workflow drop-down list in the upper right corner of the
software. We will use this workflow throughout this tutorial.
Select Import > Import Samples to specify the miRNA data files
Describe the samples by adding sample attributes
Partek Genomics Suite supports microRNA data files from different platforms as shown in
Figure 2. The import process would show slightly different import dialogs depending on
the type of input file selected. The steps include choosing the specific data files to be
imported, selecting a normalization option, adding sample attributes and exploring the data
(QA/QC, plot sample histogram, etc.). The miRNA import process is very similar to
importing gene expression samples. Please see any of the vendor-specific gene expression
tutorials for additional information about steps specific for importing data from these
vendors.

Analyzing microRNA Data and Integrating miRNA Data with Gene Expression Data in Partek® Genomics Suite™ 3
Figure 2: Importing various types of microRNA expression data
For convenience, an ANOVA was already performed with the mRNA data and is opened as
a child spreadsheet of Affy_HuGeneST_BrainHeart_GeneIntensities.fmt.
Select File > Open Project to invoke the project browser and open the miRNAmRNA integration project. This will open three spreadsheets as shown in
Figure 3
Figure 3: Three spreadsheets included in miRNAmRNAintegration project. The
ANOVAResults gene is a child spreadsheet of the gene expression spreadsheet
For the “Analyze Differentially Expressed microRNAs” section of this tutorial, use the
Affy_miR_BrainHeart_intensities.fmt spreadsheet.
For the “microRNA and mRNA integration” section of this tutorial, both
Affy_miR_BrainHeart_intensities.fmt and Affy_HuGeneST_BrainHeart_GeneIntensities.fmt
data files will be used, along with the child ANOVA spreadsheet.

Analyzing microRNA Data and Integrating miRNA Data with Gene Expression Data in Partek® Genomics Suite™ 4
Analyze differentially expressed microRNAs
Exploratory Data Analysis
Explore the data in spreadsheet 1 by plotting a principal components analysis (PCA) scatter
plot as it is an excellent method for visualizing high-dimensional data.
Select the Principal Components Analysis (PCA) step in the QA/QC section of
the workflows dialog. The PCA plot will appear as shown in Figure 4
Figure 4: A PCA scatter plot of the microRNA data. Each dot represents a sample while
the color of the dot represents its tissue type.
PCA is an example of exploratory data analysis and is useful for identifying outliers and
major effects in the data. Notice that in the scatter plot (Figure 4), tissue is a very important
source of variation within this experiment. Also, notice that the brain and heart samples are
separated on the x-axis (principal component 1) from left to right.
In the scatter plot, each point represents a chip and corresponds to a row on the
Affy_miR_BrainHeart_intensities spreadsheet; selecting a point in the scatter plot
highlights the corresponding row in the spreadsheet and vice versa. The color of the dots
represents the tissue type of the sample. In this case, red represents the brain samples and
blue represents the heart samples. Points close together in the plot are similar in terms of
their microRNA expression across all probes and points far apart in the plot are dissimilar.
This PCA plot shows that the major difference between the six samples within the
experiment is due to tissue type, which is expected.

Analyzing microRNA Data and Integrating miRNA Data with Gene Expression Data in Partek® Genomics Suite™ 5
For a more in-depth introduction to PCA, refer to the Exploratory Data Analysis section in
the Affymetrix® Down Syndrome Study Data for Gene Expression tutorial, located under the
Gene Expression tab on the On-line Tutorials webpage.
Detecting Differentially Expressed microRNAs
Select the Analysis button in the workflow and then select Detect differentially
expressed miRNAs. The ANOVA dialogue will open as in Figure 5. Values
displayed within the left panel are categorical variables listed in the data sheet.
These attributes were already added to the samples in the project. For new
experiments, use the Add sample attributes function within the Import section of
the microRNA workflow to add attribute information to the samples
Figure 5: Configuring the ANOVA model to detect differentially expressed microRNAs
Select Tissue from the Experimental Factor(s) panel and move it to the ANOVA
Factor(s) panel by selecting the Add Factor > button. This will produce a p-
value column for the Tissue factor in the resulting ANOVA table. The p-value for
Tissue will list the probability that a given microRNA is differentially expressed
across all of the listed tissues
Select the Contrast button (only available after adding factors to the ANOVA) to
add a contrast (e.g., pairwise comparison or fold-change) between different
tissues. This step will generate a p-value, fold change and ratio of microRNA
expression level between brain and heart samples
Select Tissue from the Select Factor/Interaction drop-down list; all levels in this
factor are listed in the Candidate Level(s) panel on the left of the dialog (Figure 6)
Select brain and Add Contrast Level > to Group 1
Select heart and Add Contrast Level > to Group 2
Select the Add Contrast button and select OK to exit the Configure dialog
Select OK again to calculate the ANOVA results

Analyzing microRNA Data and Integrating miRNA Data with Gene Expression Data in Partek® Genomics Suite™ 6
The resulting fold change value will be calculated with the Group 1 value representing the
numerator and the Group 2 value as the denominator in a linear fold-change ratio. In other
words, Group 2 represents the reference condition.
Figure 6: Configuring the Add Contrast dialog to add a contrast between brain and heart
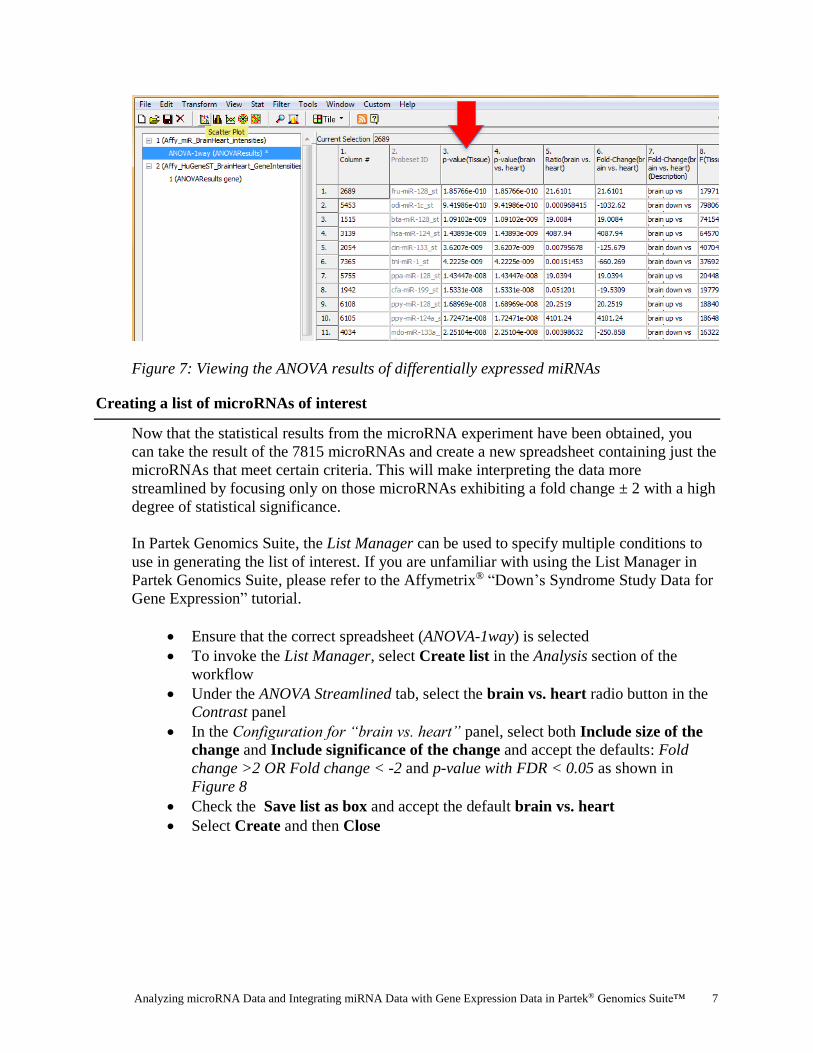
The results will be displayed in a child spreadsheet (ANOVA-1way (ANOVAResults)) with
one row per microRNA and columns containing the ANOVA results for that particular
miRNA (Figure 7). By default, the microRNAs are sorted in ascending order by the p-value
of the first categorical variable which, in this case, is Tissue. This means the most
significant differentially expressed miRNAs between the brain and heart (up-regulated) are
at the top of the spreadsheet. The most down-regulated genes between the brain and heart
are found at the bottom of the list (negative fold changes). You may explore what is known
about a particular microRNA by right-clicking its row header and selecting Find miRNA
in… which allows you to explore the TargetScan, miRBase, microRNA.org or
miR2Disease web pages for that specific microRNA (internet connection required).
Analyzing microRNA Data and Integrating miRNA Data with Gene Expression Data in Partek® Genomics Suite™ 7
Figure 7: Viewing the ANOVA results of differentially expressed miRNAs
Creating a list of microRNAs of interest
Now that the statistical results from the microRNA experiment have been obtained, you
can take the result of the 7815 microRNAs and create a new spreadsheet containing just the
microRNAs that meet certain criteria. This will make interpreting the data more
streamlined by focusing only on those microRNAs exhibiting a fold change ± 2 with a high
degree of statistical significance.
In Partek Genomics Suite, the List Manager can be used to specify multiple conditions to
use in generating the list of interest. If you are unfamiliar with using the List Manager in
Partek Genomics Suite, please refer to the Affymetrix® “Down’s Syndrome Study Data for
Gene Expression” tutorial.
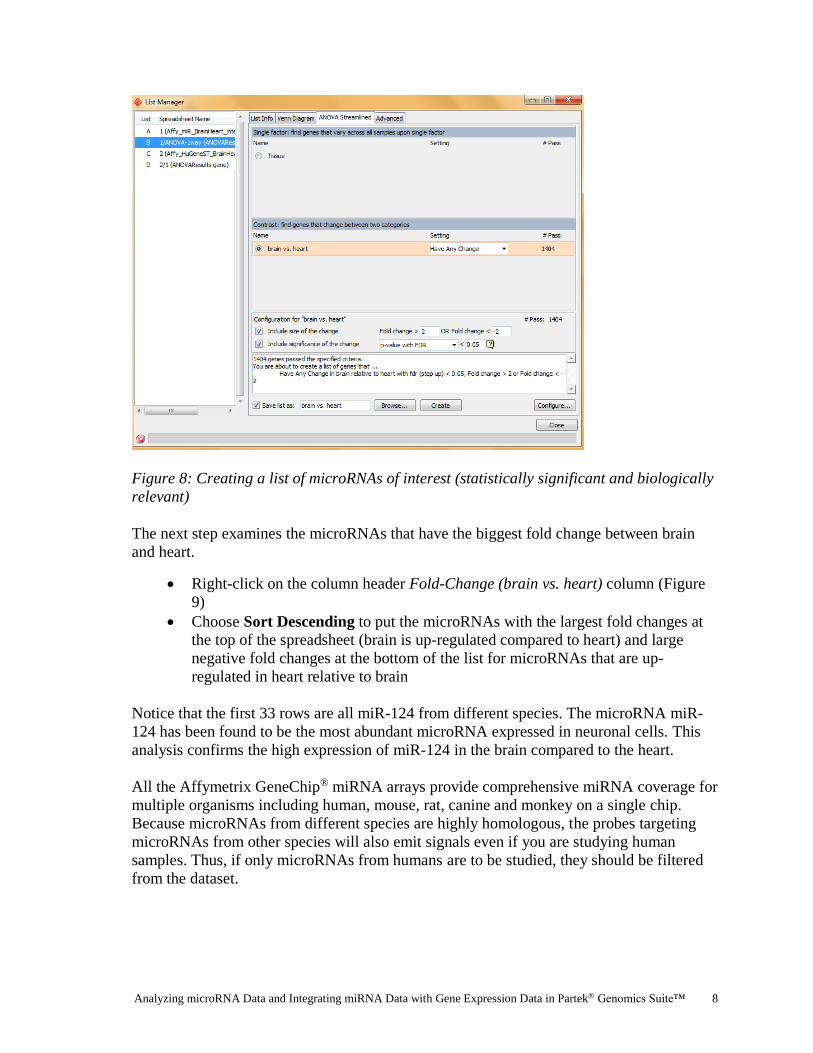
Ensure that the correct spreadsheet (ANOVA-1way) is selected
To invoke the List Manager, select Create list in the Analysis section of the
workflow
Under the ANOVA Streamlined tab, select the brain vs. heart radio button in the
Contrast panel
In the Configuration for “brain vs. heart” panel, select both Include size of the
change and Include significance of the change and accept the defaults: Fold
change >2 OR Fold change < -2 and p-value with FDR < 0.05 as shown in
Figure 8
Check the Save list as box and accept the default brain vs. heart
Select Create and then Close
Analyzing microRNA Data and Integrating miRNA Data with Gene Expression Data in Partek® Genomics Suite™ 8
Figure 8: Creating a list of microRNAs of interest (statistically significant and biologically
relevant)
The next step examines the microRNAs that have the biggest fold change between brain
and heart.
Right-click on the column header Fold-Change (brain vs. heart) column (Figure
9)
Choose Sort Descending to put the microRNAs with the largest fold changes at
the top of the spreadsheet (brain is up-regulated compared to heart) and large
negative fold changes at the bottom of the list for microRNAs that are up-
regulated in heart relative to brain
Notice that the first 33 rows are all miR-124 from different species. The microRNA miR-
124 has been found to be the most abundant microRNA expressed in neuronal cells. This
analysis confirms the high expression of miR-124 in the brain compared to the heart.
All the Affymetrix GeneChip® miRNA arrays provide comprehensive miRNA coverage for
multiple organisms including human, mouse, rat, canine and monkey on a single chip.
Because microRNAs from different species are highly homologous, the probes targeting
microRNAs from other species will also emit signals even if you are studying human
samples. Thus, if only microRNAs from humans are to be studied, they should be filtered
from the dataset.

Analyzing microRNA Data and Integrating miRNA Data with Gene Expression Data in Partek® Genomics Suite™ 9
Figure 9: Sorting the microRNA list by descending Fold-Change (brain vs. heart)
To create a filter based on species, a new annotation column containing Species Scientific
Name will be inserted into the brain vs. heart spreadsheet.
Right-click on any column header in the brain vs. heart spreadsheet and select
Insert Annotation from the pop-up menu (Figure 10).
Select Add to the Right of Column 2. Probeset ID
Check Species Scientific Name and select OK
Figure 10: Configuring the Add Annotation dialog

Analyzing microRNA Data and Integrating miRNA Data with Gene Expression Data in Partek® Genomics Suite™ 10
Column 3, containing the species name, will be inserted as shown in Figure 11.
Figure 11: Viewing the Species Scientific Name column inserted into the spreadsheet
To filter using the Species Scientific Name column, right-click on the column
header and choose Find / Replace / Select… from the pop-up menu
Next to Find What: type Homo sapiens and select 3. Species Scientific Name
from the drop downmenu next to the Only in column radio button (Figure 12)
Click Select All. All rows with microRNAs from Homo sapiens (251 rows) will
be highlighted (row headers highlighted in gray) in the spreadsheet
Figure 12: Configuring the Find/Replace/Select dialog
Close the dialog by selecting Close
Right-click on any of the row headers (like row 2) that contain highlighted rows
(dark gray background) and select Filter Include from the menu

Analyzing microRNA Data and Integrating miRNA Data with Gene Expression Data in Partek® Genomics Suite™ 11
The list shows 251 microRNAs from human (Figure 13). The first row (with the highest
fold-change) is still miR-124 (4087-fold higher in brain than in heart). In comparison, the
next largest fold change is only 249.
Figure 13: Viewing the filtered by species microRNA filtered spreadsheet. The black and
yellow bar along the right edge indicates a filter has been applied to the spreadsheet
Integration of miRNA and Gene Expression data
MicroRNAs regulate gene expression at the post-transcriptional level by base-pairing with
the 3’ UTR of the target gene, causing cleavage/degradation of the cognate mRNA or by
preventing translation initiation. Integration of microRNAs with gene expression data to
study the overall network of gene regulation is vital to understanding microRNA function
in a given sample. Partek Genomics Suite provides a platform that can analyze microRNA
and gene expression data independently, yet allows data to be integrated for downstream
analysis.
This integrative analysis can be accomplished at several different levels. If you only have
miRNA data, then Partek Genomics Suite can search the predicted gene targets in a
miRNA-mRNA database like TargetScan to provide a list of genes that might be regulated
by the differentially expressed miRNAs. Conversely, if you have only gene expression
data, Partek Genomics Suite can use the same database to identify the microRNAs that
putatively regulate those differentially expressed genes in a statistically significant manner.
If you have gene expression data and miRNA data from comparable tissue/species, Partek
Genomics Suite can combine the results of these separate experiments into one spreadsheet.
Lastly, if the miRNA and mRNA from the same source was analyzed (as in this tutorial),
then you may statistically correlate the results of miRNA and gene expression assays.

Analyzing microRNA Data and Integrating miRNA Data with Gene Expression Data in Partek® Genomics Suite™ 12
In this section of the tutorial, you will learn how to use Partek Genomics Suiteto generate
integrated miR/mRNA data tables and a table of potential miRNAs that regulate mRNAs.
Finding putative genes regulated by microRNAs
Scenario: you have miRNA expression data but do not have gene expression data. You are
interested in exploring the possible consequences of this miRNA expression pattern on
gene expression. Using a database like TargetScan, microCosm, or a custom database (a
tab-separated list of miRNA and gene symbols, one pair per line), you can identify the list
of genes that are predicted to be regulated by these differentially expressed microRNAs and
then you may perform Biological Interpretation on these genes.
On the microRNA Expression workflow, under the MicroRNA Integration
dropdown menu, select Combine microRNAs with their mRNA targets
Select the Get All Targets tab
Database Name: should be TargetScan5.2
The Spreadsheet Name: should be the list of differentially expressed human
microRNAs (brain vs. heart)
Make sure the Column with microRNA labels is set to 2. Probeset ID
Specify PutativeGenes for the Result file
Select OK
Figure 14: Identifying all predicted gene targets of differentially expressed microRNAs
This will create a spreadsheet called PutativeGenes that will contain one microRNA and
gene pair, with Gene Symbol in the last column. Since one microRNA has the capacity to

Analyzing microRNA Data and Integrating miRNA Data with Gene Expression Data in Partek® Genomics Suite™ 13
regulate many genes, the PutativeGenes list will be much longer than the input microRNA
list. The PutativeGenes list might be used for Biological Interpretation. Another useful
way to examine the data would be to right-click on the Gene Symbol column (last one on
the right) and select Create List with Occurrence Counts which will create a new
spreadsheet with the list of genes and the number of times each of those gene symbols
occurs. Genes that occur multiple times have multiple microRNAs that are predicted to
regulate those genes.
Finding Overrepresented microRNA Target Sets from Gene Expression data
Scenario: You have only gene expression results (or a list of genes of interest) and are
interested in identifying which microRNAs might regulate the significant genes in that
experiment. Using a database like TargetScan, you can create a list of microRNAs that are
statistically predicted to regulate those genes which could be explored in further
experiments by using a lower-volume technique like rtPCR.
Finding overrepresented microRNA target sets allows you to find miRNAs that target a
disproportionately high number of genes in the input list of significant mRNAs using only
gene expression data as input (Creighton et al., RNA 2008). A Fisher’s Exact right-tailed p-
value will be calculated to show the overrepresentation of the genes of interest for each
microRNA in the database. The smaller the p-value, the more overrepresented the
microRNAs are for this dataset. Target associations are taken from the specified database
(in this case, TargetScan5.2).
The input to Find overrepresented microRNA target sets should be a list of genes of
interest (significant genes). If the input list is a filtered list of genes from an ANOVA
calculation, then the parent spreadsheet is used to identify which genes were contained on
the microarray that were not significant (background genes). Genes on the array but not in
the significant gene list will be treated as “not significant” in the calculations.
To invoke the List Manager, select Create list in the Analysis section of the
workflow
Ensure that the correct list (2/1/ANOVAResults gene) is selected in the list of
spreadsheets
Under the ANOVA Streamlined tab, select the Brain vs. Heart radio button in the
Contrast panel
In the Configuration for “Brain vs. Heart” panel, select both Include size of the
change and Include significance of the change and accept the defaults: Fold
change >2 OR Fold change < -2 and p-value with FDR < 0.05
Select Save list as and enter Significant Genes as the name of the results
spreadsheet
Select Create and then Close
Select Find overrepresented microRNA target sets from the workflow
In the mRNA Spreadsheet > Spreadsheet Name drop-down menu, select
2/Brain_vs_heart (Significant Genes) (Figure 15)

Analyzing microRNA Data and Integrating miRNA Data with Gene Expression Data in Partek® Genomics Suite™ 14
A Gene Symbols annotation column is needed to complete this step. In the
Column with gene symbols drop-down, select Gene Symbol to specify the column
in the spreadsheet containing gene symbols
The microRNA Spreadsheet section should be left blank
Click OK
Figure 15: Configuring the find overrepresented microRNA target sets
The resulting file will be opened in a new spreadsheet named enrichedAssociations.txt
(Figure 16). In this spreadsheet, each row represents one microRNA from the database; the
list is sorted in ascending order of Enrichment p-value. Column 1 contains the microRNA
name and column 2 shows its p-value. The smaller the p-value, the more significant the
miRNA is.
Column 3 contains the number of genes from the (input) significant gene list that are
targeted by this microRNA and Column 7 shows the number of significant genes from the
input list that are not targeted by this microRNA. Columns 4 and 5 contain the number of
significantly up- and down-regulated genes from the input significant gene list targeted by
this microRNA. Column 6 shows the number of background genes (genes on the array but
not in the input significant gene list) that are targeted by the microRNA and Column 8
shows the number of background genes on the array that are not targeted by this
microRNA. The numbers in columns 3, 6, 7 and 8 will be used to calculate the Fisher’s

Analyzing microRNA Data and Integrating miRNA Data with Gene Expression Data in Partek® Genomics Suite™ 15
Exact (right-tailed) p-value, a measure of the overrepresentation of the predicted miRNAs
within a gene set.
Figure 16: Viewing the enrichedAssociations spreadsheet
As the Enrichment p-values have not been corrected for running multiple statistical tests,
you may want to use the multiple test correction feature of Partek Genomics Suite to adjust
the p-values.
With the enrichedAssociations spreadsheet selected, select Stat > Multiple Test
> Multiple Test Corrections from the main menu toolbar
Choose all of the multiple test correction options
In the Candidate Column(s) panel, move Enrichment p-value to the Selected
Column(s) by selecting Enrichment p-value and then selecting - > as shown in
Figure 17
Select OK

Analyzing microRNA Data and Integrating miRNA Data with Gene Expression Data in Partek® Genomics Suite™ 16
Figure 17: Correcting p-values because multiple statistical tests have been performed
The enrichedAssociations spreadsheet should be filtered (by corrected or unadjusted p-
value, species, etc.) to isolate which microRNAs are of interest.
Combining microRNAs with their mRNA target genes
Scenario: you have microRNA experiments and mRNA experiments you wish to compare.
The samples should be comparable but do not have to originate from the same specimens.
For instance, you have gene expression data from mouse livers and microRNA expression
data from other mice and you would like to see if the microRNA expression patterns are
consistent with the gene expression patterns.
From the microRNA Expression workflow, select MicroRNA Integration and
select Combine microRNAs with their mRNA targets. The dialog shown in
Figure 18 will appear. Ensure that the Get Targets from Spreadsheet tab is
selected

Analyzing microRNA Data and Integrating miRNA Data with Gene Expression Data in Partek® Genomics Suite™ 17
Figure 18: Combining microRNAs with their mRNA targets
For this tutorial, use TargetScan 5.2 for Target Database. This database predicts
biological targets of microRNAs by searching for the presence of conserved 8mer and 7mer
sites that match the seed regions of each microRNA. In the Database Name drop-down list,
more databases choices for the prediction of microRNA targets are listed, allowing for
more options depending on the species with which you are working. Selecting “Other” will
allow the use of custom databases (tab-delimited input files). Drop-down lists for both the
microRNA spreadsheets and the mRNA spreadsheets are provided.
To merge microRNAs with their target mRNAs, Partek Genomics Suite requires a
spreadsheet with microRNA names and gene names on rows; therefore, either a filtered
ANOVA spreadsheet or a gene/microRNA list spreadsheet can be selected to merge.
For this tutorial, merge brain vs. heart, which was created previously, with the mRNA
ANOVA spreadsheet so only the microRNAs of interest and their mRNA targets can be
combined.
Select Probeset ID, which is the default for Affymetrix® data. (Note: if you are
analyzing data from other technologies, such as Agilent or Illumina, then Column
ID would be the default choice)
For the mRNA spreadsheet, choose 2/1 (ANOVAResults gene)
The Column with mRNA labels requires a column containing gene names to be
selected, so select Gene Symbol which is the default
Select OK. Partek Genomics Suite will generate and open the new spreadsheet (combine.txt) automatically (Figure 19)

Analyzing microRNA Data and Integrating miRNA Data with Gene Expression Data in Partek® Genomics Suite™ 18
Figure 19: Viewing the spreadsheet that combines microRNAs with their mRNA targets
In the new spreadsheet, the data are sorted by the first p-value column, so the most
statistically significant (up-regulated) microRNA between brain and heart will be at the top
of the spreadsheet. In the new spreadsheet, each row represents a specific microRNA
associated with one of its target genes; however, a single microRNA can have multiple
targets. For example, the first microRNA, hsa-miR-124_st, has 1340 target genes;
therefore, the first 1340 rows are all hsa-miR-124_st with each row showing a different
gene. From left to right, the first columns (through F(Error)) contain the ANOVA
information from the microRNA brain_vs_heart spreadsheet; columns after that contain
the information from the gene expression ANOVA.
Correlating microRNA and mRNA Data
Scenario: microRNA and gene expression assays were processed from the same specimen
and you would like to be correlate the findings, that is, do up- or down-regulated
microRNAs result in gene expression changes in their cognate genes? Pearson and
Spearman correlation coefficients and their p-values are calculated. Note that this
correlation function can only identify miRs that affect the stability (quantity) of mRNAs
and not those that inhibit translation initiation of mRNAs.
To determine the correlations between microRNA expression and mRNA
expression, select the Correlate microRNA and mRNA data command in the
MicroRNA Expression workflow
In the resulting window, select the database to join microRNAs and mRNAs; in
this case, TargetScan 5.2 (Figure 20)
Next, select the microRNA spreadsheet and mRNA spreadsheet with samples on
rows. For this tutorial, select Affy_miR_BrainHeart_intensities as the
microRNA spreadsheet and Affy_HuGeneST_BrainHeart_GeneIntensities as
the mRNA spreadsheet. Note: since correlation occurs between the miRNA and

Analyzing microRNA Data and Integrating miRNA Data with Gene Expression Data in Partek® Genomics Suite™ 19
mRNA signal intensities, therefore filtered lists of differentially expressed genes
or miRs are not necessary
Select OK
Figure 20: Configuring the correlation dialog between microRNA and mRNA data
A further dialog box will prompt for the Sample ID columns in each spreadsheet to allow
integration (Figure 21). Ideally, the sample ID column should have been specified during
the sample import process using Import > Choose sample ID column. In this case, the
sample ID column can be specified in either location, but for other assays (CNV), the
sample ID must be specified before analysis.
Select the SampleID columns for both and click OK
Figure 21: Specifying the correct sample ID columns
The resulting file will be opened in a new spreadsheet named correlation.txt. In the
correlation.txt spreadsheet (Figure 22), each row contains one microRNA correlated with
one of its target genes. The first column contains the microRNA probeset ID from the
Affy_miR_Brainheart_Intensities spreadsheet. The second column contains the mRNA

Analyzing microRNA Data and Integrating miRNA Data with Gene Expression Data in Partek® Genomics Suite™ 20
probeset ID from the Affy_HuGeneST_BrainHeart_GeneIntensities spreadsheet. The third
column lists the gene symbols and the fourth column shows the miRNA name from the
database. The fifth and seventh columns list the calculated correlation coefficients (Pearson
and Spearman’s, respectively) between the specific microRNA and the targeted gene
intensities. Negative correlation indicates that a high level of the microRNA is associated
with low expression level of its targeted gene. Positive correlation indicates that a high
level of the microRNA is associated with high expression level of its targeted gene.
Columns 6 and 7 list the correlation p-values (Pearson and Spearman, respectively). Small
p-values indicate that the correlation between the values in the two spreadsheets is
significant.
Figure 22: Viewing the correlation spreadsheet
To view the correlation, draw a scatter plot by right-clicking on the row header
and select Scatter Plot (Orig. Data) from the pop-up menu. For this tutorial,
draw a scatter plot using row 1: microRNA xtr-miR-148a and gene RAB14
(Figure 23).
The x-axis shows the microRNA intensity and the y-axis shows the targeted mRNA
intensity. It is clear that the microRNA xtr-miR-148a has a negative correlation with its
target gene RAB14 in both brain and heart tissues. Furthermore, xtr-miR-148a shows
opposite expression patterns in both tissues.

Analyzing microRNA Data and Integrating miRNA Data with Gene Expression Data in Partek® Genomics Suite™ 21
Figure 23: Viewing the scatter plot of negatively correlated microRNA xtr-miR-148a vs.
gene RAB14
Note that this correlation function can only identify microRNAs that affect the stability of
mRNAs and not microRNAs that inhibit the translation of mRNAs.
End of Tutorial
This is the end of the “Analyzing microRNA Data and Integrating microRNA Data with
Gene Expression Data in Partek Genomics Suite” tutorial. If you need additional assistance
with this data set, contact our technical support staff at +1-314-878-2329 (US), +44 (0)
2071 938862 (Europe), +65 66353670 (Asia/Australasia) or by emailing
References
Creighton, C.J., Nagaraja, A.K., Hanash, S.M., Matzuk, M.M., & Gunaratne, P.H. A
bioinformatics tool for linking gene expression profiling results with public databases of
microRNA target predictions. RNA, 2008; 14(11):2290-6.
Date last modified: August 2015
Copyright 2015 by Partek Incorporated. All Rights Reserved. Reproduction of this material without expressed written
consent from Partek Incorporated is strictly prohibited.