Analyzing Grantee Financial Statements “But they looked so good on paper….” Delaware Valley...
23
Analyzing Grantee Financial Statements “But they looked so good on paper….” Delaware Valley Grantmakers October 15, 2009
-
Upload
lambert-jordan-rose -
Category
Documents
-
view
216 -
download
1
Transcript of Analyzing Grantee Financial Statements “But they looked so good on paper….” Delaware Valley...
Analyzing Grantee Financial Statements
“But they looked so good on paper….”
Delaware Valley Grantmakers
October 15, 2009

LTM Consulting Group, LLC
LTM Consulting Group is dedicated to providing objective, high quality, experienced based, investment, finance, accounting, tax and operating consulting services to private family and independent foundations, independent schools and other not-for-profit organizations on a regional and national level. LTM views its services as an extension of staff for Boards, Executive Directors, CFOs and CIOs and is available for consultative guidance or project work on a variety of complex financial management issues.
Lawrence T. Mangan, President, has over 20 years of experience as the chief financial officer for private foundations and independent schools. During that time, he has overseen a large, sophisticated investment portfolio, with substantial allocations to alternative assets and grant, administrative, operating and capital budgets in the hundreds of millions of dollars. He has also had responsibility for managing complex issues relating to human resources, global offices, information technology, facilities, construction projects, food service, communications and taxes at institutions with hundreds of employees and students. He has also worked with numerous not-for-profit organizations as a Board and Committee member, a grant maker and a presenter at workshops and conferences.
Larry has earned an MBA from LaSalle University and a Bachelor of Science degree in Finance from The Pennsylvania State University. He is a Past President of the Foundation Financial Officers Group (FFOG), an international association of senior level investment and financial professionals of private foundations. Larry is currently a Board member and Chair of the Audit Committee of Delaware Valley Grantmakers, a member of the Board and Chair of the Finance & Investment Committee of the First Hospital Foundation and a member of the Finance Committee of the Dorothea vanDyke McLane Association.

AgendaWelcomeMeasuring & Evaluating Fiscal Health Audits, Limited Reviews,
CompilationsFinancial Review Checklist“The Not-so Good, The Bad, The Ugly”Q & A
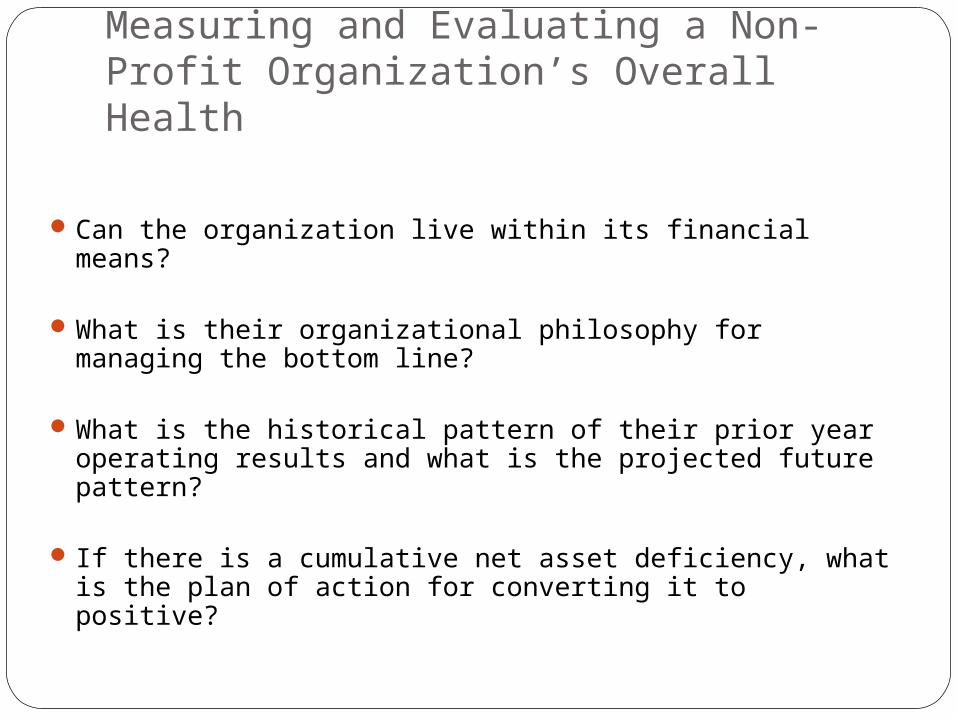
Measuring and Evaluating a Non-Profit Organization’s Overall Health
Can the organization live within its financial means?
What is their organizational philosophy for managing the bottom line?
What is the historical pattern of their prior year operating results and what is the projected future pattern?
If there is a cumulative net asset deficiency, what is the plan of action for converting it to positive?

Measuring and Evaluating a Non-Profit Organization’s Overall Health
Does the organization have sufficient working capital?
Does the organization have healthy financial ratios (e.g. current ratio, debt-to-net asset ratio, etc.)?
Is there a healthy mix of earned income & contributed income?
Remember that the financial statements & related footnotes tell an important story about the organization! What do you want the story to say about your organization?
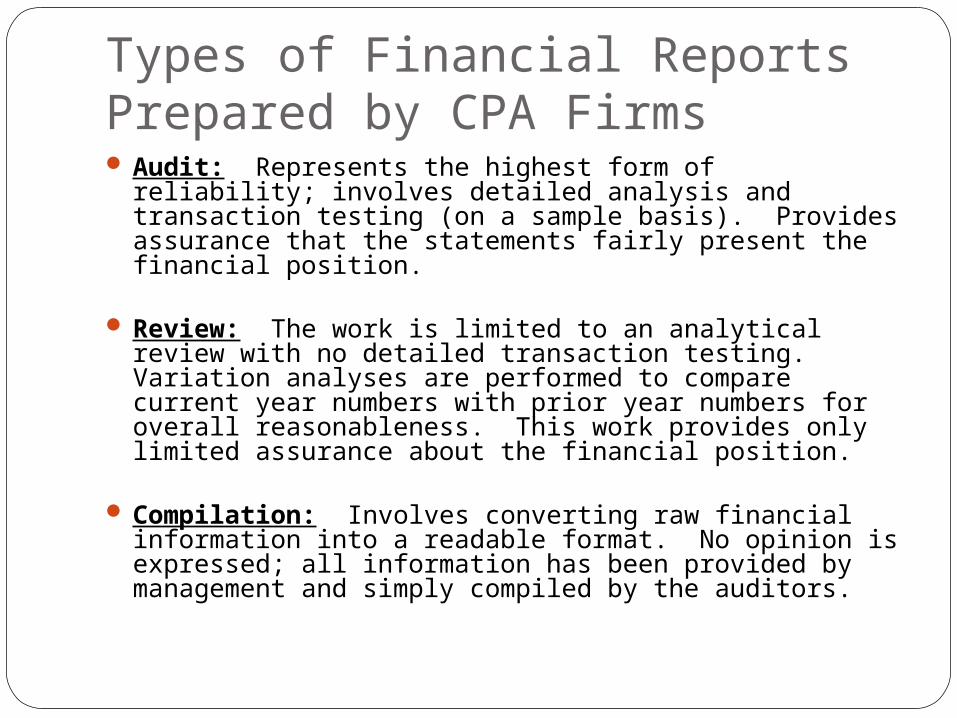
Types of Financial Reports Prepared by CPA Firms Audit: Represents the highest form of reliability;
involves detailed analysis and transaction testing (on a sample basis). Provides assurance that the statements fairly present the financial position.
Review: The work is limited to an analytical review with no detailed transaction testing. Variation analyses are performed to compare current year numbers with prior year numbers for overall reasonableness. This work provides only limited assurance about the financial position.
Compilation: Involves converting raw financial information into a readable format. No opinion is expressed; all information has been provided by management and simply compiled by the auditors.

Dewey, Cheat um & Howe Cer t ifi ed Publ ic Account ant s
Offices in Leavenworth, KS and Ossining, NY
INDEPENDENT AUDITORS' REPORT
The Board of Trustees of Shady Acres Senior Center We have audited the accompanying statements of financial position of Shady Acres Senior Center (the Center), as of December 31, 2006 and 2005, and the related statements of activities and cash flows for the years then ended. These financial statements are the responsibility of the Center's management. Our responsibility is to express an opinion on these financial statements based on our audit. We conducted our audit in accordance with auditing standards generally accepted in the United States of America. Those standards require that we plan and perform the audit to obtain reasonable assurance about whether the financial statements are free of material misstatement. An audit includes examining, on a test basis, evidence supporting the amounts and disclosures in the financial statements. An audit also includes assessing the accounting principles used and significant estimates made by management, as well as evaluating the overall financial statement presentation. We believe our audit provides a reasonable basis for our opinion. In our opinion, the financial statements referred to above present fairly, in all material respects, the financial position of the Center as of December 31, 2006 and 2005, and the change in its net assets and cash flows for the years then ended, in conformity with accounting principles generally accepted in the United States of America. Our audit was performed for the purpose of forming an opinion on the basic financial statements of the Center taken as a whole. The accompanying supplemental schedules listed in the table of contents are presented for the purposes of additional analysis and are not a required part of the basic financial statements. Such information has been subjected to the auditing procedures applied in the audit of the basic financial statements and, in our opinion, is fairly stated, in all material respects, in relation to the basic financial statements taken as a whole. Dewey, Chea t um & Howe March 24, 2007
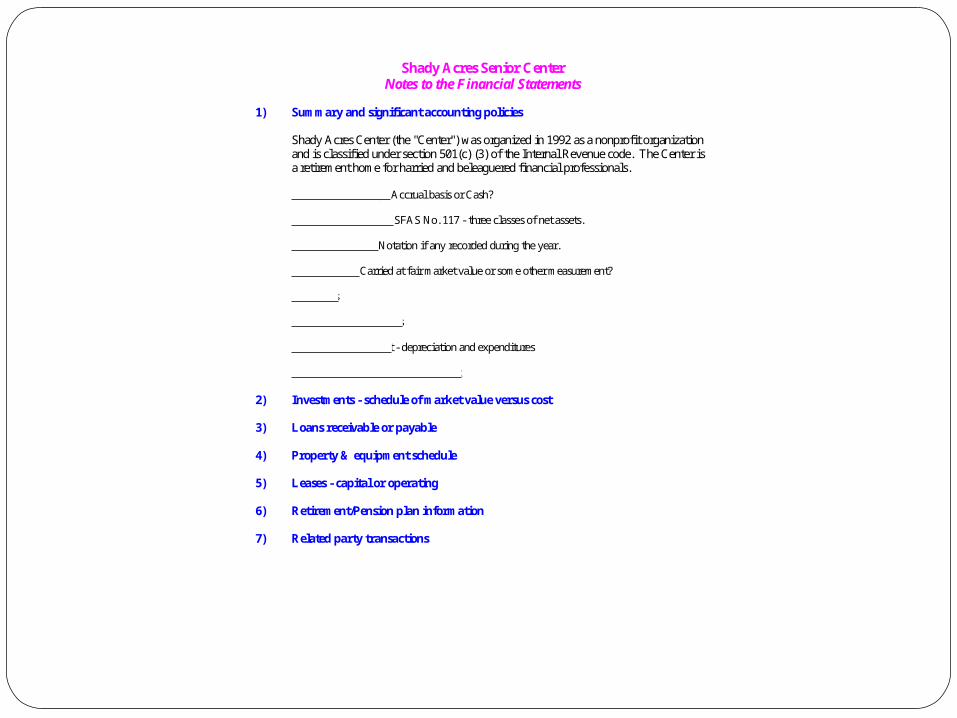
Shady Acres Senior CenterNotes to the Financial Statements
1) Summary and significant accounting policies
Shady Acres Center (the "Center") was organized in 1992 as a nonprofit organizationand is classified under section 501(c) (3) of the Internal Revenue code. The Center isa retirement home for harried and beleaguered financial professionals.
Basis of Accounting - Accrual basis or Cash?
Basis of Presentation - SFAS No. 117 - three classes of net assets.
Reclassifications - Notation if any recorded during the year.
Investments - Carried at fair market value or some other measurement?
Tax Status
Cash & Cash equivalents
Property & Equipment - depreciation and expenditures
Concentration of Credit & Market risk
2) Investments - schedule of market value versus cost
3) Loans receivable or payable
4) Property & equipment schedule
5) Leases - capital or operating
6) Retirement/Pension plan information
7) Related party transactions

2006 2005Assets
15,000 45,000 12,000 14,000 10,000 11,000
Investments 225,000 200,000 Property & Equipment, net 755,000 750,000
Total Assets 1,017,000 1,020,000
LiabilitiesAccounts payable 12,000 10,000 Accrued payroll 16,000 15,000 Line of credit payable 30,000 20,000 Mortgage payable 262,000 275,000
Total Liabilities 320,000 320,000
Net AssetsUnrestricted Net Assets 232,000 185,000 Temporarily Restricted - 50,000 Permanently Restricted 465,000 465,000
Total Net Assets 697,000 700,000
Total Liabilities and Net Assets 1,017,000 1,020,000
Accounts ReceivablePledges Receivable
Shady Acres Senior CenterStatements of Financial Position
December 31, 2006 and 2005
Cash & equivalents
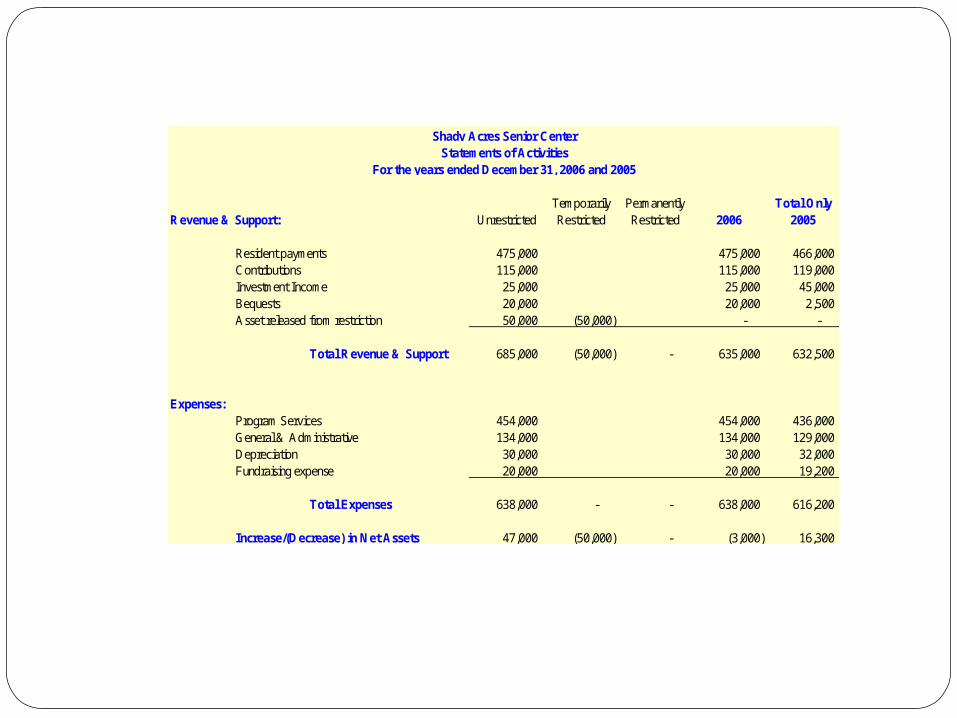
Temporarily Permanently Total OnlyRevenue & Support: Unrestricted Restricted Restricted 2006 2005
Resident payments 475,000 475,000 466,000 Contributions 115,000 115,000 119,000 Investment Income 25,000 25,000 45,000 Bequests 20,000 20,000 2,500 Asset released from restriction 50,000 (50,000) - -
Total Revenue & Support 685,000 (50,000) - 635,000 632,500
Expenses:Program Services 454,000 454,000 436,000 General & Administrative 134,000 134,000 129,000 Depreciation 30,000 30,000 32,000 Fundraising expense 20,000 20,000 19,200
Total Expenses 638,000 - - 638,000 616,200
Increase/(Decrease) in Net Assets 47,000 (50,000) - (3,000) 16,300
Shady Acres Senior CenterStatements of Activities
For the years ended December 31, 2006 and 2005
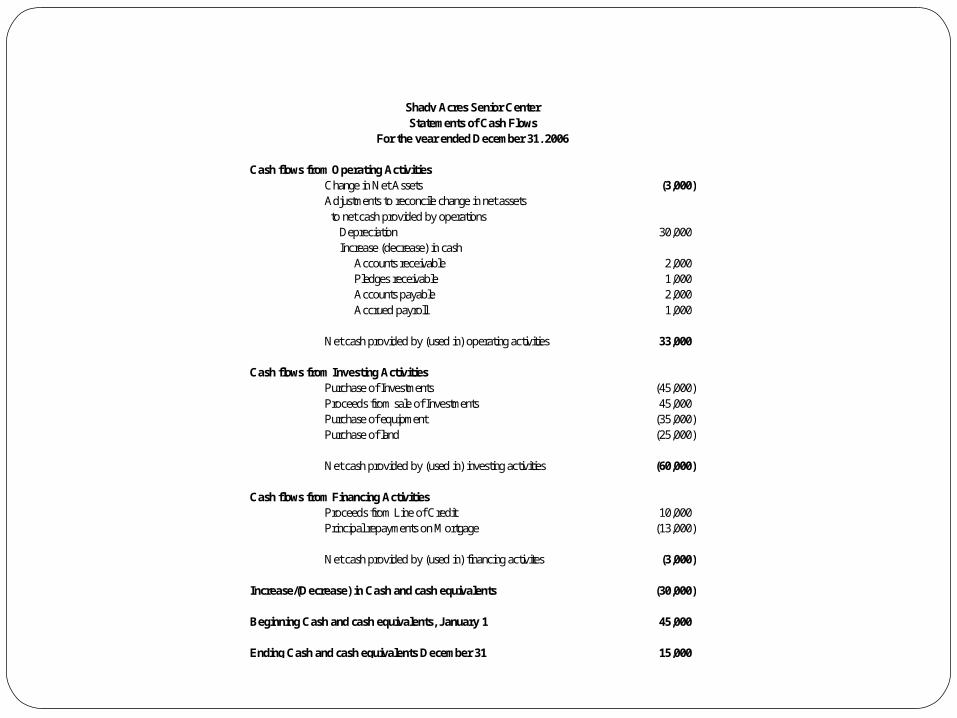
Cash flows from Operating ActivitiesChange in Net Assets (3,000) Adjustments to reconcile change in net assets to net cash provided by operations Depreciation 30,000 Increase (decrease) in cash Accounts receivable 2,000 Pledges receivable 1,000 Accounts payable 2,000 Accrued payroll 1,000
Net cash provided by (used in) operating activities 33,000
Cash flows from Investing ActivitiesPurchase of Investments (45,000) Proceeds from sale of Investments 45,000 Purchase of equipment (35,000) Purchase of land (25,000)
Net cash provided by (used in) investing activities (60,000)
Cash flows from Financing ActivitiesProceeds from Line of Credit 10,000 Principal repayments on Mortgage (13,000)
Net cash provided by (used in) financing activites (3,000)
Increase/(Decrease) in Cash and cash equivalents (30,000)
Beginning Cash and cash equivalents, January 1 45,000
Ending Cash and cash equivalents December 31 15,000
For the year ended December 31, 2006
Shady Acres Senior CenterStatements of Cash Flows

Initials of Reviewer LTMQuick Financial Overview Date Reviewed 4/20/2007
Organization: Shady Acres Senior Center Organization's Fiscal Year Ended: 12/31/06
Clean Audit Opinion: Yes___X___ No______
2 or more NO answers indicate need for further financial analysis.YES NO
Using Statement of Financial Position -
CURRENT RATIO:
Current Assets divided by Current Liabilities - determines the organization's ability to pay current debt using current assets
Target = 1 or greater
*TOTAL CURRENT ASSETS 37,000 0.64 X*TOTAL CURRENT LIABILITIES 58,000
DEBT TO NET ASSETS:
Long Term Debt divided by Total Net Assets - determines if the organization is highly leveraged(Long Term Debt is the same as Total Liabilities minus Total Current Liabilities)
Target = less than .50
LONG TERM DEBT 262,000 0.38 XTOTAL NET ASSETS 697,000
INCREASE IN NET ASSETS:
(Current year's Net Assets minus prior year's Net Assets) divided by prior year's Net Assets - determines growth in net assets
Target = greater than rate of inflation for the year 2.50%
(CURRENT YEAR'S TOTAL NET ASSETS - PRIOR YEAR'S TOTAL NET ASSETS) (3,000) -0.43% XPRIOR YEAR'S NET ASSETS 700,000

Quick Financial Overview
Organization: Shady Acres Senior Center
Using Statement of Activities -
NET MARGIN:
Change in Net Assets divided by Total Revenue - shows profitability
Target = greater than 0
TOTAL CHANGE IN NET ASSETS (3,000) -0.47% XTOTAL REVENUE 635,000
ADMINISTRATION COST:
(Management and Fundraising Expenses) divided by Total Expenses - shows percentage of each dollar spent on overhead
Target = less than .30
*TOTAL ADMINISTRATIVE + FUNDRAISING EXPENSES 177,100 0.28 XTOTAL EXPENSES 638,000
*If categories are not specific line items, then attach a detailed listing of what has been included in the calculation.
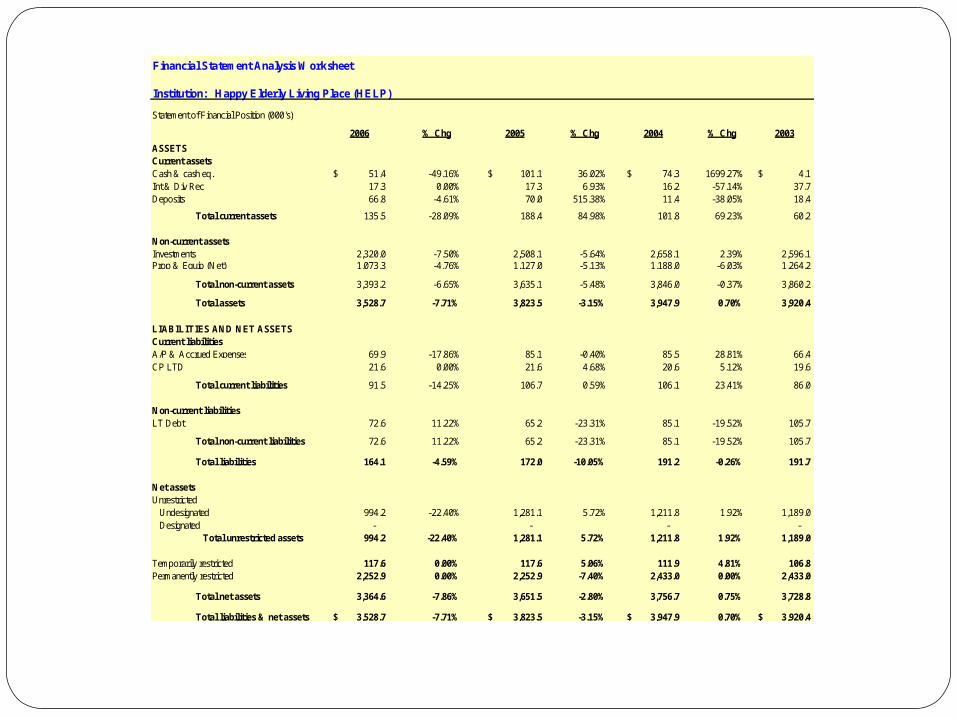
Financial Statement Analysis Worksheet
Institution: Happy Elderly Living Place (HELP)
Statement of Financial Position (000's)
2006 % Chg 2005 % Chg 2004 % Chg 2003
ASSETSCurrent assetsCash & cash eq. 51.4$ -49.16% 101.1$ 36.02% 74.3$ 1699.27% 4.1$ Int & Div Rec 17.3 0.00% 17.3 6.93% 16.2 -57.14% 37.7 Deposits 66.8 -4.61% 70.0 515.38% 11.4 -38.05% 18.4
Total current assets 135.5 -28.09% 188.4 84.98% 101.8 69.23% 60.2
Non-current assetsInvestments 2,320.0 -7.50% 2,508.1 -5.64% 2,658.1 2.39% 2,596.1 Prop & Equip (Net) 1,073.3 -4.76% 1,127.0 -5.13% 1,188.0 -6.03% 1,264.2
Total non-current assets 3,393.2 -6.65% 3,635.1 -5.48% 3,846.0 -0.37% 3,860.2
Total assets 3,528.7 -7.71% 3,823.5 -3.15% 3,947.9 0.70% 3,920.4
LIABILITIES AND NET ASSETSCurrent liabilitiesA/P & Accrued Expenses 69.9 -17.86% 85.1 -0.40% 85.5 28.81% 66.4 CP LTD 21.6 0.00% 21.6 4.68% 20.6 5.12% 19.6
Total current liabilities 91.5 -14.25% 106.7 0.59% 106.1 23.41% 86.0
Non-current liabilitiesLT Debt 72.6 11.22% 65.2 -23.31% 85.1 -19.52% 105.7
Total non-current liabilities 72.6 11.22% 65.2 -23.31% 85.1 -19.52% 105.7
Total liabilities 164.1 -4.59% 172.0 -10.05% 191.2 -0.26% 191.7
Net assetsUnrestricted Undesignated 994.2 -22.40% 1,281.1 5.72% 1,211.8 1.92% 1,189.0 Designated - - - -
Total unrestricted assets 994.2 -22.40% 1,281.1 5.72% 1,211.8 1.92% 1,189.0
Temporarily restricted 117.6 0.00% 117.6 5.06% 111.9 4.81% 106.8 Permanently restricted 2,252.9 0.00% 2,252.9 -7.40% 2,433.0 0.00% 2,433.0
Total net assets 3,364.6 -7.86% 3,651.5 -2.80% 3,756.7 0.75% 3,728.8
Total liabilities & net assets 3,528.7$ -7.71% 3,823.5$ -3.15% 3,947.9$ 0.70% 3,920.4$

Institution: Happy Elderly Living Place (HELP)
Ratios 2006 2005 2004 2003
Current (# of times covered) 1.48 1.77 0.96 0.70 Fixed (% of TA) 30.42% 29.47% 30.09% 32.25%LT Investments/TA 65.75% 65.60% 67.33% 66.22%LTD/NA 2.16% 1.79% 2.26% 2.83%LTD/UNA 7.30% 5.09% 7.02% 8.89%

Institution: Happy Elderly Living Place (HELP)
Statement of Activities and Change in Net Assets (000's)2006 % Chg 2005 % Chg 2004 % Chg 2003
Revenues & supportRevenuesPersonal care fees 784.0 -39.64% 1,298.8 -1.28% 1,315.7 25.85% 1,045.4 Investment Income 1.7 -57.14% 4.1 -44.54% 7.3 -51.72% 15.2 Endowment Inv Income 133.6 788.06% 15.0 -90.18% 153.1 -58.84% 372.1 Other income 2.6 0.00% 2.6 -28.94% 3.7 32.21% 2.8
Total revenues 922.0 -30.18% 1,320.5 -10.77% 1,479.9 3.09% 1,435.5
SupportContribution 172.5 124.28% 76.9 98.64% 38.7 -56.53% 89.1
Total support 172.5 124.28% 76.9 98.64% 38.7 -56.53% 89.1
Total revenues & support 1,094.5 -21.68% 1,397.4 -7.98% 1,518.6 -0.39% 1,524.5
ExpensesProgram Sal & Ben 530.4 -40.97% 902.4 11.79% 836.0 -8.10% 863.4 Food 75.0 -41.22% 127.1 7.94% 113.7 -3.17% 123.7 Other 248.4 -40.97% 259.5 11.79% 334.7 -8.10% 258.1 Depreciation & Utilities 161.1 -24.58% 213.7 3.58% 206.3 0.29% 205.7
Total expenses 1,015.0 -32.45% 1,502.7 0.81% 1,490.6 2.74% 1,450.9
Change in net assets 79.4 -175.50% (105.2) -476.73% 27.9 -62.08% 73.7
Ratios2006 2005 2004 2003
Net Margin 7.26% -7.53% 1.84% 4.83%Revenue Dependence 71.63% 92.94% 86.64% 68.57%Program Cost 75.52% 82.73% 77.55% 82.21%Overhead Cost 24.48% 17.27% 22.45% 17.79%Personnel Cost 52.26% 60.05% 56.08% 59.51%
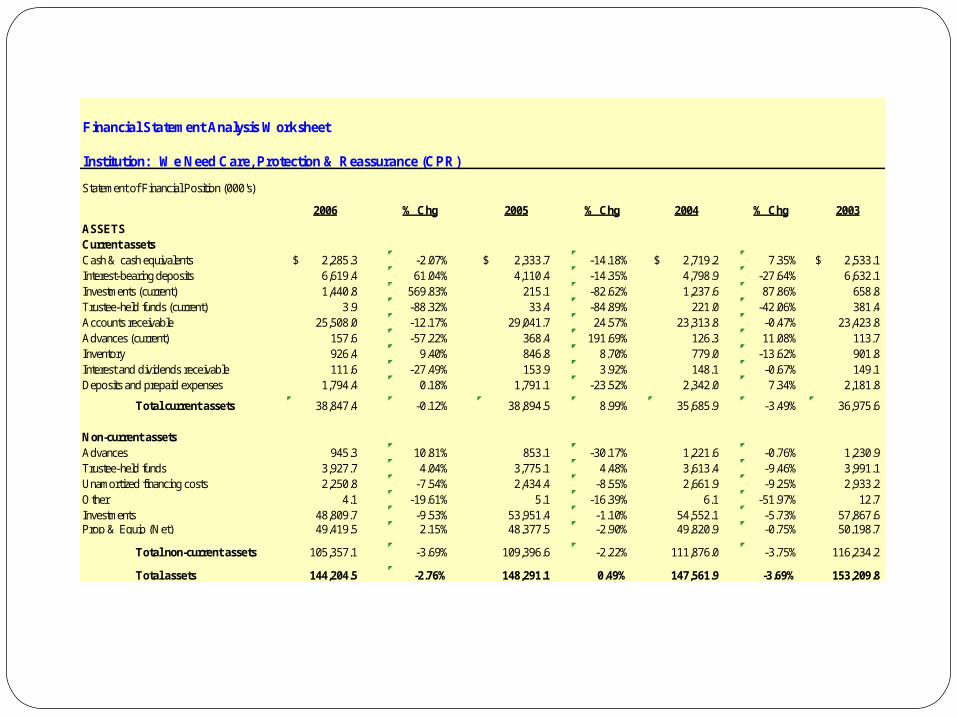
Financial Statement Analysis Worksheet
Institution: We Need Care, Protection & Reassurance (CPR)
Statement of Financial Position (000's)
2006 % Chg 2005 % Chg 2004 % Chg 2003
ASSETSCurrent assetsCash & cash equivalents 2,285.3$ -2.07% 2,333.7$ -14.18% 2,719.2$ 7.35% 2,533.1$ Interest-bearing deposits 6,619.4 61.04% 4,110.4 -14.35% 4,798.9 -27.64% 6,632.1 Investments (current) 1,440.8 569.83% 215.1 -82.62% 1,237.6 87.86% 658.8 Trustee-held funds (current) 3.9 -88.32% 33.4 -84.89% 221.0 -42.06% 381.4 Accounts receivable 25,508.0 -12.17% 29,041.7 24.57% 23,313.8 -0.47% 23,423.8 Advances (current) 157.6 -57.22% 368.4 191.69% 126.3 11.08% 113.7 Inventory 926.4 9.40% 846.8 8.70% 779.0 -13.62% 901.8 Interest and dividends receivable 111.6 -27.49% 153.9 3.92% 148.1 -0.67% 149.1 Deposits and prepaid expenses 1,794.4 0.18% 1,791.1 -23.52% 2,342.0 7.34% 2,181.8
Total current assets 38,847.4 -0.12% 38,894.5 8.99% 35,685.9 -3.49% 36,975.6
Non-current assetsAdvances 945.3 10.81% 853.1 -30.17% 1,221.6 -0.76% 1,230.9 Trustee-held funds 3,927.7 4.04% 3,775.1 4.48% 3,613.4 -9.46% 3,991.1 Unamortized financing costs 2,250.8 -7.54% 2,434.4 -8.55% 2,661.9 -9.25% 2,933.2 Other 4.1 -19.61% 5.1 -16.39% 6.1 -51.97% 12.7 Investments 48,809.7 -9.53% 53,951.4 -1.10% 54,552.1 -5.73% 57,867.6 Prop & Equip (Net) 49,419.5 2.15% 48,377.5 -2.90% 49,820.9 -0.75% 50,198.7
Total non-current assets 105,357.1 -3.69% 109,396.6 -2.22% 111,876.0 -3.75% 116,234.2
Total assets 144,204.5 -2.76% 148,291.1 0.49% 147,561.9 -3.69% 153,209.8
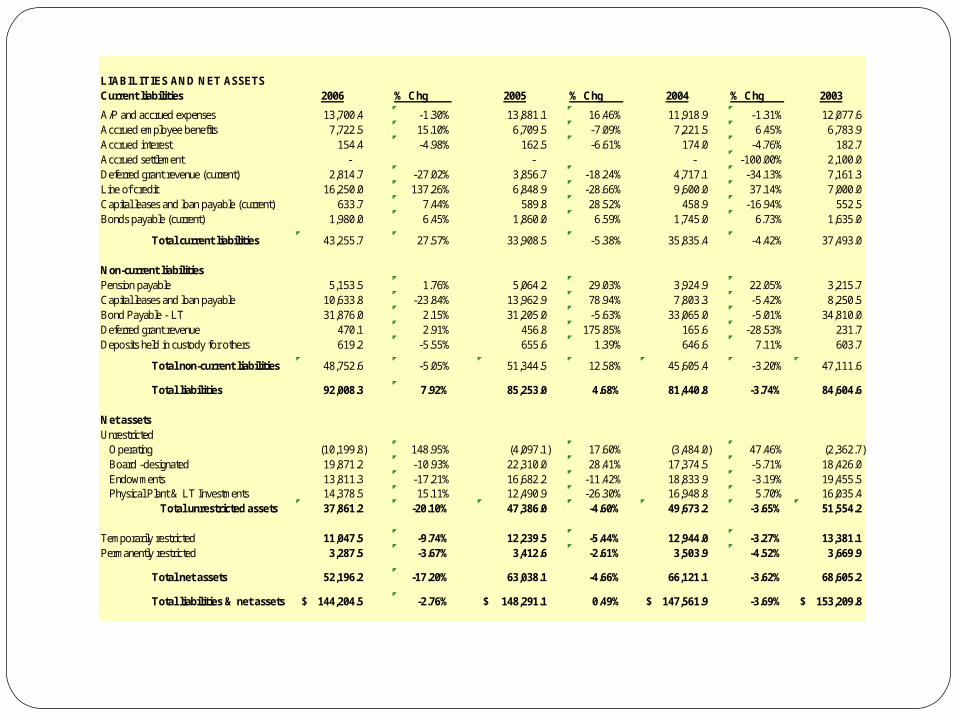
Institution: We Need Care, Protection & Reassurance (CPR)
LIABILITIES AND NET ASSETSCurrent liabilities 2006 % Chg 2005 % Chg 2004 % Chg 2003
A/P and accrued expenses 13,700.4 -1.30% 13,881.1 16.46% 11,918.9 -1.31% 12,077.6 Accrued employee benefits 7,722.5 15.10% 6,709.5 -7.09% 7,221.5 6.45% 6,783.9 Accrued interest 154.4 -4.98% 162.5 -6.61% 174.0 -4.76% 182.7 Accrued settlement - - - -100.00% 2,100.0 Deferred grant revenue (current) 2,814.7 -27.02% 3,856.7 -18.24% 4,717.1 -34.13% 7,161.3 Line of credit 16,250.0 137.26% 6,848.9 -28.66% 9,600.0 37.14% 7,000.0 Capital leases and loan payable (current) 633.7 7.44% 589.8 28.52% 458.9 -16.94% 552.5 Bonds payable (current) 1,980.0 6.45% 1,860.0 6.59% 1,745.0 6.73% 1,635.0
Total current liabilities 43,255.7 27.57% 33,908.5 -5.38% 35,835.4 -4.42% 37,493.0
Non-current liabilitiesPension payable 5,153.5 1.76% 5,064.2 29.03% 3,924.9 22.05% 3,215.7 Capital leases and loan payable 10,633.8 -23.84% 13,962.9 78.94% 7,803.3 -5.42% 8,250.5 Bond Payable - LT 31,876.0 2.15% 31,205.0 -5.63% 33,065.0 -5.01% 34,810.0 Deferred grant revenue 470.1 2.91% 456.8 175.85% 165.6 -28.53% 231.7 Deposits held in custody for others 619.2 -5.55% 655.6 1.39% 646.6 7.11% 603.7
Total non-current liabilities 48,752.6 -5.05% 51,344.5 12.58% 45,605.4 -3.20% 47,111.6
Total liabilities 92,008.3 7.92% 85,253.0 4.68% 81,440.8 -3.74% 84,604.6
Net assetsUnrestricted Operating (10,199.8) 148.95% (4,097.1) 17.60% (3,484.0) 47.46% (2,362.7) Board -designated 19,871.2 -10.93% 22,310.0 28.41% 17,374.5 -5.71% 18,426.0 Endowments 13,811.3 -17.21% 16,682.2 -11.42% 18,833.9 -3.19% 19,455.5 Physical Plant & LT Investments 14,378.5 15.11% 12,490.9 -26.30% 16,948.8 5.70% 16,035.4
Total unrestricted assets 37,861.2 -20.10% 47,386.0 -4.60% 49,673.2 -3.65% 51,554.2
Temporarily restricted 11,047.5 -9.74% 12,239.5 -5.44% 12,944.0 -3.27% 13,381.1 Permanently restricted 3,287.5 -3.67% 3,412.6 -2.61% 3,503.9 -4.52% 3,669.9
Total net assets 52,196.2 -17.20% 63,038.1 -4.66% 66,121.1 -3.62% 68,605.2
Total liabilities & net assets 144,204.5$ -2.76% 148,291.1$ 0.49% 147,561.9$ -3.69% 153,209.8$

Institution: We Need Care, Protection & Reassurance (CPR)
Ratios 2006 2005 2004 2003
Current (# of times covered) 0.90 1.15 1.00 0.99 Fixed (% of TA) 34.27% 32.62% 33.76% 32.76%LT Investments/TA 33.85% 36.38% 36.97% 37.77%LTD/NA 93.40% 81.45% 68.97% 68.67%LTD/UNA 128.77% 108.35% 91.81% 91.38%
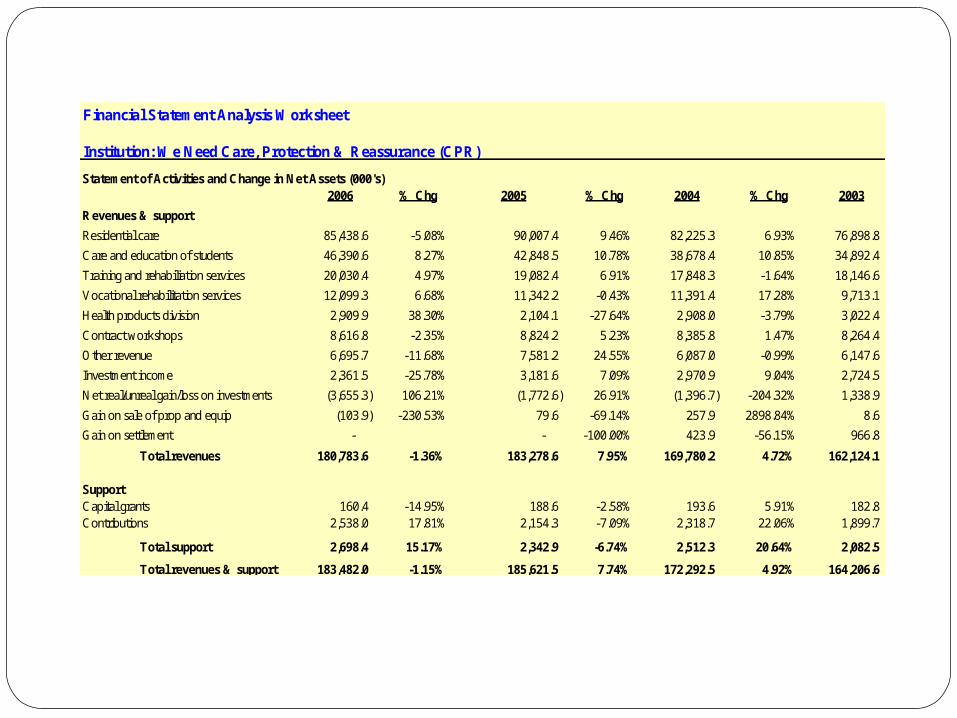
Financial Statement Analysis Worksheet
Institution: We Need Care, Protection & Reassurance (CPR)
Statement of Activities and Change in Net Assets (000's)2006 % Chg 2005 % Chg 2004 % Chg 2003
Revenues & support
Residential care 85,438.6 -5.08% 90,007.4 9.46% 82,225.3 6.93% 76,898.8
Care and education of students 46,390.6 8.27% 42,848.5 10.78% 38,678.4 10.85% 34,892.4
Training and rehabiliation services 20,030.4 4.97% 19,082.4 6.91% 17,848.3 -1.64% 18,146.6
Vocational rehabilitation services 12,099.3 6.68% 11,342.2 -0.43% 11,391.4 17.28% 9,713.1
Health products division 2,909.9 38.30% 2,104.1 -27.64% 2,908.0 -3.79% 3,022.4
Contract workshops 8,616.8 -2.35% 8,824.2 5.23% 8,385.8 1.47% 8,264.4
Other revenue 6,695.7 -11.68% 7,581.2 24.55% 6,087.0 -0.99% 6,147.6
Investment income 2,361.5 -25.78% 3,181.6 7.09% 2,970.9 9.04% 2,724.5
Net real/unreal gain/loss on investments (3,655.3) 106.21% (1,772.6) 26.91% (1,396.7) -204.32% 1,338.9
Gain on sale of prop and equip (103.9) -230.53% 79.6 -69.14% 257.9 2898.84% 8.6
Gain on settlement - - -100.00% 423.9 -56.15% 966.8
Total revenues 180,783.6 -1.36% 183,278.6 7.95% 169,780.2 4.72% 162,124.1
SupportCapital grants 160.4 -14.95% 188.6 -2.58% 193.6 5.91% 182.8 Contributions 2,538.0 17.81% 2,154.3 -7.09% 2,318.7 22.06% 1,899.7
Total support 2,698.4 15.17% 2,342.9 -6.74% 2,512.3 20.64% 2,082.5
Total revenues & support 183,482.0 -1.15% 185,621.5 7.74% 172,292.5 4.92% 164,206.6

Institution: We Need Care, Protection & Reassurance (CPR)
Statement of Activities and Change in Net Assets (000's)2006 % Chg 2005 % Chg 2004 % Chg 2003
ExpensesWages and benefits 133,434.3 2.23% 130,524.8 9.96% 118,697.5 6.84% 111,095.2 Food and utensils 2,257.7 -22.87% 2,927.1 9.83% 2,665.2 7.29% 2,484.0 Interest 3,483.5 -10.02% 3,871.6 3.95% 3,724.6 8.75% 3,425.0 Rental of buildings and equipment 4,030.7 16.64% 3,455.8 9.04% 3,169.3 16.57% 2,718.8 Utilities 3,255.5 -4.37% 3,404.1 31.29% 2,592.9 -3.86% 2,696.9 Insurance 1,898.0 29.47% 1,466.0 2.52% 1,430.0 -8.54% 1,563.6 Repairs and maintenance 1,370.3 -13.33% 1,581.0 -2.83% 1,627.1 34.05% 1,213.8 Transportation 1,049.2 -18.42% 1,286.1 13.47% 1,133.4 12.63% 1,006.3 Supplies and other 18,020.7 4.45% 17,252.9 18.73% 14,530.7 2.07% 14,235.4 Grant to subcontracts 21,516.8 15.13% 18,688.5 7.91% 17,319.1 3.31% 16,763.7 Designated expenditures - - -100.00% 3,231.0 7.05% 3,018.1 Depreciation 4,007.2 -5.64% 4,246.6 5.31% 4,032.5 3.98% 3,878.0
Total expenses 194,323.9 2.98% 188,704.5 8.36% 174,153.3 6.13% 164,098.8
Change in net assets (10,841.9) 251.67% (3,083.0) 65.68% (1,860.8) -1826.16% 107.8
Ratios
Net Margin -5.91% -1.66% -1.08% 0.07%Revenue Dependence 46.57% 48.49% 47.72% 46.83%Program Cost 90.48% 90.25% 90.85% 90.27%Overhead Cost 9.52% 9.75% 9.15% 9.73%Personnel Cost 68.67% 69.17% 68.16% 67.70%
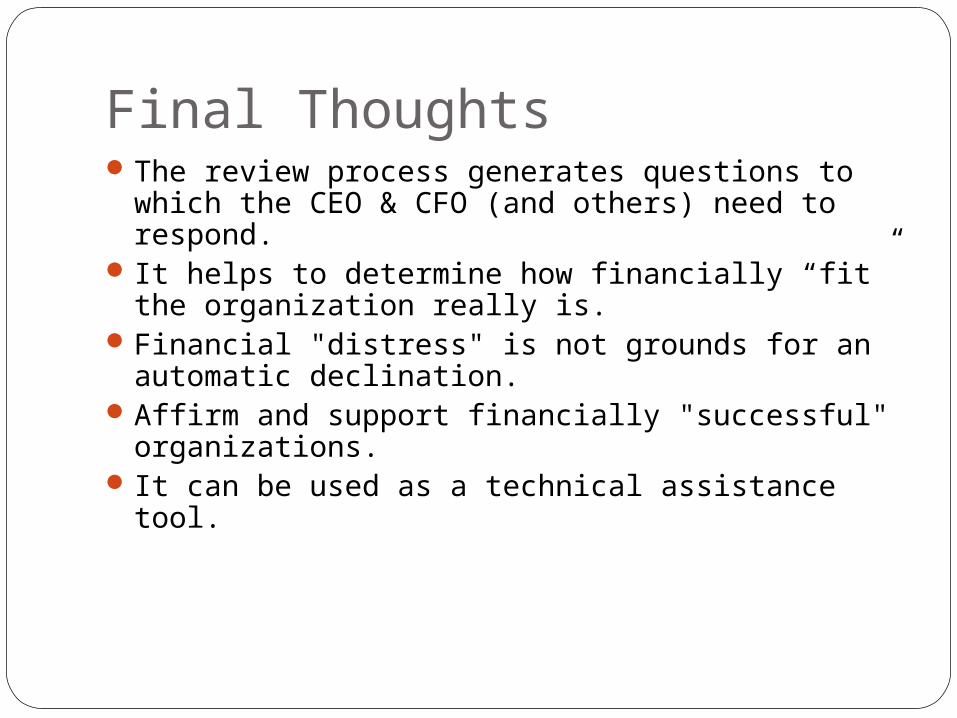
Final ThoughtsThe review process generates questions to which
the CEO & CFO (and others) need to respond. It helps to determine how financially “fit” the
organization really is. Financial "distress" is not grounds for an automatic
declination.Affirm and support financially "successful"
organizations. It can be used as a technical assistance tool.