Analyzing Florida's Government Staffing Levels · to analyze state and local government staffing...
43
How Florida Compares: An Approach for Analyzing Government Staffing Levels September 1998 Office of Program Policy Analysis and Government Accountability Report No. 98-13
Transcript of Analyzing Florida's Government Staffing Levels · to analyze state and local government staffing...

How Florida Compares: An Approach for Analyzing Government Staffing Levels
September 1998
Office of Program Policy Analysis and Government AccountabilityReport No. 98-13

Post Office Box 1735 n Tallahassee, Florida 32302111 West Madison Street n Room 312 n Claude Pepper Building n Tallahassee, Florida 32301
850/488-0021 SUNCOM 278-0021 FAX 850/487-3804
The Florida Legislature
OFFICE OF PROGRAM POLICY ANALYSIS ANDGOVERNMENT ACCOUNTABILITY
John W. Turcotte, Director
September 1998
The President of the Senate,the Speaker of the House of Representatives,and the Legislative Auditing Committee
As requested by the Legislative Auditing Committee, I have directed that an approach bedeveloped to analyze state and local government staffing levels. The results of this effortare presented to you in this report. This review was conducted by Nancy Dufoe, RobbieBrunger, and Lesley Kalan under the supervision of Julie Ferris.
Sincerely,
John W. TurcotteDirector

Contents
Executive Summary................................................................................................................... i
Chapter 1: Introduction ........................................................................................................... 1
Chapter 2: Staffing Levels ....................................................................................................... 5
Chapter 3: Approaches for Assessing Appropriateness ofStaffing Levels.......................................................................................................17
Chapter 4: Conclusions and Recommendations........................................................................31
Appendix
A. U.S. Census Bureau Functional Categories ............................................................37

i
Executive Summary Report No. 98-13
How Florida Compares: An Approach forAnalyzing Government Staffing Levels
OPPAGA conducted this review at the direction of the JointLegislative Auditing Committee. The review assessed methods toanalyze state and local government staffing levels in Florida. Thespecific objectives of the review were to
• compare Florida’s state agency staffing levels to staffing levels ofother states;
• identify factors influencing those staffing levels;
• determine what influence local government staffing levels have onFlorida’s staffing levels; and
• identify methods that Florida could use to more closely evaluatethe use of staffing resources.
OPPAGA will issue a second report in 1999 that examines theresources (staffing and funding) allocated to administrative functionsin state agencies. The report will identify potential staffing andefficiency ratios, benchmarks, and options for evaluating staffing andcosts.
The size of government is an important policy issue at the federallevel and in many states, including Florida. Public employment ispart of the service-producing sector, which is the largest and fastestgrowing sector of the U.S. economy. The number of state employeesin Florida increased at almost twice the rate of the state populationbetween 1987 and 1995. This growth has led some policymakers toquestion whether government has too many employees. A relativelylarge number of employees generally indicates a large government. Arecent survey of public attitudes found that many felt that stategovernment is too big and bureaucratic to be effective.
Florida has historically taken steps to limit the number of stateemployees. During the mid-1980s, for example, the Governor'sOffice established an informal policy to limit the size of state
Background
Scope

ii
government to 1% of the state's population.1 It is important forFlorida to continue to implement strategies for monitoring andcontrolling staffing levels to ensure the levels are appropriate. Onemethod for beginning an assessment of the size of Florida's publicsector workforce is to compare it to those in other states.
Florida's staffing levels rank relatively low when compared to otherstates. Moreover, the staffing levels for most types of governmentservices tend to be comparable with other states. Florida's stateagency staffing levels exceed other states' primarily in the publicsafety and justice services area. When local government full-timeequivalent (FTE) positions are added to the analysis, Florida showshigher-than-average staffing levels in the natural resources servicesarea.2 These levels must be interpreted with caution because they arelinked to unique social, economic, and political factors in the statethat have created demands for labor in these service areas.
Although the census data analysis shows that Florida has relativelylow staffing levels, the data cannot be used to determine whetherFlorida has the appropriate level of staff. The census data analysiscannot answer the question of whether Florida's government staffinglevels are too high or too low in any area. Assessing whether staffinglevels are appropriate requires a detailed analysis of efficiency that isdependent on more specific information about performance, staffing,and costs.
Through its performance-based program budgeting (PB²) efforts,Florida is in the forefront in bringing performance measurementinformation into the budget process to make funding decisions. Theability to assess the reasonableness of state agency staffing levels isparticularly critical under the PB² initiative. However, one weaknessin the current initiative is that prior to 1998, agencies were notrequired to develop measures for administrative and supportactivities. Without this information, a large portion of state activitiesand costs are excluded from the benefits of performance budgeting.
At present, decisions concerning staffing levels suffer from a generallack of pertinent information. The state's major sources for staffinginformation, the personnel classification system and the personnelinformation system, do not currently provide the type of informationneeded to accurately and uniformly assess staffing. Florida's CareerService personnel classification system is too complex and it excludessome state personnel, primarily members of the State University
1 According to Glenn Roberstson, Budget Director during Governor Graham's administration, attempts to formalize this policy were unsuccessful.2 The U.S. Census Bureau computes the statistic, full-time equivalent employee, to control for the variation in full-time and part-time workers. This
statistic is calculated by dividing the “part-time hours paid” by the standard number of hours for full-time employees and then adding the resultingquotient to the number of full-time employees.
Conclusions
Census Data AnalysisCannot Answer the Questionof Whether Florida'sGovernment Staffing LevelsAre Too High or Too Low inAny Area

iii
System. The state's personnel information system, COPES, was notdesigned to provide staffing information such as levels inadministrative, supervisory, or support functions. Moreover, thestate's accounting system does not collect costs by PB² programs orby activity.
The state is in the process of redesigning all of these systems. Inorder for the new systems to be of optimal use for decision-making,the systems will need to provide reliable personnel and costinformation that is compatible with PB².
PB² provides an opportunity to develop benchmarks and staffingratios that can be used to compare staffing for certain key functionsacross programs and agencies. Employee-related statistics such asbenchmarks and staffing ratios and program-based cost informationwill help the Legislature identify programs and processes for morecritical review. More precise methods can then be used to analyzehow well resources are being used and to identify reengineeringopportunities. These methods include activity-based costing, linearprogramming, and data envelopment analysis.
• The Governor's Office should continue to work with agencies todevelop measures for administrative and support activities in theirperformance-based budgets. A subsequent OPPAGA report willprovide a basis for these measures.
• The new personnel classification and compensation system needsto be completed as soon as possible and incorporated into thedesign of the Florida Financial Management Information System(FFMIS).
• The Legislature needs to ensure that FFMIS is designed in amanner that will provide the type of staffing and cost informationneeded to assess whether state agency staffing levels areappropriate.
• In order for policymakers and agency managers to make reliableand uniform staffing decisions, data is needed on the total numberof FTEs in state government. While existing exemptions toparticipating in the system may be appropriate, the StateUniversity System should be responsible for reporting FTEsaccording to standard, broad classification categories.
Recommendations

1
Chapter 1: Introduction
Purpose
OPPAGA conducted this review at the direction of the JointLegislative Auditing Committee. This review assessed methodsto analyze state and local government staffing levels in Florida.The specific objectives of the review were to
• compare Florida’s state agency staffing levels to staffinglevels of other states;
• identify factors influencing those staffing levels;
• determine what influence local government staffing levelshave on Florida’s staffing levels; and
• identify methods that Florida could use to more closelyevaluate the use of staffing resources.
OPPAGA will issue a second report in 1999 that examines theresources (staffing and funding) allocated to administrativefunctions in state agencies. The report will identify potentialstaffing and efficiency ratios and options for evaluating staff andcosts.
Background
The size of government is an important policy issue at thefederal level and in many states, including Florida. Publicemployment is part of the service-producing sector, which is thelargest and fastest growing sector of the U.S. economy. Thenumber of state employees in Florida increased at almost twicethe rate of the state's population between 1987 and 1995. (SeeExhibit 1.)
The size of government has led some policymakers at thefederal level and in many states to question whethergovernment has too many employees. A relatively largenumber of employees generally indicates a large government. Arecent survey of public attitudes found that many felt that stategovernments are too big and bureaucratic to be effective.

2
Exhibit 1Rate of Change of Florida State Employment
and State Population, 1987 and 1995
1987 1995Percentage
Change
AnnualizedPercentage
ChangeStatePopulation 11,675,904 14,184,155 108.91 2.69StateEmployees 125,983 174,717 120.89 4.84
Source: OPPAGA analysis of U.S. Census Bureau data
Variation in Service Delivery and Financing Methods. Incomparing the relative size of government across the states,such comparisons should take into account the wide variationthat exists in how states deliver and finance services.1 Becauseof these wide variations, employee counts should be viewed asmeasures of inputs of labor, not outputs of services.
Contracting Out. One factor that can substantially affect stateemployee counts is the extent to which a state contracts forservices with the private sector. Two states that spend aboutthe same to acquire a certain level of service can differsubstantially in employee counts if one contracts with a privatefirm to provide the service and the other provides the servicein-house. This factor deserves strong consideration as manystates look increasingly to privatization as a cost containmentmethod. For example, the Texas Department of Transportationincreased the number of contracts issued by approximately1,000% between 1988 and 1994.
Local Employees Paid from State Funds. Furthermore, themethod for financing employee salaries can also affect employeecounts. This is particularly true for public education. Althoughpublic school employees are considered local governmentemployees, many states provide all or a portion of the fundingfor public school employees' salaries. For example, the U.S.Census Bureau categorizes public school employees in Floridaas local government employees, yet the state provides most ofthe funding for school district employees' salaries.
1 See page 9 for a discussion of an example of how changes in service delivery have affected staffing in Florida's Department of Education.
Factors to ConsiderWhen Comparing StaffingLevels Across States

3
Federal Programs Affect State Staffing Levels. A state'semployee counts are also affected by federal requirements andfunding. For example, in Florida the federal government coversthe full cost of making disability determinations for two SocialSecurity programs, yet disability determination staff are countedas state employees. In 1997-98 Florida received $10.8 billion infederal funds for a variety of state functions includingtransportation, health care, and education. In other situations,federal funds have diminished, but the pattern of state and localgovernments performing certain levels of services had alreadybeen established.
Variation in Services Provided by Local Governments.Another factor that can affect state employee counts is theextent to which a state delegates services to its localgovernments. Government services are provided and fundedthrough a complex structure made up of numerous publicbodies and agencies. Moreover, legislative provisions forschool district and special district governments are diverse.Where one state may deliver and finance a service through alocal government, another state may use state employees toprovide the service. For example, although school systems inmost states are part of the local government structure, there arefour states with state-dependent public school systems.
Florida has historically taken steps to limit the number of stateemployees. During the mid-1980s, for example, the Governor'sOffice established an informal policy to limit the size of stategovernment to 1% of the state's population.2 In addition,lawmakers and agency managers have initiated a series ofreforms since the early 1990s to address issues of efficiency andeffectiveness in government. These reforms include adopting aperformance-based budgeting system and redesigning the state'spersonnel classification and information systems.
2 According to Glenn Roberstson, Budget Director during Governor Graham's administration, attempts to formalize this policy were unsuccessful.

4
This page intentionally left blank.

5
Chapter 2: Staffing Levels
Purpose
Although there is no agreement on the best size of government,one frequently used indicator of the relative size of governmentis the number of public sector employees. The U.S. CensusBureau reports the number of full-time equivalent (FTE) publicsector employees on an annual basis.3 To control fordifferences in state population size, we used the U.S. CensusBureau data to compute a ratio of the number of FTEs in astate per 10,000 population. We then compared Florida's ratiosto the average ratios for the other nine most populous states in1995 to determine the relative size of Florida government.4
In order to provide a more complete review of the size ofFlorida’s government, we analyzed the ratios for both state andlocal government. We included local government employees inthe analysis because of the variation in how states deliverservices and to capture the total government workforce. Forexample, one state may deliver services through localgovernments while another state provides the same servicethrough state agencies.
In comparing the relative size of government, several limitationsshould be noted. There is wide variation in how states deliverand finance services. States provide and fund services througha complex structure of numerous public bodies and agencies.One factor that can substantially affect state employee counts isthe extent to which a state contracts for services with theprivate sector. The method for financing employee salaries canalso affect employee counts, as can federal fundingrequirements. Moreover, the extent to which a state relies onlocal governments to provide services should also beconsidered.
3 We used data from the 1995 public employment survey conducted by the U.S. Bureau of the Census, Government Finance and Employment. The
employment survey is a measure of the number of public employees at a point in time (i.e., October) according to a detailed cross-classification byfunction and type of employment. The annual surveys include all state governments and a sample of approximately one in four local governments.As a result, the local government statistics are estimates subject to sampling variation. The U.S. Census Bureau computes the statistic, full-timeequivalent employee, to control for the variation in full-time and part-time workers. This statistic is calculated by dividing the “part-time hourspaid” by the standard number of hours for full-time employees and then adding the resulting quotient to the number of full-time employees.
4 The comparison states used in our analysis are Georgia, New Jersey, Michigan, Texas, New York, Ohio, Pennsylvania, Illinois, and California.
Number of Public SectorEmployees Is a FrequentlyUsed Indication of theSize of Government

6
State Staffing Levels
Florida's state employment level is low compared to otherstates. The U.S. Census Bureau data shows that Florida rankedforty-eighth among the states in 1995 in the number of FTEs.Florida had 123.2 FTEs per 10,000 population in 1995compared to the national average of 151.4 FTEs. Given thatFlorida is the fourth largest state in terms of population, arelevant comparison group for Florida is the 10 most populousstates. Exhibit 2 shows that Florida ranked relatively low(eighth) among the 10 most populous states in 1995. Theaverage ratio for the nine other most populous states was 131FTEs per 10,000 population, which is 6% higher than Florida'sratio of 123.2 FTEs.
Exhibit 2State Employee Staffing Levels
Ranking of the 10 Most Populous States - 1995
0
50
100
150
200
GA NJ MI TX NY avg OH PA FL IL CA
FTE
s Pe
r 10
,000
Pop
ulat
ion
Source: OPPAGA analysis of U.S. Census Bureau 1995 public employment survey
To better understand the results of the ratio comparison, wealso examined employment levels by government function. Thistype of analysis identifies the functions that have the highestdemand for government labor and can be used to investigatehow these demands have been affected by specific social andeconomic characteristics in a state. The focus of our review isto identify and explain functions where Florida has a higher thanaverage ratio of FTEs. For presentation purposes, we collapsedthe 22 categories used by the U.S. Census Bureau into seven
Florida Ranks Near theBottom in Per CapitaState Employees Among theMost Populous States
Staffing Levels CanBe Compared WithinGovernment Functions

7
major functional categories.5 Given the variation in stateorganization structures and service delivery modalities, thesefunctional categories provide a means for comparison acrossstates. The ratios for the functional categories do not correlateto staffing ratios for state agencies because functions often cutacross organizational structures. For example, some functionswithin the Department of Environmental Protection arecaptured under the natural resources function and some arecaptured under the health and social services function.
Exhibit 3 illustrates how Florida's state staffing levels compareto the average of the other nine most populous states in theseven major functional categories. The analysis shows Floridais comparable in the areas of administration, health and socialservices, transportation, and natural resources.
Exhibit 3State Employee Staffing Levels by Government Service - 1995
Florida Compared to the Average of the Other Nine Most Populous States
0
10
20
30
40
50
Education Public Safety andJustice
Health and SocialServices
Administration Natural Resources Transportation
Florida
Other Nine States
Source: OPPAGA analysis of U.S. Census Bureau 1995 public employment survey
5 The seven major functional categories are administration, public safety and justice, health and social services, education, transportation, natural
resources, and other/unallocable. The other/unallocable category is comprised of functions such as libraries, utilities and transit, and housing andcommunity development. For a complete description of how we collapsed the U.S. Census Bureau categories into seven functional categories, seeAppendix 1.
Florida Is Comparablein Most Areas to theAverage of the OtherNine States
8
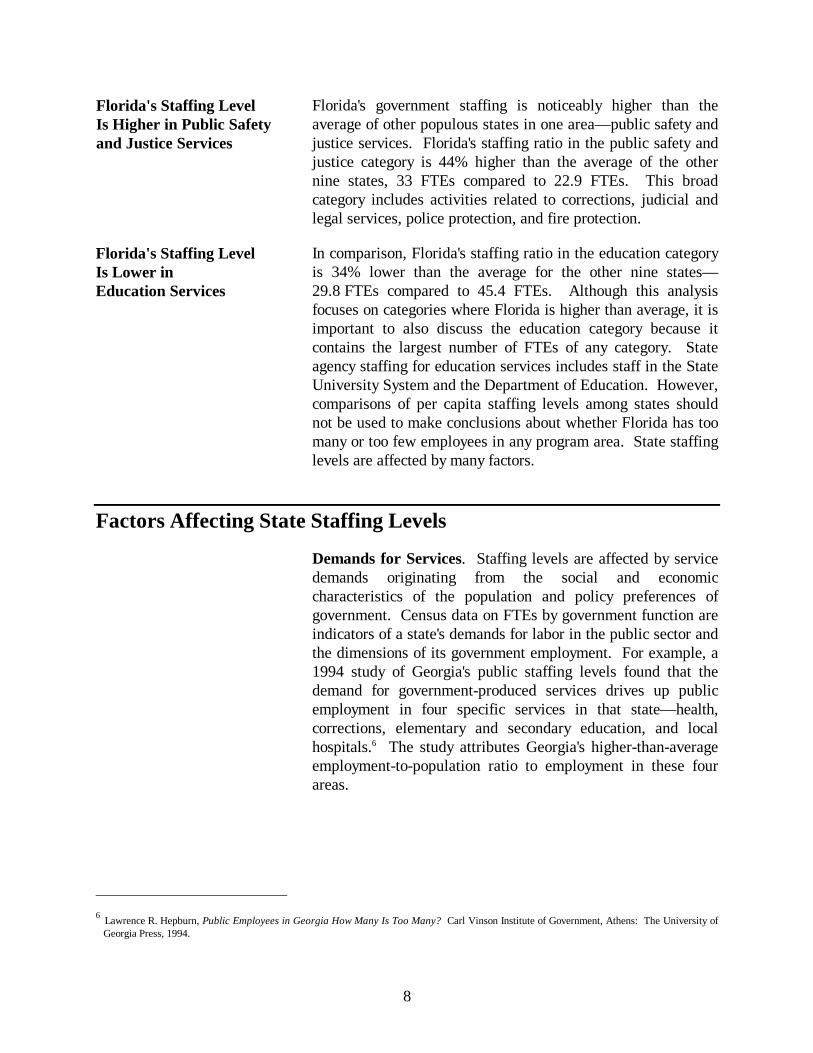
Florida's government staffing is noticeably higher than theaverage of other populous states in one area— public safety andjustice services. Florida's staffing ratio in the public safety andjustice category is 44% higher than the average of the othernine states, 33 FTEs compared to 22.9 FTEs. This broadcategory includes activities related to corrections, judicial andlegal services, police protection, and fire protection.
In comparison, Florida's staffing ratio in the education categoryis 34% lower than the average for the other nine states—29.8 FTEs compared to 45.4 FTEs. Although this analysisfocuses on categories where Florida is higher than average, it isimportant to also discuss the education category because itcontains the largest number of FTEs of any category. Stateagency staffing for education services includes staff in the StateUniversity System and the Department of Education. However,comparisons of per capita staffing levels among states shouldnot be used to make conclusions about whether Florida has toomany or too few employees in any program area. State staffinglevels are affected by many factors.
Factors Affecting State Staffing Levels
Demands for Services. Staffing levels are affected by servicedemands originating from the social and economiccharacteristics of the population and policy preferences ofgovernment. Census data on FTEs by government function areindicators of a state's demands for labor in the public sector andthe dimensions of its government employment. For example, a1994 study of Georgia's public staffing levels found that thedemand for government-produced services drives up publicemployment in four specific services in that state— health,corrections, elementary and secondary education, and localhospitals.6 The study attributes Georgia's higher-than-averageemployment-to-population ratio to employment in these fourareas.
6 Lawrence R. Hepburn, Public Employees in Georgia How Many Is Too Many? Carl Vinson Institute of Government, Athens: The University of
Georgia Press, 1994.
Florida's Staffing LevelIs Lower inEducation Services
Florida's Staffing LevelIs Higher in Public Safetyand Justice Services

9
Factors Affecting Florida's Public Safety and JusticeStaffing. As shown in Exhibit 3, Florida is above the averageof the other states in the public safety and justice servicecategory. The relatively higher ratio of FTEs stems fromdemands created by certain social, economic, and politicalconditions in the state. Florida's violent crime rate was thehighest in the nation in 1990 and in 1995. Moreover, theinmate population in Florida has almost doubled in the last 10years. Demand is also increased by tougher prison sentencingpolicies that have been adopted in recent years. For example,for offenses committed after October 1, 1995, inmates arerequired to serve a minimum of 85% of their sentences. Theaverage percentage of sentences served by inmates released inJune 1997 was 71%, compared to 34% in 1992. These types ofpolicy changes have increased demand in both the judicial andcorrections systems, which have tended to increase governmentstaffing in these areas.
Factors Affecting Education Staffing. As shown inExhibit 3, Florida is lower than the average of the other statesin staffing for education services. One factor affecting the staffratio was the 1994 reorganization of the Department ofEducation to reduce its size and to transfer decision-makingauthority and functions to the local level.7
As a result of this effort, department staff positions decreased633.5, from 1,548.5 in Fiscal Year 1994-95 to 915 in FiscalYear 1995-96. About half (330.5) of these positions weretransferred to other agencies. The remaining positions wereeliminated due to downsizing (132.5), decentralizing services(78), and eliminating contracted positions (92.5). In addition,the department significantly changed how it used its resources.Between Fiscal Years 1994-95 and 1995-96, the departmentincreased expenditures for purchased services by $4 million anddecreased expenditures for personnel by $4 million. Thedepartment's total decrease in expenditures between FiscalYears 1994-95 and 1995-96 was approximately $300,000.
7 A Review of the Department of Education's Use of Resources, OPPAGA Report No. 96-65, March 1997.
Florida Has High Demandsfor Staffing in PublicSafety and Justice
Florida's Relatively LowStaffing for EducationReflects Several Factors
Department of EducationHas Reduced Number ofPositions

10
A second factor influencing the state employment ratio is thestructure of Florida's postsecondary education system. With 28community colleges and 10 universities, Florida has designed asystem that makes its community colleges the main access pointto higher education. (The U.S. Census Bureau countscommunity college employees in Florida as local governmentemployees.) According to a Board of Regents (BOR)administrator, this unique design results in Florida having fewerstudents in the State University System than other states. Therelatively low university system student population is a factor inFlorida staffing levels for higher education.
A third factor that may indirectly affect the state employmentratio is the lower demand for public school services. Florida hasthe lowest percentage of school-age children compared to theother nine most populous states, which reduces the need forgovernment staffing in this policy area.
Local Government Staffing
Since each state allocates responsibilities differently betweenstate and local governments, some portion of the workforcecould be overlooked unless employment data for both state andlocal governments are included in the analysis.8 In Florida,local government employees comprise 75% of all publicemployees in the state. Examining local government staffingratios also helps determine to what extent, if at all, the state hasdelegated responsibilities to its local governments. Forexample, a similar study in Georgia showed that local hospitaljobs were the major reason why Georgia's public employmentexceeded the national average in 1991. To assess localgovernment staffing in Florida, we examined both localgovernment staffing and state-plus-local staffing levels.
Local Government Services and Funding. Florida's localgovernments deliver a variety of services including hospitals,police and fire protection, recreation and parks, public schools,and sewage and solid waste. Florida's local governmentsinclude counties, school districts, municipalities, andindependent special districts. The Florida Constitution grants
8 Lawrence R. Hepburn, Public Employees in Georgia How Many Is Too Many? Carl Vinson Institute of Government, Athens: The University of
Georgia Press, 1994.
Florida's Higher EducationSystem Excludes CommunityCollege Employees
11
local governments broad home rule powers to assess fees,service charges, and ad valorem taxes within certain limits. Inaddition, federal and state revenues serve as significant sourcesof revenues for local governments, although these sources havesteadily declined as a percentage of total local governmentrevenues since the early 1980s. Factors currently influencingthe revenues and expenditures of local governments includeincreases in the number of federal and state mandates on localgovernments and the need to expand services to accommodategrowth.
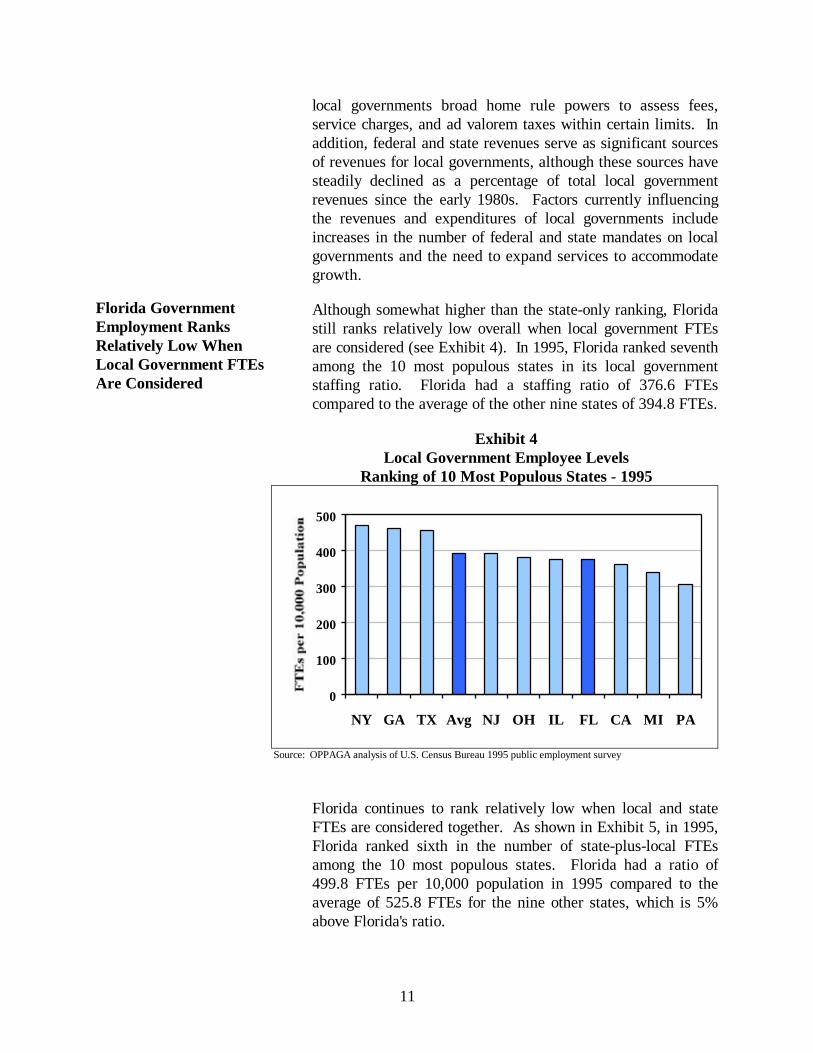
Although somewhat higher than the state-only ranking, Floridastill ranks relatively low overall when local government FTEsare considered (see Exhibit 4). In 1995, Florida ranked seventhamong the 10 most populous states in its local governmentstaffing ratio. Florida had a staffing ratio of 376.6 FTEscompared to the average of the other nine states of 394.8 FTEs.
Exhibit 4 Local Government Employee Levels
Ranking of 10 Most Populous States - 1995
0
100
200
300
400
500
NY GA TX Avg NJ OH IL FL CA MI PA
Source: OPPAGA analysis of U.S. Census Bureau 1995 public employment survey
Florida continues to rank relatively low when local and stateFTEs are considered together. As shown in Exhibit 5, in 1995,Florida ranked sixth in the number of state-plus-local FTEsamong the 10 most populous states. Florida had a ratio of499.8 FTEs per 10,000 population in 1995 compared to theaverage of 525.8 FTEs for the nine other states, which is 5%above Florida's ratio.
Florida GovernmentEmployment RanksRelatively Low WhenLocal Government FTEsAre Considered

12
Exhibit 5 State-Plus-Local Government Staffing Levels Ranking of 10 Most Populous States - 1995
0
100
200
300
400
500
600
700
GA NY TX NJ Avg OH FL IL MI CA PA
Source: OPPAGA analysis of U.S. Census Bureau 1995 public employment survey
When local FTE levels are compared to state FTE levels, thedifferences are small. As a result, there is no indication thatFlorida's relatively low overall rank of the state FTEs ismaintained at the expense of local governments. Florida's localFTEs by government function and its state-plus-localgovernment FTEs are higher than the nine-state averageprimarily in two areas: public safety and justice, and naturalresources.
As with the state FTE analysis, Florida's local governmentemployee ratio is higher than the average of the other ninestates, 61.5 compared to the average ratio of 57.8. Florida'sstate-plus-local ratio is also higher than the average, 94.5 FTEscompared to 80.7 FTEs for the other nine states.
When local FTEs are examined, Florida shows higher-than-average staffing in the natural resources service area. Thiscategory includes services related to conservation, promotionand development of natural resources, and parks and recreationservices. Exhibit 6 shows that Florida has a local governmentemployee staffing ratio of 14 compared to the nine-stateaverage of 9 FTEs. Exhibit 7 shows that Florida's state-plus-local government ratio is 19.9 compared to the nine-stateaverage of 15 FTEs.
Florida's State and LocalGovernment StaffingLevels Are Comparable
Higher in Public Safetyand Justice Services
Higher in NaturalResources Services

13
Including local government employment with state staffingbrings Florida's education staffing closer to the average of theother states. Florida's local government employee ratio is 193.4compared to the other nine states' average of 211.4. The state-plus-local government ratio is also lower, 223.2 compared to256.8 average for the other nine states.
Again, it is important that comparisons of per capitagovernment staffing levels among states not be used to makeconclusions about whether Florida has too few or too manypublic employees. As when analyzing state governmentstaffing, local government staffing levels are affected by manyfactors.
Exhibit 6Local Government Employee Staffing Levels by Government Service - 1995Florida Compared to the Average of the Other Nine Most Populous States
0
50
100
150
200
250
Education Public Safety andJustice
Health and SocialServices
Administration Natural Resources Transportation
Florida
Other Nine States
Source: OPPAGA analysis of U.S. Census Bureau 1995 public employment survey
Lower in EducationServices

14
Exhibit 7State-Plus-Local Government Employee Staffing Levels
By Government Service - 1995Florida Compared to the Average of the Other Nine Most Populous States
0
50
100
150
200
250
300
FL FL FL FL FL FL
State Local
Health andSocial
ServicesEducation
TransportationPublic Safetyand Justice
Natural Resources
Administration
Other States
Other States
Other States
Other States
Other States
Other States
Source: OPPAGA analysis of U.S. Census Bureau 1995 public employment survey
Factors Affecting Local Government Staffing
Many of the same factors identified under the state FTE sectionalso impact demand for local public safety and justice services.The higher-than-average FTE ratio stems from the states'emphasis on public safety and justice services. This emphasishas also increased the need for staffing in local governmentcorrections and judicial activities. Florida's state governmentand local governments combined place a relatively higherspending priority on corrections, fire protection, and policeprotection compared to other state and local governments in theU.S.9 This higher spending priority may impact the level ofFTEs in the public safety and justice category. Another factor
9 Features of Florida's Local Government Finances, Florida Legislative Committee on Intergovernmental Relations, 97-1, February, 1997.
Demands for Public Safetyand Justice ServicesIncrease Local GovernmentStaffing in These Areas

15
that may increase the number of local FTEs is the costassociated with the state court system. Most of the costs forthe state courts, such as courthouses and administrative supportare paid by local governments.
Florida's higher-than-average level of local government FTEs inthe natural resources category reflects consumer demands fornatural resources/parks and recreation services. Factors such asgrowth, tourism, and abundant natural resources help to createa demand for these services. A 1997 Florida LegislativeCommittee on Intergovernmental Relations report states thatFlorida's state government and local governments place arelatively higher spending priority than all other state and localgovernments in the U.S. combined on natural resources andparks and recreation services.10
Florida is among the fastest growing states in the nation.Population growth is directly linked to land development anduse, use of natural resources, and demand for services related tothese areas. Furthermore, Florida's largest industry is tourism,which is dependent on the state's abundant natural resources,and numerous parks and recreation areas.
Local government education services include activities relatedto public elementary and secondary schools and the communitycollege system. Demand for education services is a function ofthe population to be educated. The lower demand for publicschool services in Florida is linked to its proportionally smallerschool aged population. Exhibit 8 shows that in 1996, Floridahad the lowest percentage of school age children (5-17 agegroup) compared to the other nine states.
10 Ibid.
Lower Local GovernmentEducation Staffing IsLinked to ProportionallySmaller School AgePopulation
Growth, Tourism,Abundant NaturalResources Create Demandfor Local GovernmentStaffing

16
Exhibit 8School Age Population - 1996The 10 Most Populous States
0%
5%
10%
15%
20%
25%
TX MI CA GA IL Avg OH NJ NY PA FL
Source: OPPAGA analysis of U.S. Census Bureau data - current population reports - estimates as of July 1,1996
Thus, Florida's government staffing levels, when compared toother states, are relatively low and can be attributed to thecharacteristics of Florida's population and environment.

17
Chapter 3: Approaches for Assessing Appropriateness of Staffing Levels
Introduction
The U.S. Census Bureau data analysis provides usefulindicators of how Florida's staffing levels compare to otherstates. It can thus help identify areas where Florida’s staffing issignificantly higher or lower than other states. However, theU.S. Census Bureau information by itself is not particularlyuseful in determining whether Florida’s state agencies haveappropriate staffing levels. Assessing the appropriateness ofstaffing levels requires an examination of efficiency andeffectiveness which is dependent on information on programperformance, staffing, and cost. This information must bereliable and be able to be applied uniformly across programsand agencies.
Developing a sound approach to analyzing Florida governmentstaffing levels will require improvements to several state datasystems. Although comprehensive personnel data is availablethrough Florida's current systems, it cannot be uniformlyapplied across agencies or consistently integrated with budgetdata. The absence of pertinent and reliable historical budgetand performance data makes it difficult to examine staffinglevels. Moreover, two key systems, Florida's personnelclassification system and personnel information system, do notprovide the type of information needed for staffing analyses.
A Staffing Analysis Approach
By looking at how the private sector has traditionallyapproached questions of efficiency, we identified several typesof quantitative and qualitative approaches to analyzing staffing.From these approaches, we developed the following approach(Exhibit 11) which illustrates the three levels of analysesdescribed in this report and the types of data needed for eachlevel.
U.S. Census BureauInformation by Itself IsNot Particularly Useful inDetermining WhetherFlorida's State AgenciesHave AppropriateStaffing Levels

18
Tier 1 Analysis: This level is a broad, state-to-statecomparison using employee staffing levels as the basis forcomparison. It is based on U.S. Census Bureau data and can beused for limited purposes of comparing employee data acrossstates by government function. It should not be used toconclude whether Florida has too many or too few employeesin any program area, but can identify areas where more in-depthanalysis may be suggested.
Tier 2 Analysis: This level of analysis addressesagency-to-agency comparisons. This type of analysis dependson statewide information about program performance, staffing,and cost. It can be used to establish staffing ratios andbenchmarks for comparing across programs and agencies.OPPAGA's second report, to be issued in 1999, will use thislevel of analysis to establish benchmarks and staffing ratios foradministrative functions in state agencies. This level of analysiscan identify potential areas of under- or over-staffing thatshould be studied with precise analysis.
Tier 3 Analysis: This level of analysis uses more precisemethods that are applied to areas targeted for more criticalreview to assess the staffing needed to perform specific tasksand maximize the efficient use of resources.
Exhibit 11Staffing Analysis Methods
PotentialInformation Sources
PotentialApplications
Tier 1 U.S. Census Bureau publicemployment data
Stateto state
comparison
Indicates how Floridacompares to other states/
helps identify demandsfor services
Tier 2Performance measures,Classification data,Cost information
Agency to agencycomparison
Indicates how state agenciescompare to benchmarks and
ratios
Tier 3
Data envelopmentanalysis, linearprogramming,reengineering
Program/processes withparticular concerns
Determinesappropriate staffing
levels for areas ofconcern
Source: OPPAGA
19
Performance Information
Florida is in the forefront in bringing performance measurementinformation into the budget process to make funding andstaffing decisions.11 Until recent budgeting reforms, mostagencies had not maintained information demonstrating theeffectiveness of their programs and the efficiency of theiroperations. The absence of pertinent and reliable historicalbudget and performance data has made it difficult to address theneed to reduce spending where possible. The 1994Government Performance and Accountability Act establishedperformance-based program budgeting. PB2 will allowpolicymakers and managers to determine the resources neededto achieve intended outcomes, analyze employee-relatedstatistics, and ensure that staffing reductions are not made atthe expense of outcomes.
The ability to assess the reasonableness of state agency staffinglevels is critical under the PB2 initiative. The Legislature willhold agencies accountable for attaining specified levels ofperformance, but will not have as many traditional controls overagency spending and staffing levels. The Legislature providesagencies operating under PB2 with lump sum appropriations,giving agencies greater flexibility in allocating money, ratherthan specific line-item appropriations for agency salaries andbenefits, expenses, and operating capital outlay. While thisflexibility is beneficial, the budget process must also provide amechanism for assessing and justifying staffing levels. Severalimprovements are needed in order to make these staffingdeterminations.
Actions Needed to Improve Staffing Information
The ability to analyze and compare staffing levels is hindered bya lack of pertinent information. Two key systems, Florida'spersonnel classification system and personnel informationsystem lack integration, are incomplete and do not provide thetype of information needed to readily analyze agency andprogram level staffing. However, Florida is in the process ofredesigning both systems.
11 Performance-Based Program Budgeting in Context: History and Comparison, OPPAGA Report No. 96-77A, April 1997.
Performance-BasedProgram Budgeting (PB²)
Assessing Staffing NeedsIs Critical Under PB²
Agency-to-AgencyComparisons (Tier 2)

20
Personnel Classification System. Florida's Career Servicepersonnel system is complex, containing 1,513 job classes and86 different pay ranges; its basic structure lacks uniformity. Itis difficult to distinguish between classification levels within anoccupational group, such as the distinction between supervisoryand support positions. This distinction is important todetermine the ratios of supervisory and support personnel toline staff. The Career Service personnel system also excludessome state personnel, primarily the State University Systempersonnel, which make up 19% of the state's workforce. Giventhese limitations, the system is not a reliable source forobtaining uniform staffing information.
Florida is currently in the process of redesigning its personnelclassification system. In 1994, the Legislature gave theDepartment of Transportation (DOT) the authority to test amodel career service classification and compensation system.In 1997, the Legislature directed the Department ofManagement Services (DMS) to facilitate the statewideplanning of the career service broadbanding compensation andclassification system. A DMS task force is currently workingwith state agency personnel officers to develop a new system.However, two previous attempts to adopt a statewide systemhave been unsuccessful.12 Moreover, the task force has notreached consensus on how the new system should be structuredand the planned deadline is after the planned implementation ofthe new personnel information system.
Personnel Management Information System. As currentlydesigned, the state's personnel information system is a majorimpediment to developing useful statewide staffing information.The current system, the Cooperative Personnel EmploymentSubsystem (COPES), provides statewide data on employeesalaries, positions, and vacancies for the Career Servicepersonnel system. However, this system was not designed toprovide staffing information such as numbers of staff inadministrative, supervisory, or support functions. Moreover, itis almost prohibitively time-consuming to gather the data tocompare similar positions because agencies use different codingsystems. This requires a manual, line-by-line review of eachposition and discussions with agency personnel staff. Important
12First, DMS determined that the broadbanding model developed by DOT was not suitable for statewide implementation. Second, agency personnel
directors did not support the alternative proposed by DMS.
Redesign of Florida'sPersonnel ClassificationSystem Needs toBe Completed in aTimely Manner

21
data designating whether a position is supervisory is optionaland often not recorded in the system. Therefore, COPEScannot be readily used to determine the ratio of positions inthose types of functions to line staff or to establish benchmarksfor these functions across agencies.
Florida is currently in the process of reengineering its personneland payroll information systems through a joint projectinvolving the Executive Office of the Governor, the Departmentof Management Services, and the Department of Banking andFinance. The Florida Financial Management InformationSystem (FFMIS) will be a unified information system that willprovide personnel, management, and accounting support forstate decision-makers. The design of the new system isscheduled to begin in September 1998 and implementation on apilot basis is scheduled to end in the year 2000.13 Although oneof the purposes of the new system is to provide bettermanagement information, the specific types of managementreports will be determined during the design phase.
Administrative Component of PB2. In addition, the PB2
requirements need to be revised to include measures foradministrative functions. The 1994 PB2 legislation requires thateach agency provide the Executive Office of the Governor(EOG) with a list of programs and performance measures foreach program. Although the 1994 PB2 legislation does notspecifically exclude administrative functions, until recently theEOG did not require agencies to include their administrativefunctions in the PB2 process. In response to 1998 legislation,the EOG established a workgroup to develop performancemeasures for administrative and support functions. Measuresfor administrative functions should include benchmarks andratios related to staffing. OPPAGA's second report willcompare administrative functions and develop potentialbenchmarks.
Benchmarks and Staffing Ratios. Benchmarking is astructured approach for identifying the best practices fromindustry and government and comparing and adapting them tothe organization's operations. Benchmarking can range fromcomparing output per employee over time to comparing moreglobal measures of productivity or efficiency across an industry.
13The FFMIS will contain five subsystems: the Planning and Budgeting System, the Florida Accounting Information Resource, Cash Management
Subsystem, Purchasing System, and the Cooperative Personnel Employment Subsystem.
Reengineered PersonnelInformation SystemWill Provide BetterManagement Information
Agencies Should IncludeAdministrative Functionsin PB2
Agencies ShouldDevelop Benchmarksand Staffing Ratios

22
Staffing ratios can be used to compare the resources devoted tomanagement and support functions to direct program staff.These approaches can assist policymakers and managers inidentifying areas where staffing may be higher or lower whencompared to an average or a standard. Examples of staffingratios used by the public sector include number of students perteacher, number of welfare clients per caseworker, and staffingfor highway maintenance per mile of road.
Under traditional budgetary practices, agencies are not requiredto include standards or benchmarks to support existing FTEs intheir budget requests. In contrast, many private industries havestaffing standards for their activities. This is especially true forhighly similar and routine activities such as manufacturing andadministrative functions. These types of standards weredeveloped through the use of methods involving careful study,observation, and comparative analysis. Because privatecompanies and consulting firms that market benchmarks oftenconsider their staffing standards proprietary, private sectorstandards are difficult for state and local governments to obtain.The state will have to undertake similar studies in order todevelop the same types of staffing standards for comparabletypes of positions.
Actions Needed to Improve Cost Information
Accounting Information System. Florida also needs betterinformation on the costs of providing services and achievingdesired outputs and outcomes. In many programs, staffingrepresents the largest expenditure because most agencies arelabor intensive. Information on staff costs is necessary toadequately estimate the work to be performed or the outputs tobe produced. It would also be useful to know how an agencydetermines its administrative and operating costs.
A major barrier to the development of accurate and reliable costdata is the state's accounting information system, FloridaAccounting Information Resource (FLAIR).14 FLAIR does notaccount for costs by the types of programs the Legislatureestablishes under PB2. The system was also not designed toprovide staffing cost information.
14The Legislature changed the name of the State Automated Management Accounting System (SAMAS) to FLAIR in 1997.
Agencies ShouldDevelop Informationon Staffing Costs

23
The state is in the process of improving its cost accountingsystem as part of its development of the FFMIS. This newsystem needs to be linked to PB2. Knowing the cost of agencyprograms and activities, including its human resources costs,will help the Legislature consider performance in relation tobudgeting. This information will enable the state to make“make versus buy” decisions and compare its costs of providingservices to those of similar organizations and private sectorproviders. Cost accounting information managed electronicallyis critical for accurate and reliable measures of the cost toachieve desired outputs and outcomes.
Cost information will also enable the state to do more detailedanalyses of work processes using techniques such as businessprocess reengineering, activity-based costing, and linearprogramming. These types of quantitative methods can behelpful in determining why a program is not producing desiredresults and for identifying ways to improve efficiency.
More Precise Staffing Analysis Techniques
Employee-related statistics such as benchmarks and ratios andprogram-based cost information will help the Legislature andagency managers identify programs and processes for morecritical analysis. Selection criteria could include areas that areclearly underperforming or are overstaffed compared to similaragency functions. Once a program is targeted for furtherreview, more precise techniques can be used to analyze whetherresources are being used efficiently and to identify opportunitiesfor streamlining operations and staffing.
The techniques described below are not currently widely used instate agencies because they can be time-consuming, resourceintensive, and require good data. However, a leading expert ongovernment budgeting and management argues that mostgovernment activities can be measured by employing varyingmethodologies.15 He cites the time-reporting systems in effectfor engineers, architects, lawyers, researchers, and managementconsultants in the private and public sectors as evidence ofapplicability in the public sector.
15Donald Axelrod, Budgeting For Modern Government, 2nd edition, New York: St. Martin Press, Inc., 1995.
FFMIS Needs toBe Linked to PB²
Process-SpecificAnalysis (Tier 3)
Techniques Are Not WidelyUsed in State Agencies
24
We conducted a literature review and consulted experts in theuse of analytic techniques to identify some methods foraddressing staffing and general resource allocation questions.The techniques described below include both qualitative andquantitative methods that vary in terms of complexity andapplicability. The appropriate use of these techniques isdependent on the specific issues or questions that need to beaddressed.
Process Analysis techniques form the basis for othertechniques and are essential in using higher-level mathematicaltechniques. Process analysis involves a step-by-step analysis ofwork or business processes with the goal of simplifying andimproving the process. Both large and small processes can beincluded in the analysis. A process analysis can beaccomplished a number of ways including flowcharting, processmapping, and process inventorying. Process analysis involvesidentifying the starting and ending points, key inputs andoutputs, and the key customers and suppliers of the process.This analysis forms the basis for process reengineering.
Business process reengineering (BPR) provides theframework for the systematic rethinking and redesign ofbusiness core processes to bring about dramatic improvementsin performance, such as cost, quality, and speed.16,17 BPR beganas a private sector technique to help organizations improvecustomer service, cut costs, and become more competitive.BPR builds from several roots including strategic planning,quality management, participative management, and projectmanagement.18 The U.S. General Accounting Office issued aBPR guide in 1997 that identifies nine major issues that areconsidered to be the stepping stones to successful BPRimplementation.19 These issues cover a wide range of activities,such as identifying customer needs, reassessing strategic goals,and successfully implementing new processes. The BPRprocess starts with a high level assessment of the organization'smission, goals, and customer needs. After the high-level
16M. Hammer and J. Champy, Reengineering the Corporation, New York: Harper Collins Publishers, 1993.17A business process is a specific ordering of work activities across time and place, with a beginning, end, and clearly defined inputs and outputs that
deliver value to customers.18Sandra Hale, A. C. Hyde, editors, "Reengineering in the Public Sector," Public Productivity and Management Review, Vol. 18. No. 2, Winter
1994, 127-131.19United States General Accounting Office, Business Process Reengineering Guide, Version 3, May 1997.
Process AnalysisIs Basis for AllOther Techniques
BPR Results inRadical Changes
25
assessments, BPR includes a step-by-step analysis of core workprocesses.
BPR promises radical changes in performance (gains of 80% to85%). However, it is considered high-risk because it oftenrequires additional funding and can be difficult and timeconsuming to implement. Factors that can hinder successfulimplementation of BPR are the lack of data about performanceand costs, the lack of criteria for judging the value of processes,and the lack of workforce buy-in to change.20 Experts estimatethat implementing BPR requires a minimum timeframe of 9 to18 months. To determine an organization's readiness toundertake reengineering and to increase the likelihood ofsuccess, the U.S General Services Administration (GSA)recommends that organizations conduct a BPR readinessassessment.
Organizations that decide not to pursue BPR, but have a needfor organizational change, may prefer an alternative strategysuch as Business Process Improvement (BPI) or Total QualityManagement (TQM). These strategies are less radical processimprovement techniques and involve more incremental andgradual change. For example, BPI is considered to bemoderate-to-low risk and can help realize moderateperformance gains. It can be implemented in less than one yearand can impact a number of sub-processes. TQM is consideredto be low-risk, can be implemented within several months, anduses existing resources. However, these techniques do notusually result in dramatic improvements to performance.
Several state agencies have used reengineering to restructuretheir operations and improve efficiency. For example, Florida'sDepartment of Corrections (DOC) used TQM principles toestablish its quality improvement program, Correctional QualityManagerial Leadership. DOC has also established theEfficiency Through Innovation Program. The purpose of thisprogram is to ensure the department uses good businesspractices and innovative techniques in order to maximizelimited resources.
Queuing Modeling is a mathematical technique used to studywaiting lines and service processes. Waiting lines and service
20William R. Phillips, Bonnie L. Brown, C. Morgan Kinghorn, Andrew C. West, Public Dollars, Common Sense: New Roles for Financial
Managers, Coopers and Lybrand, 1997.
Several State AgenciesHave Used Reengineeringto Restructure Operations
Risks AssociatedWith BPR
Other Types ofReengineering
Queuing ModelsHave a Wide Range ofApplications

26
processes generally have three things in common: arrivals,servers, and the provision of service.21 Some typical examplesof services with waiting lines include courts, drivers' licensebureaus, health clinics, and tollbooths. Queuing models have awide range of application in public policy.22 Models identify theconsequences of various alternatives, but do not identify the"best" alternative. For example, in an analysis of toll bridgeoperations, a queuing model identifies the extent to whichadditional lanes will reduce driver wait time, but it does notidentify the "best" number of lanes that should be in operation.23
"Best" requires a choice that may be made on the basis of fundavailability or some other factor.
A 1986 project conducted by the Office of the AuditorGeneral's Performance Audit Division (now OPPAGA) used aqueuing model to examine the process used to issue drivers'licenses.24 The queuing model simulated the activities ofdrivers' license offices to test the effectiveness of various meansof improving office efficiency and reduce applicant-waitingtime. The study found that changes in the operations of one ofthe offices could significantly reduce waiting time if the officeimplemented a block appointment system, reallocated its staffamong work stations, and revised its procedures on which workstation examiners should assist when not busy.
Continuing with the example of prisons, queuing modelingcould be used to determine correctional officer scheduling inprisons. The objective would be to provide staff coverage thatis sufficient to ensure public safety, yet at minimum payrollcost. Some of the variables to consider in developing the staffschedule include post patterns (level of officer staffing) andshifts.
Activity-Based Costing (ABC) can be used to generatefinancial and operations information for improving processesand determining the appropriate budget and staffing foroperations. It is a cost allocation method that assigns costs toactivities as opposed to traditional allocation methods that
21Christopher K. McKenna, Quantitative Methods For Public Decision Making, New York: McGraw-Hill, 1980.22 Edith Stokey and Richard Zeckhauser, A Primer for Policy Analysis, New York: W.W. Norton Company, Inc., 1978.23Christopher K. McKenna, Quantitative Methods For Public Decision Making, New York: McGraw-Hill, 1980.24Performance Audit of the Management of Driver Licensing Program Operations and Workload by the Department of Highway Safety and
Motor Vehicles, Office of the Auditor General Report No. 10696, May 1986.
Activity-Based CostingMeasures ResourceConsumption by Activity

27
assign costs more broadly to products or services. The ABCanalysis involves identifying the activities within eachdepartment and why each activity is done, how often and forwhom the activity is performed, resources consumed in doingthe activity, and what factors determine or drive the activity orresource. One of the main advantages of ABC is that it can beused to determine indirect costs more accurately thantraditional allocation methods, which may hide or skew indirectcosts. Moreover, ABC allows financial and performanceinformation to be viewed by process or by organization.
Government entities can use ABC to improve efficiency andeffectiveness by redesigning processes or applying processimprovement techniques. A recent example is Iowa's use ofABC to analyze its Transportation Department paint crewoperations. ABC costing was used to provide total activitycosts and unit costs for the paint crews' major activities. Thisinformation was then used to determine ways to improve theefficiency and effectiveness of the activities including increasingrevenues and timeliness.25
Returning to our example of prisons, a potential application ofABC in Florida would be in a purchasing department of aprison. For a purchasing function, ABC identifies the costsassociated with specific activities, such as processing purchaseorders and updating files and with specific outputs. Thisinformation would allow prison managers to compare theircosts to other organizations and target areas for costreductions.
25Mark D. Abrahams and Mary Noss Requely, "Activity Based Costing: Illustrations from the State of Iowa," Government Finance Review, April
1998.

28
Linear Programming is a mathematical programmingtechnique for allocating limited resources among competinguses. This technique measures the relative efficiency of anorganization, agency, or program. Unlike queuing models,which provide a description of alternative solutions to aproblem, the purpose of linear programming is to find the bestalternative.26 Due to advances in data processing andinformation technology, linear programming is now widely usedin industrial and military operations, financial services, andmunicipal governments. Linear programming can be used tosolve a variety of problems that involve decisions regarding theallocation of limited resources. Examples of its use in thepublic sector include staff scheduling, school bus routing, andclient contact scheduling.
Linear programming can also be used to develop standardsagainst which one can compare an agency's actualperformance.27 Developing a standard consists of estimatingthe optimal level of performance, given the agency's technologyand environmental conditions. Estimating the optimal level ofperformance requires knowledge about laws affecting theagency, resource constraints, technology used, and the rate atwhich agency activities achieve objectives.
We believe that there are several activities within stategovernment that could be improved through the use of linearprogramming analysis. Linear programming is the most highlydeveloped and widely used of the various operations researchtechniques. In prisons, an example of the use of linearprogramming would be in examining high-cost services, such asfood service and health care. For food services, linearprogramming can specify a diet that meets nutritionalrequirements at a minimum total cost. For health care services,the technique could provide a means for minimizing cost inproviding emergency medical services.
Data Envelopment Analysis (DEA) is an analytical techniqueused to evaluate the performance of organizations and theiroperational processes. DEA is becoming an increasinglyvaluable tool in comparing similar organizations, particularly inthe public sector. Organizational units analyzed in DEA are
26Christopher K. McKenna, Quantitative Methods For Public Decision Making, New York: McGraw-Hill, 1980.27Gloria A. Grizzle, "Developing Standards for Interpreting Agency Performance: An Exploration of Three Models," Public Administration Review,
March/April 1984, 128-133.
Linear ProgrammingAllocates Limited ResourcesAmong Competing Uses
Data EnvelopmentAnalysis Is Useful inComparing Organizations

29
referred to as decision-making units (DMUs). A DMU can be amunicipal organization, a program, a contracted provider, or anagency.28 DEA has been used to make comparisons amongschools, human service agencies, court systems, and health careproviders.
The central purpose of DEA is to explain how each DMU isperforming relative to others and how its performance can beimproved. DEA provides insight into the relative efficiency oforganizations and identifies organizations using best practicesand organizations using poor practices. This allowsmanagement to know which units to focus on for improvementand to monitor improvements over time. DEA can alsocalculate the amount of resources that could be saved or theamount of additional output or outcome that could be producedthrough improved efficiency.
Although DEA is a powerful analytical tool, its greatestweakness is its complexity. Given its complexity and thenumber of variables that can be included in the analysis, DEA ishighly susceptible to measurement error. Failure to include avalid input or output will bias the results so that some units willappear to be more efficient than they really are. DEA is alsohighly dependent on the availability of reliable data; all inputsand outputs have to specified and measured. These limitationsstress the importance of planning and qualitative assessmentthroughout the analysis.
DEA would be useful in Florida for comparing multipleproviders of a similar service. For example, the technique couldbe applied in comparing identical tasks within public and privateprisons. Specific factors that could be compared to assist indecision-making include efficiency, quality, and effectiveness.
Performance measurement information will become increasingsignificant to Florida government and the Legislature in thecoming years. Performance information has implications forbudgeting, granting, contracting, and other resource allocationdecisions. Policymakers and agency managers will needimproved analytic tools to use performance informationeffectively. These tools range from simple comparisons such asthe use of ratios to more powerful techniques such as DEA.
28Ronald C. Nyhan and Lawrence L. Martin, "Performance Measurement and Multiple Provider Comparisons," Annual Meeting American Public
Administration Society, July 1997, Philadelphia.
Summary

30
These analytic tools are dependent, to a large extent, on reliableperformance data and information systems. As discussedpreviously in this report, the state's personnel and financialinformation systems are in the process of being redesigned.Improved data from these sources will be critical to conductingcomparative analysis between state agencies. We believe thatusing these analytical tools can produce significantimprovements in the operation of Florida government.

31
Chapter 4: Conclusions andRecommendations
Florida's staffing levels rank relatively low when compared toother states. Moreover, the staffing levels for most types ofgovernment services tend to be comparable with other states.Florida's state agency staffing levels exceed other states'primarily in the public safety and justice services area. Whenlocal government full-time equivalent (FTE) positions are addedto the analysis, Florida shows higher-than-average staffinglevels in the natural resources services area.29 These levels mustbe interpreted with caution because they are linked to uniquesocial, economic, and political factors in the state that havecreated demands for labor in these service areas.
However, the U.S. Census Bureau data analysis should not beused to make conclusions about whether Florida's staffing levelsare appropriate. The census data analysis cannot answer thequestion of whether Florida's government staffing levels are toohigh or too low in any area. Such assessments require anexamination of individual program efficiency and effectivenessand is dependent on information about program performance,staffing, and cost.
The ability to assess state agency staffing is particularly criticalunder Florida's new budget reform initiative. Performance-based budgeting (PB2) establishes performance measures andprovides a mechanism for holding agencies accountable foroutcomes. However, PB2 needs to be expanded to includemeasures for administrative functions.
In order to develop good systems for analyzing agency staffinglevels, Florida will require significant improvements in itspersonnel information systems. These systems will also need tobe integrated with budget and accounting systems. The state'smajor sources that support staffing-related information, thepersonnel classification system and the personnel information
29The U.S. Census Bureau computes the statistic, full-time equivalent employee, to control for the variation in full-time and part-time workers. This
statistic is calculated by dividing the “part-time hours paid” by the standard number of hours for full-time employees and then adding the resultingquotient to the number of full-time employees.
Census Data AnalysisCannot Answer theQuestion of WhetherFlorida's GovernmentStaffing Levels AreToo High or Too Lowin Any Area

32
system, do not currently provide the type of information neededto accurately and uniformly assess staffing. Florida's CareerService personnel system is too complex and excludes somestate personnel, primarily employees of the State UniversitySystem (SUS) which comprise 19% of all state employees. Thestate's personnel information system was not designed toprovide staffing information such as the number inadministrative, support, and supervisory functions. Moreover,the state's accounting system does not collect cost informationby PB2 program or by activity. The state is in the process ofredesigning all of these systems. In order for the new systemsto be of optimal use in decision making, the systems will needto provide reliable and accurate personnel and cost informationthat is compatible with PB2.
We recommend the following actions.
• The Governor's Office should continue to work with stateagencies to develop measures for administrative andsupport activities in their performance-based budgets. Theeffort should include output measures such as staffing ratiosand overhead ratios and should define both administrativeand support activities to ensure comparability betweenagencies. OPPAGA's second report on staffing issues willprovide a basis for such measures. Without thisinformation, a large portion of state activities and costs willbe excluded from the PB2 process.
• The new personnel classification and compensation systemneeds to be developed and incorporated as part of thedesign of the Florida Financial Management InformationSystem (FFMIS). The FFMIS design process is scheduledto begin in September. To ensure that the FFMIS includesthe new personnel classification system, the Department ofManagement Services (DMS) and the state agencypersonnel directors need to establish a more timely deadlinefor the completion of the statewide personnel classificationsystem. In establishing the deadline, DMS should consultwith the FFMIS project coordinators. The Legislatureshould intervene in the event these agencies fail to establishan appropriate time frame for developing the new personnelsystem.

33
• The Legislature needs to ensure that the FFMIS is designedso that it will provide the type of staffing and costinformation described in this report and envisioned underPB2. Knowing the cost of agency programs and activities,including its human resources costs, is a major componentto the success of Florida's PB2 efforts. This type ofinformation is also needed to support more precise staffinganalysis techniques such as data envelopment analysis andlinear programming.
• In order for policymakers and agency managers to makedecisions about staffing levels, data is needed on the totalFTEs in the state. Not all of Florida's state employees arecurrently required to be included in the new personnelclassification system or the FFMIS. While the careerservice system exemptions may be appropriate, the SUSshould be responsible for reporting FTEs according tostandard, broad classification categories. Further study isneeded to determine how the SUS could participate in thenew personnel classification and information systems.

34
This page intentionally left blank.

35
Appendix
A. U.S. Census Bureau Functional Categories........................................................................37

36
This page intentionally left blank.

37
Appendix A
U.S. Census Bureau Functional Categories
The following shows the specific public employment functions used by the U.S. Census Bureauthat are included under the seven major categories used in the report.
Functional Category Public Employment Functions
Administration Financial AdministrationCentral Administration
Public Safetyand Justice
CorrectionsJudicial and LegalPolice Protection – OfficersPolice Protection – OtherFire Protection
Health andSocial Services
HospitalsPublic WelfareHealthSocial Insurance Administration
Education Higher Education – OtherHigher Education – InstructionalElementary and Secondary Education – OtherElementary and Secondary Education – InstructionalOther Education
Transportation Highways
Natural Resources Natural ResourcesParks and Recreation
Other Other and Unallocable (includes libraries and state liquor stores)Utilities and TransitHousing and Community Development
Source: OPPAGA's categorization of U.S. Census Bureau Information