ANALYZING CURRENT TREND FOR CUSTOMER PREFERENCE TO A PARTICULAR DTH BRAND WITH EMPHASIS ON QUALITY...
15
ANALYZING CURRENT TREND FOR CUSTOMER PREFERENCE TO A PARTICULAR DTH BRAND WITH EMPHASIS ON QUALITY AND SERVICES. Submitted By: Mukul Dabas 07613701710 BBA VI M1
-
Upload
catherine-banks -
Category
Documents
-
view
222 -
download
1
Transcript of ANALYZING CURRENT TREND FOR CUSTOMER PREFERENCE TO A PARTICULAR DTH BRAND WITH EMPHASIS ON QUALITY...

ANALYZING CURRENT TREND FOR CUSTOMER PREFERENCE TO A PARTICULAR DTH BRAND WITH EMPHASIS ON QUALITY
AND SERVICES.
Submitted By:Mukul Dabas07613701710BBA VI M1

What is DTH
DTH is an acronym for ‘Direct to Home’ service. DTH is a digital satellite service that provides television viewing services directly to subscribers through satellite transmission anywhere in the country.

MAJOR PLAYERS IN INDIA
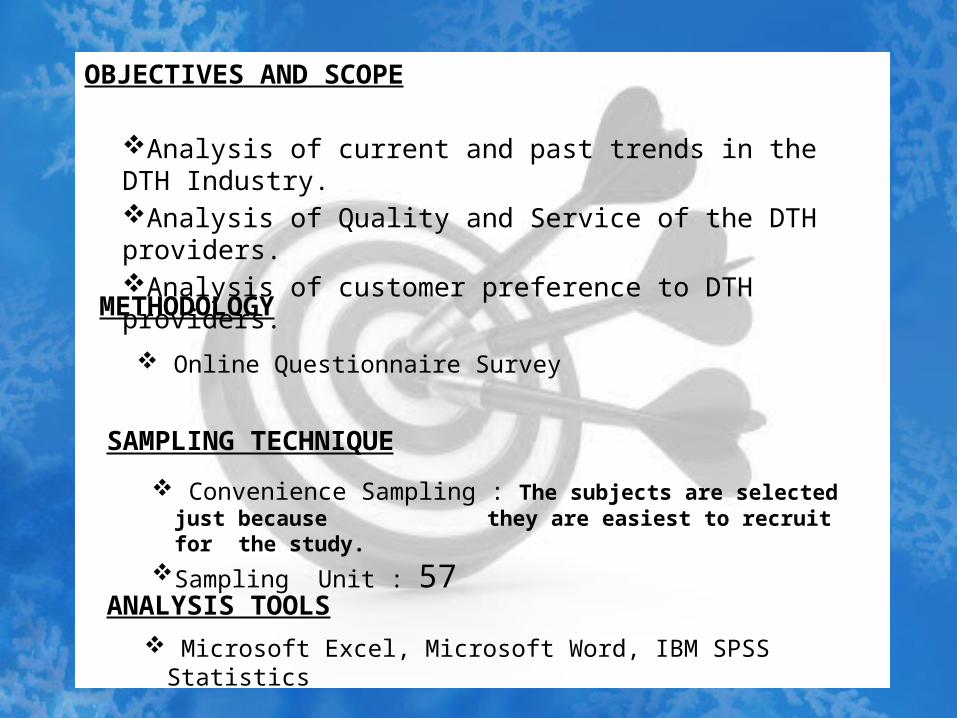
OBJECTIVES AND SCOPE
Analysis of current and past trends in the DTH Industry.Analysis of Quality and Service of the DTH providers.Analysis of customer preference to DTH providers.
METHODOLOGY
Online Questionnaire Survey
SAMPLING TECHNIQUE
Convenience Sampling : The subjects are selected just because they are easiest to recruit for the study.
Sampling Unit : 57ANALYSIS TOOLS
Microsoft Excel, Microsoft Word, IBM SPSS Statistics
DATA ANALYSIS & INTERPRETATION

Demographics are the quantifiable statistics of a given population. Demographics is also used to identify the study of quantifiable subsets within a given population which characterize that population at a specific point in time.
These types of data are used widely in public opinion polling and marketing. Commonly examined demographics include gender, age, ethnicity, knowledge of languages, disabilities, mobility, home ownership, employment status, and even location.
DEMOGRAPHIC DETAIL

Types of Questions
Multiple Choice Questions
Rating Scale
A rating scale is a set of categories designed to elicit information about a quantitative or a qualitative attribute.
Likert scale
A Likert scale is a psychometric (physiological measurement) scale commonly involved in research that employs questionnaires. It is the most widely used approach to scaling responses in survey research, such that the term is often used interchangeably with rating scale, or more accurately the Likert-type scale.

Frequency Percent
Below 1
1 – 3 Years
3 – 5 Years
Over 5 Years
Total
610.5
2035.1
2442.1
712.3
57 100.0
Below
1 Y
ear
1 - 3
Yea
rs
3 - 5
Yea
rs
Ove
r 5 Y
ears
0
10
20
30
Years Sub-scribed to by Respondents
Number of Respondent
10.5
35.142.
1
12.3
Percentage of Respondents
Below 1 Year
1 - 3 Years
3 - 5 Years
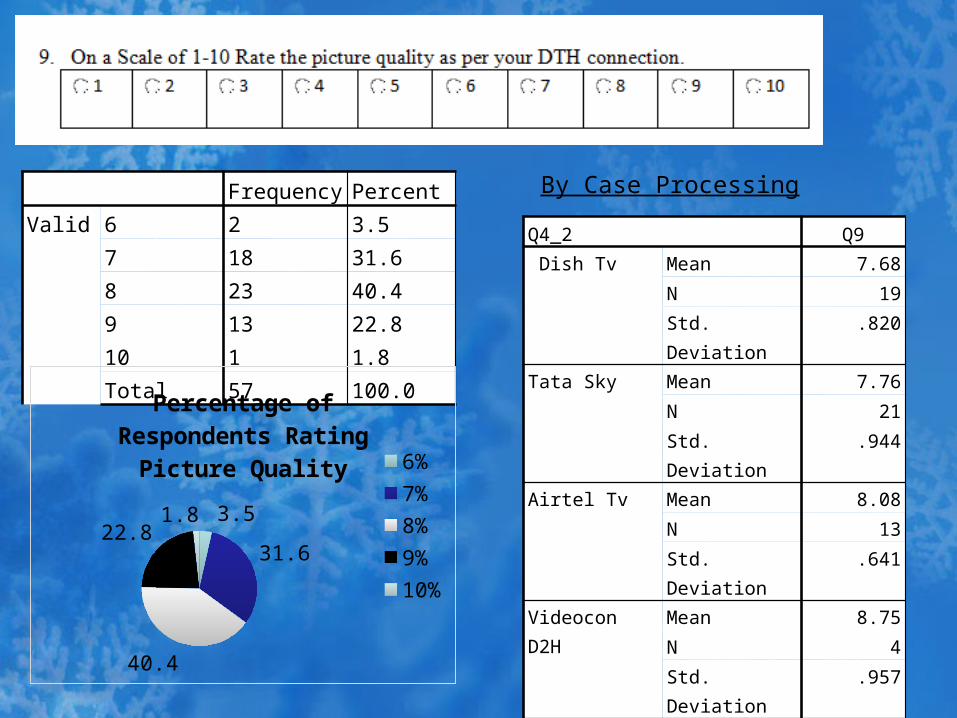
Frequency PercentValid 6 2 3.5
7 18 31.68 23 40.49 13 22.810 1 1.8Total 57 100.0
3.5
31.6
40.4
22.81.8
Percentage of Re-spondents Rating Pic-
ture Quality 6%7%8%9%10%
Q4_2 Q9 Dish Tv Mean 7.68
N 19
Std. Deviation .820
Tata Sky Mean 7.76
N 21
Std. Deviation .944
Airtel Tv Mean 8.08
N 13
Std. Deviation .641
Videocon D2H Mean 8.75
N 4
Std. Deviation .957
Total Mean 7.88
N 57
Std. Deviation .867
By Case Processing

Frequency PercentLow
Neutral
High
Very High
Total
11.8
3764.9
1628.1
35.3
57100.0
1.8
64.9
28.1
5.3
Percentage of Respon-dents Rating Cost of
Service
LowNeutralHighVery High

Q4_2 * Q13 Crosstabulation
Q13
TotalMonthl
yHalf
yearly YearlyQ4_2 Dish Tv Count 16 1 2 19
% within Q4_2
84.2% 5.3% 10.5% 100.0%
Tata Sky Count 19 1 1 21
% within Q4_2
90.5% 4.8% 4.8% 100.0%
Airtel Tv Count 11 1 1 13
% within Q4_2
84.6% 7.7% 7.7% 100.0%
Videocon Count 3 1 0 4
% within Q4_2
75.0% 25.0% .0% 100.0%
Total Count 49 4 4 57
% within Q4_2
86.0% 7.0% 7.0% 100.0%

Group Statistics
Q1 N Mean Std. Deviation Std. Error Mean
Cost of Service Male 33 3.42 .663 .115
Female 24 3.29 .550 .112
Customer Service Male 33 2.97 .174 .030
Female 24 3.08 .504 .103
Subscription Offers Male 33 3.09 .678 .118
Female 24 3.29 .550 .112
Value added Services Male 33 2.91 .579 .101
Female 24 3.00 .659 .135
Variety of Channels Male 33 3.82 .584 .102
Female 24 3.50 .511 .104
Promotional strategies Male 33 2.91 .579 .101
Female 22 2.68 .477 .102
T-Test Analysis

CONCLUSIONS
RESULTS • PREFERRED NAME IS DISH TV• DUE TO HABIT CUSTOMERS WILL NOT CHANGE
SERVICE PROVIDERS• NEED TO INCREASE PROMOTIONAL ACTIVITIES• MONTHLY INSTALLMENTS IS MOST LIKELY THE
SUBSCRIPTION PERIOD• COST MAY BE HIGH YET PEOPLE PAY TO RECEIVE
CERTAIN QUALITY OF PICTURE, SOUND AND ADDITIONAL FEATURES.
• BAD WEATHER IS A PROBLEM FOR THESE SERVICE PROVIDERS.
• THERE ARISES A NEED FOR SERVICE PROVIDERS TO EDUCATE THEIR CUSTOMERS ON THE FEATURE AVAILABLE TO THEM.

LIMITATIONS
SCOPE FOR FURTHER STUDY COLLECTION OF MORE DATA, INCREASING THE
SAMPLE SIZE. COLLECTION OF DTH PROVIDERS IS LIMITED TO
JUST 4 (DISH TV, TATA SKY, AIRTEL DIGITAL TV AND VIDEOCON D2H) INCLUSION OF OTHER BRANDS MAY BRING LIGHT NEW AND IMPROVED FINDINGS/RESULTS.
RESPONDENTS IN CLUSTERS SHOULD NOT BE TARGETED AND HENCE MUST BE SPREAD OUT OVER A CITY TO GET AN OVERALL GEOGRAPHIC COMPARISON TAKING INTO CONSIDERATION MORE FACTORS SUCH AS LOCALITY, DENSENESS ETC
QUESTIONS COULD HAVE BEEN FILLED BY A PERSONAL INTERVIEW TO DIMINISH THE INDIFFERENCE IN THE MINDS OF THE RESPONDENTS.
MICRO LEVEL STUDYSAMPLE SIZE IS SMALL TO AGGREGATE THE MASS
POPULATIONTIME CONSTRAINTNOT AWARE ABOUT THE HONESTLY OF THE
RESPONDENT WHILE FILLING THE SURVEY