Analytical Modeling of Emulsion Flow at the Edge of Steam … · Different models have been...
69
Analytical Modeling of Emulsion Flow at the Edge of Steam Chamber During SAGD Process by Mahdie Mojarad A thesis submitted in partial fulfillment of the requirements for the degree of Master of Science in Petroleum Engineering Department of Civil and environmental Engineering University of Alberta © Mahdie Mojarad, 2015 Page 1 of 69
Transcript of Analytical Modeling of Emulsion Flow at the Edge of Steam … · Different models have been...

Analytical Modeling of Emulsion Flow at the Edge of Steam Chamber During SAGD Process
by
Mahdie Mojarad
A thesis submitted in partial fulfillment of the requirements for the degree of
Master of Science
in Petroleum Engineering
Department of Civil and environmental Engineering University of Alberta
copy Mahdie Mojarad 2015
Page 1 of 69
Abstract Different models have been proposed to describe two- and three-phase flow at the
edge of a steam chamber developed during a SAGD process However two-
dimensional scaled SAGD experiments and recent micro model visualizations
demonstrate that steam-condensate is primarily in the form of microbubbles
dispersed in the oil phase (water-in-oil emulsion) Therefore the challenging
question is Can multiphase Darcy equation be used to describe the transport of
water as a discontinuous phase Furthermore the physical impact of water as a
continuous phase or as microbubbles on oil flow can be different Water
microbubbles increase the apparent oil viscosity while a continuous water phase
decreases the oil relative permeability Investigating the impact of these two
phenomena on oil mobility at the steam chamber edge and on overall oil
production rate during a SAGD process requires development of relevant
mathematical models that is the focus of this thesis
In this thesis we develop an analytical model for lateral expansion of steam
chamber that accounts for formation and transport of water-in-oil emulsion both in
single and two phase flow It is assumed that emulsion is generated due to
condensation of steam which is penetrated into the heated bitumen The emulsion
concentration decreases from a maximum value at the chamber interface to zero far
from the interface The oil viscosity is affected by both temperature gradient due to
heat conduction and microbubble concentration gradient due to emulsification We
conduct a sensitivity analysis by using the measured data from scaled SAGD
experiments The sensitivity analysis shows that by increasing the value of m
(temperature viscosity parameter) the effect of emulsification on oil flow rate
decreases It also shows that the effect of temperature on oil mobility is much
stronger than that of emulsion We also compare the model predictions with field
Page 2 of 69
production data from several SAGD operations Butlerrsquos model overestimates oil
production rate due to single-phase assumption while the proposed model presents
more accurate oil flow rate supporting the fact that emulsification effect should be
included in the SAGD analysis
Page 3 of 69
Dedication
Dedicated to my beloved family
for their endless love and support
Page 4 of 69
Acknowledgment I would like to express my sincere gratitude to my supervisor Dr Hassan
Dehghanpour for his trust and confidence in me and for the direction and
encouragement throughout the course of this work His invaluable guidance and
personal characteristics have inspired me to question and learn He has provided
me so much more assistance than deserved
I would also like to thank all the members of our group particularly Ali Ashkan
Mahmood and Obina for their support
My love and special thanks go to my family
Page 5 of 69
Table of Content Abstract 2
Dedication 4
Acknowledgment 5
Table of Content 6
List of Tables 9
List of Figures 10
1 Chapter One Introduction 11
11 Heavy Oil and Oil Sands 11
12 In-situ Extraction of Heavy Oil 12
121 Non-thermal Recovery Methods 12
122 Thermal Recovery Methods 12
1221 Steam-Assisted Gravity Drainage and its Variants 14
1222 Original SAGD Concept 14
13 Motivation 16
14 Specific Objectives of this Research 16
15 Thesis Outline 17
2 Chapter Two Literature Review 18
21 Overview 18
22 Analytical Modelling of Steam-Assisted Gravity Drainage (SAGD) 20
221 Butler Single Phase Model 20
222 Other Variants of Butlerrsquos Models 22
223 Sharma and Gatesrsquo Multiphase Model 24
3 Chapter 3 Emulsions in SAGD 27
31 Definitions 27
32 Emulsion Characteristics 27
321 Droplet Size 27
322 Viscosity 28
323 Color and appearance 31
33 Emulsion Stability 31
331 Steam Quality 32
332 Temperature 32
Page 6 of 69
333 Initial Water Saturation 33
334 Rate of Steam Injection 33
335 Oil Production Rate 34
336 Pressure 34
337 pH 34
338 Droplet Size 34
339 Heavy Fraction in Crude Oil 35
3310 Solid particles 35
3311 Counter current flow 35
34 Thermodynamics of Emulsion 35
4 Chapter 4 Single Phase Analytical Modeling of SAGD 37
41 Proposed Theory 37
411 Total oil flow rate 40
412 Darcyrsquos law 41
413 Material balance 42
414 Energy Balance 25
42 Model Results 43
421 Model Verification 43
422 Sensitivity Analysis 47
43 Dynamic Emulsion Viscosity 47
44 Emulsion Mobility 47
45 Volumetric Oil Flux 48
46 Field data analysis 48
5 Chapter 5 Two Phase Analytical Modeling of SAGD 53
51 Proposed Theory 53
511 Total oil flow rate 55
512 Darcyrsquos law 55
52 Model Result 57
521 Model Verification 57
522 Sensitivity Analysis 57
523 Emulsion Mobility 57
524 Field data analysis 58
6 Chapter 6 Conclusion 62
Page 7 of 69
BIBLIOGRAPHY 65
Page 8 of 69
List of Tables Table 1 Parameters from Sasaki et al (2001) Experimental Data 45 Table 2 Comparison of SAGD models for different field operations data 51
Page 9 of 69
List of Figures Figure 1 Distribution of the total world oil reserves (Oilfield Review May 2008) 12 Figure 2 Viscosity of Athabasca bitumen versus temperature (Mehrota and Svrcek 1986) 13 Figure 3 Cross-sectional view of Steam Assisted Gravity Drainage (SAGD) 15 Figure 4 Viscosities of very tight emulsions at 125deg F (Kokal 2005) 29 Figure 5 Pore-scale illustration of fluid occupancies (water oil) at the edge of steam chamber (a) WO emulsion SAGD (b) traditional SAGD (Ezeuko et al 2013) 29 Figure 6 Schematic illustration of temperature dispersed and continuous phase volume fraction emulsion concentration and emulsion viscosity with respect to the distance beyond the steam chamber edge (ε ) 39 Figure 7 Cross sectional view of a typical SAGD process and expanded view of a differential element at the edge of steam chamber (modified from Sharma and Gates 2010) 40 Figure 8 Comparison of oil phase mobility from Butlerrsquos and the current theory with respect to distance beyond the edge of a steam chamber using Sasaki et al (2001) experimental data (a) with no temperature effect (b) with no emulsion effect 44 Figure 9 Comparison of emulsion mobility with respect to ε from Butlerrsquos Sharma and Gatesrsquo and the proposed model using Sasaki et al (2001) experimental data 46 Figure 10 Dynamic Viscosity of pure bitumen and emulsion with respect of distance beyond edge of steam chamber for different values of (a) m and (b) α 47 Figure 11 (a) Effect of temperature viscosity parameter (m) (b) thermal diffusivity (α) and (c) water viscosity (microw) on oil mobility with respect to distance beyond the edge of the steam chamber 49 Figure 12 Effect of (a) thermal diffusivity (b) advance velocity of steam chamber (c) temperature viscosity parameter and (d) water viscosity on volumetric oil flux profile for Christina Lake reservoir 50 Figure 13 Comparison of SAGD models for different field operations data 51 Figure 14 Schematic illustration of emulsion concentration continuous phase water saturation oil mobility and probability of emulsion formation function with respect to the distance beyond the steam chamber edge (ε ) 54 Figure 15 Comparison of oil mobility in different models 59 Figure 16 (a) Effect of temperature viscosity parameter (m) (b) thermal diffusivity (α) and (c) water viscosity (microw) on oil mobility with respect to distance beyond the edge of the steam chamber 60 Figure 17 Comparison of SAGD models for different field operations data 61
Page 10 of 69
1 Chapter One Introduction
In this chapter an overview of Canadarsquos heavy oil distribution and related recovery methods are described Motivations objectives and outline of the thesis are discussed in the chapter as well
11 Heavy Oil and Oil Sands Unconventional sources of oil such as heavy oil and oil sands (tar sands) are important hydrocarbon resources that play an increasingly important role in the oil supply of the world Figure 1 shows the distribution of the world oil resources The amount of total unconventional oil is about three times the amount of conventional oil in place which is about 3 trillion barrels worldwide discovered today Conventional oil is defined as oil with an API gravity of 25deg or higher while unconventional oil which includes heavy oil and oil sands crude is characterized by high viscosity and density at reservoir conditions heavy oil (μ~100minus10000 cp ρsim20degminus10degAPI gravity) and oil sands (μ gt 10000 cp ρ lt 10degAPI gravity) Most heavy oil occurs in shallow (1000 m or less) high permeability (1 to 7 Darcy) high porosity (around 30) poorly consolidated sand formations (Farouq Ali 2008) The oil saturations are typically high (50minus80) and formation thicknesses are 10 to several meters (Farouq Ali 2008) Canada does not have much conventional crude but it does have huge quantities of oil sands and heavy oil More than half of Canada oil production is from oil sands Alberta oil sands contain about two trillion barrels of recoverable heavy oil and bitumen most of it with in-situ viscosities in the hundreds of thousands to millions of centipoise (cp) at reservoir conditions The efficient and economic recovery method is a major challenge (Sharma and Gates 2010)
Page 11 of 69
12 In-situ Extraction of Heavy Oil Conventional recovery methods are rarely applicable in high viscosity and low solution gas content which are the characteristics of heavy oil and oil sands Primary recovery factors are low averaging about 5 of the oil-in-place (Farouq Ali 2008) Recovery processes include thermal and non-thermal methods
121 Non-thermal Recovery Methods Non-thermal heavy oil recovery techniques can be considered for moderate viscous oils (50-200 cp) thin formations (lt9 m) low permeability (lt 1 Darcy) and large depths (gt 900 m) Non-thermal methods help to increase the recovery by several different mechanisms like reducing the viscosity of the oil increasing the viscosity of the displacing fluid altering wettability of the rock or reducing interfacial tension The non-thermal methods include polymer flooding surfactant flooding water flooding caustic and emulsion flooding light hydrocarbon flooding and carbon dioxide flooding Overall non-thermal methods have been only marginally successful and not cost-effective for recovering heavy oil (Ahmed et al 2014)
Figure 1 Distribution of the total world oil reserves (Oilfield Review May 2008)
122 Thermal Recovery Methods
Page 12 of 69
The two required steps in any bitumen recovery process are 1) Make the oil sufficiently mobile 2) Provide a driving force to move the mobile oil into a production wellbore For example the driving force can be from an imposed pressure difference or gravity drainage water drive or solution-gas drive or combinations of them If one of these steps is not met then the production would fail Thermal techniques increases oil mobility by reducing oil viscosity with heating For example Figure 2 shows the viscosity drops of Athabasca bitumen when temperature increases At initial reservoir conditions (temperature typically between 7 and 15degC) the viscosity is in the millions of centipoise Above about 200degC the viscosity is less than 10 cp To achieve this many processes including Cyclic Steam Stimulation (CSS) steam flooding and Steam-Assisted Gravity Drainage use steam injection into the formation A certain fraction of the latent and sensible heat of the injected steam is transferred to the oil sands which heats the bitumen and consequently lowers its viscosity Other methods for heating the oil include underground combustion such as in in-situ combustion process hot water flooding and electrical heating (Mehrota and Svrcek 1986)
Figure 2 Viscosity of Athabasca bitumen versus temperature (Mehrota and Svrcek 1986)
Page 13 of 69
1221 Steam-Assisted Gravity Drainage and its Variants Steam-Assisted Gravity Drainage (SAGD) is the main choice to recover bitumen from shallow reservoirs where solution gas content is low and vertical permeability is not significantly impaired It piloted in Athabasca and Cold Lake reservoirs in Alberta (Komery Luhning and Pearce 1999 Butler 1997a Kisman and Yeung 1995 Ito and Suzuki 1996 Ito Hirata and Ichikawa 2004 Edmunds and Chhina 2001 Suggett Gittins and Youn 2000 ERCB website 2007) and is being used as a commercial technology to recover bitumen in several Athabasca reservoirs (Yee and Spargo 2001 Farouq Ali 1997) The pilots demonstrated that SAGD is effective and has the potential for similar scale success in other high viscosity high permeability oil sands deposits around the world SAGD has a number of advantages compared with conventional surface mining extraction techniques or other thermal recovery methods For example SAGD offers significantly higher production rates per well lower injection pressures higher reservoir recovery steam override elimination and continuous production
1222 Original SAGD Concept Roger Butler and his coworkers at Imperial Oil were the first ones who proposed SAGD in the late 1970rsquos (Butler McNab and Lo 1981 Butler and Stephen 1981 Butler 1985) Figure 3 shows the cross-section of a typical SAGD chamber In the reservoir steam flows from the top horizontal injection well into a chamber
Page 14 of 69
Figure 3 Cross-sectional view of Steam Assisted Gravity Drainage (SAGD)
The production well is typically located a few meters above the base of the oil column whereas the injection well is located between 5 and 10 meters above the production well A liquid saturation at the base of the chamber surrounds the production well and acts as a steam trap preventing injected steam from being directly produced from the reservoir Typically the lengths of the injection and production wells are between 500 and 1000 m Since the dominant drive mechanism of SAGD is gravity relatively shallow reservoirs or ones with low solution gas such as Athabasca reservoirs can be produced by SAGD The steam flows to the edge of the steam chamber and releases its remaining latent heat to the cool oil sands at the edges In this work the lsquoedge of the chamberrsquo is defined mathematically as the interface beyond which the temperature declines below the saturated steam temperature inside the SAGD chamber The viscosity of the bitumen drops due to heating effect of steam and the mobilized oil then flows under gravity to the lower horizontal production well In a SAGD process the oil layer adjacent to the expanding steam chamber is mobile and this region is called lsquomobile zonersquo (within the steam chamber the oil phase is at residual oil saturation
Page 15 of 69
and beyond the heated zone the cold oil phase is practically immobile because of its high viscosity)
13 Motivation The purpose of the work described in this thesis is to develop an analytical model for lateral expansion of steam chamber that accounts for formation and transport of water-in-oil emulsion Most of the previous models do not account for thd condensate at the edge of the SAGD Butlerrsquos model overestimates oil production rate due to single-phase assumption while the proposed model presents more accurate oil flow rate supporting the fact that emulsification effect should be included in the SAGD analysis It is assumed that emulsion is generated due to condensation of steam which is penetrated into the heated bitumen The oil viscosity is affected by both temperature gradient due to heat conduction and microbubble concentration gradient due to emulsification so the oil flow rate The proposed mathematical model and its application to field and experimental data help the industry to understand the effect of emulsification on oil mobility during SAGD processes Based on this understanding steam chamber growth rate and oil production can be estimated more accurately The motivation of this research is to improve our understanding of the underlying physics in SAGD process with recapping the effect of emulsion in the process and filling a critical gap in this area
14 Specific Objectives of this Research The specific objectives of this research are as follows 1 Develop an analytical model of SAGD that includes the emulsion effect 2 Conduct sensitivity analysis with involved parameters such as temperature viscosity and thermal diffusivity parameter
Page 16 of 69
3 Compare the results yielded by the new models with those given by previous analytical SAGD models and the field data
15 Thesis Outline Chapter 2 presents a literature review of the analytical models of SAGD process It highlights the strengths and major shortcomings of the previous analytical models The recent experiments which emulsions were found both in the porous media and oil produced have been introduced In chapter 3 a detailed overview of the emulsion formation propagation and coalescence has been explained In chapter 4 a new model for gravity drainage of mobilized bitumen at the edge of a SAGD steam chamber is derived that includes emulsion effect The analytical models derived in this research were compared with 6 set of field data and the system is assumed single phase The system includes water droplets which are emulsified in the oil phase and are flowing with oil as a single phase
In chapter 5 the multiphase effect is added to the current theory Emulsion effect is investigated in a two phase flow system which is closer to the real system
Page 17 of 69
2 Chapter Two Literature Review
This chapter includes the overview of the existing analytical models of SAGD process It highlights the strengths and major shortcomings of the previous analytical models The recent experiments which emulsions were found both in the porous media and oil produced have been introduced
21 Overview
As the oil recovery rate from conventional hydrocarbon resources continues to decline the role of unconventional heavy oil and bitumen resources become more pronounced These reserves cannot be produced at effective and economic production rate without assistance of enhanced oil recovery operations such as Cyclic Steam Stimulation (CSS) Steam Assisted Gravity Drainage (SAGD) or Solvent Aided Processes (SAP) because of their extremely high oil viscosity Steam injection is a proven thermal technique to be used in heavy ultra heavy oil and bitumen recovery (Al-Bahlani and Babadagli 2009) Mehrotra and Svrcek (1997) measured the effect of temperature on bitumen viscosity of typical Athabasca bitumen They observed that bitumen viscosity sharply drops by increasing the temperature
In SAGD operations two horizontal wells are drilled in an oil sand deposit The production well is about five meters below the injection well located at the formation bottom First steam is circulated through both injection and production wells This process is called preheating and the goal is to establish the hot communication In the next step steam is injected in the upper well and flows upward in the reservoir When hot steam contacts cold bitumen steam transfers its heat to the cold oil The heated oil and condensate drain towards the lower production well due to gravity The upper injection well continuously injects steam and the heated oil and condensate are produced through the lower production well Continuous steam injection forms a steam chamber that develops vertically and horizontally (Canbolat 2002 Butler 2008 Sasaki et al 1996) Birrell (2001) detected the location of steam chamber by interpreting temperature data He
Page 18 of 69
specified the regions of constant high temperature as boundaries of the steam chamber
Butler (1985) developed an analytical gravity drainage model by combining the flux equation of oil and steam with conduction heat transfer equation and predicted the oil production rate of a spreading steam chamber in a SAGD process
Because of the single-phase assumption his model overestimates the field production data
Sharma and Gates (2010) extended Butlerrsquos model by accounting for the impact of oil saturation and relative permeability to address the discrepancy observed between field data and Butlerrsquos model In both models the major mechanism of heat transfer at the edge of steam chamber is heat conduction
The current analytical models do not consider emulsification phenomena which has been observed and reported by several authors Chung and Butler (1988) studied the production of emulsion under laboratory conditions using a scaled reservoir model to investigate the effect of steam injection geometry on the degree of in-situ emulsification Ito and Suzuki (1999) simulated the SAGD process and showed that water flow ahead of steam chamber edge and convective heat transfer play significant roles in oil recovery Sasaki et al (2001) and (2002) conducted scaled SAGD experiments and observed that production fluid after breakthrough consists of single-phase condensate and water-in-oil emulsion The diameter of water droplets was reported to be in the range of 001-007 mm Furthermore pore-level investigations of Mohammadzadeh and Chatzis (2009) demonstrate the simultaneous three-phase flow of steam condensate and mobilized oil during a SAGD process According to flow visualization experiments of Mohammadzadeh and Chatzis (2009) it is evident that water-in-oil emulsion can be formed in-situ during a SAGD process The water droplet size in their experiments was reported to be in the range of 11 to 5microm They visualized water-in-oil emulsification at the chamber interface caused by local condensation of steam Noik et al (2005) observed the existence of residual emulsion in extra heavy oil using Differential Scanning Calorimeter (DSC) during SAGD production Mohammadzadeh et al (2010) concluded that temperature gradient between the gaseous mixture and mobile oil phase can affect the extent of emulsification Azom (2009) studied the
Page 19 of 69
effect of emulsion during SAGD and modeled the emulsion droplets as chemical species He utilized the features available in CMG simulator in order to model emulsion generation propagation and coalescence in porous media He pointed out that transport of these emulsion droplets into the bitumen phase facilitates convective heat transfer resulting in improved oil recovery Hence the oil rate increases in spite of increase in bitumen viscosity due to emulsion effect Recently Ezeuko et al (2013) conducted a simulation study to investigate the effect of emulsion on SAGD Their results show that emulsification increases bitumen mobility and therefore decreases cSOR More recently Ezeuko et al (2013) numerically simulated the effect of emulsion in a SAGD process and compared the simulation results with the experimental results They concluded that in-situ emulsification may play a vital role within the reservoir during SAGD increasing bitumen mobility and thereby decreasing cumulative steamoil ratio
Reverse emulsion can also occur during SAGD production Reverse emulsion is produced by emulsification of oil in a continuous water phase As a general rule the phase with the smaller volume fraction is the dispersed phase and the other phase will be the continuous phase When both phases are at the same magnitude other factors will determine type of emulsion formed (Kokal 2005) Water-in-oil emulsion could invert to oil-in-water emulsion typically when water volume fraction is greater than 80 Furthermore steam quality may play an important role in emulsification (Ezeuko et al2013 Kokal 2005) Azom (2013) states water-in-oil emulsion occurs when steam quality is high
In this thesis we added the effect of emulsion into Butlerrsquos model to address overestimation of oil flow rate The proposed mathematical model and its application to field and experimental data help the industry to understand the effect of emulsification on oil mobility during SAGD processes Based on this understanding steam chamber growth rate and oil production can be estimated more accurately
22 Analytical Modelling of Steam-Assisted Gravity Drainage (SAGD)
221 Butler Single Phase Model
Page 20 of 69
Butler et al (1979) presented the first paper on SAGD at the Oil sands Symposium in Jasper Canada The key physics of SAGD are relatively well and simply described the oil drainage rate from first principles (Butler et al 1981 Butler and Stephens 1981 Butler 1985 Ferguson and Butler 1988 Reis 1992 1993 Butler 1997a Akin 2005) Butler et al (1981 1985) analysis underlies all SAGD theories that have been published till today (Ferguson and Butler 1988 Reis 1992 1993 Akin 2005) He developed a gravity drainage model with a fundamental assumption that the only heat transfer mechanism at the edge of steam chamber is conduction Also the temperature ahead of the interface is assumed to have a quasi-steady state distribution in the direction normal to the chamber edge which means that the time-scale of heat transfer is similar to the time-scale of the interface advance Hence the temperature profile is given by
Tlowast =T minus TRTs minus TR
= e(minusUεα) (1)
Where 119879lowast 119879119877 and 119879119904 are dimensionless temperature initial reservoir temperature and steam temperature respectively 119880 is the advance velocity of steam chamber edge which is normal to the interface 120576 is the distance away from the chamber edge with a coordinate normal to the interface 120572 is the thermal diffusivity given by 120572 = 119896119879119867120588119862119875 where 119896119879119867 120588 and 119862119875 are the thermal conductivity rock density and specific heat capacity of the formation respectively In simple α controls the ability of a material to conduct thermal energy When α is higher the heat transfer is more efficient
The kinematic viscosity as a function of temperature is assumed to be
νsνo
= T minus TRTs minus TR
m
(2)
Where 120599119904 and 120599119900 are kinematic oil viscosity at steam temperature (Ts) and reservoir temperature (TR) respectively 119898 is a temperature viscosity parameter For heavy crude oil and bitumen the value of m is typically between 3 and 4 (Butler 1985)
Page 21 of 69
Substituting Eq 1 into Darcy equation and using the relationship between advance velocity and the system geometry oil flow rate becomes
Q = 2 L2 empty ∆So k g α h
m νs
(3)
where q is the volumetric bitumen production rate L is the length of the production well k α φ ΔS
o are the permeability thermal diffusivity porosity and mobile oil
saturation range of the reservoir respectively Detail of the calculations is shown in appendix A oslash ΔSo k 119892 and h are porosity oil saturation difference permeability gravitational acceleration and reservoir thickness As Butler analyzed the oil flow in a 2-D model the flow rate Q has a unit of m2s The reservoir is assumed to be laterally infinite and there is no dissolved gas in the oil phase
222 Other Variants of Butlerrsquos Models
The original theory was revised by Butler and Stephen (1981) to model the chamber shape such that it remained attached to the production well The oil production rate predicted by this revised model referred to as the ldquoTandrainrdquo model is given by
q = 2L15kgαφhΔSo
mνs
(4)
Ferguson and Butler (1988) reported a procedure to investigate the impact of variable steam injection rates and pressure on SAGD Their improved the original SAGD theory because it could handle varying steam pressures However the resulting theory was developed numerically and required the solution of a complex differential equation that approximated heat transfer at the boundary of the steam chamber as a constant temperature boundary at the edge of the chamber Reis (1992) derived a SAGD theory similar to Butlerrsquos (1985) theory for horizontal wells He assumed the steam chamber shape as an inverted triangle This shape was in Hele-Shaw and sandpack laboratory models (Chung and Butler 1988) but
Page 22 of 69
thermocouple data (EnCana report 2007 CNRL report 2007 ConocoPhillips report 2008) from field operations and detailed simulation studies (Ito Hirata and Ichikawa 2001b Gates Kenny Hernandez-Hdez and Bunio 2005) suggest that the steam chamber is more elliptical Reis (1992) derived a similar theory for steam-based gravity drainage in radial geometry around vertical wells He assumed that the steam chamber is an inverted cone and used material and energy balance equations to determine a steam to oil ratio Reis used his theory to demonstrate that vertical well SAGD may have potential as a bitumen recovery process The oil drainage rate predicted by Reis for a linear geometry is given by
q = 2L119896119892120572120593ℎ120549119878119900
2120572119877119898120584119904
(5)
Where aR
is an empirical constant equal to 04 Reis (1992 1993) showed that Butlerrsquos model overpredicts the oil production rates compared to the experimental results However his model did not predict production during the rise of the chamber
SAGD is a multi-physics process involving simultaneous mass and heat transport with significant thermal geomechanical and interfacial effects Butlerrsquos model has been extended by several researchers to account for such effects Akin (2005) developed a mathematical model for gravity drainage during steam injection that accounted for steam distillation and asphaltene deposition eddects in a linear geometry where the steam chamber is assumed to be an inverted triangle shape His analysis showed that in late times steam-distillation and asphaltene deposition are the controlling parameters of the process rather than steam chamber size and lateral heat transfer He implemented the effects of temperature pressure and asphaltene-content on the viscosity of the drained oil by using a compositional viscosity model Irani and Cokar (2014) developed an approach to incorporate temperature-dependant thermal conductivity into a SAGD analytical model Azad and Chalaturnyk (2010 and 2012) proposed a circular geometry formulation to model the SAGD process Cokar et al (2013) derived a formula that accounts for thermogeomechanical effects at the edge of the steam chamber
Page 23 of 69
Wei et al (2014) developed a new model which considers the time-dependent overburden heat losses Heidari et al (2009) developed a model to study effects of drainage and permeability on production rate in a SAGD process Their model introduces the dilation effects arising from thermal expansion into the analytical model for SAGD oil production Azom et al (2013) studied interfacial phenomena during the SAGD process and concluded that Butlerrsquos and Sharma and Gatesrsquos solutions are respectively more accurate at relatively low and high values of Marangoni number Rabiei et al (2014) developed an unsteady-state semi-analytical model to predict the oil flow rate in a solvent-assisted SAGD process
223 Sharma and Gatesrsquo Multiphase Model
Butlerrsquos derivation assumes a single phase flow and does not account for relative permeability effect at the interface By extending Butlerrsquos theory Sharma and Gates (2010) developed a multiphase SAGD model with an assumption that oil saturation linearly changes with respect to temperature ahead of the steam chamber ranging from the residual oil saturation at the edge of steam chamber to the initial reservoir oil saturation Thus the oil saturation profile is given by
So = Sor + (Sio minus Sor)(1minus Tlowast) (6)
Where Sor and Sio are residual and initial oil saturation respectively
The relative permeability of oil depends on the oil saturation which varies with the distance beyond the steam chamber edge It can be determined from lab-based relative permeability models such as (Brook and Corey 1964)
krow = krocw(1 minus SwD)a (7)
The exponent ldquoardquo is a Corey coefficient which controls the curvature of the oil relative permeability curve kro krocw and SwD are relative permeability of oil phase with respect to water relative permeability of oil phase at irreducible water saturation and the normalized water saturation respectively The normalized water saturation is defined as
Page 24 of 69
SwD =Sw minus Swc
1 minus Swc minus Sor (8)
Where 119878119908119888 and 119878119900119903 are connate water saturation and residual oil saturation respectively
The oil flow rate equation developed by Sharma and Gates is finally given by
Q = 2L2 α k krocw g empty ΔSo h Г(m + 1)Г(a + 1)
νsГ(m + a + 1) (9)
Г is gamma function The difference between this volumetric flow rate equation and Butlerrsquos model is the following term which accounts for the multiphase effects The detail of the calculations can be found elsewhere (Sharma and Gates 2010)
Г(m + 1)Г(a + 1)Г(m + a + 1)
224 Energy Balance In this section the steam oil ratio is determined by energy balance (Murtaza et al 2014) Based on Butler (1987) there are three types of heat which is transferred to the system The heat transferred to rock residual oil and connate water within the finger is Hf The heat transferred to the oil stream at the edge of steam chamber Ho The heat conducted to the oil saturated reservoir Hr
119867119891 = 120588119888119862119888119881(119879119904 minus 119879119903)119909119894
119867119900 = 119881emptyΔSo(119879119898 minus 119879119903)119909119894[120588119900119862119900]
Where 119879119898 is temperature of heated bitumen 120588119888119862119888 is volumetric heat capacity of steam chamber excluding condensate 119909119894 is interface position of steam and drainage flow 1198601198981 is constant
119867119903 = 119881120588119888119862119888119909119894(119879119904 minus 119879119903) +1198601198981
2 119909119894[emptyΔSo[120588119900119862119900 + 120588119908119862119908](119879119904 minus 119879119903)]
Where 119879119898 = 11986011989812
(119879119904 minus 119879119903) + 119879119903
Page 25 of 69
1198601198981 =119898 + 1119898 + 2 +
120587121205872
160 + 12058732688
120587455296 + 1205875
1351680minus1205876
38338560119898+2
minus 1
120587121205872
160 + 12058732688
120587355296 + 1205875
1351680minus1205876
38338560119898+1
minus 1
The weighted steamoil ratio is given by
Rg´ =(119879119904 minus 119879119903)ΔSo120582empty120588119900
120588119888119862119888 + 1198601198981
2 emptyΔSo[120588119900119862119900 + 120588119908119862119908]
Page 26 of 69
3 Chapter 3 Emulsions in SAGD
A detailed overview of the emulsion characteristics and important factors on emulsion stability has been explained in this chapter
31 Definitions
Emulsification can occur in most of the oil production and processing like inside the reservoir wellbore wellheads and transportation pipelines even in the storages An oil emulsion is a dispersion of water droplets in oil Emulsions can be classified into three groups
bull Water in oil emulsions (WO) bull Oil in water emulsions (OW) bull Complex emulsions
The WO emulsion includes water droplets in a continuous oil phase and the OW emulsion includes oil droplets in a continuous water phase Complex emulsions include tiny droplets suspended in bigger droplets that are suspended in a continuous water phase As a rule of thumb the dispersed phase is the one in the mixture which the volume fraction is smaller compared with the other one (continuous phase) In case that the phase volume ratio is close to 1 other factors will determine the type of emulsion formed (Kokal 2005 Farah et al 2005)
32 Emulsion Characteristics
321 Droplet Size Produced emulsions have droplet diameters 01 μm ndash 50 μm Emulsion droplet size distribution depends on number of factors like IFT nature of emulsifying agents and presence of solids Droplet size distribution may be a factor to determine emulsion stability The smaller the average size of dispersed water droplets the longer the residence time required (Kokal 2005)
Page 27 of 69
322 Viscosity
Due to non-Newtonian behavior of emulsions caused by droplet crowding emulsion viscosity is higher than either oil or water viscosity As a certain value of water emulsions would behave as shear thinning or pseudoplastic fluids as shear rate increases the viscosity decreases (Noik et al 2005) The viscosity data shown in Figure 4 indicates that emulsions exhibit Newtonian behavior up to a water content of 30 (this is indicated by constant values of viscosity for all rates or a slope of zero)(Kokal 2005) For water cuts above 30 the slope would deviate from zero showing the non-Newtonian behavior Kokal (2005) observed in the Saudi Arabian crude emulsions that water cut exceeds than 80 WO emulsion inverts to OW emulsion The viscosity of emulsion is affected by number of parameters like
bull Temperature bull Amount of dispersed water bull Droplet size and distribution bull Oil and water viscosity bull Amount of solid presents bull Rate of shear or shearing force bull Temperature viscosity parameter bull Thermal diffusivity parameter
Among them temperature and amount of dispersed water and rate of shear have the main effect and others have minor effect on the viscosity (Broughton and Squires 1938)
Page 28 of 69
Figure 4 Viscosities of very tight emulsions at 125deg F (Kokal 2005)
From the pore-scale schematic in Figure 5 due to emulsification effect at the water-oil interface a fraction of water flows with the continuous oleic phase in the form of dispersed droplet instead of flowing as a separate continuous phase Emulsification phenomenon at the interface during the advance of steam chamber is not considered in previous analytical models Several authors reported formation of emulsion during SAGD production in the reservoir wellbore wellhead and transportation pipelines (Kokal 2005 Ronningsen 1995)
Figure 5 Pore-scale illustration of fluid occupancies (water oil) at the edge of steam chamber (a) WO emulsion SAGD (b) traditional SAGD (Ezeuko et al 2013)
Page 29 of 69
The viscosity of a liquid which small solid spheres are dispersed in it studies by Einstein in theoretical hydrodynamics Taylor (1932) stated that Einstein analysis may be extended to include the liquid droplets
Based on Taylorrsquos empirical relationship (Taylor 1932)
microemmicro
= 1 + 25 τ + 04τ + 1
x (1)
This equation shows that the viscosity of emulsion increases by increasing the volume fraction of dispersed water at constant temperature Here τ is the ratio between the viscosity water droplets and continuous oil phase 120583119890119898 119886119899119889 120583 are emulsion viscosity and continuous oil phase viscosity respectively and 119909 is the dispersed phase volume fraction Taylorrsquos equation is applicable under the following conditions
a) Low concentration of the dispersed phase (Farah et al 2005) Increasing the dispersed phase concentration increases the chance for interactions among and deformation of the original spherical droplets Based on the experiments when the water saturation exceeds 80 the system inverts to oil-in-water emulsion
b) The radii of dispersed phase droplets do not exceed a certain critical radius (Broughton and Squires 1938)
c) Droplets of the dispersed phase should not be deformed from the original spherical shape (Farah et al 2005)
d) The tangential stress parallel to the surface is continuous at the surface of the droplet so any film existing between the two liquids only transmits tangential stress from one fluid to the other one
In Taylorrsquos relationship viscosity is a function of dispersed phase volume fraction However there are several other correlations describing viscosity as a function of temperature and dispersed phase volume fraction (Farah et al 2005 Broughton and Squires 1938 Pal 1998 Krieger and Dougherty 1959) Here we assume that when Sw lt 06 water droplets do not deform and coalesce Furthermore we assume that the radius of the dispersed droplets does not exceed the critical value
Page 30 of 69
323 Color and appearance The color of the emulsion can vary widely depending on
bull Oilwater content bull Characteristics of the oil and water
The common colors of emulsions are dark reddish brown gray or blackish brown however any color can occur depending on the type of oil and water at a particular facility Emulsion brightness is sometimes used to characterize an emulsion An emulsion generally looks murky and opaque because of light scattering at the oilwater interface When an emulsion has small diameter droplets (large surface area) it has a light color When an emulsion has large diameter droplets (low total interfacial surface area) it generally looks dark and less bright Understanding the characteristics of an emulsion by visual observation is an art that improves with experience (Sarbar and Wingrove 1997)
33 Emulsion Stability
Emulsifiers (surface active agents or surfactants) that concentrate at the oilwater interface and form the interfacial films would stabilize the emulsions They lead to reduction in interfacial tension and emulsification of droplets as well Emulsifiers have higher boiling point fractions such as asphaltenes resins organic acids and bases There are natural and chemical emulsifiers Chemical ones include surfactants that may be injected into formation or wellbore (drilling fluids stimulators) Fine solids may play as an emulsifier The effectiveness of them may depend on some factors like particle size particles interaction and wettability of the particles
From thermodynamic point of view an emulsion is an unstable system It is because each liquidliquid system tends to reduce the interfacial area and energy by separation Emulsions are classified based on their kinematic stability to three groups
Loose emulsions separate in a few minutes Medium emulsions separate in 10 minutes or more Tight emulsions separate partially in hours or days
Page 31 of 69
Interfacial films play an important role in emulsion formation and stability The films are formed due to adsorption of polar and high weight molecules which are active at the interface They would reduce the IFT and increase the interfacial viscosity at the same time The strength of films is a function of temperature pH of water and oil type (polar molecules) The films can be rigid (solid) or mobile (liquid) The rigid films have very high interfacial viscosity like an insoluble skin They provide structural barrier and help to increase emulsion stability Mobile films are characterized by low interfacial viscosity They are less stable Surfactants can modify the stability of films and eventually the emulsions (Poindexter et al 2006) The important factors affecting emulsion stability include the following
331 Steam Quality Chung and Butler (1989) reported from a 2D experimental model no significant difference on emulsification with wet or dry steam They attributed that to the interfacial activities and the heating mechanism being the same at the steam front The comparison was done on a low pressure injection and they did not report any high pressure Their observation supports the fact that steam quality is controlled by reservoir temperature and pressure Although we can control the quality of injected steam to keep it as high as possible it drops as it flows through the reservoir Although Gates and Chakrabarty (2005) stated that the quality of the injected steam should be as high as possible at the sandface because any condensate in the injected fluids falls under gravity from the injector towards the producer and does not deliver a significant amount of heat to the oil sand
332 Temperature Temperature affects the physical properties of oil water and interfacial films surrounding the water droplets that give the emulsions their stability Waxes can dissolve in crude oil when temperature increases Waxes are the main constituents of the interfacial films surroundings the water droplets Hence dissolving of waxes
Page 32 of 69
into the crude oil reduces the chances of water droplets to form as an emulsion Temperature also increases the thermal energy of the droplets and hence increases the frequency of droplet collisions Gradual destabilization of the crude oilwater interfacial films is another result of increasing temperature Increasing temperature causes the reduction in interfacial viscosity of the interfacial films which results in the instability of emulsion Highly viscous interfacial films retard the rate of oil-film drainage providing a mechanical barrier to coalescence (Kokal 2005) However decreasing viscosity of the system causes the higher rate of drainage at the edge which makes the size of the water droplets smaller and more stable and suitable for making emulsion
333 Initial Water Saturation Chung and Butler (1989) noticed a higher water in oil emulsion when Swi = 0 than Swi = 125 They commented that there is less tendency for water to condense as droplets on the surface of oil when enough connate water is available As the droplets of water condense on oil they become ldquoburiedrdquo because of the spreading characteristics of oil It is worth mentioning that Sasaki et al (2002) observed this process in a microscopic visualization experiment m In crude samples with higher value of m the concentration of naturally occurring emulsifiers like higher boiling point fraction in oil is higher Hence the probability of forming emulsions may increase when m increases α For higher value of α which means the heat will diffuse more quickly we expect to have less emulsion Higher rate of heat diffusion results in sharp viscosity drop so the drainage rate will be faster The chance of water droplet coalescence may be more than having dispersed water droplets as emulsions
334 Rate of Steam Injection
Page 33 of 69
Higher injection rate can make a faster drainage rate at the edge and may enhance droplet coalescence Hence higher injection rate can result into less emulsification
335 Oil Production Rate In higher oil production rate water droplets may have more chance to coalescence so even when there are some emulsions in the system they would disappear
336 Pressure Chung and Butler (1989) conducted high pressure experiments on the steam assisted gravity drainage process using a scaled physical model The results showed that the pressure variation of steam injection does not have significant effect on the emulsified water ratio It is well-known that naturally occurring emulsifiers are concentrated in heavy fraction in crude oil such as asphaltenes resins and oil-soluble organic acids (Kokal 2005) These components are the main constituents of the interfacial films surrounding the water droplets that give the emulsions their stability Therefore it can be interpret that the steam injection pressure does not significantly affect the emulsion stability
337 pH For oil-water systems there exists an optimum pH range for which the interfacial film exhibits minimum emulsion stabilizing The optimum pH for maximum emulsion stability depends on both the oil and water composition (Kokal 2005)
338 Droplet Size When the size of the water droplet is smaller forming emulsion is easier Generally the emulsions that have smaller-sized droplets will be more stable (Kokal 2005)
Page 34 of 69
339 Heavy Fraction in Crude Oil Asphaltenes resins and oil soluble organic acids (eg carboxylic and naphthenic acids) are the main part of the interfacial film They reside at the oil- water interface because of their surface active properties The accumulation of them at the interface results in the formation of a rigid film (Kokal 2005) There are still debates on the resins and waxes effect on emulsion stability in the literature while the effect of asphaltenes on increasing emulsion stability has been approved Crude oil that has low cloud point have greater tendancy to form stable and tight emulsions
3310 Solid particles Fine solid particles present in the crude oil are capable to stabilize the emulsion They diffuse to the oil-water interface where they form rigid structure to form emulsion and help to inhibit of emulsion coalescence If the solid particles at the interface are charged they may increase the stability of the emulsion To act as a stabilizer the size of the solids should be smaller than the size of the emulsions When the solids are oil wet like asphaltenes and waxes a water in oil emulsion will result because the particles partition into oil phase and will prevent the coalescence of water droplets Similarly water wet solid like CaCO3 and CaSO4 (clays and sands) will stabilize oil in water emulsion(Kokal 2005)
3311 Counter current flow Counter current flow increases the chance of emulsion formation Chung and Butler (1989) observed much higher wateroil emulsion content in the produced fluid when the steam chamber was rising in the experiment with bottom steam injection than with injection at the top
34 Thermodynamics of Emulsion
Page 35 of 69
As mentioned previously in this chapter emulsions are thermodynamically unstable Emulsification is an exothermic process and can be described in two steps Step 1 is transferring of water micro bubbles across the bitumen interface (Equation 2) the enthalpy released is the heat which is generated and transferred to bitumen Step 2 is the process of encapsulation of emulsions into bitumen(Equation 3) The reactions are first order and dependent on the emulsion concentration The stoichiometric constants A B X and Y will be determined by experimental analysis (Ezeuko et al 2013) X(H2O) Y(Emulsion) [ΔH Emulsification] (2) A(Emulsion)+B(Bitumen) D (WOEmulsion) (3) Kumar et al (2012) studied effect of in situ emulsion in heavy oil recovery Since the key problem in heavy oil is sweep efficiency and flow rate They proposed using Alkaline surfactant flooding can form WO emulsion based on the solubility of the surfactant If the OW emulsion formed the viscosity would be lower than the original oil Bypassed oil can be emulsified at the surface of water fingered mobilized and produced at relatively low pressure gradient
Page 36 of 69
4 Chapter 4 Single Phase Analytical Modeling of SAGD The purpose of this chapter is to develop a new gravity drainage model of mobilized bitumen at the edge of steam chamber which includes emulsion effect in in a single phase system Considering that several SAGD experiments reported water-in-oil emulsion we restrict water fraction evaluated in our model to be less than 80 We develop a new analytical oil drainage model by extending Butlerrsquos (1985) and Sharma and Gatesrsquo (2010) models to account for water-in-oil emulsification effect The oil flow rate from the new theory is calculated and compared with other analytical SAGD theories and with the production data from several existing SAGD operations as well as experimental data Overestimation of oil flow rate calculated by Butlerrsquos model is clearly predictable Sharma and Gates tried to address overestimation problem of Butlerrsquos model by considering multiphase effects and adding relative permeability into Butlerrsquos model
Assumptions of the model are as follow 1 Heat transfer ahead of the chamber edge is only by conduction 2 All the water is emulsified in the system 3 Porous medium is homogeneous (constant porosity and permeability) 4 Heat losses are neglected 5 Density is dependent on temperature 6 Steam chamber that has reached the maximum height h and is expanding at a
constant velocity U in the direction perpendicular to the chamber walls 7 Reservoir oil does not have any solution gas 8 Heat transfer and mass transfer is directed normal to the edge of the chamber
41 Proposed Theory
Figure 6 shows a conceptual model of a differential element at the edge of the steam chamber As the distance beyond the steam chamber edge increases the temperature decreases from steam temperature to reservoir temperature In this
Page 37 of 69
model all of the water in the formation is assumed to be emulsified in the oil phase Emulsion concentration decreases from a maximum value at the chamber interface to zero far from the interface Water saturation is maximum at the chamber edge (ε = 0) and it equals to the connate water saturation far enough from the edge
Emulsion at the steam chamber interface is a system of immiscible fluids with water droplets as the dispersed phase and oil as the continuous phase Therefore Taylor equation becomes
microemmicroo
= 1 + 25
microwmicroo
+ 04microwmicroo
+ 1 Sw (1)
There are several other equations for calculating emulsion viscosity at certain conditions At high concentration of dispersed phase the droplets can interact and deform from the spherical shape Yaron and Gal-Or (1972) and Choi and Schowater (1975) suggested correction factors for Taylor equation to take into account the deformation of droplets Both models describe the viscosity variation as a function of dispersed phase volume fraction but not the temperature In our model which we used Taylor equation we consider the effect of temperature with using the relation of water saturation with distance and temperature Several authors proposed correlation for the viscosity of WO emulsion as a function of temperature and dispersed phase volume fraction like Ronnigsen (1995) Richardson (1950) and Walther (1931)
In our theory we assume that all the water is emulsified in the oil phase This assumption is in agreement with the experimental study conducted by Noik et al (2005) to characterize the water-in-oil emulsion produced by SAGD operation Based on their results when the water cut is about 40 water is totally emulsified They also mentioned that a threshold energy exists above which the oil-water system tends to be totally emulsified
By solving Eq 1 we have
microem =microw + microo + (25microw + microo)(Sw)
microwmicroo+ 1
(2)
Page 38 of 69
Figure 6 Schematic illustration of temperature dispersed and continuous phase volume fraction emulsion concentration and emulsion viscosity with respect to the distance beyond the
steam chamber edge (ε )
We also assume that oil saturation is a linear function of temperature ahead of the interface with an assumption that conductive heat transfer dominates beyond the steam chamber edge
Sw = 1 minus So = (1 minus Sor) minus (Sio minus Sor)(1 minus Tlowast) = (1 minus Sor) minus (Sio minus Sor) 1 minus eminusUεα (3)
This relationship which was first proposed by Sharma and Gates (2010) requires the assumption of similar length scales for capillary diffusion and thermal diffusion According to Azom et el (2013) this assumption can hardly be justified for a capillary dominated flow at the edge of the steam chamber However in the presence of emulsions the length scale of saturation advection can be assumed to be similar to that of thermal convection It should be noted that emulsions are generated primarily by condensation of penetrated steam (Mohammadzadeh and Chatzis (2009)) and therefore heat transport ahead of the steam chamber is controlled by both conduction and convention mechanisms (Azom and Srinivasan (2009))
Page 39 of 69
Eventually water saturation becomes a function of distance (ε) beyond the steam
chamber interface Substituting 1microo
= δminusm
micros and Eq3 into Eq2 the dynamic emulsion
viscosity as a function of distance beyond the steam chamber interface is given by
microem =microw + micros
δminusm + 25microw + microsδminusm [(1 minus Sor) minus (Sio minus Sor)(1 minus δminus1)]
microwδminusm
micros+ 1
(4)
Where 120633 = 119942119932120634120630
Therefore emulsion mobility defined by λoil = kρemνem
= kmicroem
is given by
λoil =k microwδ
minusm
micros+ 1
microw + microsδm + (25microw + microsδm)[(1 minus Sor) minus (Sio minus Sor)(1 minus δminus1)] (5)
Figure 7 Cross sectional view of a typical SAGD process and expanded view of a differential element at the edge of steam chamber (modified from Sharma and Gates 2010)
411 Total oil flow rate Here we follow Butlerrsquos approach (Butler et al 1981) to develop an expression for the total oil flow rate by combining Darcyrsquos and mass conservation laws
Page 40 of 69
412 Darcyrsquos law Integration of differential Darcyrsquos law equation for emulsion flow results in
qo = k So g sinθ int dενem
infin0 = k So g sin θint ρem
microem dεinfin
0 (6)
Let A = U α x = Aε dx = Adε dε = 1A
dx
qo =k g sinθ
A
So(amicrowmicroseminus(m+1)x + aeminusx + ρo
microwmicros
eminusmx + ρo)
microw + microsemx + 25(Sio minus Sor)microweminusx + micros(Sio minus Sor)e(mminus1)x dxinfin
0
(7)
Let δ = ex dδ = exdx therefore dx = eminusxdδ = 1δ
dδ
qo =k g sinθmicrosA
So
amicrowδm+1 + amicros
δ + ρomicrowδm + ρomicros
1δ
microw + microsδm + 25(Sio minus Sor)microwδ + micros(Sio minus Sor)δmminus1
dδinfin
1
(8)
qo =k g sinθmicros A
So
amicrowδm+1 + amicros
δ + ρomicrowδm + ρomicros
microwδ + microsδm+1 + 25(Sio minus Sor)microw + micros(Sio minus Sor)δminfin
1dδ (9)
Substituting A= U α gives
qo =k g sinθmicroS U
So
amicrowδm+1 + amicros
δ + ρomicrowδm + ρomicros
microwδ + microsδm+1 + 25(Sio minus Sor)microw + micros(Sio minus Sor)δmdδ
infin
1 (10)
Here it is assumed that steam density is significantly lower than emulsion density 119892 is the acceleration due to gravity and ө is the local inclination angle for the steam chamber interface Eq 10 gives the relative flow rate of oil per unit well length assuming single-phase flow of emulsion Here we are assuming that water flow is fully coupled to oil flow An analogous assumption was made by Dehghanpour and DiCarlo (2013) who measured and modeled coupled flow of water and mobilized oil in a tertiary gas flood We also assume that the size of water droplets is comparable to that of typical pore-throat in oil sand deposits
Page 41 of 69
Combining Eq4 with Eq6 gives
qo = k So ρem g sin θ microwmicros
δminusm + 1
microw + microsδm + (25microw + microsδm)[(1 minus Sor) minus (Sio minus Sor)(1 minus δminus1)]
infin
0dε (11)
The emulsion density ρem as a function of distance beyond the steam chamber edge is given by
ρem = ρwSw + ρo(1 minus Sw) = (ρw minus ρo)Sw + ρo (12)
Combining Eq12 with Eq3 gives
ρem = (ρw minus ρo) lowast (1 minus Sio) + (sio minus sor) eminusUε α + ρo (13)
Substituting Eq13 into Eq 11 and re-arranging gives
qo =k g sinθmicroSU
β (14)
Where β = intSo
amicrowδm+1+
amicrosδ +ρomicrowδm +ρomicros
microwδ+microsδm+1+25(SiominusSor)microw+micros(SiominusSor)δmdδinfin
1 and a = (120588119908 minus 120588119900)(119878119894119900 minus
119878119900119903) This equation is not the final solution for oil flowrate since U and Sin θ are unknown
413 Material balance From the material balance the rate of increase of oil flow across the differential element displayed in Figure 7 is related to the advance rate of the steam chamber interface The material balance relationship can be expressed as
120597119902119900120597119909
= empty Δ119878119900(120597119910120597t
) (15)
The advance velocity of interface U is given by
Page 42 of 69
U = minus cos 120579120597119910120597119905
(16)
U is growth velocity normal to the edge of steam chamber
Substituting Eq 15 and Eq 16 into Eq 14 and recalling that sin120579cos120579
= 120597119910120597x
results in
qo partqo = k g sin θ β empty ΔSo
microSparty (17)
Integrating the left side of Eq 17 from 0 to 119902119900 and the right side from 0 to h (the height of steam chamber) gives the total oil flow rate per unit well length for one side of the steam chamber Therefore the total volumetric oil flow rate is given by
Qo = 2L 2 k g sinθ β empty ΔSo
microS
Here 120573 accounts for in-situ emulsification phenomenon and replacing it with 120572119898
gives Butlerrsquos original solution
42 Model Results
421 Model Verification Table 1 lists the parameters from a physical model experiment (Sasaki et al 2001) which are used in the model verification and sensitivity analysis
Page 43 of 69
(a) (b)
Figure 8 Comparison of oil phase mobility from Butlerrsquos and the current theory with respect to distance beyond the edge of a steam chamber using Sasaki et al (2001) experimental data (a)
with no temperature effect (b) with no emulsion effect
Page 44 of 69
Table 1 Parameters from Sasaki et al (2001) Experimental Data
Parameters Value
Tr (C) 20
Ts (C) 106
ρo (kgm3) 998
h (m) 03
L (m) 00045
empty 038
α (m2s) 260x10-7
kab (m2) 115x10-10
Kro 04
Sio 1
Sorw 005
Swc 0
νs (m2s) 12010x10-4
m 36
a 1
Figure 8 (a) compares the proposed model with Butlerrsquos model in the absence of temperature effect (m=0) The current model converges to Butlerrsquos model far enough from the chamber edge As the distance increases emulsion concentration approaches to zero so there is no emulsion effect in the formation and the proposed model converges to Butlerrsquos single-phase model as expected Figure 8 (b) compares the current model with Butlerrsquos in the absence of emulsion effect Emulsion viscosity is the same as oil viscosity and the emulsion mobility curve are exactly the same for the two models so the current model matches with Butlerrsquos model
Page 45 of 69
Figure 9 compares the oil phase mobility with respect to distance beyond the interface estimated using 1) the proposed model 2) Butlerrsquos model and 3) Sharma and Gatesrsquo model The results show that the oil mobility at any distance calculated from the proposed model is lower than that from Butlerrsquos model and higher than that from Sharma and Gatesrsquo model The oil phase mobility in the proposed model exponentially decreases with increasing distance which is similar to Butlerrsquos but smaller due to the effect of emulsification Because there is no consideration of multiphase and emulsion effect Butlerrsquos model has the highest oil mobility When there is no other fluid the pore network is exclusively available for oil flow Sharma and Gates considered multiphase effect by adding relative permeability to Butlerrsquos model Multiphase assumption allocates a share of fluid path to oil in Sharma and Gatesrsquo model Therefore the oil mobility in their model is lower than that in Butlerrsquos Though emulsion increases effective oil viscosity our model has a higher mobility than Sharma and Gatesrsquo model because we ignore multiphase effect in the presence of emulsion
Figure 9 Comparison of emulsion mobility with respect to ε from Butlerrsquos Sharma and Gatesrsquo and the proposed model using Sasaki et al (2001) experimental data
0
200
400
600
800
1000
0 3 6 9 12 15
Oil
Mob
ility
(mD
cp)
Distance Beyond Steam Chamber Edge (m)
Current Theory
Butlers model
Sharma and Gates Model
Page 46 of 69
(a) (b)
Figure 10 Dynamic Viscosity of pure bitumen and emulsion with respect of distance beyond edge of steam chamber for different values of (a) m and (b) α
422 Sensitivity Analysis
In this part we conduct a sensitivity analysis to investigate the dependence of oil flux and total oil production rate on m α and μwater which control emulsion viscosity
43 Dynamic Emulsion Viscosity Figure 10 shows how the viscosity of emulsion and pure bitumen change with respect to the distance from the chamber edge at different values of (a) α and (b) m At a specific distance μem increases by increasing m while μem decreases by increasing α Furthermore μem- ε is steeper at lower values of α and at higher values of m
44 Emulsion Mobility Effect of m Figure 11 (a) shows the effect of m on the oil mobility versus distance The results reveal that the smaller the m the larger the oil mobility is As we described in previous section increasing m increases μem so the oil mobility
Page 47 of 69
will be lower due to higher μem Oil mobility increases with increasing temperature as a result of decreasing viscosity
Effect of α Figure 11 (b) shows the oil mobility with respect to distance at several thermal diffusivities Increasing α enhances the efficiency of heat transfer and therefore increases the oil mobility
Effect of μw Figure 11 (c) shows that μw does not have any significant effect on oil mobility μw is significantly smaller than bitumen viscosity and thus it does not affect the oil mobility Furthermore based on Eq5 the multiplier of oil viscosity is
orders of magnitude larger than that of water viscosity (119890119880120576120572 119898 gtgt 1 gtgt 119890minus 119880120576120572 119898)
45 Volumetric Oil Flux
Figure 12 (a) to (d) compares the effects of α U m and microw on volumetric oil flux respectively As expected increasing α increases the oil flux due to faster heat transfer and increasing m decreases the oil flux as oil becomes more viscous Increasing U gives lower oil flux since there will be less time to receive condensate thermal energy As mentioned before μw does not affect the oil mobility and thus changing water viscosity does not considerably affect volumetric oil flux
46 Field data analysis
In this section we use the proposed model to predict oil production rate at the field scale Figure 13 compares the oil production rate by the proposed model with Butlerrsquos (1985) and Sharma and Gatesrsquo (2010) models for six different field production data Properties of the 6 fields are listed in Table 2 Butlerrsquos model overestimates the oil production rate because there is no consideration of emulsion and multiphase effects Oil flows easily because there is no relative permeability effect to limit the oil flow Therefore the values estimated by Butlerrsquos model are higher than those predicted by the other two models Sharma and Gates considered multiphase effect in their model by adding relative permeability to Butlerrsquos model
Page 48 of 69
Their model has more accurate results than Butlerrsquos but it does not consider emulsion effect which many authors reported in their observations
The results reveal that the proposed model provides an improved estimate of oil production rate under a series of specific values of α and m reported from field data of Athabasca deposit It demonstrates that emulsification effect at the edge of steam chamber should be included in the SAGD analysis Our model assumes that the entire flow system is single phase Hence there is a potential that this model overestimates the oil flow rate
(a) (b)
(c)
Figure 11 (a) Effect of temperature viscosity parameter (m) (b) thermal diffusivity (α) and (c) water viscosity (microw) on oil mobility with respect to distance beyond the edge of the steam
chamber
Page 49 of 69
(a) (b)
(c) (d)
Figure 12 Effect of (a) thermal diffusivity (b) advance velocity of steam chamber (c) temperature viscosity parameter and (d) water viscosity on volumetric oil flux profile for
Christina Lake reservoir
(a) (b)
Page 50 of 69
Figure 13 Comparison of SAGD models for different field operations data
Table 2 Comparison of SAGD models for different field operations data (After Sharma and Gates 2010)
Wellpair A3 A Phase B
Average of 3 well pairs
Average of 15 well pairs A B C D EG
H IJ K LM N O P
amp Q
I3P3
B10 grand rapids SD9
pad average of 6 well pairs
Parameters Christina
Lake Surmont
Dover UTF Phase B
Hangingstone Hilda Lake
Cold Lake
Wolf Lake Cold Lake
TR 20 15 7 20 20 20
Ts 220 225 220 260 245 250
ρs (kgm3) 880 880 880 980 880 980
ρo (kgm3) 1009 1009 1009 1015 1009 1015
0
100
200
300
400
Chr
istin
a L
ake
Surm
ont
Dov
er U
TF
Phas
e B
Han
ging
-sto
ne
Hild
a L
ake
Col
d L
ake
Wol
f Lak
e C
old
Lak
eOil
Prod
uctio
n R
ate
(m3 d
ay)
Fields
Field DataCurrent TheorySharma amp Gates ModelButlers Model
Page 51 of 69
h (m) 26 30 21 25 24 11
L (m) 690 850 500 500 1000 500
ф 033 033 033 035 035 032
α (m2s) 5501x10-7 0201 x10-
7 3601 x10-7 260 x10-7 036 x10-7 300 x10-7
kab (m2) 60x10-12 50x10-12 70x10-12 50x10-12 50x10-12 30x10-12
Kro 02 02 02 03 02 03
Sio 080 079 085 077 063 075
Sorw 01 012 015 01 012 01
Swc 015 01 01 01 01 01
νs (m2s) 681x10-6 341x10-6 795x10-6 428x10-6 341x10-6 408x10-6
m 4 5 5 5 5 4
microw (kgms) 000085 000096 000117 000085 000085 000085
ρw (kgm3) 998 999 999 998 998 998
Oil flow rate q (m3day)
Field data 170 50 77 82 65 50
Butler et al (1981)
262 379 148 229 359 131
Sharma and Gates
173 75 80 91 72 39
Current Theory 177 59 84 95 75 48
Page 52 of 69
5 Chapter 5 Two Phase Analytical Modeling of SAGD
The purpose of this chapter is to modify the single phase gravity drainage model developed in previous chapter to derive a two phase model The model includes the effect of multi-phase flow (relative permeability) and oil saturation on oil mobility and drainage rate
Assumptions of the model are as follow
1 The reservoir is homogeneous 2 Steam depletion chamber is symmetric and two dimensional 3 Some part of the water is flowing separately and the rest is emulsified in oil 4 Heat transfer ahead of the chamber edge is only by conduction 5 Porous medium is homogeneous (constant porosity and permeability) 6 Heat losses are neglected 7 Density is dependent on temperature 8 Steam chamber that has reached the maximum height h and is expanding at
a constant velocity U in the direction perpendicular to the chamber walls 9 Reservoir oil does not have any solution gas 10 Heat transfer and mass transfer is directed normal to the edge of the
chamber
51 Proposed Theory
Figure 14 shows a conceptual model of a differential element at the edge of the steam chamber In this model portion of the water in the formation is assumed to be emulsified in the oil phase (Cw) and the rest is flowing along with as a continuous phase (Sw) The total water saturation (Swt) becomes
Swt = Cw + Sw
Probability of Emulsion formation decreases at higher temperatures since when temperature increases emulsion concentration decreases Water saturation is maximum at the chamber edge (ε = 0) and it equals to the connate water saturation far enough from the edge Emulsion formation occurs more when there is less water saturation water droplets can coalescence and flow as a continuous phase
Page 53 of 69
when the water saturation is higher As discussed in chapter 3 emulsification phenomena is a function of following factors temperature viscosity parameter temperature initial water saturation steam injection rate water droplet size and temperature diffusivity parameter
Emulsion at the steam chamber interface is a system of immiscible fluids with water droplets as the dispersed phase and oil as the continuous phase Therefore if we assume τ = microdispersed
microcontinuous= microw
microo and x = Cw Taylor equation becomes
microemmicroo
= 1 + 25
microwmicroo
+ 04microwmicroo
+ 1 Cw (1)
There are several other equations for calculating emulsion viscosity at certain conditions
Figure 14 Schematic illustration of emulsion concentration continuous phase water saturation oil mobility and probability of emulsion formation function with respect to the distance beyond
the steam chamber edge (ε )
Page 54 of 69
Again water saturation becomes a function of distance (ε) beyond the steam chamber interface
Sw = 1 minus So minus Cw = (1 minus Sor) minus (Sio minus Sor)(1minus Tlowast) minus Cw =
(1 minus Sor) minus (Sio minus Sor) 1 minus eminusUεα minus Cw
(2)
Therefore emulsion mobility defined by λoil = k krowmicromix
= k krowρmixνmix
is given by
λo = k krowmicromix
=kkrocw
Sio +CwminusSor1minusSwcminusSor
a
(1minus (eminus Uεα ))a
micromix =
kkrocw(1minus (eminus Uεα ))a(microwmicrose
minusUεα
m+ 1)
microw + micros(e Uεα )m ρoρs+ Cw 25microw + micros
ρoρs
(e Uεα )m
(3)
Where oil relative permeability and dimensionless water saturation are defined as Equation 4 and 5
krow = krocw(1 minus SwD)a (4)
SwD =Sw minus Swc
1 minus Swc minus Sor=
Swt minus Swc minus Cw1 minus Swc minus Sor
(5)
511 Total oil flow rate To develop an expression for the total oil flow rate we combine Darcyrsquos and mass conservation laws together
512 Darcyrsquos law Integration of differential Darcyrsquos law equation for emulsion flow results in
qo = krwSo g sinθ int dενem
infin0 = (6)
Page 55 of 69
qo = kkrocwgsinθSio + Cw minus Sor
1 minus Swc minus Sora
(1 minus (eminus Uεα ))aSoρemmicroem
infin
0 dε
ρem = ρwSw + ρo(1 minus Sw) = (ρw minus ρo)Sw + ρo (8)
Combining equation 1 and equation 8 gives
ρemmicroem
= [(ρw minus ρo)((1minus Sor) + (Sio minus Sor)(1minus eminus Uεα ))minusCw)] + ρo
microw + microo + (25microw + microo)Cwmicrowmicroo
+ 1
(9)
Substituting equation 9 in equation 8 gives
qo = kkrocwgsinθ times
Sio + Cw minus Sor
1 minus Swc minus Sora
(1 minus (eminus Uεα ))aSo([(ρw minus ρo)((1 minus Sor) + (Sio minus Sor)(1 minus eminus Uεα ))minusCw)] + ρo) microwmicroo+ 1
microw + microo + (25microw + microo)Cw
infin
0 dε
(10)
Let 119880120576120572
= 119883 then previous equation becomes below (Equation 11)
q =kkrocw gsinθα
Utimes
Sio + Cw minus Sor
1 minus Swc minus Sora
(1 minus (eminus x))aSo([(ρw minus ρo)((1 minus Sor) + (Sio minus Sor)(1 minus eminus x))minusCw)] + ρo) microwmicroo+ 1
microw + microo + (25microw + microo)Cw
infin
0 dX
(11)
Repeating the material balance same as previous chapter the rate of increase of oil flow across the differential element is related to the advance rate of the steam chamber interface
partqopartx
= OslashΔSo(partypartt
) (12)
The advance velocity interface is
U = minuscosθ (partypartt
) (13)
Page 56 of 69
sinθcos θ
= partypartx
(14)
Simplifying equation 11 knowing ex = δ gives
119902119900 =119896119896119903119900119888119908 119892119904119894119899120579120572
119880times
(1 minus (120575minus 1))119886119878119900((120588119908 minus 120588119900)[(1 minus 119878119900119903) + (119878119894119900 minus 119878119900119903)(1 minus 120575minus 1) minus 119862119908] + 120588119900) 120583119908120583119900
+ 1
(120583119908 + 120583119900 + (25120583119908 + 120583119900)119862119908)120575
infin
1 119889120575
(15)
Substituting equation 12 and 13 in equation 11 with using the geometrical relation of equation 15 gives the total volumetric oil flow rate as
119902119900 = 2119871 times
119896119896119903119900119888119908 119904119894119899120579119892Oslash1205721198781198742(1 minus (120575minus 1))119886((120588119908 minus 120588119900)[(1 minus 119878119900119903) + (119878119894119900 minus 119878119900119903)(1 minus 120575minus 1) minus 119862119908] + 120588119900) 120583119908120583119900
+ 1
(120583119908 + 120583119900 + (25120583119908 + 120583119900)119862119908)120575
infin
1 119889120575
(16)
52 Model Result
521 Model Verification Figure 15 compares the oil phase mobility with respect to distance beyond the interface estimated using 1) the proposed model (two phase flow) 2) Butlerrsquos model and 3) Sharma and Gatesrsquo model Same as single phase model in previous chapter the oil mobility at any distance calculated from the proposed model is lower than that from Butlerrsquos model and lower than that from Sharma and Gatesrsquo model
522 Sensitivity Analysis Sensitivity analysis is done to investigate the dependence of oil flux and total oil production rate on m α and μwater which control emulsion viscosity
523 Emulsion Mobility
Page 57 of 69
Effect of m Figure 16 (a) shows the effect of m on the oil mobility versus distance The results reveal that the smaller the m the smaller the oil mobility profile is As we described in previous section increasing m increases μem so the oil mobility will be lower due to higher μem
Effect of α Figure 16 (b) shows the oil mobility with respect to distance at several thermal diffusivities Increasing α enhances the efficiency of heat transfer and therefore in a specific distance higher the α equals higher oil mobility The maximum oil mobility occurs closer to the edge when α is smaller
Effect of μw Figure 16 (c) shows that μw does not have any significant effect on oil mobility
524 Field data analysis In this section we use the proposed model to predict oil production rate at the field scale Figure 17 compares the oil production rate by the proposed model with Butlerrsquos (1985) and Sharma and Gatesrsquo (2010) models for six different field production data Butlerrsquos model overestimates the oil production rate because there is no consideration of emulsion and multiphase effects Oil flows easily because there is no relative permeability effect to limit the oil flow
The results reveal that the proposed model provides an improved estimate of oil production rate under a series of specific values of α and m reported from field data of Athabasca deposit It demonstrates that emulsification effect at the edge of steam chamber should be included in the SAGD analysis
Page 58 of 69
Figure 15 Comparison of oil mobility in different models
0
200
400
600
800
1000
0 1 2 3 4 5 6
Emul
sion
Mob
ility
mD
cp
Distance Deyond Steam Chamber Edge (m)
Single phse Theory
Butlers model
Gates Model
Two Phase Theory
Page 59 of 69
(a) (b)
(c)
Figure 16 (a) Effect of temperature viscosity parameter (m) (b) thermal diffusivity (α) and (c) water viscosity (microw) on oil mobility with respect to distance beyond the edge of the steam
chamber
Page 60 of 69
Figure 17 Comparison of SAGD models for different field operations data
0
100
200
300
400
Chr
istin
a L
ake
Surm
ont
Dov
er U
TF
Phas
e B
Han
ging
-sto
ne
Hild
a L
ake
Col
d L
ake
Wol
f Lak
e C
old
Lak
e
Oil
Prod
uctio
n R
ate
(m3 d
ay)
Fields
Field Data
Current Theory
Sharma amp Gates Model
Butlers Model
Page 61 of 69
6 Chapter 6 Conclusion
An analytical model for lateral expansion of steam chamber during SAGD process is derived with incorporation of formation and transport of water-in-oil emulsion It is assumed that emulsion is generated due to condensation of steam penetrated into the heated bitumen We also assume that the transport of emulsified water is fully coupled with that of the continuous oil phase and therefore use Darcyrsquos law for modeling emulsion flow The key mechanisms accounted for in this model are alteration of bitumen viscosity and thermal effect The new model reveals that the oil viscosity is set by the balance between temperature gradient due to heat conduction and microbubble concentration gradient due to emulsification There are two controlling parameters temperature-viscosity parameter and thermal diffusivity A comparative application of the proposed model and other SAGD models on different field data reveals that emulsification effect should be included in the SAGD analysis By considering emulsion in the proposed model prediction of oil flow rate improved comparing with Butlerrsquos model A need for extension of the model in case of extensive condensation andor high initial water saturation made us to extend the single phase model The extended model accounts for the flow of water as a separate continuous phase It is assumed that emulsion is generated due to condensation of steam dispersed in oil phase while the rest of water condensation flows as a continuous phase Considering emulsion in the proposed model improved oil flow rate prediction The two phase model with emulsion effect simulates the real condition in the reservoir
A more detailed analysis of effective parameters on emulsion formation in the reservoir during SAGD process is needed for further studies Validation of the model with experimental data came from the laboratory would be valuable as well
Page 62 of 69
Nomenclature
a Corey parameter (dimensionless) Am1 Constant cp volumetric heat capacity of oil sands (Jm3-deg Celsius) g acceleration dure to gravity (ms2) h reservoir thickness (m) Hf heat trnsfered to residual oil connate of warer and reservoir rock (J) Ho heat transferred to the oil stream (J) Hr heat tranasferred to oil saturated reservoir (J) k permeability (m2) kab absolute permeability of the reservoir (m2) krow relative permeability of oil with respect to water (dimensionless) krocw relative permeability of oil at connate water saturation (dimensionless) kTH thermal conductivity (Js m-deg Celsius) L length of the production well (m) m temperature viscosity parameter (dimensionless) Q volumetric oil flow rate (m3s) qo oil flow rate per unit well length (m2s) Rg weigthed (mass) steam oil ratio Sio initial oil saturation (dimensionless) So oil saturation (dimensionless) Sor residual oil saturation (dimensionless) Sw water saturation (dimensionless) Swc connate water saturation (dimensionless) SwD normalised water saturation (dimensionless) T temperature (degree celsius) T imensionless temperature (dimensionless) TR initial reservoir temperature (degree celsius) TS steam temperature (degree celsius) Tm Temperature of heated bitumen (degree celsius) t time (s) U advanced velocity of steam chamber edge measured normal to the interface
(ms) V rise velocity of steam chamber (ms) x distance measured in the horizontal direction (m) xi interface position (m) y distance measured in the vertical direction (m) z distance measured parallel to the well direction (m) Greek Symbols
Page 63 of 69
α thermal diffusivity (m2s) β factor in flow rate equation with emulsion at the chamber edge Ф porosity (dimensionless) microo dynamic oil viscosity (kgms) micros dynamic steam viscosity (kgms) microw dynamic water viscosity (kgms) microem dynamic emulsion viscosity (kgms)
θ angle between the steam chamber edge and the horizontal axis (dimensionless) ε distance beyond the steam chamber edge measured in the direction normal
to it (m) λ latent heat of condensation (Jkg) λo oil mobility (m3skg) ν dispersed phase volume fraction (dimensionless) υs kinematic oil viscosity at steam temperature (m2s) υo kinematic oil viscosity (m2s) ρ rock density (kgm3) ρcCc volumetric heat capacity of steam chamber excluding condensate (kJdegC
m3) ρo oil density (kgm3) ρoCo volumetric heat capacity of oil ρem emulsion density (kgm3) ρw water density at reservoir temperature (kgm3) ρwCw volumetric heat capacity of water ρs bitumen density at steam temperature
Page 64 of 69
BIBLIOGRAPHY
1 Ahmed M Jaafar M Z Wan Sulaiman W R amp Hashim M (2014 March) Miscible Flood Performance of Heterogeneous Layered Reservoirs Considering Profile Control Through Controlled Fluid Movements In Offshore Technology Conference-Asia Offshore Technology Conference
2 Alali N Pishvaie M R amp Jabbari H (2009) A new semi-analytical modeling of steam-
assisted gravity drainage in heavy oil reservoirs Journal of Petroleum Science and Engineering 69(3) 261-270
3 Akin S (2005) Mathematical modeling of steam assisted gravity drainageSPE Reservoir Evaluation amp Engineering 8(05) 372-376
4 Azad A amp Chalaturnyk R J (2010) A mathematical improvement to SAGD using geomechanical modelling Journal of Canadian Petroleum Technology49(10) 53-64
5 Azad A amp Chalaturnyk R J (2012) An improved SAGD analytical simulator Circular steam chamber geometry Journal of Petroleum Science and Engineering 82 27-37
6 Al-Bahlani A and Babadagli T (2009) SAGD laboratory experimental and numerical simulation studies A review of current status and future issues Journal of Petroleum Science and Engineering 68(3-4) 135-150
7 Azom P N amp Srinivasan S (2009 October) Mechanistic modeling of emulsion formation and heat transfer during the steam-assisted gravity drainage (SAGD) process In SPE Annual Technical Conference and Exhibition Society of Petroleum Engineers
8 Azom P N (2013) Improved modeling of the steam-assisted gravity drainage (SAGD) process PhD thesis
9 Azom P N Kamp A amp Srinivasan S (2013 June) Characterizing the Effect of Heat Transfer on Multiphase Flow during the Steam-Assisted Gravity Drainage (SAGD) Process In SPE Heavy Oil Conference-Canada Society of Petroleum Engineers
Page 65 of 69
10 Becker J R (1977) Crude Oil Waxes Emulsions and Asphaltenes Pennwell Tulsa OK
pp 16ndash26 pp 62ndash63 pp 84ndash86
11 Bharatha S Yee C-T Chan MY (2005) Dissolved gas effects in SAGD Paper 2005-176 Pet Soc 6th Canadian Int Pet Conf (56th Annual Tech Meet) Calgary Canada June
12 Birrell GE (2001) lsquoHeat transfer ahead of a SAGD steam chamber a study of thermocouple data from Phase B of the underground test facility (Dover Project)rsquo SPE 71503 SPE Ann Tech Conf And Exhib New Orleans USA Oct
13 Bosch R Axcell E Little V Cleary R Wang S Gabel R amp Moreland B (2004) A novel approach for resolving reverse emulsions in SAGD production systems Canadian Journal of Chemical Engineering 82(4) 836-839
14 Brooks R H amp Corey T (1964) Hydraulic properties of porous media
15 Broughton G amp Squires L (1938) The viscosity of oil-water emulsions Journal of Physical Chemistry 42(1) 253-263
16 Butler RM (1991) Thermal Recovery of Oil and Bitumen Prentice-Hall Englewood Cliffs New Jersey
17 Butler R M (1985) New approach to the modelling of steam-assisted gravity drainage Journal of Canadian Petroleum Technology 24(3) 42-51
18 Butler R M (1987) Rise of Interfering Steam Chambers Journal of Canadian Petroleum Technology 26(3) 70-75
19 Butler R M McNab G S and Lo H Y (1981) Theoretical studies of the gravity drainage of heavy oil during in-situ steam heating Journal of Canadian Petroleum Technology 59 455-460
20 Canbolat S Akin S amp Kovscek A R (2002) A study of steam-assisted gravity drainage performance in the presence of noncondensable gases Paper presented at the Proceedings - SPE Symposium on Improved Oil Recovery 78-89
Page 66 of 69
21 Cokar M Gates I D amp Kallos M S (2013) A New Thermogeomechanical Theory for
Gravity Drainage in Steam-Assisted Gravity Drainage SPE Journal18(04) 736-742
22 Chung K H amp Butler R M (1988) Geometrical effect of steam injection on the
formation of emulsions in the steam-assisted gravity drainage process Journal of Canadian Petroleum Technology 27(1) 36-42
23 Dehghanpour H DiCarlo D A (2013) Drainage of capillary-trapped oil by an immiscible gas Impact of transient and steady-state water displacement on three-phase oil permeability Transport in Porous Media 100 297-319
24 Ezeuko C C Wang J amp Gates I D (2013) Investigation of Emulsion Flow in Steam-Assisted Gravity Drainage SPE Journal 18(03) 440-447
25 Farah M A Oliveira R C Caldas J N amp Rajagopal K (2005) Viscosity of water-in-oil emulsions Variation with temperature and water volume fraction Journal of Petroleum Science and Engineering 48(3-4) 169-184
26 Farouq Ali SM 2008 Practical Heavy Oil Recovery ENCH 647 Lecture Notes Dept of
Chem and Pet Eng University of Calgary 27 Heidari M Pooladi-Darvish M Azaiez J amp Maini B (2009) Effect of drainage height
and permeability on SAGD performance Journal of Petroleum Science and Engineering 68(1) 99-106
28 Irani M amp Cokar M (2014 June) Understanding the Impact of Temperature-Dependent Thermal Conductivity on the Steam-Assisted Gravity-Drainage (SAGD) Process Part 1 Temperature Front Prediction In SPE Heavy Oil Conference-Canada Society of Petroleum Engineers
29 Ito Y amp Suzuki S (1999) Numerical simulation of the SAGD process in the Hangingstone oil sands reservoir Journal of Canadian Petroleum Technology38(09)
30 Kasenow Michael (2002)Determination of hydraulic conductivity from grain size analysis Water Resources Publication
Page 67 of 69
31 Kokal S (2005) Crude-oil emulsions A state-of-the-art review SPE Production and
Facilities 20(1) 5-12
32 Krieger I M amp Dougherty T J (1959) A mechanism for non‐Newtonian flow in suspensions of rigid spheres Transactions of The Society of Rheology (1957-1977) 3(1) 137-152
33 Noik C Dalmazzone C Goulay C amp Glenat P (2005) Characterisation and emulsion
behaviour of athabasca extra-heavy-oil produced by SAGD Paper presented at the SPEPS-CIMCHOA International Thermal Operations and Heavy Oil Symposium Proceedings 2005 A365-A372
34 Mehrotra A K amp Svrcek W Y (1987) Viscosity of compressed cold lake bitumen Canadian Journal of Chemical Engineering 65(4) 672-675
35 Mohammadzadeh O and Chatzis I (2009) Pore-level investigation of heavy oil recovery
using steam assisted gravity drainage (SAGD) Paper presented at the Society of Petroleum Engineers - International Petroleum Technology Conference 2009 IPTC 2009 2 1070-1086
36 Mohammadzadeh O Rezaei N amp Chatzis I (2010) Pore-level investigation of heavy oil and bitumen recovery using solvent -aided steam assisted gravity drainage (SA-SAGD) process Energy and Fuels 24(12) 6327-6345
37 Murtaza M He Z amp Dehghanpour H (2013) An approach to model three-phase flow
coupling during steam chamber rise Canadian Journal of Chemical Engineering
38 Pal R (1998) A novel method to correlate emulsion viscosity data Colloids and Surfaces A Physicochemical and Engineering Aspects 137(1) 275-286
39 Poindexter M K Chuai S Marble R A amp Marsh S (2006) The Key to Predicting Emulsion Stability Solid Content SPE Production amp Operations21(03) 357-364
Page 68 of 69
40 Rabiei Faradonbeh M Harding T G amp Abedi J (2014 June) Semi-Analytical
Modeling of Steam-Solvent Gravity Drainage of Heavy Oil and Bitumen Part 2 Unsteady-State Model with Curved Interface In SPE Heavy Oil Conference-Canada Society of Petroleum Engineers
41 Ronningsen HP (1995) Correlations for predicting viscosity of wo emulsions based on North Sea crude oils Proc SPE IntSymp Oil Field Chem SPE 28968 Houston Texas
42 Sarbar M A amp Wingrove M D (1997 January) Physical and chemical characterization of Saudi Arabian crude oil emulsions In SPE Annual Technical Conference and Exhibition Society of Petroleum Engineers
43 Sasaki K Akibayashi S Yazawa N Doan Q T amp Farouq Ali S M (2001) Experimental modeling of the SAGD process - enhancing SAGD performance with periodic stimulation of the horizontal producer SPE Journal 6(1) 89-97
44 Sasaki K Akibayashi S Yazawa N Doan Q amp Ali S F (2001) Numerical and experimental modelling of the steam assisted gravity drainage (SAGD) process Journal of Canadian Petroleum Technology 40(1) 44-50
45 Sasaki K Satoshi A Yazawa N amp Kaneko F (2002 January) Microscopic
visualization with high resolution optical-fiber scope at steam chamber interface on initial stage of SAGD process In SPEDOE Improved Oil Recovery Symposium Society of Petroleum Engineers
46 Sharma J amp Gates I D (2010) Multiphase flow at the edge of a steam
chamber Canadian Journal of Chemical Engineering 88(3) 312-321
47 Taylor G I (1932) The viscosity of a fluid containing small drops of another fluid Proceedings of the Royal Society of London Series A Containing Papers of a Mathematical and Physical Character 41-48
48 Wei S Lin-Song C Huang S amp Huang W (2014 June) Steam Chamber
Development and Production Performance Prediction of Steam Assisted Gravity Drainage In SPE Heavy Oil Conference-Canada Society of Petroleum Engineers
Page 69 of 69
- Analytical Modeling of Emulsion Flow at the Edge of Steam Chamber During SAGD Process
- 1 Chapter One Introduction
-
- 11 Heavy Oil and Oil Sands
- 12 In-situ Extraction of Heavy Oil
-
- 121 Non-thermal Recovery Methods
- 122 Thermal Recovery Methods
-
- 1221 Steam-Assisted Gravity Drainage and its Variants
- 1222 Original SAGD Concept
-
- 13 Motivation
- 14 Specific Objectives of this Research
- 15 Thesis Outline
-
- 2 Chapter Two Literature Review
-
- 21 Overview
- 22 Analytical Modelling of Steam-Assisted Gravity Drainage (SAGD)
-
- 221 Butler Single Phase Model
- 222 Other Variants of Butlerrsquos Models
- 223 Sharma and Gatesrsquo Multiphase Model
- 224 Energy Balance
-
- 3 Chapter 3 Emulsions in SAGD
-
- 31 Definitions
- 32 Emulsion Characteristics
-
- 321 Droplet Size
- 322 Viscosity
- 323 Color and appearance
-
- 33 Emulsion Stability
-
- 331 Steam Quality
- 332 Temperature
- 333 Initial Water Saturation
- 334 Rate of Steam Injection
- 335 Oil Production Rate
- 336 Pressure
- 337 pH
- 338 Droplet Size
- 339 Heavy Fraction in Crude Oil
- 3310 Solid particles
- 3311 Counter current flow
-
- 34 Thermodynamics of Emulsion
-
- 4 Chapter 4 Single Phase Analytical Modeling of SAGD
- The purpose of this chapter is to develop a new gravity drainage model of mobilized bitumen at the edge of steam chamber which includes emulsion effect in in a single phase system Considering that several SAGD experiments reported water-in-oil emulsi
-
- 41 Proposed Theory
-
- 411 Total oil flow rate
- 412 Darcyrsquos law
- 413 Material balance
-
- 42 Model Results
-
- 421 Model Verification
- 422 Sensitivity Analysis
-
- 43 Dynamic Emulsion Viscosity
- 44 Emulsion Mobility
- 45 Volumetric Oil Flux
- 46 Field data analysis
-
- 5 Chapter 5 Two Phase Analytical Modeling of SAGD
-
- 51 Proposed Theory
-
- 511 Total oil flow rate
- 512 Darcyrsquos law
-
- 52 Model Result
-
- 521 Model Verification
- 522 Sensitivity Analysis
- 523 Emulsion Mobility
- 524 Field data analysis
-
- 6 Chapter 6 Conclusion
-
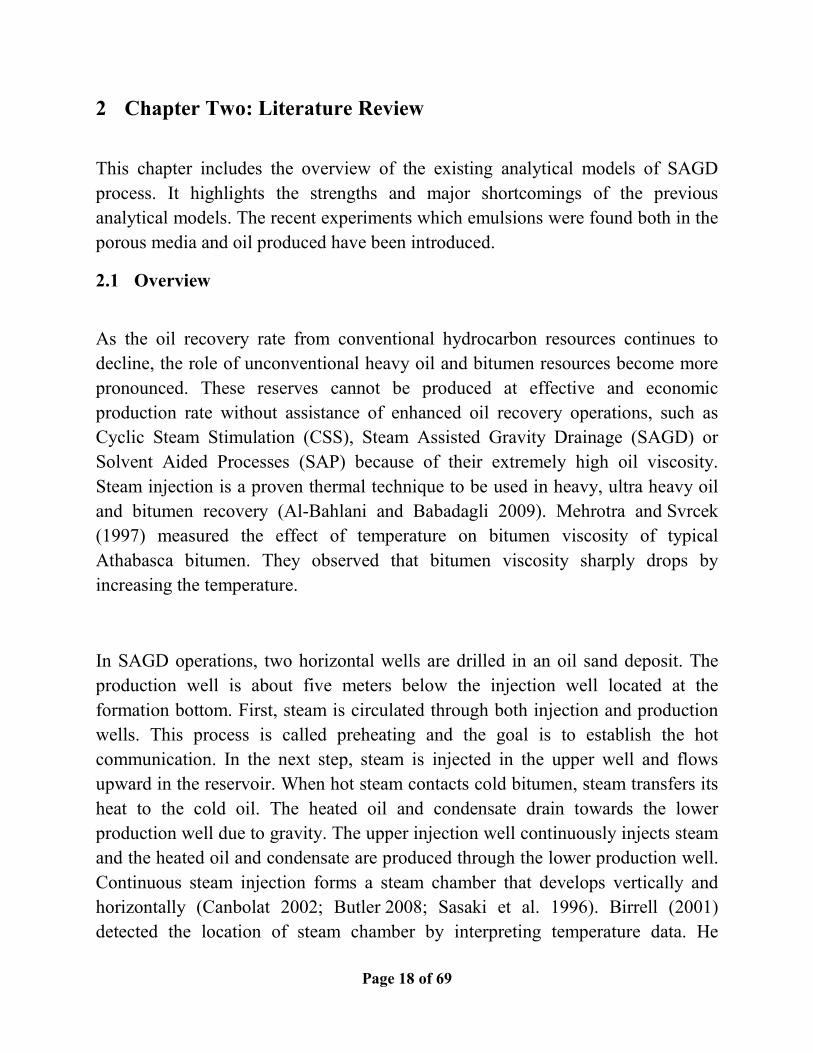
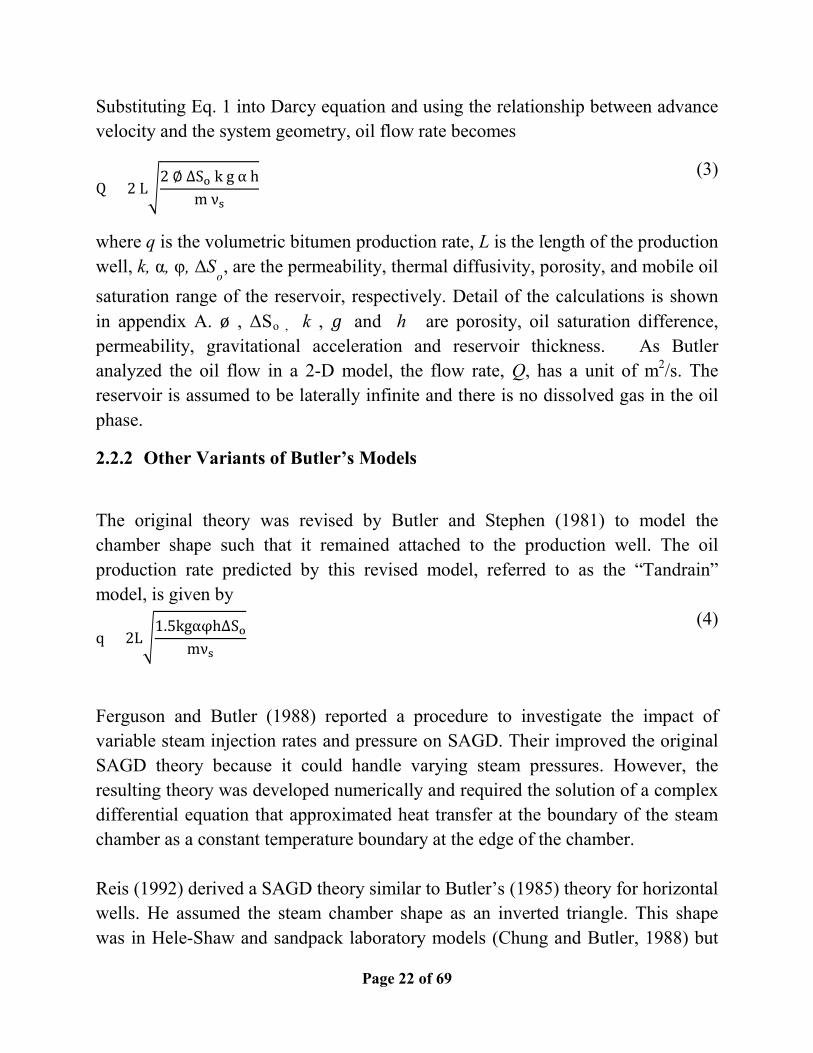

SwD =Sw minus Swc
1 minus Swc minus Sor (8)
Where 119878119908119888 and 119878119900119903 are connate water saturation and residual oil saturation respectively
The oil flow rate equation developed by Sharma and Gates is finally given by
Q = 2L2 α k krocw g empty ΔSo h Г(m + 1)Г(a + 1)
νsГ(m + a + 1) (9)
Г is gamma function The difference between this volumetric flow rate equation and Butlerrsquos model is the following term which accounts for the multiphase effects The detail of the calculations can be found elsewhere (Sharma and Gates 2010)
Г(m + 1)Г(a + 1)Г(m + a + 1)
224 Energy Balance In this section the steam oil ratio is determined by energy balance (Murtaza et al 2014) Based on Butler (1987) there are three types of heat which is transferred to the system The heat transferred to rock residual oil and connate water within the finger is Hf The heat transferred to the oil stream at the edge of steam chamber Ho The heat conducted to the oil saturated reservoir Hr
119867119891 = 120588119888119862119888119881(119879119904 minus 119879119903)119909119894
119867119900 = 119881emptyΔSo(119879119898 minus 119879119903)119909119894[120588119900119862119900]
Where 119879119898 is temperature of heated bitumen 120588119888119862119888 is volumetric heat capacity of steam chamber excluding condensate 119909119894 is interface position of steam and drainage flow 1198601198981 is constant
119867119903 = 119881120588119888119862119888119909119894(119879119904 minus 119879119903) +1198601198981
2 119909119894[emptyΔSo[120588119900119862119900 + 120588119908119862119908](119879119904 minus 119879119903)]
Where 119879119898 = 11986011989812
(119879119904 minus 119879119903) + 119879119903
Page 25 of 69
1198601198981 =119898 + 1119898 + 2 +
120587121205872
160 + 12058732688
120587455296 + 1205875
1351680minus1205876
38338560119898+2
minus 1
120587121205872
160 + 12058732688
120587355296 + 1205875
1351680minus1205876
38338560119898+1
minus 1
The weighted steamoil ratio is given by
Rg´ =(119879119904 minus 119879119903)ΔSo120582empty120588119900
120588119888119862119888 + 1198601198981
2 emptyΔSo[120588119900119862119900 + 120588119908119862119908]
Page 26 of 69
3 Chapter 3 Emulsions in SAGD
A detailed overview of the emulsion characteristics and important factors on emulsion stability has been explained in this chapter
31 Definitions
Emulsification can occur in most of the oil production and processing like inside the reservoir wellbore wellheads and transportation pipelines even in the storages An oil emulsion is a dispersion of water droplets in oil Emulsions can be classified into three groups
bull Water in oil emulsions (WO) bull Oil in water emulsions (OW) bull Complex emulsions
The WO emulsion includes water droplets in a continuous oil phase and the OW emulsion includes oil droplets in a continuous water phase Complex emulsions include tiny droplets suspended in bigger droplets that are suspended in a continuous water phase As a rule of thumb the dispersed phase is the one in the mixture which the volume fraction is smaller compared with the other one (continuous phase) In case that the phase volume ratio is close to 1 other factors will determine the type of emulsion formed (Kokal 2005 Farah et al 2005)
32 Emulsion Characteristics
321 Droplet Size Produced emulsions have droplet diameters 01 μm ndash 50 μm Emulsion droplet size distribution depends on number of factors like IFT nature of emulsifying agents and presence of solids Droplet size distribution may be a factor to determine emulsion stability The smaller the average size of dispersed water droplets the longer the residence time required (Kokal 2005)
Page 27 of 69
322 Viscosity
Due to non-Newtonian behavior of emulsions caused by droplet crowding emulsion viscosity is higher than either oil or water viscosity As a certain value of water emulsions would behave as shear thinning or pseudoplastic fluids as shear rate increases the viscosity decreases (Noik et al 2005) The viscosity data shown in Figure 4 indicates that emulsions exhibit Newtonian behavior up to a water content of 30 (this is indicated by constant values of viscosity for all rates or a slope of zero)(Kokal 2005) For water cuts above 30 the slope would deviate from zero showing the non-Newtonian behavior Kokal (2005) observed in the Saudi Arabian crude emulsions that water cut exceeds than 80 WO emulsion inverts to OW emulsion The viscosity of emulsion is affected by number of parameters like
bull Temperature bull Amount of dispersed water bull Droplet size and distribution bull Oil and water viscosity bull Amount of solid presents bull Rate of shear or shearing force bull Temperature viscosity parameter bull Thermal diffusivity parameter
Among them temperature and amount of dispersed water and rate of shear have the main effect and others have minor effect on the viscosity (Broughton and Squires 1938)
Page 28 of 69
Figure 4 Viscosities of very tight emulsions at 125deg F (Kokal 2005)
From the pore-scale schematic in Figure 5 due to emulsification effect at the water-oil interface a fraction of water flows with the continuous oleic phase in the form of dispersed droplet instead of flowing as a separate continuous phase Emulsification phenomenon at the interface during the advance of steam chamber is not considered in previous analytical models Several authors reported formation of emulsion during SAGD production in the reservoir wellbore wellhead and transportation pipelines (Kokal 2005 Ronningsen 1995)
Figure 5 Pore-scale illustration of fluid occupancies (water oil) at the edge of steam chamber (a) WO emulsion SAGD (b) traditional SAGD (Ezeuko et al 2013)
Page 29 of 69
The viscosity of a liquid which small solid spheres are dispersed in it studies by Einstein in theoretical hydrodynamics Taylor (1932) stated that Einstein analysis may be extended to include the liquid droplets
Based on Taylorrsquos empirical relationship (Taylor 1932)
microemmicro
= 1 + 25 τ + 04τ + 1
x (1)
This equation shows that the viscosity of emulsion increases by increasing the volume fraction of dispersed water at constant temperature Here τ is the ratio between the viscosity water droplets and continuous oil phase 120583119890119898 119886119899119889 120583 are emulsion viscosity and continuous oil phase viscosity respectively and 119909 is the dispersed phase volume fraction Taylorrsquos equation is applicable under the following conditions
a) Low concentration of the dispersed phase (Farah et al 2005) Increasing the dispersed phase concentration increases the chance for interactions among and deformation of the original spherical droplets Based on the experiments when the water saturation exceeds 80 the system inverts to oil-in-water emulsion
b) The radii of dispersed phase droplets do not exceed a certain critical radius (Broughton and Squires 1938)
c) Droplets of the dispersed phase should not be deformed from the original spherical shape (Farah et al 2005)
d) The tangential stress parallel to the surface is continuous at the surface of the droplet so any film existing between the two liquids only transmits tangential stress from one fluid to the other one
In Taylorrsquos relationship viscosity is a function of dispersed phase volume fraction However there are several other correlations describing viscosity as a function of temperature and dispersed phase volume fraction (Farah et al 2005 Broughton and Squires 1938 Pal 1998 Krieger and Dougherty 1959) Here we assume that when Sw lt 06 water droplets do not deform and coalesce Furthermore we assume that the radius of the dispersed droplets does not exceed the critical value
Page 30 of 69
323 Color and appearance The color of the emulsion can vary widely depending on
bull Oilwater content bull Characteristics of the oil and water
The common colors of emulsions are dark reddish brown gray or blackish brown however any color can occur depending on the type of oil and water at a particular facility Emulsion brightness is sometimes used to characterize an emulsion An emulsion generally looks murky and opaque because of light scattering at the oilwater interface When an emulsion has small diameter droplets (large surface area) it has a light color When an emulsion has large diameter droplets (low total interfacial surface area) it generally looks dark and less bright Understanding the characteristics of an emulsion by visual observation is an art that improves with experience (Sarbar and Wingrove 1997)
33 Emulsion Stability
Emulsifiers (surface active agents or surfactants) that concentrate at the oilwater interface and form the interfacial films would stabilize the emulsions They lead to reduction in interfacial tension and emulsification of droplets as well Emulsifiers have higher boiling point fractions such as asphaltenes resins organic acids and bases There are natural and chemical emulsifiers Chemical ones include surfactants that may be injected into formation or wellbore (drilling fluids stimulators) Fine solids may play as an emulsifier The effectiveness of them may depend on some factors like particle size particles interaction and wettability of the particles
From thermodynamic point of view an emulsion is an unstable system It is because each liquidliquid system tends to reduce the interfacial area and energy by separation Emulsions are classified based on their kinematic stability to three groups
Loose emulsions separate in a few minutes Medium emulsions separate in 10 minutes or more Tight emulsions separate partially in hours or days
Page 31 of 69
Interfacial films play an important role in emulsion formation and stability The films are formed due to adsorption of polar and high weight molecules which are active at the interface They would reduce the IFT and increase the interfacial viscosity at the same time The strength of films is a function of temperature pH of water and oil type (polar molecules) The films can be rigid (solid) or mobile (liquid) The rigid films have very high interfacial viscosity like an insoluble skin They provide structural barrier and help to increase emulsion stability Mobile films are characterized by low interfacial viscosity They are less stable Surfactants can modify the stability of films and eventually the emulsions (Poindexter et al 2006) The important factors affecting emulsion stability include the following
331 Steam Quality Chung and Butler (1989) reported from a 2D experimental model no significant difference on emulsification with wet or dry steam They attributed that to the interfacial activities and the heating mechanism being the same at the steam front The comparison was done on a low pressure injection and they did not report any high pressure Their observation supports the fact that steam quality is controlled by reservoir temperature and pressure Although we can control the quality of injected steam to keep it as high as possible it drops as it flows through the reservoir Although Gates and Chakrabarty (2005) stated that the quality of the injected steam should be as high as possible at the sandface because any condensate in the injected fluids falls under gravity from the injector towards the producer and does not deliver a significant amount of heat to the oil sand
332 Temperature Temperature affects the physical properties of oil water and interfacial films surrounding the water droplets that give the emulsions their stability Waxes can dissolve in crude oil when temperature increases Waxes are the main constituents of the interfacial films surroundings the water droplets Hence dissolving of waxes
Page 32 of 69
into the crude oil reduces the chances of water droplets to form as an emulsion Temperature also increases the thermal energy of the droplets and hence increases the frequency of droplet collisions Gradual destabilization of the crude oilwater interfacial films is another result of increasing temperature Increasing temperature causes the reduction in interfacial viscosity of the interfacial films which results in the instability of emulsion Highly viscous interfacial films retard the rate of oil-film drainage providing a mechanical barrier to coalescence (Kokal 2005) However decreasing viscosity of the system causes the higher rate of drainage at the edge which makes the size of the water droplets smaller and more stable and suitable for making emulsion
333 Initial Water Saturation Chung and Butler (1989) noticed a higher water in oil emulsion when Swi = 0 than Swi = 125 They commented that there is less tendency for water to condense as droplets on the surface of oil when enough connate water is available As the droplets of water condense on oil they become ldquoburiedrdquo because of the spreading characteristics of oil It is worth mentioning that Sasaki et al (2002) observed this process in a microscopic visualization experiment m In crude samples with higher value of m the concentration of naturally occurring emulsifiers like higher boiling point fraction in oil is higher Hence the probability of forming emulsions may increase when m increases α For higher value of α which means the heat will diffuse more quickly we expect to have less emulsion Higher rate of heat diffusion results in sharp viscosity drop so the drainage rate will be faster The chance of water droplet coalescence may be more than having dispersed water droplets as emulsions
334 Rate of Steam Injection
Page 33 of 69
Higher injection rate can make a faster drainage rate at the edge and may enhance droplet coalescence Hence higher injection rate can result into less emulsification
335 Oil Production Rate In higher oil production rate water droplets may have more chance to coalescence so even when there are some emulsions in the system they would disappear
336 Pressure Chung and Butler (1989) conducted high pressure experiments on the steam assisted gravity drainage process using a scaled physical model The results showed that the pressure variation of steam injection does not have significant effect on the emulsified water ratio It is well-known that naturally occurring emulsifiers are concentrated in heavy fraction in crude oil such as asphaltenes resins and oil-soluble organic acids (Kokal 2005) These components are the main constituents of the interfacial films surrounding the water droplets that give the emulsions their stability Therefore it can be interpret that the steam injection pressure does not significantly affect the emulsion stability
337 pH For oil-water systems there exists an optimum pH range for which the interfacial film exhibits minimum emulsion stabilizing The optimum pH for maximum emulsion stability depends on both the oil and water composition (Kokal 2005)
338 Droplet Size When the size of the water droplet is smaller forming emulsion is easier Generally the emulsions that have smaller-sized droplets will be more stable (Kokal 2005)
Page 34 of 69
339 Heavy Fraction in Crude Oil Asphaltenes resins and oil soluble organic acids (eg carboxylic and naphthenic acids) are the main part of the interfacial film They reside at the oil- water interface because of their surface active properties The accumulation of them at the interface results in the formation of a rigid film (Kokal 2005) There are still debates on the resins and waxes effect on emulsion stability in the literature while the effect of asphaltenes on increasing emulsion stability has been approved Crude oil that has low cloud point have greater tendancy to form stable and tight emulsions
3310 Solid particles Fine solid particles present in the crude oil are capable to stabilize the emulsion They diffuse to the oil-water interface where they form rigid structure to form emulsion and help to inhibit of emulsion coalescence If the solid particles at the interface are charged they may increase the stability of the emulsion To act as a stabilizer the size of the solids should be smaller than the size of the emulsions When the solids are oil wet like asphaltenes and waxes a water in oil emulsion will result because the particles partition into oil phase and will prevent the coalescence of water droplets Similarly water wet solid like CaCO3 and CaSO4 (clays and sands) will stabilize oil in water emulsion(Kokal 2005)
3311 Counter current flow Counter current flow increases the chance of emulsion formation Chung and Butler (1989) observed much higher wateroil emulsion content in the produced fluid when the steam chamber was rising in the experiment with bottom steam injection than with injection at the top
34 Thermodynamics of Emulsion
Page 35 of 69
As mentioned previously in this chapter emulsions are thermodynamically unstable Emulsification is an exothermic process and can be described in two steps Step 1 is transferring of water micro bubbles across the bitumen interface (Equation 2) the enthalpy released is the heat which is generated and transferred to bitumen Step 2 is the process of encapsulation of emulsions into bitumen(Equation 3) The reactions are first order and dependent on the emulsion concentration The stoichiometric constants A B X and Y will be determined by experimental analysis (Ezeuko et al 2013) X(H2O) Y(Emulsion) [ΔH Emulsification] (2) A(Emulsion)+B(Bitumen) D (WOEmulsion) (3) Kumar et al (2012) studied effect of in situ emulsion in heavy oil recovery Since the key problem in heavy oil is sweep efficiency and flow rate They proposed using Alkaline surfactant flooding can form WO emulsion based on the solubility of the surfactant If the OW emulsion formed the viscosity would be lower than the original oil Bypassed oil can be emulsified at the surface of water fingered mobilized and produced at relatively low pressure gradient
Page 36 of 69
4 Chapter 4 Single Phase Analytical Modeling of SAGD The purpose of this chapter is to develop a new gravity drainage model of mobilized bitumen at the edge of steam chamber which includes emulsion effect in in a single phase system Considering that several SAGD experiments reported water-in-oil emulsion we restrict water fraction evaluated in our model to be less than 80 We develop a new analytical oil drainage model by extending Butlerrsquos (1985) and Sharma and Gatesrsquo (2010) models to account for water-in-oil emulsification effect The oil flow rate from the new theory is calculated and compared with other analytical SAGD theories and with the production data from several existing SAGD operations as well as experimental data Overestimation of oil flow rate calculated by Butlerrsquos model is clearly predictable Sharma and Gates tried to address overestimation problem of Butlerrsquos model by considering multiphase effects and adding relative permeability into Butlerrsquos model
Assumptions of the model are as follow 1 Heat transfer ahead of the chamber edge is only by conduction 2 All the water is emulsified in the system 3 Porous medium is homogeneous (constant porosity and permeability) 4 Heat losses are neglected 5 Density is dependent on temperature 6 Steam chamber that has reached the maximum height h and is expanding at a
constant velocity U in the direction perpendicular to the chamber walls 7 Reservoir oil does not have any solution gas 8 Heat transfer and mass transfer is directed normal to the edge of the chamber
41 Proposed Theory
Figure 6 shows a conceptual model of a differential element at the edge of the steam chamber As the distance beyond the steam chamber edge increases the temperature decreases from steam temperature to reservoir temperature In this
Page 37 of 69
model all of the water in the formation is assumed to be emulsified in the oil phase Emulsion concentration decreases from a maximum value at the chamber interface to zero far from the interface Water saturation is maximum at the chamber edge (ε = 0) and it equals to the connate water saturation far enough from the edge
Emulsion at the steam chamber interface is a system of immiscible fluids with water droplets as the dispersed phase and oil as the continuous phase Therefore Taylor equation becomes
microemmicroo
= 1 + 25
microwmicroo
+ 04microwmicroo
+ 1 Sw (1)
There are several other equations for calculating emulsion viscosity at certain conditions At high concentration of dispersed phase the droplets can interact and deform from the spherical shape Yaron and Gal-Or (1972) and Choi and Schowater (1975) suggested correction factors for Taylor equation to take into account the deformation of droplets Both models describe the viscosity variation as a function of dispersed phase volume fraction but not the temperature In our model which we used Taylor equation we consider the effect of temperature with using the relation of water saturation with distance and temperature Several authors proposed correlation for the viscosity of WO emulsion as a function of temperature and dispersed phase volume fraction like Ronnigsen (1995) Richardson (1950) and Walther (1931)
In our theory we assume that all the water is emulsified in the oil phase This assumption is in agreement with the experimental study conducted by Noik et al (2005) to characterize the water-in-oil emulsion produced by SAGD operation Based on their results when the water cut is about 40 water is totally emulsified They also mentioned that a threshold energy exists above which the oil-water system tends to be totally emulsified
By solving Eq 1 we have
microem =microw + microo + (25microw + microo)(Sw)
microwmicroo+ 1
(2)
Page 38 of 69
Figure 6 Schematic illustration of temperature dispersed and continuous phase volume fraction emulsion concentration and emulsion viscosity with respect to the distance beyond the
steam chamber edge (ε )
We also assume that oil saturation is a linear function of temperature ahead of the interface with an assumption that conductive heat transfer dominates beyond the steam chamber edge
Sw = 1 minus So = (1 minus Sor) minus (Sio minus Sor)(1 minus Tlowast) = (1 minus Sor) minus (Sio minus Sor) 1 minus eminusUεα (3)
This relationship which was first proposed by Sharma and Gates (2010) requires the assumption of similar length scales for capillary diffusion and thermal diffusion According to Azom et el (2013) this assumption can hardly be justified for a capillary dominated flow at the edge of the steam chamber However in the presence of emulsions the length scale of saturation advection can be assumed to be similar to that of thermal convection It should be noted that emulsions are generated primarily by condensation of penetrated steam (Mohammadzadeh and Chatzis (2009)) and therefore heat transport ahead of the steam chamber is controlled by both conduction and convention mechanisms (Azom and Srinivasan (2009))
Page 39 of 69
Eventually water saturation becomes a function of distance (ε) beyond the steam
chamber interface Substituting 1microo
= δminusm
micros and Eq3 into Eq2 the dynamic emulsion
viscosity as a function of distance beyond the steam chamber interface is given by
microem =microw + micros
δminusm + 25microw + microsδminusm [(1 minus Sor) minus (Sio minus Sor)(1 minus δminus1)]
microwδminusm
micros+ 1
(4)
Where 120633 = 119942119932120634120630
Therefore emulsion mobility defined by λoil = kρemνem
= kmicroem
is given by
λoil =k microwδ
minusm
micros+ 1
microw + microsδm + (25microw + microsδm)[(1 minus Sor) minus (Sio minus Sor)(1 minus δminus1)] (5)
Figure 7 Cross sectional view of a typical SAGD process and expanded view of a differential element at the edge of steam chamber (modified from Sharma and Gates 2010)
411 Total oil flow rate Here we follow Butlerrsquos approach (Butler et al 1981) to develop an expression for the total oil flow rate by combining Darcyrsquos and mass conservation laws
Page 40 of 69
412 Darcyrsquos law Integration of differential Darcyrsquos law equation for emulsion flow results in
qo = k So g sinθ int dενem
infin0 = k So g sin θint ρem
microem dεinfin
0 (6)
Let A = U α x = Aε dx = Adε dε = 1A
dx
qo =k g sinθ
A
So(amicrowmicroseminus(m+1)x + aeminusx + ρo
microwmicros
eminusmx + ρo)
microw + microsemx + 25(Sio minus Sor)microweminusx + micros(Sio minus Sor)e(mminus1)x dxinfin
0
(7)
Let δ = ex dδ = exdx therefore dx = eminusxdδ = 1δ
dδ
qo =k g sinθmicrosA
So
amicrowδm+1 + amicros
δ + ρomicrowδm + ρomicros
1δ
microw + microsδm + 25(Sio minus Sor)microwδ + micros(Sio minus Sor)δmminus1
dδinfin
1
(8)
qo =k g sinθmicros A
So
amicrowδm+1 + amicros
δ + ρomicrowδm + ρomicros
microwδ + microsδm+1 + 25(Sio minus Sor)microw + micros(Sio minus Sor)δminfin
1dδ (9)
Substituting A= U α gives
qo =k g sinθmicroS U
So
amicrowδm+1 + amicros
δ + ρomicrowδm + ρomicros
microwδ + microsδm+1 + 25(Sio minus Sor)microw + micros(Sio minus Sor)δmdδ
infin
1 (10)
Here it is assumed that steam density is significantly lower than emulsion density 119892 is the acceleration due to gravity and ө is the local inclination angle for the steam chamber interface Eq 10 gives the relative flow rate of oil per unit well length assuming single-phase flow of emulsion Here we are assuming that water flow is fully coupled to oil flow An analogous assumption was made by Dehghanpour and DiCarlo (2013) who measured and modeled coupled flow of water and mobilized oil in a tertiary gas flood We also assume that the size of water droplets is comparable to that of typical pore-throat in oil sand deposits
Page 41 of 69
Combining Eq4 with Eq6 gives
qo = k So ρem g sin θ microwmicros
δminusm + 1
microw + microsδm + (25microw + microsδm)[(1 minus Sor) minus (Sio minus Sor)(1 minus δminus1)]
infin
0dε (11)
The emulsion density ρem as a function of distance beyond the steam chamber edge is given by
ρem = ρwSw + ρo(1 minus Sw) = (ρw minus ρo)Sw + ρo (12)
Combining Eq12 with Eq3 gives
ρem = (ρw minus ρo) lowast (1 minus Sio) + (sio minus sor) eminusUε α + ρo (13)
Substituting Eq13 into Eq 11 and re-arranging gives
qo =k g sinθmicroSU
β (14)
Where β = intSo
amicrowδm+1+
amicrosδ +ρomicrowδm +ρomicros
microwδ+microsδm+1+25(SiominusSor)microw+micros(SiominusSor)δmdδinfin
1 and a = (120588119908 minus 120588119900)(119878119894119900 minus
119878119900119903) This equation is not the final solution for oil flowrate since U and Sin θ are unknown
413 Material balance From the material balance the rate of increase of oil flow across the differential element displayed in Figure 7 is related to the advance rate of the steam chamber interface The material balance relationship can be expressed as
120597119902119900120597119909
= empty Δ119878119900(120597119910120597t
) (15)
The advance velocity of interface U is given by
Page 42 of 69
U = minus cos 120579120597119910120597119905
(16)
U is growth velocity normal to the edge of steam chamber
Substituting Eq 15 and Eq 16 into Eq 14 and recalling that sin120579cos120579
= 120597119910120597x
results in
qo partqo = k g sin θ β empty ΔSo
microSparty (17)
Integrating the left side of Eq 17 from 0 to 119902119900 and the right side from 0 to h (the height of steam chamber) gives the total oil flow rate per unit well length for one side of the steam chamber Therefore the total volumetric oil flow rate is given by
Qo = 2L 2 k g sinθ β empty ΔSo
microS
Here 120573 accounts for in-situ emulsification phenomenon and replacing it with 120572119898
gives Butlerrsquos original solution
42 Model Results
421 Model Verification Table 1 lists the parameters from a physical model experiment (Sasaki et al 2001) which are used in the model verification and sensitivity analysis
Page 43 of 69
(a) (b)
Figure 8 Comparison of oil phase mobility from Butlerrsquos and the current theory with respect to distance beyond the edge of a steam chamber using Sasaki et al (2001) experimental data (a)
with no temperature effect (b) with no emulsion effect
Page 44 of 69
Table 1 Parameters from Sasaki et al (2001) Experimental Data
Parameters Value
Tr (C) 20
Ts (C) 106
ρo (kgm3) 998
h (m) 03
L (m) 00045
empty 038
α (m2s) 260x10-7
kab (m2) 115x10-10
Kro 04
Sio 1
Sorw 005
Swc 0
νs (m2s) 12010x10-4
m 36
a 1
Figure 8 (a) compares the proposed model with Butlerrsquos model in the absence of temperature effect (m=0) The current model converges to Butlerrsquos model far enough from the chamber edge As the distance increases emulsion concentration approaches to zero so there is no emulsion effect in the formation and the proposed model converges to Butlerrsquos single-phase model as expected Figure 8 (b) compares the current model with Butlerrsquos in the absence of emulsion effect Emulsion viscosity is the same as oil viscosity and the emulsion mobility curve are exactly the same for the two models so the current model matches with Butlerrsquos model
Page 45 of 69
Figure 9 compares the oil phase mobility with respect to distance beyond the interface estimated using 1) the proposed model 2) Butlerrsquos model and 3) Sharma and Gatesrsquo model The results show that the oil mobility at any distance calculated from the proposed model is lower than that from Butlerrsquos model and higher than that from Sharma and Gatesrsquo model The oil phase mobility in the proposed model exponentially decreases with increasing distance which is similar to Butlerrsquos but smaller due to the effect of emulsification Because there is no consideration of multiphase and emulsion effect Butlerrsquos model has the highest oil mobility When there is no other fluid the pore network is exclusively available for oil flow Sharma and Gates considered multiphase effect by adding relative permeability to Butlerrsquos model Multiphase assumption allocates a share of fluid path to oil in Sharma and Gatesrsquo model Therefore the oil mobility in their model is lower than that in Butlerrsquos Though emulsion increases effective oil viscosity our model has a higher mobility than Sharma and Gatesrsquo model because we ignore multiphase effect in the presence of emulsion
Figure 9 Comparison of emulsion mobility with respect to ε from Butlerrsquos Sharma and Gatesrsquo and the proposed model using Sasaki et al (2001) experimental data
0
200
400
600
800
1000
0 3 6 9 12 15
Oil
Mob
ility
(mD
cp)
Distance Beyond Steam Chamber Edge (m)
Current Theory
Butlers model
Sharma and Gates Model
Page 46 of 69
(a) (b)
Figure 10 Dynamic Viscosity of pure bitumen and emulsion with respect of distance beyond edge of steam chamber for different values of (a) m and (b) α
422 Sensitivity Analysis
In this part we conduct a sensitivity analysis to investigate the dependence of oil flux and total oil production rate on m α and μwater which control emulsion viscosity
43 Dynamic Emulsion Viscosity Figure 10 shows how the viscosity of emulsion and pure bitumen change with respect to the distance from the chamber edge at different values of (a) α and (b) m At a specific distance μem increases by increasing m while μem decreases by increasing α Furthermore μem- ε is steeper at lower values of α and at higher values of m
44 Emulsion Mobility Effect of m Figure 11 (a) shows the effect of m on the oil mobility versus distance The results reveal that the smaller the m the larger the oil mobility is As we described in previous section increasing m increases μem so the oil mobility
Page 47 of 69
will be lower due to higher μem Oil mobility increases with increasing temperature as a result of decreasing viscosity
Effect of α Figure 11 (b) shows the oil mobility with respect to distance at several thermal diffusivities Increasing α enhances the efficiency of heat transfer and therefore increases the oil mobility
Effect of μw Figure 11 (c) shows that μw does not have any significant effect on oil mobility μw is significantly smaller than bitumen viscosity and thus it does not affect the oil mobility Furthermore based on Eq5 the multiplier of oil viscosity is
orders of magnitude larger than that of water viscosity (119890119880120576120572 119898 gtgt 1 gtgt 119890minus 119880120576120572 119898)
45 Volumetric Oil Flux
Figure 12 (a) to (d) compares the effects of α U m and microw on volumetric oil flux respectively As expected increasing α increases the oil flux due to faster heat transfer and increasing m decreases the oil flux as oil becomes more viscous Increasing U gives lower oil flux since there will be less time to receive condensate thermal energy As mentioned before μw does not affect the oil mobility and thus changing water viscosity does not considerably affect volumetric oil flux
46 Field data analysis
In this section we use the proposed model to predict oil production rate at the field scale Figure 13 compares the oil production rate by the proposed model with Butlerrsquos (1985) and Sharma and Gatesrsquo (2010) models for six different field production data Properties of the 6 fields are listed in Table 2 Butlerrsquos model overestimates the oil production rate because there is no consideration of emulsion and multiphase effects Oil flows easily because there is no relative permeability effect to limit the oil flow Therefore the values estimated by Butlerrsquos model are higher than those predicted by the other two models Sharma and Gates considered multiphase effect in their model by adding relative permeability to Butlerrsquos model
Page 48 of 69
Their model has more accurate results than Butlerrsquos but it does not consider emulsion effect which many authors reported in their observations
The results reveal that the proposed model provides an improved estimate of oil production rate under a series of specific values of α and m reported from field data of Athabasca deposit It demonstrates that emulsification effect at the edge of steam chamber should be included in the SAGD analysis Our model assumes that the entire flow system is single phase Hence there is a potential that this model overestimates the oil flow rate
(a) (b)
(c)
Figure 11 (a) Effect of temperature viscosity parameter (m) (b) thermal diffusivity (α) and (c) water viscosity (microw) on oil mobility with respect to distance beyond the edge of the steam
chamber
Page 49 of 69
(a) (b)
(c) (d)
Figure 12 Effect of (a) thermal diffusivity (b) advance velocity of steam chamber (c) temperature viscosity parameter and (d) water viscosity on volumetric oil flux profile for
Christina Lake reservoir
(a) (b)
Page 50 of 69
Figure 13 Comparison of SAGD models for different field operations data
Table 2 Comparison of SAGD models for different field operations data (After Sharma and Gates 2010)
Wellpair A3 A Phase B
Average of 3 well pairs
Average of 15 well pairs A B C D EG
H IJ K LM N O P
amp Q
I3P3
B10 grand rapids SD9
pad average of 6 well pairs
Parameters Christina
Lake Surmont
Dover UTF Phase B
Hangingstone Hilda Lake
Cold Lake
Wolf Lake Cold Lake
TR 20 15 7 20 20 20
Ts 220 225 220 260 245 250
ρs (kgm3) 880 880 880 980 880 980
ρo (kgm3) 1009 1009 1009 1015 1009 1015
0
100
200
300
400
Chr
istin
a L
ake
Surm
ont
Dov
er U
TF
Phas
e B
Han
ging
-sto
ne
Hild
a L
ake
Col
d L
ake
Wol
f Lak
e C
old
Lak
eOil
Prod
uctio
n R
ate
(m3 d
ay)
Fields
Field DataCurrent TheorySharma amp Gates ModelButlers Model
Page 51 of 69
h (m) 26 30 21 25 24 11
L (m) 690 850 500 500 1000 500
ф 033 033 033 035 035 032
α (m2s) 5501x10-7 0201 x10-
7 3601 x10-7 260 x10-7 036 x10-7 300 x10-7
kab (m2) 60x10-12 50x10-12 70x10-12 50x10-12 50x10-12 30x10-12
Kro 02 02 02 03 02 03
Sio 080 079 085 077 063 075
Sorw 01 012 015 01 012 01
Swc 015 01 01 01 01 01
νs (m2s) 681x10-6 341x10-6 795x10-6 428x10-6 341x10-6 408x10-6
m 4 5 5 5 5 4
microw (kgms) 000085 000096 000117 000085 000085 000085
ρw (kgm3) 998 999 999 998 998 998
Oil flow rate q (m3day)
Field data 170 50 77 82 65 50
Butler et al (1981)
262 379 148 229 359 131
Sharma and Gates
173 75 80 91 72 39
Current Theory 177 59 84 95 75 48
Page 52 of 69
5 Chapter 5 Two Phase Analytical Modeling of SAGD
The purpose of this chapter is to modify the single phase gravity drainage model developed in previous chapter to derive a two phase model The model includes the effect of multi-phase flow (relative permeability) and oil saturation on oil mobility and drainage rate
Assumptions of the model are as follow
1 The reservoir is homogeneous 2 Steam depletion chamber is symmetric and two dimensional 3 Some part of the water is flowing separately and the rest is emulsified in oil 4 Heat transfer ahead of the chamber edge is only by conduction 5 Porous medium is homogeneous (constant porosity and permeability) 6 Heat losses are neglected 7 Density is dependent on temperature 8 Steam chamber that has reached the maximum height h and is expanding at
a constant velocity U in the direction perpendicular to the chamber walls 9 Reservoir oil does not have any solution gas 10 Heat transfer and mass transfer is directed normal to the edge of the
chamber
51 Proposed Theory
Figure 14 shows a conceptual model of a differential element at the edge of the steam chamber In this model portion of the water in the formation is assumed to be emulsified in the oil phase (Cw) and the rest is flowing along with as a continuous phase (Sw) The total water saturation (Swt) becomes
Swt = Cw + Sw
Probability of Emulsion formation decreases at higher temperatures since when temperature increases emulsion concentration decreases Water saturation is maximum at the chamber edge (ε = 0) and it equals to the connate water saturation far enough from the edge Emulsion formation occurs more when there is less water saturation water droplets can coalescence and flow as a continuous phase
Page 53 of 69
when the water saturation is higher As discussed in chapter 3 emulsification phenomena is a function of following factors temperature viscosity parameter temperature initial water saturation steam injection rate water droplet size and temperature diffusivity parameter
Emulsion at the steam chamber interface is a system of immiscible fluids with water droplets as the dispersed phase and oil as the continuous phase Therefore if we assume τ = microdispersed
microcontinuous= microw
microo and x = Cw Taylor equation becomes
microemmicroo
= 1 + 25
microwmicroo
+ 04microwmicroo
+ 1 Cw (1)
There are several other equations for calculating emulsion viscosity at certain conditions
Figure 14 Schematic illustration of emulsion concentration continuous phase water saturation oil mobility and probability of emulsion formation function with respect to the distance beyond
the steam chamber edge (ε )
Page 54 of 69
Again water saturation becomes a function of distance (ε) beyond the steam chamber interface
Sw = 1 minus So minus Cw = (1 minus Sor) minus (Sio minus Sor)(1minus Tlowast) minus Cw =
(1 minus Sor) minus (Sio minus Sor) 1 minus eminusUεα minus Cw
(2)
Therefore emulsion mobility defined by λoil = k krowmicromix
= k krowρmixνmix
is given by
λo = k krowmicromix
=kkrocw
Sio +CwminusSor1minusSwcminusSor
a
(1minus (eminus Uεα ))a
micromix =
kkrocw(1minus (eminus Uεα ))a(microwmicrose
minusUεα
m+ 1)
microw + micros(e Uεα )m ρoρs+ Cw 25microw + micros
ρoρs
(e Uεα )m
(3)
Where oil relative permeability and dimensionless water saturation are defined as Equation 4 and 5
krow = krocw(1 minus SwD)a (4)
SwD =Sw minus Swc
1 minus Swc minus Sor=
Swt minus Swc minus Cw1 minus Swc minus Sor
(5)
511 Total oil flow rate To develop an expression for the total oil flow rate we combine Darcyrsquos and mass conservation laws together
512 Darcyrsquos law Integration of differential Darcyrsquos law equation for emulsion flow results in
qo = krwSo g sinθ int dενem
infin0 = (6)
Page 55 of 69
qo = kkrocwgsinθSio + Cw minus Sor
1 minus Swc minus Sora
(1 minus (eminus Uεα ))aSoρemmicroem
infin
0 dε
ρem = ρwSw + ρo(1 minus Sw) = (ρw minus ρo)Sw + ρo (8)
Combining equation 1 and equation 8 gives
ρemmicroem
= [(ρw minus ρo)((1minus Sor) + (Sio minus Sor)(1minus eminus Uεα ))minusCw)] + ρo
microw + microo + (25microw + microo)Cwmicrowmicroo
+ 1
(9)
Substituting equation 9 in equation 8 gives
qo = kkrocwgsinθ times
Sio + Cw minus Sor
1 minus Swc minus Sora
(1 minus (eminus Uεα ))aSo([(ρw minus ρo)((1 minus Sor) + (Sio minus Sor)(1 minus eminus Uεα ))minusCw)] + ρo) microwmicroo+ 1
microw + microo + (25microw + microo)Cw
infin
0 dε
(10)
Let 119880120576120572
= 119883 then previous equation becomes below (Equation 11)
q =kkrocw gsinθα
Utimes
Sio + Cw minus Sor
1 minus Swc minus Sora
(1 minus (eminus x))aSo([(ρw minus ρo)((1 minus Sor) + (Sio minus Sor)(1 minus eminus x))minusCw)] + ρo) microwmicroo+ 1
microw + microo + (25microw + microo)Cw
infin
0 dX
(11)
Repeating the material balance same as previous chapter the rate of increase of oil flow across the differential element is related to the advance rate of the steam chamber interface
partqopartx
= OslashΔSo(partypartt
) (12)
The advance velocity interface is
U = minuscosθ (partypartt
) (13)
Page 56 of 69
sinθcos θ
= partypartx
(14)
Simplifying equation 11 knowing ex = δ gives
119902119900 =119896119896119903119900119888119908 119892119904119894119899120579120572
119880times
(1 minus (120575minus 1))119886119878119900((120588119908 minus 120588119900)[(1 minus 119878119900119903) + (119878119894119900 minus 119878119900119903)(1 minus 120575minus 1) minus 119862119908] + 120588119900) 120583119908120583119900
+ 1
(120583119908 + 120583119900 + (25120583119908 + 120583119900)119862119908)120575
infin
1 119889120575
(15)
Substituting equation 12 and 13 in equation 11 with using the geometrical relation of equation 15 gives the total volumetric oil flow rate as
119902119900 = 2119871 times
119896119896119903119900119888119908 119904119894119899120579119892Oslash1205721198781198742(1 minus (120575minus 1))119886((120588119908 minus 120588119900)[(1 minus 119878119900119903) + (119878119894119900 minus 119878119900119903)(1 minus 120575minus 1) minus 119862119908] + 120588119900) 120583119908120583119900
+ 1
(120583119908 + 120583119900 + (25120583119908 + 120583119900)119862119908)120575
infin
1 119889120575
(16)
52 Model Result
521 Model Verification Figure 15 compares the oil phase mobility with respect to distance beyond the interface estimated using 1) the proposed model (two phase flow) 2) Butlerrsquos model and 3) Sharma and Gatesrsquo model Same as single phase model in previous chapter the oil mobility at any distance calculated from the proposed model is lower than that from Butlerrsquos model and lower than that from Sharma and Gatesrsquo model
522 Sensitivity Analysis Sensitivity analysis is done to investigate the dependence of oil flux and total oil production rate on m α and μwater which control emulsion viscosity
523 Emulsion Mobility
Page 57 of 69
Effect of m Figure 16 (a) shows the effect of m on the oil mobility versus distance The results reveal that the smaller the m the smaller the oil mobility profile is As we described in previous section increasing m increases μem so the oil mobility will be lower due to higher μem
Effect of α Figure 16 (b) shows the oil mobility with respect to distance at several thermal diffusivities Increasing α enhances the efficiency of heat transfer and therefore in a specific distance higher the α equals higher oil mobility The maximum oil mobility occurs closer to the edge when α is smaller
Effect of μw Figure 16 (c) shows that μw does not have any significant effect on oil mobility
524 Field data analysis In this section we use the proposed model to predict oil production rate at the field scale Figure 17 compares the oil production rate by the proposed model with Butlerrsquos (1985) and Sharma and Gatesrsquo (2010) models for six different field production data Butlerrsquos model overestimates the oil production rate because there is no consideration of emulsion and multiphase effects Oil flows easily because there is no relative permeability effect to limit the oil flow
The results reveal that the proposed model provides an improved estimate of oil production rate under a series of specific values of α and m reported from field data of Athabasca deposit It demonstrates that emulsification effect at the edge of steam chamber should be included in the SAGD analysis
Page 58 of 69
Figure 15 Comparison of oil mobility in different models
0
200
400
600
800
1000
0 1 2 3 4 5 6
Emul
sion
Mob
ility
mD
cp
Distance Deyond Steam Chamber Edge (m)
Single phse Theory
Butlers model
Gates Model
Two Phase Theory
Page 59 of 69
(a) (b)
(c)
Figure 16 (a) Effect of temperature viscosity parameter (m) (b) thermal diffusivity (α) and (c) water viscosity (microw) on oil mobility with respect to distance beyond the edge of the steam
chamber
Page 60 of 69
Figure 17 Comparison of SAGD models for different field operations data
0
100
200
300
400
Chr
istin
a L
ake
Surm
ont
Dov
er U
TF
Phas
e B
Han
ging
-sto
ne
Hild
a L
ake
Col
d L
ake
Wol
f Lak
e C
old
Lak
e
Oil
Prod
uctio
n R
ate
(m3 d
ay)
Fields
Field Data
Current Theory
Sharma amp Gates Model
Butlers Model
Page 61 of 69
6 Chapter 6 Conclusion
An analytical model for lateral expansion of steam chamber during SAGD process is derived with incorporation of formation and transport of water-in-oil emulsion It is assumed that emulsion is generated due to condensation of steam penetrated into the heated bitumen We also assume that the transport of emulsified water is fully coupled with that of the continuous oil phase and therefore use Darcyrsquos law for modeling emulsion flow The key mechanisms accounted for in this model are alteration of bitumen viscosity and thermal effect The new model reveals that the oil viscosity is set by the balance between temperature gradient due to heat conduction and microbubble concentration gradient due to emulsification There are two controlling parameters temperature-viscosity parameter and thermal diffusivity A comparative application of the proposed model and other SAGD models on different field data reveals that emulsification effect should be included in the SAGD analysis By considering emulsion in the proposed model prediction of oil flow rate improved comparing with Butlerrsquos model A need for extension of the model in case of extensive condensation andor high initial water saturation made us to extend the single phase model The extended model accounts for the flow of water as a separate continuous phase It is assumed that emulsion is generated due to condensation of steam dispersed in oil phase while the rest of water condensation flows as a continuous phase Considering emulsion in the proposed model improved oil flow rate prediction The two phase model with emulsion effect simulates the real condition in the reservoir
A more detailed analysis of effective parameters on emulsion formation in the reservoir during SAGD process is needed for further studies Validation of the model with experimental data came from the laboratory would be valuable as well
Page 62 of 69
Nomenclature
a Corey parameter (dimensionless) Am1 Constant cp volumetric heat capacity of oil sands (Jm3-deg Celsius) g acceleration dure to gravity (ms2) h reservoir thickness (m) Hf heat trnsfered to residual oil connate of warer and reservoir rock (J) Ho heat transferred to the oil stream (J) Hr heat tranasferred to oil saturated reservoir (J) k permeability (m2) kab absolute permeability of the reservoir (m2) krow relative permeability of oil with respect to water (dimensionless) krocw relative permeability of oil at connate water saturation (dimensionless) kTH thermal conductivity (Js m-deg Celsius) L length of the production well (m) m temperature viscosity parameter (dimensionless) Q volumetric oil flow rate (m3s) qo oil flow rate per unit well length (m2s) Rg weigthed (mass) steam oil ratio Sio initial oil saturation (dimensionless) So oil saturation (dimensionless) Sor residual oil saturation (dimensionless) Sw water saturation (dimensionless) Swc connate water saturation (dimensionless) SwD normalised water saturation (dimensionless) T temperature (degree celsius) T imensionless temperature (dimensionless) TR initial reservoir temperature (degree celsius) TS steam temperature (degree celsius) Tm Temperature of heated bitumen (degree celsius) t time (s) U advanced velocity of steam chamber edge measured normal to the interface
(ms) V rise velocity of steam chamber (ms) x distance measured in the horizontal direction (m) xi interface position (m) y distance measured in the vertical direction (m) z distance measured parallel to the well direction (m) Greek Symbols
Page 63 of 69
α thermal diffusivity (m2s) β factor in flow rate equation with emulsion at the chamber edge Ф porosity (dimensionless) microo dynamic oil viscosity (kgms) micros dynamic steam viscosity (kgms) microw dynamic water viscosity (kgms) microem dynamic emulsion viscosity (kgms)
θ angle between the steam chamber edge and the horizontal axis (dimensionless) ε distance beyond the steam chamber edge measured in the direction normal
to it (m) λ latent heat of condensation (Jkg) λo oil mobility (m3skg) ν dispersed phase volume fraction (dimensionless) υs kinematic oil viscosity at steam temperature (m2s) υo kinematic oil viscosity (m2s) ρ rock density (kgm3) ρcCc volumetric heat capacity of steam chamber excluding condensate (kJdegC
m3) ρo oil density (kgm3) ρoCo volumetric heat capacity of oil ρem emulsion density (kgm3) ρw water density at reservoir temperature (kgm3) ρwCw volumetric heat capacity of water ρs bitumen density at steam temperature
Page 64 of 69
BIBLIOGRAPHY
1 Ahmed M Jaafar M Z Wan Sulaiman W R amp Hashim M (2014 March) Miscible Flood Performance of Heterogeneous Layered Reservoirs Considering Profile Control Through Controlled Fluid Movements In Offshore Technology Conference-Asia Offshore Technology Conference
2 Alali N Pishvaie M R amp Jabbari H (2009) A new semi-analytical modeling of steam-
assisted gravity drainage in heavy oil reservoirs Journal of Petroleum Science and Engineering 69(3) 261-270
3 Akin S (2005) Mathematical modeling of steam assisted gravity drainageSPE Reservoir Evaluation amp Engineering 8(05) 372-376
4 Azad A amp Chalaturnyk R J (2010) A mathematical improvement to SAGD using geomechanical modelling Journal of Canadian Petroleum Technology49(10) 53-64
5 Azad A amp Chalaturnyk R J (2012) An improved SAGD analytical simulator Circular steam chamber geometry Journal of Petroleum Science and Engineering 82 27-37
6 Al-Bahlani A and Babadagli T (2009) SAGD laboratory experimental and numerical simulation studies A review of current status and future issues Journal of Petroleum Science and Engineering 68(3-4) 135-150
7 Azom P N amp Srinivasan S (2009 October) Mechanistic modeling of emulsion formation and heat transfer during the steam-assisted gravity drainage (SAGD) process In SPE Annual Technical Conference and Exhibition Society of Petroleum Engineers
8 Azom P N (2013) Improved modeling of the steam-assisted gravity drainage (SAGD) process PhD thesis
9 Azom P N Kamp A amp Srinivasan S (2013 June) Characterizing the Effect of Heat Transfer on Multiphase Flow during the Steam-Assisted Gravity Drainage (SAGD) Process In SPE Heavy Oil Conference-Canada Society of Petroleum Engineers
Page 65 of 69
10 Becker J R (1977) Crude Oil Waxes Emulsions and Asphaltenes Pennwell Tulsa OK
pp 16ndash26 pp 62ndash63 pp 84ndash86
11 Bharatha S Yee C-T Chan MY (2005) Dissolved gas effects in SAGD Paper 2005-176 Pet Soc 6th Canadian Int Pet Conf (56th Annual Tech Meet) Calgary Canada June
12 Birrell GE (2001) lsquoHeat transfer ahead of a SAGD steam chamber a study of thermocouple data from Phase B of the underground test facility (Dover Project)rsquo SPE 71503 SPE Ann Tech Conf And Exhib New Orleans USA Oct
13 Bosch R Axcell E Little V Cleary R Wang S Gabel R amp Moreland B (2004) A novel approach for resolving reverse emulsions in SAGD production systems Canadian Journal of Chemical Engineering 82(4) 836-839
14 Brooks R H amp Corey T (1964) Hydraulic properties of porous media
15 Broughton G amp Squires L (1938) The viscosity of oil-water emulsions Journal of Physical Chemistry 42(1) 253-263
16 Butler RM (1991) Thermal Recovery of Oil and Bitumen Prentice-Hall Englewood Cliffs New Jersey
17 Butler R M (1985) New approach to the modelling of steam-assisted gravity drainage Journal of Canadian Petroleum Technology 24(3) 42-51
18 Butler R M (1987) Rise of Interfering Steam Chambers Journal of Canadian Petroleum Technology 26(3) 70-75
19 Butler R M McNab G S and Lo H Y (1981) Theoretical studies of the gravity drainage of heavy oil during in-situ steam heating Journal of Canadian Petroleum Technology 59 455-460
20 Canbolat S Akin S amp Kovscek A R (2002) A study of steam-assisted gravity drainage performance in the presence of noncondensable gases Paper presented at the Proceedings - SPE Symposium on Improved Oil Recovery 78-89
Page 66 of 69
21 Cokar M Gates I D amp Kallos M S (2013) A New Thermogeomechanical Theory for
Gravity Drainage in Steam-Assisted Gravity Drainage SPE Journal18(04) 736-742
22 Chung K H amp Butler R M (1988) Geometrical effect of steam injection on the
formation of emulsions in the steam-assisted gravity drainage process Journal of Canadian Petroleum Technology 27(1) 36-42
23 Dehghanpour H DiCarlo D A (2013) Drainage of capillary-trapped oil by an immiscible gas Impact of transient and steady-state water displacement on three-phase oil permeability Transport in Porous Media 100 297-319
24 Ezeuko C C Wang J amp Gates I D (2013) Investigation of Emulsion Flow in Steam-Assisted Gravity Drainage SPE Journal 18(03) 440-447
25 Farah M A Oliveira R C Caldas J N amp Rajagopal K (2005) Viscosity of water-in-oil emulsions Variation with temperature and water volume fraction Journal of Petroleum Science and Engineering 48(3-4) 169-184
26 Farouq Ali SM 2008 Practical Heavy Oil Recovery ENCH 647 Lecture Notes Dept of
Chem and Pet Eng University of Calgary 27 Heidari M Pooladi-Darvish M Azaiez J amp Maini B (2009) Effect of drainage height
and permeability on SAGD performance Journal of Petroleum Science and Engineering 68(1) 99-106
28 Irani M amp Cokar M (2014 June) Understanding the Impact of Temperature-Dependent Thermal Conductivity on the Steam-Assisted Gravity-Drainage (SAGD) Process Part 1 Temperature Front Prediction In SPE Heavy Oil Conference-Canada Society of Petroleum Engineers
29 Ito Y amp Suzuki S (1999) Numerical simulation of the SAGD process in the Hangingstone oil sands reservoir Journal of Canadian Petroleum Technology38(09)
30 Kasenow Michael (2002)Determination of hydraulic conductivity from grain size analysis Water Resources Publication
Page 67 of 69
31 Kokal S (2005) Crude-oil emulsions A state-of-the-art review SPE Production and
Facilities 20(1) 5-12
32 Krieger I M amp Dougherty T J (1959) A mechanism for non‐Newtonian flow in suspensions of rigid spheres Transactions of The Society of Rheology (1957-1977) 3(1) 137-152
33 Noik C Dalmazzone C Goulay C amp Glenat P (2005) Characterisation and emulsion
behaviour of athabasca extra-heavy-oil produced by SAGD Paper presented at the SPEPS-CIMCHOA International Thermal Operations and Heavy Oil Symposium Proceedings 2005 A365-A372
34 Mehrotra A K amp Svrcek W Y (1987) Viscosity of compressed cold lake bitumen Canadian Journal of Chemical Engineering 65(4) 672-675
35 Mohammadzadeh O and Chatzis I (2009) Pore-level investigation of heavy oil recovery
using steam assisted gravity drainage (SAGD) Paper presented at the Society of Petroleum Engineers - International Petroleum Technology Conference 2009 IPTC 2009 2 1070-1086
36 Mohammadzadeh O Rezaei N amp Chatzis I (2010) Pore-level investigation of heavy oil and bitumen recovery using solvent -aided steam assisted gravity drainage (SA-SAGD) process Energy and Fuels 24(12) 6327-6345
37 Murtaza M He Z amp Dehghanpour H (2013) An approach to model three-phase flow
coupling during steam chamber rise Canadian Journal of Chemical Engineering
38 Pal R (1998) A novel method to correlate emulsion viscosity data Colloids and Surfaces A Physicochemical and Engineering Aspects 137(1) 275-286
39 Poindexter M K Chuai S Marble R A amp Marsh S (2006) The Key to Predicting Emulsion Stability Solid Content SPE Production amp Operations21(03) 357-364
Page 68 of 69
40 Rabiei Faradonbeh M Harding T G amp Abedi J (2014 June) Semi-Analytical
Modeling of Steam-Solvent Gravity Drainage of Heavy Oil and Bitumen Part 2 Unsteady-State Model with Curved Interface In SPE Heavy Oil Conference-Canada Society of Petroleum Engineers
41 Ronningsen HP (1995) Correlations for predicting viscosity of wo emulsions based on North Sea crude oils Proc SPE IntSymp Oil Field Chem SPE 28968 Houston Texas
42 Sarbar M A amp Wingrove M D (1997 January) Physical and chemical characterization of Saudi Arabian crude oil emulsions In SPE Annual Technical Conference and Exhibition Society of Petroleum Engineers
43 Sasaki K Akibayashi S Yazawa N Doan Q T amp Farouq Ali S M (2001) Experimental modeling of the SAGD process - enhancing SAGD performance with periodic stimulation of the horizontal producer SPE Journal 6(1) 89-97
44 Sasaki K Akibayashi S Yazawa N Doan Q amp Ali S F (2001) Numerical and experimental modelling of the steam assisted gravity drainage (SAGD) process Journal of Canadian Petroleum Technology 40(1) 44-50
45 Sasaki K Satoshi A Yazawa N amp Kaneko F (2002 January) Microscopic
visualization with high resolution optical-fiber scope at steam chamber interface on initial stage of SAGD process In SPEDOE Improved Oil Recovery Symposium Society of Petroleum Engineers
46 Sharma J amp Gates I D (2010) Multiphase flow at the edge of a steam
chamber Canadian Journal of Chemical Engineering 88(3) 312-321
47 Taylor G I (1932) The viscosity of a fluid containing small drops of another fluid Proceedings of the Royal Society of London Series A Containing Papers of a Mathematical and Physical Character 41-48
48 Wei S Lin-Song C Huang S amp Huang W (2014 June) Steam Chamber
Development and Production Performance Prediction of Steam Assisted Gravity Drainage In SPE Heavy Oil Conference-Canada Society of Petroleum Engineers
Page 69 of 69
- Analytical Modeling of Emulsion Flow at the Edge of Steam Chamber During SAGD Process
- 1 Chapter One Introduction
-
- 11 Heavy Oil and Oil Sands
- 12 In-situ Extraction of Heavy Oil
-
- 121 Non-thermal Recovery Methods
- 122 Thermal Recovery Methods
-
- 1221 Steam-Assisted Gravity Drainage and its Variants
- 1222 Original SAGD Concept
-
- 13 Motivation
- 14 Specific Objectives of this Research
- 15 Thesis Outline
-
- 2 Chapter Two Literature Review
-
- 21 Overview
- 22 Analytical Modelling of Steam-Assisted Gravity Drainage (SAGD)
-
- 221 Butler Single Phase Model
- 222 Other Variants of Butlerrsquos Models
- 223 Sharma and Gatesrsquo Multiphase Model
- 224 Energy Balance
-
- 3 Chapter 3 Emulsions in SAGD
-
- 31 Definitions
- 32 Emulsion Characteristics
-
- 321 Droplet Size
- 322 Viscosity
- 323 Color and appearance
-
- 33 Emulsion Stability
-
- 331 Steam Quality
- 332 Temperature
- 333 Initial Water Saturation
- 334 Rate of Steam Injection
- 335 Oil Production Rate
- 336 Pressure
- 337 pH
- 338 Droplet Size
- 339 Heavy Fraction in Crude Oil
- 3310 Solid particles
- 3311 Counter current flow
-
- 34 Thermodynamics of Emulsion
-
- 4 Chapter 4 Single Phase Analytical Modeling of SAGD
- The purpose of this chapter is to develop a new gravity drainage model of mobilized bitumen at the edge of steam chamber which includes emulsion effect in in a single phase system Considering that several SAGD experiments reported water-in-oil emulsi
-
- 41 Proposed Theory
-
- 411 Total oil flow rate
- 412 Darcyrsquos law
- 413 Material balance
-
- 42 Model Results
-
- 421 Model Verification
- 422 Sensitivity Analysis
-
- 43 Dynamic Emulsion Viscosity
- 44 Emulsion Mobility
- 45 Volumetric Oil Flux
- 46 Field data analysis
-
- 5 Chapter 5 Two Phase Analytical Modeling of SAGD
-
- 51 Proposed Theory
-
- 511 Total oil flow rate
- 512 Darcyrsquos law
-
- 52 Model Result
-
- 521 Model Verification
- 522 Sensitivity Analysis
- 523 Emulsion Mobility
- 524 Field data analysis
-
- 6 Chapter 6 Conclusion
-

(a) (b)
Figure 8 Comparison of oil phase mobility from Butlerrsquos and the current theory with respect to distance beyond the edge of a steam chamber using Sasaki et al (2001) experimental data (a)
with no temperature effect (b) with no emulsion effect
Page 44 of 69
Table 1 Parameters from Sasaki et al (2001) Experimental Data
Parameters Value
Tr (C) 20
Ts (C) 106
ρo (kgm3) 998
h (m) 03
L (m) 00045
empty 038
α (m2s) 260x10-7
kab (m2) 115x10-10
Kro 04
Sio 1
Sorw 005
Swc 0
νs (m2s) 12010x10-4
m 36
a 1
Figure 8 (a) compares the proposed model with Butlerrsquos model in the absence of temperature effect (m=0) The current model converges to Butlerrsquos model far enough from the chamber edge As the distance increases emulsion concentration approaches to zero so there is no emulsion effect in the formation and the proposed model converges to Butlerrsquos single-phase model as expected Figure 8 (b) compares the current model with Butlerrsquos in the absence of emulsion effect Emulsion viscosity is the same as oil viscosity and the emulsion mobility curve are exactly the same for the two models so the current model matches with Butlerrsquos model
Page 45 of 69
Figure 9 compares the oil phase mobility with respect to distance beyond the interface estimated using 1) the proposed model 2) Butlerrsquos model and 3) Sharma and Gatesrsquo model The results show that the oil mobility at any distance calculated from the proposed model is lower than that from Butlerrsquos model and higher than that from Sharma and Gatesrsquo model The oil phase mobility in the proposed model exponentially decreases with increasing distance which is similar to Butlerrsquos but smaller due to the effect of emulsification Because there is no consideration of multiphase and emulsion effect Butlerrsquos model has the highest oil mobility When there is no other fluid the pore network is exclusively available for oil flow Sharma and Gates considered multiphase effect by adding relative permeability to Butlerrsquos model Multiphase assumption allocates a share of fluid path to oil in Sharma and Gatesrsquo model Therefore the oil mobility in their model is lower than that in Butlerrsquos Though emulsion increases effective oil viscosity our model has a higher mobility than Sharma and Gatesrsquo model because we ignore multiphase effect in the presence of emulsion
Figure 9 Comparison of emulsion mobility with respect to ε from Butlerrsquos Sharma and Gatesrsquo and the proposed model using Sasaki et al (2001) experimental data
0
200
400
600
800
1000
0 3 6 9 12 15
Oil
Mob
ility
(mD
cp)
Distance Beyond Steam Chamber Edge (m)
Current Theory
Butlers model
Sharma and Gates Model
Page 46 of 69
(a) (b)
Figure 10 Dynamic Viscosity of pure bitumen and emulsion with respect of distance beyond edge of steam chamber for different values of (a) m and (b) α
422 Sensitivity Analysis
In this part we conduct a sensitivity analysis to investigate the dependence of oil flux and total oil production rate on m α and μwater which control emulsion viscosity
43 Dynamic Emulsion Viscosity Figure 10 shows how the viscosity of emulsion and pure bitumen change with respect to the distance from the chamber edge at different values of (a) α and (b) m At a specific distance μem increases by increasing m while μem decreases by increasing α Furthermore μem- ε is steeper at lower values of α and at higher values of m
44 Emulsion Mobility Effect of m Figure 11 (a) shows the effect of m on the oil mobility versus distance The results reveal that the smaller the m the larger the oil mobility is As we described in previous section increasing m increases μem so the oil mobility
Page 47 of 69
will be lower due to higher μem Oil mobility increases with increasing temperature as a result of decreasing viscosity
Effect of α Figure 11 (b) shows the oil mobility with respect to distance at several thermal diffusivities Increasing α enhances the efficiency of heat transfer and therefore increases the oil mobility
Effect of μw Figure 11 (c) shows that μw does not have any significant effect on oil mobility μw is significantly smaller than bitumen viscosity and thus it does not affect the oil mobility Furthermore based on Eq5 the multiplier of oil viscosity is
orders of magnitude larger than that of water viscosity (119890119880120576120572 119898 gtgt 1 gtgt 119890minus 119880120576120572 119898)
45 Volumetric Oil Flux
Figure 12 (a) to (d) compares the effects of α U m and microw on volumetric oil flux respectively As expected increasing α increases the oil flux due to faster heat transfer and increasing m decreases the oil flux as oil becomes more viscous Increasing U gives lower oil flux since there will be less time to receive condensate thermal energy As mentioned before μw does not affect the oil mobility and thus changing water viscosity does not considerably affect volumetric oil flux
46 Field data analysis
In this section we use the proposed model to predict oil production rate at the field scale Figure 13 compares the oil production rate by the proposed model with Butlerrsquos (1985) and Sharma and Gatesrsquo (2010) models for six different field production data Properties of the 6 fields are listed in Table 2 Butlerrsquos model overestimates the oil production rate because there is no consideration of emulsion and multiphase effects Oil flows easily because there is no relative permeability effect to limit the oil flow Therefore the values estimated by Butlerrsquos model are higher than those predicted by the other two models Sharma and Gates considered multiphase effect in their model by adding relative permeability to Butlerrsquos model
Page 48 of 69
Their model has more accurate results than Butlerrsquos but it does not consider emulsion effect which many authors reported in their observations
The results reveal that the proposed model provides an improved estimate of oil production rate under a series of specific values of α and m reported from field data of Athabasca deposit It demonstrates that emulsification effect at the edge of steam chamber should be included in the SAGD analysis Our model assumes that the entire flow system is single phase Hence there is a potential that this model overestimates the oil flow rate
(a) (b)
(c)
Figure 11 (a) Effect of temperature viscosity parameter (m) (b) thermal diffusivity (α) and (c) water viscosity (microw) on oil mobility with respect to distance beyond the edge of the steam
chamber
Page 49 of 69
(a) (b)
(c) (d)
Figure 12 Effect of (a) thermal diffusivity (b) advance velocity of steam chamber (c) temperature viscosity parameter and (d) water viscosity on volumetric oil flux profile for
Christina Lake reservoir
(a) (b)
Page 50 of 69
Figure 13 Comparison of SAGD models for different field operations data
Table 2 Comparison of SAGD models for different field operations data (After Sharma and Gates 2010)
Wellpair A3 A Phase B
Average of 3 well pairs
Average of 15 well pairs A B C D EG
H IJ K LM N O P
amp Q
I3P3
B10 grand rapids SD9
pad average of 6 well pairs
Parameters Christina
Lake Surmont
Dover UTF Phase B
Hangingstone Hilda Lake
Cold Lake
Wolf Lake Cold Lake
TR 20 15 7 20 20 20
Ts 220 225 220 260 245 250
ρs (kgm3) 880 880 880 980 880 980
ρo (kgm3) 1009 1009 1009 1015 1009 1015
0
100
200
300
400
Chr
istin
a L
ake
Surm
ont
Dov
er U
TF
Phas
e B
Han
ging
-sto
ne
Hild
a L
ake
Col
d L
ake
Wol
f Lak
e C
old
Lak
eOil
Prod
uctio
n R
ate
(m3 d
ay)
Fields
Field DataCurrent TheorySharma amp Gates ModelButlers Model
Page 51 of 69
h (m) 26 30 21 25 24 11
L (m) 690 850 500 500 1000 500
ф 033 033 033 035 035 032
α (m2s) 5501x10-7 0201 x10-
7 3601 x10-7 260 x10-7 036 x10-7 300 x10-7
kab (m2) 60x10-12 50x10-12 70x10-12 50x10-12 50x10-12 30x10-12
Kro 02 02 02 03 02 03
Sio 080 079 085 077 063 075
Sorw 01 012 015 01 012 01
Swc 015 01 01 01 01 01
νs (m2s) 681x10-6 341x10-6 795x10-6 428x10-6 341x10-6 408x10-6
m 4 5 5 5 5 4
microw (kgms) 000085 000096 000117 000085 000085 000085
ρw (kgm3) 998 999 999 998 998 998
Oil flow rate q (m3day)
Field data 170 50 77 82 65 50
Butler et al (1981)
262 379 148 229 359 131
Sharma and Gates
173 75 80 91 72 39
Current Theory 177 59 84 95 75 48
Page 52 of 69
5 Chapter 5 Two Phase Analytical Modeling of SAGD
The purpose of this chapter is to modify the single phase gravity drainage model developed in previous chapter to derive a two phase model The model includes the effect of multi-phase flow (relative permeability) and oil saturation on oil mobility and drainage rate
Assumptions of the model are as follow
1 The reservoir is homogeneous 2 Steam depletion chamber is symmetric and two dimensional 3 Some part of the water is flowing separately and the rest is emulsified in oil 4 Heat transfer ahead of the chamber edge is only by conduction 5 Porous medium is homogeneous (constant porosity and permeability) 6 Heat losses are neglected 7 Density is dependent on temperature 8 Steam chamber that has reached the maximum height h and is expanding at
a constant velocity U in the direction perpendicular to the chamber walls 9 Reservoir oil does not have any solution gas 10 Heat transfer and mass transfer is directed normal to the edge of the
chamber
51 Proposed Theory
Figure 14 shows a conceptual model of a differential element at the edge of the steam chamber In this model portion of the water in the formation is assumed to be emulsified in the oil phase (Cw) and the rest is flowing along with as a continuous phase (Sw) The total water saturation (Swt) becomes
Swt = Cw + Sw
Probability of Emulsion formation decreases at higher temperatures since when temperature increases emulsion concentration decreases Water saturation is maximum at the chamber edge (ε = 0) and it equals to the connate water saturation far enough from the edge Emulsion formation occurs more when there is less water saturation water droplets can coalescence and flow as a continuous phase
Page 53 of 69
when the water saturation is higher As discussed in chapter 3 emulsification phenomena is a function of following factors temperature viscosity parameter temperature initial water saturation steam injection rate water droplet size and temperature diffusivity parameter
Emulsion at the steam chamber interface is a system of immiscible fluids with water droplets as the dispersed phase and oil as the continuous phase Therefore if we assume τ = microdispersed
microcontinuous= microw
microo and x = Cw Taylor equation becomes
microemmicroo
= 1 + 25
microwmicroo
+ 04microwmicroo
+ 1 Cw (1)
There are several other equations for calculating emulsion viscosity at certain conditions
Figure 14 Schematic illustration of emulsion concentration continuous phase water saturation oil mobility and probability of emulsion formation function with respect to the distance beyond
the steam chamber edge (ε )
Page 54 of 69
Again water saturation becomes a function of distance (ε) beyond the steam chamber interface
Sw = 1 minus So minus Cw = (1 minus Sor) minus (Sio minus Sor)(1minus Tlowast) minus Cw =
(1 minus Sor) minus (Sio minus Sor) 1 minus eminusUεα minus Cw
(2)
Therefore emulsion mobility defined by λoil = k krowmicromix
= k krowρmixνmix
is given by
λo = k krowmicromix
=kkrocw
Sio +CwminusSor1minusSwcminusSor
a
(1minus (eminus Uεα ))a
micromix =
kkrocw(1minus (eminus Uεα ))a(microwmicrose
minusUεα
m+ 1)
microw + micros(e Uεα )m ρoρs+ Cw 25microw + micros
ρoρs
(e Uεα )m
(3)
Where oil relative permeability and dimensionless water saturation are defined as Equation 4 and 5
krow = krocw(1 minus SwD)a (4)
SwD =Sw minus Swc
1 minus Swc minus Sor=
Swt minus Swc minus Cw1 minus Swc minus Sor
(5)
511 Total oil flow rate To develop an expression for the total oil flow rate we combine Darcyrsquos and mass conservation laws together
512 Darcyrsquos law Integration of differential Darcyrsquos law equation for emulsion flow results in
qo = krwSo g sinθ int dενem
infin0 = (6)
Page 55 of 69
qo = kkrocwgsinθSio + Cw minus Sor
1 minus Swc minus Sora
(1 minus (eminus Uεα ))aSoρemmicroem
infin
0 dε
ρem = ρwSw + ρo(1 minus Sw) = (ρw minus ρo)Sw + ρo (8)
Combining equation 1 and equation 8 gives
ρemmicroem
= [(ρw minus ρo)((1minus Sor) + (Sio minus Sor)(1minus eminus Uεα ))minusCw)] + ρo
microw + microo + (25microw + microo)Cwmicrowmicroo
+ 1
(9)
Substituting equation 9 in equation 8 gives
qo = kkrocwgsinθ times
Sio + Cw minus Sor
1 minus Swc minus Sora
(1 minus (eminus Uεα ))aSo([(ρw minus ρo)((1 minus Sor) + (Sio minus Sor)(1 minus eminus Uεα ))minusCw)] + ρo) microwmicroo+ 1
microw + microo + (25microw + microo)Cw
infin
0 dε
(10)
Let 119880120576120572
= 119883 then previous equation becomes below (Equation 11)
q =kkrocw gsinθα
Utimes
Sio + Cw minus Sor
1 minus Swc minus Sora
(1 minus (eminus x))aSo([(ρw minus ρo)((1 minus Sor) + (Sio minus Sor)(1 minus eminus x))minusCw)] + ρo) microwmicroo+ 1
microw + microo + (25microw + microo)Cw
infin
0 dX
(11)
Repeating the material balance same as previous chapter the rate of increase of oil flow across the differential element is related to the advance rate of the steam chamber interface
partqopartx
= OslashΔSo(partypartt
) (12)
The advance velocity interface is
U = minuscosθ (partypartt
) (13)
Page 56 of 69
sinθcos θ
= partypartx
(14)
Simplifying equation 11 knowing ex = δ gives
119902119900 =119896119896119903119900119888119908 119892119904119894119899120579120572
119880times
(1 minus (120575minus 1))119886119878119900((120588119908 minus 120588119900)[(1 minus 119878119900119903) + (119878119894119900 minus 119878119900119903)(1 minus 120575minus 1) minus 119862119908] + 120588119900) 120583119908120583119900
+ 1
(120583119908 + 120583119900 + (25120583119908 + 120583119900)119862119908)120575
infin
1 119889120575
(15)
Substituting equation 12 and 13 in equation 11 with using the geometrical relation of equation 15 gives the total volumetric oil flow rate as
119902119900 = 2119871 times
119896119896119903119900119888119908 119904119894119899120579119892Oslash1205721198781198742(1 minus (120575minus 1))119886((120588119908 minus 120588119900)[(1 minus 119878119900119903) + (119878119894119900 minus 119878119900119903)(1 minus 120575minus 1) minus 119862119908] + 120588119900) 120583119908120583119900
+ 1
(120583119908 + 120583119900 + (25120583119908 + 120583119900)119862119908)120575
infin
1 119889120575
(16)
52 Model Result
521 Model Verification Figure 15 compares the oil phase mobility with respect to distance beyond the interface estimated using 1) the proposed model (two phase flow) 2) Butlerrsquos model and 3) Sharma and Gatesrsquo model Same as single phase model in previous chapter the oil mobility at any distance calculated from the proposed model is lower than that from Butlerrsquos model and lower than that from Sharma and Gatesrsquo model
522 Sensitivity Analysis Sensitivity analysis is done to investigate the dependence of oil flux and total oil production rate on m α and μwater which control emulsion viscosity
523 Emulsion Mobility
Page 57 of 69
Effect of m Figure 16 (a) shows the effect of m on the oil mobility versus distance The results reveal that the smaller the m the smaller the oil mobility profile is As we described in previous section increasing m increases μem so the oil mobility will be lower due to higher μem
Effect of α Figure 16 (b) shows the oil mobility with respect to distance at several thermal diffusivities Increasing α enhances the efficiency of heat transfer and therefore in a specific distance higher the α equals higher oil mobility The maximum oil mobility occurs closer to the edge when α is smaller
Effect of μw Figure 16 (c) shows that μw does not have any significant effect on oil mobility
524 Field data analysis In this section we use the proposed model to predict oil production rate at the field scale Figure 17 compares the oil production rate by the proposed model with Butlerrsquos (1985) and Sharma and Gatesrsquo (2010) models for six different field production data Butlerrsquos model overestimates the oil production rate because there is no consideration of emulsion and multiphase effects Oil flows easily because there is no relative permeability effect to limit the oil flow
The results reveal that the proposed model provides an improved estimate of oil production rate under a series of specific values of α and m reported from field data of Athabasca deposit It demonstrates that emulsification effect at the edge of steam chamber should be included in the SAGD analysis
Page 58 of 69
Figure 15 Comparison of oil mobility in different models
0
200
400
600
800
1000
0 1 2 3 4 5 6
Emul
sion
Mob
ility
mD
cp
Distance Deyond Steam Chamber Edge (m)
Single phse Theory
Butlers model
Gates Model
Two Phase Theory
Page 59 of 69
(a) (b)
(c)
Figure 16 (a) Effect of temperature viscosity parameter (m) (b) thermal diffusivity (α) and (c) water viscosity (microw) on oil mobility with respect to distance beyond the edge of the steam
chamber
Page 60 of 69
Figure 17 Comparison of SAGD models for different field operations data
0
100
200
300
400
Chr
istin
a L
ake
Surm
ont
Dov
er U
TF
Phas
e B
Han
ging
-sto
ne
Hild
a L
ake
Col
d L
ake
Wol
f Lak
e C
old
Lak
e
Oil
Prod
uctio
n R
ate
(m3 d
ay)
Fields
Field Data
Current Theory
Sharma amp Gates Model
Butlers Model
Page 61 of 69
6 Chapter 6 Conclusion
An analytical model for lateral expansion of steam chamber during SAGD process is derived with incorporation of formation and transport of water-in-oil emulsion It is assumed that emulsion is generated due to condensation of steam penetrated into the heated bitumen We also assume that the transport of emulsified water is fully coupled with that of the continuous oil phase and therefore use Darcyrsquos law for modeling emulsion flow The key mechanisms accounted for in this model are alteration of bitumen viscosity and thermal effect The new model reveals that the oil viscosity is set by the balance between temperature gradient due to heat conduction and microbubble concentration gradient due to emulsification There are two controlling parameters temperature-viscosity parameter and thermal diffusivity A comparative application of the proposed model and other SAGD models on different field data reveals that emulsification effect should be included in the SAGD analysis By considering emulsion in the proposed model prediction of oil flow rate improved comparing with Butlerrsquos model A need for extension of the model in case of extensive condensation andor high initial water saturation made us to extend the single phase model The extended model accounts for the flow of water as a separate continuous phase It is assumed that emulsion is generated due to condensation of steam dispersed in oil phase while the rest of water condensation flows as a continuous phase Considering emulsion in the proposed model improved oil flow rate prediction The two phase model with emulsion effect simulates the real condition in the reservoir
A more detailed analysis of effective parameters on emulsion formation in the reservoir during SAGD process is needed for further studies Validation of the model with experimental data came from the laboratory would be valuable as well
Page 62 of 69
Nomenclature
a Corey parameter (dimensionless) Am1 Constant cp volumetric heat capacity of oil sands (Jm3-deg Celsius) g acceleration dure to gravity (ms2) h reservoir thickness (m) Hf heat trnsfered to residual oil connate of warer and reservoir rock (J) Ho heat transferred to the oil stream (J) Hr heat tranasferred to oil saturated reservoir (J) k permeability (m2) kab absolute permeability of the reservoir (m2) krow relative permeability of oil with respect to water (dimensionless) krocw relative permeability of oil at connate water saturation (dimensionless) kTH thermal conductivity (Js m-deg Celsius) L length of the production well (m) m temperature viscosity parameter (dimensionless) Q volumetric oil flow rate (m3s) qo oil flow rate per unit well length (m2s) Rg weigthed (mass) steam oil ratio Sio initial oil saturation (dimensionless) So oil saturation (dimensionless) Sor residual oil saturation (dimensionless) Sw water saturation (dimensionless) Swc connate water saturation (dimensionless) SwD normalised water saturation (dimensionless) T temperature (degree celsius) T imensionless temperature (dimensionless) TR initial reservoir temperature (degree celsius) TS steam temperature (degree celsius) Tm Temperature of heated bitumen (degree celsius) t time (s) U advanced velocity of steam chamber edge measured normal to the interface
(ms) V rise velocity of steam chamber (ms) x distance measured in the horizontal direction (m) xi interface position (m) y distance measured in the vertical direction (m) z distance measured parallel to the well direction (m) Greek Symbols
Page 63 of 69
α thermal diffusivity (m2s) β factor in flow rate equation with emulsion at the chamber edge Ф porosity (dimensionless) microo dynamic oil viscosity (kgms) micros dynamic steam viscosity (kgms) microw dynamic water viscosity (kgms) microem dynamic emulsion viscosity (kgms)
θ angle between the steam chamber edge and the horizontal axis (dimensionless) ε distance beyond the steam chamber edge measured in the direction normal
to it (m) λ latent heat of condensation (Jkg) λo oil mobility (m3skg) ν dispersed phase volume fraction (dimensionless) υs kinematic oil viscosity at steam temperature (m2s) υo kinematic oil viscosity (m2s) ρ rock density (kgm3) ρcCc volumetric heat capacity of steam chamber excluding condensate (kJdegC
m3) ρo oil density (kgm3) ρoCo volumetric heat capacity of oil ρem emulsion density (kgm3) ρw water density at reservoir temperature (kgm3) ρwCw volumetric heat capacity of water ρs bitumen density at steam temperature
Page 64 of 69
BIBLIOGRAPHY
1 Ahmed M Jaafar M Z Wan Sulaiman W R amp Hashim M (2014 March) Miscible Flood Performance of Heterogeneous Layered Reservoirs Considering Profile Control Through Controlled Fluid Movements In Offshore Technology Conference-Asia Offshore Technology Conference
2 Alali N Pishvaie M R amp Jabbari H (2009) A new semi-analytical modeling of steam-
assisted gravity drainage in heavy oil reservoirs Journal of Petroleum Science and Engineering 69(3) 261-270
3 Akin S (2005) Mathematical modeling of steam assisted gravity drainageSPE Reservoir Evaluation amp Engineering 8(05) 372-376
4 Azad A amp Chalaturnyk R J (2010) A mathematical improvement to SAGD using geomechanical modelling Journal of Canadian Petroleum Technology49(10) 53-64
5 Azad A amp Chalaturnyk R J (2012) An improved SAGD analytical simulator Circular steam chamber geometry Journal of Petroleum Science and Engineering 82 27-37
6 Al-Bahlani A and Babadagli T (2009) SAGD laboratory experimental and numerical simulation studies A review of current status and future issues Journal of Petroleum Science and Engineering 68(3-4) 135-150
7 Azom P N amp Srinivasan S (2009 October) Mechanistic modeling of emulsion formation and heat transfer during the steam-assisted gravity drainage (SAGD) process In SPE Annual Technical Conference and Exhibition Society of Petroleum Engineers
8 Azom P N (2013) Improved modeling of the steam-assisted gravity drainage (SAGD) process PhD thesis
9 Azom P N Kamp A amp Srinivasan S (2013 June) Characterizing the Effect of Heat Transfer on Multiphase Flow during the Steam-Assisted Gravity Drainage (SAGD) Process In SPE Heavy Oil Conference-Canada Society of Petroleum Engineers
Page 65 of 69
10 Becker J R (1977) Crude Oil Waxes Emulsions and Asphaltenes Pennwell Tulsa OK
pp 16ndash26 pp 62ndash63 pp 84ndash86
11 Bharatha S Yee C-T Chan MY (2005) Dissolved gas effects in SAGD Paper 2005-176 Pet Soc 6th Canadian Int Pet Conf (56th Annual Tech Meet) Calgary Canada June
12 Birrell GE (2001) lsquoHeat transfer ahead of a SAGD steam chamber a study of thermocouple data from Phase B of the underground test facility (Dover Project)rsquo SPE 71503 SPE Ann Tech Conf And Exhib New Orleans USA Oct
13 Bosch R Axcell E Little V Cleary R Wang S Gabel R amp Moreland B (2004) A novel approach for resolving reverse emulsions in SAGD production systems Canadian Journal of Chemical Engineering 82(4) 836-839
14 Brooks R H amp Corey T (1964) Hydraulic properties of porous media
15 Broughton G amp Squires L (1938) The viscosity of oil-water emulsions Journal of Physical Chemistry 42(1) 253-263
16 Butler RM (1991) Thermal Recovery of Oil and Bitumen Prentice-Hall Englewood Cliffs New Jersey
17 Butler R M (1985) New approach to the modelling of steam-assisted gravity drainage Journal of Canadian Petroleum Technology 24(3) 42-51
18 Butler R M (1987) Rise of Interfering Steam Chambers Journal of Canadian Petroleum Technology 26(3) 70-75
19 Butler R M McNab G S and Lo H Y (1981) Theoretical studies of the gravity drainage of heavy oil during in-situ steam heating Journal of Canadian Petroleum Technology 59 455-460
20 Canbolat S Akin S amp Kovscek A R (2002) A study of steam-assisted gravity drainage performance in the presence of noncondensable gases Paper presented at the Proceedings - SPE Symposium on Improved Oil Recovery 78-89
Page 66 of 69
21 Cokar M Gates I D amp Kallos M S (2013) A New Thermogeomechanical Theory for
Gravity Drainage in Steam-Assisted Gravity Drainage SPE Journal18(04) 736-742
22 Chung K H amp Butler R M (1988) Geometrical effect of steam injection on the
formation of emulsions in the steam-assisted gravity drainage process Journal of Canadian Petroleum Technology 27(1) 36-42
23 Dehghanpour H DiCarlo D A (2013) Drainage of capillary-trapped oil by an immiscible gas Impact of transient and steady-state water displacement on three-phase oil permeability Transport in Porous Media 100 297-319
24 Ezeuko C C Wang J amp Gates I D (2013) Investigation of Emulsion Flow in Steam-Assisted Gravity Drainage SPE Journal 18(03) 440-447
25 Farah M A Oliveira R C Caldas J N amp Rajagopal K (2005) Viscosity of water-in-oil emulsions Variation with temperature and water volume fraction Journal of Petroleum Science and Engineering 48(3-4) 169-184
26 Farouq Ali SM 2008 Practical Heavy Oil Recovery ENCH 647 Lecture Notes Dept of
Chem and Pet Eng University of Calgary 27 Heidari M Pooladi-Darvish M Azaiez J amp Maini B (2009) Effect of drainage height
and permeability on SAGD performance Journal of Petroleum Science and Engineering 68(1) 99-106
28 Irani M amp Cokar M (2014 June) Understanding the Impact of Temperature-Dependent Thermal Conductivity on the Steam-Assisted Gravity-Drainage (SAGD) Process Part 1 Temperature Front Prediction In SPE Heavy Oil Conference-Canada Society of Petroleum Engineers
29 Ito Y amp Suzuki S (1999) Numerical simulation of the SAGD process in the Hangingstone oil sands reservoir Journal of Canadian Petroleum Technology38(09)
30 Kasenow Michael (2002)Determination of hydraulic conductivity from grain size analysis Water Resources Publication
Page 67 of 69
31 Kokal S (2005) Crude-oil emulsions A state-of-the-art review SPE Production and
Facilities 20(1) 5-12
32 Krieger I M amp Dougherty T J (1959) A mechanism for non‐Newtonian flow in suspensions of rigid spheres Transactions of The Society of Rheology (1957-1977) 3(1) 137-152
33 Noik C Dalmazzone C Goulay C amp Glenat P (2005) Characterisation and emulsion
behaviour of athabasca extra-heavy-oil produced by SAGD Paper presented at the SPEPS-CIMCHOA International Thermal Operations and Heavy Oil Symposium Proceedings 2005 A365-A372
34 Mehrotra A K amp Svrcek W Y (1987) Viscosity of compressed cold lake bitumen Canadian Journal of Chemical Engineering 65(4) 672-675
35 Mohammadzadeh O and Chatzis I (2009) Pore-level investigation of heavy oil recovery
using steam assisted gravity drainage (SAGD) Paper presented at the Society of Petroleum Engineers - International Petroleum Technology Conference 2009 IPTC 2009 2 1070-1086
36 Mohammadzadeh O Rezaei N amp Chatzis I (2010) Pore-level investigation of heavy oil and bitumen recovery using solvent -aided steam assisted gravity drainage (SA-SAGD) process Energy and Fuels 24(12) 6327-6345
37 Murtaza M He Z amp Dehghanpour H (2013) An approach to model three-phase flow
coupling during steam chamber rise Canadian Journal of Chemical Engineering
38 Pal R (1998) A novel method to correlate emulsion viscosity data Colloids and Surfaces A Physicochemical and Engineering Aspects 137(1) 275-286
39 Poindexter M K Chuai S Marble R A amp Marsh S (2006) The Key to Predicting Emulsion Stability Solid Content SPE Production amp Operations21(03) 357-364
Page 68 of 69
40 Rabiei Faradonbeh M Harding T G amp Abedi J (2014 June) Semi-Analytical
Modeling of Steam-Solvent Gravity Drainage of Heavy Oil and Bitumen Part 2 Unsteady-State Model with Curved Interface In SPE Heavy Oil Conference-Canada Society of Petroleum Engineers
41 Ronningsen HP (1995) Correlations for predicting viscosity of wo emulsions based on North Sea crude oils Proc SPE IntSymp Oil Field Chem SPE 28968 Houston Texas
42 Sarbar M A amp Wingrove M D (1997 January) Physical and chemical characterization of Saudi Arabian crude oil emulsions In SPE Annual Technical Conference and Exhibition Society of Petroleum Engineers
43 Sasaki K Akibayashi S Yazawa N Doan Q T amp Farouq Ali S M (2001) Experimental modeling of the SAGD process - enhancing SAGD performance with periodic stimulation of the horizontal producer SPE Journal 6(1) 89-97
44 Sasaki K Akibayashi S Yazawa N Doan Q amp Ali S F (2001) Numerical and experimental modelling of the steam assisted gravity drainage (SAGD) process Journal of Canadian Petroleum Technology 40(1) 44-50
45 Sasaki K Satoshi A Yazawa N amp Kaneko F (2002 January) Microscopic
visualization with high resolution optical-fiber scope at steam chamber interface on initial stage of SAGD process In SPEDOE Improved Oil Recovery Symposium Society of Petroleum Engineers
46 Sharma J amp Gates I D (2010) Multiphase flow at the edge of a steam
chamber Canadian Journal of Chemical Engineering 88(3) 312-321
47 Taylor G I (1932) The viscosity of a fluid containing small drops of another fluid Proceedings of the Royal Society of London Series A Containing Papers of a Mathematical and Physical Character 41-48
48 Wei S Lin-Song C Huang S amp Huang W (2014 June) Steam Chamber
Development and Production Performance Prediction of Steam Assisted Gravity Drainage In SPE Heavy Oil Conference-Canada Society of Petroleum Engineers
Page 69 of 69
- Analytical Modeling of Emulsion Flow at the Edge of Steam Chamber During SAGD Process
- 1 Chapter One Introduction
-
- 11 Heavy Oil and Oil Sands
- 12 In-situ Extraction of Heavy Oil
-
- 121 Non-thermal Recovery Methods
- 122 Thermal Recovery Methods
-
- 1221 Steam-Assisted Gravity Drainage and its Variants
- 1222 Original SAGD Concept
-
- 13 Motivation
- 14 Specific Objectives of this Research
- 15 Thesis Outline
-
- 2 Chapter Two Literature Review
-
- 21 Overview
- 22 Analytical Modelling of Steam-Assisted Gravity Drainage (SAGD)
-
- 221 Butler Single Phase Model
- 222 Other Variants of Butlerrsquos Models
- 223 Sharma and Gatesrsquo Multiphase Model
- 224 Energy Balance
-
- 3 Chapter 3 Emulsions in SAGD
-
- 31 Definitions
- 32 Emulsion Characteristics
-
- 321 Droplet Size
- 322 Viscosity
- 323 Color and appearance
-
- 33 Emulsion Stability
-
- 331 Steam Quality
- 332 Temperature
- 333 Initial Water Saturation
- 334 Rate of Steam Injection
- 335 Oil Production Rate
- 336 Pressure
- 337 pH
- 338 Droplet Size
- 339 Heavy Fraction in Crude Oil
- 3310 Solid particles
- 3311 Counter current flow
-
- 34 Thermodynamics of Emulsion
-
- 4 Chapter 4 Single Phase Analytical Modeling of SAGD
- The purpose of this chapter is to develop a new gravity drainage model of mobilized bitumen at the edge of steam chamber which includes emulsion effect in in a single phase system Considering that several SAGD experiments reported water-in-oil emulsi
-
- 41 Proposed Theory
-
- 411 Total oil flow rate
- 412 Darcyrsquos law
- 413 Material balance
-
- 42 Model Results
-
- 421 Model Verification
- 422 Sensitivity Analysis
-
- 43 Dynamic Emulsion Viscosity
- 44 Emulsion Mobility
- 45 Volumetric Oil Flux
- 46 Field data analysis
-
- 5 Chapter 5 Two Phase Analytical Modeling of SAGD
-
- 51 Proposed Theory
-
- 511 Total oil flow rate
- 512 Darcyrsquos law
-
- 52 Model Result
-
- 521 Model Verification
- 522 Sensitivity Analysis
- 523 Emulsion Mobility
- 524 Field data analysis
-
- 6 Chapter 6 Conclusion
-

(a) (b)
Figure 10 Dynamic Viscosity of pure bitumen and emulsion with respect of distance beyond edge of steam chamber for different values of (a) m and (b) α
422 Sensitivity Analysis
In this part we conduct a sensitivity analysis to investigate the dependence of oil flux and total oil production rate on m α and μwater which control emulsion viscosity
43 Dynamic Emulsion Viscosity Figure 10 shows how the viscosity of emulsion and pure bitumen change with respect to the distance from the chamber edge at different values of (a) α and (b) m At a specific distance μem increases by increasing m while μem decreases by increasing α Furthermore μem- ε is steeper at lower values of α and at higher values of m
44 Emulsion Mobility Effect of m Figure 11 (a) shows the effect of m on the oil mobility versus distance The results reveal that the smaller the m the larger the oil mobility is As we described in previous section increasing m increases μem so the oil mobility
Page 47 of 69
will be lower due to higher μem Oil mobility increases with increasing temperature as a result of decreasing viscosity
Effect of α Figure 11 (b) shows the oil mobility with respect to distance at several thermal diffusivities Increasing α enhances the efficiency of heat transfer and therefore increases the oil mobility
Effect of μw Figure 11 (c) shows that μw does not have any significant effect on oil mobility μw is significantly smaller than bitumen viscosity and thus it does not affect the oil mobility Furthermore based on Eq5 the multiplier of oil viscosity is
orders of magnitude larger than that of water viscosity (119890119880120576120572 119898 gtgt 1 gtgt 119890minus 119880120576120572 119898)
45 Volumetric Oil Flux
Figure 12 (a) to (d) compares the effects of α U m and microw on volumetric oil flux respectively As expected increasing α increases the oil flux due to faster heat transfer and increasing m decreases the oil flux as oil becomes more viscous Increasing U gives lower oil flux since there will be less time to receive condensate thermal energy As mentioned before μw does not affect the oil mobility and thus changing water viscosity does not considerably affect volumetric oil flux
46 Field data analysis
In this section we use the proposed model to predict oil production rate at the field scale Figure 13 compares the oil production rate by the proposed model with Butlerrsquos (1985) and Sharma and Gatesrsquo (2010) models for six different field production data Properties of the 6 fields are listed in Table 2 Butlerrsquos model overestimates the oil production rate because there is no consideration of emulsion and multiphase effects Oil flows easily because there is no relative permeability effect to limit the oil flow Therefore the values estimated by Butlerrsquos model are higher than those predicted by the other two models Sharma and Gates considered multiphase effect in their model by adding relative permeability to Butlerrsquos model
Page 48 of 69
Their model has more accurate results than Butlerrsquos but it does not consider emulsion effect which many authors reported in their observations
The results reveal that the proposed model provides an improved estimate of oil production rate under a series of specific values of α and m reported from field data of Athabasca deposit It demonstrates that emulsification effect at the edge of steam chamber should be included in the SAGD analysis Our model assumes that the entire flow system is single phase Hence there is a potential that this model overestimates the oil flow rate
(a) (b)
(c)
Figure 11 (a) Effect of temperature viscosity parameter (m) (b) thermal diffusivity (α) and (c) water viscosity (microw) on oil mobility with respect to distance beyond the edge of the steam
chamber
Page 49 of 69
(a) (b)
(c) (d)
Figure 12 Effect of (a) thermal diffusivity (b) advance velocity of steam chamber (c) temperature viscosity parameter and (d) water viscosity on volumetric oil flux profile for
Christina Lake reservoir
(a) (b)
Page 50 of 69
Figure 13 Comparison of SAGD models for different field operations data
Table 2 Comparison of SAGD models for different field operations data (After Sharma and Gates 2010)
Wellpair A3 A Phase B
Average of 3 well pairs
Average of 15 well pairs A B C D EG
H IJ K LM N O P
amp Q
I3P3
B10 grand rapids SD9
pad average of 6 well pairs
Parameters Christina
Lake Surmont
Dover UTF Phase B
Hangingstone Hilda Lake
Cold Lake
Wolf Lake Cold Lake
TR 20 15 7 20 20 20
Ts 220 225 220 260 245 250
ρs (kgm3) 880 880 880 980 880 980
ρo (kgm3) 1009 1009 1009 1015 1009 1015
0
100
200
300
400
Chr
istin
a L
ake
Surm
ont
Dov
er U
TF
Phas
e B
Han
ging
-sto
ne
Hild
a L
ake
Col
d L
ake
Wol
f Lak
e C
old
Lak
eOil
Prod
uctio
n R
ate
(m3 d
ay)
Fields
Field DataCurrent TheorySharma amp Gates ModelButlers Model
Page 51 of 69
h (m) 26 30 21 25 24 11
L (m) 690 850 500 500 1000 500
ф 033 033 033 035 035 032
α (m2s) 5501x10-7 0201 x10-
7 3601 x10-7 260 x10-7 036 x10-7 300 x10-7
kab (m2) 60x10-12 50x10-12 70x10-12 50x10-12 50x10-12 30x10-12
Kro 02 02 02 03 02 03
Sio 080 079 085 077 063 075
Sorw 01 012 015 01 012 01
Swc 015 01 01 01 01 01
νs (m2s) 681x10-6 341x10-6 795x10-6 428x10-6 341x10-6 408x10-6
m 4 5 5 5 5 4
microw (kgms) 000085 000096 000117 000085 000085 000085
ρw (kgm3) 998 999 999 998 998 998
Oil flow rate q (m3day)
Field data 170 50 77 82 65 50
Butler et al (1981)
262 379 148 229 359 131
Sharma and Gates
173 75 80 91 72 39
Current Theory 177 59 84 95 75 48
Page 52 of 69
5 Chapter 5 Two Phase Analytical Modeling of SAGD
The purpose of this chapter is to modify the single phase gravity drainage model developed in previous chapter to derive a two phase model The model includes the effect of multi-phase flow (relative permeability) and oil saturation on oil mobility and drainage rate
Assumptions of the model are as follow
1 The reservoir is homogeneous 2 Steam depletion chamber is symmetric and two dimensional 3 Some part of the water is flowing separately and the rest is emulsified in oil 4 Heat transfer ahead of the chamber edge is only by conduction 5 Porous medium is homogeneous (constant porosity and permeability) 6 Heat losses are neglected 7 Density is dependent on temperature 8 Steam chamber that has reached the maximum height h and is expanding at
a constant velocity U in the direction perpendicular to the chamber walls 9 Reservoir oil does not have any solution gas 10 Heat transfer and mass transfer is directed normal to the edge of the
chamber
51 Proposed Theory
Figure 14 shows a conceptual model of a differential element at the edge of the steam chamber In this model portion of the water in the formation is assumed to be emulsified in the oil phase (Cw) and the rest is flowing along with as a continuous phase (Sw) The total water saturation (Swt) becomes
Swt = Cw + Sw
Probability of Emulsion formation decreases at higher temperatures since when temperature increases emulsion concentration decreases Water saturation is maximum at the chamber edge (ε = 0) and it equals to the connate water saturation far enough from the edge Emulsion formation occurs more when there is less water saturation water droplets can coalescence and flow as a continuous phase
Page 53 of 69
when the water saturation is higher As discussed in chapter 3 emulsification phenomena is a function of following factors temperature viscosity parameter temperature initial water saturation steam injection rate water droplet size and temperature diffusivity parameter
Emulsion at the steam chamber interface is a system of immiscible fluids with water droplets as the dispersed phase and oil as the continuous phase Therefore if we assume τ = microdispersed
microcontinuous= microw
microo and x = Cw Taylor equation becomes
microemmicroo
= 1 + 25
microwmicroo
+ 04microwmicroo
+ 1 Cw (1)
There are several other equations for calculating emulsion viscosity at certain conditions
Figure 14 Schematic illustration of emulsion concentration continuous phase water saturation oil mobility and probability of emulsion formation function with respect to the distance beyond
the steam chamber edge (ε )
Page 54 of 69
Again water saturation becomes a function of distance (ε) beyond the steam chamber interface
Sw = 1 minus So minus Cw = (1 minus Sor) minus (Sio minus Sor)(1minus Tlowast) minus Cw =
(1 minus Sor) minus (Sio minus Sor) 1 minus eminusUεα minus Cw
(2)
Therefore emulsion mobility defined by λoil = k krowmicromix
= k krowρmixνmix
is given by
λo = k krowmicromix
=kkrocw
Sio +CwminusSor1minusSwcminusSor
a
(1minus (eminus Uεα ))a
micromix =
kkrocw(1minus (eminus Uεα ))a(microwmicrose
minusUεα
m+ 1)
microw + micros(e Uεα )m ρoρs+ Cw 25microw + micros
ρoρs
(e Uεα )m
(3)
Where oil relative permeability and dimensionless water saturation are defined as Equation 4 and 5
krow = krocw(1 minus SwD)a (4)
SwD =Sw minus Swc
1 minus Swc minus Sor=
Swt minus Swc minus Cw1 minus Swc minus Sor
(5)
511 Total oil flow rate To develop an expression for the total oil flow rate we combine Darcyrsquos and mass conservation laws together
512 Darcyrsquos law Integration of differential Darcyrsquos law equation for emulsion flow results in
qo = krwSo g sinθ int dενem
infin0 = (6)
Page 55 of 69
qo = kkrocwgsinθSio + Cw minus Sor
1 minus Swc minus Sora
(1 minus (eminus Uεα ))aSoρemmicroem
infin
0 dε
ρem = ρwSw + ρo(1 minus Sw) = (ρw minus ρo)Sw + ρo (8)
Combining equation 1 and equation 8 gives
ρemmicroem
= [(ρw minus ρo)((1minus Sor) + (Sio minus Sor)(1minus eminus Uεα ))minusCw)] + ρo
microw + microo + (25microw + microo)Cwmicrowmicroo
+ 1
(9)
Substituting equation 9 in equation 8 gives
qo = kkrocwgsinθ times
Sio + Cw minus Sor
1 minus Swc minus Sora
(1 minus (eminus Uεα ))aSo([(ρw minus ρo)((1 minus Sor) + (Sio minus Sor)(1 minus eminus Uεα ))minusCw)] + ρo) microwmicroo+ 1
microw + microo + (25microw + microo)Cw
infin
0 dε
(10)
Let 119880120576120572
= 119883 then previous equation becomes below (Equation 11)
q =kkrocw gsinθα
Utimes
Sio + Cw minus Sor
1 minus Swc minus Sora
(1 minus (eminus x))aSo([(ρw minus ρo)((1 minus Sor) + (Sio minus Sor)(1 minus eminus x))minusCw)] + ρo) microwmicroo+ 1
microw + microo + (25microw + microo)Cw
infin
0 dX
(11)
Repeating the material balance same as previous chapter the rate of increase of oil flow across the differential element is related to the advance rate of the steam chamber interface
partqopartx
= OslashΔSo(partypartt
) (12)
The advance velocity interface is
U = minuscosθ (partypartt
) (13)
Page 56 of 69
sinθcos θ
= partypartx
(14)
Simplifying equation 11 knowing ex = δ gives
119902119900 =119896119896119903119900119888119908 119892119904119894119899120579120572
119880times
(1 minus (120575minus 1))119886119878119900((120588119908 minus 120588119900)[(1 minus 119878119900119903) + (119878119894119900 minus 119878119900119903)(1 minus 120575minus 1) minus 119862119908] + 120588119900) 120583119908120583119900
+ 1
(120583119908 + 120583119900 + (25120583119908 + 120583119900)119862119908)120575
infin
1 119889120575
(15)
Substituting equation 12 and 13 in equation 11 with using the geometrical relation of equation 15 gives the total volumetric oil flow rate as
119902119900 = 2119871 times
119896119896119903119900119888119908 119904119894119899120579119892Oslash1205721198781198742(1 minus (120575minus 1))119886((120588119908 minus 120588119900)[(1 minus 119878119900119903) + (119878119894119900 minus 119878119900119903)(1 minus 120575minus 1) minus 119862119908] + 120588119900) 120583119908120583119900
+ 1
(120583119908 + 120583119900 + (25120583119908 + 120583119900)119862119908)120575
infin
1 119889120575
(16)
52 Model Result
521 Model Verification Figure 15 compares the oil phase mobility with respect to distance beyond the interface estimated using 1) the proposed model (two phase flow) 2) Butlerrsquos model and 3) Sharma and Gatesrsquo model Same as single phase model in previous chapter the oil mobility at any distance calculated from the proposed model is lower than that from Butlerrsquos model and lower than that from Sharma and Gatesrsquo model
522 Sensitivity Analysis Sensitivity analysis is done to investigate the dependence of oil flux and total oil production rate on m α and μwater which control emulsion viscosity
523 Emulsion Mobility
Page 57 of 69
Effect of m Figure 16 (a) shows the effect of m on the oil mobility versus distance The results reveal that the smaller the m the smaller the oil mobility profile is As we described in previous section increasing m increases μem so the oil mobility will be lower due to higher μem
Effect of α Figure 16 (b) shows the oil mobility with respect to distance at several thermal diffusivities Increasing α enhances the efficiency of heat transfer and therefore in a specific distance higher the α equals higher oil mobility The maximum oil mobility occurs closer to the edge when α is smaller
Effect of μw Figure 16 (c) shows that μw does not have any significant effect on oil mobility
524 Field data analysis In this section we use the proposed model to predict oil production rate at the field scale Figure 17 compares the oil production rate by the proposed model with Butlerrsquos (1985) and Sharma and Gatesrsquo (2010) models for six different field production data Butlerrsquos model overestimates the oil production rate because there is no consideration of emulsion and multiphase effects Oil flows easily because there is no relative permeability effect to limit the oil flow
The results reveal that the proposed model provides an improved estimate of oil production rate under a series of specific values of α and m reported from field data of Athabasca deposit It demonstrates that emulsification effect at the edge of steam chamber should be included in the SAGD analysis
Page 58 of 69
Figure 15 Comparison of oil mobility in different models
0
200
400
600
800
1000
0 1 2 3 4 5 6
Emul
sion
Mob
ility
mD
cp
Distance Deyond Steam Chamber Edge (m)
Single phse Theory
Butlers model
Gates Model
Two Phase Theory
Page 59 of 69
(a) (b)
(c)
Figure 16 (a) Effect of temperature viscosity parameter (m) (b) thermal diffusivity (α) and (c) water viscosity (microw) on oil mobility with respect to distance beyond the edge of the steam
chamber
Page 60 of 69
Figure 17 Comparison of SAGD models for different field operations data
0
100
200
300
400
Chr
istin
a L
ake
Surm
ont
Dov
er U
TF
Phas
e B
Han
ging
-sto
ne
Hild
a L
ake
Col
d L
ake
Wol
f Lak
e C
old
Lak
e
Oil
Prod
uctio
n R
ate
(m3 d
ay)
Fields
Field Data
Current Theory
Sharma amp Gates Model
Butlers Model
Page 61 of 69
6 Chapter 6 Conclusion
An analytical model for lateral expansion of steam chamber during SAGD process is derived with incorporation of formation and transport of water-in-oil emulsion It is assumed that emulsion is generated due to condensation of steam penetrated into the heated bitumen We also assume that the transport of emulsified water is fully coupled with that of the continuous oil phase and therefore use Darcyrsquos law for modeling emulsion flow The key mechanisms accounted for in this model are alteration of bitumen viscosity and thermal effect The new model reveals that the oil viscosity is set by the balance between temperature gradient due to heat conduction and microbubble concentration gradient due to emulsification There are two controlling parameters temperature-viscosity parameter and thermal diffusivity A comparative application of the proposed model and other SAGD models on different field data reveals that emulsification effect should be included in the SAGD analysis By considering emulsion in the proposed model prediction of oil flow rate improved comparing with Butlerrsquos model A need for extension of the model in case of extensive condensation andor high initial water saturation made us to extend the single phase model The extended model accounts for the flow of water as a separate continuous phase It is assumed that emulsion is generated due to condensation of steam dispersed in oil phase while the rest of water condensation flows as a continuous phase Considering emulsion in the proposed model improved oil flow rate prediction The two phase model with emulsion effect simulates the real condition in the reservoir
A more detailed analysis of effective parameters on emulsion formation in the reservoir during SAGD process is needed for further studies Validation of the model with experimental data came from the laboratory would be valuable as well
Page 62 of 69
Nomenclature
a Corey parameter (dimensionless) Am1 Constant cp volumetric heat capacity of oil sands (Jm3-deg Celsius) g acceleration dure to gravity (ms2) h reservoir thickness (m) Hf heat trnsfered to residual oil connate of warer and reservoir rock (J) Ho heat transferred to the oil stream (J) Hr heat tranasferred to oil saturated reservoir (J) k permeability (m2) kab absolute permeability of the reservoir (m2) krow relative permeability of oil with respect to water (dimensionless) krocw relative permeability of oil at connate water saturation (dimensionless) kTH thermal conductivity (Js m-deg Celsius) L length of the production well (m) m temperature viscosity parameter (dimensionless) Q volumetric oil flow rate (m3s) qo oil flow rate per unit well length (m2s) Rg weigthed (mass) steam oil ratio Sio initial oil saturation (dimensionless) So oil saturation (dimensionless) Sor residual oil saturation (dimensionless) Sw water saturation (dimensionless) Swc connate water saturation (dimensionless) SwD normalised water saturation (dimensionless) T temperature (degree celsius) T imensionless temperature (dimensionless) TR initial reservoir temperature (degree celsius) TS steam temperature (degree celsius) Tm Temperature of heated bitumen (degree celsius) t time (s) U advanced velocity of steam chamber edge measured normal to the interface
(ms) V rise velocity of steam chamber (ms) x distance measured in the horizontal direction (m) xi interface position (m) y distance measured in the vertical direction (m) z distance measured parallel to the well direction (m) Greek Symbols
Page 63 of 69
α thermal diffusivity (m2s) β factor in flow rate equation with emulsion at the chamber edge Ф porosity (dimensionless) microo dynamic oil viscosity (kgms) micros dynamic steam viscosity (kgms) microw dynamic water viscosity (kgms) microem dynamic emulsion viscosity (kgms)
θ angle between the steam chamber edge and the horizontal axis (dimensionless) ε distance beyond the steam chamber edge measured in the direction normal
to it (m) λ latent heat of condensation (Jkg) λo oil mobility (m3skg) ν dispersed phase volume fraction (dimensionless) υs kinematic oil viscosity at steam temperature (m2s) υo kinematic oil viscosity (m2s) ρ rock density (kgm3) ρcCc volumetric heat capacity of steam chamber excluding condensate (kJdegC
m3) ρo oil density (kgm3) ρoCo volumetric heat capacity of oil ρem emulsion density (kgm3) ρw water density at reservoir temperature (kgm3) ρwCw volumetric heat capacity of water ρs bitumen density at steam temperature
Page 64 of 69
BIBLIOGRAPHY
1 Ahmed M Jaafar M Z Wan Sulaiman W R amp Hashim M (2014 March) Miscible Flood Performance of Heterogeneous Layered Reservoirs Considering Profile Control Through Controlled Fluid Movements In Offshore Technology Conference-Asia Offshore Technology Conference
2 Alali N Pishvaie M R amp Jabbari H (2009) A new semi-analytical modeling of steam-
assisted gravity drainage in heavy oil reservoirs Journal of Petroleum Science and Engineering 69(3) 261-270
3 Akin S (2005) Mathematical modeling of steam assisted gravity drainageSPE Reservoir Evaluation amp Engineering 8(05) 372-376
4 Azad A amp Chalaturnyk R J (2010) A mathematical improvement to SAGD using geomechanical modelling Journal of Canadian Petroleum Technology49(10) 53-64
5 Azad A amp Chalaturnyk R J (2012) An improved SAGD analytical simulator Circular steam chamber geometry Journal of Petroleum Science and Engineering 82 27-37
6 Al-Bahlani A and Babadagli T (2009) SAGD laboratory experimental and numerical simulation studies A review of current status and future issues Journal of Petroleum Science and Engineering 68(3-4) 135-150
7 Azom P N amp Srinivasan S (2009 October) Mechanistic modeling of emulsion formation and heat transfer during the steam-assisted gravity drainage (SAGD) process In SPE Annual Technical Conference and Exhibition Society of Petroleum Engineers
8 Azom P N (2013) Improved modeling of the steam-assisted gravity drainage (SAGD) process PhD thesis
9 Azom P N Kamp A amp Srinivasan S (2013 June) Characterizing the Effect of Heat Transfer on Multiphase Flow during the Steam-Assisted Gravity Drainage (SAGD) Process In SPE Heavy Oil Conference-Canada Society of Petroleum Engineers
Page 65 of 69
10 Becker J R (1977) Crude Oil Waxes Emulsions and Asphaltenes Pennwell Tulsa OK
pp 16ndash26 pp 62ndash63 pp 84ndash86
11 Bharatha S Yee C-T Chan MY (2005) Dissolved gas effects in SAGD Paper 2005-176 Pet Soc 6th Canadian Int Pet Conf (56th Annual Tech Meet) Calgary Canada June
12 Birrell GE (2001) lsquoHeat transfer ahead of a SAGD steam chamber a study of thermocouple data from Phase B of the underground test facility (Dover Project)rsquo SPE 71503 SPE Ann Tech Conf And Exhib New Orleans USA Oct
13 Bosch R Axcell E Little V Cleary R Wang S Gabel R amp Moreland B (2004) A novel approach for resolving reverse emulsions in SAGD production systems Canadian Journal of Chemical Engineering 82(4) 836-839
14 Brooks R H amp Corey T (1964) Hydraulic properties of porous media
15 Broughton G amp Squires L (1938) The viscosity of oil-water emulsions Journal of Physical Chemistry 42(1) 253-263
16 Butler RM (1991) Thermal Recovery of Oil and Bitumen Prentice-Hall Englewood Cliffs New Jersey
17 Butler R M (1985) New approach to the modelling of steam-assisted gravity drainage Journal of Canadian Petroleum Technology 24(3) 42-51
18 Butler R M (1987) Rise of Interfering Steam Chambers Journal of Canadian Petroleum Technology 26(3) 70-75
19 Butler R M McNab G S and Lo H Y (1981) Theoretical studies of the gravity drainage of heavy oil during in-situ steam heating Journal of Canadian Petroleum Technology 59 455-460
20 Canbolat S Akin S amp Kovscek A R (2002) A study of steam-assisted gravity drainage performance in the presence of noncondensable gases Paper presented at the Proceedings - SPE Symposium on Improved Oil Recovery 78-89
Page 66 of 69
21 Cokar M Gates I D amp Kallos M S (2013) A New Thermogeomechanical Theory for
Gravity Drainage in Steam-Assisted Gravity Drainage SPE Journal18(04) 736-742
22 Chung K H amp Butler R M (1988) Geometrical effect of steam injection on the
formation of emulsions in the steam-assisted gravity drainage process Journal of Canadian Petroleum Technology 27(1) 36-42
23 Dehghanpour H DiCarlo D A (2013) Drainage of capillary-trapped oil by an immiscible gas Impact of transient and steady-state water displacement on three-phase oil permeability Transport in Porous Media 100 297-319
24 Ezeuko C C Wang J amp Gates I D (2013) Investigation of Emulsion Flow in Steam-Assisted Gravity Drainage SPE Journal 18(03) 440-447
25 Farah M A Oliveira R C Caldas J N amp Rajagopal K (2005) Viscosity of water-in-oil emulsions Variation with temperature and water volume fraction Journal of Petroleum Science and Engineering 48(3-4) 169-184
26 Farouq Ali SM 2008 Practical Heavy Oil Recovery ENCH 647 Lecture Notes Dept of
Chem and Pet Eng University of Calgary 27 Heidari M Pooladi-Darvish M Azaiez J amp Maini B (2009) Effect of drainage height
and permeability on SAGD performance Journal of Petroleum Science and Engineering 68(1) 99-106
28 Irani M amp Cokar M (2014 June) Understanding the Impact of Temperature-Dependent Thermal Conductivity on the Steam-Assisted Gravity-Drainage (SAGD) Process Part 1 Temperature Front Prediction In SPE Heavy Oil Conference-Canada Society of Petroleum Engineers
29 Ito Y amp Suzuki S (1999) Numerical simulation of the SAGD process in the Hangingstone oil sands reservoir Journal of Canadian Petroleum Technology38(09)
30 Kasenow Michael (2002)Determination of hydraulic conductivity from grain size analysis Water Resources Publication
Page 67 of 69
31 Kokal S (2005) Crude-oil emulsions A state-of-the-art review SPE Production and
Facilities 20(1) 5-12
32 Krieger I M amp Dougherty T J (1959) A mechanism for non‐Newtonian flow in suspensions of rigid spheres Transactions of The Society of Rheology (1957-1977) 3(1) 137-152
33 Noik C Dalmazzone C Goulay C amp Glenat P (2005) Characterisation and emulsion
behaviour of athabasca extra-heavy-oil produced by SAGD Paper presented at the SPEPS-CIMCHOA International Thermal Operations and Heavy Oil Symposium Proceedings 2005 A365-A372
34 Mehrotra A K amp Svrcek W Y (1987) Viscosity of compressed cold lake bitumen Canadian Journal of Chemical Engineering 65(4) 672-675
35 Mohammadzadeh O and Chatzis I (2009) Pore-level investigation of heavy oil recovery
using steam assisted gravity drainage (SAGD) Paper presented at the Society of Petroleum Engineers - International Petroleum Technology Conference 2009 IPTC 2009 2 1070-1086
36 Mohammadzadeh O Rezaei N amp Chatzis I (2010) Pore-level investigation of heavy oil and bitumen recovery using solvent -aided steam assisted gravity drainage (SA-SAGD) process Energy and Fuels 24(12) 6327-6345
37 Murtaza M He Z amp Dehghanpour H (2013) An approach to model three-phase flow
coupling during steam chamber rise Canadian Journal of Chemical Engineering
38 Pal R (1998) A novel method to correlate emulsion viscosity data Colloids and Surfaces A Physicochemical and Engineering Aspects 137(1) 275-286
39 Poindexter M K Chuai S Marble R A amp Marsh S (2006) The Key to Predicting Emulsion Stability Solid Content SPE Production amp Operations21(03) 357-364
Page 68 of 69
40 Rabiei Faradonbeh M Harding T G amp Abedi J (2014 June) Semi-Analytical
Modeling of Steam-Solvent Gravity Drainage of Heavy Oil and Bitumen Part 2 Unsteady-State Model with Curved Interface In SPE Heavy Oil Conference-Canada Society of Petroleum Engineers
41 Ronningsen HP (1995) Correlations for predicting viscosity of wo emulsions based on North Sea crude oils Proc SPE IntSymp Oil Field Chem SPE 28968 Houston Texas
42 Sarbar M A amp Wingrove M D (1997 January) Physical and chemical characterization of Saudi Arabian crude oil emulsions In SPE Annual Technical Conference and Exhibition Society of Petroleum Engineers
43 Sasaki K Akibayashi S Yazawa N Doan Q T amp Farouq Ali S M (2001) Experimental modeling of the SAGD process - enhancing SAGD performance with periodic stimulation of the horizontal producer SPE Journal 6(1) 89-97
44 Sasaki K Akibayashi S Yazawa N Doan Q amp Ali S F (2001) Numerical and experimental modelling of the steam assisted gravity drainage (SAGD) process Journal of Canadian Petroleum Technology 40(1) 44-50
45 Sasaki K Satoshi A Yazawa N amp Kaneko F (2002 January) Microscopic
visualization with high resolution optical-fiber scope at steam chamber interface on initial stage of SAGD process In SPEDOE Improved Oil Recovery Symposium Society of Petroleum Engineers
46 Sharma J amp Gates I D (2010) Multiphase flow at the edge of a steam
chamber Canadian Journal of Chemical Engineering 88(3) 312-321
47 Taylor G I (1932) The viscosity of a fluid containing small drops of another fluid Proceedings of the Royal Society of London Series A Containing Papers of a Mathematical and Physical Character 41-48
48 Wei S Lin-Song C Huang S amp Huang W (2014 June) Steam Chamber
Development and Production Performance Prediction of Steam Assisted Gravity Drainage In SPE Heavy Oil Conference-Canada Society of Petroleum Engineers
Page 69 of 69
- Analytical Modeling of Emulsion Flow at the Edge of Steam Chamber During SAGD Process
- 1 Chapter One Introduction
-
- 11 Heavy Oil and Oil Sands
- 12 In-situ Extraction of Heavy Oil
-
- 121 Non-thermal Recovery Methods
- 122 Thermal Recovery Methods
-
- 1221 Steam-Assisted Gravity Drainage and its Variants
- 1222 Original SAGD Concept
-
- 13 Motivation
- 14 Specific Objectives of this Research
- 15 Thesis Outline
-
- 2 Chapter Two Literature Review
-
- 21 Overview
- 22 Analytical Modelling of Steam-Assisted Gravity Drainage (SAGD)
-
- 221 Butler Single Phase Model
- 222 Other Variants of Butlerrsquos Models
- 223 Sharma and Gatesrsquo Multiphase Model
- 224 Energy Balance
-
- 3 Chapter 3 Emulsions in SAGD
-
- 31 Definitions
- 32 Emulsion Characteristics
-
- 321 Droplet Size
- 322 Viscosity
- 323 Color and appearance
-
- 33 Emulsion Stability
-
- 331 Steam Quality
- 332 Temperature
- 333 Initial Water Saturation
- 334 Rate of Steam Injection
- 335 Oil Production Rate
- 336 Pressure
- 337 pH
- 338 Droplet Size
- 339 Heavy Fraction in Crude Oil
- 3310 Solid particles
- 3311 Counter current flow
-
- 34 Thermodynamics of Emulsion
-
- 4 Chapter 4 Single Phase Analytical Modeling of SAGD
- The purpose of this chapter is to develop a new gravity drainage model of mobilized bitumen at the edge of steam chamber which includes emulsion effect in in a single phase system Considering that several SAGD experiments reported water-in-oil emulsi
-
- 41 Proposed Theory
-
- 411 Total oil flow rate
- 412 Darcyrsquos law
- 413 Material balance
-
- 42 Model Results
-
- 421 Model Verification
- 422 Sensitivity Analysis
-
- 43 Dynamic Emulsion Viscosity
- 44 Emulsion Mobility
- 45 Volumetric Oil Flux
- 46 Field data analysis
-
- 5 Chapter 5 Two Phase Analytical Modeling of SAGD
-
- 51 Proposed Theory
-
- 511 Total oil flow rate
- 512 Darcyrsquos law
-
- 52 Model Result
-
- 521 Model Verification
- 522 Sensitivity Analysis
- 523 Emulsion Mobility
- 524 Field data analysis
-
- 6 Chapter 6 Conclusion
-

(a) (b)
(c) (d)
Figure 12 Effect of (a) thermal diffusivity (b) advance velocity of steam chamber (c) temperature viscosity parameter and (d) water viscosity on volumetric oil flux profile for
Christina Lake reservoir
(a) (b)
Page 50 of 69
Figure 13 Comparison of SAGD models for different field operations data
Table 2 Comparison of SAGD models for different field operations data (After Sharma and Gates 2010)
Wellpair A3 A Phase B
Average of 3 well pairs
Average of 15 well pairs A B C D EG
H IJ K LM N O P
amp Q
I3P3
B10 grand rapids SD9
pad average of 6 well pairs
Parameters Christina
Lake Surmont
Dover UTF Phase B
Hangingstone Hilda Lake
Cold Lake
Wolf Lake Cold Lake
TR 20 15 7 20 20 20
Ts 220 225 220 260 245 250
ρs (kgm3) 880 880 880 980 880 980
ρo (kgm3) 1009 1009 1009 1015 1009 1015
0
100
200
300
400
Chr
istin
a L
ake
Surm
ont
Dov
er U
TF
Phas
e B
Han
ging
-sto
ne
Hild
a L
ake
Col
d L
ake
Wol
f Lak
e C
old
Lak
eOil
Prod
uctio
n R
ate
(m3 d
ay)
Fields
Field DataCurrent TheorySharma amp Gates ModelButlers Model
Page 51 of 69
h (m) 26 30 21 25 24 11
L (m) 690 850 500 500 1000 500
ф 033 033 033 035 035 032
α (m2s) 5501x10-7 0201 x10-
7 3601 x10-7 260 x10-7 036 x10-7 300 x10-7
kab (m2) 60x10-12 50x10-12 70x10-12 50x10-12 50x10-12 30x10-12
Kro 02 02 02 03 02 03
Sio 080 079 085 077 063 075
Sorw 01 012 015 01 012 01
Swc 015 01 01 01 01 01
νs (m2s) 681x10-6 341x10-6 795x10-6 428x10-6 341x10-6 408x10-6
m 4 5 5 5 5 4
microw (kgms) 000085 000096 000117 000085 000085 000085
ρw (kgm3) 998 999 999 998 998 998
Oil flow rate q (m3day)
Field data 170 50 77 82 65 50
Butler et al (1981)
262 379 148 229 359 131
Sharma and Gates
173 75 80 91 72 39
Current Theory 177 59 84 95 75 48
Page 52 of 69
5 Chapter 5 Two Phase Analytical Modeling of SAGD
The purpose of this chapter is to modify the single phase gravity drainage model developed in previous chapter to derive a two phase model The model includes the effect of multi-phase flow (relative permeability) and oil saturation on oil mobility and drainage rate
Assumptions of the model are as follow
1 The reservoir is homogeneous 2 Steam depletion chamber is symmetric and two dimensional 3 Some part of the water is flowing separately and the rest is emulsified in oil 4 Heat transfer ahead of the chamber edge is only by conduction 5 Porous medium is homogeneous (constant porosity and permeability) 6 Heat losses are neglected 7 Density is dependent on temperature 8 Steam chamber that has reached the maximum height h and is expanding at
a constant velocity U in the direction perpendicular to the chamber walls 9 Reservoir oil does not have any solution gas 10 Heat transfer and mass transfer is directed normal to the edge of the
chamber
51 Proposed Theory
Figure 14 shows a conceptual model of a differential element at the edge of the steam chamber In this model portion of the water in the formation is assumed to be emulsified in the oil phase (Cw) and the rest is flowing along with as a continuous phase (Sw) The total water saturation (Swt) becomes
Swt = Cw + Sw
Probability of Emulsion formation decreases at higher temperatures since when temperature increases emulsion concentration decreases Water saturation is maximum at the chamber edge (ε = 0) and it equals to the connate water saturation far enough from the edge Emulsion formation occurs more when there is less water saturation water droplets can coalescence and flow as a continuous phase
Page 53 of 69
when the water saturation is higher As discussed in chapter 3 emulsification phenomena is a function of following factors temperature viscosity parameter temperature initial water saturation steam injection rate water droplet size and temperature diffusivity parameter
Emulsion at the steam chamber interface is a system of immiscible fluids with water droplets as the dispersed phase and oil as the continuous phase Therefore if we assume τ = microdispersed
microcontinuous= microw
microo and x = Cw Taylor equation becomes
microemmicroo
= 1 + 25
microwmicroo
+ 04microwmicroo
+ 1 Cw (1)
There are several other equations for calculating emulsion viscosity at certain conditions
Figure 14 Schematic illustration of emulsion concentration continuous phase water saturation oil mobility and probability of emulsion formation function with respect to the distance beyond
the steam chamber edge (ε )
Page 54 of 69
Again water saturation becomes a function of distance (ε) beyond the steam chamber interface
Sw = 1 minus So minus Cw = (1 minus Sor) minus (Sio minus Sor)(1minus Tlowast) minus Cw =
(1 minus Sor) minus (Sio minus Sor) 1 minus eminusUεα minus Cw
(2)
Therefore emulsion mobility defined by λoil = k krowmicromix
= k krowρmixνmix
is given by
λo = k krowmicromix
=kkrocw
Sio +CwminusSor1minusSwcminusSor
a
(1minus (eminus Uεα ))a
micromix =
kkrocw(1minus (eminus Uεα ))a(microwmicrose
minusUεα
m+ 1)
microw + micros(e Uεα )m ρoρs+ Cw 25microw + micros
ρoρs
(e Uεα )m
(3)
Where oil relative permeability and dimensionless water saturation are defined as Equation 4 and 5
krow = krocw(1 minus SwD)a (4)
SwD =Sw minus Swc
1 minus Swc minus Sor=
Swt minus Swc minus Cw1 minus Swc minus Sor
(5)
511 Total oil flow rate To develop an expression for the total oil flow rate we combine Darcyrsquos and mass conservation laws together
512 Darcyrsquos law Integration of differential Darcyrsquos law equation for emulsion flow results in
qo = krwSo g sinθ int dενem
infin0 = (6)
Page 55 of 69
qo = kkrocwgsinθSio + Cw minus Sor
1 minus Swc minus Sora
(1 minus (eminus Uεα ))aSoρemmicroem
infin
0 dε
ρem = ρwSw + ρo(1 minus Sw) = (ρw minus ρo)Sw + ρo (8)
Combining equation 1 and equation 8 gives
ρemmicroem
= [(ρw minus ρo)((1minus Sor) + (Sio minus Sor)(1minus eminus Uεα ))minusCw)] + ρo
microw + microo + (25microw + microo)Cwmicrowmicroo
+ 1
(9)
Substituting equation 9 in equation 8 gives
qo = kkrocwgsinθ times
Sio + Cw minus Sor
1 minus Swc minus Sora
(1 minus (eminus Uεα ))aSo([(ρw minus ρo)((1 minus Sor) + (Sio minus Sor)(1 minus eminus Uεα ))minusCw)] + ρo) microwmicroo+ 1
microw + microo + (25microw + microo)Cw
infin
0 dε
(10)
Let 119880120576120572
= 119883 then previous equation becomes below (Equation 11)
q =kkrocw gsinθα
Utimes
Sio + Cw minus Sor
1 minus Swc minus Sora
(1 minus (eminus x))aSo([(ρw minus ρo)((1 minus Sor) + (Sio minus Sor)(1 minus eminus x))minusCw)] + ρo) microwmicroo+ 1
microw + microo + (25microw + microo)Cw
infin
0 dX
(11)
Repeating the material balance same as previous chapter the rate of increase of oil flow across the differential element is related to the advance rate of the steam chamber interface
partqopartx
= OslashΔSo(partypartt
) (12)
The advance velocity interface is
U = minuscosθ (partypartt
) (13)
Page 56 of 69
sinθcos θ
= partypartx
(14)
Simplifying equation 11 knowing ex = δ gives
119902119900 =119896119896119903119900119888119908 119892119904119894119899120579120572
119880times
(1 minus (120575minus 1))119886119878119900((120588119908 minus 120588119900)[(1 minus 119878119900119903) + (119878119894119900 minus 119878119900119903)(1 minus 120575minus 1) minus 119862119908] + 120588119900) 120583119908120583119900
+ 1
(120583119908 + 120583119900 + (25120583119908 + 120583119900)119862119908)120575
infin
1 119889120575
(15)
Substituting equation 12 and 13 in equation 11 with using the geometrical relation of equation 15 gives the total volumetric oil flow rate as
119902119900 = 2119871 times
119896119896119903119900119888119908 119904119894119899120579119892Oslash1205721198781198742(1 minus (120575minus 1))119886((120588119908 minus 120588119900)[(1 minus 119878119900119903) + (119878119894119900 minus 119878119900119903)(1 minus 120575minus 1) minus 119862119908] + 120588119900) 120583119908120583119900
+ 1
(120583119908 + 120583119900 + (25120583119908 + 120583119900)119862119908)120575
infin
1 119889120575
(16)
52 Model Result
521 Model Verification Figure 15 compares the oil phase mobility with respect to distance beyond the interface estimated using 1) the proposed model (two phase flow) 2) Butlerrsquos model and 3) Sharma and Gatesrsquo model Same as single phase model in previous chapter the oil mobility at any distance calculated from the proposed model is lower than that from Butlerrsquos model and lower than that from Sharma and Gatesrsquo model
522 Sensitivity Analysis Sensitivity analysis is done to investigate the dependence of oil flux and total oil production rate on m α and μwater which control emulsion viscosity
523 Emulsion Mobility
Page 57 of 69
Effect of m Figure 16 (a) shows the effect of m on the oil mobility versus distance The results reveal that the smaller the m the smaller the oil mobility profile is As we described in previous section increasing m increases μem so the oil mobility will be lower due to higher μem
Effect of α Figure 16 (b) shows the oil mobility with respect to distance at several thermal diffusivities Increasing α enhances the efficiency of heat transfer and therefore in a specific distance higher the α equals higher oil mobility The maximum oil mobility occurs closer to the edge when α is smaller
Effect of μw Figure 16 (c) shows that μw does not have any significant effect on oil mobility
524 Field data analysis In this section we use the proposed model to predict oil production rate at the field scale Figure 17 compares the oil production rate by the proposed model with Butlerrsquos (1985) and Sharma and Gatesrsquo (2010) models for six different field production data Butlerrsquos model overestimates the oil production rate because there is no consideration of emulsion and multiphase effects Oil flows easily because there is no relative permeability effect to limit the oil flow
The results reveal that the proposed model provides an improved estimate of oil production rate under a series of specific values of α and m reported from field data of Athabasca deposit It demonstrates that emulsification effect at the edge of steam chamber should be included in the SAGD analysis
Page 58 of 69
Figure 15 Comparison of oil mobility in different models
0
200
400
600
800
1000
0 1 2 3 4 5 6
Emul
sion
Mob
ility
mD
cp
Distance Deyond Steam Chamber Edge (m)
Single phse Theory
Butlers model
Gates Model
Two Phase Theory
Page 59 of 69
(a) (b)
(c)
Figure 16 (a) Effect of temperature viscosity parameter (m) (b) thermal diffusivity (α) and (c) water viscosity (microw) on oil mobility with respect to distance beyond the edge of the steam
chamber
Page 60 of 69
Figure 17 Comparison of SAGD models for different field operations data
0
100
200
300
400
Chr
istin
a L
ake
Surm
ont
Dov
er U
TF
Phas
e B
Han
ging
-sto
ne
Hild
a L
ake
Col
d L
ake
Wol
f Lak
e C
old
Lak
e
Oil
Prod
uctio
n R
ate
(m3 d
ay)
Fields
Field Data
Current Theory
Sharma amp Gates Model
Butlers Model
Page 61 of 69
6 Chapter 6 Conclusion
An analytical model for lateral expansion of steam chamber during SAGD process is derived with incorporation of formation and transport of water-in-oil emulsion It is assumed that emulsion is generated due to condensation of steam penetrated into the heated bitumen We also assume that the transport of emulsified water is fully coupled with that of the continuous oil phase and therefore use Darcyrsquos law for modeling emulsion flow The key mechanisms accounted for in this model are alteration of bitumen viscosity and thermal effect The new model reveals that the oil viscosity is set by the balance between temperature gradient due to heat conduction and microbubble concentration gradient due to emulsification There are two controlling parameters temperature-viscosity parameter and thermal diffusivity A comparative application of the proposed model and other SAGD models on different field data reveals that emulsification effect should be included in the SAGD analysis By considering emulsion in the proposed model prediction of oil flow rate improved comparing with Butlerrsquos model A need for extension of the model in case of extensive condensation andor high initial water saturation made us to extend the single phase model The extended model accounts for the flow of water as a separate continuous phase It is assumed that emulsion is generated due to condensation of steam dispersed in oil phase while the rest of water condensation flows as a continuous phase Considering emulsion in the proposed model improved oil flow rate prediction The two phase model with emulsion effect simulates the real condition in the reservoir
A more detailed analysis of effective parameters on emulsion formation in the reservoir during SAGD process is needed for further studies Validation of the model with experimental data came from the laboratory would be valuable as well
Page 62 of 69
Nomenclature
a Corey parameter (dimensionless) Am1 Constant cp volumetric heat capacity of oil sands (Jm3-deg Celsius) g acceleration dure to gravity (ms2) h reservoir thickness (m) Hf heat trnsfered to residual oil connate of warer and reservoir rock (J) Ho heat transferred to the oil stream (J) Hr heat tranasferred to oil saturated reservoir (J) k permeability (m2) kab absolute permeability of the reservoir (m2) krow relative permeability of oil with respect to water (dimensionless) krocw relative permeability of oil at connate water saturation (dimensionless) kTH thermal conductivity (Js m-deg Celsius) L length of the production well (m) m temperature viscosity parameter (dimensionless) Q volumetric oil flow rate (m3s) qo oil flow rate per unit well length (m2s) Rg weigthed (mass) steam oil ratio Sio initial oil saturation (dimensionless) So oil saturation (dimensionless) Sor residual oil saturation (dimensionless) Sw water saturation (dimensionless) Swc connate water saturation (dimensionless) SwD normalised water saturation (dimensionless) T temperature (degree celsius) T imensionless temperature (dimensionless) TR initial reservoir temperature (degree celsius) TS steam temperature (degree celsius) Tm Temperature of heated bitumen (degree celsius) t time (s) U advanced velocity of steam chamber edge measured normal to the interface
(ms) V rise velocity of steam chamber (ms) x distance measured in the horizontal direction (m) xi interface position (m) y distance measured in the vertical direction (m) z distance measured parallel to the well direction (m) Greek Symbols
Page 63 of 69
α thermal diffusivity (m2s) β factor in flow rate equation with emulsion at the chamber edge Ф porosity (dimensionless) microo dynamic oil viscosity (kgms) micros dynamic steam viscosity (kgms) microw dynamic water viscosity (kgms) microem dynamic emulsion viscosity (kgms)
θ angle between the steam chamber edge and the horizontal axis (dimensionless) ε distance beyond the steam chamber edge measured in the direction normal
to it (m) λ latent heat of condensation (Jkg) λo oil mobility (m3skg) ν dispersed phase volume fraction (dimensionless) υs kinematic oil viscosity at steam temperature (m2s) υo kinematic oil viscosity (m2s) ρ rock density (kgm3) ρcCc volumetric heat capacity of steam chamber excluding condensate (kJdegC
m3) ρo oil density (kgm3) ρoCo volumetric heat capacity of oil ρem emulsion density (kgm3) ρw water density at reservoir temperature (kgm3) ρwCw volumetric heat capacity of water ρs bitumen density at steam temperature
Page 64 of 69
BIBLIOGRAPHY
1 Ahmed M Jaafar M Z Wan Sulaiman W R amp Hashim M (2014 March) Miscible Flood Performance of Heterogeneous Layered Reservoirs Considering Profile Control Through Controlled Fluid Movements In Offshore Technology Conference-Asia Offshore Technology Conference
2 Alali N Pishvaie M R amp Jabbari H (2009) A new semi-analytical modeling of steam-
assisted gravity drainage in heavy oil reservoirs Journal of Petroleum Science and Engineering 69(3) 261-270
3 Akin S (2005) Mathematical modeling of steam assisted gravity drainageSPE Reservoir Evaluation amp Engineering 8(05) 372-376
4 Azad A amp Chalaturnyk R J (2010) A mathematical improvement to SAGD using geomechanical modelling Journal of Canadian Petroleum Technology49(10) 53-64
5 Azad A amp Chalaturnyk R J (2012) An improved SAGD analytical simulator Circular steam chamber geometry Journal of Petroleum Science and Engineering 82 27-37
6 Al-Bahlani A and Babadagli T (2009) SAGD laboratory experimental and numerical simulation studies A review of current status and future issues Journal of Petroleum Science and Engineering 68(3-4) 135-150
7 Azom P N amp Srinivasan S (2009 October) Mechanistic modeling of emulsion formation and heat transfer during the steam-assisted gravity drainage (SAGD) process In SPE Annual Technical Conference and Exhibition Society of Petroleum Engineers
8 Azom P N (2013) Improved modeling of the steam-assisted gravity drainage (SAGD) process PhD thesis
9 Azom P N Kamp A amp Srinivasan S (2013 June) Characterizing the Effect of Heat Transfer on Multiphase Flow during the Steam-Assisted Gravity Drainage (SAGD) Process In SPE Heavy Oil Conference-Canada Society of Petroleum Engineers
Page 65 of 69
10 Becker J R (1977) Crude Oil Waxes Emulsions and Asphaltenes Pennwell Tulsa OK
pp 16ndash26 pp 62ndash63 pp 84ndash86
11 Bharatha S Yee C-T Chan MY (2005) Dissolved gas effects in SAGD Paper 2005-176 Pet Soc 6th Canadian Int Pet Conf (56th Annual Tech Meet) Calgary Canada June
12 Birrell GE (2001) lsquoHeat transfer ahead of a SAGD steam chamber a study of thermocouple data from Phase B of the underground test facility (Dover Project)rsquo SPE 71503 SPE Ann Tech Conf And Exhib New Orleans USA Oct
13 Bosch R Axcell E Little V Cleary R Wang S Gabel R amp Moreland B (2004) A novel approach for resolving reverse emulsions in SAGD production systems Canadian Journal of Chemical Engineering 82(4) 836-839
14 Brooks R H amp Corey T (1964) Hydraulic properties of porous media
15 Broughton G amp Squires L (1938) The viscosity of oil-water emulsions Journal of Physical Chemistry 42(1) 253-263
16 Butler RM (1991) Thermal Recovery of Oil and Bitumen Prentice-Hall Englewood Cliffs New Jersey
17 Butler R M (1985) New approach to the modelling of steam-assisted gravity drainage Journal of Canadian Petroleum Technology 24(3) 42-51
18 Butler R M (1987) Rise of Interfering Steam Chambers Journal of Canadian Petroleum Technology 26(3) 70-75
19 Butler R M McNab G S and Lo H Y (1981) Theoretical studies of the gravity drainage of heavy oil during in-situ steam heating Journal of Canadian Petroleum Technology 59 455-460
20 Canbolat S Akin S amp Kovscek A R (2002) A study of steam-assisted gravity drainage performance in the presence of noncondensable gases Paper presented at the Proceedings - SPE Symposium on Improved Oil Recovery 78-89
Page 66 of 69
21 Cokar M Gates I D amp Kallos M S (2013) A New Thermogeomechanical Theory for
Gravity Drainage in Steam-Assisted Gravity Drainage SPE Journal18(04) 736-742
22 Chung K H amp Butler R M (1988) Geometrical effect of steam injection on the
formation of emulsions in the steam-assisted gravity drainage process Journal of Canadian Petroleum Technology 27(1) 36-42
23 Dehghanpour H DiCarlo D A (2013) Drainage of capillary-trapped oil by an immiscible gas Impact of transient and steady-state water displacement on three-phase oil permeability Transport in Porous Media 100 297-319
24 Ezeuko C C Wang J amp Gates I D (2013) Investigation of Emulsion Flow in Steam-Assisted Gravity Drainage SPE Journal 18(03) 440-447
25 Farah M A Oliveira R C Caldas J N amp Rajagopal K (2005) Viscosity of water-in-oil emulsions Variation with temperature and water volume fraction Journal of Petroleum Science and Engineering 48(3-4) 169-184
26 Farouq Ali SM 2008 Practical Heavy Oil Recovery ENCH 647 Lecture Notes Dept of
Chem and Pet Eng University of Calgary 27 Heidari M Pooladi-Darvish M Azaiez J amp Maini B (2009) Effect of drainage height
and permeability on SAGD performance Journal of Petroleum Science and Engineering 68(1) 99-106
28 Irani M amp Cokar M (2014 June) Understanding the Impact of Temperature-Dependent Thermal Conductivity on the Steam-Assisted Gravity-Drainage (SAGD) Process Part 1 Temperature Front Prediction In SPE Heavy Oil Conference-Canada Society of Petroleum Engineers
29 Ito Y amp Suzuki S (1999) Numerical simulation of the SAGD process in the Hangingstone oil sands reservoir Journal of Canadian Petroleum Technology38(09)
30 Kasenow Michael (2002)Determination of hydraulic conductivity from grain size analysis Water Resources Publication
Page 67 of 69
31 Kokal S (2005) Crude-oil emulsions A state-of-the-art review SPE Production and
Facilities 20(1) 5-12
32 Krieger I M amp Dougherty T J (1959) A mechanism for non‐Newtonian flow in suspensions of rigid spheres Transactions of The Society of Rheology (1957-1977) 3(1) 137-152
33 Noik C Dalmazzone C Goulay C amp Glenat P (2005) Characterisation and emulsion
behaviour of athabasca extra-heavy-oil produced by SAGD Paper presented at the SPEPS-CIMCHOA International Thermal Operations and Heavy Oil Symposium Proceedings 2005 A365-A372
34 Mehrotra A K amp Svrcek W Y (1987) Viscosity of compressed cold lake bitumen Canadian Journal of Chemical Engineering 65(4) 672-675
35 Mohammadzadeh O and Chatzis I (2009) Pore-level investigation of heavy oil recovery
using steam assisted gravity drainage (SAGD) Paper presented at the Society of Petroleum Engineers - International Petroleum Technology Conference 2009 IPTC 2009 2 1070-1086
36 Mohammadzadeh O Rezaei N amp Chatzis I (2010) Pore-level investigation of heavy oil and bitumen recovery using solvent -aided steam assisted gravity drainage (SA-SAGD) process Energy and Fuels 24(12) 6327-6345
37 Murtaza M He Z amp Dehghanpour H (2013) An approach to model three-phase flow
coupling during steam chamber rise Canadian Journal of Chemical Engineering
38 Pal R (1998) A novel method to correlate emulsion viscosity data Colloids and Surfaces A Physicochemical and Engineering Aspects 137(1) 275-286
39 Poindexter M K Chuai S Marble R A amp Marsh S (2006) The Key to Predicting Emulsion Stability Solid Content SPE Production amp Operations21(03) 357-364
Page 68 of 69
40 Rabiei Faradonbeh M Harding T G amp Abedi J (2014 June) Semi-Analytical
Modeling of Steam-Solvent Gravity Drainage of Heavy Oil and Bitumen Part 2 Unsteady-State Model with Curved Interface In SPE Heavy Oil Conference-Canada Society of Petroleum Engineers
41 Ronningsen HP (1995) Correlations for predicting viscosity of wo emulsions based on North Sea crude oils Proc SPE IntSymp Oil Field Chem SPE 28968 Houston Texas
42 Sarbar M A amp Wingrove M D (1997 January) Physical and chemical characterization of Saudi Arabian crude oil emulsions In SPE Annual Technical Conference and Exhibition Society of Petroleum Engineers
43 Sasaki K Akibayashi S Yazawa N Doan Q T amp Farouq Ali S M (2001) Experimental modeling of the SAGD process - enhancing SAGD performance with periodic stimulation of the horizontal producer SPE Journal 6(1) 89-97
44 Sasaki K Akibayashi S Yazawa N Doan Q amp Ali S F (2001) Numerical and experimental modelling of the steam assisted gravity drainage (SAGD) process Journal of Canadian Petroleum Technology 40(1) 44-50
45 Sasaki K Satoshi A Yazawa N amp Kaneko F (2002 January) Microscopic
visualization with high resolution optical-fiber scope at steam chamber interface on initial stage of SAGD process In SPEDOE Improved Oil Recovery Symposium Society of Petroleum Engineers
46 Sharma J amp Gates I D (2010) Multiphase flow at the edge of a steam
chamber Canadian Journal of Chemical Engineering 88(3) 312-321
47 Taylor G I (1932) The viscosity of a fluid containing small drops of another fluid Proceedings of the Royal Society of London Series A Containing Papers of a Mathematical and Physical Character 41-48
48 Wei S Lin-Song C Huang S amp Huang W (2014 June) Steam Chamber
Development and Production Performance Prediction of Steam Assisted Gravity Drainage In SPE Heavy Oil Conference-Canada Society of Petroleum Engineers
Page 69 of 69
- Analytical Modeling of Emulsion Flow at the Edge of Steam Chamber During SAGD Process
- 1 Chapter One Introduction
-
- 11 Heavy Oil and Oil Sands
- 12 In-situ Extraction of Heavy Oil
-
- 121 Non-thermal Recovery Methods
- 122 Thermal Recovery Methods
-
- 1221 Steam-Assisted Gravity Drainage and its Variants
- 1222 Original SAGD Concept
-
- 13 Motivation
- 14 Specific Objectives of this Research
- 15 Thesis Outline
-
- 2 Chapter Two Literature Review
-
- 21 Overview
- 22 Analytical Modelling of Steam-Assisted Gravity Drainage (SAGD)
-
- 221 Butler Single Phase Model
- 222 Other Variants of Butlerrsquos Models
- 223 Sharma and Gatesrsquo Multiphase Model
- 224 Energy Balance
-
- 3 Chapter 3 Emulsions in SAGD
-
- 31 Definitions
- 32 Emulsion Characteristics
-
- 321 Droplet Size
- 322 Viscosity
- 323 Color and appearance
-
- 33 Emulsion Stability
-
- 331 Steam Quality
- 332 Temperature
- 333 Initial Water Saturation
- 334 Rate of Steam Injection
- 335 Oil Production Rate
- 336 Pressure
- 337 pH
- 338 Droplet Size
- 339 Heavy Fraction in Crude Oil
- 3310 Solid particles
- 3311 Counter current flow
-
- 34 Thermodynamics of Emulsion
-
- 4 Chapter 4 Single Phase Analytical Modeling of SAGD
- The purpose of this chapter is to develop a new gravity drainage model of mobilized bitumen at the edge of steam chamber which includes emulsion effect in in a single phase system Considering that several SAGD experiments reported water-in-oil emulsi
-
- 41 Proposed Theory
-
- 411 Total oil flow rate
- 412 Darcyrsquos law
- 413 Material balance
-
- 42 Model Results
-
- 421 Model Verification
- 422 Sensitivity Analysis
-
- 43 Dynamic Emulsion Viscosity
- 44 Emulsion Mobility
- 45 Volumetric Oil Flux
- 46 Field data analysis
-
- 5 Chapter 5 Two Phase Analytical Modeling of SAGD
-
- 51 Proposed Theory
-
- 511 Total oil flow rate
- 512 Darcyrsquos law
-
- 52 Model Result
-
- 521 Model Verification
- 522 Sensitivity Analysis
- 523 Emulsion Mobility
- 524 Field data analysis
-
- 6 Chapter 6 Conclusion
-
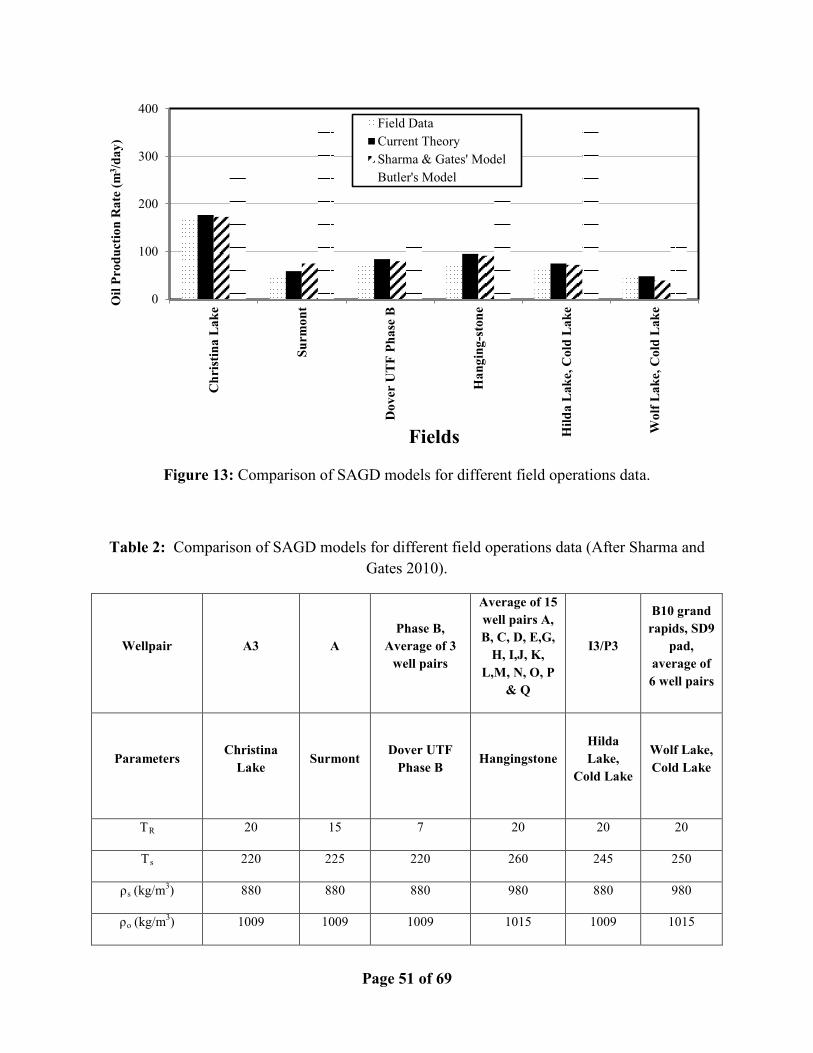
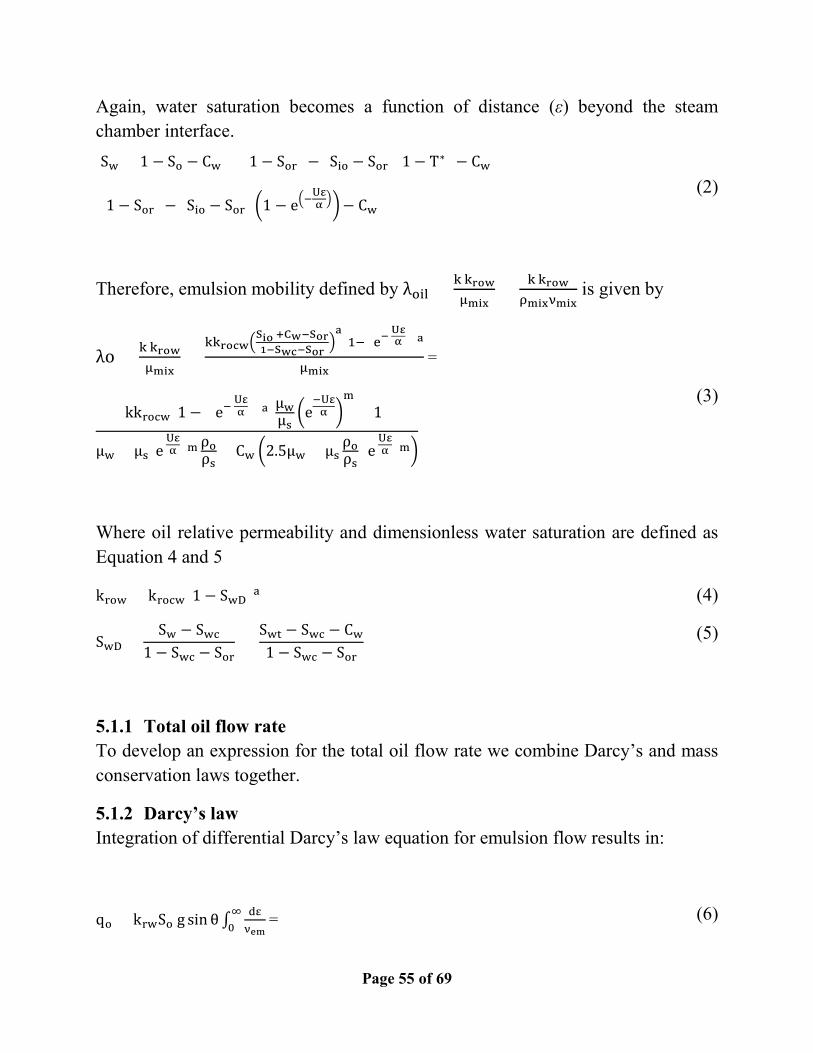