analytical method development and validation of anticancer drugs
15
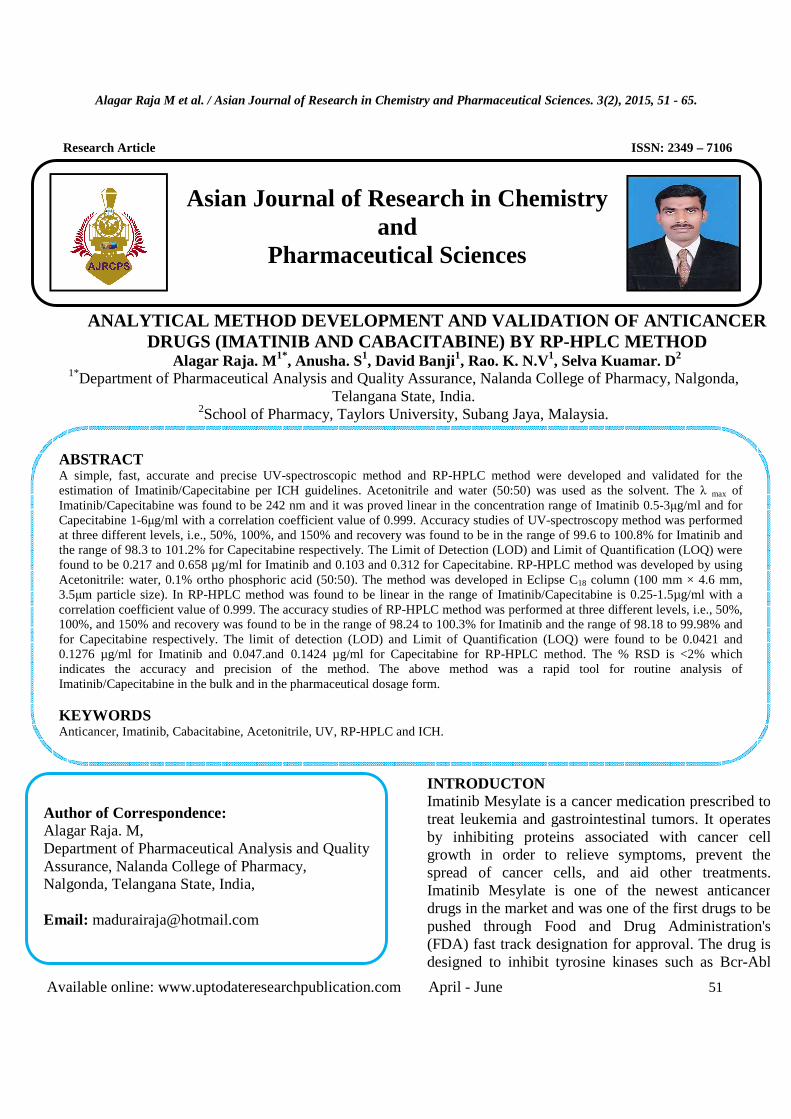
Alagar Raja M et al. / Asian Journal of Research in Chemistry and Pharmaceutical Sciences. 3(2), 2015, 51 - 65. Available online: www.uptodateresearchpublication.com April - June 51 Research Article ISSN: 2349 – 7106 ANALYTICAL METHOD DEVELOPMENT AND VALIDATION OF ANTICANCER DRUGS (IMATINIB AND CABACITABINE) BY RP-HPLC METHOD Alagar Raja. M 1* , Anusha. S 1 , David Banji 1 , Rao. K. N.V 1 , Selva Kuamar. D 2 1* Department of Pharmaceutical Analysis and Quality Assurance, Nalanda College of Pharmacy, Nalgonda, Telangana State, India. 2 School of Pharmacy, Taylors University, Subang Jaya, Malaysia. INTRODUCTON Imatinib Mesylate is a cancer medication prescribed to treat leukemia and gastrointestinal tumors. It operates by inhibiting proteins associated with cancer cell growth in order to relieve symptoms, prevent the spread of cancer cells, and aid other treatments. Imatinib Mesylate is one of the newest anticancer drugs in the market and was one of the first drugs to be pushed through Food and Drug Administration's (FDA) fast track designation for approval. The drug is designed to inhibit tyrosine kinases such as Bcr-Abl ABSTRACT A simple, fast, accurate and precise UV-spectroscopic method and RP-HPLC method were developed and validated for the estimation of Imatinib/Capecitabine per ICH guidelines. Acetonitrile and water (50:50) was used as the solvent. The λ max of Imatinib/Capecitabine was found to be 242 nm and it was proved linear in the concentration range of Imatinib 0.5-3µg/ml and for Capecitabine 1-6µg/ml with a correlation coefficient value of 0.999. Accuracy studies of UV-spectroscopy method was performed at three different levels, i.e., 50%, 100%, and 150% and recovery was found to be in the range of 99.6 to 100.8% for Imatinib and the range of 98.3 to 101.2% for Capecitabine respectively. The Limit of Detection (LOD) and Limit of Quantification (LOQ) were found to be 0.217 and 0.658 μg/ml for Imatinib and 0.103 and 0.312 for Capecitabine. RP-HPLC method was developed by using Acetonitrile: water, 0.1% ortho phosphoric acid (50:50). The method was developed in Eclipse C 18 column (100 mm × 4.6 mm, 3.5µm particle size). In RP-HPLC method was found to be linear in the range of Imatinib/Capecitabine is 0.25-1.5μg/ml with a correlation coefficient value of 0.999. The accuracy studies of RP-HPLC method was performed at three different levels, i.e., 50%, 100%, and 150% and recovery was found to be in the range of 98.24 to 100.3% for Imatinib and the range of 98.18 to 99.98% and for Capecitabine respectively. The limit of detection (LOD) and Limit of Quantification (LOQ) were found to be 0.0421 and 0.1276 μg/ml for Imatinib and 0.047.and 0.1424 μg/ml for Capecitabine for RP-HPLC method. The % RSD is <2% which indicates the accuracy and precision of the method. The above method was a rapid tool for routine analysis of Imatinib/Capecitabine in the bulk and in the pharmaceutical dosage form. KEYWORDS Anticancer, Imatinib, Cabacitabine, Acetonitrile, UV, RP-HPLC and ICH. Author of Correspondence: Alagar Raja. M, Department of Pharmaceutical Analysis and Quality Assurance, Nalanda College of Pharmacy, Nalgonda, Telangana State, India, Email: [email protected] Asian Journal of Research in Chemistry and Pharmaceutical Sciences
Transcript of analytical method development and validation of anticancer drugs
Alagar Raja M et al. / Asian Journal of Research in Chemistry and Pharmaceutical Sciences. 3(2), 2015, 51 - 65.
Available online: www.uptodateresearchpublication.com April - June 51
Research Article ISSN: 2349 – 7106
ANALYTICAL METHOD DEVELOPMENT AND VALIDATION OF ANTICANCER DRUGS (IMATINIB AND CABACITABINE) BY RP-HPLC METHOD
Alagar Raja. M1*, Anusha. S1, David Banji1, Rao. K. N.V1, Selva Kuamar. D2 1*Department of Pharmaceutical Analysis and Quality Assurance, Nalanda College of Pharmacy, Nalgonda,
Telangana State, India. 2School of Pharmacy, Taylors University, Subang Jaya, Malaysia.
INTRODUCTON Imatinib Mesylate is a cancer medication prescribed to treat leukemia and gastrointestinal tumors. It operates by inhibiting proteins associated with cancer cell growth in order to relieve symptoms, prevent the spread of cancer cells, and aid other treatments. Imatinib Mesylate is one of the newest anticancer drugs in the market and was one of the first drugs to be pushed through Food and Drug Administration's (FDA) fast track designation for approval. The drug is designed to inhibit tyrosine kinases such as Bcr-Abl
ABSTRACT A simple, fast, accurate and precise UV-spectroscopic method and RP-HPLC method were developed and validated for the estimation of Imatinib/Capecitabine per ICH guidelines. Acetonitrile and water (50:50) was used as the solvent. The λ max of Imatinib/Capecitabine was found to be 242 nm and it was proved linear in the concentration range of Imatinib 0.5-3µg/ml and for Capecitabine 1-6µg/ml with a correlation coefficient value of 0.999. Accuracy studies of UV-spectroscopy method was performed at three different levels, i.e., 50%, 100%, and 150% and recovery was found to be in the range of 99.6 to 100.8% for Imatinib and the range of 98.3 to 101.2% for Capecitabine respectively. The Limit of Detection (LOD) and Limit of Quantification (LOQ) were found to be 0.217 and 0.658 µg/ml for Imatinib and 0.103 and 0.312 for Capecitabine. RP-HPLC method was developed by using Acetonitrile: water, 0.1% ortho phosphoric acid (50:50). The method was developed in Eclipse C18 column (100 mm × 4.6 mm, 3.5µm particle size). In RP-HPLC method was found to be linear in the range of Imatinib/Capecitabine is 0.25-1.5µg/ml with a correlation coefficient value of 0.999. The accuracy studies of RP-HPLC method was performed at three different levels, i.e., 50%, 100%, and 150% and recovery was found to be in the range of 98.24 to 100.3% for Imatinib and the range of 98.18 to 99.98% and for Capecitabine respectively. The limit of detection (LOD) and Limit of Quantification (LOQ) were found to be 0.0421 and 0.1276 µg/ml for Imatinib and 0.047.and 0.1424 µg/ml for Capecitabine for RP-HPLC method. The % RSD is <2% which indicates the accuracy and precision of the method. The above method was a rapid tool for routine analysis of Imatinib/Capecitabine in the bulk and in the pharmaceutical dosage form. KEYWORDS Anticancer, Imatinib, Cabacitabine, Acetonitrile, UV, RP-HPLC and ICH.
Author of Correspondence: Alagar Raja. M, Department of Pharmaceutical Analysis and Quality Assurance, Nalanda College of Pharmacy, Nalgonda, Telangana State, India, Email: [email protected]
Asian Journal of Research in Chemistry and
Pharmaceutical Sciences
Alagar Raja M et al. / Asian Journal of Research in Chemistry and Pharmaceutical Sciences. 3(2), 2015, 51 - 65.
Available online: www.uptodateresearchpublication.com April - June 52
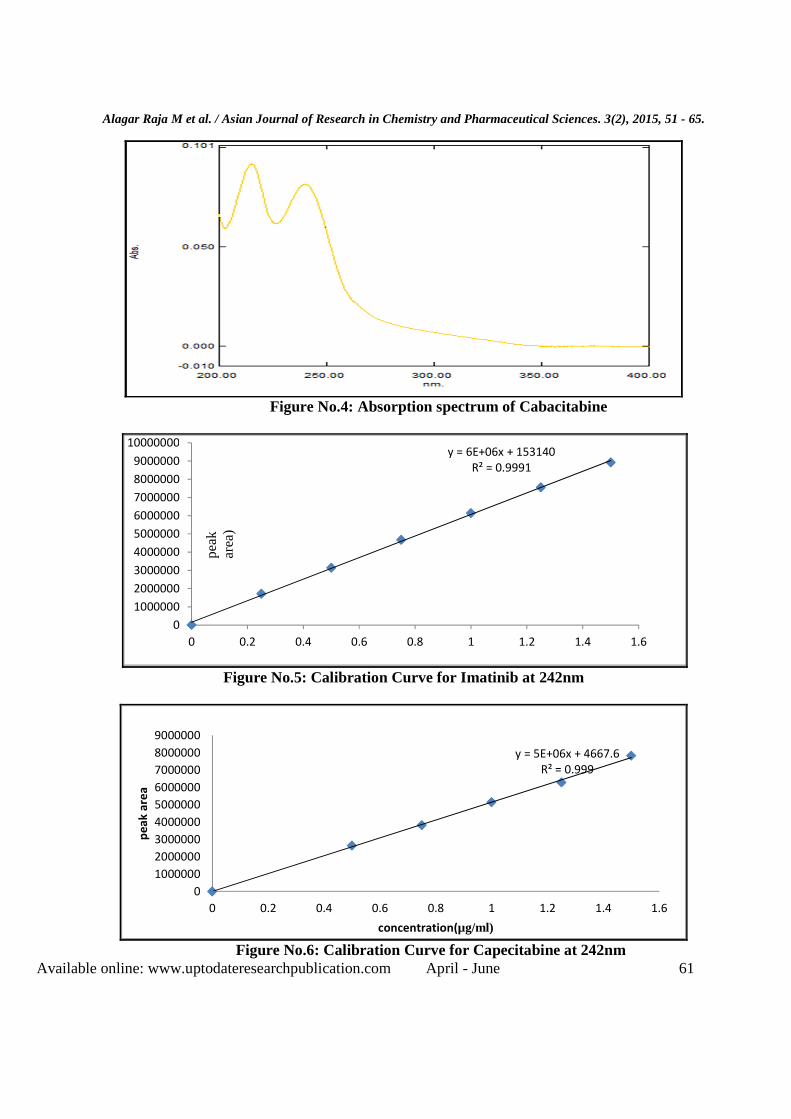
and is used in the treatment of Chronic Myeloid Leukemia (CML) and gastrointestinal stroma tumors. Chemically Capecitabine is designated as pentyl[1-(3,4-dihydroxy-5-methyl tetrahydrofuran-2-yl)-5-fluoro-2-oxo-1H-pyrimidin-4-yl]aminomethanoate1, it is used as antineoplastic agent for the treatment of breast and colorectal cancer. Literature survey reveals a few LC-MS methods reported for the determination of Capecitabine and its metabolites in biological fluids. and a single HPLC method in tablet formulation7-8. Keeping this point into consideration, an attempt was made to develop a simple, accurate and validated stability indicating RP-HPLC method for the estimation of Imatinib and Capecitabine in pure and tablet form. The proposed Method was validated as per ICH guidelines Q2A. MATERIALS AND METHODS Chemicals and Reagents Analytically pure sample of imatinib mesylate (GLEEVEC) with purity greater than 99% manufactured by Cipla Limited was used. Acetonitrile (HPLC grade) was obtained from Merck water (HPLC grade), potassium dihydrogen (AR grade), acetic acid (AR Grade) were obtained from SD Fine chemicals (Hyderabad, India). Instrumentation Double beam UV-Visible Spectrophotometer (Shimadzu-1800) connected to a computer loaded with Shimadzu UV Probe 2.33 software was used for all the spectrophotometric measurements in all proposed spectrophotometric methods. Selection of wavelength of Imatinib/Capecitabine 10µg/ml of Imatinib/Capcitabine were prepared in acetonitrile:water (50:50v/v) solvent. The resulting solutions were scanned from 190 to 400 nm in UV-Visible spectrophotometer. The optimal response for two of them was obtained at 242 nm. Hence the complete method was processed at the wavelength of 242 nm. Preparation of mobile phase of Imatinib/Capecitabine Take HPLC water 500 ml (50%) and 500ml Acetonitrile (50%) HPLC into a 1000 ml volumetric flask to this add (0.1%v/v) of ortho phosphoric acid
was mixed and degassed in ultrasonic water bath for 5 minutes and was filtered through 0.45 µ filter under vacuum filtration. Selection of flow rate of Imatinib/Capecitabine. As increase in the flow rate results in decrease in the retention time. Hence sufficient flow rate of 0.8 mLmin-1 was chosen to avoid overlap between the peaks and the loss of its acceptable resolution values. Preparation of Standard Stock Solution of Imatinib/Capecitabine Standard stock solution of Imatinib/Capecitabine (1 mg/ml) was prepared by transferring into a 10 ml volumetric flask containing 4mL of acetonitrile:water (50:50v/v)diluent. It was then sonicated for 15 minutes and solution was diluted up to the volume by acetonitrile: water (50:50v/v). From these, further dilutions were made using acetonitrile: water (50:50v/v) to produce solution of Imatinib/Capecitabine (10µg/ml). Preparation of sample solution of Imatinib/Capecitabine 20 Tablets of contents were weighed and the average weight was determined. They were crushed in to fine powder with glass mortar. The quantity of powder equivalent to 10 mg of active ingredient present in Imatinib/ powder equivalent to 50mg of Capecitabine was transferred into a 10 ml clean dry volumetric flask, 7 ml of diluents acetonitrile:water (50:50v/v) was added to it and was shaken by mechanical stirrer and sonicated for about 10 minutes by shaking at intervals of five minutes and diluted up to the mark with diluent to give a concentration of 1000 µg/ml for Imatinib and 5000µg/ml for Capecitabine. The solution was filtered through the whatman filter paper. The filtrate contains 10µg/ml of Imatinib/Capecitabine to give the respective concentrations as par with standard solution. System Suitability studies of Imatinib/Capecitabine According to the USP, system suitability tests are an integral part of chromatographic methods. These tests are used to verify that the resolution and reproducibility of the system are adequate for the analysis to be performed. System suitability tests are based on the concept that the equipment, electronics, analytical operations, and samples constitute an
Alagar Raja M et al. / Asian Journal of Research in Chemistry and Pharmaceutical Sciences. 3(2), 2015, 51 - 65.
Available online: www.uptodateresearchpublication.com April - June 53
integral system that can be evaluated as a whole. The purpose of the system suitability test is to ensure that the complete testing system (including instrument, reagents, columns, analysts) is suitable for the intended application. System Suitability Test Parameters are Plate number or number of theoretical plates (n) Capacity factor (capacity ratio) k The selectivity or Separation Factor (relative retention) α. Peak Resolution rS
Peak asymmetry factor (As). These are measured on a peak or peaks of known retention time and peak width. Linearity and range of Imatinib/Capecitabine The linearity of analytical method is its ability to elicit test results that are directly proportional to the concentration of analyte in the sample within the range. The range of the analytical method is the interval between the upper and lower levels that have been demonstrated to be determined within a suitable level of precision, accuracy and linearity. Procedure for Imatinib/Capecitabine Each level solution was injected into the chromatographic system and the peak area was measured. A graph of peak area versus concentration (on X-axis concentration and on Y-axis Peak area) was plotted and the correlation coefficient was calculated. The linearity of the method was demonstrated over the concentration range of Imatinib/Capecitabine 0.25-1.5µg / ml. Aliquots of six levels were prepared from sample solution. The solutions were injected in to HPLC system as per test procedure. Preparation of sample stock solution of Imatinib/Capecitabine About 10mg of Imatinib/Capecitabine samples was weighed in to volumetric flask, it was dissolved with diluents acetonitrile:water (50:50v/v) and the volume was made up to the mark with same diluent ( 10µg/ml of Imatinib/Capecitabine). Precision studies of Imatinib/Capecitabine The precision of an analytical method is the degree of agreement among individual test results, when the method is applied repeatedly to multiple sampling of homogeneous samples. It provides an indication of
random error results and is expressed as relative standard deviation (% RSD). Precision of the method was demonstrated by
• Intraday precision • Inter day precision • Repeatability
Repeatability (Method precision) of Imatinib/Capecitabine Repeatability expresses the analytical variability under the same operating conditions over a short interval of time. The repeatability studies were carried out by taking 2µg/ml for Imatinib and 4µg/ml for Capecitabine as 100% test concentration and repeating it for six times. Intermediate precision Intraday precision and inter day precision of Imatinib/Capecitabine Variation of results within the same day (intra-day) and variation of results between days (inter-day) were analysed. Intra-day precision was determined by analyzing single concentration of Imatinib/Capecitabine for 6 times on the same day at 242nm. Inter-day precision was determined by analyzing single concentrations of Imatinib/Capecitabine on the preceding day at 242nm and % RSD was calculated. Accuracy studies of Imatinib/Capecitabine Accuracy is the closeness of the results obtained by the method to the true value. Recovery studies were carried out at 50%, 100% and 150% by adding known amount of standard drug solution of Imatinib/Capecitabine i.e. (0.75, 1, 1.25 µg/ml) to the sample solution whose concentration is maintained constant for Imatinib/Capecitabine i.e. 0.5µg/ml. The %recovery was calculated and reported. Robustness of Imatinib/Capecitabine Robustness of an analytical procedure is a measure of its capacity to remain unaffected by small, but deliberate variations in method parameters and provides an indication of its reliability during normal usage. It is carried out by changing the flow rate of mobile phase from 0.8 to 1.2mL min-changing the detection wavelength from 240 to 242nm.
Alagar Raja M et al. / Asian Journal of Research in Chemistry and Pharmaceutical Sciences. 3(2), 2015, 51 - 65.
Available online: www.uptodateresearchpublication.com April - June 54
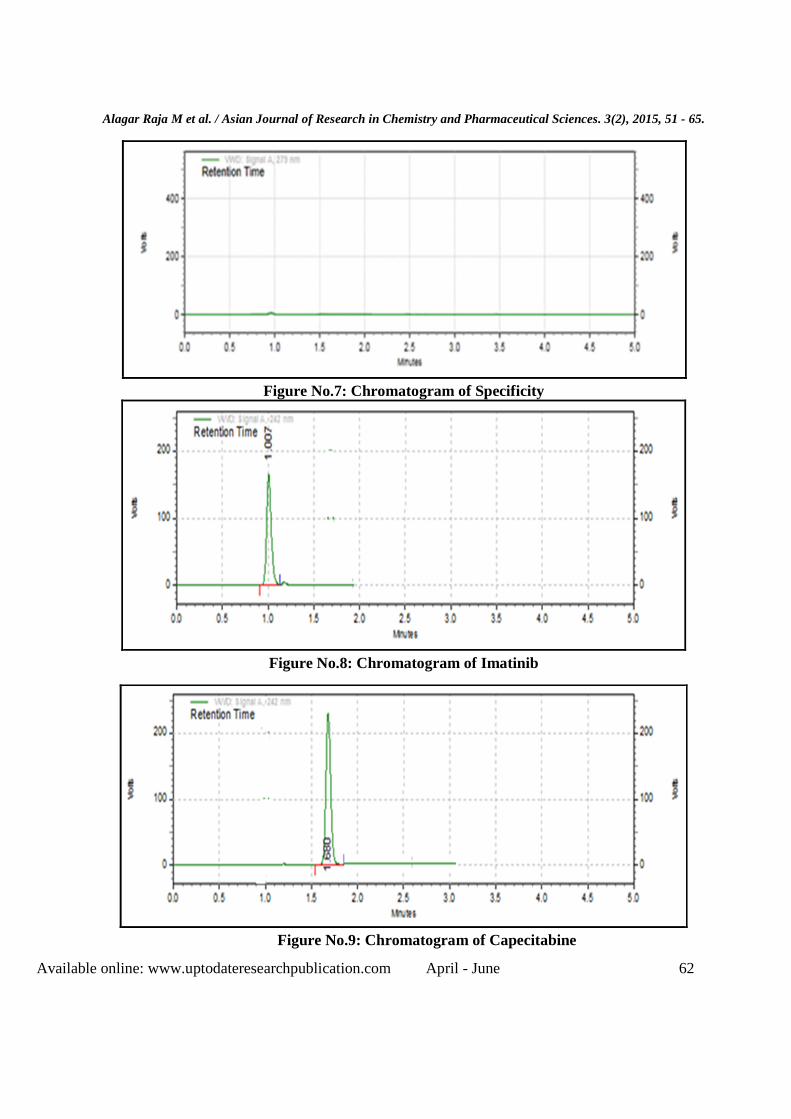
Specificity of Imatinib/Capecitabine The term specific generally refers to a method that produces a response for a single analyte only while the term selectivity refers to a method that provides responses for a number of chemical entities that may or may not be distinguished from each other. The analyte was assessed in the presence of components and it was found that there was no interaction with the analyte. System suitability testing (SST) of Imatinib/Capecitabine System suitability tests are an integral part of chromatographic method. They were used to verify that the reproducibility of the chromatographic system is adequate for the analysis. It is defined as tests to measure that the method can generate result of acceptable accuracy and precision. Limits of detection and limits of quantification of Imatinib/Capecitabine The parameters LOD and LOQ were determined on the basis of response and slope of the regression equation. Procedure The Limit of Quantification (LOQ) and Limit of Detection (LOD) were based on the residual standard deviation of the response and the slope of the constructed calibration curve (n=3), as described in International Conference on Harmonization guidelines Q2 (R1). LOD = 3.3 × σ/S LOQ = 10 × σ/S Where, σ = the residual standard deviation of the response and S = slope of the calibration curve The flow rate was varied for Imatinib/Capecitabine at 0.9 mLmin-1 to 0.7 mLmin-1. Standard solution of Imatinib/Capecitabine was analysed at 0.9 and 0.7mL min-1 i.e. at ± 0.8unit of optimized flow rate (1mL/min).The detection wavelength was varied at 240 to 244nm. Standard solution of Imatinib/Capecitabine was analysed at 240 and 244nm i.e. at ± 1unit of optimized wavelength (242nm).
Selectivity studies of Imatinib/Capecitabine The solutions were prepared and analysed with change in the analytical conditions like different instrument and different analyst. Standard concentrations of Imatinib/Capecitabine 1µg/ml were carried used to carry out the ruggedness studies. Assay studies of Imatinib/Capecitabine Assay studies were carried out by weighing twenty tablets of Imatinib/Capecitabine formulation and powdered. The powder equivalent to 10mg was taken and the solution equivalent to 1000µg/ml was prepared and was used for further dilutions. RESULTS AND DISCUSSION Selection of mobile phase and flow rate of Imatinib/Capecitabine Initially various mobile phase compositions were tried, to separate title ingredients. Mobile phase composition and flow rate selection was based on peak parameters (height, tailing, theoretical plates, capacity or symmetry factor) and run time. The system with acetonitrile:water 0.1% ortho phosphoric acid(50:50v/v) of 0.8ml/min flow rate was found to be quite robust. The optimum wavelength for detection was 242nm at which better detector response for Imatinib/Capecitabine was obtained. The retention time was found to be 1.0min for imatinib and 1.6min for Capecitabine and the total runtime for this method along with the elution of and indicates that the developed method is quite fast and economical. Calibration curve for Imatinib/Capecitabine Appropriate aliquots from standard Imatinib/Capecitabine stock solutions were transferred into different volumetric flasks of 10ml capacity and the volume is adjusted to the mark to obtain concentrations of 0.25, 0.5, 0.75, 1, 1.25, 1.5 µg/ml of Imatinib/Capecitabine. Linearity of Imatinib/Capecitabine The linearity was found in the concentration range of 0.25-1.5 µg/ml for the developed HPLC method and the results are shown in Table No.1 and 2. Precision studies of Imatinib/Capecitabine Repeatability studies were carried out by taking 100 % test concentration and repeating it three times. Interday and intraday precision were done by taking 100% test
Alagar Raja M et al. / Asian Journal of Research in Chemistry and Pharmaceutical Sciences. 3(2), 2015, 51 - 65.
Available online: www.uptodateresearchpublication.com April - June 55
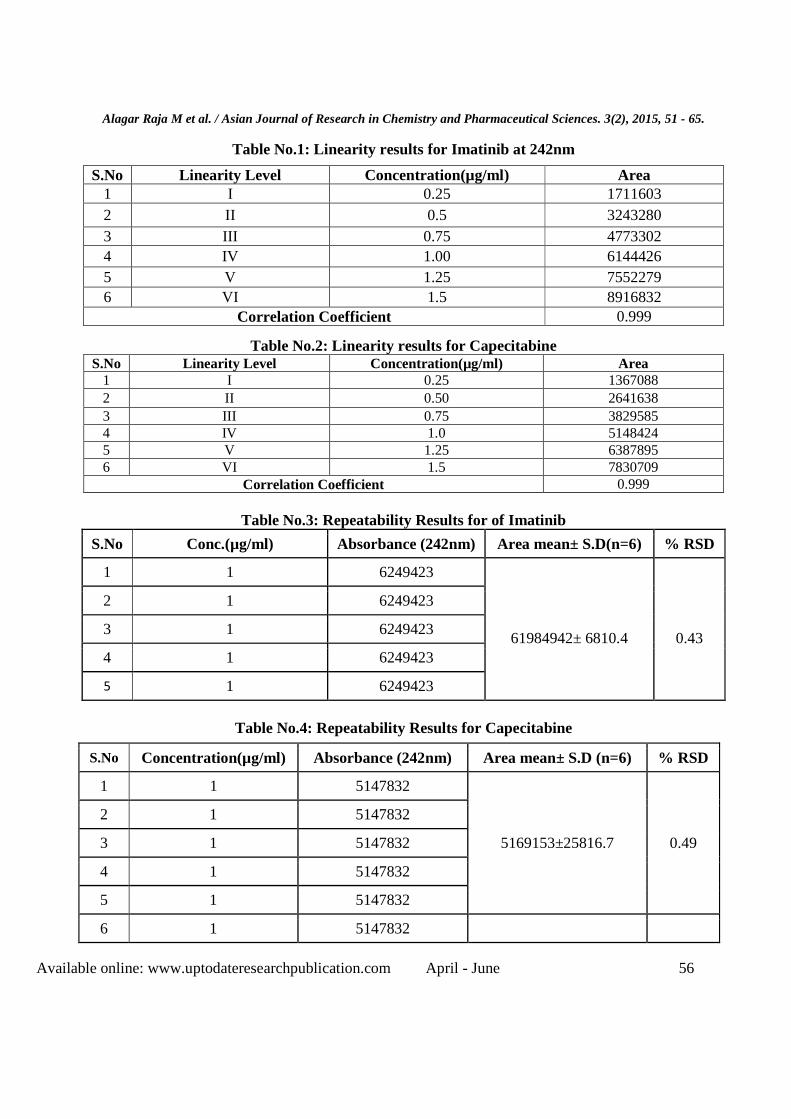
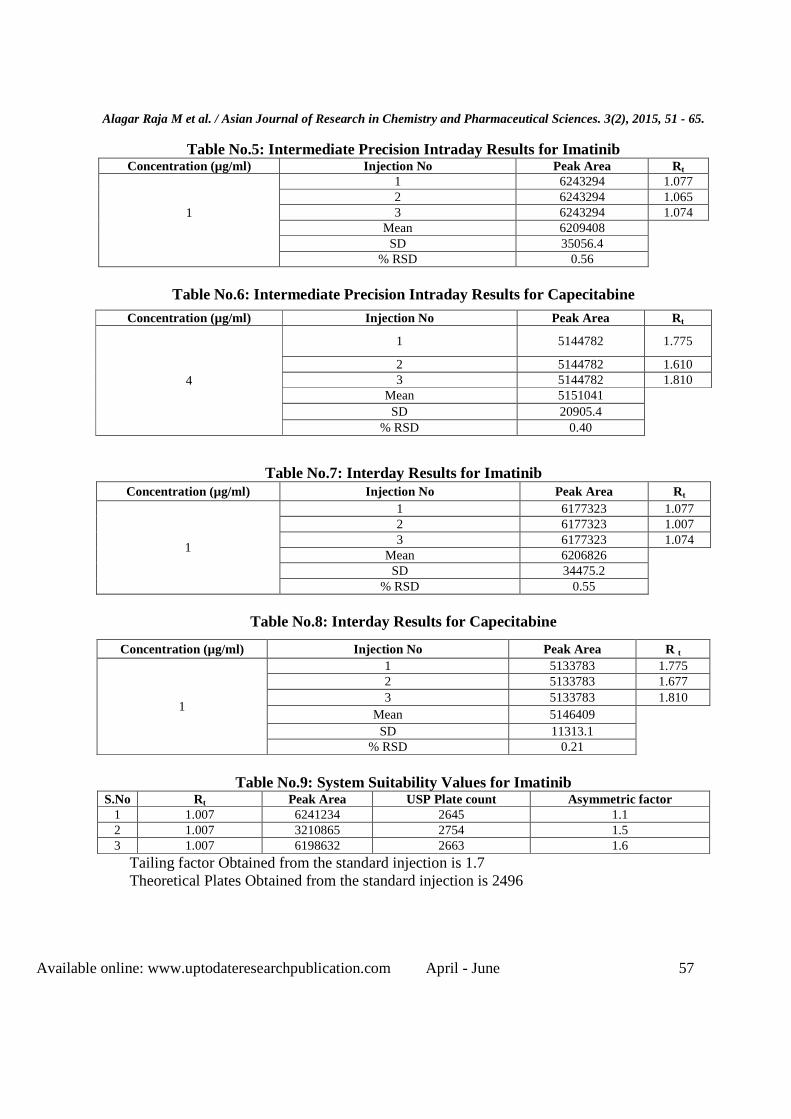
concentration and repeating it three times and values for both system precision and method precision in terms of % RSD were found to be <2.0% . The results show that the % RSD value for repeatability, intraday and intraday is 0.43, 0.56, 0.55 for Imatinib the results shown in Table No.3 and 0.49,0.40,0.21 for Capecitabine the results shown in Table No.4 which indicate that they meet the acceptance criteria and hence the method is said to be precise. System suitability studies of Imatinib/Capecitabine System suitability tests are an integral part of chromatographic method. They were used to verify that the reproducibility of the chromatographic system is adequate for the analysis. It is defined as tests to measure that the method can generate result of acceptable accuracy and precision. For Imatinib the results have shown in Table No.9 and for Capecitabine the result shown in Table No.10. Procedure System suitability standard solution which contained 10µg/ml of Imatinib/Capecitabine was prepared by appropriately diluting and mixing the corresponding stock standard solutions. System suitability was determined from six replicate injections of the system suitability standard before sample analysis. Parameters such as a number of theoretical plates (N), tailing factor and retention time, resolution were calculated. Specificity studies of Imatinib/Capecitabine The term specific generally refers to a method that produces a response for a single analyte only while the term selectivity refers to a method that provides responses for a number of chemical entities that may or may not be distinguished from each other. The analyte was assessed in the presence of components and it was found that there was no interaction with the analyte. Robustness studies of Imatinib/Capecitabine Robustness of an analytical procedure is a measure of its capacity to remain unaffected by small, but deliberate variations in method parameters and provides an indication of its reliability during normal usage. It is carried out by changing the flow rate of mobile phase from 0.8 to 1.2 mL min-1 changing the
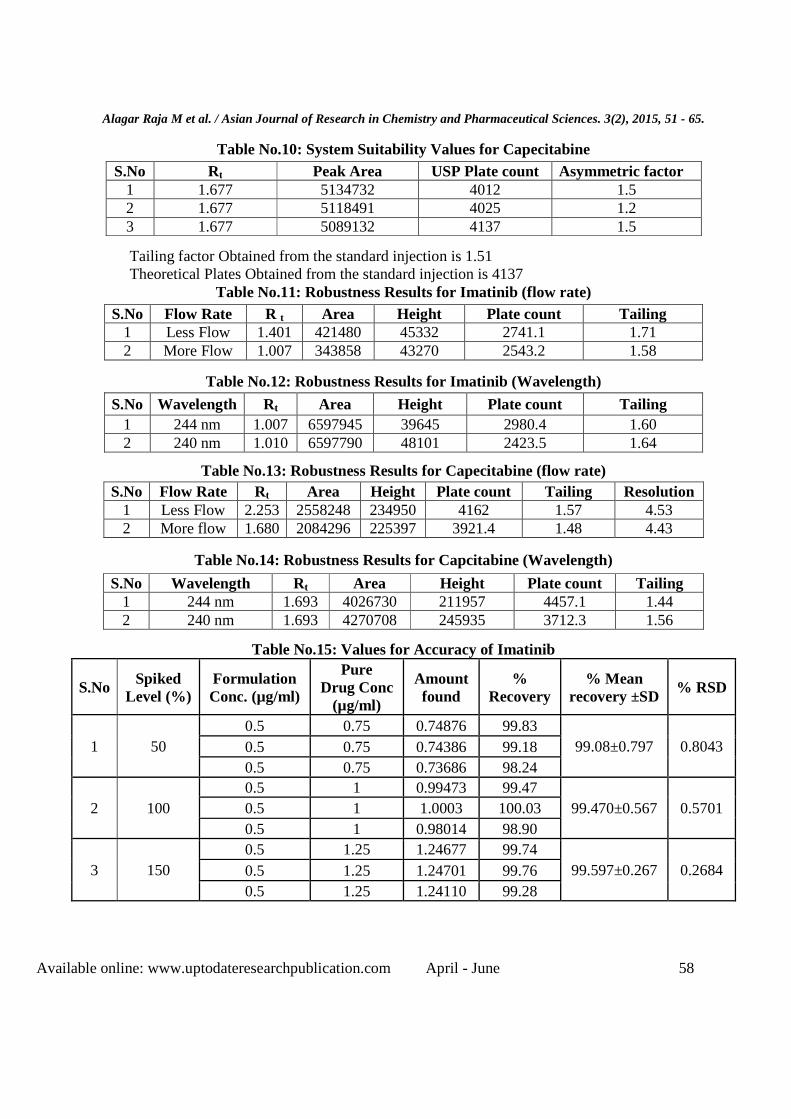
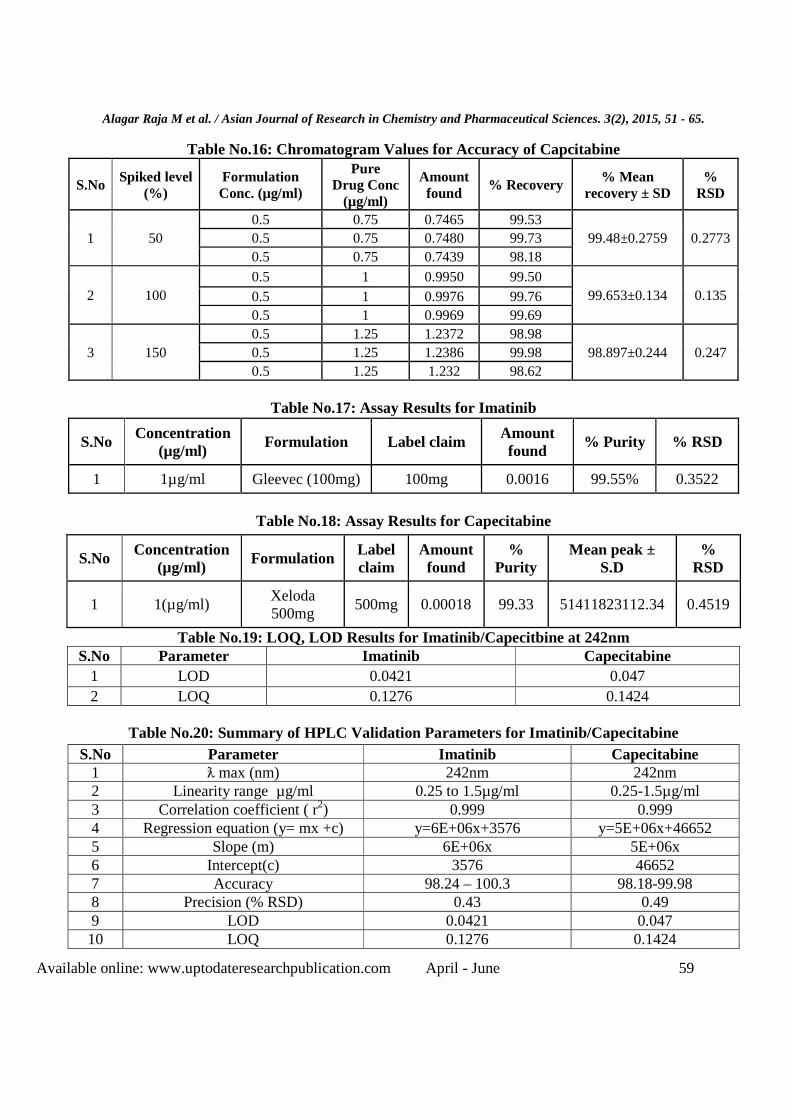
detection wavelength from 240 to 242nm.for Imatinib. The results shown in Table Nos.11, 12, 13 and14. Accuracy studies of Imatinib/Capecitabine Accuracy is the closeness of the results obtained by the method to the true value. Recovery studies were carried out at 50%, 100% and 150% by adding known amount of standard drug solution of imatinib / capecitabine i.e. (0.75, 1, 1.25µg/ml), to the sample solution whose concentration is maintained constant for Imatinib/Capecitabine i.e. 0.5µg/ml. The %recovery was calculated. The results for accuracy indicate that the % recovery values are in the range of 98.24-100.3 for Imatinib. The results shown in table no.15 and 98.18- 99.98 for Capecitabine. The results shown in table no.16: which indicate that the method is accurate as it meets the necessary criteria. Application to pharmaceutical dosage form of Imatinib/Capecitabine Assay studies were carried out by taking twenty tablets of Imatinib/Capecitabine formulation which were weighed and powdered. The powder equivalent to 10mg was taken and the solution equivalent to 1000µg/ml and was used for further estimation and the results are shown in Table No.19. The results show that the % purity was found to be 99.55% for Imatinib. The results shown in table and 99.33%for Capecitabine. The results shown in Table No.20 hence meets the necessary criteria. Limit of detection (LOD) and Limit of quantification (LOQ) of Imatinib/Capecitabine The LOD and LOQ were calculated by using the slope and SD of response (intercept). The mean slope value and the SD of response were obtained from the calibration curve and LOD and LOQ were shown in Table No.20.
Alagar Raja M et al. / Asian Journal of Research in Chemistry and Pharmaceutical Sciences. 3(2), 2015, 51 - 65.
Available online: www.uptodateresearchpublication.com April - June 56
Table No.1: Linearity results for Imatinib at 242nm
Table No.2: Linearity results for Capecitabine S.No Linearity Level Concentration(µg/ml) Area
1 I 0.25 1367088 2 II 0.50 2641638 3 III 0.75 3829585 4 IV 1.0 5148424 5 V 1.25 6387895 6 VI 1.5 7830709
Correlation Coefficient 0.999
Table No.3: Repeatability Results for of Imatinib
S.No Conc.(µg/ml) Absorbance (242nm) Area mean± S.D(n=6) % RSD
1 1 6249423
61984942± 6810.4
0.43
2 1 6249423
3 1 6249423
4 1 6249423
5 1 6249423
Table No.4: Repeatability Results for Capecitabine
S.No Linearity Level Concentration(µg/ml) Area 1 I 0.25 1711603 2 II 0.5 3243280 3 III 0.75 4773302 4 IV 1.00 6144426 5 V 1.25 7552279 6 VI 1.5 8916832
Correlation Coefficient 0.999
S.No Concentration(µg/ml) Absorbance (242nm) Area mean± S.D (n=6) % RSD
1 1 5147832
5169153±25816.7
0.49
2 1 5147832
3 1 5147832
4 1 5147832
5 1 5147832
6 1 5147832
Alagar Raja M et al. / Asian Journal of Research in Chemistry and Pharmaceutical Sciences. 3(2), 2015, 51 - 65.
Available online: www.uptodateresearchpublication.com April - June 57
Table No.5: Intermediate Precision Intraday Results for Imatinib Concentration (µg/ml) Injection No Peak Area Rt
1
1 6243294 1.077 2 6243294 1.065 3 6243294 1.074
Mean 6209408 SD 35056.4
% RSD 0.56
Table No.6: Intermediate Precision Intraday Results for Capecitabine
Table No.7: Interday Results for Imatinib
Concentration (µg/ml) Injection No Peak Area Rt
1
1 6177323 1.077 2 6177323 1.007 3 6177323 1.074
Mean 6206826 SD 34475.2
% RSD 0.55
Table No.8: Interday Results for Capecitabine
Table No.9: System Suitability Values for Imatinib
S.No Rt Peak Area USP Plate count Asymmetric factor 1 1.007 6241234 2645 1.1 2 1.007 3210865 2754 1.5 3 1.007 6198632 2663 1.6
Tailing factor Obtained from the standard injection is 1.7 Theoretical Plates Obtained from the standard injection is 2496
Concentration (µg/ml) Injection No Peak Area Rt
4
1 5144782 1.775
2 5144782 1.610 3 5144782 1.810
Mean 5151041 SD 20905.4
% RSD 0.40
Concentration (µg/ml) Injection No Peak Area R t
1
1 5133783 1.775 2 5133783 1.677 3 5133783 1.810
Mean 5146409 SD 11313.1
% RSD 0.21
Alagar Raja M et al. / Asian Journal of Research in Chemistry and Pharmaceutical Sciences. 3(2), 2015, 51 - 65.
Available online: www.uptodateresearchpublication.com April - June 58
Table No.10: System Suitability Values for Capecitabine
Tailing factor Obtained from the standard injection is 1.51 Theoretical Plates Obtained from the standard injection is 4137
Table No.11: Robustness Results for Imatinib (flow rate)
Table No.12: Robustness Results for Imatinib (Wavelength)
Table No.13: Robustness Results for Capecitabine (flow rate)
Table No.14: Robustness Results for Capcitabine (Wavelength)
Table No.15: Values for Accuracy of Imatinib
S.No Spiked Level (%)
Formulation Conc. (µg/ml)
Pure Drug Conc
(µg/ml)
Amount found
% Recovery
% Mean recovery ±SD
% RSD
1 50 0.5 0.75 0.74876 99.83
99.08±0.797 0.8043 0.5 0.75 0.74386 99.18 0.5 0.75 0.73686 98.24
2 100 0.5 1 0.99473 99.47
99.470±0.567 0.5701 0.5 1 1.0003 100.03 0.5 1 0.98014 98.90
3 150 0.5 1.25 1.24677 99.74
99.597±0.267 0.2684 0.5 1.25 1.24701 99.76 0.5 1.25 1.24110 99.28
S.No Rt Peak Area USP Plate count Asymmetric factor 1 1.677 5134732 4012 1.5 2 1.677 5118491 4025 1.2 3 1.677 5089132 4137 1.5
S.No Flow Rate R t Area Height Plate count Tailing 1 Less Flow 1.401 421480 45332 2741.1 1.71 2 More Flow 1.007 343858 43270 2543.2 1.58
S.No Wavelength Rt Area Height Plate count Tailing 1 244 nm 1.007 6597945 39645 2980.4 1.60 2 240 nm 1.010 6597790 48101 2423.5 1.64
S.No Flow Rate Rt Area Height Plate count Tailing Resolution 1 Less Flow 2.253 2558248 234950 4162 1.57 4.53 2 More flow 1.680 2084296 225397 3921.4 1.48 4.43
S.No Wavelength Rt Area Height Plate count Tailing 1 244 nm 1.693 4026730 211957 4457.1 1.44 2 240 nm 1.693 4270708 245935 3712.3 1.56
Alagar Raja M et al. / Asian Journal of Research in Chemistry and Pharmaceutical Sciences. 3(2), 2015, 51 - 65.
Available online: www.uptodateresearchpublication.com April - June 59
Table No.16: Chromatogram Values for Accuracy of Capcitabine
S.No Spiked level (%)
Formulation Conc. (µg/ml)
Pure Drug Conc
(µg/ml)
Amount found
% Recovery % Mean recovery ± SD
% RSD
1 50 0.5 0.75 0.7465 99.53
99.48±0.2759 0.2773 0.5 0.75 0.7480 99.73 0.5 0.75 0.7439 98.18
2 100 0.5 1 0.9950 99.50
99.653±0.134 0.135 0.5 1 0.9976 99.76 0.5 1 0.9969 99.69
3 150 0.5 1.25 1.2372 98.98
98.897±0.244 0.247 0.5 1.25 1.2386 99.98 0.5 1.25 1.232 98.62
Table No.17: Assay Results for Imatinib
Table No.18: Assay Results for Capecitabine
Table No.19: LOQ, LOD Results for Imatinib/Capecitbine at 242nm S.No Parameter Imatinib Capecitabine
1 LOD 0.0421 0.047 2 LOQ 0.1276 0.1424
Table No.20: Summary of HPLC Validation Parameters for Imatinib/Capecitabine
S.No Concentration (µg/ml)
Formulation Label claim Amount found
% Purity % RSD
1 1µg/ml Gleevec (100mg) 100mg 0.0016 99.55% 0.3522
S.No Concentration (µg/ml)
Formulation Label claim
Amount found
% Purity
Mean peak ± S.D
% RSD
1 1(µg/ml) Xeloda 500mg
500mg 0.00018 99.33 51411823112.34 0.4519
S.No Parameter Imatinib Capecitabine 1 ƛ max (nm) 242nm 242nm 2 Linearity range µg/ml 0.25 to 1.5µg/ml 0.25-1.5µg/ml 3 Correlation coefficient ( r2) 0.999 0.999 4 Regression equation (y= mx +c) y=6E+06x+3576 y=5E+06x+46652 5 Slope (m) 6E+06x 5E+06x 6 Intercept(c) 3576 46652 7 Accuracy 98.24 – 100.3 98.18-99.98 8 Precision (% RSD) 0.43 0.49 9 LOD 0.0421 0.047 10 LOQ 0.1276 0.1424
Alagar Raja M et al. / Asian Journal of Research in Chemistry and Pharmaceutical Sciences. 3(2), 2015, 51 - 65.
Available online: www.uptodateresearchpublication.com April - June 60
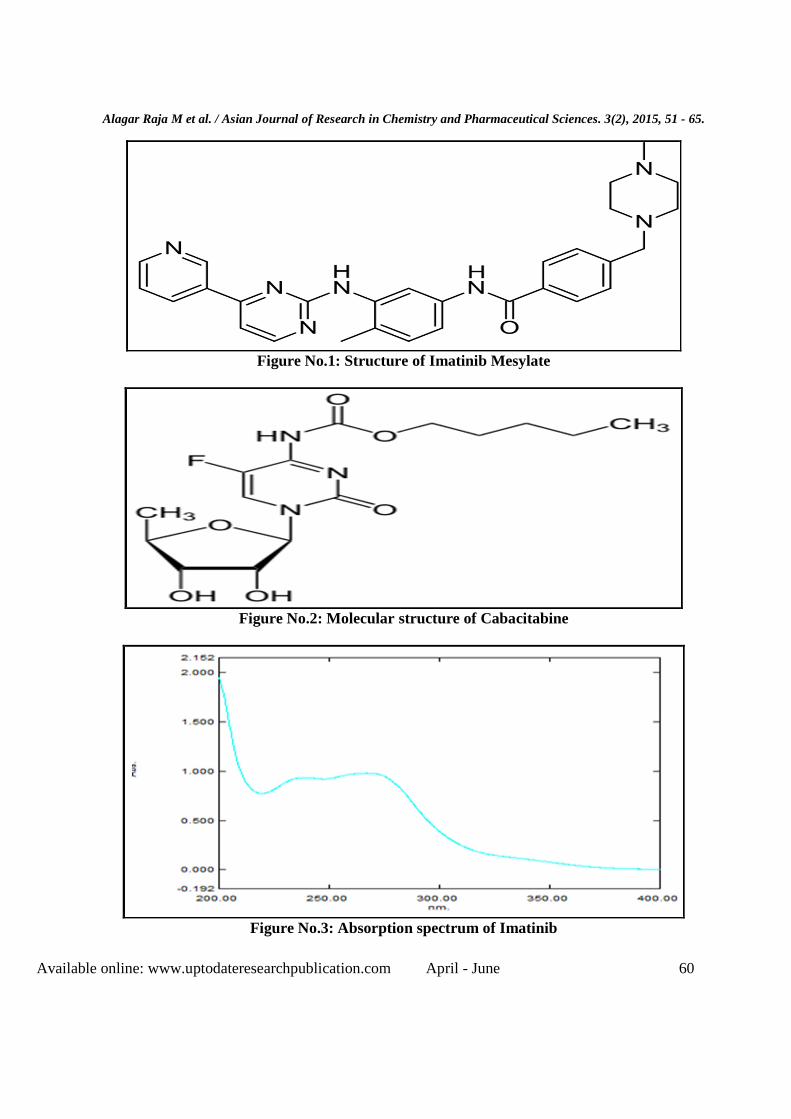
Figure No.1: Structure of Imatinib Mesylate
Figure No.2: Molecular structure of Cabacitabine
Figure No.3: Absorption spectrum of Imatinib
Alagar Raja M et al. / Asian Journal of Research in Chemistry and Pharmaceutical Sciences. 3(2), 2015, 51 - 65.
Available online: www.uptodateresearchpublication.com April - June 61
Figure No.4: Absorption spectrum of Cabacitabine
Figure No.5: Calibration Curve for Imatinib at 242nm
Figure No.6: Calibration Curve for Capecitabine at 242nm
y = 6E+06x + 153140
R² = 0.9991
0
1000000
2000000
3000000
4000000
5000000
6000000
7000000
8000000
9000000
10000000
0 0.2 0.4 0.6 0.8 1 1.2 1.4 1.6
pe
ak
are
a)
y = 5E+06x + 4667.6
R² = 0.999
0
1000000
2000000
3000000
4000000
5000000
6000000
7000000
8000000
9000000
0 0.2 0.4 0.6 0.8 1 1.2 1.4 1.6
pe
ak
are
a
concentration(µg/ml)
Alagar Raja M et al. / Asian Journal of Research in Chemistry and Pharmaceutical Sciences. 3(2), 2015, 51 - 65.
Available online: www.uptodateresearchpublication.com April - June 62
Figure No.7: Chromatogram of Specificity
Figure No.8: Chromatogram of Imatinib
Figure No.9: Chromatogram of Capecitabine
Alagar Raja M et al. / Asian Journal of Research in Chemistry and Pharmaceutical Sciences. 3(2), 2015, 51 - 65.
Available online: www.uptodateresearchpublication.com April - June 63
CONCLUSION High performance liquid chromatography at present one of the most sophisticated tool of the analysis. The estimation of Imatinib myselate and Capcitabine was done by RP-HPLC Method. The mobile phase was optimized with consists of Acetonitrile. Water mixed in the ratio of 50:50 % v/ v. A C18 column C18 (4.6 x 150mm, 5µm, Make: XTerra) or equivalent chemically bonded to porous silica particles was used as stationary phase. The solutions were chromatographed at a constant flow rate of 1.0 ml/min. the linearity range of Imatinib myselate and Capcitabine were found to be from 25-125 µg/ml of Imatinib myselate and Capcitabine. Linear regression coefficient was not more than 0.999.The maximum absorbance is found to be at 242 nm. The values of % RSD are less than 2% indicating accuracy and precision of the method. The percentage recovery varies from 97-102% of Imatinib myselate and Capcitabine. LOD and LOQ were found to be within limit. The results obtained on the validation parameters met ICH and USP requirements. It inferred the method found to be simple, accurate, precise and linear. The method was found to be having suitable application in routine laboratory analysis with high degree of accuracy and precision. ACKNOWLEDGMENT I express my deep thanks and gratitude to my respectable, beloved guide, our principal, Vice-principal, Matrix Lab, Bangalore and my Parents and friends for providing all the encouragement and facilities to complete my research work successively. CONFLICT OF INTEREST We decleare that we have no conflict of interest. BIBLIOGRAPHY
1. Martindale. The complete drug reference, Pharmaceutical press, Lambeth High Street, London, 36th edition, 2009, 773-774.
2. Widmer N et al. Determination of imatinib (Gleevec®) in human plasma by solid-phase extraction - liquid chromatography - ultraviolet absorbance detection, J. Chromatogr B., 803(2), 2004, 285-292.
3. Thirumurthy et al. Development and validation of a simple liquid chromatographic method with ultraviolet detection for the determination of imatinib in biological samples, J. of Chromatography B, 804(3), 2004, 431-434.
4. Vivekananda et al. A validated LC method for imatinib mesylate, Journal of pharmaceutical and biomedical analysis, 333(5), 2000, 879-889.
5. Ivanovic D, Medenica M, Jancic B and Malenovic. Reversed-phase liquid chromatography analysis of imatinib mesylate and impurity product in Glive capsules, J. chromatography B, 800(1-2), 2004, 253-258.
6. Roos L O, Jos H B, Jan H M, Olaf van T. Determination of imatinib mesylate and its main metabolite (CGP74588) in human plasma and murine specimens by ion-pairing reversed phase high-performance liquid chromatography, Biomedical chromatography, 21(7), 2007, 747-754.
7. Solassol F, Bressolle L, Philibert V, Charasson C, Astre F. Liquid Chromatography- Electrospray Mass Spectrometry Determination of Imatinib and Its Main Metabolite, N-Desmethyl- Imatinib in Human Plasma, J. liquid chromatography and related technologies, 29(20), 2006, 2957-2974.
8. Rosasco J et al. Validation of an HPLC Method for the Determination of Imatinib Mesylate in Pharmaceutical Dosage forms, Liquid chromatography and related technologies, 28(20), 2005, 3283-3292.
9. Satyanarayana et al. Development and Validation of New Reversed Phase High Performance Liquid Chromatography Method for the Estimation of Imatinib in Bulk and Pharmaceutical Dosage Forms, International Journal of Research in Pharmaceutical and Biomedical Sciences, 1(1), 2010, 6-9.
10. Bende G, Kollipara S, Kolachina V, Saha R. UV-spectrophotometric determination of Imatinib mesylate and its application in solubility studies, Chromatographia, 66(7), 2007, 859-866.
Alagar Raja M et al. / Asian Journal of Research in Chemistry and Pharmaceutical Sciences. 3(2), 2015, 51 - 65.
Available online: www.uptodateresearchpublication.com April - June 64
11. Arun Kumar Kuna, Jagadeesh Kumar Kuna. RP-HPLC method development and validation of imatinib mesylate in tablet dosage form, Int J Pharm Pharm Sci, 3(15), 2011, 162-165.
12. Bende G, Kollipara S, Sekar V and Saha R. UV-spectrophotometric determination of imatinib mesylate and its application in solubility studies, Die pharmazie, 63(9), 2008, 641-645.
13. International conference on the harmonization of technical requirements for the registration of pharmaceuticals for human use (ICH) Q2 (R1), Validation of Analytical Procedures, Geneva, 2005.
14. Malet-Martiono M, Martino R. Clinical studies of three oral prodrugs of 5-fluorouracil (capecitabine, UFT, S-1): a review, Oncologist, 7(4), 2002, 288-323.
15. Desmoulin F, Gilard V, Malet-Martino M, Martino R. Metabolism of capecitabine, an oral fluorouracil prodrug: (19)F NMR studies in animal models and human urine, Drug Metab, Dispos, 30(11), 2002, 1221-9.
16. Judson I R, Beale P J, Trigo J M, Aherne W, Crompton T, Jones D, Bush E, Reigner B. A human capecitabine excretion balance and pharmacokinetic study after administration of a single oral dose of 14C-labelled drug, Invest. New Drugs, 17(1), 1999, 49-56.
17. Braun A H, Achterrath W, Wilke H, Vanhoefer U, Harstrick A, Preusser P. New systemic frontline treatment for metastatic colorectal carcinoma, Cancer, 100(8), 2004, 1558-77.
18. Mader M R, Uller M, Steger G G. Resistance to 5-fluorouracil, Gen Pharmacol, 31(5), 1998, 661 - 666.
19. Moriwaki T, Hyodo I, Nishina T, Hirao K, Tsuzuki T, Hidaka S, Kajiwara T, Endo S, Nasu J, Hirasaki S, Masumoto T, Kurita A. A phase I study of doxifluridine combined with weekly paclitaxel for metastatic gastric cancer, Cancer Chemother, Pharmacol, 56(1), 2005, 138 - 145.
20. Ohta Y, Sueki K, Ketta K, Takemoto K, Ishitsuka H, Yagi Y. Comparative studies on
the immunosuppressive effect among 5'-deoxy-5-fluorouridine, ftorafur, and 5-fluorouracil, Gann, 71(1), 1980, 190.
21. Ninomiya Y, Miwa M, Eda H, Sahara H, Fujimoto K, Ishida M, Umeda I, Yokose K, Ishitsuku H. Comparative antitumor activity and intestinal toxicity of 5'-deoxy-5-fluorouridine and its prodrug trimethoxybenzoyl-5'-deoxy-5-fluorocytidine, J. Cancer Res, 81(5), 1990, 188 -189.
22. Tabata T, Katoh M, Tokudome S, Hosakawa M, Chiba K, Nakajima M, Yokoi T. Bioactivation of capecitabine in human liver: involvement of the cytosolic enzyme on 5′-deoxy-5-fluorocytidine formation, Drug Metab, Dispos, 32(2), 2004, 762 -764.
23. Ishikawa T, Sekiguchi F, Yu F, Sawada N, Ishitsuka H. Positive correlation between the efficacy of capecitabine and doxifluridine and the ratio of thymidine phosphorylase to dihydropyrimidine dehydrogenase activities in tumors in human cancer xenografts, Cancer Res, 58(4), 1998, 685-90.
24. Compagnon P, Thiberville L, Moore N, Thuillez C, Lacroix C. Simple high-performance liquid chromatographic method for the quantitation of 5-fluorouracil in human plasma, J Chromatogr. B., 677(2), 1996, 380-3
25. Gamelin E, Boisdron-Celle M, Turcant A, Larra F, Allain P. Rapid and sensitive high-performance liquid chromatographic analysis of halogenopyrimidines in plasma, Robert J. Chromatogr B, 695(2), 1997, 409-416.
26. Wung W E, Howell S B. Simultaneous liquid chromatography of 5-fluorouracil, uridine, hypoxanthine, xanthine, uric acid, allopurinol, and oxipurinol in plasma, Clin. Chem, 26(2), 1980, 1708-1710.
27. Buckpitt A R, Boyd M R. A sensitive method for determination of 5-fluorouracil and 5-fluoro-2'-deoxyuridine in human plasma by high-pressure liquid chromatography, Anal, Biochem, 106(2), 1980, 432-437.
28. La Creta F P, Williams W M. Pancreas divisum: incidence, detection, and clinical
Alagar Raja M et al. / Asian Journal of Research in Chemistry and Pharmaceutical Sciences. 3(2), 2015, 51 - 65.
Available online: www.uptodateresearchpublication.com April - June 65
significance, Chromatogr J, 82(4), 1987, 315-320.
29. Wattanatorn W, McLeod H L. Cassidy J, Kendle K E. A review of analytical methods for the determination of 5- fluorouracil in biological matrices, Chromatogr J B, 69(2), 1997, 237- 246.
30. Del Nozal M J, Bernal J L, Pampliega A, Marinero P, Pozuelo M. Determination of the concentrations of 5-fluorouracil and its metabolites in rabbit plasma and tissues by high-performance liquid chromatography, Chromatogr J., 656(2), 1994, 397 - 405.
Please cite this article in press as: Alagar Raja. M et al. Analytical Method Development and Validation of Anticancer Drugs (Imatinib and Cabacitabine) By RP-HPLC Method, Asian Journal of Research in Chemistry and Pharmaceutical Sciences, 3(2), 2015, 51 - 65.