Analytical and Experimental Investigations of Crippling...
14
1 Abstract This paper deals with the postbuckling behaviour of thin-walled structures, modelled using a system of interacting plates. The main objective of the paper is the crippling of short multiplate rods and panels, i.e. their load-carrying capacity under compression after local buckling. The analysis of semi-empirical methods of analysing crippling has been performed. A test machine of high accuracy for measuring has been created and a number of new experimental results confirming and correcting these methods have been obtained. Comparison of the experimental results with the results obtained by the means of a finite element analysis taking into account postbuckling and plastic deformations have been completed. Keywords: crippling, postbuckling, numerical, experimental, rods, panels. 1 Introduction Thin-walled rods (or columns, such as structural shapes) are widely utilized in constructions and known to buckle locally while not reaching their load-carrying capability limits: the interacting plates (such as flanges and webs) may during postbuckling deformation take the increasing load until the yield limit is attained and the rod buckles as a whole. The postbuckling deformation is termed crippling; the corresponding destructing force P K and the mean compression stress F P K K = σ (where F is the cross-sectional area) are the crippling limit force and the crippling limit stress, respectively. The major contribution to studies on shape/panel crippling was made by US researchers Needham [1] and Gerard [2]; their primary tools were experiments and engineering analysis equations. Many materials and cross-sectional shapes were evaluated, taking into account manufacturing processes. Most studies were focused on the typical roll-formed or extruded angles out of aluminum alloys. It was Paper 168 Analytical and Experimental Investigations of Crippling in Multiplate Rods and Panels G. Zamula and I. Kondakov Central Aerohydrodynamic Institute (TsAGI) Zhukovsky, Moscow Region, Russia ©Civil-Comp Press, 2012 Proceedings of the Eleventh International Conference on Computational Structures Technology, B.H.V. Topping, (Editor), Civil-Comp Press, Stirlingshire, Scotland
Transcript of Analytical and Experimental Investigations of Crippling...

1
Abstract This paper deals with the postbuckling behaviour of thin-walled structures, modelled using a system of interacting plates. The main objective of the paper is the crippling of short multiplate rods and panels, i.e. their load-carrying capacity under compression after local buckling.
The analysis of semi-empirical methods of analysing crippling has been performed. A test machine of high accuracy for measuring has been created and a number of new experimental results confirming and correcting these methods have been obtained. Comparison of the experimental results with the results obtained by the means of a finite element analysis taking into account postbuckling and plastic deformations have been completed. Keywords: crippling, postbuckling, numerical, experimental, rods, panels. 1 Introduction Thin-walled rods (or columns, such as structural shapes) are widely utilized in constructions and known to buckle locally while not reaching their load-carrying capability limits: the interacting plates (such as flanges and webs) may during postbuckling deformation take the increasing load until the yield limit is attained and the rod buckles as a whole. The postbuckling deformation is termed crippling; the corresponding destructing force PK and the mean compression stress
FPKK =σ (where F is the cross-sectional area) are the crippling limit force and the crippling limit stress, respectively. The major contribution to studies on shape/panel crippling was made by US researchers Needham [1] and Gerard [2]; their primary tools were experiments and engineering analysis equations. Many materials and cross-sectional shapes were evaluated, taking into account manufacturing processes. Most studies were focused on the typical roll-formed or extruded angles out of aluminum alloys. It was
Paper 168 Analytical and Experimental Investigations of Crippling in Multiplate Rods and Panels G. Zamula and I. Kondakov Central Aerohydrodynamic Institute (TsAGI) Zhukovsky, Moscow Region, Russia
©Civil-Comp Press, 2012 Proceedings of the Eleventh International Conference on Computational Structures Technology, B.H.V. Topping, (Editor), Civil-Comp Press, Stirlingshire, Scotland

2
established that the crippling problem is certainly important for rods with a relatively low slenderness ratio cil=λ (where l, i, and с are the length, radius of gyration, and fixture coefficient, respectively); the crippling limit stress at low λ values does not almost depend on the slenderness ratio, so we usually assume λ=20. It is the value corresponding to short rods that is currently regarded as Kσ . Some examples of appearance of short columns upon destruction in crippling can be seen in Figure 1. The results are incorporated in structural strength standards of the USA; the crippling analysis (and testing, because of poor accuracy of analyses) has been mandatory for aircraft manufacturing companies (refer to [3, 4]).
Figure 1. Typical appearance of compression-loaded thin- walled structural
shapes during crippling failure The state-of-the-art airplanes feature high stresses and low slenderness ratio of compressed stiffened rods/panels; therefore, crippling becomes essential, and Kσ is as important as elσ and 2.0σ when deriving dependence of limit stresses on the slenderness ratio and other parameters of panels and shapes. Crippling problem is actual for panels composed of stiffened (ribbed) plates including combined loaded panels and panels from new metallic and composite materials, as well. Thus, the crippling problem is acute; note that today's numerical methods for solving the geometrically and physically nonlinear problems support further advance in this area. The present article deals with the crippling/postbuckling behavior of aircraft structures; the primary objective is to analyze and compare the existing simplified methods, consider new experimental data and improve finite-element analysis of crippling of compression-loaded shapes. 2 Comparison of engineering analysis approaches The most popular are the semi-empirical crippling analysis relations derived by Needham in [1] and by Gerard in [2]. The first approach considers any shape as a set of angles with various boundary conditions for two longitudinal edges, and the

3
principal equation for the angle is
n
e2.0
K bCE
⎟⎠⎞
⎜⎝⎛δ′
=σ
σ , (1)
where n=0.75 and Ce are empirical coefficients obtained from comprehensive experiments. For roll- formed aluminum angles the Ce value is 0.316 for the case of two free edges (Figure 2, a), 0.342 for single free edge (Figure 2, b), and 0.366 for a shape with no free edges (Figure 2, c). The value of b′ is specified as shown in Figure 2; in the case of an unequal angle one would use the mean width of the legs.
Experiments were conducted at λ=20, c=1, ≈δR 3; equation (1) is valid if 10b ≥δ′ and 2.0K 8.0 σ≤σ . Limit forces PKi for the component angles are obtained by multiplying the stress (1) by the actual cross-sectional areas iF and the crippling force is computed by summation: ∑ ⋅σ=
iiKiK FP ; the mean ultimate stress is,
FPKK =σ , where ∑=i
iFF .
Gerard in [2] used more comprehensive investigations and Needham’s results to propose the generalized relation for all types of extruded , milled and roll-formed shapes (except two-angle such as Z and channel):
mg
2.0
K xy β=σσ
= (where 2
12.0
2 EgFx ⎟
⎠
⎞⎜⎝
⎛ σ⎟⎟⎠
⎞⎜⎜⎝
⎛
δ= ), (2)
gβ and т are empirical coefficients depending on section configuration and
a) angle b) channel
c) tube d) plate
Figure 2. Cross sections of objects

4
manufacturing process; g is the integer governed by the manner of subdividing the section into legs (e.g., g=2 for the angle, g= 12 for a square-section tube, and g= 3 for a general rectangular plate). For extruded shapes with unloaded longitudinal edges deformable in plane (such as the angle and tube) it is recommended that m=0.85 and gβ =0.56; m = 0.85, gβ = 0.66 for similar roll-formed shapes; and m = 0.4 and gβ = 0.65 for extruded rods whose unloaded attachment edges do not deform in plane (such as T, H, and cross). As for λ , δb , and 2.0K σσ the relation (2) features the same limitations as the ones for equation (1). Note that the latter limitation is really equivalent to the assumption of the shape buckling locally at elastic stresses. Contributions [2, 3] propose that when 2.0K σσ > 0.8 we should either use crK σσ = (where crσ is the critical stress of local buckling) or undertake extra testing; this is a noticeable disadvantage of the method. Test data differ from results of (1) and (2) by %105 ÷± Let us compare these methods with current achievements and the traditional approach to estimating the load-bearing capability of shapes upon local buckling on the basis of reduction coefficients (RC) 0σσϕ RC= (and Karman formula
0σσϕ RC= ) for buckled plates. The methods are assumed to cover the entire shape, as in [5]:
0σσσσ crRCK == , ϕσ=σ= FFP 0KK , (3) Here, the limit stress is the lower value amongst 2.0ξσ and ..genercrσ and ξ = 1.1 and 1.2 for roll-formed and extruded shapes, respectively. The critical stress is calculated by using the versatile expression
2
⎟⎠⎞
⎜⎝⎛=δ
ησ μbEKcr ( где
)1(12KK
2
2
μ−
π=μ ), (4)
where K, the stability coefficient; EEK=η the plasticity coefficient; Et, the tangential elasticity modulus (note that 1=η for the case of elastic deformation); at
3.0=μ we have K9.0K =μ , i.e., for a prolonged plate with two simply supported edges we obtain K= 4 and μK = 3.6, and for the case with one edge simply supported and the other edge free, we have K =0.425 and μK = 0.383. Substitution of (4) into (3) at 2.00 σ⋅ξ=σ does immediately provide for the RC method the expression comparable with the relation (1):
⎟⎠⎞
⎜⎝⎛δ
η=σ
σ bCE
4
2.0
K (where μ⋅ξ= KC , n = 1 ), (5)
note that at elcr σσ ≤ we adopt 1=η , and 1.1=ξ for roll-formed shapes; and for the two aforementioned plates we get С = C2 = 2 and C = C1 =0.65, respectively. Clearly, these particular situations completely correspond to local buckling of equal legs in a tube and an angle (refer to Figure 2). Given the same conditions equations (5) may be rewritten as (2) by Gerard for an angle (with δ= b2F ),

5
xCy 14
2.0
K η=σσ
= (where 2
1
2.0 ⎟⎠⎞
⎜⎝⎛=
Ebx σδ
) (6)
and for a tube,
x3Cy 24
2.0
K η=σσ
= (where 2
12.0
E3bx ⎟
⎠
⎞⎜⎝
⎛ σδ
= ) (7)
with the exponent m= 1; note that in the case of extruded shapes the С values should be multiplied by 044.11.12.1 = . Taking into account that 12 C3C ≅ , it is evident that (6) coincides with (7); these, at 1=η , are represented in Figure 3 (with log-log coordinates) by dashed straight lines. Solid lines in the same Figure are from
Gerard's formula (2) for extruded shapes (see the lower straight line) and roll-formed shapes (the upper straight line). And the dash-dot line is generated by Needham's formula (1) transformed to (2) for a roll-formed angle (m=n=0.75,
( ) 81
2.0eg EC σ=β , Ce =0.316); in this case, the tube features m=0.75,
( ) ( ) 81
2.075.0
eg E32C σ=β , 366.0Ce = at 250/E 2.0 =σ .
These equations and Figure 3 may be compared to conclude the following. 1. The experimental data represented in [2] demonstrate an 18% excess of the crippling limit stress for roll-formed shapes over that for extruded shapes, whereas the RC method reveals an opposite result. The cause of the excess is discussed in [1, 2]: roll-formed shapes are strengthened at their corners. When using the RC method, the ξ coefficient for extruded shapes should not be greater than 1 - that is, we have
Figure 3. Crippling limit stresses for angle,
○, ● - test data for moulded rods
2500632.02.0
21
2.02 =⎟
⎠⎞
⎜⎝⎛≈⎟
⎠⎞
⎜⎝⎛⋅⎟⎟
⎠
⎞⎜⎜⎝
⎛=
σδσ
δEприb
EgFxAngle for

6
to assume 2.00 σ≤σ . 2. The experimental data representation concept adopted by Gerard and the expressions (6) and (7) - with x and у variables - are better than Needham's dependence, because these are more general; in particular, relations (2) have been validated for various materials (with a wide range of 2.0E σ ). 3. The RC method overestimates the exponent m for (2), (6), and (7): m=1 whereas tests give 85.04.0m ÷= . Evidently, the primary cause is that applying Karman formula to the shape as a whole is not a correct operation, whereas the formula is conservative for supported plate; refer to [5, 6]. For analysis of two-angle shapes the work [2] recommends equation (2) to be used upon replacing x with . ( )( ) 3
12.0
2 EFx σδ=′ and gβ with β ; test data suggest m=0.75 and β =3.2 and 3.8 for milled and roll-formed shapes, respectively. Needham equation (1) is reduced to the same appearance by assuming that
m = n=0.75, 4
12.0
e E8C ⎟
⎠
⎞⎜⎝
⎛ σ=β , 2ba
b2b4F=
δ=δ′= , (8)
in the case of Ce = 0.342 and 250E 2.0 =σ the relation produces
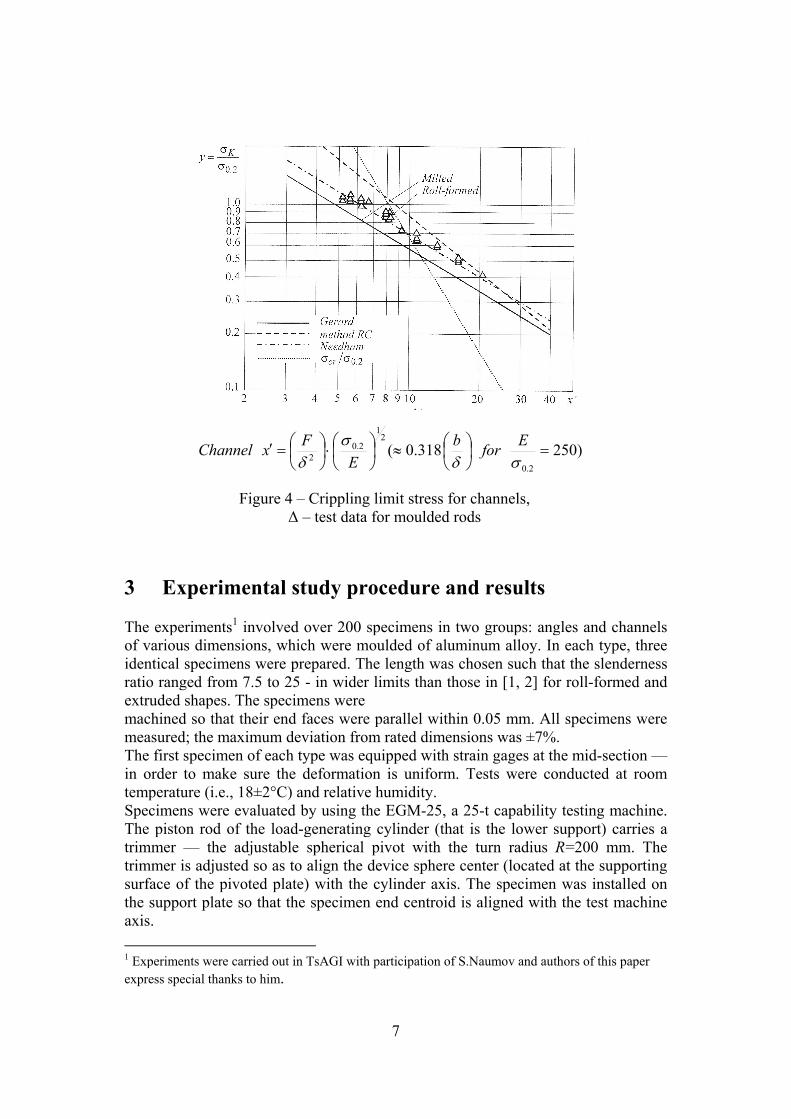
( ) ( )δ=δ′≈′ b318.0b636.0x (at a=b/2) and 85.3=β . This means that the methods and their fundamental constants almost coincide for aluminum roll-formed shapes. These functions are depicted in Figure 4 (with log-log coordinates) for roll-formed and milled channels. Also, the situation with a=b/2 (Figure 2, b), 250E 2.0 =σ ,
1=η and a roll-formed shape is represented in the Figure upon computation by the RC method with transformation to the concept (5) - (7):
⎟⎠⎞
⎜⎝⎛δ
=σσ bC
E2.0
K , 2
12.0
2.0
KE
bC ⎟⎠
⎞⎜⎝
⎛ σ⎟⎠⎞
⎜⎝⎛δ
=σσ (where μ⋅ξ= KC ), (9)
here we assume а=b/2, 1.1=ξ , К = 2.9 , 61.2=μK , C = C3 = 1.69 , and b = 2b'. It is seen that the RC method does also notably overestimates both the exponent m and crippling limit stress. Dotted lines in Figure 3 and 4 compare calculation of local buckling stress
2.0σσ cr by (4) for the same shapes at 1=η . One can see that for thin-walled shapes the ratio crK σσ may be significant, tending to 1 only when the ratio b/δ decreases to 10÷11 for an angle or to 29÷30 for a roll-formed channel; in these cases the local buckling takes place at plastic stresses, so the crippling limit stress is almost equal to the local buckling stress. Thus, the method by Gerard in [2] is the best validated by experiments and may be used for practice. The common disadvantage of the semi-empirical approaches is the necessity to conduct additional experimental studies for the stress range
2.0σσ K >0.8 and for introducing new designer solutions; as well, the methods are difficult to extrapolate to cover the composite shapes, non-uniform heating, multiaxial loading, etc.
7
Figure 4 – Crippling limit stress for channels,
Δ – test data for moulded rods
3 Experimental study procedure and results The experiments1 involved over 200 specimens in two groups: angles and channels of various dimensions, which were moulded of aluminum alloy. In each type, three identical specimens were prepared. The length was chosen such that the slenderness ratio ranged from 7.5 to 25 - in wider limits than those in [1, 2] for roll-formed and extruded shapes. The specimens were machined so that their end faces were parallel within 0.05 mm. All specimens were measured; the maximum deviation from rated dimensions was ±7%. The first specimen of each type was equipped with strain gages at the mid-section — in order to make sure the deformation is uniform. Tests were conducted at room temperature (i.e., 18±2°C) and relative humidity. Specimens were evaluated by using the EGM-25, a 25-t capability testing machine. The piston rod of the load-generating cylinder (that is the lower support) carries a trimmer — the adjustable spherical pivot with the turn radius R=200 mm. The trimmer is adjusted so as to align the device sphere center (located at the supporting surface of the pivoted plate) with the cylinder axis. The specimen was installed on the support plate so that the specimen end centroid is aligned with the test machine axis. 1 Experiments were carried out in TsAGI with participation of S.Naumov and authors of this paper express special thanks to him.
)250318.0(2.0
21
2.02 =⎟
⎠⎞
⎜⎝⎛≈⎟
⎠⎞
⎜⎝⎛⋅⎟
⎠⎞
⎜⎝⎛=′
σδσ
δEforb
EFxChannel

8
Prior to destructive tests the first specimen of each type was used to verify load uniformity at specimen end faces. For this purpose the specimen was preloaded to 20% of the predicted limit load, and strain gage signals were taken. They were the basis for adjusting the trimmer so that the readings of the strain gages were equal within 10%. Upon the adjustment the plate was fixed with screws, the specimen was unloaded to almost zero force and then gradually loaded to failure (while keeping a constant rate of piston rod movement). Alignment of the other two specimens of each type was checked up visually; if a specimen featured a nonuniform contact with the supporting plates, then the trimmer was adjusted again. During loading, we simultaneously recorded forces, strains, and displacements by using a high- performance data acquisition system. The test data was the basis for computing the mean values (for the three specimens) of the ultimate stresses (σK) and stresses at the time instant of shape leg buckling (σM) for each type of specimens. The data scatter is less than 9% for angles and 5% for channels. Most experiments featured the prior local buckling of shape legs, followed by general failure. Some specimens with the slenderness ratio of 20 and 25 showed not only the local buckling but also the general buckling. Figure 5 demonstrates an example of the "load-strain" diagram for angles (at a midsection). The local buckling force is determined from the deformation diagrams -the minimum force at which the main lines deviates from a straight line. In Figure 3, all experimental data on crippling for angles are depicted with circles. One can see that most points are between Gerard straight lines and may be described by (2) with m=0.85 and gβ =0.61 (with error of ±10%) which was obtained in [2] and recommended for assessment by [3]. Note that this holds true for the specimens with 8.02.0 >σσ K (at low values of b/δ); this means that the limitations of [2, 3] for the maximum of Kσ values are not presented.
It should, however, be noticed that works [2, 3] processed crippling test data for specimens with the slenderness ratio λ=20, whereas our angles have the value 7.5≤ λ≤25. Nevertheless the experimental data clearly correlate with the slenderness ratio - they increase as the ratio decreases (due to the finite ratio l/b for shape legs) and get decreased when λ≥20 (due to the influence of the longitudinal bending of the column). Test points for angles with the slenderness ratio of 20 are outlined by full circles in Figure 3. One can see that these points are nearer the lower theoretical line than the set, and feature a narrower scatter. The method by Needham provides good results for the moulded angles only with low values of b/δ at 6.02.0 >σσ K .
A similar procedure was taken to process the test data on crippling of moulded channels. Results are represented in Figure 4. The experimental points for entire ranges of b/δ and 2.0σσ K compare well with the theoretical curve for roll-formed members. Note that the effect of the slenderness ratio on crippling limit stresses is insignificant in this case.

9
Figure 5. Example of measured dependence of mid-section strain on external force In order to identify the influence of even and non-uniform heating on load-carrying capacity of compressed multiplate columns a number of experimental tests of crippling on steel tubular specimens with different thicknesses δ = 1, 1.5, 2, 3 mm have been performed. The tests were carried out on specially developed test facility, that includes loading, measurement, heating and cooling systems, providing maximum temperature Тmах = 250оС on one pair of opposite sides of a specimen and Тmin = 50оС on the other pair of sides, so the temperature drop along the cross section could reach ΔТ = 200оС. Examples of specimens after destruction when normal temperature and when non-uniform heating is shown on Figure 6. The results of the investigation have shown that experimental data can be enough good described by the equation (2) where m = 0.67, βg = 0.54 and as for the tube, g = 12, F/(g δ2) = b/3 δ, where b is a half-sum of lengths of adjacent flanges of the cross-section. They can be presented with corresponding lines (Fig.3) where х = 0.0138b/ δ when the meaning of σ0.2(То)/Е(То) is a characteristic quantity for steel, and in the range 0.33≤ х≤1. Influence of non-uniform heating on ultimate crippling load reduces to taking into account dependencies σ0.2(Т), Е(Т) in (2), at the same time values of m, βg remain the same as in the case Т = То. At the maximum testing temperature T = 250оС this influence causes the reduction of critical stresses by ~15% and is approximately equal to the reduction of yield strength of the material. At the same time experimental data showed the reduction of load-carrying capacity within the range 9.1÷16.7% for specimens tested with non-uniform heating, that is close to the foregoing value. That means that the influence of temperature stresses on crippling is insignificant (though the potential level of temperature stresses in the structure EαΔT/2σ0.2 is rather high) and gives a possibility to perform analytical solution of crippling at α = 0 taking into account

10
Figure 6. Two specimens after destruction
only dependencies of mechanical properties of the material on the temperature at T = Tmax. The main explanation of this experimental fact is high level of plastic deformations at crippling.
According to recommendations [3],[4], semi-empirical methods can be used also for the analysis of crippling of short compressed monolith panels, modeled by a system of interacting plates. In this case either entire panel or a regular fragment of the panel formed by the skin with stiffening elements is investigated. A particular case is a plain non-stiffened skin (Figure 2,d), web in a form of a rectangular plate lean on straight ribs placed along the thickness zo. In this case the average ultimate stress of the plate is defined (the same as for the tube) by the equation (2) and Figure 3,
where δδ 32b
gF
= and at E/σ0.2 = 250, x = 0.021 δb . The boundary conditions for its
sides are simply supported sides and free non-loaded edges in the plane of the plate. However, for the same case, with a condition of straight non-loaded edges, and in the elastic zone of postbuckling deformation, a confident solution [6] is given and the results of this solution for σK/σ0.2 are higher and good harmonized with the experimental Gerard’s analytical-experimental data. The solution of the task can be used for verification and development of FEM methods of crippling analysis.
4 Some results of numerical analysis The method for finite-element analysis of local buckling and load-bearing capability of compressed structural shapes was improved by using simply supported and clamped plates and equal angles; the assumed conditions were close to those during real tests. The ratio l/b (thus, the slenderness ratio) was varied widely. To validate the approach to specifying boundary conditions, the first step was to determine buckling stresses of a compression-loaded elastic plate with one unstressed edge simply supported and with the other edge free; conditions at the

11
loaded edges were varied. To compare the numerical results with the analytical solutions, the plate should be loaded uniaxially. This had been ensured by leaving free the boundary node displacements in the transverse direction. The bifurcation analysis was conducted within the MSC/NASTRAN system. The various plates were subdivided into QUAD4 finite elements (while trying to attain equal sides of the rectangles and subdividing the plate width into five elements). The results almost coincide with the theoretical findings of [3, 5]. Note that boundary conditions at the loaded edges significantly affect stability of plates with l/b≤ 8 . Similar results were obtained from analysis of buckling of angles with the following boundary conditions (termed hereafter "standard boundary conditions", SBC): displacement of the loaded edges along the load vector is permitted, whereas rotation is prohibited. When undertaking nonlinear analysis, the strain-stress diagram )( εσ of the material was undimensionalized so that 250E 2.0 =σ , 75.02.0 =σσ el , ( 33.0=μ ), and approximated with a broken line. The geometry of angle №1 was as follows: b/δ = 13.4, l/b = 4.47 , λ≈10.8 at c=4, and λ≈21.6 at c = l. Results from the various methods for this object at the SBC are shown in Table 1:
Table 1
The first step was to analyze local stability on the basis of the bifurcation theory. The value σcr = 33.3 thus obtained differs by 1.5% from the value 32.8 provided by exact equation (4) at η= 1 and SBC. Thereafter, the angle clamped at its end faces was considered assuming the geometrical and physical nonlinearity and the actual σ(ε) diagram. Used was the variable parameter method in combination with Newton-Raphson algorithm (refer to [7]); the angle was assumed to be loaded in the step-by-step manner. Local buckling was obtained to take place at σcr = 32.1 To determine the load-bearing capability, the nonlinear analysis method using the assumed displacement basis was used; in our situation, this refers to mutual displacement of ends, Δl. The compression force is determined from reaction forces at loaded boundary nodes. This approach is suitable for comparison with real tests.
Specimen Crippling stress σK Buckling stress σcr Number
№ Slenderness ratio at c=4
Elongation l/b
Numerical analysis
Engineering methods By equation (4)
Needham Gerard Clumped Simply
supported 1 10.8 4.47 30.3 30.0 27.1÷31.9 32.8 24.7 2 17.3 7.15 27.9 30.0 27.1÷31.9 26.1 23.0 3 21.6 8.94 25.4 30.0 27.1÷31.9 24.6 22.6 4 17.3 7.11 24.8 24.9 21.9÷25.8 15.9 14.0

12
Figure 7. Numerically obtained dependence of angle load on end-to-end displacement at various values of initial sag
There exists the most logical (and easy-to-implement) method for nonlinear analysis which simplifies searching for the critical point (and forcing the structure to buckle during the further growth of the load): a disturbance should be introduced in the form of a rather low uniform pressure over the entire surface of the angle. The effect of this pressure was evaluated on the basis of the transverse displacement f (at the midpoint of the free edge); this displacement is termed initial sag. Note that the pressure introduces the deformed shape close to the mode 1 of local buckling.
Figure 8.Stress field of the specimen during plastic deformation stage
For initiatory nonlinear analysis of the structure thus loaded the initial sag (f = 1.6% of the angle leg thickness) was selected on the basis of the tolerance for angle leg thicknesses. In this case, the ultimate stress is σK= 30.3 The results described above and shown in Table 1 were compared to draw the following conclusion. The angle

13
№1 selected is greatly sensitive to boundary conditions in what concerns bending of both the rod (at с = 1÷4) and its legs (simple support or clamping at loaded edges). Clearly, at c= 1 all parameters of angle №1 are within applicability of the engineering methods; however, the slenderness ratio l/b=4.47 turns out to be in the zone of the essential influence of leg support conditions on the local buckling limit stress. Indeed, in the case of simple support of the loaded edges the relation (4) provides σcr =24.7, whereas the situation with clamping features the much higher value σcr =32.8 shown in Table 1; this value exceeds both the crippling limit stress as by Gerard and Needham methods. Therefore, we decided to increase the object length so as to attain λ≈20 and the ratio l/b which are sufficient to eliminate their effect on angle crippling at SBC close to those in the test machine. The angle №1 was used to evaluate the influence of the initial sag (in the shape of the local buckling mode 1) on the load-bearing capability of the structure. Figure 7 includes theoretical curves representing the dependence of the reaction force (at the loaded edges) on the mutual displacement of ends. One can see how the load-bearing capability varies when the maximum sag/ (at the free edge of the leg) changes from 25% of the thickness to 0.02%. The set of curves was analyzed to derive features of the computation procedure. All curves have much in common: - there is a linear portion whose slope is identical for all lines; - the next portion is running up nonlinearly, and the culmination point corresponds to the limit load-bearing capability at the given initial sag; - the last stage is destruction, load drops, a certain cross section turns out to be plastic completely (Figure 8). The diagram of dependence of limit stresses on the sag amplitude has a rather large plateau over 0.002 <f /δ <0.02 when σK varies from 31.0 to 30.3. The sag influences insignificantly the stress level prior to destruction but is sufficient to avoid computational uncertainty around this point. These results were used in numerical analysis of crippling (see Table 1), also for specimens №2, 3 with larger length in comparison with specimen №1, and for specimen №4 with less thickness of the flange b/δ = 17.2 (l/b = 7.11, λ = 17.3 at c = 4). Parametrical studies reveal that the values of σK decrease with the increase of ratio l/b; this is easy to explain through the weaker influence of clamp boundary conditions. However, in the case of angles with λ ≥ 20 the values are slightly below (but within the ±10% scatter) the σK values provided by semi-empirical methods. Coincidence of numerical analysis results is satisfactory. Of course, the numerical studies would be continued to cover other types of structural shapes and include experimental data - so as to prepare reliable computational procedures. 5 Summary The study of the existing methods for crippling analysis has shown that the method by Gerard [2] is the most suitable and appropriate semi-empirical method developed

14
to date. However, for application of this method for new materials and structural or manufacturing methods requires a significant amount of additional experimental research. Such an investigation has been done in framework of the present paper by applying a number of compressed moulded profiles from aluminium alloy with the respective correction of empirical coefficients. For a number of specimens the three-fold excess of the destructive crippling stresses over the local buckling stresses of the profile was experimentally obtained. Development and parametrical research of the finite element method of crippling analysis has shown the following. As for the numerical calculation of the critical stresses of local buckling, the solution using a bifurcational statement usually requires little difficulty and the results correspond well to the experimental data as well as to the accurate analytical solution. This is partly true for the finite element analysis of moderate postbuckling deformations of compressed rods and panels in the elastic regime. However, the assessment of the load-carrying capacity of structural elements with significant geometrical non-linear and plastic deformations requires further development, particularly for problems of crippling of stiffened panels with different boundary conditions and combined loading. References [1] Needham R.A. The Ultimate Strength of Aluminium-Alloy Formed Structural
Shapes in Compression, JAS, v. 21, №4, 1954. [2] Gerard G. The Crippling Strength of Compression Elements, JAS, v.25, №1,
1958. [3] Bruhn E.F. Analysis and Design of Flight Vehicle Structures. USA Tristate
Offset Company,1973. [4] Military Handbook - 5G, USA, 1994. [5] Vol'mir A.S. Stability of elastic systems. - Fizmatgiz, Moscow, 1963. [6] Zamula G.N., Ierusalimsky K.M Stability and elements postbuckling behavior
of complex composite structures. Proc. of the 20th ICAS Congress, Sorrento, 1996.
[7] Nonlinear Analysis Using MSC.Nastran, NAS103 Course Notes, 2005.


![The Torsion Effects on the Non-Linear Behaviour of Thin ...webapp.Tudelft.nl/proceedings/cst2012/pdf/mohri.pdfVlasov’s model in small non-uniform torsion context [2],[3]. Pi [4]](https://static.fdocuments.net/doc/165x107/5ea48a786d789108ba1661b1/the-torsion-effects-on-the-non-linear-behaviour-of-thin-s-model-in-small-non-uniform.jpg)